Ecological studies in a man-made - VLIZ · Ecological studies in a man-made estuarine environment,...
210
Transcript of Ecological studies in a man-made - VLIZ · Ecological studies in a man-made estuarine environment,...


Ecological studies in a man-made
estuarine environment,
the port of Rotterdam

Paalvast, P., 2014. Ecological studies in a man-made estuarine environment, the
port of Rotterdam. Thesis, Radboud University, Nijmegen.
© 2014 P. Paalvast, all rights reserved.
Cover: P. Paalvast
Layout: P. Paalvast
Printed by Ipskamp Drukkers BV, Nijmegen, The Netherlands

Ecological studies in a man-made
estuarine environment,
the port of Rotterdam
PROEFSCHRIFT
ter verkrijging van de graad van doctor
aan de Radboud Universiteit Nijmegen
op gezag van de rector magnificus prof. mr. S. C. J. J. Kortmann
volgens besluit van het College van Decanen
in het openbaar te verdedigen op donderdag 17 april 2014
om 10.30 uur precies
door
Pieter Paalvast
geboren op 10 februari 1952
te Maassluis

Promotor:
Prof. dr. H. Siepel
Copromotor:
Dr. G. van der Velde
Manuscriptcommissie:
Prof. dr. P.M.J. Herman
Dr. R.S.E.W. Leuven
Prof. dr. H.J. Lindeboom
Paranimfen:
Emiel van Velzen
Piet Jan Zijlstra

To my grandsons Tom Pieter, Noah (†) and Daniël.


Contents
Chapter 1 General introduction 9
Chapter 2 Long term anthropogenic changes and ecosystem service 31
consequences in the northern part of the complex Rhine-
Meuse estuarine system
Ocean & Coastal Management 921 (2014) 50-64
Chapter 3 Distribution, settlement, and growth of first-year individuals of 71
the shipworm Teredo navalis L. (Bivalvia: Teredinidae) in the
port of Rotterdam area, the Netherlands
International Biodeterioration & Biodegradation
65 (2011) 379-388
Chapter 4 What is the main food source of the shipworm (Teredo navalis)? 95
A stable isotope approach
Journal of Sea Research 80 (2013) 58-60
Chapter 5 New threats of an old enemy: The distribution of the shipworm 105
Teredo navalis L. (Bivalvia: Teredinidae) related to climate
change in the port of Rotterdam area, the Netherlands
Marine Pollution Bulletin 62 (2011) 1822–1829
Chapter 6 Pole and pontoon hulas: An effective way of ecological 125
engineering to increase productivity and biodiversity in the hard-
substrate environment of the port of Rotterdam
Ecological Engineering 44 (2012) 199–209
Chapter 7 Synthesis 153
Summary 173
Samenvatting 181
Dankwoord 189
Curriculum vitae 195


Chapter 1
General introduction
Peter Paalvast
Chapter 1
10

Introduction
11
The port of Rotterdam is located in the so-called "Noordrand" of the northern
delta basin of the Netherlands (Fig. 1). It comprises the Nieuwe Maas and
Nieuwe Waterweg (including Scheur) with adjacent harbour systems and a part
of the Oude Maas.
Rotterdam received its city rights from Count William IV on June 7, 1340. In the
beginning of the second half of the 14th century, newly constructed canals
(Coolse and Goudse vest) that served as a defence line around the city came in
use as harbours (Brolsma, 2006). Well into the 17th century Rotterdam was
mainly a herring port leading to related economic activities to conserve the
herring for trade. The Rhine hinterland was a major customer, but also Rouen in
northern France was an important destination for herring products. On the return
trip a range of goods was carried and Rotterdam developed itself more and
more as a transhipment port. The growth of the port kept pace with the
economic development of Holland and from the mid-19th century with that in the
German Rhine and Ruhr area.
Large harbour expansions took place in particular in three periods: a) so-called
Golden Age of the Netherlands (1600-1700), b) the industrial revolution in the
mid 19th century and c) after the second World War (WWII) (1945-nowadays) in
particular. In the period 1962-2004, the port of Rotterdam in terms of cargo
Figure 1 The location of the port of Rotterdam area at the Noordrand in the
northern part of the Delta Area in the Netherlands.
Chapter 1
12
handling could call itself the largest port of the world. Nowadays, Rotterdam is
the fifth largest port in the world behind ports such as Shanghai (China) and
Singapore, but by far the largest of Western Europe.
Hydrology and salinity
Human interference in the area by land reclamation and port development have
had an enormous impact on the hydrology of the area (see Table 1), which is
reflected in changes in the average yearly tidal range (difference between low
and high water level), water velocities, sediment transport and salt intrusion. But
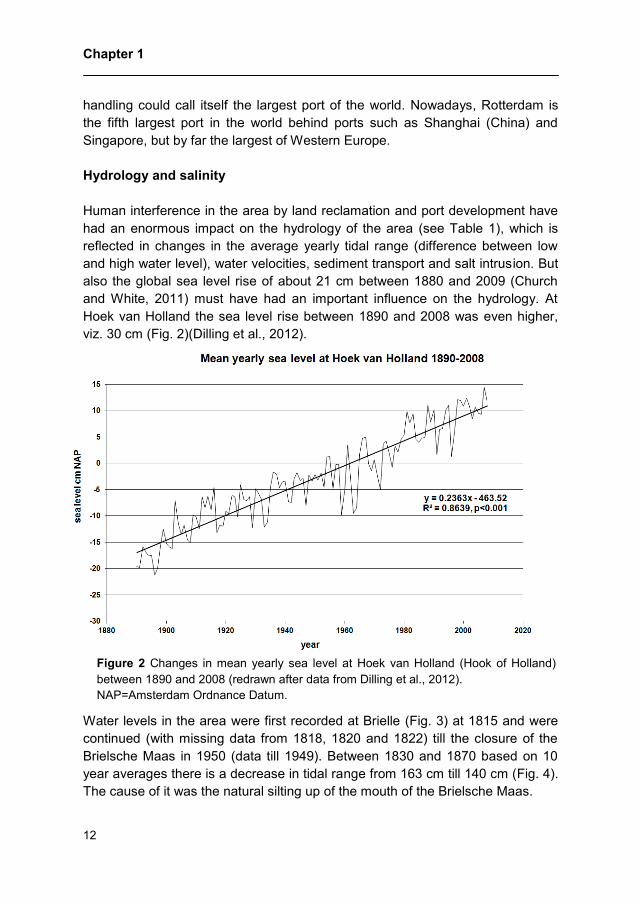
also the global sea level rise of about 21 cm between 1880 and 2009 (Church
and White, 2011) must have had an important influence on the hydrology. At
Hoek van Holland the sea level rise between 1890 and 2008 was even higher,
viz. 30 cm (Fig. 2)(Dilling et al., 2012).
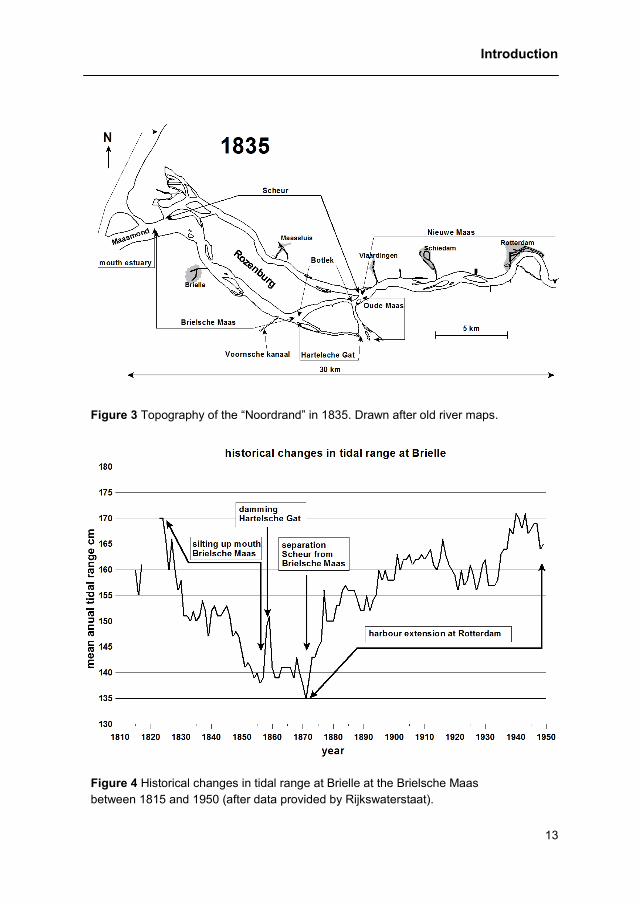
Water levels in the area were first recorded at Brielle (Fig. 3) at 1815 and were
continued (with missing data from 1818, 1820 and 1822) till the closure of the
Brielsche Maas in 1950 (data till 1949). Between 1830 and 1870 based on 10
year averages there is a decrease in tidal range from 163 cm till 140 cm (Fig. 4).
The cause of it was the natural silting up of the mouth of the Brielsche Maas.
Figure 2 Changes in mean yearly sea level at Hoek van Holland (Hook of Holland)
between 1890 and 2008 (redrawn after data from Dilling et al., 2012).
NAP=Amsterdam Ordnance Datum.
Introduction
13
Figure 4 Historical changes in tidal range at Brielle at the Brielsche Maas
between 1815 and 1950 (after data provided by Rijkswaterstaat).
Figure 3 Topography of the “Noordrand” in 1835. Drawn after old river maps.
Chapter 1
14
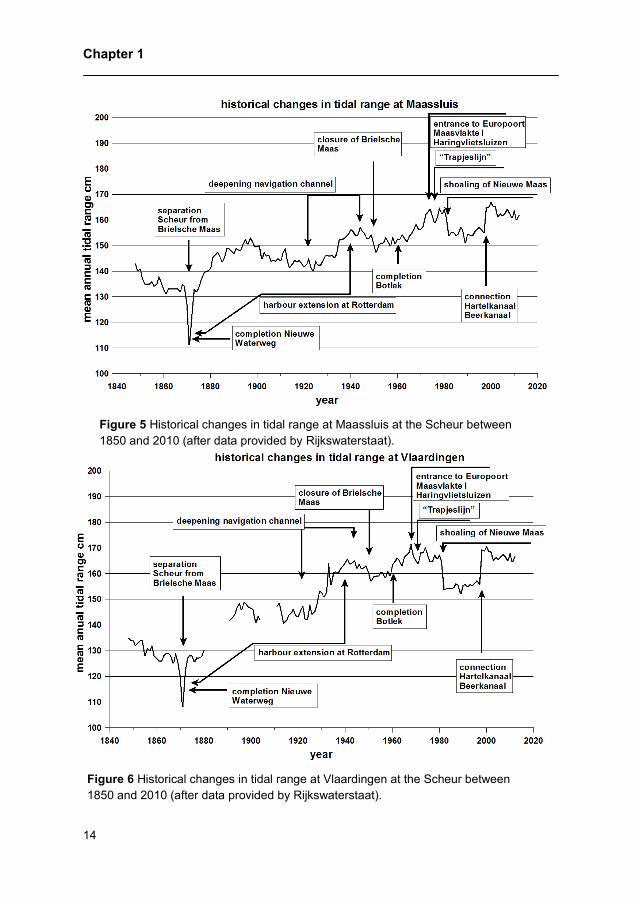
Figure 5 Historical changes in tidal range at Maassluis at the Scheur between
1850 and 2010 (after data provided by Rijkswaterstaat).
Figure 6 Historical changes in tidal range at Vlaardingen at the Scheur between
1850 and 2010 (after data provided by Rijkswaterstaat).

Introduction
15
The cause of the increase in the average yearly tidal range at Brielle in 1858 and
1859 seems unclear but might be the effect of the damming of the Hartelsche
Gat in 1857 (Fig. 4).
The recording of the water levels at Maassluis, Vlaardingen and Rotterdam
started all around 1850. The graphs in figure 5, 6 and 7 all show a decrease in
tidal range due to sedimentation in both Scheur and Nieuwe Maas before 1868.
In 1868 the excavation of the Nieuwe Waterweg through the dunes of Hoek van
Holland started and the canal was opened in 1872. The connection between the
Brielsche Maas and the Scheur became closed in 1872. To separate the Scheur
from the Brielsche Maas first the banks were reinforced and in 1871 a low water
dam was constructed. The effect of this low water dam is clearly shown in
figures 5, 6 and 7 by a decrease in the average yearly tidal range of 1871 for
Maassluis, Vlaardingen and Rotterdam compared with 1870 of 16 cm, 12 cm
and 10 cm, respectively. At Brielle this was less clear as this difference in tidal
range between 1871 and 1870 was only – 3 cm.
After the completion of the Nieuwe Waterweg the port water surface quadrupled
from 50 to 200 ha between 1872 and 1900 (see chapter 2). Also the average
wet cross section of the river increased by dredging for greater depth and
widening of the mouth of the Nieuwe Waterweg (Table 1). These interventions
Figure 7 Historical changes in tidal range at Rotterdam at the Nieuwe Maas
between 1850 and 2010 (after data provided by Rijkswaterstaat).

Chapter 1
16
led to a considerable increase in channel detention of this part of the estuary
and resulted in a rise in tidal range of 20 cm at Maassluis and Vlaardingen and
about 30 cm at Rotterdam (Fig. 5 to 7). The period 1897 till 1909 is considered
as the first period in which sedimentation and erosion of the Nieuwe Waterweg
were in equilibrium with each other (Haring, 1977) and no significant increase in
tidal range occurred. Within the period of 1910 till 1923 many harbours were
constructed or under construction, for example the Waalhaven (261 ha), by
which the flood volume strongly increased and by dredging and possible erosion
of the Brielsche Maas, Scheur and Nieuwe Waterweg the tidal range as a
consequence of this further increased. Between 1924 and 1944 from the mouth
of the Nieuwe Waterweg to 1 km upstream Rotterdam the whole river was
deepened increasing the flood volume and tidal range stream upwards again.
On the contrary the tidal range at Hoek van Holland probably due to
sedimentation near the mouth dropped between 1910 and 1950 about 10 cm. In
1950 the Brielsche Maas was dammed leading to an approximately 20%
increase in river water discharge via the Nieuwe Waterweg (Haring, 1977), a
situation that remained unchanged until the closure of the Haringvliet in 1970 as
part of the Delta Project (see chapter 2). With the closure of the Haringvliet and
the management of the Haringvliet sluices the discharge of river water via the
Nieuwe Waterweg at an average river discharge of 2200 m3/s at the Dutch
German border increased from 950 m3/s to 1700 m
3/s (Paalvast et al., 1998).
Also the construction of weirs that close at low river discharges in the Lek (and
Nederrijn) as part of the Rhine channelization programme affected the tidal
range. The period 1950-1958 is considered as the second equilibrium of
sedimentation and erosion and no change in tidal range took place. Between
1958 and 1964 many improvement works for shipping such as dredging for
greater depth for the new harbour systems Botlek and Europoort were carried
out leading to an increase of 10 cm in tidal range at Rotterdam. The decline in
Table 1 Historical morphological and hydrological changes in the Nieuwe
Waterweg and Scheur (after Van Os, 1993).

Introduction
17
tidal range at Rotterdam and rise of tidal range in particular at Hoek van Holland
in 1971 (Fig. 6) were the result of the enormous increase of the channel
detention by opening of the Beer- and Calandkanaal harbour system. The
construction of the large harbour systems and the deepening of the navigation
channel had a great impact on the salt intrusion upstream and consequences for
both the intake of drinking water and the supply of water for agriculture. To
reduce this salt intrusion the water depth of the Nieuwe Waterweg (and Scheur)
and Nieuwe Maas was managed by either dredging from or supplementation of
sediment (Nieuwe Maas and parts of the Nieuwe Waterweg) on the river bottom
in a stepwise way from mouth to upstream as far as Rkm 955 from respectively -
22.5 metres relative to NAP and -8.0 metres relative to NAP (Fig. 8). This
stepwise intervention in the river bottom is called “Trapjeslijn” in Dutch and the
works started in 1968 and were finished in 1972 reducing the tidal range by a
few cm’s. In fact the “Trapjeslijn” is a compromise between the need to reduce
the salt intrusion, which requires a water depth reduction, and the need of
greater depth for navigation. In the first years the “Trapjeslijn” was well
maintained, but later on shipping prevailed and in particular the depth of the
Nieuwe Waterweg and the route to the Waalhaven at the Nieuwe Maas
Figure 8 Historical changes in the depth of the navigation channel of Nieuwe
Waterweg, Scheur and Nieuwe Maas. The depths of 1833, 1879 and 1907 were
retrieved from old river maps, those of 1968 from data of Deltares. Trapjeslijn
2002 = design of river bed elevation 2002. 2008 = average depth of the
navigation channel per river kilometre (redrawn from Kuijper and Kaaij, 2009).
NAP= Amsterdam Ordnance Datum.

Chapter 1
18
increased again (Rijkswaterstaat, 2004). The deliberate shoaling of the Nieuwe
Maas in 1984 decreased the tidal range at Rotterdam by another 10 cm (Fig. 7).
In December 1997 the Beerkanaal was connected with the Hartelkanaal (see
Fig. 11) which led to a new rise in tidal range at Maassluis, Vlaardingen and
Rotterdam of 10 cm, 13 cm and 14 cm, respectively. Since then the tidal range
remained similar.
The historical change in tidal range along the Nieuwe Maas, Nieuwe Waterweg
and Brielsche Maas is significantly correlated with the increase of the port water
surface or harbour extension (in fact all the deepening and widening of the
waterways to the harbours).This is clearly shown in the graphs for Brielle (Fig. 9)
and Rotterdam (Fig. 10). The weaker correlation for Brielle (Fig. 9), Maassluis
(Y=3.86ln(X)+125.12, R2=0.48, p<0.001) and Vlaardingen (Y=10.71ln(X)+86.75,
R2=0.86, p<0.001) compared with Rotterdam (Fig. 10) is related to their shorter
distance from the sea. If the extension of the port surface by the creation of
Europoort and Maasvlakte 1, that led to an increase of the channel detention at
the mouth, is disregarded then correlation between harbour extension and
increase in tidal range at Rotterdam is even stronger (R2=0.913 vs R
2=0.906,
figures not round off).
Figure 9 Relation between harbour extension along the Nieuwe Maas near Rotterdam
and the mean tidal range at Brielle between 1872 and 1949.

Introduction
19
There are not many historical salinity data of the Rotterdam port area as
monitoring started in the 1970s when the Haringvlietsluizen came into operation.
In the months of September 1907 and July 1908 however salinity measurements
were carried out in the northern part of the Dutch delta area by Rijkswaterstaat.
On the basis of the minimum and maximum values that were acquired isohalines
for the average river flow in those months were derived (Fig. 11). Peelen (1967)
calculated the isohalines of the Delta area for the period (1960-1970) before the
closure of the Haringvliet, Grevelingen and Oosterschelde. The underlying data
were used by Wolff (1973) to calculate the salinity at the bottom of the rivers and
the sea floor (Fig. 12). They clearly show the effect of deepening of the
navigation channel on salt intrusion, which was more stream upwards in the
period 1960-1970 than it was in 1907 and 1908 (Fig. 12). Around 1970 Beer-
and Calandkanaal were connected to the sea and the Nieuwe Waterweg and in
this way a large polyhaline area was formed. In that same year the management
scheme of the Haringvliet sluices was implemented and extra river water from
then on is forced through the Noordrand to reduce salt intrusion. The reduction
of salt intrusion by means of the management of the Haringvliet sluices and the
“Trapjeslijn” becomes clear by comparing the isohalines of around the year 2000
(Fig. 13A) and those of the period 1960-1970 (Fig. 12A).
Figure 10 Relation between harbour extension along the Nieuwe Maas near
Rotterdam and the mean tidal range at Rotterdam between 1872 and 1970.

Chapter 1
20
Figure 11 Isohalines (S) at the bottom in the Noordrand in September 1907 (A)
and July 1908 (B) (after data from Anonymus, 1911).Qbr = monthly average
discharge at the Dutch-German border, Qnw= monthly average discharge Nieuwe
Waterweg, Qbm= monthly average discharge Brielsche Maas.

Introduction
21
Figure 12 Isohalines (S) at the bottom in the Noordrand in between 1960 and
1970 (redrawn after Wolff, 1973). A. at average discharge at the Dutch German
border. B. at low discharge at the Dutch German border. Qbr = discharge at the
Dutch-German border, Qnw= discharge Nieuwe Waterweg.

Chapter 1
22
Figure 13 Isohalines (S) at the bottom in the Noordrand in around 2000
calculated with the model RIJMAMO 3D (Bol and Kraak, 1998). A. at average
discharge at the Dutch German border. B. at low discharge at the Dutch German
border. Qbr = discharge at the Dutch-German border, Qnw= discharge Nieuwe
Waterweg.

Introduction
23
Ecological monitoring
The pollution of water and soil in the period after WWII, especially in the 1960s
and 1970s was the major reason for the neglectance of ecological studies in the
Noordrand (Den Hartog, 1963a, Wolff, 1973, Heerebout, 1974). During that
period the port of Rotterdam area was considered as almost biologically dead.
There are a few exceptions. For example before and after the closure of the
inlets of the delta region inventories of higher plants along the banks have been
taken place by members of the KNNV (the Royal Dutch Society for Natural
History) and employees of the DIHO (Delta Institute for Hydrobiological
Research). The data gathered are included in the Atlas of the Dutch Flora
(FLORON, 2012). Den Hartog (1959) and Nienhuis (1974) have paid attention to
the algae of the littoral zone of the area. Further Den Hartog (1963b, 1964)
investigated the amphipods in the Delta region and found the talitrid amphipods
Orchestia cavimana and O. gammarella along the Nieuwe Waterweg and
Nieuwe Maas but no gammarid amphipods. Gammarids were only found on the
piers in the mouth of the Nieuwe Waterweg. Further fauna records are anecdotal
for example the first observation of the Chinese mitten crab (Eriocheir sinensis)
in the harbours Rotterdam and the mouth of the Nieuwe Waterweg in 1931
(Kamps, 1937), the Brackish water mussel Mytilopsis leucophaeata (syn.
Congeria cochleata) in the harbour of Maassluis in 1946 (pers. comm. Wim
Kuijper) or the Dog whelk (Nucella lapillus) on the northern pier at Hoek van
Holland (Smits, 1954). No studies were carried out in the Nieuwe Waterweg,
Scheur or Nieuwe Maas. Only on a few occasions the hard substrate of the pier
of Hoek van Holland at the mouth of the Nieuwe Waterweg was investigated
(Wolff, 1968). In the years after the large inlets (Oosterschelde, Grevelingen and
Haringvliet) as part of the Delta project were closed more floristic and faunistic
research in the Noordrand has been conducted in particular in the context of the
monitoring of the chemical and ecological condition of the Dutch water bodies
(MWTL) (Boogaart-Scholte et al., 2012). Within the Noordrand there are a small
number of measuring points but the harbours were excluded, in spite of the fact
that they comprise the major part of the water surface of the area. Platvoet and
Pinkster (1995) studied the distribution of various amphipod species in the Delta
region in 1992 and found several talitrid and gammarid amphipod species along
the Nieuwe Waterweg and adjacent harbours and the Nieuwe Maas. Ecological
investigations have taken place within the harbours along the salinity gradient
only on an ad hoc basis, for example the investigation of the flora and fauna of
the littoral zone in Beer-, Caland- and Hartelkanaal and Nieuwe Waterweg by
Paalvast (1998). This has led to some insight into the functioning of the harbours

Chapter 1
24
as an estuarine ecosystem, but due to the lack of consistency no deeper insight
could be derived.
Outline of this thesis (Fig. 14)
Land reclamation, urbanisation, industrialisation and harbour development have
radically changed the Noordrand as part of the Rhine-Meuse estuary from a soft
to a hard substrate environment made of asphalt, stone, concrete, wood and
steel. This environmental change from soft to hard is the underlying theme of
this thesis.
From the middle of the 14th century to the construction of Maasvlakte 1 in the
1960s there was only awareness of the demands for shipping, port, industrial
and urban development. Until the middle of the 19th century this had no serious
consequences for estuarine nature, but with the industrial revolution this
changed rapidly. In about one century, the ever changing dynamic estuary with
its typical flora and fauna has been transformed into a massive hardened
environment.
How and how quickly have these changes taken place? What characteristics of
the estuary have been lost and what has come in its place? In chapter 2, the
historical demise of the estuary using the disappearance of the estuary
distinctive soft substrate ecotopes and the rise of hard substrate ecotopes
related to port development, industrialization and urbanization is described.
The policy of the port of Rotterdam, international collaboration and a stricter
environmental legislation drastically reduced the pollution of water and sediment.
In particular the ban on the aggressive biocide TBT (tributyltin) from 1 January
2003 following the decision taken by the International Maritime Organisation has
created possibilities for estuarine nature to recover. As water and sediment
quality improved in the port area over the last decades, many plant and animal
species have settled on the new hard substrates. The shipworm Teredo navalis,
a wood boring bivalve mollusc is a threat to wooden structures in the port area,
in particular fir and oak wood where many quays of the old harbours are build
upon. The question is, is the shipworm still present in the port of Rotterdam area
since its first appearance in the Dutch coastal waters in 1730 (Vrolik et al.,
1860)? In chapter 3 the distribution of this species in the port area and the
growth of first year individuals in various types of wood are described.

Introduction
25
The shipworm, T. navalis, drills in wood and depending on the type of wood may
reach a length of 60 cm during its three year lifespan (Sordyl et al., 1998,
Hoppe, 2002). But why it needs wood? Does it pierces in timber to use it as food
or only to protect itself from predators. A stable isotope approach is used in
chapter 4 to answer to this question.
Dredging for greater depth for shipping as mentioned above has led to a further
penetration of the salt wedge stream upwards. At low river discharge brackish
water penetrates the old harbours of the eastern part of the port of Rotterdam
where quay walls are built on fir and oak piles. This might create conditions
favourable for the shipworm to settle and grow. Climate change by global
warming could result in long-term low to very low river discharges in summer.
This may cause the shipworm to become a real threat to the stability of quay
walls, but also for other structures made of wood, such as sluice gates and
mooring poles. The sea level rise, also a consequence of climate change may
exacerbate this.
But how serious will be the threat of the shipworm T. navalis to wooden
structures in the harbours of the port of Rotterdam at global warming? In
chapter 5, a risk analysis is made for damage caused by the shipworm in the
Figure 14 Schematic outline of the thesis.
Chapter 1
26
old harbours of the city of Rotterdam based on the KNMI (Royal Netherlands
Meteorological Institute) climate change scenarios (Van den Hurk et al., 2007).
The harbours of the port of Rotterdam are designed exclusively for the berthing
of ships and the transhipment of goods. No structural provisions are made
neither intertidal nor subtidal for aquatic flora and fauna. A development of a
stable soft bottom fauna by the ever continuing disturbance of the sea floor by
dredging and boat propellers is impossible. However, with relatively simple
means in sheltered environments, for example under jetties and pontoons,
structure-rich habitats can be created, that might strengthen the biodiversity and
productivity of the estuarine ecosystem of the port, now pollution is no longer
limiting. One of the remedies could be rope structures around mooring poles and
under pontoons and piers. The results of a pilot study described in chapter 6
could bring clarity if habitat enrichment with this kind of structures really has an
positive influence on biodiversity and -productivity in harbour systems.
In chapter 7, the outcome of the study is discussed in a broader perspective
and compared with developments elsewhere.
Further improvements of the harbour environment by structural habitat
enrichment are delineated that could make the port of Rotterdam a haven for
estuarine nature.
Introduction
27
References
Anonymous, 1911. Nota’s betreffende het zoutgehalte der Nederlandsche
benedenrivieren van Rijkswege waargenomen in 1907 en 1908. Met 31
bijlagen. Uitgegeven door het Departement van Waterstaat.
Bogaart-Scholte, M.W.M.,Van der Weijden, M.H., Naber, A., Wetsteijn, L.P.M.J.,
Roos, M., 2012. MWTL Meetplan 2012. Monitoring Waterstaatkundige
Toestand des Lands. Milieumeetnet rijkswateren. Water, Wegen, Werken,
Rijkswaterstaat.
Bol, R., Kraak, A., 1998. MER Beheer Haringvlietsluizen. Over de grens van
zout en zoet. Deelrapport Water- en Zoutbeweging. ISBN: 903694871. RWS,
notanummer: apv 98/093. 212 pp.
Brolsma, J.U., 2006 "Havens, kranen, dokken en veren." De Gemeentelijke
Handelsinrichtingen en het Havenbedrijf der gemeente Rotterdam, 1882-
2004. PhD-Thesis, University of Leiden, the Netherlands.
Den Hartog, C., 1959. The epilithic algal communities along the coast of the
Netherlands. Wentia, 1: 1-241.
Den Hartog, C., 1963a. The amphipods of the deltaic region of the rivers Rhine,
Meuse and Scheldt in relation to the hydrography of the area part I. Intro-
duction and hydrography. Netherlands Journal of Sea Research, 2: 29-39.
Den Hartog, C., 1963b. The amphipods of the deltaic region of the rivers Rhine,
Meuse and Scheldt in relation to the hydrography of the area part II. The
Talitridae. Netherlands Journal of Sea Research, 2: 40-67.
Den Hartog, C., 1964. The amphipods of the deltaic region of the rivers Rhine,
Meuse and Scheldt in relation to the hydrography of the area: Part III. The
Gammaridae. Netherlands Journal of Sea Research, 2: 407-457.
Dillingh, D., Baart, F., De Ronde, J., 2012. Is er al versnelde zeespiegelstijging?
H2O, 45: 37-41.
Floron, 2012. Nieuwe atlas van de Nederlandse flora. Floron, Nijmegen. ISBN
9789050114134.
Heerebout, G.R., 1974. Distribution and ecology of the Decapoda Natantia of the
estuarine region of the rivers Rhine, Meuse and Scheldt. Netherlands Journal
of Sea Research, 8: 73-93.
Hoppe, K., 2002. Teredo navalis – The cryptogenic shipworm. In: Invasive
aquatic species of Europe. Distribution, impacts and management.
Leppäkoski, E., Gollasch, S., Olenin, S. (eds.). Kluwer Academic Publishers,
The Netherlands, 116-119.
Kamps, L.F., 1937. De Chineesche wolhandkrab in Nederland. PhD-thesis,
University of Groningen.

Chapter 1
28
Kuijper, C., Van der Kaaij, T., 2009. Herstel van de "trapjeslijn" in de Nieuwe
Waterweg en de Nieuwe Maas. Fase 1: Voorstudie naar de effecten op
de zoutindringing. Deltares, Delft.
Nienhuis, P.H., 1975. Biosystematics and ecology of Rhizoclonium riparium
(Roth) Harv. (Chlorophyceaea: Cladophorales) in the estuarine area of the
rivers Rhine, Meuse and Scheldt. PhD-thesis, University of Groningen, the
Netherlands.
Paalvast, P., 1998. Ecologische waardering van de oevers in het Rotterdamse
havengebied. Calandkanaal, Beerkanaal, Hartelkanaal en Nieuwe Waterweg.
Ecoconsult. In opdracht van het Rijksinstituut voor Kust en Zee, Middelburg.
Rijkswaterstaat, directie Zuid-Holland.
Platvoet, D., Pinkster, S., 1995. Changes in the amphipod fauna (Crustacea) of
the Rhine, Meuse and Scheldt estuary due to the ‘Delta Plan’ coastal
engineering works. Netherlands Journal of Aquatic Ecology, 29: 5-30.
Rijkswaterstaat, 2004. Huidige situatie en autonome ontwikkeling Rijn-
Maasmonding. Beschrijving hydraulische, morfologische en scheep-
vaartkundige aspecten in het kader van ‘ruimte voor de rivier’. Rijks-
waterstaat, Directie Zuid-Holland. Hoofdgroep Planvorming Water AP.
Notanummer AP/2004/15.
Smits, H., 1954. Purperslakken aan de mond van de Nieuwe Waterweg. Het
Zeepaard 14: 33-34.
Sordyl, H., Bönsch, R., Gercken, J., Gosselck, F., Kreuzberg, M., Schulze, H.,
1998. Dispersal and reproduction of the shipworm Teredo navalis L. in
coastal waters of Mecklenburg-Western Pomerania. Deutsche Gewässer-
kundliche Mitteilungen, 42: 142-149.
Van den Hurk, B., Klein Tank, A., Lenderink, G., Van Ulden, A., Van
Oldenborgh, G.J., Katsman, C., Van den Brink, H., Keller, F., Bessembinder,
J., Burgers, G., Komen, G., Hazeleger, W., Drijfhout, S., 2007. New climate
change scenarios for the Netherlands. Water Science & Technology, 56: 27-
33.
Van Os, A.G., 1993. Density currents and salt intrusion. Delft Hydraulics.
Vrolik, W., Harting, P., Storm Buysing, D.J., Van Oordt, J.W.L., Von Baumhauer
E.H., 1860. Verslag over den Paalworm, uitgegeven door de Natuurkundige
Afdeeling der Koninklijke Nederlandsche Akademie van Wetenschappen,
Amsterdam, 153 pp.
Wolff, W.J., 1968. The Echinodermata of the estuarine region of the rivers
Rhine, Meuse, and Scheldt, with a list of species occurring in the coastal
waters of the Netherlands. Netherlands Journal of Sea Research, 4: 59-85.

Introduction
29
Wolff, W.J., 1973. The estuary as a habitat. An analysis of data on the soft-
bottom macrofauna of the estuarine area of the rivers Rhine, Meuse and
Scheldt. Zoölogische Verhandelingen, 126: 1-242. Brill, Leiden.


Chapter 2
Long term anthropogenic changes and
ecosystem service consequences in the
northern part of the complex Rhine-
Meuse estuarine system
Peter Paalvast
Gerard van der Velde Ocean & Coastal Management 92 (2014) 50-64

Chapter 2
32
Abstract
Around 0 AD, the Rhine-Meuse estuary in the southwest of the Netherlands was
a typical coastal plain estuary. Drainage of peatland and land subsidence behind
the dunes later caused the sea to penetrate into the land. Most of the peat was
eroded, and by 1000 AD the so-called Delta area had turned into a landscape of
large estuaries and intertidal zones. Rotterdam developed from a small fishing
village on the banks of the tidal river “Nieuwe Maas” from the 14th century
onwards into the largest seaport of Europe in 2013. The Rotterdam harbour area
situated in the northern part of the Delta area includes the former Europoort
harbour, and is nowadays known as Rijnmond. The hydrology of the area is
controlled by the drainage regime of the sluices in the Haringvliet barrier that
was constructed as part of the “Delta Works” project to protect the southwest of
the Netherlands against storm surges. The sluices are opened at slack tide to
discharge river water to the sea and are always closed at flood tide.
As a baseline study for environmental and ecological reconstruction and
development, we describe in detail the loss of intertidal soft sediment ecotopes
due to land reclamation, harbour development and river training works
(straightening of the navigational channel) in the tidal rivers, and the expansion
of hard substrate ecotopes (quay walls, groynes, training walls, riprap, concrete,
stones etc.) in the Rijnmond area in the 19th and 20th centuries. Within 135
years, more than 99% of the original 4775 ha of characteristic pristine soft
sediment estuarine ecotopes have disappeared. In the same period, 338 ha of
hard intertidal substrate zone was constructed. Such trends can also be
observed in harbour areas elsewhere, and have ecological and environmental
consequences for estuarine areas in particular.
Restoration of soft substrate estuarine ecotopes can be achieved by opening the
Haringvliet Sluices at both ebb and flood tide, which would restore large-scale
estuarine dynamics to the northern part of the Rhine-Meuse estuarine system.
This will have a highly favourable effect on many ecosystem services. The Dutch
division of the Word Wild Life Fund has launched a new proposal for a safer and
more attractive South-West Delta area. It comprises the reopening of the sea
inlets such as the Haringvliet by removing the barriers, and building climate-
proof dikes in combination with natural wetlands. In case of storm surges, the
hinterland could be protected with a new generation of barriers that do not
hamper the free transport of sediment, tides and animals. Based on 30
ecosystem services or subservices, it was calculated that opening the
Haringvliet inlet would lead to an increase in Total Economic Value (TEV) of at
least 500 million Euro per year. The costs of removing old barriers and the
construction of new ones was not included in the calculations.
Petrifying the Rhine-Meuse estuary
33
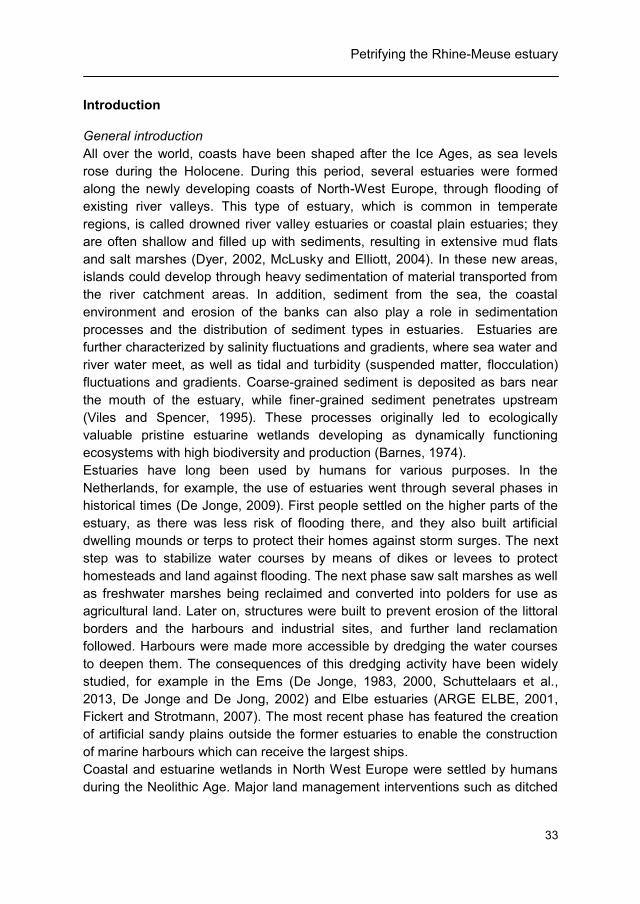
Introduction
General introduction
All over the world, coasts have been shaped after the Ice Ages, as sea levels
rose during the Holocene. During this period, several estuaries were formed
along the newly developing coasts of North-West Europe, through flooding of
existing river valleys. This type of estuary, which is common in temperate
regions, is called drowned river valley estuaries or coastal plain estuaries; they
are often shallow and filled up with sediments, resulting in extensive mud flats
and salt marshes (Dyer, 2002, McLusky and Elliott, 2004). In these new areas,
islands could develop through heavy sedimentation of material transported from
the river catchment areas. In addition, sediment from the sea, the coastal
environment and erosion of the banks can also play a role in sedimentation
processes and the distribution of sediment types in estuaries. Estuaries are
further characterized by salinity fluctuations and gradients, where sea water and
river water meet, as well as tidal and turbidity (suspended matter, flocculation)
fluctuations and gradients. Coarse-grained sediment is deposited as bars near
the mouth of the estuary, while finer-grained sediment penetrates upstream
(Viles and Spencer, 1995). These processes originally led to ecologically
valuable pristine estuarine wetlands developing as dynamically functioning
ecosystems with high biodiversity and production (Barnes, 1974).
Estuaries have long been used by humans for various purposes. In the
Netherlands, for example, the use of estuaries went through several phases in
historical times (De Jonge, 2009). First people settled on the higher parts of the
estuary, as there was less risk of flooding there, and they also built artificial
dwelling mounds or terps to protect their homes against storm surges. The next
step was to stabilize water courses by means of dikes or levees to protect
homesteads and land against flooding. The next phase saw salt marshes as well
as freshwater marshes being reclaimed and converted into polders for use as
agricultural land. Later on, structures were built to prevent erosion of the littoral
borders and the harbours and industrial sites, and further land reclamation
followed. Harbours were made more accessible by dredging the water courses
to deepen them. The consequences of this dredging activity have been widely
studied, for example in the Ems (De Jonge, 1983, 2000, Schuttelaars et al.,
2013, De Jonge and De Jong, 2002) and Elbe estuaries (ARGE ELBE, 2001,
Fickert and Strotmann, 2007). The most recent phase has featured the creation
of artificial sandy plains outside the former estuaries to enable the construction
of marine harbours which can receive the largest ships.
Coastal and estuarine wetlands in North West Europe were settled by humans
during the Neolithic Age. Major land management interventions such as ditched

Chapter 2
34
drainage systems and reclamation of salt marshes started during the Roman era
(Rippon, 2000, Healy and Hickey, 2002) in particular in the south of Great Britain
and the Netherlands. Systematic reclamation by means of embankment,
resulting in large-scale loss of coastal and estuarine habitats, started in the 12th
century (Wolff, 1992, 1993, Rippon, 2000) and continued until the second half of
the 20th century. Airoldi and Beck (2007) give a comprehensive overview of the
historical development of coastal wetlands in Europe, and they estimate an
overall loss of more than 50% of the original surface area, with peak losses of
over 80% in many regions. They estimated that between 1960 and 1995, one
kilometre of European coastline a day was developed for human purposes
alone. Land reclamation and dredging are considered to be more destructive to
the estuarine ecosystem than the input and discharge of pollutants, as they lead
to the disappearance of vital sedimentary habitats by coastal squeeze and
changes in the hydrodynamic situation and associated sedimentation patterns
(Doody, 2004, Hughes and Paramor, 2004, McLusky and Elliott, 2004).
Losses of estuarine ecotopes in the Netherlands
Large areas of moorland, swamp forest and salt marsh were reclaimed in the
Netherlands between the 12th century and the second half of the 20
th century
(Wolff, 1993). The world’s largest intertidal system, the “Wadden Sea”
(Waddenzee in Dutch), which stretches along the coasts of the northern
Netherlands, northwest Germany and west Denmark, has frequently been
altered by humans since its origin 7500 years ago. The large-scale habitat
transformations over the last 1000 years have had a major impact on its
functioning as an ecosystem (Lotze et al., 2005), and during the last century in
particular, human exploitation has transformed the intertidal areas from an
internally regulated and spatially heterogeneous system to an externally
regulated and spatially homogenous system (Erikson et al., 2010).
Two projects carried out in the Netherlands during the 20th century greatly
reduced the size of the Rhine-Meuse estuary. The damming of the large
northern inlet formerly known as the Zuiderzee (Fig. 1) was decided upon after a
storm surge in 1916 had breached many dikes and inundated large areas
around its shores (De Jonge, 2009). The 30 km long dike separating the
Zuiderzee from the Wadden Sea was completed in 1932, and changed a 3700
km2 estuarine area into a freshwater lake (De Jonge and De Jong, 1992). After
the 1953 storm surge, which breached the dikes in 89 places in the south-west
of the Netherlands, with the loss of 1836 lives, a huge flood protection scheme
known as the Delta Project was proposed in the Delta Act, which was adopted
by the lower chamber of the Dutch Parliament in 1957 and by the upper
chamber in 1958 (Stuvel, 1956, 1961). The implementation of the Delta Project

Petrifying the Rhine-Meuse estuary
35
shortened the coastline by 700 km and resulted in the closure of most of the
inlets of the Rhine-Meuse estuary by means of dams and sluices, and in the
case of the Eastern Scheldt inlet and the Nieuwe Waterweg canal, by means of
a storm surge barrier. An area of 890 km2, comprising deep tidal water (446
km2), shallow water (97 km
2), sand and mud flats (188 km
2), salt and brackish
marshes (94 km2), extensive reed and rush beds (40 km
2) and tidal willow
coppices (tidal forest) (25 km2) was lost or no longer part of the estuary (Wolff,
1992, Eertman, 1997, Paalvast et al., 1998). If these numbers are added to the
losses due to land reclamation (3500 km2) over the last 1000 years before the
Delta Project, the total loss of estuarine ecotopes in the 5300 km2 Delta Area is
83%, including the Western Scheldt inlet which was not closed. In 2011, less
than 7% of the total area of the Rhine-Meuse estuary was left, relative to the
1950 situation. As entrances to the harbours of Antwerp and Rotterdam, the
Western Scheldt inlet and Nieuwe Waterweg canal remained open, and only
these waterways can be regarded as estuaries nowadays. From 1970, the
Nieuwe Waterweg canal (excavated in the second half of the 19th century) was
the only open connection left between the North Sea and the catchment areas of
the rivers Rhine and Meuse.
Historical flood defence systems
The first dikes were protected against wave attack by rows of wooden piles
(open-pile permeable groynes), which continued to be used until the years
1731/32, which saw massive destruction of the piles by the shipworm Teredo
navalis (Vrolik et al., 1860). This led to a partial change in dike construction
techniques, and by 1733 the dikes started to be protected by imported stones,
which over the centuries led to “petrification” (hardening and consolidation of
shores with riprap, stone, concrete and debris) of large parts of the Dutch
coastline (including the estuaries) with hard-substrate defence structures.
Similar measures were also taken in comparable areas in Europe from that time
onwards. This ecotope was originally absent in the Netherlands and the
hardening of the littoral zone created opportunities for rocky shore species to
establish.
Petrifying trends in Europe
Different types of hard-substrate defences have led to severe petrification of
dynamic sedimentary coastal areas in Europe (Airoldi et al., 2005). In addition,
many estuaries (and rivers) became more or less petrified from the second half
of the 19th century due to regulatory works involving groynes (mostly upstream)
and training walls to maintain shipping lane depths, and due to shore protection
with riprap or even debris from demolished buildings and roads. A striking

Chapter 2
36
example is the mouth of the navigational channel in the Seine bay, where two
large training walls have hardened and narrowed this part of the estuary by
approximately 90% (Auger and Verrel, 1998).
The Port of Rotterdam is by far the largest port in Europe and was the world’s
busiest port between 1962 and 2004. It is an example of how in the past all
estuarine nature in Europe was sacrificed for port development without any
hesitation. This article describes the historical changes in soft-substrate areas
and the petrification by means of stones, riprap, asphalt, concrete etc. of the
northern part of the Dutch Delta Area, where the Rotterdam harbour is situated.
It also discusses the prospects for recovery of the Rhine-Meuse estuarine
ecosystem and its management in a local and an international context.
Materials and methods
Study area
The study was restricted to the northern part of the Delta Area (known locally as
Rijnmond) in the southwest of the Netherlands (Fig. 1). To describe the changes
in estuarine ecotopes (see section 2.2 for a definition), the estuary has been
divided into three water systems with associated harbours (Figs. 1 and 5):
1. The Nieuwe Maas system, between Rotterdam at Rkm 996.3 (Rkm =
river kilometre of the Rhine) and the confluence of the Oude Maas and
Nieuwe Maas river near Vlaardingen.
2. The Scheur and Nieuwe Waterweg system (including the Hartelkanaal,
Beerkanaal and Calandkanaal canals with associated harbours).
3. The Oude Maas, Hartelsche Gat, Botlek and Brielsche Maas system,
including the mouth of the estuary.
Methods
An ecotope classification system has been developed for the larger water bodies
in the Netherlands (Wolfert, 1996). Ecotopes are defined as “spatially delimited
landscape units, whose composition is determined by the local abiotic, biotic and
anthropogenic conditions.”
Detailed digitized river and harbour maps were used to determine the changes
in estuarine ecotopes and the petrification of the estuary in the northern part of
the delta region between 1834 and 2010.
Data for the 1834-1835 period were derived from map numbers 17, 18, 19 and
20 of the “Algemeene Rivierkaart serie I” (General River Map, Series I) issued
by the ministerial department of public works (Rijkswaterstaat, RWS) between

Petrifying the Rhine-Meuse estuary
37
Figure 1 The location of the study area in the Delta Area in the Netherlands. The
Lek, Waal and Oude Maas are distributaries of the river Rhine. Maas=Meuse.

Chapter 2
38
1834 and 1835 at 1:10,000 scale (Rienstra, 1958, Boode, 1979, Van den Brink
et al., 2002). Since these maps do not cover the mouth of the estuary, we
estimated the ecotope surface areas in the mouth of the estuary by digitizing the
map made by Von Wiebeking (1795) at a 1:40,000 scale.
Data for the 1877-1878 period were derived from map numbers 18, 19, 20, 21,
22 and 23 of the “Algemeene Rivierkaart, Eerste Herziening, Serie I” (General
River Map, First Revision, Series I) issued by Rijkswaterstaat between 1880 and
1881, at a 1:10,000 scale (Boode, 1979, Van den Brink et al., 2002).
Data for the 1933-1935 period were derived from map numbers 20, 21 and 22 of
the “Algemeene Rivierkaart, Tweede Herziening, Serie I” (General River Map,
Second Revision, Series I) issued by Rijkswaterstaat between 1942 and 1945 at
a 1:10,000 scale, and map numbers 17 to 29 of the “Algemeene Rivierkaart,
Tweede Herziening, Serie II” (General River Map, Second Revision, Series II)
issued by Rijkswaterstaat between 1933 and 1937, at a 1:5,000 scale (Boode,
1979, Van den Brink et al., 2002).
Data for the 2000-2010 period were derived from the digital map of ecotopes of
the region at a 1:5,000 scale, produced by Rijkswaterstaat (Anonymous, 2000),
and the digital map of the Rotterdam harbour area, at a 1:20,000 scale, issued
by the Port of Rotterdam Authority (2006), in combination with designs for the
banks at a 1:500 scale and “Google Earth”.
It should be noted that the old river maps were all drawn on the basis of the
mean low water level.
The following ecotopes were distinguished on these maps:
a. Natural open water at mean low water level (MLW): rivers, tidal creeks,
gullies.
b. Artificial open water at MLW: harbours
c. Soft substrate in the intertidal zone (between MLW and HWS =
maximum spring tide high water level): estuarine meadows, tidal willow
coppice, reed beds, rush beds, mud flats, sand flats and beaches.
d. Hard substrate in the intertidal zone (between MLW and HWS): quays
and riprap in harbours, groynes, piers, riprap and rockfill along rivers.
e. Soft substrate above HWS: dunes, open sand flats
The surface areas covered by these ecotopes and the lengths of the banks of
rivers, creeks, gullies and quays were measured on-screen with the aid of the
spatial data builder Cartalinx by Clark Labs.

Petrifying the Rhine-Meuse estuary
39
The zonation of the ecotopes is shown in figure 2.
In this article, estuarine means that part of the river where the tide is still
noticeable and that part of the sea where there is still river influence. It includes
the freshwater tidal area and the tidal area with a gradient from fresh river water
to seawater.
Figure 2 Zonation of ecotopes in the fresh and brackish water part of the Rhine-
Meuse estuary.

Chapter 2
40
Estuarine meadows. The estuarine meadows are found in the zone with the
lowest tidal inundation frequency. This ecotope was in use as extensively
managed grasslands and hayfields. They were the richest amongst the soft
substrate intertidal ecotopes in terms of biodiversity, with hundreds of plant
(Melman et al., 1997) and macroinvertebrate species (Van der Velde,
unpublished data) and many breeding and foraging bird species (Strucker et al.,
1994). The composition of the communities changed gradually along the salinity
gradient from fresh to brackish.
Tidal willow coppice (called grienden in Dutch). This ecotope can be regarded as
replacing the original tidal forests, and is found in the freshwater part of the
estuary. The practice of coppicing willow trees in the Rhine-Meuse estuary dates
back as far as the 13th century (Wolf et al., 2001). The osiers were used for
baskets, fykes, beanpoles, helves, hoops for butter casks and herring barrels,
furniture, Dutch mattresses, shore defence etc. (Wisboom van Giessendam,
1878). The most common trees used for this purpose are Salix viminalis
(Common Osier) and S. alba (White Willow). S. dasyclados is usually the only
tree in the parts of the coppices with the longest duration and highest frequency
of inundation. Although these coppices are not rich in numbers of plant species,
their undergrowth houses unique species such as Cardamine amara (Large
Bitter-cress), Leucojum aestivum (Summer Snowflake) and Caltha palustris
subsp. araneosa (Marsh-marigold). The coppices are important for many bird,
fish and macroinvertebrate species (Adriani, 1977, Wolf et al., 2001).
Reed beds. This ecotope, consisting mainly of Phragmites australis (Common
Reed) is found in both the freshwater and brackish parts of the estuary. Most of
the reed beds have been cultivated for use in mats, baskets, furniture and
roofing. Among the reeds in the freshwater parts of the estuary, there are large
numbers of specimens of C. palustris subsp. araneosa in the lowest zone of the
beds, while C. amara determines the aspect higher up. Both species are
replaced by Cochlearia officinalis subsp. officinalis (Common Scurvygrass) when
the inundating water becomes brackish (Paalvast, 1995). Reed beds are a
habitat for many invertebrates and birds (Weeda et al., 1994) and a feeding
ground for crustaceans and fish at high tide.
Rush beds. The rush beds are the lowest vegetated ecotope of the intertidal
zone of the freshwater and brackish water parts of the estuary. The rushes used
to be cultivated for mats, chair seats and sealing of barrels. The rhizomes of the
rushes were often planted on newly accreted sediment to promote
sedimentation, as a first step towards land reclamation (Bakker and Boer, 1954,
Smit and Coops, 1991). In the freshwater part of the estuary, the rush beds
show a high-to-low zonation going from Bolboschoenus maritimus (Sea Club-
rush), via Schoenoplectus lacustris (Common Club-rush or Bul-rush) to

Petrifying the Rhine-Meuse estuary
41
Schoenoplectus triqueter (Triangular Club-rush). The latter is the most
characteristic plant of the freshwater tidal area in the Netherlands (Weeda et al.,
1994). S. triqueter does not occur in the brackish zone, while S. lacustris is
gradually replaced by S. tabernaemontani (Grey Club-rush). Rushes are an
important food source for herbivorous birds and a feeding ground for
crustaceans and fish at high tide.
Sand flats and beaches. This ecotope is found in the intertidal zone with the
strongest hydrodynamics. The sand flats and sand bars are important feeding
areas for waders at low tide and for fish and crustaceans at high tide.
Mud flats. This ecotope develops at lee sites with considerable hydrodynamics,
where it fulfils the same ecological role as sand flats.
Open sand flats above HWL. This ecotope consists of bare sand and is
characterized by pioneer species such as Elytrigia juncea subsp. boreoatlantica
(Sand Couch) and Euphorbia paralias (Sea Spurge), as well as by juvenile
dunes. They are very important for ground-breeding seabirds (Van Beusekom et
al., 1930).
Dunes. The dunes form an ecotope out of direct reach of the estuarine water.
Due to their complexity of habitats, with large differences in abiotic conditions, in
which salt spray plays an important role, the variety of plant and animal species
is the highest of all ecotopes in the estuary.
Hard intertidal substrate. All of the hard substrate of this ecotope in the estuary
has been introduced by man. Large parts of it consist of bare concrete,
limestone, basalt etc. In the freshwater and oligohaline parts of the estuary, it
can be covered by small green algae, while a dense cover of Fucus vesiculosus
(Bladder wrack), a brown alga, may occur in the meso- and polyhaline parts.
Results
The main events in the area are summarized in Table 1.
Changes in the study area (Rotterdam Harbour) between 0 AD and 1830 AD
Around 0 AD, the mouth of the river Meuse was a truncated estuary with a
length of 30 km and a width of some 10 km at its outlet into the sea (Fig. 3). The
estuary was fed by water from the Rhine and Meuse and some peatland rivers.
The coastline of southwest Holland was more or less closed and only interrupted
by a few estuaries. Drainage of peatland and land subsidence behind the dunes
caused the sea to penetrate into the land. Most of the peat was eroded and by
1000 AD, the Delta area had turned into a landscape of large estuaries and
intertidal zones (Zagwijn, 1991, Mulder et al., 2003).

Chapter 2
42

Petrifying the Rhine-Meuse estuary
43
Vlaardingen, the oldest known human settlement in the area (2900 BC to 2600
BC; Rippon, 2000), was founded as a village around 800 AD. The first harbours
were located at the mouths of peatland rivers that have either been dammed or
have disappeared over time. The towns of Brielle, Schiedam and Rotterdam
were founded in the 13th, Delfshaven (the harbour of the town of Delft) and
Maassluis in the 14th century (Fig. 3). Rotterdam (named after a dam built in a
small tidal peatland river called “Rotte”) developed in the 14th century from a
small fishing village on the banks of the “Nieuwe Maas” tidal river, and later
became a seaport.
From the 12th to the 14
th century, large parts of the intertidal zone were
reclaimed, reshaping this part of the open estuary once more into a more
truncated one (Fig. 3). The construction of dikes along the rivers and the
damming of river branches around the 15th century meant that the bulk of the
Rhine and Meuse water came to be discharged via the “Oude Maas” river to the
mouth of the river Brielsche Maas (“Maasmond”) (Fig. 4) (Ploeger, 1992, Ten
Brinke, 2005). A storm surge known as “Sint Elisabethsvloed” in 1421 created
an inland sea, which has by now developed into the marshland area called
Biesbosch (Fig. 1). The main cause of the disaster was peat extraction all the
way to the foot of the dikes, resulting in “piping”. After this flood event, most of
the water of the river Waal discharged via the new inland sea towards the
Hollandsch Diep-Haringvliet inlet. In the mouth of the river Brielsche Maas (Fig.
4), the river discharge fell to 25% of its original value, leading to increased
Figure 4 Map of the northern part of the Rhine-Meuse estuary around 1500 AD
(author unknown). .

Chapter 2
44

Petrifying the Rhine-Meuse estuary
45
period/year event
800 founding of Vlaardingen
11th century first dikes along the rivers
12th till 20
th century land reclamation on a large scale
13th century founding of Brielle, Schiedam, Rotterdam
14th century founding of Delfshaven, Maassluis
1421 St-Elisabeth flood resulting in an inner sea where now is the Biesbosch
1586 first embankment in the mouth of the estuary, creation of the isle of Rozenburg
1658 appointment of a permanent commission by the city of Rotterdam to monitor salmon weirs in the river
1830 opening of the Voornsche Kanaal, a navigational channel for Rotterdam
1866-1872 excavation of the Nieuwe Waterweg
1932 closure of the Zuiderzee after storm surge in 1916
1950-1953 closure of the Brielsche Maas
1954-1960 Botlek harbour and industrial area
1956-1997 Delta project, closure of Delta area after storm surge in 1953
1957-1968 Europort harbour and industrial area
1965-1970 Maasvlakte 1 harbour and industrial area
2008-2013 Maasvlakte 2 harbour and industrial area
sedimentation. Large sandbanks and mud flats were formed from sediments of
the now slow-flowing river, which split the truncated estuary into two parallel tidal
rivers, called Scheur and Brielsche Maas (Maese). The water was slowed down
further by the large number of places where salmon weirs (zalmsteken in Dutch;
fascine wood structures to which large fyke nets were attached; see Fig. 4) were
placed perpendicular to the flow, up to 110 metres into the river. To cope with
this problem, the local government of Rotterdam decided in 1658 to appoint a
permanent commission that had to monitor this type of fishing (Wouda, 2007).
The first embankment in this part of the river mouth was completed in 1586
(Kuipers, 1962) creating the island of Rozenburg (Figs. 4 and 5). Sedimentation
and accretion continued, not only by sediment from the sea but also as a result
of large-scale logging (clear-felling) on the banks in the middle reaches of the
river Rhine in the 17th century (Wouda, 2007). Although ships sailed between the
Table 1 Main events in the northern part of the Rhine-Meuse estuary. .

Chapter 2
46
North Sea and Rotterdam and vice versa along the Brielsche Maas and Scheur,
this was not without risk and only possible with shallow draught ships. From the
18th century on, large vessels could no longer use the Brielsche Maas and
Scheur at low tide (Kuipers, 1962, Buijsman, 2007). The cargo had to be
transhipped at the town of Hellevoetsluis on the Haringvliet inlet, into smaller
ships that could more easily sail to Rotterdam. Alternative routes via
Haringvliet/Grevelingen-Hollandsch Diep-Dordtse Kil-Oude Maas-Nieuwe Maas
(Fig. 1) were used up to the first half of the 18th century, but these waterways
silted up, making access to the port of Rotterdam more and more difficult.
Sailing to and from Rotterdam by these routes took several days and sometimes
several weeks (Buijsman, 2007). The “Voornsche Kanaal”, a canal excavated
through the island of Voorne, was opened in 1830 (Kuipers, 1962). Ships could
now use the canal and continue their journey to Rotterdam via the section of the
river Meuse called Botlek (Figs. 1 and 5).
From around 1300 to 1600, the surface area covered by the harbour grew from
8 to 20 ha, mainly at Rotterdam (Fig. 6). In the beginning of the so-called Golden
Age of the Netherlands (1600) the harbour area doubled to 40 ha over a period
of 30 years, thanks to shipping to tropical regions and the Baltic. The size of the
harbour area then remained unchanged until the start of the industrial revolution
around 1850.
The state of estuarine ecotopes in the Rotterdam harbour area around 1835
Until 1835, urbanization and industrialization had only taken place on a small
scale on the northern bank of the river Nieuwe Maas, particularly at Rotterdam
(Fig. 5). Fifty-eight percent (1536 ha) of the total estuarine area of the Nieuwe
Maas was occupied by the tidal river, 38% by soft substrate intertidal ecotopes,
4% by harbours and less than 1% by hard substrate intertidal ecotopes, mainly
quays (Fig. 7, Table 2). The lower part of the river banks consisted of sand flats,
and in sheltered places also mud flats. Reed and rush beds and tidal willow
coppice were the most important estuarine ecotopes, with a total area of some
500 ha. Two small and six larger sandbanks were situated in the riverbed.
Along the river Scheur, with a total estuarine area of 1683 ha (river and harbour
water surface and hard and soft estuarine ecotopes) stretching to the west end
of the island of Rozenburg, soft estuarine ecotopes were already scarce (Fig. 7),
due to land reclamation activities carried out here since the 15th century (Figs. 5
A and B); they consisted of a narrow strip of estuarine meadows adjoining the
sea dikes. The shores were protected by riprap in several places, covering a
total intertidal surface of 2 ha. However near the confluence with the river
Brielsche Maas, there were many large sand and mud flats, reed and rush beds,
estuarine meadows and dunes, covering 75% of this part of the estuarine area.

Petrifying the Rhine-Meuse estuary
47
The Brielsche Maas water system, with a total estuarine surface of 5154 ha, was
characterized upstream by a considerable area of tidal willow coppice and large
reed and rush beds that changed into sand and mud flats near the mouth of the
estuary (Fig. 5). Since the end of the Middle Ages, sedimentation had led to a
large dynamic area of beaches, sand and mud flats, dunes, reed and rush beds
and salt marshes, called “De Beer” (the Bear) or the “Hook of Holland”, with a
size of 1500 ha (Fig. 5). Salt marshes were not indicated on the maps, but they
must have been present, covering an area of 200 to 300 ha, as they still existed
around 1960 (Buijsman, 2007). A map drawn by Jacobsz (1633) also suggests
the presence of salt marshes near the mouth of the estuary. The intertidal zone
and the dunes together comprised 62% of the total area, the tidal river 38% and
tidal harbours a mere 0.1 % (Fig. 7, Table 2).
Data presented by Haring (1977) show that of the average discharge of the
Rhine and Meuse together (2400 m3 s
-1), some 850 m
3 s
-1 would have been
discharged via the Scheur and Nieuwe Maas. The Maasmond must therefore
have been a polyhaline area. In the upstream parts of the Scheur and Brielsche
Maas, this would gradually have changed to oligohaline conditions, with the
Nieuwe Maas and Oude Maas rivers constituting a freshwater tidal area.
Figure 6 Historical development of the port water area in the northern part of the
Rhine-Meuse estuary between 1300 and 2000.
.

Chapter 2
48

Petrifying the Rhine-Meuse estuary
49
A look at the total area shows that there was an estuarine area of 8372 ha, 42%
of which consisted of tidal river, 1% of tidal harbour, 57% of soft substrate
ecotopes and only 0.2% of hard substrate ecotopes (Fig. 7, Table 2).
The state of estuarine ecotopes in the Rotterdam harbour area around 1880
Only a few decades after the “Voornsche Kanaal” canal came into use, it had
already become too narrow for the new steam-driven ships, and problems of
navigation also arose as the entrance to the Haringvliet inlet silted up (Kuipers,
1962). The solution was found in constructing the Nieuwe Waterweg canal
through the “De Beer” area, damming the Scheur at its confluence with the
Brielsche Maas, directing the river water from the Oude Maas into the Scheur
and normalizing the river (i.e. straightening its navigational channel) with the
help of groynes (Anonymous, 1885). The project started in 1866 and the 4.3 km
Nieuwe Waterweg was finished in 1872, connecting the river Scheur to the sea
(Fig. 3), so that Rotterdam became easily accessible to steam ships.
The harbours of Rotterdam expanded along the river Nieuwe Maas by some
30% between 1850 and 1880 (Table 2), predominantly on the southern bank of
the river, in the polder called Fijenoord (now named Feijenoord) a former island
in a bend of the river (Fig. 5). River training works and land reclamation had
caused large parts of the vegetated intertidal zone to disappear, viz. 80% of the
reed and rush beds and 70% of the tidal willow coppice. The less frequently
inundated estuarine meadows were reduced by 30%, and the area covered by
sand and mud flats fell by 70%. Around 1880, three small and four partly
vegetated larger sand banks were still present, but they were removed soon
after by dredging. The total size of the estuarine area was reduced by 27% to
1122 ha.
The excavation of the Nieuwe Waterweg and river training works caused a
further reduction of the estuarine meadows that had been reclaimed along the
river Scheur, as well as a loss of dune area, whereas the water area increased
by over 400 ha to 1111 ha (Table 2). A temporary 85 ha mud flat area developed
in the part of the Scheur that was separated from the Maasmond by a dam. The
hard intertidal substrate, in the form of groynes and shore defences, increased
by over 400%, to 11 ha. The discharge of river water under average conditions
(data derived from Haring (1977)) totalled 350 m3 s
-1, which must have created a
transition zone from polyhaline conditions at the sea mouth to oligohaline
conditions in the Nieuwe Maas.
Land reclamation between 1850 and 1880 had a tremendous impact on the
estuarine ecotopes of the Brielsche Maas water system. The water surface
increased by 3%, but the total estuarine area (including the tidal river and
harbour area) decreased by 26% from 5154 ha to 3818 ha. Estuarine meadows

Chapter 2
50
shrank by 70%, reed and rush beds by 80%, mud flats by 85% and sand flats
and beaches by 40%. Tidal willow coppice increased by more than 150% as
reed and rush beds were turned into coppices. The area of bare sand situated
above the high water level and that of the dunes remained the same. Although
the harbour was not expanded further between 1835 and 1880, the hard
intertidal substrate increased from 2 to 5 ha. The discharge of river water under
average conditions (data derived from Haring (1977)) in the Maasmond dropped
from 850 m3 s
-1 to 450 m
3 s
-1 after the Nieuwe Waterweg (350 m
3 s
-1) was
excavated and the Scheur was dammed off. This must have led to a significant
increase in the salinity of the river Brielsche Maas, especially the Maasmond
part, favouring saline flora and fauna in the ecotopes.
Between 1835 and 1880, the total natural estuarine area shrank by 19% from
8377 ha to 6780 ha. The decrease was mainly caused by the disappearance of
more than half of the area of soft estuarine ecotopes by land reclamation. In
1880, the estuarine area consisted of 60% tidal river area, 1.3% tidal harbour
area, 39% soft estuarine ecotope and 0.5% hard estuarine ecotope (Fig. 7,
Table 2).
The state of estuarine ecotopes in the Rotterdam harbour area around 1933-35
Between 1880 and 1900, the harbours along the river Nieuwe Maas expanded
by 120 ha to cover a total of 195 ha (Fig. 6). Between 1900 and 1938, a further
550 ha of harbours were constructed on both the southern and northern banks
of the river (Fig. 5), and just before World War II, the area of tidal harbours
exceeded the area of the river channel itself (Table 2). Compared with 1880, the
total estuarine area had grown by 392 ha, but the soft estuarine ecotopes had
been reduced by almost 50% to 70 ha (a factor of 8 compared to 1835), whilst
the hard intertidal substrate in the Nieuwe Maas area had nearly tripled in area
to 46 ha (Fig. 7). The river training was almost completed, the shoreline had
been turned into a stony environment with only a few small areas of soft
estuarine ecotopes in direct contact with the river downstream of Rotterdam.
Soon after the Nieuwe Waterweg came into use in 1877 it started to silt up, as
did the river Scheur, and new regulatory works (mainly groynes) and dredging
had to be carried out to cope with the problem for shipping (Anonymous, 1880).
Furthermore, the mouth of the Nieuwe Waterweg became narrowed, while the
river Scheur widened (Ploeger, 1992) and the discharge of river water increased
to 690 m3 s
-1 (under average conditions) (Haring, 1977). The soft estuarine
ecotopes, in particular the estuarine meadows, were reduced by 75% compared
to 1880, to a size of 179 ha, while the area of hard-surface estuarine ecotopes
along the Nieuwe Waterweg and Scheur quadrupled to 44 ha. The tidal harbour
area showed a relatively slight increase of 3 ha, to a total of 12 ha.

Petrifying the Rhine-Meuse estuary
51
Chapter 2
52
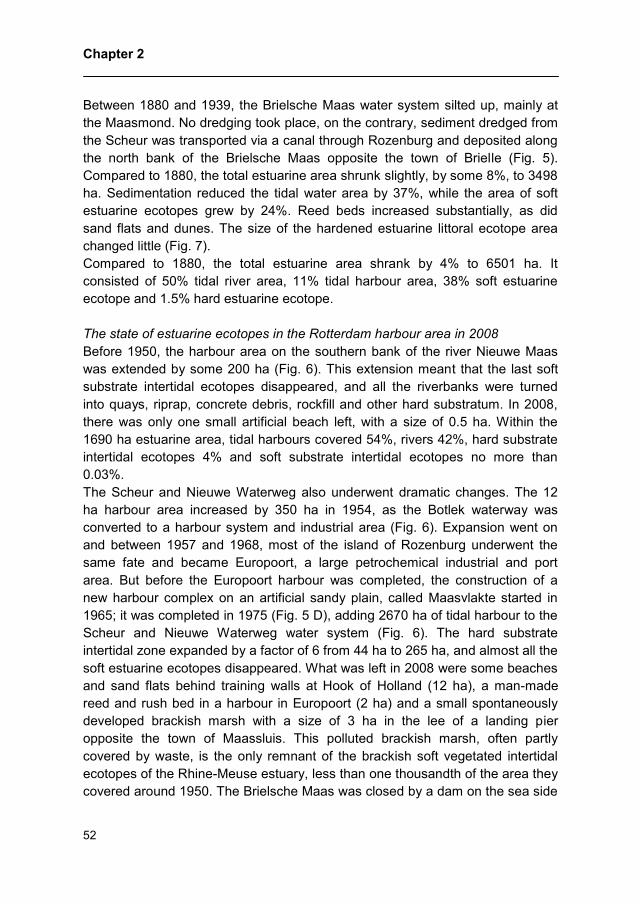
Between 1880 and 1939, the Brielsche Maas water system silted up, mainly at
the Maasmond. No dredging took place, on the contrary, sediment dredged from
the Scheur was transported via a canal through Rozenburg and deposited along
the north bank of the Brielsche Maas opposite the town of Brielle (Fig. 5).
Compared to 1880, the total estuarine area shrunk slightly, by some 8%, to 3498
ha. Sedimentation reduced the tidal water area by 37%, while the area of soft
estuarine ecotopes grew by 24%. Reed beds increased substantially, as did
sand flats and dunes. The size of the hardened estuarine littoral ecotope area
changed little (Fig. 7).
Compared to 1880, the total estuarine area shrank by 4% to 6501 ha. It
consisted of 50% tidal river area, 11% tidal harbour area, 38% soft estuarine
ecotope and 1.5% hard estuarine ecotope.
The state of estuarine ecotopes in the Rotterdam harbour area in 2008
Before 1950, the harbour area on the southern bank of the river Nieuwe Maas
was extended by some 200 ha (Fig. 6). This extension meant that the last soft
substrate intertidal ecotopes disappeared, and all the riverbanks were turned
into quays, riprap, concrete debris, rockfill and other hard substratum. In 2008,
there was only one small artificial beach left, with a size of 0.5 ha. Within the
1690 ha estuarine area, tidal harbours covered 54%, rivers 42%, hard substrate
intertidal ecotopes 4% and soft substrate intertidal ecotopes no more than
0.03%.
The Scheur and Nieuwe Waterweg also underwent dramatic changes. The 12
ha harbour area increased by 350 ha in 1954, as the Botlek waterway was
converted to a harbour system and industrial area (Fig. 6). Expansion went on
and between 1957 and 1968, most of the island of Rozenburg underwent the
same fate and became Europoort, a large petrochemical industrial and port
area. But before the Europoort harbour was completed, the construction of a
new harbour complex on an artificial sandy plain, called Maasvlakte started in
1965; it was completed in 1975 (Fig. 5 D), adding 2670 ha of tidal harbour to the
Scheur and Nieuwe Waterweg water system (Fig. 6). The hard substrate
intertidal zone expanded by a factor of 6 from 44 ha to 265 ha, and almost all the
soft estuarine ecotopes disappeared. What was left in 2008 were some beaches
and sand flats behind training walls at Hook of Holland (12 ha), a man-made
reed and rush bed in a harbour in Europoort (2 ha) and a small spontaneously
developed brackish marsh with a size of 3 ha in the lee of a landing pier
opposite the town of Maassluis. This polluted brackish marsh, often partly
covered by waste, is the only remnant of the brackish soft vegetated intertidal
ecotopes of the Rhine-Meuse estuary, less than one thousandth of the area they
covered around 1950. The Brielsche Maas was closed by a dam on the sea side

Petrifying the Rhine-Meuse estuary
53
in 1950 to shorten the coastline, and in 1953 the Botlek was also dammed,
turning the Brielsche Maas into a freshwater lake. An entire estuary with a
transition zone from salt to fresh water conditions had thereby disappeared. The
“De Beer” nature reserve was sacrificed to the development of Europoort and
the Maasvlakte, thus demolishing one of the most precious nature reserves of
Western Europe. It was Europe’s largest dynamic dune area and one of the
most important breeding grounds for many seabirds of the North Sea (Van
Beusekom et al., 1930). Of the Brielsche Maas water system, only part of the
Oude Maas remains. The shores of this tidal river section are mainly covered by
debris (6 ha).
In 2008, the 6598 ha estuarine area consisted of tidal harbours (65%), tidal
rivers (35%), hard substrate intertidal ecotopes (5%) and soft substrate intertidal
ecotopes (0.3%). Although there were artificial beaches and dunes on the
seaward side of the artificial Maasvlakte plain, and tidal flats and salt marshes in
the southern part of the plain, they were not in direct contact with the remains of
the Rhine-Meuse estuary and not considered to be part of it.
The Delta Works project considerably changed the hydrology of the Rotterdam
harbour area. The hydrology of the area is nowadays strongly controlled by the
drainage regime of the Haringvliet sluices (Fig. 1), based on the discharge of the
Rhine at the Dutch–German border (Qbr). The degree to which the sluice gates
are opened at ebb tide increases with increasing discharge of fresh river water.
To avoid salinization via the deepened Scheur/Nieuwe Waterweg waterways
upstream of Rotterdam, an amount of 1500 m3 s
-1 of river water is directed to the
Rotterdam harbour area, i.e. the Scheur and Nieuwe Waterweg (1300 m3
s-1
)
and Hartelkanaal (200 m3 s
-1). This flow of fresh water via the Rotterdam harbour
area can be maintained at a Qbr of 1700 m3
s-1
to 4500 m3
s-1
. Below 1700
m3
s-1
, the salinity gradient shifts inland, while above 4500 m3
s-1
it shifts
seawards. At a Qbr of approximately 1100 m3
s-1
, the Haringvliet sluices are
closed completely and a mixture of Meuse and Rhine water flows into the sea at
Hook of Holland.
Petrifying the estuary
Table 2 serves as a guideline for the following paragraphs about the petrification
of the estuary. Before the appearance of the shipworm (Teredo navalis) in 1730
(Sellius, 1733) dikes or shores were not protected by stones. The massive
destruction of wooden protecting structures in 1731 and 1732 (Vrolik et al.,
1860) triggered the hardening of large parts of the Dutch coastline. Later
outbreaks of the shipworm in the 18th and 19
th centuries infected sluices and
dolphins, and its boring activity led to harbour quays collapsing. The use of

Chapter 2
54
stone for shore and dike protection, for quays and in hydraulic engineering
became common practice.
Around 1835, the area of hard substrate intertidal ecotopes was still limited and
mainly consisted of the quays of the Rotterdam harbours (Fig. 7). Even then,
however, the length of the hard shores along the Nieuwe Maas already
exceeded its length by more than a factor of 2. Further stretches of hard
intertidal substrate were found as quays along the river Nieuwe Maas, as a few
small training walls and as reinforcements of the outlet of drainage sluices. The
soft shoreline along the estuary exceeded the length of the rivers by a factor of
14. On average, there were 80 ha of soft substrate intertidal ecotopes per km of
river, with a maximum of 109 ha per km along the Brielsche Maas water system.
Despite the many regulatory works and a significant expansion of the hard
intertidal shore due to harbour extensions between 1835 and 1880, the length of
the soft shoreline along the estuary increased slightly. The average area
covered by soft substrate intertidal ecotopes, however, declined by 50% to 40 ha
per km of river. Further river training of the Nieuwe Maas doubled its hard
shores to a length of some 30 km, but due to the many small creeks within rush
and reed beds and tidal willow coppice, the soft shoreline decreased only
slightly. The total length of the hard river shoreline tripled, while the hard
shoreline along the harbours almost doubled compared with 1835, especially
along the Nieuwe Maas.
The harbour area along the Nieuwe Maas grew by a factor of almost 10 between
1880 and 1935, leading to a hard shore along the river and harbours stretching
for 101 km, or about seven times the length of the river. The soft shoreline of the
river decreased by a factor of 10, to less than twice the length of the river.
Although 15 km of soft harbour shoreline existed when the aerial photographs
for the maps were taken in 1934, this was only a temporary situation, with
harbours under construction at that time. Between 1880 and 1934, the Scheur
and Nieuwe Waterweg waterways had undergone a complete metamorphosis.
Large parts of the soft shores had been straightened and protected by packed
stone revetments, while old groynes had been enlarged and many new ones
built. The hard shoreline grew to 56 km, more than twice the length of the river
and 3.5 times the total length of the soft shoreline, which was reduced by 93% in
the same period. Along the Brielsche Maas water system on the other hand,
sedimentation in the Maasmond and the formation of new reed and rush beds
with many small creeks meant that the soft shoreline grew by 50% to 629 km, 11
times the length of the water system itself. The closure of the Brielsche Maas
and the exponential harbour expansion along the Scheur/Nieuwe Waterweg
between 1950 and 1970 caused the almost complete disappearance of soft
substrate intertidal ecotopes. In 2008, only a few hundred metres of soft

Petrifying the Rhine-Meuse estuary
55
shoreline at low tide were present in front of the stone revetment of the dikes
and between the groynes. With a total of 344 km of hard shoreline, the estuary
contours were fixed and completely petrified.
Estuarine developments and perspectives
Recent developments and perspectives for the Rhine-Meuse estuary
The construction of the second Maasvlakte plain started in September 2008.
This is a seaward extension of the Rotterdam harbour area (Fig. 8), covering
about 2000 ha, expanding the wet harbour area by another 510 ha and the hard
substrate by 22 km of quay wall, creating another 6.6 ha of hard substrate
intertidal zone. Completion is expected in the course of 2013/2014. To
compensate for the loss of part of the seabed, a 25,000 ha area of the North
Sea south of the Maasvlakte has been designated as a marine reserve. In
addition, a new 35 ha dune area is being created north of Hook of Holland
(Project Organisatie Maasvlakte 2, 2008). The current infrastructure of rivers,
harbours, industrial and urbanized areas hampers large-scale restoration of soft
Figure 8 Aerial view in July 2012 of the genesis of Maasvlakte 2 (left from black
line). The line indicates the border between Maasvlakte 1 (right) and Maasvlakte 2
(left)(see Fig. 1). Photograph by Aeroview, Rotterdam, the Netherlands.
.

Chapter 2
56
estuarine ecotopes by removal of hard substrate, landward coastal realignment
or managed retreat. Only in some small lee sites in the harbour area, kilometres
apart, could some brackish marshes and reed and rush beds, covering a few ha,
be created by sediment supplementation (Paalvast, 1998, Stikvoort et al., 2002).
However, more and more ports along the river Nieuwe Maas are losing their
trade, as the size of container ships and bulk carriers continues to increase and
the new handling facilities and infrastructure on the first and second Maasvlakte
plains are adapted to this. This creates opportunities to restore freshwater soft
estuarine ecotopes in the near future in the upstream harbours, and the City of
Rotterdam has made proposals to do so on a small scale in their new area
development plans for old harbours.
On the 2nd of October 2013 the Port of Rotterdam, Rijkswaterstaat, the City of
Rotterdam and the World Wildlife Fund signed an agreement to develop over a
period of 10 years a nature–friendly intertidal zone along the south bank of the
Nieuwe Waterweg with a length of 5 km. Within this zone a brackish vegetation
and intertidal sand and mud flat of some 20 ha will develop over time. This is
only 0.4 percent of the 4745 ha of soft estuarine intertidal ecotopes that existed
in the Noordrand around 1835, but it might be a first step towards ecological
restoration in this part of the Rhine-Meuse estuary. The return of soft estuarine
ecotopes along the salinity gradient of the Rhine-Meuse estuary can be
achieved by changing the drainage regime of the Haringvliet sluices (Smit et al.,
1997, Paalvast et al., 1998, Storm et al., 2005), viz. by opening the sluices not
only around low water slack tide but also at high tide. The construction of the
Haringvliet sluices allows them to be used as a storm surge barrier.
Furthermore, large parts of the former estuarine infrastructure are still intact, and
habitat development projects that have been carried out in the last two decades
have all taken a new management of the sluices with a return of estuarine
dynamics into account. However the reintroduction of estuarine dynamics in the
Haringvliet inlet will not lead to the same situation as before the closure of the
Delta inlets. The Haringvliet sluices not only prevent the return of the old tidal
regime, but also have a great impact on sediment transport to and from the
Haringvliet. For example, the sill of the sluices (8 m above the sea floor)
prevents the transport of coarse sand from the sea to the Haringvliet (Van
Wijngaarden and Ludikhuize, 1997).
If it should be decided not to change the management of the Haringvliet sluices
by opening them at flood tide to restore estuarine dynamics, this would not only
hamper the development of soft estuarine ecotopes (Paalvast et al., 1998), it
would also have consequences for a number of estuarine ecosystem services
(see Barbier et al., 2011). A few examples are given.

Petrifying the Rhine-Meuse estuary
57
Erosion control would require the maintenance of foreshore protection by means
of riprap to avoid further erosion of the banks towards the dikes as result of the
disappearance of the tide.
Some migratory fish, such as Salmon (Salmo salar) and Sea Trout (S. trutta),
are able to enter the Haringvliet when the sluices are open at ebb tide as river
water is being discharged, but they are not able to reach their upstream
spawning grounds in the river Rhine and Meuse via the Haringvliet at discharges
below 1500 m3, as the sluices are then also closed at ebb tide (Hop et al., 2011).
Estuarine residents such as Smelt (Osmerus eperlanus), Flounder (Platichthys
flesus) and Twaite Shad (Alosa fallax) are currently unable to build up viable
populations in the Haringvliet (Van Leeuwen et al., 2004), while catadromous
fish species like Flounder (Platichthys flesus) and Eel (Anguilla anguilla) are
unable to migrate upstream as the transport of their larvae towards fresh water
depends on the tidal currents. Conversely, freshwater fish are being washed out
to sea in large quantities (up to 10,000 kg per day) at ebb tide at high river
discharges, and are unable to return to the Haringvliet at high tide, so they die in
the salt water (Hop et al., 2011). The former function of the Haringvliet estuary
as a nursery for Plaice (Pleuronectes platessa), Sole (Solea solea) and Herring
(Clupea harengus) would not be restored either if the sluice regimen is not
changed (Paalvast et al., 1998a).
A return of estuarine dynamics with its gradient from fresh to saline conditions
would stimulate recreation and tourism by enhancing the amenity value of the
landscape, as it leads to an ever changing landscape, in which the intertidal
zone of marshes, reed, rushes, sand and mud flats plays an important role.
Waterbound recreation would also benefit as more dynamics means more
challenges, while anglers would greatly benefit from the increased fish
biodiversity (Paalvast et al., 1998b).
An important aspect is to secure a sufficient minimum supply of fresh water. The
return of estuarine dynamics would mean that part of the Haringvliet would have
a salinity gradient going from mesohaline to fresh (Bol and Kraak, 1998). This
would have consequences for both the intake of drinking water (Meeuwissen
and Brink, 1998) and the supply of water for agriculture (Anonymous, 1998).
Moreover water intake points would have to be relocated.
In 1989 the Third National Policy Document on Water Management (NW3) was
published by the Dutch Government (Ministerie van Verkeer en Waterstaat,
1989), with ecological restoration of the Dutch water systems one of the main
issues. It was a turning point in Dutch water management, as it sets out a new
strategy under the name of “Integrated Water Management”. The strategy
proved to be a success, and the Fourth National Policy Document on Water
Management (NW4) issued in 1998 retains the same approach (Ministerie van

Chapter 2
58
Verkeer en Waterstaat, 1998). In 2007, the Dutch government created the Delta
Commission II (DC II), which is charged with investigating ways to strengthen
the water defence system and the infrastructure of the country in order to be well
prepared for the expected climate change, in both a physical and governance
sense. In particular, the commission was requested to produce an integral vision
for the coming centuries. As regards the safety of the Rijnmond area, DC II
proposed a scenario of closable open systems with weirs in conjunction with
using the Haringvliet sluices as a storm surge barrier (Deltacommissie 2008,
2008).
In 2009, the National Water Plan (NWP) was presented, as a follow-up to NW4
(Stumpe, 2009). One of the policy choices in both the NW4 and NWP was the
restoration of estuarine dynamics by eliminating the strict separation between
the various basins in a controlled manner. The implementation of a new
management scheme for the Haringvliet sluices with a new drainage regime
involving partial opening of the sluices at high tide at Rhine discharges of 1500
m3 or higher (the Kierbesluit, literally the decision to set the sluices ajar), which
was planned for 2010 (Kerkhofs et al., 2005, Rijkswaterstaat, 2009), would have
been a first step towards the estuarine recovery of the Haringvliet, Hollandsch
Diep and Biesbosch areas. The Dutch government, however, decided soon after
it came into office in 2010 not to discuss and implement the plan, though it later
reversed its decision after pressure from the EU. At the same time, it was
decided that a new drainage regime would be the final change in the
management of the Haringvliet sluices. The implementation of the Kierbesluit is
now foreseen for mid-2018 and is a separate decision that does not prelude a
further recovery of the estuarine dynamics (Staf Deltacommissaris, 2013) This
implies that it is not very likely that the near future will see a recovery of
estuarine dynamics and hence of soft estuarine ecotopes within the Rhine-
Meuse estuary. This policy is at odds with NWP and the recommendations of
DC II, and contrasts with the development of estuarine restoration elsewhere in
Europe (Attrill, 1998, Dauvin, 2006, Antheunisse and Verhoeven, 2006,
Ducrotoy and Dauvin, 2008, Ducrotoy, 2010).
The restoration of estuarine dynamics may however get a boost from a
completely different side, that of safety. The current drainage regime of the
Haringvliet sluices leads to high water velocities in the Spui, Dordtse Kil and
Oude Maas river branches (Fig. 1) with severe erosion along the whole channel,
which will in the long run undermine the stability of the dikes. A solution to the
problem can be generated by managing the Haringvliet sluices as a storm surge
barrier (Anonymous, 2012). The Dutch division of the Word Wild Life Fund has
launched a new proposal for a safer and more attractive South-West Delta area.
It comprises the reopening of the sea inlets such as the Haringvliet by removing

Petrifying the Rhine-Meuse estuary
59
the barriers, and building climate-proof dikes in combination with the creation of
natural wetlands. In case of storm surges the hinterland could be protected with
a new generation of barriers that do not hamper the free transport of sediment,
tides and animals (Braakhekke et al., 2008, Van Winden et al., 2010). A pilot
study conducted by Böhnke-Henrichs and De Groot (2010) shows an increase in
Total Economic Value (TEV) of at least 500 million Euro per year (from a TEV of
1.26 billion currently to 1.74 billion under the open Haringvliet scenario) based
on 30 ecosystem services and subservices that were included in the analysis
(the costs for removing barriers and building new dikes were not included in the
analysis).
Wider perspectives and developments elsewhere
The losses of pristine estuarine ecotopes and the expansion of hard substrate
ecotopes are not confined to the Rhine-Meuse estuary. Since the majority of
large harbours in Western Europe have developed over centuries and are
situated as far inland along the estuary as ancient ships could sail, they are
characterized by developments comparable to those in the south-western part of
the Netherlands. Examples are Hamburg on the Elbe, Bremen on the Weser,
Emden and Delfzijl on the Ems, Antwerp on the Western Scheldt, London on the
Thames, Hull on the Humber, Rouen on the Seine, Nantes on the Loire,
Bordeaux on the Garonne and Lisbon on the Tagus. Over the last two centuries,
these estuaries have undergone great hydromorphological changes (increased
tidal range, salt intrusion further upstream, going from multichannel to single-
channel) as a result of dredging to provide greater depth for shipping, land
reclamation for agriculture, urbanization and industrialization and port
development. In estuaries such as the Elbe (Reky, 1992, Fickert and Strotmann,
2007), Ems (Herrling and Niemeyer, 2008) and Seine (Bessineton, 1997,
Lesueur and Lesourd, 1999,) most marshes have been turned into polders,
while large parts of marshes and sand and mud flats have disappeared by
coastal squeeze due to hydrological changes caused by dredging and river
training. One of the most extreme examples is the Ems estuary (De Jonge et al.,
2014) where a combination of channel maintenance dredging in the lower
estuary and river deepening in the upper estuary (tidal Ems river) has led to
significantly increased concentrations of suspended material. In the main
estuary, the concentrations have increased 2- to 3-fold, while in the river, the
concentrations have increased by an order of magnitude. As a result, the main
estuary suffers from low primary production. The tidal Ems river is now
characterized by extremely high suspended matter concentrations and
extremely low oxygen values over a distance of about 15 to 25 km during
summer, so organisms cannot migrate between fresh water and sea water and

Chapter 2
60
vice versa. The Humber estuarine area has been reduced over time by human
activities from over 90,000 ha to about 30,000 ha, and some 50% of the original
intertidal zone area has been sacrificed to such activities (Jones, 1988, Winn et
al., 2003). In the same time, shorelines have been straightened and protected by
a variety of hard materials. Large parts of the shoreline of the river Seine, from
the mouth of the estuary up to Rouen and even further upstream, consist of
concrete, steel, asphalt, riprap, debris etc. (personal observations for GIP Seine-
Aval), while half of the entire river length of the Elbe estuary is protected by
embankments (Anonymous, 2010). The loss of large parts of the intertidal zone
and the hardening of the shores has undoubtedly lowered biological productivity
in estuaries to a great extent.
In Europe, the restoration/rehabilitation of estuarine ecotopes and the
management of estuaries has been mainly a national or regional issue. Between
2004 and 2008, the HARBASINS project, part of the Interreg IIIB North Sea
Programme, was carried out with the aim of enhancing the compatibility of
management strategies and international cooperation for the North Sea's coastal
waters, estuaries and river basins. Its focus has been on harmonizing the EU
Water Framework Directive and international cooperation for integrated
management of estuaries and coastal waters in the North Sea Region, ultimately
leading to ecosystem restoration and instruments that are compatible which
sound environmental management of interconnected coastal zones in the North
Sea (Enserink et al., 2007). As a follow–up, the Tide project started in 2010, with
the aim of finding multi-beneficial solutions for future sustainable estuary
development (Anonymous, 2010a). So far, however, no concrete measures
have been taken. For the Ems estuary, Schuttelaars et al. (2013) have proposed
a management solution to solve the problem of the high suspended matter
concentrations in the tidal Ems river by removing the weir at Herbrum. If this
plan is implemented, the river will be lengthened by 7 km, which is enough to
significantly change the hydraulics so that the accumulation of suspended matter
will no longer take place in that part of the system, but will return more or less to
its original position (near Emden).
The estuarine ecosystem would be best served in the near future if port activities
were moved from inland locations to the mouths of the estuaries. This should
lead to a decrease in the pressure on the estuarine ecosystem, as dredging for
greater waterway depths, with all its consequences, would no longer be
necessary. In this respect, the development of the second Maasvlakte could set
an example for port development elsewhere. Nevertheless, we need to be aware
of unforeseen effects of engineering on and along the coast, as has been
illustrated by De Jonge and De Jong (1992). They showed that the effects of the
dumping of dredge sludge at the Dutch coast near Scheveningen clearly

Petrifying the Rhine-Meuse estuary
61
affected the suspended matter concentrations in the western Dutch Wadden
Sea, 120 to 180 km further north.
Acknowledgements
The authors are thankful to Peter Charpentier for searching and finding obscure
literature, Ernst Lofvers and Marjolein Bons for providing many digitized old river
maps and to Prof. dr. V.N. de Jonge and two anonymous reviewers for
constructive remarks leading to improvement of the paper.
References
Adriani, M.J., 1977. De Oude Maas als groene rivier. Rapport werkgroep Oude
Maas. Deel 1.
Airoldi, L., Abbiati, M., Beck, M.W., Hawkins, S.J., Jonsson, P.R., Martin, D.,
Moschella, P.S., Sundelöf, A., Thompson, R.C., Åberg, P., 2005. An
ecological perspective on the deployment and design of low crested and
other hard coastal defence structures. Coastal Engineering, 52: 1073–1087.
Airoldi, L., Beck, M.W., 2007. Loss, status and trends for coastal marine habitats
of Europe. In Oceanography and Marine Biology, Gibson, R.N., Atkinson
R.J.A., Gordon, J.D.M. (eds.). CRC Press,Taylor & Francis Group, Boca
Raton.An Annual Review, 45: 345-405.
Anonymous, 1885. Rapport over de verbetering van den Waterweg van
Rotterdam naar zee, uitgebragt door een raad van den Waterstaat,
ingesteld bij besluit van den Minister van Binnenlandsche Zaken van den
5den
november 1857, No. 125, 3
de afdeeling. Van Weelden en Mingelen, ’s
Gravenhage.
Anonymous, 1880. Eindverslag van de Staats-Commissie benoemd bij
Koninklijk besluit van 4 December 1877, No. 1, tot het instellen van een
onderzoek omtrent de verbetering van den Waterweg langs Rotterdam naar
zee. Met tekeningen. Algemeene Landsdrukkerij, ’s Gravenhage.
Anonymous, 1998. MER Beheer Haringvlietsluizen. Over de grens van zout en
zoet. Deelrapport Landbouwwatervoorziening. ISBN: 903694831. RWS,
notanummer: apv 98/096.
Anonymous, 2010. The Elbe river estuary. Tide Facts. Tidal River Development.
Anonymous, 2012. Mogelijke toekomsten Haringvliet. Verslag werkplaats. 17
augustus 2012. Boompjes 200 Rotterdam. Deltaprogramma. Werkplaats
Zuidwestelijke Delta.

Chapter 2
62
Antheunisse, A.M., Verhoeven, J.T., 2006. Restoration of natural hydrological
and salinity gradients in tidal rivers; consequences for helophyte vegetation.
p. 51-63. In: Antheunisse, A.M., 2006. Floodplain rehabilitation and the
importance of nitrogen dynamics for plant communities. PhD thesis, Utrecht
University, Science Faculty. 144 pp.
Attrill, M.J., 1998. A rehabilitated estuarine ecosystem: The environment and
ecology of the Thames estuary. Kluwer Academic Publishers.
Dordrecht/Boston/London. ISBN 0412496801
Auger, C., Verrel, J.-L. (eds.), 1998. Les estuaires français: évolution naturelle et
artificielle: Quel avenir pour leurs zones d'intérêt biologique? Actes de
Colloques - IFREMER, 22 IFREMER: Plouzané. ISBN 2-905434-95-3. 366
pp.
ARGE-ELBE, 2001. Mittlere Wasserstände der Elbe ab 1843 am Pegel St. Pauli
und Fahrrinnen-Soltiefen. Grafik. Arbeitsgemeinschaft für die Reinhaltung
der Elbe (ARGE-ELBE). WGE Be 3/01.
Bakker, D., Boer, A.C., 1954. Mattenbiezen. De Levende Natuur, 57: 30-35.
Barnes, R.S.K., 1974. Estuarine biology. The Institute of Biology’s Studies in
Biology no. 49. Edward Arnold, London.
Barbier, E.B., Hacker, S.D., Kennedy, C., Koch, E.W., Stier, A.C., Silliman, B.R.,
2011. The value of estuarine and coastal ecosystem services. Ecological
Monographs, 81: 169-193.
Bessineton, C., 1997. La creation de vasières artificielles dans l’estuaire de la
Seine. In : Les estuaires français. Évolution naturelle et artificielle. Éditions
Ifremer. ISBN 2-905434-95-3. Auger, C., Verrel, J.-L. (eds.), 111-121.
Bol, R., Kraak, A., 1998. MER Beheer Haringvlietsluizen. Over de grens van
zout en zoet. Deelrapport Water- en Zoutbeweging. ISBN: 903694871.
RWS, notanummer: apv 98/093, 212 pp.
Böhnke-Henrichs, A., De Groot, R., 2010. A pilot study on the consequences of
an Open Haringvliet Scenario for changes in ecosystem services and their
monetary value. Wageningen University, 79 pp.
Boode, M.F., 1979. 150 jaar rivierkaarten van Nederland. Meetkundige Dienst
van Rijkswaterstaat Delft.
Braakhekke, W., Van Winden, A., Litjens, G., Berkhuysen, A., 2008. Hoogtij voor
Laag Nederland. Bureau Stroming. WNF. Geschreven in opdracht van het
Wereld Natuur Fonds.
Buijsman, E., 2007. Een eersteklas landschap. De teloorgang van
natuurmonument De Beer. Uitgeverij Matrijs. ISBN 9789053453285.
Dauvin, J.-C., 2006. North-Atlantic estuaries: Problems and perspectives. Seine-
Aval Special Issue. Groupement d’intéret public Seine-Aval, Rouen.

Petrifying the Rhine-Meuse estuary
63
De Jonge, V.N., 1983. Relations between annual dredging activities, suspended
matter concentrations, and the development of the tidal regime in the Ems
estuary. Canadian Journal of Fisheries and Aquatic Sciences, 40 (Suppl. 1):
289-300.
De Jonge, V.N., 2000. Importance of temporal and spatial scales in applying
biological and physical process knowledge in coastal management, an
example for the Ems estuary. Continental Shelf Research, 20: 1655-1686.
De Jonge, V.N., 2009. Water management in the Netherlands: development
from a defensive to an integral water system approach. P. 17-46. In: Water
Problems and Policies in The Netherlands. Folmer, H., Reinhard, S. (eds.).
RFF-PRESS, Boca Raton, 257 pp.
De Jonge, V.N., De Jong, D.J., 1992. Role of tide, light and fisheries in the
decline of Zostera marina L. in the Dutch Wadden Sea. Proceedings if the
7th International Wadden Sea Symposium, Ameland, The Netherlands.
Netherlands Institute for Sea Research, Publication Series, 20: 161-176.
De Jonge, V. N., De Jong, D. J., 2002. Ecological restoration in coastal areas in
the Netherlands: concepts, dilemmas and some examples.
Hydrobiologia, 478: 7-28.
De Jonge, V.N., Schuttelaars, H.M., Van Beusekom, J.E.E., Talke, S.A., De
Swart, H E., 2014. The influence of channel deepening on estuarine
turbidity levels and dynamics, as exemplified by the Ems
estuary. Estuarine, Coastal and Shelf Science: 46-59.
Deltacommissie 2008, 2008. Samen werken met water. Een land dat leeft,
bouwt aan zijn toekomst. Bevindingen van de Deltacommissie 2008.
ISBN/EAN 978-90-9023484-7.
De Mulder, E.F., Geluk, M.C., Ritsema, I., Westerhoff, W.E., Wong, T.E.,
2003. De ondergrond van Nederland. Wolters-Noordhoff.
Doody, J.P., 2004. ‘Coastal squeeze’ an historical perspective. Journal of
Coastal Conservation, 10: 129-138.
Ducrotoy, J.P., 2010. Ecological restoration of tidal estuaries in North Western
Europe: an adaptive strategy to multi-scale changes. Plankton & Benthos
Research, 5: 174-184.
Ducrotoy, J.P., Dauvin, J.-C., 2008. Estuarine conservation and restoration: The
Somme and the Seine case studies (English Channel, France). Marine
Pollution Bulletin, 57: 208-218.
Dyer, K.R., 2002. FutureCoast Estuary Assessment. On: FutureCoast CD-ROM,
Halcrow,. Swindon, UK.
Eertman, R., 1997. Veranderingen in de estuariene ecotopen in de delta.
Rapport NIOO-CEMO 1997-01. Werkdocument RIKZ/AB-96.803x.

Chapter 2
64
Enserink, G., Dommering, A., Knoben, R., Van Nieuwerburgh, L., Coumans, C.,
2007. HARBASINS WP1. Document analysis: comparison of WFD Article 5
implementation in estuaries and coastal zones in Belgium, Denmark,
Germany, the Netherlands and United Kingdom. RWS Noord-Holland.
Working document. 9S1158.
Eriksson, B.K., Van der Heide, T., Van de Koppel, J., Piersma, T., Van der Veer,
H.W., Olff, H., 2010. Major changes in the ecology of the Wadden Sea:
human impacts, ecosystem engineering and sediment
dynamics. Ecosystems,13: 752-764.
Fickert, M., Strotmann, T., 2007. Hydrodynamische Entwicklung der Tideelbe.
Coastline Reports Nr. 9: 59-68.
Haring, J., 1977. De geschiedenis van de ontwikkeling van de waterbeweging en
het profiel van de rivieren in het Noordelijke Deltabekken over de perioden
1870 - 1970 – 1976. Deel I – De periode 1870 – 1970. Rijkswaterstaat.
Directie Waterhuishouding en Waterbeweging. District Zuidwest.
Memorandum No. 44.011.02.
Healy, M.G., Hickey, K.R., 2002. Historic land reclamation in the intertidal
wetlands of the Shannon estuary, western Ireland. Journal of Coastal
Research, 36 SI: 365–373.
Herrling, G., Niemeyer, H.D., 2008. Hydro- and Morphological Pressures and
Impacts. HARBASINS Report. Lower Saxony Water Management, Coastal
Defense and Nature Conservation Agency- Coastal Research Station -
Hop, J., Vriese, T., Quak, J., Breukelaar, A.W., 2011. Visstand Haringvliet en
Kier. ATKB rapportnummer 20110243/001. Commissioned by
Rijkswaterstaat Zuid-Holland, Rotterdam.
Hughes, R.G., Paramor, O.A.L., 2004. On the loss of saltmarshes in south‐east
England and methods for their restoration. Journal of Applied Ecology, 41:
440-448.
Jacobsz., F., 1633. Maese. Map of northern banks of the Rhine-Meuse estuary
between Maassluis and the North Sea.
Jones, N.V., 1988. A dynamic estuary. Man, Nature and the Humber. Hull
University Press. ISBN 9780859584692.
Kerkhofs, M.J.J., Tiebosch, T., Van der Velden, J.A., Kuijpers, J.W.M., 2005.
Alternative management of the Haringvliet sluices : first step towards major
rehabilitation of the Rhine-Meuse estuary. Archiv für Hydrobiologie.
Supplementband. Large Rivers, 15: 549-560.
Kuipers, H., 1962. The changing landscape of the island of Rozenburg
(Rotterdam Port Area). Geographical Review, 52: 362-378.

Petrifying the Rhine-Meuse estuary
65
Lesueur, P., Lesourd, S., 1999. Sands, channels and mudflats: sediment
transport and morphologic changes. The Seine-Aval scientific programme.
39 pp.
Lotze, H.K., Reise, K., Worm, B., Van Beusekom, J.E.E., Busch, M., Ehlers, A.,
Heinrich, D., Hoffmann, R.C., Holm, P., Jensen, C., Knottnerus, O.S.,
Langhanki, N., Prummel, W., Wolff, W.J., 2005. Human transformations of
the Wadden Sea ecosystem through time: a synthesis. Helgoland Marine
Research, 59: 84–95.
McLusky, D.S., Elliott, M., 2004. The estuarine ecosystem. Ecology, threats and
management. Oxford Biology, Oxford University Press, Oxford. 3rd
ed.
Meeuwissen, B.A.J., Brink, H., 1998. MER Beheer Haringvlietsluizen. Over de
grens van zout en zoet. Deelrapport Drinkwatervoorziening. ISBN:
903694811. RWS, notanummer: apv 98/095.
Melman, P.J.M., Reitsma, J.M., Loomans, P.M., 1997. De vegetatie van de
buitendijkse gebieden langs de Lek, Oude Maas, Afgedamde Maas en
Boven-Merwede: op basis van false-colour luchtfoto's 1992. Ministerie van
Verkeer en Waterstaat, Directoraat-Generaal Rijkswaterstaat, Meetkundige
Dienst, Afdeling Thematische Geo-informatie.
Ministerie van Verkeer en Waterstaat, 1989. Water voor nu en later: Derde Nota
Waterhuishouding. Tweede Kamer, 1988-1989, 21250, nr. 2.
Ministerie van Verkeer en Waterstaat, 1998. Water Kader. Vierde Nota
Waterhuishouding Regeringsbeslissing. Ministerie van Verkeer en
Waterstaat, Directoraat-Generaal Rijkswaterstaat, Ministerie van
Landbouw, Natuurbeheer en Visserij, Ministerie van Volkshuisvesting,
Ruimtelijke Ordening en Milieubeheer, Den Haag.
Paalvast, P., 1995. Amoebes Benedenrivieren. Doelvariabelen producenten &
plantesoorten. 2e herziene druk. Ecoconsult, Vlaardingen. In opdracht van
Rijkswaterstaat, Directie Zuid-Holland.
Paalvast, P., 1998. Ecologische waardering van de oevers in het Rotterdamse
havengebied. Calandkanaal, Beerkanaal, Hartelkanaal en Nieuwe
Waterweg. Ecoconsult. In opdracht van het Rijksinstituut voor Kust en Zee,
Middelburg. Rijkswaterstaat, directie Zuid-Holland
Paalvast, P., Iedema, W., Ohm, M., Posthoorn, R., 1998. Milieu-effectrapport
over een ander beheer van de Haringvlietsluizen. Over de grens van zout
en zoet. Deelrapport ecologie en landschap. RIZA rapport 98051. RWS,
Memorandum No. APV 98/103. ISBN: 90-369-5205-0.
Paalvast, P., Peters, H., Van Sprundel, L., 1998. MER Beheer Haring-
vlietsluizen. Over de grens van zout naar zoet. Hoofdrapport. Milieu-
effectrapport over een ander beheer van de Haringvlietsluizen.
Memorandum No. APV 98.186. ISBN nummer 903694802.

Chapter 2
66
Ploeger, B., 1992. Bouwen aan de Rijn. Menselijke ingrepen op de Rijn en zijn
takken. Ministerie van Verkeer en Waterstaat, Memorandum No. 53.
Project Organisatie Maasvlakte 2, 2008. The sustainable port. Port of Rotterdam
Authority. Project Organization Maasvlakte 2.
Reky, Z., 1992. Die Elbe. Ein Lebenslauf. Eine Ausstellung des Deutschen
Historischen Museums Berlin in Zusammenarbeit mit dem Deutschen
Hygiene-Museum Dresden, dem Altonaer Museum, dem Museum für
Hamburgische Geschichte und dem Nationalmuseum Prag. 450 Seiten mit
300 Abbildungen. Nicolaische Verlagsanstalt Berlin.
Rienstra, S., 1958. De algemene rivierkaart. Tijdschrift van het Koninklijk Neder-
landsch Aardrijkskundig Genootschap, 75: 384-387.
Rijkswaterstaat, 2009. Programma Rijkswateren 2010-2015. Uitwerking Water-
beheer 21e eeuw, Kaderrichtlijn Water en Natura 2000. Beheer- en
Ontwikkelplan voor de Rijkswateren 2010-2015. Rijkswaterstaat. Ministerie
van Verkeer en Waterstaat.
Rippon, S., 2000. The transformation of coastal wetlands: Exploitation and
management of marshland landscapes in North West Europe during the
Roman and medieval periods. London: British Academy.
Schuttelaars, H.M., De Jonge, V.N., Chernetsky, A., 2013. Improving the
predictive power when modelling physical effects of human interventions in
estuarine systems. Ocean & Coastal Management, 79: 70-82.
Sellius, G., 1733. Historia naturalis teridinis seu Xylophagi marini, tubule-
conchoideis speciatim belgici cum tabulis ad vivum delineatis. Trajecti ad
Rhenum Apud Hermannum Besseling.
Smit, H., Coops, H., 1991. Ecological, economic and social aspects of natural
and man-made bulrush (Scirpus lacustris L.) wetlands in The Netherlands.
Landscape and Urban Planning, 20: 33-40.
Smit, H., Van der Velde, G., Smits, R.G., Coops, H., 1997. Ecosystem respon-
ses in the Rhine-Meuse Delta during two decades after enclosure and steps
toward estuary restoration. Estuaries, 20: 504-520.
Staf Deltacommissaris, 2013. Delta Programme 2014. Working on the delta.
Promising solutions for tasking and ambitions. Ministry of Infrastructure and
Environment.
Stikvoort, E.C., Graveland, J., Eertman, R.H.M., 2002. Leve(n)de Noordrand.
Pragmatische toekomstvisie voor het ecologische herstel van het estuarium
van het Rotterdamse havengebied. Rapport RIKZ/2002.032,
Rijkswaterstaat Rijksinstituut voor Kust en Zee, Middelburg.
Storm, C., Van der Velden, J.A., Kuijpers, J.W.M., 2005. From nature
conservation towards restoration of estuarine dynamics in the heavily
Petrifying the Rhine-Meuse estuary
67
modified Rhine-Meuse estuary, The Netherlands. Archiv für Hydrobiologie.
Supplementband. Large Rivers, 15: 305-318.
Strucker, R.C.W., Preesman, L.C., Verkerk, J. 1994. Watervogels van het
zoetwater-getijdegebied de Oude Maas. Limosa, 67: 45-52.
Stumpe, J. (ed.), 2009. National Water Plan. 2009-2015. Dutch Central
Government.
Stuvel, H.J., 1956. Het Deltaplan. De Geboorte. Scheltema & Holkema N.V.
Amsterdam.
Stuvel, H.J., 1961. Grendel van Holland. CO-OP Nederland Rotterdam.
Talke, S.A., De Swart, H.E., 2006. Hydrodynamics and morphology in the
Ems/Dollard Estuary: Review of models, measurements, scientific literature,
and the effects of changing conditions. Institute for Marine and Atmospheric
Research Utrecht (IMAU).
Ten Brinke, W., 2005. The Dutch Rhine, a restrained river. Veens Magazines
B.V. the Netherlands. ISBN 9076988919.
Van Beusekom G., Kooimans F.P.J., Rutten, M.G., Tinbergen, N., 1930. Het
Vogeleiland. A.G. Schoonderbeek, Laren, the Netherlands.
Van den Brink, P.P.W.J., Hoofs, J., Van der Pijl, Y., 2002. Kartobibliografie van
de Rivierkaart (1830-1961). Delft: Meetkundige Dienst, afd. IEBD.
Van Leeuwen, F., Jacobs, P., Storm, K., 2004. Haringvlietsluizen op een Kier.
Effecten op natuur en gebruiksfuncties. Stuurgroep Realisatie de Kier.
Commissioned by Ministerie van Verkeer en Waterstaat, Ministerie van
Landbouw, Natuur en Voedselkwaliteit. Notanummer AP/2004.07.
Van Wijngaarden, M., Ludikhuize, D., 1997. Veranderingen in morfologie, water-
en bodemkwaliteit in het Noordelijk Deltabekken bij een alternatief beheer
van de Haringvlietsluizen. Deelrapport MER Beheer Haringvlietsluizen.
Rijkswaterstaat 98/094, ISBN 903694851.
Van Winden, A., Tangelder, M., Braakhekke, W., Geenen, B., Berkhuysen, A.,
Blom, E., 2010. Met Open Armen. Voor het belang van veiligheid, natuur en
economie. Wereld Natuur Fonds 2010.
Viles, H., Spencer, T., 1995. Coastal problems. Geomorphology, ecology and
society at the coast. Edward Arnold, London.
Von Wiebeking, C.F., 1795. Karte zur Darstellung des Binnen und Aeussern
Wasserstaates von Delfland.
Vos, P.C., Bazelmans, J., Weerts, H.J.T., Van der Meulen, M.J. (eds.), 2011.
Atlas van Nederland in het Holoceen. Bert Bakker Uitgeverij, Amsterdam.
Vrolik, W., Harting, P., Storm Buysing, D.J., Van Oordt, J.W.L., Von Baumhauer,
E.H., 1860. Verslag over den Paalworm, uitgegeven door de Natuurkundige
Afdeeling der Koninklijke Nederlandsche Akademie van Wetenschappen,
Amsterdam, 153 pp.

Chapter 2
68
Weeda, E.J., Westra, R., Westra, Ch., Westra, T., 1994. Nederlandse
oecologische Flora. Wilde planten en hun relaties 5. IVN, Amsterdam. ISBN
90-6301-024-9.
Winn, P.J.S., Edwards, A.M.C., Young, R.M., Waters, R., Lunn, J., 2003. A
strategic approach to flood defence and habitat restoration for the Humber
estuary. Archiv für Hydrobiologie. Supplementband. Large Rivers, 15: 631-
641.
Wisboom van Giessendam, D.W.P., 1878. De teelt van griend- en teenhout in
Nederland en het naburige Vlaanderen. Beantwoording der prijsvraag.
Bekroond met de Gouden Medaille door de Hollandsche Maatschappij van
Landbouw. H.A.M. Roelants, Schiedam.
Wolf, R.J.A.M., Stortelder, A.H.F., De Waal, R.W., 2001. Ooibossen,
Bosecosystemen van Nederland deel 2. KNNV, Utrecht.
Wolfert, H., 1996. Rijkswateren Ecotopenstelsels. Uitgangspunten en plan van
aanpak. RIZA Memorandum No. 96.050, Rijkwaterstaat Lelystad en DLO-
Staringscentrum Wageningen. RIZA Memorandum No. 96.050. ISBN
9036950163.
Wolff, W.J., 1992. The end of a tradition: 1000 years of embankment and
reclamation of wetlands in the Netherlands. Ambio, 21: 287–291.
Wolff, W.J., 1993. Netherlands-Wetlands. Hydrobiologia, 265: 1-14.
Wouda, B., 2007. Doordachte dieptelijnen op Rotterdamse rivierkaarten. De
Nieuwe Maas in 1697 door Pierre Ancelin gekarteerd. Tijdschrift voor
Waterstaatsgeschiedenis, 16: 69-92.
Zagwijn, W.H.,1991. Nederland in het Holoceen [The Netherlands in the
Holocene]. The Hague: SDU Uitgeverij.


Chapter 3
Distribution, settlement, and growth of
first-year individuals of the shipworm
Teredo navalis L. (Bivalvia:
Teredinidae) in the port of Rotterdam
area, the Netherlands
Peter Paalvast
Gerard van der Velde
International Biodeterioration & Biodegradation 65 (2011) 379-388

Chapter 3
72
Abstract
During the period 2004 -2008 the distribution, settlement and growth of first year
shipworms (Teredo navalis L., 1758.) was studied by exposing fir and oak
panels in the port of Rotterdam area, which is situated in the Rhine-Meuse
estuary in the Netherlands and covers the complete salinity gradient. Shipworms
were found yearly in the western large polyhaline harbours. On only a few
occasions they were found in harbours that showed large seasonal and daily
fluctuations in salinity over the years. In 2006 the shipworm was found in fir
panels 20 km upstream from the polyhaline harbours, demonstrating their ability
to travel with the tidal currents over considerable distances and to settle once
the abiotic conditions become favourable. Although the water temperatures
allowed them to breed from April till November, infestations were not found
before September and from the size of the animals in the panels it was
concluded that in the port of Rotterdam area they spawned from August until the
end of November.
The settlement height was negatively correlated with the distance of the panels
to the sea floor. In the first season after settlement they showed a substantial
growth rate of 0.18 cm day-1
in 2006. The longest shipworm found was in 2006
and measured 36.8 cm after 4 – 5 months of growth after settlement.
Infestations and growth were lower in oak than in fir wood. In 2006 the maximum
loss of wood caused by individuals settled in the same year in panels at the
bottom accounted 12.4%. Shell size and body length of the animal after the first
season of growth showed a significant positive logarithmic relation. In both 2006
and 2007 a similar relation between the average boring tube diameter and the
length of the animals was found.
Lower river discharges leading to salinisation of the eastern part of the port of
Rotterdam area create conditions favourable for the shipworm with serious
consequences for the condition of the piles where the quays are built upon.

The shipworm Teredo navalis in the port of Rotterdam
73
Introduction
Shipworms are ‘xylophagous’ marine bivalve molluscs belonging to the
Teredinidae which are specialized to bore into wood. The first documented mass
appearance of the shipworm (Teredo navalis L.) in the coastal waters of the
Netherlands took place in 1730,1731, and 1732 and led to massive destruction
of the wooden constructions that protected the dikes in Zealand and
Westfrisland (Vrolik et al., 1860). Later outbreaks of the species occurred in
1770, 1827, 1858 and 1859. Also sluices and dolphins in harbours upstream the
Rhine-Meuse estuary were found to be infected in 1826. The conclusion was
drawn that several seasons of low river discharges resulting in increased salinity
had created favourable conditions for the shipworm to settle and survive in the
area. The shipworm commonly occurs in the Dutch coastal waters and the
enclosed salt water bodies in the Dutch Delta Area (Van Benthem Jutting, 1943,
De Bruyne, 1994).
The adult shipworm tolerates salinity conditions between 5 and 35 (Nair and
Sarawathy, 1971) making the mouth of estuaries with daily changing salinities a
hospitable habitat for this species. The animal thrives and reproduces at
salinities of 10 and higher (Soldatova, 1961 in Tuente, 2002). Below a salinity of
9-10 boring activity stops (Blum, 1922). The pelagic larvae survive at salinities
as low as 5 (Hoagland, 1986). The optimal water temperature for growth and
reproduction lies between 15˚C and 25˚C. Spawning starts when the
temperature rises above 11 to 12˚C and the animals may breed from May until
October (Grave, 1928). Temperatures up to 30˚C are tolerated. Below 10˚C the
boring activity drops and it stops at 5˚C. At temperatures around the freezing
point they will hibernate until the water temperature becomes favourable again.
The port of Rotterdam covers the complete salinity gradient of the Rhine-Meuse
estuary. The large harbours in the western part are always polyhaline and the
shipworm could settle if wooden constructions to bore into are present. The
bottom water of the harbours of the eastern part is fresh to oligohaline at
average river discharge, but at discharges below 1000 m3
s-1
the area becomes
α-mesohaline with salinities over 10. If the discharge of the river Rhine remains
below 1000 m3
s-1
during the breeding season for a few weeks the conditions
might become favourable for the shipworm. Larvae transported with the tidal
currents to the eastern part of the port of Rotterdam area could perhaps settle
and grow in the oak and pine on which several old quays are built upon. In the
summer of 2003 the discharge of the river Rhine dropped to a level below 1000
m3
s-1
and the salinity in the eastern part of the port of Rotterdam area rose to
levels above 10. In September 2003 the Port Authority decided to test the
validity of the above hypotheses and sets of fir panels where placed at the

Chapter 3
74
bottom at various sites of the port of Rotterdam area yearly from 2004 till 2008
and were inspected for the presence of shipworms .
The following research questions were formulated:
1. What is the distribution of the shipworm related to salinity and what is the
potential and actual breeding season and length of boring period of T.
navalis in the port of Rotterdam area based on water temperature and
settlement on fir panels, respectively?
2. Is it possible for the shipworm to settle in the eastern part of the port of
Rotterdam area at low river discharges and is settlement equally distributed
over the water column or is there a relation with water depth?
3. How fast does the shipworm grow in fir wood the first season after
settlement, how much wood loss they cause in that period and is there a
difference in settlement and growth of shipworms in fir and oak panels?
4. Can shell size be used to estimate the length of the shipworm and its cause
of wood loss and is there a relation between the length of the shipworm and
its average boring tube diameter?
Materials and methods
Study area
The port of Rotterdam is situated in the estuary of the rivers Rhine and Meuse
(Fig. 1A). It stretches over a length of 40 km and covers 10,500 hectares of
which 3440 hectares of the area is water of harbours and 1960 hectares rivers
and canals. Under average conditions, at a river Rhine discharge (Qbr) of 2200
m3
s-1
at the Dutch-German border, the complete salinity gradient from fresh to
seawater is found in this part of the estuary. This salinity gradient moves
downstream at ebb tide and upstream at floodtide. The hydrology of the area is
strongly controlled by means of the drainage regime of the Haringvliet sluices
(Fig. 1A), based on the discharge of the Rhine at the Dutch-German border. The
degree to which the sluice gates are opened at ebbtide increase with increasing
discharge of fresh water. To avoid salinisation upstream of Rotterdam an
amount of 1500 m3
s-1
of fresh water is directed to the port of Rotterdam area,
i.e. the Nieuwe Waterweg (1300 m3
s-1
) and the Hartelkanaal (200 m3
s-1
). This
flow of fresh water via the port of Rotterdam area can be maintained between a
Qbr of 1700 m3
s-1
and 4500 m3
s-1
. Below 1700 m3
s-1
the salinity gradient
moves land inward, while above 4500 m3
s-1
it moves seaward. At a Qbr of
approximately 1100 m3 s
-1 the Haringvliet sluices are closed completely and both
Meuse and Rhine water flows in the sea at Hoek van Holland. The isohalines of
the bottom water in the area under average and low river discharge (1000 m3 s
-1)
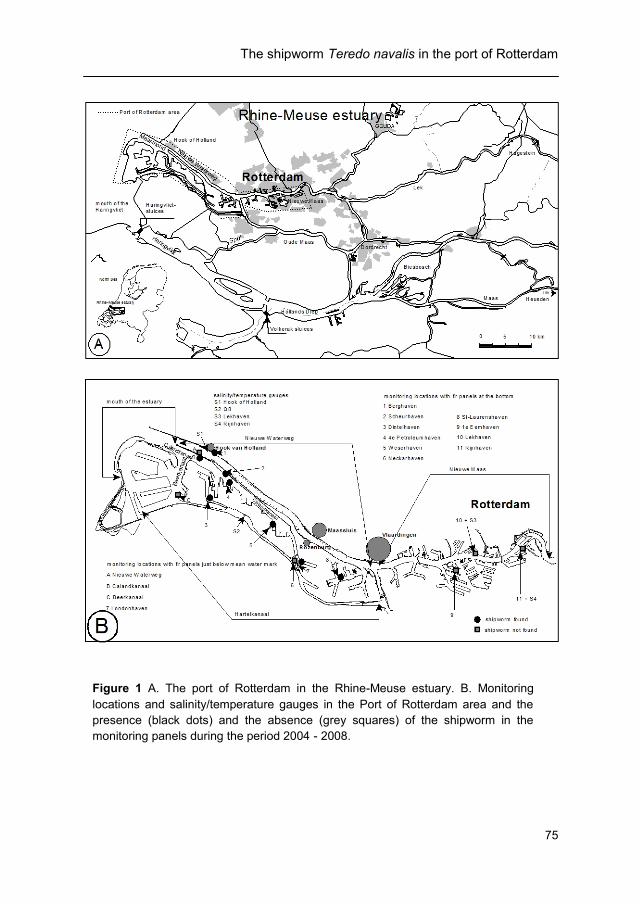
The shipworm Teredo navalis in the port of Rotterdam
75
Figure 1 A. The port of Rotterdam in the Rhine-Meuse estuary. B. Monitoring
locations and salinity/temperature gauges in the Port of Rotterdam area and the
presence (black dots) and the absence (grey squares) of the shipworm in the
monitoring panels during the period 2004 - 2008.
.

Chapter 3
76
were calculated by the model RIJNAMO of Rijkswaterstaat (Bol and Kraak,
1998) (Fig. 2A, 2B).
The Rhine-Meuse estuary is microtidal with an average tidal range of 1.75 m at
Hoek van Holland gradually decreases upstream till 1.10 m at Hagestein on the
Lek and 0.25 m at Heusden on the Meuse. At springtide the tidal cycle at Hoek
van Holland exhibits approximately a 4-h period of flood, a 4-h period of ebb and
a 4.5-h low-water period.
Salinity, oxygen and temperature measurements
Salinity and temperature were recorded every 10 min at four stations (Fig. 1B).
The water depth given is in metres related to NAP (Normaal Amsterdams Peil or
Amsterdam Ordnance Datum). NAP is a vertical datum in use in a large part of
Western Europe and is close to the mean sea level at the Dutch coast. In 2003
salinity depth files with 1-m intervals from surface to bottom (i.e., sea floor) were
obtained with a WTW-conductivity meter (Cond 3301) with a TetraCon®325
conductivity and temperature sensor.
To determine if oxygen was a limiting factor for the shipworm from October 2004
till November 2005 monthly samples of the bottom water at eight locations were
taken and the concentration was measured with a HQ20 Hach Portable LDOTM
dissolved oxygen/pH meter.
Sampling
The distribution of the shipworm by its settlement was investigated by placing fir
(monitoring) panels at the bottom or just below the mean water mark at different
locations (Fig. 1B) along the salinity gradient. The vertical panels measured 10 x
20 x 2 cm. Five locations were in use from 2004 to 2008, seven from 2004 to
2007 and six from 2005 to 2008. In 2006 the number of locations was extended
to 16, but at three locations the fir panels disappeared and were not used in the
analysis, leading to 13 locations from which information about the shipworm
could be obtained (Table 1).
The settlement season was studied by retrieving fir panels monthly in 2004 from
August to December and in 2005 from July to December. A set of oak panels of
10 x 20 x 2 cm was placed next to the fir panels in 2006 in the Scheurhaven to
compare settlement and growth in both types of wood (Table 1).
The settlement height in relation to the distance to the bottom (sea floor) was
studied in 2006 by placing a construction (Fig. 3) with fir panels with a distance
from the bottom of 0, 25, 50, 75 and 100 cm at the bottom of the Scheurhaven.
Panels were retrieved in July, October and December 2006. In 2007 this was
repeated at the same station but with four beams, with a length of 540 cm, a

The shipworm Teredo navalis in the port of Rotterdam
77

Chapter 3
78
Figure 2 A. The isohalines 5 and 10 at ebb and flood in the port of Rotterdam area
at an average discharge of the Rhine at the Dutch-German border (Qbr) of 2200
m3
s-1
. B. The isohalines 5 and 10 at ebb and flood in the Port of Rotterdam area at
a discharge of the Rhine at the Dutch-German border (Qbr) of 1000 m3 s
-1.
.

The shipworm Teredo navalis in the port of Rotterdam
79
width of 10 cm and a thickness of 5 cm, covering the water column and intertidal
zone. The beams were retrieved in January 2008 and sawed into pieces 20 cm
long.
Figure 3 The construction with the fir panels to study the settlement height (0, 25,
50, 75 and 100 cm) in relation to the distance to the bottom placed in the Scheur-
haven in 2006.
.

Chapter 3
80
Analysis
From the data of the measuring stations the daily minimum and maximum
salinity was taken for a yearly overview of the salinity fluctuations in relation to
the discharge of the river Rhine at the Dutch German border (Lobith; Bimmen).
The mean daily water temperature was calculated.
Shipworm individuals were identified to the species level using the key in
Hayward and Ryland (1995).
All panels and beam pieces were freed of fouling, placed in plastic bags, deep
frozen if necessary and digitally radio graphed by Applus RTD Benelux. On
screen the body length (length of the boreholes) and shell size was measured
for each individual shipworm. Also, for the years 2006, 2007 and 2008 the
average diameter of the boreholes was estimated, based on measurements of
the diameter at 0.25, 0.50 and 0.75 of the length in order to calculate the loss of
wood. Growth was calculated by comparing the average length of the shipworms
in October with those in December in 2006 and 2007.
Statistical analysis was carried out with the aid of the computer program SPSS
for Windows Release 11.0.0. The Levene’s test for equality of variance and the
independent t-test were applied for comparing the average length of the
shipworms in 2006 and 2007. To compare the average length of the shipworms
at the different monitoring locations and at different distances from the bottom
the Levene’s test for equality of variance and analysis of variance (One way
Anova) were conducted. For testing the relation of settlement of shipworms and
the distance to the bottom, the relation of body length and shell size, and the
relation of body length and average boring tube diameter the curve fit and
correlation coefficient were calculated and analysis of variance applied.
Results
Hydrography
The water temperature fluctuated between 3°C in winter and 25°C in summer in
the Lekhaven and between 4 and 22°C at Hoek van Holland during 2004-2008.
From April to November the water temperature was above 10°C, and it was
above 15°C from June until mid-October. In spring and summer the river water
temperature was higher than that of seawater, in autumn they were about the
same, while in winter seawater temperature was higher. Over the period 2004-
2008, out of 1814 days, for 1697 days the water temperature was high enough
for the shipworm to exhibit boring activity. Spawning could have taken place in
the period mid-April until mid-November.
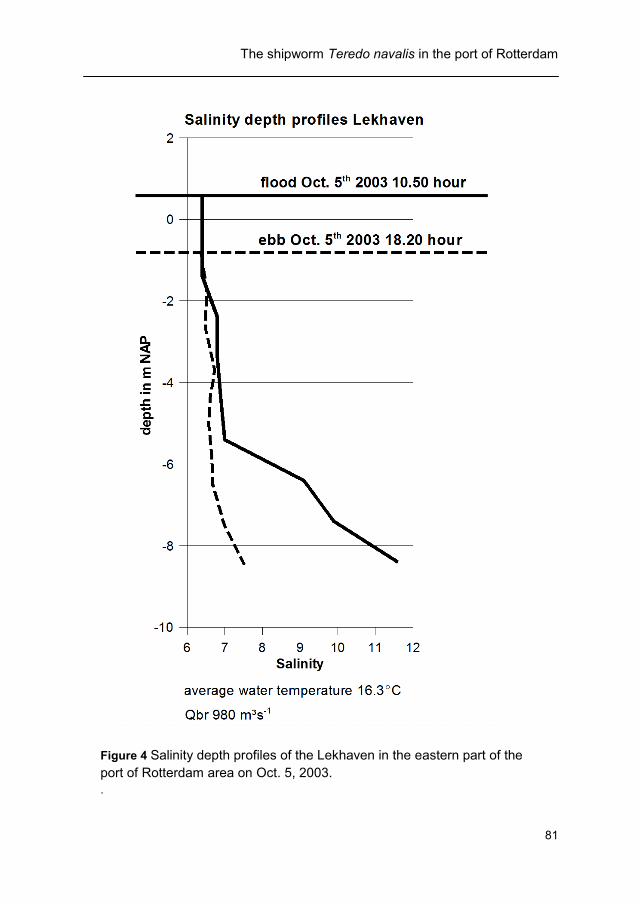
The shipworm Teredo navalis in the port of Rotterdam
81
Figure 4 Salinity depth profiles of the Lekhaven in the eastern part of the
port of Rotterdam area on Oct. 5, 2003.
.

Chapter 3
82

The shipworm Teredo navalis in the port of Rotterdam
83
On Aug. 10, 2003 the Qbr (discharge of the river Rhine at the Dutch-German
border) reached, approximately, the critical value of 1000 m3
s-1
, with the
consequence that in some eastern parts of the port of Rotterdam area the
salinity reached values of over 10 and this situation lasted until Oct. 7, a period
of almost two months.
Two salinity depth profiles were measured at flood and ebb on October 5, 2003
at a Qbr of 980 m3
s-1
in the Lekhaven. The profile taken at flood demonstrates
the stratification under conditions of high salt intrusion in this part of the port of
Rotterdam area (Fig. 4). At these low discharges the conditions become
favourable for the shipworm to settle.
In the period 2003-2008 in the eastern part of the port of Rotterdam area, salinity
changed at the bottom several times from fresh-oligohaline to meso-haline
conditions, but as the river discharge after 2003 until 2008 reached values below
1000 m3 s
-1 only for a few days, no suitable conditions for the shipworm occurred
for settlement and growth. Long periods of discharges below 1000 m3
s-1
occur
(Fig. 5). In the last decade, in 15 separate years, there were periods of 30 days
or longer then discharges below 1000 m3
s-1
were recorded during the breeding
season of the shipworm. The longest uninterrupted period with this critical
discharge was in 1949, which had a duration of 141 days, but before 1970 the
hydrology of the port of Rotterdam area differed greatly from the present
situation because of the absence of the Haringvliet sluices and weirs in the Lek
and Nederrijn.
In the western part of the port of Rotterdam area the waterways Hartelkanaal
and Nieuwe Waterweg and adjacent harbours exhibited strong daily changes in
salinity due to the tide and the river discharges. The large harbours Beer- en
Calandkanaal where polyhaline throughout 2003-2008.
Oxygen levels measured between October 2004 and October 2005 at the
monitoring locations were high and fluctuated between 80 and 120% saturation,
with a median value of 98%. On only one occasion was an oxygen saturation
level as low as 69% measured.
Distribution
The settlement of larvae as an indication of the distribution of the shipworm on
the monitoring panels varied from year to year (Table 2).
The shipworm settled in the fir panels in the Scheurhaven throughout the
monitoring period and in three individual years in those in the Berghaven. Only
in 2006 were shipworms found in panels at other locations that were monitored
from 2004 or 2005 until 2008, none of them, however, were in the eastern part of
the port of Rotterdam area. In 2006 shipworms were also encountered in the

Chapter 3
84
panels of the extra locations in the Calandkanaal, but not in those of the
Beerkanaal (Fig. 1B).
Wooden piles made of Basralokus (Dicorynia paraensis Bentham) pulled out the
polyhaline Calandkanaal contained many boreholes in the outer 5 cm.
Inspection of fir piles from the harbours of Maassluis, Vlaardingen and the centre
of Rotterdam did not show any damage caused by shipworms.
Examination of the shells of live animals in panels and beams and in empty
burrows of the piles and driftwood from the Calandkanaal, showed that only one
species, T. navalis, was involved.
Breeding season
Shipworms were never found in the panels before September. Small individuals
with a body length of less than 50 mm were encountered in the panels from
September to December, indicating a breeding season from August until the end
of November.
Settlement in relation to the distance to the bottom
In both 2006 and 2007 the settlement of the shipworm was significant negatively
correlated with the distance to the bottom (Fig. 6). Almost 75% of the shipworms
were found in the first 60-cm and 80-cm water layer above the bottom in 2006
and 2007, respectively. In 2007, above 120 cm from the bottom shipworms were
found only sporadically.
Table 2 Number of shipworms that settled on 6 fir panels at the different monitoring
locations in the Port of Rotterdam area during the period 2004 – 2008.
- = no shipworms found, blank = no panels at monitoring location.
.

The shipworm Teredo navalis in the port of Rotterdam
85
Growth and wood loss
The number of shipworms found in the panels during 2006 and 2007 allowed
calculation of body length frequency distribution, growth and caused wood loss.
The body length frequency (Fig. 7) as a percentage of the total number of
individuals in fir panels from the locations 2, 5, 7, 8 and B in the Calandkanaal
(Fig. 1B), the polyhaline region of the port of Rotterdam area, shows that the
majority of the individuals in 2006 belonged to higher body-length classes than
in 2007. The average body length of the shipworms at the end of the growing
season in 2006 (n=334, M=15.5 cm, SD=5.5 cm) was significantly greater
(t(427)=4.1, p<0.001) than the average body length of the shipworms at the end
of the growing season in 2007 (n=95, M=12.8 cm, SD=6.3 cm). The longest
individuals in 2006 and 2007 measured 36.9 cm and 28.8 cm, respectively
(Table 3).
Between Oct. 3 and Dec. 10, 2006, the average body length of the individuals
from the Calandkanaal increased by 10.5 cm, from 5 cm to 15.5 cm, a growth of
0.15 cm day
-1. If the individuals in the body-length classes 0–5 cm and 5–10 cm
are considered to have settled after Oct. 3, 2006, then the growth would have
been 0.18 cm day
-1.
Individuals found in the St-Laurenshaven, a harbour with strong fluctuations in
salinity, all belonged to the 0–5 cm body-length class on Oct. 3 and Dec. 10,
2006. Growth of these individuals between these two dates amounted to only
0.02 cm day
-1. Body lengths of the individuals on Dec. 10, 2006 at the bottom on
the locations 2, 4, 5, 7 en B in the Calandkanaal differed significantly (one-way
ANOVA, F(4,170)=5.3, p<0.001). Those of location 5 (Weserhaven) were
Figure 6 Settlement of shipworms in 2006 (left)(Y = 465X-0.48
, R2 = 0.96, p < 0.003)
and 2007 (right) (Y = 17028X-1.69
, R2 = 0.94, p < 0.001) in the Scheurhaven in
relation to the distance to the bottom (sea floor).
.

Chapter 3
86
significantly longer than those of the locations 7 (Londonhaven) and B
(Calandkanaal mouth). On the latter locations the panels felt dry during spring
tide. Significant differences in body length in shipworms between the locations 2
(Scheurhaven), 4 (fourth Petroleumhaven) and the locations 7 (Londonhaven)
and B (Calandkanaal mouth) were not seen.
In both 2006 and 2007 the body lengths of the individuals at the end of the
growing season at different distance from the bottom over approximately the first
metre differed significantly from one another (one-way ANOVA, F(4, 232)=3.5,
p<0.01 and F(4, 44)=2.8, p<0.05) (Table 3). The largest shipworms were found
closest to the bottom and around 1 m above the bottom. In both years a
quadratic trend could be demonstrated between the distance from the bottom
and the body lengths of the shipworms (one-way independent ANOVA, F(1,
232)=8.3, p<0.01 and F(1, 44)=5.3, p<0.05 for the years 2006 and 2007,
respectively).
The individuals found in the oak wood panels at the bottom of the Scheurhaven
(n=7, M=7.0 cm, SD=2.9 cm) on Dec. 10, 2006, were significantly shorter in
body length (t(43)=2.5, p<0.02), than those found in the fir panels at the bottom
of the Scheurhaven (n=40, M=11.6 cm, SD=4.8 cm) on the same date.
Figure 7 Body length frequency of the shipworms found in 2006 and 2007 in the fir
panels as a percentage of the number of individuals. Data from all monitoring
locations.
.

The shipworm Teredo navalis in the port of Rotterdam
87
Shell length and body length of 531 individuals were measured in 2006 and
2007. A clear positive logarithmic correlation (R2=0.78, p<0.0001) was found
between the body length and size of the shell (Fig. 8A). The largest shell
measured 10.8 mm. The boring tube changes from conical to cylindrical at a
body length between 50 and 100 mm.
In 2006 and 2007 almost the same logarithmic relationship between the body
length of the shipworms and the average tube diameter was found (Fig. 8B). In
both cases there was a significant positive correlation (R2=0.84, p<0.001 and
R2=0.76, p<0.001, respectively).
The wood loss by shipworms could be calculated by means of the average
diameter of the boring tubes (Table 3). In 2006 most of the wood was lost within
the panels on the bottom due to the higher shipworm infestation there than in the
other panels. Within a period of 3 to 4 months 12.4 % of the fir wood was lost
due to shipworm boring activity.
In 2007 the percentage wood loss was much lower, not only as a result of fewer
shipworms within the panels but also because the individuals were smaller than
in 2006 (Table 3). The amount of wood loss per individual shipworm in oak wood
was less than half of that in fir (Table 3).
Figure 8 A. Relation between the shipworm body length and its shell size (Y =
1.69lnX – 1.38, R2 = 0.78, p < 0.0001, N = 531), B. Relation between the shipworm
body length and the average boring tube diameter in 2006 and 2007 (Y = 1.38lnX -
1.02, R2 = 0.83, p < 0.001, N = 592). Data from all monitoring locations.
.

Chapter 3
88
Discussion
The water temperatures measured at the mouth of the estuary indicate that
during the monitoring period T. navalis could perform its boring activity almost
year round, although it was reduced during winter. Taking 12˚C as the lower limit
for reproduction, the spawning season could start in April/May and end at the
beginning of November, but as no individuals were found before September, it is
more likely that reproduction started in July/August based on settlement time.
The settlement of T. navalis in the port of Rotterdam area decreased with
increasing distance from the bottom (sea floor) in both test panels and test
beams; this was found also by Scheltema and Truitt (1956) in test panels in
Maryland coastal waters, U.S.A., and by Tuente et al. (2002), who counted bore
holes in oak piles and fir pier posts in the harbours of Bremerhaven in Germany.
This pattern of settling could be an advantage in estuaries where salinities are
usually higher and more stable near the bottom.
The shipworms in the port of Rotterdam grew rapidly in 2006 and 2007 and
achieved maximum body lengths of 38.9 cm and 29.0 cm, respectively. The
higher average body length in 2006 related to more wood lost is very likely the
result of the higher water temperatures in that year compared to 2007.
Kristensen (1979) observed a maximum body length growth of 0.7 mm day
-1 of
Table 3 Wood loss due to the shipworm activity in 2006 and 2007 and their length
in fir and oak panels and in fir beams (*) in the Scheurhaven. std = standard
deviation, med = median, min = minimum, max = maximum.
.

The shipworm Teredo navalis in the port of Rotterdam
89
first-year animals in Denmark. In the present study the average body length
growth in 2006 of 1.5 mm day-1
exceeded this more than twofold, and
considering a growth period of 130 days, the longest animal found should be the
result of an average body length growth rate of 3 mm day
-1.
A significant relationship between the shell size and body length of the shipworm
was found. The curve of the logarithmic formula supports the findings of Mann
and Gallagar (1985) that the shape of the boring tube is a truncated cone
progressing to a cylinder. The formula can be used to estimate the body length
of the animals and thus the wood consumption by measuring the shell size, but it
should only be used when densities are too high to measure individual tube
lengths.
Significantly less shipworm larvae settled on the oak panels and showed less
growth after metamorphoses than those that had settled on fir panels. This may
be related to the greater hardness of oak wood, which means that the animals
need to spent more energy boring into oak than into fir. Within specialized
epithelial cells of several members of the Teredinidae, associations of symbiotic
cellulolytic nitrogen-fixing bacteria were found within the gills (Distel et al., 1991,
2002, Sipe et al., 2000). Popham and Dickson (1973) demonstrated bacterial
associations in the gills of the shipworm T. navalis, indicating that this species
may be able to feed solely on wood. Mann and Gallager (1985) found no
significant growth enhancement in the presence of a phytoplankton supplement
(in addition to wood). However it is not unlikely that individuals that bore into
hardwood need to acquire extra nourishment by filtration for at least their basal
metabolism. This is also the case in highly infested wood when there is no more
space to bore into left.
In the port of Rotterdam T. navalis seems to have a vital population in the
Caland- and Beerkanaal from which larvae are transported by the tidal currents
via the Hartelkanaal and Nieuwe Waterweg where, as demonstrated for a few
locations, they can settle and survive for a short period of time. Taking into
account the high river discharges that occur with the low salinities they bring
about, it is not possible that a viable T. navalis population could be built up other
than in the polyhaline environment of the Caland- and Beerkanaal. The
presence of T. navalis in panels in the St-Laurenshaven showed the ability of the
larvae to travel upstream of at least 20 km.
Conclusions
The area of distribution in the port of Rotterdam of the shipworm T. navalis
encompasses the polyhaline harbours Beer- and Calandkanaal. Under
conditions of low river discharge the area of distribution can temporarily be

Chapter 3
90
extended to some 20 km upstream via the Nieuwe Waterweg. Based on the
water temperature in the period 2004-2008, the potential breeding season lies
between April and November. Based on the settlement on fir panels, a breeding
season between July and November is more likely for the port of Rotterdam
area.
Considering the water temperature in the period 2004-2008 the shipworm could
have performed its boring activity 94% of the time. This is almost year round.
The historical river discharge changes make it plausible that the shipworm could
settle for a short period of time in the eastern part of the port of Rotterdam area.
The settlement of the shipworm in the port of Rotterdam area showed a clear
negative correlation to its distance to the bottom.
Shipworms in the port of Rotterdam area grew with an average body-length
growth rate of 1.5 mm day
-1 in 2006 and caused a loss of 12.4% of the fir wood
of panels at the bottom of the Scheurhaven in a period of approximately 4
months. Significantly less shipworm larvae managed to settle in oak wood than
in fir wood. The growth of shipworm individuals in oak wood was significantly
lower than in fir wood.
Although there is a strong statistical relation between the shell size and the body
length of the shipworm, the shell size should only be used to calculate the length
of an individual if not exceeding 5 to 6 mm. At high densities measurement of
the shell sizes could be appropriate to calculate wood consumption in the first
season after settlement. There is a significant relation between the length of the
shipworm and its average boring tube diameter, but as the individuals grow
longer this relation becomes weaker.
Lower river discharges leading to salinisation of the eastern part of the port of
Rotterdam area create conditions favourable for the shipworm to settle and
grow, with consequences for the condition of the piles upon which the quays are
built.
Acknowledgements
This work was supported by the port of Rotterdam Authority.

The shipworm Teredo navalis in the port of Rotterdam
91
References
Bol, R., Kraak, A., 1998. MER Beheer Haringvlietsluizen. Over de grens van
zout en zoet. Deelrapport Water- en Zoutbeweging. ISBN: 903694871.
RWS, notanummer: apv 98/093. 212 pp.
Blum, H.F., 1922. On the effect of low salinity on Teredo navalis. University of
California, Publications in Zoology, 22: 348-368.
De Bruyne, R.H., 1994. Schelpen van de Nederlandse kust. Stichting
Jeugdbondsuitgeverij, Utrecht, 2e druk, 165 pp.
Distel, D.L., DeLong, E.F., Waterbury, J.B., 1991. Phylogenetic characterization
and in situ localization of the bacterial symbiont of shipworms (Teredinidae:
Bivalvia) by using 16S rRNA sequence analysis and oligodeoxynucleotide
probe hybridization. Applied and Environmental. Microbiology, 57: 2376-
2382.
Distel, D.L., Beaudoin, D.J., Morrill, W., 2002. Coexistence of multiple
proteobacterial endosymbionts in the gills of the wood-boring Lyrodus
pedicellatus (Bivalvia: Teredinidae). Applied and Environmental.
Microbiology, 68: 6292-6299.
Grave, B.H., 1942. The sexual cycle of the shipworm, Teredo navalis. Biological
Bulletin, 82: 438-445.
Hoagland, K.E., 1986. Effects of temperature, salinity, and substratum on larvae
of the shipworms Teredo bartschi Clapp and Teredo navalis Linnaeus
(Bivalvia: Teredinidae). American Malacological Bulletin, 4: 89–99.
Hayward, P.J., Ryland, J.S. (eds.), 1998. Handbook of the marine fauna of
North-West Europe. Oxford University Press: Oxford, UK. ISBN 0-19-
854055-8, 800 pp.
Kristensen, E.S., 1979. Observations on growth and life cycle of the shipworm
Teredo navalis L. (Bivalvia, Mollusca) in the Isefjord, Denmark. Ophelia, 18:
235-242.
Mann, R., Gallager, S.M., 1985. Growth, morphometry and biochemical
composition of the wood boring molluscs Teredo navalis L., Bankia gouldi
(Bartsch), and Nototeredo knoxi (Bartsch) (Bivalvia: Teredinidae). Journal
of Experimental Marine Biology and Ecology, 85: 229-251.
Nair, N.B., Saraswathy, M., 1971. The biology of wood-boring teredinid
molluscs. Advances in Marine Biology, 9: 335–509.
Popham, J.D., Dickson, M.R., 1973. Bacterial associations in the teredo Bankia
australis (Lamellibranchia: Mollusca). Marine Biology, 19: 338—340.
Scheltema, R.S., Truitt, R.V., 1956. The shipworm Teredo navalis in Maryland
coastal waters. Ecology, 37: 841-843.
Chapter 3
92
Sipe, A.R., Wilbur, A.E., Cary, S.C., 2000. Bacterial symbiont transmission in the
wood-boring shipworm Bankia setacea (Bivalvia: Teredinidae). Applied and
Environmental Microbiology, 66: 1685-1691.
Soldatova, I.N., 1961. Effect of various salinities on the bivalve mollusc Teredo
navalis L. (in Russian). Trudy Instituta Okeanologii, 49: 162-179.
Tuente, U, Piepenburg, D., Spindler, M., 2002. Occurrence and settlement of the
common shipworm Teredo navalis (Bivalvia: Teredinidae) in Bremerhaven
harbours, northern Germany. Helgoland Marine Research, 56: 87-94.
Van Benthem Jutting, T., 1943. Mollusca. C. Lamellibranchia.— Fauna van
Nederland, 12: 1-477.
Vrolik, W., Harting, P., Storm Buysing, D.J., Van Oordt, J.W.L., Von Baumhauer,
E.H., 1860. Verslag over den Paalworm, uitgegeven door de Natuurkundige
Afdeeling der Koninklijke Nederlandsche Akademie van Wetenschappen,
Amsterdam, 153 pp.


Chapter 4
What is the main food source of the
shipworm (Teredo navalis)? A stable
isotope approach
Peter Paalvast
Gerard van der Velde Journal of Sea Research 80 (2013) 58-60
Chapter 4
96
Abstract
Stable isotope analysis of soft bodies of the shipworm Teredo navalis
demonstrated that this species is mainly feeding on seston by filter feeding in
contrast to wood consumption. Teredo navalis showed similar stable isotope
values (δ13
C, δ15
N) as Mytilus edulis and Crassostrea gigas, which species were
attached to the wood instead of boring into.

Teredo navalis drilling in wood, for shelter or food?
97
Introduction
Boring behaviour protects bivalves against predation while they filter feed
consuming seston. Within boring bivalves belonging to the Pholadacea two
families are usually distinguished viz. Pholadidae (Angel Wings) which bore into
hardened peat, wood, soft chalkstone, corals (and even ABS pipes e.g. Jenner
et al., 2003) and Teredinidae (Shipworms) which are specialized to bore into
wood (Turner, 1966). It is an ongoing debate if some species of the Teredinidae
are able to feed on wood exclusively, or on symbiotic bacteria feeding on wood
or also feed on seston (suspended organic matter: plankton and detritus) as
additional or as main food source (e.g. Nair and Saraswathy, 1971, Pechenik et
al., 1979 and literature therein).
Within specialized epithelial cells of several members of the Teredinidae,
associations of symbiotic cellulolytic nitrogen fixing bacteria were found within
the gills (Distel et al., 1991, Distel et al., 2002, Sipe et al., 2000, Betcher et al.,
2012). Wood contains a very low level of nitrogen and has so a very high C/N
ratio (Distel, 2003) and therefore the atmospheric nitrogen usable for some
shipworm species fixed by endosymbionts (Lechene et al., 2007) may be the
main source.
One of the most common teredinid species is Teredo navalis. Popham and
Dickson (1973) demonstrated bacterial associations in the gills of T. navalis
indicating that this species may be able to feed solely on wood. Mann and
Gallager (1985) found no significant growth enhancement in the presence of a
phytoplankton supplement (in addition to wood), which could suggest wood as
the primary food resource. Paalvast and Van der Velde (2011) suggest that
individuals that bore into hardwood need to acquire extra nourishment by
filtration for at least their basal metabolism, and that this also accounts in highly
infested wood when there is no more wood left to bore into.
To find out what T. navalis is mainly consuming can nowadays be tested by
stable isotope analysis. Carbon isotope ratios (δ13
C) in animal tissues closely
resemble the food consumed over longer period of time, meaning you are
(almost) what you eat. The enrichment in δ13
C in the consumer compared with
its diet lies within 0 to 1‰ (DeNiro and Epstein, 1978, Rau et al., 1983, Fry et al.,
1984, Gu et al., 1996, Vander Zanden et al., 1997, Vander Zanden et al., 1999).
The nitrogen ratio (δ15
N) increases by 3.4 ± 1.1‰ with each trophic level through
the food web (DeNiro and Epstein, 1978, Minagawa and Wada, 1984, Wada et
al., 1987). δ13
C values indicate the carbon sources, while δ15
N values indicate
trophic position.
We hypothized that, when T. navalis feeds mainly on wood as a carbon source
the δ13
C values of the shipworm would resemble the δ13
C values of the wood in

Chapter 4
98
which they bore into. When T. navalis feeds on seston by filter feeding, than the
δ13
C values of the shipworm resemble the δ13
C values of other bivalve filter
feeders at the same location. We further hypothesized in the case of filter
feeding on seston the δ15
N values of the shipworm are expected to be at least
3.4 ± 1.1‰ higher than the δ15
N of wood and should be similar to the δ15
N
values of other bivalve filter feeders at the same location.
Material and methods
To test the above hypotheses the carbon and nitrogen stable isotope
composition of the body tissue of the bivalves T. navalis (shipworm), Mytilus
edulis (Blue mussel) and Crassostrea gigas (Pacific oyster) and the fir wood
(Picea abies) where they lived in or on wood, was analysed.
The shipworms, blue mussels and Pacific oysters were all collected from the last
metre near the sea floor of 8 metre long fir beam that was attached to a mooring
pole from 3 metres above the mean low water level (MLWL) till the bottom of the
sea floor 5 m below MLWL in the polyhaline Scheurhaven of the port of
Rotterdam, the Netherlands (51º 57' 43.33" N, 4º 8' 16.41" E). The fir beam was
attached to the mooring pole in April 2009 and removed in April 2012. The last
metre of the pole was cut off and transported to the laboratory of the Radboud
University Nijmegen. Mussels and oysters that grew on the beam were removed,
shipworms were retrieved by cutting and splitting the beam with an axe and
samples of the wood were taken for stable isotope analysis.
In the laboratory, bivalves were rinsed first in tap water and then in distilled
water. The soft bodies of 6-8 individuals were pooled for each sample and oven
dried at 60 °C for 3-5 days. Shells of molluscs and pallets in the case of the
shipworm were removed and the remaining body tissue dried for 48 h at 60oC,
after which specimens were ground to a fine powder using a pestle and mortar
and liquid nitrogen. Measurements were carried out for each individual using
their powder stored in small new glass bottles with a plastic cap until weighing.
Carbon and nitrogen stable isotopic compositions were measured with a Carlo
Erba NA 1500 elemental analyzer coupled online via a Finnigan Conflo III
interface with a ThermoFinnigan DeltaPlus mass spectrometer. Carbon and
nitrogen isotope ratios are expressed in the standard delta notation (δ13
C, δ15
N)
relative to Vienna PDB and atmospheric nitrogen. Average reproducibility based
on replicate measurements of internal standards Sucrose (IAEA-CH-6) for δ13
C
and Ammonium sulphate (IAEA-N-2) for δ15
N was ca. 0.15‰. Acetanilide was
used as the laboratory reference.

Teredo navalis drilling in wood, for shelter or food?
99
Statistical analysis was carried out with SPSS 15.0 for Windows. Anova together
with the Levene’s test for equality of variance was conducted to compare the
means of δ13
C and δ15
N of the species involved.
Results
As fir wood contains very little nitrogen this led to overflow of 5 of the 9 samples
during the stable isotope analyses for this element, but this was not the case for
carbon. All other samples did not show any overflow.
There was a significant difference in the means of δ13
C values between the
species (one-way ANOVA, F(3,52)= 31.1, p< 0.001) (Fig. 1). Wood (N = 9, M
(δ13
C) = -26.41 ‰, SE = 0.023) compared with the bivalves had a significant
(Tamhane at the 0.05 level) lower δ13
C value ranging from -1.8‰ for the Pacific
oyster (N = 8, M (δ13
C) = -24.58 ‰, SE = 0.213), -3.0‰ for the Blue mussel (N =
23, M (δ13
C) = -23.46 ‰, SE = 0.181) to -3.3‰ for the shipworm (N = 16, M
(δ13
C) = -23.13 ‰, SE = 0.302). Furthermore the Pacific oyster’s δ13
C was
significantly lower (Tamhane at the 0.05 level) than those of shipworm and Blue
mussel.
Figure 1 Stable isotope values for the shipworm (Teredo navalis), Blue mussel (Mytilus
edulis), Pacific oyster (Crassostrea gigas) and wood (Picea abies).
.

Chapter 4
100
There was also a significant difference in the means of δ15
N values between the
species (one-way ANOVA, F(3,47)= 170.6, p< 0.001) (Fig. 1). Wood (N = 4, M
(δ15
N) = -0.86 ‰, SE = 0.538) compared with the bivalves had a significant
(Tamhane at the 0.05 level) lower δ15
N value ranging from -8.2‰ for the
shipworm(N = 16, M (δ15
N) = 7.38 ‰, SE = 0.251), -9.0‰ for the Pacific
oyster(N = 8, M (δ15
N) = 8.14, SE = 0.120) to -9.3‰ for the Blue mussel (N = 23,
M (δ15
N) = 8.48 ‰, SE = 0.130). Between the bivalves there was only a
significant difference between the mean δ15
N values of the shipworm and the
Blue mussel.
Discussion
Several species of shipworms including Teredo navalis seem to be able to grow
in the absence of food (apart from wood) as demonstrated under laboratory
conditions (Gallager et al., 1981, Man and Gallager, 1985). The presence of
phytoplankton supplement enhanced growth in the shipworm, Bankia gouldi, but
was progressively less significant in the shipworms T. navalis and Lyrodus
pedicellatus (Man and Gallager, 1985). Becker (1959, in Nair and Sarawathy)
managed to rear L. pedicellatus through four generations in artificial sea water
without any additional food. He was unsuccessful with T. navalis that failed to
breed probably on account of inadequate nutrition, owing to the absence of
protein rich plankton. Mann and Gallager (1985) observed well developed
gonads with sperm and ova present for Bankia gouldi in the absence of
planktonic food but did not mention this for T. navalis as gonad development
was not part of their study. Turner (1966) suggested that the adults of some
species require planktonic food during the breeding period, while others may be
capable of surviving on plankton only as do many other bivalves.
The δ13
C values of the shipworm T. navalis were on average 3.3‰ higher than
that of the wood it lived in. This is far above the range of 0 to 1‰ if wood would
have been the main source of carbon. The shipworm’s δ13
C values closely
resembled the δ13
C values of the Blue mussel and were higher than the δ13
C
values of the Pacific oyster. This means that not the wood it bores into but food
obtained by filter feeding via the siphons was the main source of carbon, despite
the presence of possible symbiotic cellulolytic nitrogen fixing bacteria in the gills
of this species of shipworm. It further indicates that under natural conditions
drilling in wood by the shipworm, T. navalis, is more important for shelter than
nutrition.
The positive difference between the δ15
N of the bivalves compared with the δ15
N
of wood was more than twice the 3.4 ± 1.1‰ value for each consecutive trophic
level through the food web (DeNiro and Epstein, 1978, Minagawa and Wada,

Teredo navalis drilling in wood, for shelter or food?
101
1984, Wada et al., 1987), further the δ15
N of the shipworm was very close to the
δ15
N of the Blue mussel and Pacific oyster. This excludes wood as the main
source for nitrogen, and that food must have been acquired by filter feeding of
seston. It would be very illogical that food present in the inhaled water would not
be utilized as a carbon and nitrogen source.
This means that under natural conditions symbiosis between shipworm, T.
navalis, and endosymbionts is not a case of mutualism but rather of
commensalism from the latter.
Acknowledgements
We thank Marij Orbons for preparing the samples and Jelle Eygensteyn for
measuring the stable isotopes.
References
Becker, G., 1959. Biological investigations on marine borers in Berlin-Dahlem. In
Marine boring and fouling organisms. Ray, D.J. (ed.). University of
Washington Press, Seattle, 62-76.
Betcher, M.A., Fung, J.M., Han, A.W., O’Connor, R., Seronay, R., Concepcion,
G.P., Distel, D.L., Haygood, M.G., 2012. Microbial distribution and
abundance in the digestive system of five Shipworm species (Bivalvia:
Teredinidae). PLoS ONE, 7(9): e45309. doi:10.1371/journal.pone.0045309
DeNiro, M.J., Epstein, S., 1978. Influence of diet on the distribution of nitrogen
isotopes in animals. Geochimica et Cosmochimica Acta, 42: 495-506.
Distel, D.L., DeLong, E. F., Waterbury, J.B., 1991. Phylogenetic characterization
and in situ localization of the bacterial symbiont of shipworms (Teredinidae:
Bivalvia) by using 16S rRNA sequence analysis and oligodeoxynucleotide
probe hybridization. Applied Environmental Microbiology, 57: 2376-2382.
Distel, D.L., Beaudoin, D.J., Morrill, W., 2002. Coexistence of multiple
proteobacterial endosymbionts in the gills of the wood-boring Lyrodus
pedicellatus (Bivalvia: Teredinidae). Applied Environmental Microbiology,
68: 6292-6299.
Distel, D.L., 2003. The biology of marine wood boring bivalves and their bacterial
endosymbionts. In: Wood deterioration and preservation: Advances in our
changing world. Goodell, B., Nicholas, D.D., Schulz T. (eds.). American
Chemical Society, 253-271
Fry, B., Anderson, R.K., Entzeroth, L., Bird, J.L., Parker, Ρ.L., 1984. 13
C
enrichment and oceanic food web structure in the northwestern Gulf of
Mexico. Contributions to Marine Science, 27: 49–63.

Chapter 4
102
Gallager, S., Turner, R., Berg, C., 1981. Physiological aspects of wood
consumption, growth, and reproduction in the shipworm Lyrodus
pedicellatus Quatrefages (Bivalvia: Teredinidae). Journal of Experimental
Marine Biology and Ecology, 52: 63–77.
Gu, B., Schelske, C.L., Hoyer, M.V., 1996. Stable isotopes of carbon and
nitrogen as indicators of diet and trophic structure of the fish community in a
shallow hypereutrophic lake. Journal of Fish Biology, 49: 1233-1243.
Jenner, H.A., Rajagopal, S., Van der Velde, G., Daud, M.S., 2003. Perforation of
ABS pipes by boring bivalve Martesia striata: a case study. International
Biodeterioration and Biodegradation, 52: 229-232.
Lechene, C., Luyten, Y., Mcmahon, G., Distel, D., 2007 Quantitative imaging of
nitrogen fixation by individual bacteria within animal cells. Science, 317:
1563–1566. doi: PMID: 17872448.
Mann, R., Gallager, S.M., 1985. Growth, morphometry and biochemical
composition of the wood boring molluscs Teredo navalis L., Bankia gouldi
(Bartsch), and Nototeredo knoxi (Bartsch) (Bivalvia: Teredinidae). Journal
of Experimental Marine Biology and Ecology, 85: 229-251.
Minagawa, Μ., Wada, Ε., 1984. Stepwise enrichment of 15
N along food chains:
further evidence and the relation between δ15
N and animal age.
Geochimica et Cosmochimica Acta, 48: 1135–1140.
Nair, N.B., Saraswathy, M., 1971. The biology of wood-boring teredinid
molluscs. Advances in Marine Biology, 9: 335–509.
Paalvast, P., Van der Velde, G., 2011. Distribution, settlement and growth of first
year individuals of the shipworm Teredo navalis L. (Bivalvia: Teredinidae) in
the Port of Rotterdam area, the Netherlands. International Biodeterioration
and Biodegradation, 65: 379-388.
Pechenik, J.A., Perron, F.E., Turner, R.D., 1979. The role of phytoplankton in
the diets of adult and larval shipworms, Lyrodus pedicellatus (Bivalvia:
Teredinidae). Estuaries, 2: 58-60.
Popham, J.D., Dickson, M.R., 1973. Bacterial associations in the teredo Bankia
australis (Lamellibranchia: Mollusca). Marine Biology, 19: 338-340.
Rau, G.H., Mearns, A.J., Young, D.R., Olson, R.J., Schäfer, Η.A., Kaplan, I.R.,
1983. Animal 13
C/12
C correlates with trophic level in pelagic food webs.
Ecology, 64: 1314–1318.
Sipe, A.R., Wilbur, A. E., Cary, S.C., 2000. Bacterial symbiont transmission in
the wood-boring shipworm Bankia setacea (Bivalvia: Teredinidae). Applied
Environmental Microbiology, 66: 1685-1691.
Turner, R.D., 1966. A survey and illustrated catalogue of the Teredinidae
(Mollusca: Bivalvia). Cambridge, Massachusetts: The Museum of
Comparative Zoology, Harvard University.

Teredo navalis drilling in wood, for shelter or food?
103
Vander Zanden, M.J., Cabana, G., Rasmussen, J.B., 1997. Comparing trophic
position of freshwater fish calculated using stable nitrogen isotope ratios
(δ15
N) and literature dietary data. Canadian Journal of Fisheries and
Aquatic Sciences, 54: 1142-1158.
Vander Zanden, M.J., Rasmussen, J.B., 1999. Primary consumer δ13
C and δ15
N
and the trophic position of aquatic consumers. Ecology, 80: 1395-1404.
Wada, E., Terazaki, M., Kabaya, Υ., Nemoto, Τ., 1987. 15
N and 13
C abundances
in the Antarctic Ocean with emphasis on the biogeochemical structure of
the food web. Deep-Sea Research, 34: 829-841
Wada, A., Hattori, A., 1991. Nitrogen in the sea: Forms, Abundances and Rate
Processes. Florida, CRC Press.


105
Chapter 5
New threats of an old enemy: The
distribution of the shipworm Teredo
navalis L. (Bivalvia: Teredinidae) related
to climate change in the port of
Rotterdam area, the Netherlands
Peter Paalvast
Gerard van der Velde
Marine Pollution Bulletin 62 (2011) 1822–1829

Chapter 5
106
Abstract
The effects of four climate change scenarios for the Netherlands on the
distribution of the shipworm upstream the Rhine-Meuse estuary are described.
Global warming will cause dry and warmer summers and decreased river
discharges. This will extend the salinity gradient upstream in summer and fall
and may lead to attacks on wooden structures by the shipworm. Scenarios with
a one and two degree temperature increases by 2050 compared to 1990 with a
weak change in air circulation above Europe will lead to an increased chance of
shipworm damage upstream from once in 36 years to once in 27 and 22 years,
respectively, however with a strong change in air circulation, the chance of
shipworm damage increases to once in 6 and 3 years, respectively. The
upstream expansion of the distribution of the shipworm stream upwards will also
be manifest in other Northwest European estuaries and will even be stronger in
Southern Europe.

Climate change; New threats of a old enemy Teredo navalis
107
Introduction
Shipworms (Teredinidae) are wood-boring marine bivalves. The shipworm
Teredo navalis L. appeared in 1730 in the coastal waters of the Netherlands and
was described by Sellius (1733) as Teredo marina. Its origin is unknown, and
the species is therefore described as cryptogenic by Hoppe (2002). In the
successive years of 1731 and 1732, massive destruction of the wooden
constructions that protected the dikes in Zealand and Westfrisland occurred
(Vrolik et al., 1860). Authorities attempted to use tropical hardwoods and arsenic
and to cover the wooden dike gates with iron plates and nails, but the only (very
expensive) solution was changing the mode of dike construction. This began as
soon as 1733 by defending the dikes with imported stones, and over the
centuries, this has led to the ‘‘petrification’’ of large parts of the Dutch coastline.
Later outbreaks of the species took place in the Netherlands in 1770, 1827,
1858 and 1859. Not only were sluices and dolphins in harbours upstream of the
Rhine–Meuse estuary found to be infected in 1826, but quays also collapsed.
Low river discharges resulting in increased salinity had created favorable
conditions for the shipworm. The shipworm is still commonly found in Dutch
coastal waters and enclosed salt water bodies in the Dutch Delta Area (Van
Benthem Jutting, 1943, De Bruyne, 1994).
If shipworms encounter optimal abiotic conditions, they are able to destroy fir
piles 15 cm in diameter in six weeks (Snow, 1917), and even 10 m long, 25 cm
thick oak pilings can be turned into rubble in 7 months (Cobb, 2002). In 1995,
shipworm damage in the US was estimated to cost approximately US$ 200
million per year (Cohen and Carlton, 1995). Over the centuries, many attempts
to protect wood structures from shipworm attacks have more or less failed. They
have used copper and lead plating, nails with large flat heads (Teredo-nails),
paraffin, tar, asphalt, and paints. The most effective deterrent, creosote, has
been banned in many countries because of its toxic and carcinogenic properties
(Snow, 1917, Hoppe, 2002). Chemical impregnation with chrome copper
arsenate (CCA) or borax (CKB) is widely used as a wood preservative and is
effective, although this practice remains controversial among environmentalists
(Hoppe, 2002).
The adult shipworm tolerates salinity conditions between 5 and 35 (Nair and
Sarawathy, 1971) and thrives and reproduces at salinities of 9 and higher
(Kristensen, 1969, Soldatova, 1961 in Tuente et al., 2002). Boring activity stops
below a salinity of 9–10. Pelagic shipworm larvae survive at salinities as low as
6, and below that salinity level, pediveligers die within a few days (Hoagland,
1986). It was observed in Germany that a low salinity of 9 prevented the
establishment of shipworm larvae (Hoppe, 2002). At water current velocities
Chapter 5
108
exceeding 0.8 m1
s-1
, shipworm larvae can no longer attach to wood (Quayle,
1992). The optimal water temperatures for growth and reproduction range
between 15 and 25˚C. Spawning is initiated when the temperature rises above
11 to 12˚C. These animals may breed from May until October (Grave, 1928).
First year animals may reach sexual maturity in six weeks (Lane, 1959).
Temperatures up to 30˚C are tolerated. Boring activity decreases below 10˚C
and stops at 5˚C (Roch, 1932, Norman, 1977). At temperatures near the
freezing point, shipworms hibernate until the water temperature becomes
favourable again.
The complete salinity gradient of the Rhine-Meuse estuary is present in the port
of Rotterdam area, and a vital shipworm population exists in the large polyhaline
harbours in the western region (Beerkanaal and Calandkanaal). T. navalis
settlement in the port of Rotterdam area decreases with increasing distance
from the sea floor in both test panels and beams (Paalvast and Van der Velde,
2011). This was also found by Scheltema and Truitt (1956) in test panels in
coastal waters of Maryland in the US and by Tuente et al. (2002) in the harbours
of Bremerhaven in Germany.
The situation in the Rotterdam port area, which is one of the largest ports in the
world, can be used as a typical example of the estuaries of all large temperate
rivers in western Europe. Various climate models (Van den Hurk et al., 2006,
2007, Boé et al., 2009, Diaz-Nieto and Wilby, 2005) used to predict the effects of
global warming on the hydrology of these large rivers show, on average, a
serious decrease in precipitation during summer and fall, leading to lower river
discharges. Combined with an expected sea level rise, this will lead to an
increasing salinity over large parts of the estuarine gradient (Beijk, 2008).
Therefore the following research question was formulated: What is the risk of
shipworm damage (i.e. expansion of its distribution upstream) under present
climate conditions and under climate change due to global warming?
Materials and methods
Study area
The port of Rotterdam is situated in the estuary of the Rhine and Meuse (Fig. 1).
It stretches over a length of 40 kilometres and covers 10,500 hectares, 3,440
hectares of which are covered by harbour waters and 1,960 hectares, by rivers
and canals. Under average conditions, with a Rhine river discharge at the Dutch-
German border (Qbr) of 2200 m3
s-1
, the complete salinity gradient from fresh to
seawater is found in this part of the estuary. This salinity gradient moves
downstream at ebb tide and upstream at floodtide. The hydrology of the area is
strongly controlled by means of the drainage program for the Haringvliet sluices

Climate change; New threats of a old enemy Teredo navalis
109
(Fig. 1), based on the discharge of the Rhine at the Dutch-German border (Qbr).
The degree to which the sluice gates are opened at ebb tide increases with
increasing discharge of fresh water. To avoid salinisation upstream of
Rotterdam, 1500 m3
s-1
of fresh water is directed to the port of Rotterdam area,
i.e., the Nieuwe Waterweg (1300 m3
s-1
) and the Hartelkanaal (200 m3
s-1
). This
flow of fresh water via the port of Rotterdam area can be maintained between a
Qbr of 1700 m3 s
-1 and 4500 m
3 s
-1. Below 1700 m
3 s
-1, the salinity gradient shifts
landwards, while above 4500 m3 s
-1 it moves seaward. At a Qbr of approximately
1100 m3
s-1
, the Haringvliet sluices are closed completely, and both Meuse and
Rhine waters flow into the sea at Hoek van Holland. The isohalines of the
bottom water in the area under average and low river discharges (1000 m3
s-1
)
were calculated using the RIJMAMO model of Rijkswaterstaat (Bol and Kraak,
1998) (Fig. 2A; 2B).
Figure 1 The port of Rotterdam in the Rhine-Meuse estuary.
.

Chapter 5
110
Figure 2 (A) The 5 and 10 isohalines during ebb and flood periods in the port of
Rotterdam area under an average discharge of the Rhine at the Dutch-German
border (Qbr) of 2200 m3
s-1
. (B). The 5 and 10 isohalines during ebb and flood
periods in the port of Rotterdam area under a discharge of the Rhine at the Dutch-
German border (Qbr) of 1000 m3
s-1
.
.

Climate change; New threats of a old enemy Teredo navalis
111
The Rhine-Meuse estuary is microtidal, with an average tidal range of 1.75 m at
Hoek van Holland, which gradually decreases upstream to 1.10 m at Hagestein
on the Lek and 0.25 m at Heusden on the Meuse. At springtide, the tidal cycle at
Hoek van Holland exhibits approximately a 4 h flood period, a 4 h ebb period of
ebb and a 4.5 h low-water period.
Under conditions of average river discharge, the water above the sea floor of the
harbours of the Nieuwe Maas (Fig. 2A) in the eastern region is fresh to
oligohaline, but at discharges below 1000 m3
s-1
, the area becomes α-meso-
haline, with salinities over 10. When the discharge of the river Rhine remains
below 1000 m3
s-1
for a few weeks during the shipworm breeding season,
conditions might become favorable for this bivalve (Paalvast and Van der Velde,
2011). Larvae transported with the tidal currents to the eastern part of the port of
Rotterdam area could settle and grow in the wooden oak and pine poles on
which several old quays are build, in particular in harbours where the current
velocity is considerably reduced. Salinity depth profiles show a sharp increase in
salinity one to two metres above the sea floor at low river discharge (< 1000
m3
s-1
), which makes this water layer suitable for settlement and growth of the
shipworm. In the summer of 2003, the discharge of the river Rhine dropped to a
level below 1000 m3
s-1
, and the salinity in the eastern part of the port of
Rotterdam area rose to levels above 10 (Paalvast and Van der Velde, 2011).
Risk analysis
SIMONA is the hydraulics information system for the Ministry of Transport
(Ministry of Transport, Public Works and Water Management, 2008), consisting
of a collection of mathematical simulation models that describes hydrodynamic
processes. It includes four models for the simulation of hydrodynamic
phenomena, such as simulations of tides, the transport of solutes in water, and
water movement and it is designed as a layered system which makes use of
uniform data storage. The port of Rotterdam Authority uses SIMONA for
forecasting hydrodynamics 36 hours in advance twice a day.
Using the SIMONA modelling system with the (critical) river discharge (crit-Qbr)
under the prevailing climate conditions in the eastern part of the port of
Rotterdam as far upstream as the Rijnhaven (Fig. 2A), the salinity at one to two
metres above the sea floor reaching a permanent level (9 or higher)
corresponding to necessary conditions for the shipworm to settle and to grow,
was computed (Fig. 3).

Chapter 5
112
Van den Hurk et al. (2006) of the Royal Netherlands Meteorological Institute
have elaborated climate change scenarios for the Netherlands known as the
KNMI’06 scenarios (Fig. 4). Two anticipated circulation regime changes are
included in the scenarios: a strong circulation change, which induces warmer
and moister winter seasons and increases the likelihood of dry, warm summer
situations, and a weak circulation change. Both regimes are presented for the
+1°C and +2°C global temperature increases for 2050 compared to 1990,
producing a total of four scenarios. In the G scenarios the maximum mean sea
level rise is 25 cm and in the W scenarios 35 cm.
Rhineflow (Van Deursen, 1995, 2003) is a spatially distributed water balance
model of the Rhine basin that can simulate river flows, soil moisture, snow pack
and groundwater storage with a 10 days time step. In order of the Ministry of
Transport, Carthago Consultancy, Rotterdam, simulated the effects of these
climate scenarios using this model in terms of percentage change (Fig. 5) in the
daily river discharge (Van Deursen, 2006). This relative change in the discharge
under each scenario was applied to measurements of the average daily
Figure 3. Example of the output of the SIMONA hydraulics knowledge system at a
Qbr of 700 m3
s-1
for the salinity at the sea floor of the Waalhaven in the eastern
part of the port of Rotterdam area.

Climate change; New threats of a old enemy Teredo navalis
113
discharge at the Dutch-German border (Qbr) over the period 1901-2008 to
simulate the discharge under these scenarios. The crit-Qbr for the KNMI’06
scenarios in relation to sea level rise was elaborated.
A period of 14 days of crit-Qbr was considered as the minimum for shipworm
settlement and boring to cause damage, and a period of 42 days was
considered for the shipworms to complete their life cycle (Richards et al., 1984).
By counting the number of days per year on which the discharge over the period
1901-2008 and the simulated discharges over the same period for each of the
KNMI’06 scenarios reached the crit-Qbr or lower, the number of periods of 14
days or longer and their repetition time (risk of damage) were calculated. The
length of the periods was used to determine whether the shipworm could
complete its life cycle in the eastern part of the port of Rotterdam under the
KNMI’06 scenarios.
Figure 4. Schematic overview of the four KNMI’06 scenarios (after Van den Hurk,
et al., 2006).

Chapter 5
114
Results
Risk of damage under the present conditions
Using the SIMONA modelling system it was calculated that for the port of
Rotterdam area, a discharge of 700 m3
s-1
or less (crit-Qbr) of the Rhine river at
the Dutch-German border under the prevailing climate conditions would lead,
within a week to salinities of the bottom water in the harbours of the Nieuwe
Maas in the eastern part of the port of Rotterdam upstream to the Rijnhaven
(Fig. 2A) appropriate for settlement and growth of the shipworm (and thus
expansion of its distribution upstream). From 1901 to 2008, the crit-Qbr was
reached for a period of two weeks or longer in only three years (Table 1, Fig. 6),
which indicates a repetition time of 36 years, or that the risk of damage is once
in 36 years. The longest uninterrupted period lasted 34 days, which is too short
for the shipworm to complete its life cycle.
Figure 5. Simulated relative change in the discharge of the Rhine river as a
consequence of the KNMI’06 scenarios (after Van Deursen, 2006).

Climate change; New threats of a old enemy Teredo navalis
115
Risk of damage due to climate change
With the sea level rise under the KNMI’06 scenarios for 2050, the required
salinity conditions for the settlement and growth of the shipworm in the eastern
part of the port of Rotterdam upstream to the Rijnhaven (and, thus, expansion of
its distribution upstream) will occur at a discharge of approximately 800 m3
s-1
or
lower (crit-Qbr).
Under the scenarios G and W, with a weak change in air circulation patterns,
there is only a slight decrease in river discharge in summer and fall (Fig. 5), and
thus the increase in number of days with a crit-Qbr is small compared with the
number of days with a crit-Qbr observed over the period 1901-2008 (Fig. 6- 8).
For the G and W scenarios, the crit-Qbr is reached for 14 days or longer in only
5 and 4 years, respectively, resulting in a risk of damage once in 22 and 27
years (Table 1). Under both scenarios, the shipworm is able to complete its life
cycle in 1 and 2 years over a period of 108 years for G and W, respectively.
Under a future climate with a strong change in air circulation patterns, scenario
G+ leads to many days and to several periods of 14 days or longer associated
with a crit-Qbr in summer and fall (Table 1, Fig. 7 and 8) and a considerable risk
of damage once in 6 years. In 50% of these periods, the shipworm is able to
complete its life cycle between one to three times in a year. In three periods the
crit-Qbr reaches values less than 600 m3 s
-1 for several days.
Table 1. Number of years with periods of 14 days or longer with a crit-Qbr or lower
and years with a Qbr < 600 m3
s-1
with a risk of shipworm damage under the present climate conditions (1990) and the KNMI’06 scenarios for 2050, the length of the periods, their repetition time and the number of periods > 42 days for the shipworm to complete its life cycle.

Chapter 5
116
Under a future climate with a strong change in air circulation patterns, scenario
W+, will bring a period of 14 days or longer with crit-Qbr almost once in
approximately 2 years, and once in 4 years, the shipworm could complete its life
cycle from one to three times in a year.
Under the G+ and W+ scenarios, there is no significant difference in the lengths
of periods of potential shipworm damage (t(64)=-0.37, p>0.7).
Discussion
The increased risk of the expansion of the shipworm towards the eastern part of
the port of Rotterdam as far as the Rijnhaven depends greatly on a temperature
increase with changed air circulation patterns. However, under the present
situation, at discharges below 1000 m3
s-1
, there is a salinisation above the sea
floor in the most downstream part of the eastern portion of the port of Rotterdam
that creates conditions for the shipworm to settle and grow. Paalvast and Van
der Velde (2011) demonstrated that with the flood stream, shipworm larvae
Figure 6. Periods of discharges of the river Rhine at the Dutch-German border of
≤ 700 m3
s-1
during the period 1901- 2008 and their occurrence in the breeding and
growing season of the shipworm.

Climate change; New threats of a old enemy Teredo navalis
117
could travel 20 km stream upwards to 0.5 km before the confluence of the
Nieuwe Maas and Oude Maas during a period in which the discharge of the
Rhine was slightly higher than 1000 m3
s-1
. Under the G and W scenarios the
probability of shipworm attacks in the eastern part of the port of Rotterdam
increases slightly compared with the present situation, but the periods with
critical discharges are becoming much longer, so the eventual damage to
wooden constructions will also increase.
Under the G+ and W+ scenarios, the probability of the risk of shipworm attacks
and damage of underwater fir and oak harbour structures in the eastern part of
the port of Rotterdam greatly increases, not only due to a decrease in repetition
time, but also because the periods with a crit-Qbr or lower persist over 2 months
on average, which is long enough for the shipworm to reach maturity and to
reproduce.
Figure 7. Simulated periods of discharges of the Rhine river at the Dutch-German
border of ≤ 800 m3
s-1
during the period 1901- 2008 and their occurrence in the
breeding and growing season of the shipworm as a consequence of the KNMI’06
scenarios.
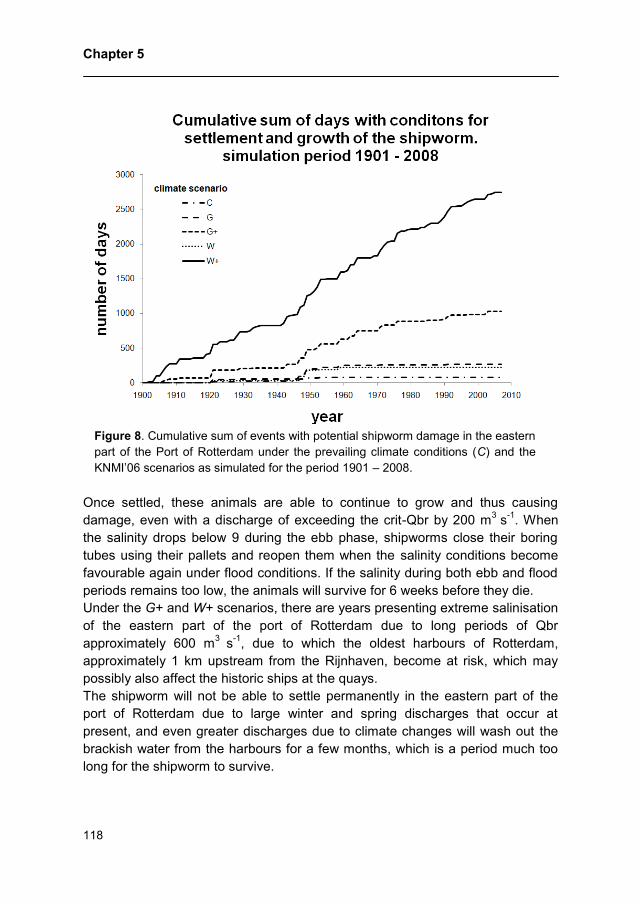
Chapter 5
118
Once settled, these animals are able to continue to grow and thus causing
damage, even with a discharge of exceeding the crit-Qbr by 200 m3
s-1
. When
the salinity drops below 9 during the ebb phase, shipworms close their boring
tubes using their pallets and reopen them when the salinity conditions become
favourable again under flood conditions. If the salinity during both ebb and flood
periods remains too low, the animals will survive for 6 weeks before they die.
Under the G+ and W+ scenarios, there are years presenting extreme salinisation
of the eastern part of the port of Rotterdam due to long periods of Qbr
approximately 600 m3
s-1
, due to which the oldest harbours of Rotterdam,
approximately 1 km upstream from the Rijnhaven, become at risk, which may
possibly also affect the historic ships at the quays.
The shipworm will not be able to settle permanently in the eastern part of the
port of Rotterdam due to large winter and spring discharges that occur at
present, and even greater discharges due to climate changes will wash out the
brackish water from the harbours for a few months, which is a period much too
long for the shipworm to survive.
Figure 8. Cumulative sum of events with potential shipworm damage in the eastern
part of the Port of Rotterdam under the prevailing climate conditions (C) and the
KNMI’06 scenarios as simulated for the period 1901 – 2008.

Climate change; New threats of a old enemy Teredo navalis
119
In addition to the eastern part of the port of Rotterdam, in the shallower old
harbours of Maassluis and Vlaardingen, the conditions might become favourable
under the scenarios G+ and W+ for the shipworm to settle and grow in the fir
piles on which the old quays are built, and if they are not replaced by that time,
the mechanical stability of the piles and, consequently, that of the quays will be
impaired.
Paalvast and Van der Velde (2011) found an average body length growth rate of
1.5 mm day
-1 in 2006 and wood consumption of 12.4% of fir wood panels in the
polyhaline harbours in the western part of the port of Rotterdam by first year
shipworm individuals in 130 days. The number of shipworm attacks per m2
accounted approximately 250. Hoppe (2002) recorded 40,000 larvae per m2 on
wood after one month of exposure. These figures clearly show the potential
threat of the species, and therefore, it is not surprising that when shipworms
encounter structures made of wood into which they can bore, these are ruined in
a short period of time. The complete destruction of a U.S. Navy base in the San
Francisco Bay from 1919-1920 serves as a good example of the destructive
capabilities of these bivalves (Cohen, 2004). However, not only climate change,
but also the improvement of water quality will have an effect on the distribution
of the shipworm in estuaries. After the Clean Water Act of 1972, pilings that
stood in the Hudson estuary in New York, USA for 100 years began to fall, and
more recently, parts of the wooden Brooklyn pier collapsed due to shipworm
damage. The city of New York has already spent hundreds of millions of dollars
fixing wooden support pilings (Cobb, 2002). Additionally, in the Rotterdam port
area, the water and sediment quality has been improved since the 1970’s, when
pollution was severe. This was due to the decreasing levels of pollutants in the
Rhine river as a result of the Rhine Action Plan following the Sandoz accident in
1986 (Admiraal et al., 1993, Bij de Vaate et al., 2006).
Various types of tropical timber (hardwood) have been tested over a period of 30
years in the marine waters of the Netherlands (Koninklijk Instituut voor de
Tropen, 1972). The results showed that not only the hardness of timber, but also
the presence of silica particles and poisonous alkaloids in wood affords
considerable protection against shipworm attacks. However, even the most
resistant hardwoods showed at least some damage by the shipworm after 30
years of exposure. The shipworm lives in the outer 3 cm of hundreds of pilings,
fender structures and piers made of the hardwood basralokus (Dicorynia
paraensis Benth.) and in driftwood in the polyhaline harbours of the port of
Rotterdam (Paalvast and Van der Velde, 2011). With a reproductive rate of up to
2 million larvae per individual (Hoppe, 2002) and the ability to travel over large

Chapter 5
120
distances through the flood stream, this species is on standby to attack wooden
structures upstream once the river discharge decreases and salinity rises.
Furthermore, the increased length of the salinity gradient and, consequently the
expansion of the distribution of the shipworm upstream that are predicted within
the Rhine-Meuse estuary as a consequence of climate change due to global
warming will be similarly manifest in other northwest European estuaries, like the
Elbe, Thames and Loire. The impact of climate change in Southern Europe
estuaries will be even stronger under the worst case scenario, W+ as in summer
and fall, the decrease in precipitation may reach as much as 80% (Van den Hurk
et al., 2006). When salinity rises to levels favourable for the shipworm to settle
and grow in places where wooden constructions are located in southern
estuaries, these constructions will eventually be attacked by the animal and will
be seriously impaired or may collapse.
This study on the effects of global warming due to climate change on the
expansion of the distribution of the shipworm upstream in the Rhine-Meuse
estuary clearly shows how ecologists can benefit from computer models
developed by meteorologists and hydrologists. Despite the limitations and
uncertainties that each model has, they are invaluable in providing insight into
the ecological impacts of climate change.
Conclusion
Climate change with a global increase in temperature of one or two degrees
coinciding with a strong change of air circulation that leads to low river
discharges in summer and fall will extend the salinity gradient upstream in
western Europe estuaries and considerably increase the risk of damage to
wooden structures by the shipworm in the near future.
Acknowledgements
We thank the Rotterdam Port Authority for financing the use of the SIMONA
modelling system.

Climate change; New threats of a old enemy Teredo navalis
121
References
Admiraal, W., Van der Velde, G., Smit, H., Cazemier, W.G., 1992. The rivers
Rhine and Meuse in The Netherlands: present state and signs of ecological
recovery. Hydrobiologia, 265: 97-128.
Beijk, V., 2008. Klimaatsverandering en verzilting. Modelstudie naar de effecten
van de KNMI’06 klimaatscenario’s op de verzilting van het noordelijk
deltabekken. Rijkswaterstaat Waterdienst. Rijkswaterstaat Dienst Zuid-
Holland. Rapportnummer: 2008.035.
Bij de Vaate, A., Breukel, R., Van der Velde, G., 2006. Long-term developments
in ecological rehabilitation of the main distributaries in the Rhine delta: fish
and macroinvertebrates. Hydrobiologia, 565: 229-242.
Boé, J., Terray, L., Martin, E., Habets, F., 2009. Projected changes in
components of the hydrological cycle in French river basins during the 21st
century. Water Resources Research 45: 1-49.
Bol, R., Kraak, A., 1998. MER Beheer Haringvlietsluizen. Over de grens van
zout en zoet. Deelrapport Water- en Zoutbeweging. ISBN: 903694871.
RWS, notanummer: apv 98/093. 212 pp.
Cobb, K., 2002. Return of a castaway: the gripping story of a boring clam –
shipworm. Science News, 162: 72.
Cohen, A.N., 2004. Invasions in the sea. Park Science, 22: 37-41.
Cohen, A.N, Carlton, J.T., 1995. Nonindigenous aquatic species in a United
States estuary: a case study of the biological invasions of the San
Francisco Bay and delta. NOAA: USA. 251 pp.
De Bruyne, R.H., 1994. Schelpen van de Nederlandse kust. Stichting
Jeugdbondsuitgeverij, Utrecht, 2e druk. 165 pp.
Diaz-Nieto, J., Wilby, R.I., 2005. A comparison of statistical downscaling and
climate change factor methods: impacts on low flows in the river Thames,
United Kingdom. Climatic Change, 69: 245–268.
Grave, B.H., 1942. The sexual cycle of the shipworm, Teredo navalis. Biological
Bulletin, 82: 438-445.
Hoagland, K.E., 1986. Effects of temperature, salinity, and substratum on larvae
of the shipworms Teredo bartschi Clapp and Teredo navalis Linnaeus
(Bivalvia: Teredinidae). American Malacological Bulletin, 4: 89–99.
Hoppe, K., 2002. Teredo navalis – The cryptogenic shipworm. In Invasive
aquatic species of Europe. Distribution, impacts and management.
Leppäkoski, E., Gollasch, S., Olenin., S. (eds.). Kluwer Academic
Publishers, The Netherlands.
Chapter 5
122
Koninklijk Instituut voor de Tropen, 1972. Shipworm experiments during the
period 1938-1970. A comparative study of the resistance of tropical timber
to shipworm. Communication No. 62 of the Department of Agricultural
Research.
Kristensen, E., 1969. Attacks by Teredo navalis L. in inner Danish waters in
relation to environmental factors. Videnskabelige Meddelelser Dansk
Naturhistorisk Forening, 132: 199-210.
Lane, C.E., 1959. Some aspects of the general biology of Teredo. In: Marine
boring and fouling organisms: Symposium. Ray, D.L. (ed.). Friday Harbour
Symposia, 137-158.
Ministry of Transport, Public Works and Water Management, 2008.
WAQUA/TRIWAQ - two- and three-dimensional shallow water flow model.
Technical documentation, version 3.3, March 2008.
Nair, N.B., Saraswathy, M., 1971. The biology of wood-boring teredinid
molluscs. Advances in Marine Biology, 9: 335–509.
Norman, E., 1977. The geographical distribution and the growth of the woord-
boring molluscs Teredo navalis L., Psiloteredo megotara (Hanley) and
Xylophaga dorsalis (Turton) on the Swedish west coast. Ophelia, 16: 233-
250.
Paalvast, P., Van der Velde, G., 2011. Distribution, settlement and growth of first
year individuals of the shipworm Teredo navalis L. (Bivalvia: Teredinidae) in
the port of Rotterdam area, the Netherlands. International Biodeterioration.
and Biodegradation, 65: 379-388.
Quayle, D.B., 1992. Marine wood borers in British Columbia. Canadian Special
Publication of Fisheries and Aquatic Sciences, 115: 55.
Richards B.R., Hillman, R.E., Maciolek, N.J., 1984. Shipworms. In: Lecture
Notes on Coastal and Estuarine Studies. Ecology of Barnegat Bay, New
Jersey. Kennish M.J., Lutz, R.A. (eds.). Springer-Verlag. New York, 201-
225.
Roch, F., 1932. Einige Beobachtungen zur Ökologie und Physiologie von
Teredo navalis L. Arkiv för Zoologi, 24: 1-17.
Scheltema, R.S., Truitt, R.V., 1956. The shipworm Teredo navalis in Maryland
coastal waters. Ecology, 37: 841-843.
Sellius, G., 1733. Historia naturalis teridinis seu Xylophagi marini, tubule-
conchoideis speciatim belgici cum tabulis ad vivum delineatis. Trajecti ad
Rhenum Apud Hermannum Besseling.
Snow, C.H., 1917. Wood and other organic structural materials. McGraw-Hill
book company, New York, Londen: Hill publishing co., ltd.

Climate change; New threats of a old enemy Teredo navalis
123
Tuente, U, Piepenburg, D., Spindler, M., 2002. Occurrence and settlement of the
common shipworm Teredo navalis (Bivalvia: Teredinidae) in Bremerhaven
harbours, northern Germany. Helgoland Marine Research, 56: 87-94.
Van Benthem Jutting, T., 1943. Mollusca. C. Lamellibranchia.— Fauna van
Nederland, 12: 1-477.
Van den Hurk, B., Klein Tank, A., Lenderink, G., van Ulden, A., van Oldenborgh,
G.J., Katsman, C., Van den Brink, H., Keller, F., Bessembinder, J., Burgers,
G., Komen G., Hazeleger, W., Drijfhout, S., 2006. KNMI Climate Change
Scenarios 2006 for the Netherlands. KNMI Scientific Report WR 2006-01.
Van den Hurk, B., Klein Tank, A., Lenderink,G,, van Ulden, A., van Oldenborgh,
G.J., Katsman, C., Van den Brink, H., Keller, F., Bessembinder, J., Burgers,
G., Komen, G., Hazeleger, W., Drijfhout, S., 2007. New climate change
scenarios for the Netherlands. Water Science & Technology, 56: 27-33.
Van Deursen, W.P.A., 1995. Geographical Information systems and dynamic
models. Development and application of a prototype spatial modelling
language. PhD-thesis, may 19, 1995. Faculty of Spatial Sciences University
of Utrecht, The Netherlands.
Van Deursen, W.P.A., 2003. Klimaatveranderingen in de stroomgebieden van
Rijn van en Maas: modelstudies met Rhineflow-3 en Meuseflow-2;
Carthago Consultancy, Rotterdam.
Van Deursen, W.P.A., 2006. Rapportage Rhineflow/Meuseflow. Nieuwe
KNMIscenario’s 2050. Carthago Consultancy, Rotterdam.
Vrolik, W., Harting, P., Storm Buysing, D.J., Van Oordt, J.W.L., Von Baumhauer,
E.H., 1860. Verslag over den Paalworm, uitgegeven door de Natuurkundige
Afdeeling der Koninklijke Nederlandsche Akademie van Wetenschappen,
Amsterdam. 153 pp.


Chapter 6
Pole and pontoon hulas: An effective
way of ecological engineering to
increase productivity and biodiversity in
the hard-substrate environment of the
port of Rotterdam
Peter Paalvast
Bregje K. van Wesenbeeck
Gerard van der Velde
Mindert B. de Vries Ecological Engineering 44 (2012) 199–209

Chapter 6
126
Abstract
Underwater environments in ports are designed for harbour activities solely.
However, by simple and cost-effective measures, suitable habitat for underwater
flora and fauna can be created. This is expected to have positive effects on
higher trophic levels, such as fish, and improve water quality, by enlarging filter
feeder biomass. In this study we developed ‘pole hulas’ and ‘pontoon hulas’,
consisting of hanging ropes of different materials. The pole hulas are made up of
many 6 mm thick and 55 cm long strings just above and below the mean low
water level (MLWL) around poles. The pontoon hulas resemble raft like
structures with 12 mm thick and 150 cm long ropes within the open space of
mooring pontoons. The first experimentation with these structures was executed
in the polyhaline harbours of the port of Rotterdam. The pole hulas were rapidly
colonized by a variety of organisms. Above MLWL a seaweed community
dominated on the strings. Below MLWL Mytilus edulis (the Blue mussel) was
found to be the dominating species after a few months. In the dense layer of M.
edulis on both pole hulas and pontoon hulas many mobile soft-bottom
amphipods and young ragworms occurred, which means that colonisation on
these structures compensate for biodiversity loss of bottom fauna due to
dredging and disturbance by propellers of ships. Settlement of the exotic
Crassostrea gigas (Pacific or Japanese oyster) did not occur on the strings of
the pole hulas, the ropes of the pontoon hulas and not on the poles with hulas.
Wet biomass (including shells) on pole hulas was positively correlated with
depth and on average 4.4-11.4 higher compared to biomass on reference poles.
Colonization of the pontoon hula ropes was similar to colonization of the pole
hulas below MLWL. Biomass production per rope was density dependent and
optimal density of ropes was estimated at 4 to 8 ropes m-2
. Biomass (mainly M.
edulis) on the ropes of pontoon hulas decreased to a half from the edge to the
heart of the hula demonstrating the limitation of food by competition.
It was concluded that ecological engineering in the port of Rotterdam with simple
structures such as pole and pontoon hulas strongly enhances sessile biological
production and biodiversity. This is likely to result in a positive impact on local
water quality, and, if applied at larger scales, may have positive influences on
the remains of Rhine-Meuse estuary.

Pole and pontoon hulas in the port of Rotterdam
127
Introduction
Various large ports all over the world have come to development over centuries
and are situated as far land inwards the estuary as ancient ships could sail.
Systematic dredging for greater depth of the waterways and canalization started
in the 19th century. Together with agriculture, urbanization, industrialization and
port development, this exerted a strong influence on the estuarine ecosystem. In
estuaries such as the Elbe (Reky, 1992) and the Seine (Lesueur and Lesourd,
1999) most marshes were used for land reclamation and sand and mudflats
disappeared due to hydrological changes. Within the Humber estuary some 50%
of the original intertidal zone area was sacrificed for human activity (Jones,
1988).
The port of Rotterdam is situated in the remains of the Rhine-Meuse estuary.
Before the Delta Works (Smits et al., 2006) that closed most of the river mouths
with dams and barriers (1958–1986), the intertidal zone of the estuary consisted
mostly out of beaches, salt and brackish marshes, sand and mud flats, tidal
creeks, immense fresh and brackish rush and reed beds and intertidal forests. In
the northern part of the Rhine-Meuse estuary many of these soft substrate
ecotopes disappeared gradually with the development of the port of Rotterdam
between 1870 and 1970 (Paalvast, 2002). At present along the salinity gradient
no more than 3 ha of brackish marshes, rush and reed beds are left, and due to
canalization the tidal creeks and the natural sand and mud banks have
disappeared completely (Paalvast, 2002). Between 1960 and 1970 the pollution
of the port of Rotterdam was severely degrading the ecosystem to a low number
of pollution tolerant species (Wolff, 1978). However, since the 1970’s the water
and sediment quality has been improved. This was due to the lowering of
pollutants in the river Rhine in particular as a result of the Rhine Action Plan
after the Sandoz accident in 1986 (Admiraal et al., 1993, Huisman et al., 1998,
Middelkoop and Van Haselen, 1999, Bij de Vaate et al., 2006). But also the ban
of TBT, dredging and removal of the heavily polluted sediment, prevention of oil
spills and the change from a bulk harbour to a container harbour contributed to a
better water and sediment quality (Anonymous, 1999, Anonymous, 2006).The
development of the port of Rotterdam transformed a formerly soft sediment
habitat into a habitat that is mainly dominated by hard structures such as
retaining walls, rip rap, piers, quays, pontoons, and mooring poles of concrete,
hardwood and steel. These structures were quickly colonised by hard substrate
communities and it is known that although distinct such ‘artificial reefs’ on the
long-term may resemble natural reefs (Burt et al., 2011).
In 1964 the Japanese or Pacific oyster Crassostrea gigas was deliberately
introduced by oyster farmers in the Eastern Scheldt in the Netherlands

Chapter 6
128
(Duursma et al., 1982) and has since then spread over the brackish and salty
waters of the Netherlands and abroad. In the Rotterdam port area C. gigas was
observed for the first time in 1994 and has expanded since that time greatly over
the past 15 years (Paalvast, 1995, 1998, 2008) mainly at the expense of the
native Blue mussel Mytilus edulis. Nowadays C. gigas occupies almost all hard
substratum including the pontoons and pier and mooring poles, while M. edulis
is mainly confined to a narrow zone around the mean low water level (MLWL).
Ecological engineering was defined by Odum and Odum (2003) as the practice
of joining the economy of society to the environment symbiotically fitting
technological with ecological self design. Ecological engineering is common
practice along rivers (Leuven et al., 2006) and was applied in coastal protection
of the Netherlands on an experimental scale (Borsje et al., 2011). Such
ecological engineering is rarely applied in port development (De Wit et al.,
2007).
Considering the position of these large harbour water bodies within the Rhine-
Meuse estuary implicating an enormous supply of nutrients and detritus by the
river, ecological engineering by the enrichment of the aquatic environment with
simple cost-effective under water structures that means surface enlargement
and increased structure diversity for settlement, could enhance bioproductivity in
particular of filter feeders as well as biodiversity. Fibrous structures are well
known (since the 13th century) for their rapid colonisation by a variety of aquatic
organisms particularly mussels (Veverica, 1982, Bompais et al., 1991, Pulfrich,
1996). Fibrous structures were chosen to test how far bioproductivity as well as
biodiversity could be improved. “Pole hulas” (paalhula’s in Dutch), hula skirt liked
rope structures were attached to wooden and steel poles, and “pontoon hulas”
(pontonhula’s in Dutch) raft liked structures with ropes were placed in the
enclosed space of the floaters of mooring pontoons.
The main goal of the present study is to get an answer on the question if pole
and pontoon hulas can serve as tools for ecological engineering in a man-made
estuarine environment, the port of Rotterdam. Therefore the following research
questions were formulated: (a) How proceeds the colonisation and the
succession of the fouling community on pole and pontoon hulas, (b) Can
colonisation on pole and pontoon hulas compensate for biodiversity loss of the
bottom fauna due to dredging and disturbance by propellers of ships, and
reduce the settlement of the exotic Pacific oyster? (c) How does biomass
production of the fouling community on pole and pontoon hulas develops in
time? (d) Is biomass production on poles with hula’s higher than on those
without? (e) Is biomass production on the pole hulas related to their position
relative to the MLWL?, (f) Does competition exist between the fouling organisms

Pole and pontoon hulas in the port of Rotterdam
129
on different ropes of the pontoon hulas, and does rope density on pontoon hulas
influence the biomass production?
Material and methods
Study area
The Beer- and Calandkanaal are two large man-made polyhaline tidal water
bodies (>2200 ha) in the westward part of the port of Rotterdam (Fig. 1).
Location
The colonisation experiment with pole and pontoon hulas was carried out in two
small harbours, the Scheurhaven and the Pistoolhaven (Fig. 1). The
Scheurhaven is a small working harbour with a length of over 300 m and a width
of 100 m at the MLWL (mean low water level). The depth of the port is variable
and ranges between 3.5 and 9.5 m below MLWL. Due to its location with access
to the southeast, the Scheurhaven is a lee port. Waves, even in big storms, and
tidal currents are negligible. However, there is 24-h activity of in and outgoing
tugs and their propellers produce strong water currents, resulting in sediment
resuspension. The average tidal range is 1.94 m. At springtide the tidal cycle
exhibits approximately a 4 h period of flood, a 4 h period of ebb and a 4.5 h low
water period. The water is often clear with a Secchi depth up to 3 m. The water
is always polyhaline and depending on the river discharge there is a more or
less clear vertical gradient in salinity with high salinity near the sea floor and a
lower salinity at the water surface (Paalvast and Van der Velde, 2011).
The Pistoolhaven is one of the home ports of pilot tenders and has a length of
165 m and a width of 110 m at MLWL. At low tide the harbour is about 6 m deep.
The abiotic conditions are similar to those of the Scheurhaven, but with wider
salinity fluctuations and due to its entrance to the west waves are slightly higher.
There is no significant resuspension of sediment by the tenders.
Pole and pontoon hulas
A pole hula is a synthetic free-hanging rope work that can be attached around
wooden and steel poles. It consists of a 10 cm high hollow band made of a
heavy quality plastic canvas on the top. In the seam of the band strings of 55 cm
long with a diameter of 6 mm are sewn (Fig. 2). Per metre band there are 167

Chapter 6
130
Figure 1 (A) The port of Rotterdam in the Rhine-Meuse Estuary. (B) The location
of the Scheurhaven and the Pistoolhaven in the port of Rotterdam. Relevant
temperature gauges are located at Hoek van Holland in the Nieuwe Waterweg and
Q8 in the Hartelkanaal.
.

Pole and pontoon hulas in the port of Rotterdam
131
strings with a total length of 92 m. Through the hollow band runs a 25 mm wide
nylon strap which at one end has a stainless steel rattle that is fixed on the band.
With the rattle the pole hula can be attached tightly around a pole. For
monitoring purposes, six counter buckles are stitched to the hollow band at
equal distances. To each buckle four strings with a label are fastened. Pole
hulas with polyamide strings that float are placed at intertidal levels and pole
hulas with nylon strings that sink are attached subtidally (Fig. 2).
Pole hulas were mounted on five wooden poles in the Scheurhaven on the 9th of
March 2009. Each pole contained four hulas, one with polyamide strings at 50
cm above MLWL and three with nylon strings with an overlap of approximately
10 cm at 0 cm, 50 cm and 100 cm below MLWL. On two steel poles in the
Scheurhaven, three pole hulas were mounted below MLWL, because a hula
above MLWL would be scraped off the pole by the pontoon that moves up and
down with the tide. Fouling organisms were removed from all poles, including
five wooden and two steel reference poles, with a high pressure sprayer (200
bars) between 1 m above and 2 m below MLWL.
A pontoon hula consists of a floating frame which is made of PVC sewer pipe
with a diameter of 125 mm. Within this frame a nylon net with a mesh size of
12.5 cm x 12.5 cm is mounted. At the knots of the net nylon ropes with a
diameter of 12 mm are attached. By the cross of the frame numbered counter
buckles are attached to the knots of the net. Each counter buckle contains a
numbered rope for monitoring purposes. The length of the rope and the string
density varies per pontoon hula. There are two types (Fig. 3). Type I consists of
ropes with a length of around 150 cm, and type II contains varying rope lengths,
ranging from 30 cm in the middle to 150 cm at the outside with 20 cm
differences between adjacent ropes (bell type). Hulas were placed in both
harbour basins on the 16th and 17
th of March 2009. In the Scheurhaven a type I
and type II pontoon hula measuring 160 cm x 200 cm with both 208 ropes, and
in the Pistoolhaven three type I pontoon hulas D16, D32 and D64 (with
respectively 16, 32 and 64 ropes m-2
) measuring 85 cm x 230 cm were placed in
the enclosed space of the floaters of mooring pontoons (Table 1).
Salinity, oxygen and temperature measurements
At two nearby measuring stations water temperature was recorded every ten
minutes (Fig. 1). To determine if oxygen was limited, samples of the surface
water were taken and oxygen concentration was measured with a HQ20 Hach
Portable LDOTM Dissolved Oxygen/pH Meter. Salinity was measured with a
WTW-conductivity meter (Cond 3301) with a TetraCon®325 conductivity and
temperature sensor. From the data of the measuring stations the mean daily
water temperature during the monitoring period was calculated.

Chapter 6
132
Figure 2 The pole hulas and their position in relation to the mean low water level
(MLWL). MHWL = mean high water level.
.
Figure 3 The pole two types of pontoon hulas.
.

Pole and pontoon hulas in the port of Rotterdam
133
Monitoring
The composition of the sessile community on the pole hulas was monitored
monthly with the aid of an underwater camera. One set of monitoring strings was
removed from each pole hula in June (107 days after placement) and October
(231 days after placement) to determine wet biomass and species composition.
However, in June strings were only removed from two hulas (out of seven) that
were situated 100 cm below MLWL due to dangerous conditions. The strings
with the fouling organisms were weighted on a scale with an accuracy of 1 gram
after the surplus of water had dropped off. Wet biomass including that of shells
(wet biomass = wet tissue plus calcimass) was calculated by extracting the
weight of the strings in wet condition. Percentage coverage on the strings of
dominant sessile species was estimated, while of other sessile species their
numbers were counted. Due to the constant incoming and outgoing tugs it was
impossible to sample mobile species on separate monitoring strings in an
accurate way. Their abundance was estimated and a simple relative scale
ranging from rare (1-10 individuals), common (11-100 individuals) to abundant
(>100) was applied. All sessile species were identified to species level. For
mobile species this was only done for samples taken in June. In October
percentage coverage on reference poles was estimated as well. With the aid of
a scrape net some of the fouling on the reference poles was removed and
weighted after the surplus of water had dropped off. Wet biomass per m2 at a
100 % coverage with mussels was calculated from a 100 % coverage of
mussels within a frame of 20 cm x 20 cm.
Monitoring ropes on the pontoon hulas in the Scheurhaven were removed to
determine wet biomass and species composition on May 19th, June 17
th and July
24th 2009, respectively after 64, 93 and 130 days of exposure. The ropes with
fouling organisms were weighted on location with a weighing hook with an
accuracy of 5 gram hanging in a stable metal frame of 2 m high and 1 m wide.
Wet biomass was calculated by extracting the weight of the ropes in wet
Location Placing date Pontoon hula Number of ropes
n ropes m-2 Length of
ropes cm
Scheurhaven 16-03-2009 type I 208 64 150
Scheurhaven 16-03-2009 type II (bell type) 208 64 150–30
Pistoolhaven 17-03-2009 type I D64 168 64 150
Pistoolhaven 17-03-2009 type I D32 80 32 150
Pistoolhaven 17-03-2009 type I D16 40 16 150
Table 1 Properties of the pontoon hulas placed in the Scheurhaven and
Pistoolhaven.
.

Chapter 6
134
condition. On July 24th 2009 percentage coverage of sessile species and
abundance of mobile species was determined. All organisms were, if possible,
identified to the species level. After analysis, ropes with fouling organisms were
placed back to their original position. Measurements in the Pistoolhaven were
executed on May 18th, June 18
th, July 24
th and November 6
th 2009.
Calculating maximum biomass
Maximum biomass at a given time on each single rope in the absence of
competition between ropes can be calculated by considering each individual
rope with all the fouling species as one “organism”. For this calculation laws of
theoretical crop science are used (De Wit, 1960). This can be done by setting
the reciprocal of the biomass per cm2 pontoon hula (in this case multiplied by
100 for application within SPSS) against the reciprocal of the number of ropes
per cm2 per pontoon hula. The product (Ω*β) of the intersection of the regression
line with the x-axis and y-axis gives the maximum wet biomass per rope.
Statistical analysis
Statistical analysis was carried out with SPSS for Windows (Release 15.0).
Linear regression was applied to test (a) the relation of wet biomass on the pole
hulas and their position relative to the MLWL, (b) the relation of wet biomass
production and rope density on the pontoon hulas in the Pistoolhaven, and (c)
the relation of wet biomass on a pontoon hula rope in regard to its shortest
distance to the edge of the hula
Analysis of covariance (ANCOVA)(covariate=shortest distance to the edge of the
hula) was conducted to compare the wet biomass on the ropes on the pontoon
hulas type I and in the Scheurhaven.
1-Way analysis of variance (1-way ANOVA) was applied to compare (a) the
mean wet biomass on pontoon hulas with different rope densities in the
Pistoolhaven and (b) the mean wet biomass on the ropes of the pontoon hula
type I in the Scheurhaven with those of the pontoon hulas in the Pistoolhaven
Levene’s test for the homogeneity of variances was applied for both ANCOVA
and 1-way ANOVA.

Pole and pontoon hulas in the port of Rotterdam
135
Results
Abiotics
During the experiment oxygen content of the water fluctuated between 7.6 mg l-1
and 8.7 mg l-1
and salinity between 15 and 23. Water temperature varied from 7
°C at the start of the experiment in March, till 22 °C in mid August and then
gradually dropped to 11 °C at the end of the experiment in November.
Succession
After placement in March pole hulas below MLWL were completely covered by
diatoms within a month (solitary, stalked and colonial species). Above MLWL no
macroscopic sessile organisms were observed. In the period between April and
May some individuals of the sessile algae Ulva lactuca and Porphyra umbilicalis
settled on the strings above MLWL, while the strings below MLWL were
completely covered with a monoculture of the hydroid Obelia dichotoma. At the
end of June more species were present (Table 2). Above MLWL the fouling
community was dominated by P. umbilicalis. Below MLWL O. dichotoma was
degenerating and was replaced by small individuals of the Blue mussel (Mytilus
edulis) and the barnacle Amphibalanus improvisus (nn) (nn = not native). The
number of seaweed species on the strings of pole hulas decreased from the
MLWL downwards. In between the sessile organisms on the strings many
mobile species were found (Table 3). Chironomidae, juvenile Polychaeta, crab
larvae, the amphipod Monocorophium insidiosum, and the tanaidacean
Sinelobus stanfordi (nn) appeared in high numbers. The amphipods
Monocorophium acherusicum, Microdeutopus gryllotalpa, Melita palmata (nn)
and the decapod Hemigrapsus takanoi (nn) were commonly found, while the
amphipods Caprella linearis, Caprella mutica (nn), Monocorophium sextonae
(nn), Gammarus salinus, Hyale prevosti and the gastropod Crepidula fornicata
(nn) were only met on occasion.
At the end of October composition of the fouling community on the strings had
changed considerably. Both above and below MLWL P. umbilicalis and Ulva
species disappeared, while the red algae Callithamnion roseum and Ceramium
rubrum increased considerably in abundance. On the whole M. edulis became
the dominating species with an increasing abundance with depth, thereby
outcompeting A. improvisus. The Blue mussel grew around the strings and
because of the high number of strings were present in multiple layers. On
several strings the ascidians Styela clava (nn) and Molgula manhattensis (nn)
and the sponge Halichondria panicea were found. Despite a small spot of
bryozoans, no fouling was found on the mussels. Mobile species were present
between the sessile fauna in higher abundance in October than in June. The sea

Chapter 6
136

Pole and pontoon hulas in the port of Rotterdam
137
star Asterias rubens and the prawn Palaemonetes varians were observed on
many of the pole hulas below the MLWL. Also in October 2009 the Rock gunnel
Pholis gunnellus was seen in-between the strings. Thicklip grey mullets (Chelon
labrosus), a common fish in the port of Rotterdam were often foraging on the
seaweeds from the pole hulas. On the poles underneath the pole hulas only
barnacles with a coverage of 50% and occasionally a Blue mussel settled. Of
these barnacles 80% was dead.
From April till October the same type of fouling developed on the reference poles
below MLWL. In contrast with the strings M. edulis settled as one layer and on
average covered the poles in October by some 50%. A. improvisus had an
average coverage of 14%. A small amount of Pacific oyster spat was observed
on the steel reference poles. In the zone of 50 cm above MLWL the reference
poles were for 50% covered in codominance by the algae P. umbilicalis, Ulva
linza, U. lactuca and Blidingia minima. In October P. umbilicalis disappeared and
U. lactuca became the dominant species. Fucus vesiculosus was also found in
low densities.
Succession on the pontoon hulas was similar to succession on the pole hulas
with the exception that no seaweeds grew on the ropes of the pontoon hulas as
a result of shading by the pontoons. In June 2009 composition of mobile species
on the pontoon hulas resembled composition on the pole hulas, although
Chironomidae and Polychaeta were rare. Young fish was regularly observed
between the ropes, and on one occasion a young eel (Anguilla anguilla) was
found between the mussels on a rope in the Pistoolhaven.
position mobile species June 24th 2009 October 26
th 2009
>MLWL Amphipoda common common
<MLWL
Amphipoda abundant abundant
Decapoda (crabs) abundant abundant
Tanaidacea abundant abundant
Chironomidae abundant rare
Polychaeta abundant abundant
Table 3 Relative abundance of mobile macrofauna on the monitoring strings of the
pole hulas in the Scheurhaven on June 24th
2009 and October 26th
2009.
>MLWL = above mean low water level. < MLWL = below mean low water level.
.
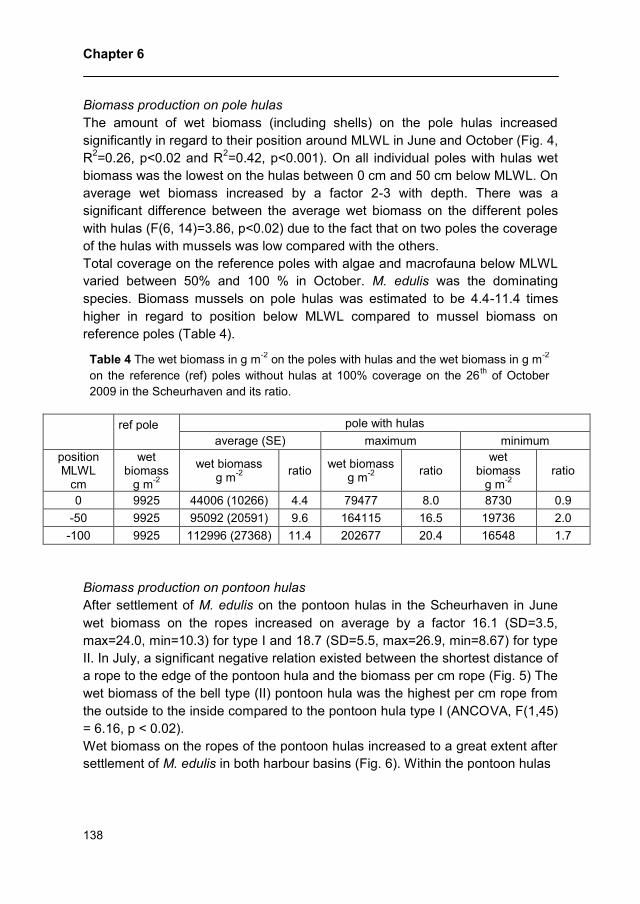
Chapter 6
138
Biomass production on pole hulas
The amount of wet biomass (including shells) on the pole hulas increased
significantly in regard to their position around MLWL in June and October (Fig. 4,
R2=0.26, p<0.02 and R
2=0.42, p<0.001). On all individual poles with hulas wet
biomass was the lowest on the hulas between 0 cm and 50 cm below MLWL. On
average wet biomass increased by a factor 2-3 with depth. There was a
significant difference between the average wet biomass on the different poles
with hulas (F(6, 14)=3.86, p<0.02) due to the fact that on two poles the coverage
of the hulas with mussels was low compared with the others.
Total coverage on the reference poles with algae and macrofauna below MLWL
varied between 50% and 100 % in October. M. edulis was the dominating
species. Biomass mussels on pole hulas was estimated to be 4.4-11.4 times
higher in regard to position below MLWL compared to mussel biomass on
reference poles (Table 4).
ref pole pole with hulas
average (SE) maximum minimum
position MLWL
cm
wet biomass
g m-2
wet biomass g m
-2
ratio wet biomass
g m-2
ratio
wet biomass
g m-2
ratio
0 9925 44006 (10266) 4.4 79477 8.0 8730 0.9
-50 9925 95092 (20591) 9.6 164115 16.5 19736 2.0
-100 9925 112996 (27368) 11.4 202677 20.4 16548 1.7
Biomass production on pontoon hulas
After settlement of M. edulis on the pontoon hulas in the Scheurhaven in June
wet biomass on the ropes increased on average by a factor 16.1 (SD=3.5,
max=24.0, min=10.3) for type I and 18.7 (SD=5.5, max=26.9, min=8.67) for type
II. In July, a significant negative relation existed between the shortest distance of
a rope to the edge of the pontoon hula and the biomass per cm rope (Fig. 5) The
wet biomass of the bell type (II) pontoon hula was the highest per cm rope from
the outside to the inside compared to the pontoon hula type I (ANCOVA, F(1,45)
= 6.16, p < 0.02).
Wet biomass on the ropes of the pontoon hulas increased to a great extent after
settlement of M. edulis in both harbour basins (Fig. 6). Within the pontoon hulas
Table 4 The wet biomass in g m-2
on the poles with hulas and the wet biomass in g m-2
on the reference (ref) poles without hulas at 100% coverage on the 26th
of October
2009 in the Scheurhaven and its ratio.
.
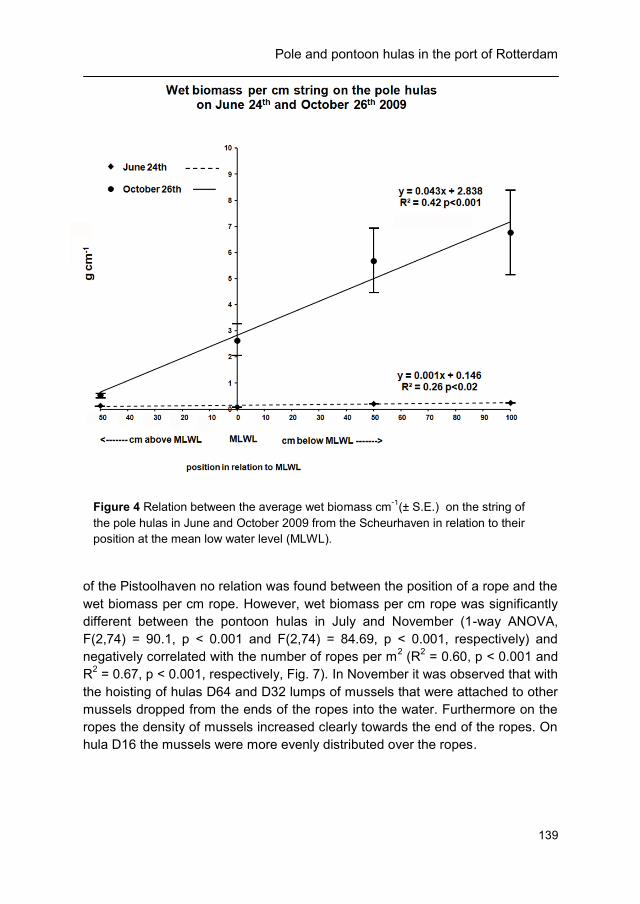
Pole and pontoon hulas in the port of Rotterdam
139
of the Pistoolhaven no relation was found between the position of a rope and the
wet biomass per cm rope. However, wet biomass per cm rope was significantly
different between the pontoon hulas in July and November (1-way ANOVA,
F(2,74) = 90.1, p < 0.001 and F(2,74) = 84.69, p < 0.001, respectively) and
negatively correlated with the number of ropes per m2 (R
2 = 0.60, p < 0.001 and
R2 = 0.67, p < 0.001, respectively, Fig. 7). In November it was observed that with
the hoisting of hulas D64 and D32 lumps of mussels that were attached to other
mussels dropped from the ends of the ropes into the water. Furthermore on the
ropes the density of mussels increased clearly towards the end of the ropes. On
hula D16 the mussels were more evenly distributed over the ropes.
Figure 4 Relation between the average wet biomass cm-1
(± S.E.) on the string of
the pole hulas in June and October 2009 from the Scheurhaven in relation to their
position at the mean low water level (MLWL).
.

Chapter 6
140
The average wet biomass (N=26, M=1796,8 g rope-1
, SE=67.2) on the ropes of
pontoon hula type I from July in the Scheurhaven is compared with the average
wet biomass on the ropes of the pontoon hulas D64 (N=27, M=607,2 g rope-1
,
SE=33.0), D32 (N=24, M=842,1 g rope-1
, SE=42.6) and D16 (N=26, M=1382,1 g
rope-1
, SE=50.3) from July in the Pistoolhaven. The average biomass on the
ropes of pontoon hula I in the Scheurhaven was significantly higher (1-way
ANOVA, F(3,99)=116.79, p<0.001).
For the sampling on November 6, 2009 in the Pistoolhaven using the laws of
theoretical crop science (de Wit, 1960) the maximum biomass on one rope in the
absence of competition between ropes would give a wet biomass of 3030 g
rope-1
(Fig. 8). This could be achieved at a density between 4 to 8 ropes per m-2
.
Figure 5 Relation between the average wet biomass cm-1
(± S.E.) on the ropes of
pontoon hula I and pontoon hula II (bell shaped) from the Scheurhaven and the
shortest distance of the ropes to the edge of the pontoon hula on July 24th
2009.
.

Pole and pontoon hulas in the port of Rotterdam
141
Discussion
Species that settled on the pole hulas are commonly found in the Netherlands. A
number of them are non-native. M. manhattensis (18th century) and
Amphibalanus improvisus (19th century) invaded the Netherlands long ago as
hull fouling, while others like C. fornicata (1926), M. sextonae (1952), S. clava
(1974), C. mutica (1994) appeared in the course of the 20th century (Wolff, 2005,
Cook et al., 2007). H. takanoi (2000)(Wolff, 2005) and S. stanfordi (2006)(van
Haaren and Soors, 2009) were introduced recently in the first decade of this
century.
The hydroid O. dichotoma was the first macroinvertebrate species that occupied
the ropes of the pole (below MLWL) and pontoon hulas massively in early
spring. This creates a great advantage for mussels as the larvae preferentially
Figure 6 Pontoon hula type I D16 on July 24th
2009 in the Pistoolhaven.
.

Chapter 6
142
attach to filamentous substrates in particularly hydroids (Brienne, 1960, Pulfrich,
1996, Genzano et al., 2003).
Within the dense layer of M. edulis that developed in short time many mobile
soft-bottom amphipods and young ragworms occurred in the interstices, which
indicates sediment trapping. This phenomenon has been observed both in
mussel culture on ropes (Loo and Rosenberg, 1983, Lopez-Jamar et al., 1984)
and on suspended oyster cultures (Mazouni et al., 2001), but also in mussel
beds (Dittmann, 1990, Crooks, 1998, Thiel and Ulrich, 2002, Koivisto and
Westerbom, 2010). Within a harbour system where the top layer of the sea floor
is continuously disturbed by the propellers of the ships, and where dredging is
common practice, hula systems potentially offer a refugium for animals that
normally inhabit soft sediments on the sea floor. From hanging mussel cultures
it is known that if the infaunal macrobenthos community beneath rafts is
depauperated the diet of fish is composed primarily of raft epifauna (López-
Jamar et al., 1984). Furthermore, Iglesias (1981) found density and biomass of
Figure 7 Relation between rope density and the average wet biomass cm-1
(± S.E.)
on the ropes of the pontoon hulas from the Pistoolhaven on July 24th
2009 and
November 6th
2009.
.

Pole and pontoon hulas in the port of Rotterdam
143
gobies to be higher in raft areas than in non-raft areas. The gobies were not
supposed to take much advantages of the rope epifauna, but from the cover of
the episubstrate of the shell deposits under the rafts (Chesney and Iglesias,
1979). Also crab density can be much higher in raft- areas compared to non-raft
areas (Romero et al., 1982). Different bird species might well profit from an
Figure 8 Relation between the area per gram wet biomass and the area per rope.
.

Chapter 6
144
increase in density and biomass of the mussel. As clumps of mussels are
released from the ropes due to heavy turbulence caused by propellers from time
to time, these mussels may serve as the start of a mussel bed on the sea floor
beneath piers and pontoons where pole and pontoon hulas are located and so
creating new habitat.
The pole hulas above MLWL were mainly covered by large green and red
seaweeds. No large brown seaweeds were found after one season. In the
polyhaline harbours of the port of Rotterdam F. vesiculosus grows on anchor
ropes and ropes that hold old car tires that serve as fenders. Applying pole hulas
with thicker strings or ropes above the MLWL increases the biomass of large
seaweeds from which not only the herbivorous Thicklip grey mullets will profit
but many other fish species as well due to the presence of high numbers of
amphipods.
The value of the pole hula to strengthen the biodiversity of the port seems (after
one year) still limited, but they do increase the biodiversity on smooth concrete
and steel poles by providing a more structure rich habitat enabling animals to
creep in and between. An important phenomenon was the absence of the exotic
C. gigas both on and on the pole under the strings of the pole hulas. Because of
the inability of C. gigas to attach to relatively thin rope structures which
prevented also direct settlement of C. gigas on the poles, the presence of pole
hulas may strengthen the weakened position of M. edulis in the Rotterdam port
area. In particular when pole hulas are introduced in March/April before
spawning of M. edulis and C. gigas, because first spatfall in the Netherlands of
M. edulis takes place in May/June (Tydeman, 1996) and C. gigas in July/August
(Dankers et al., 2004), when water temperatures rises above 16 – 18 ºC.
The biomass on the pole hulas increased with increasing depth. Chaves and
Chew (1975) have found that mussel spat settled less at the top metre of a rope
and suggest that light intensity plays a role for settlement of spat. In the case of
pole hulas the inundation duration as their position was around MLWL might
have been important too. Due to the tidal movement more individuals could
settle on the lower pole hulas and had more time to feed than on the higher
ones. As the biomass (mainly M. edulis) per m2 pole hula below MLWL was
found to exceed the biomass per m2 on a reference pole as much as 20 times,
pole hulas are efficient tools in ecological engineering for strengthening the
estuarine biomass production in harbours.
On both types of pontoon hulas in the Scheurhaven the biomass (mainly M.
edulis) in July on the ropes decreased to a half from the edge to the heart of the
hula demonstrating the limitation of food by competition. The competition on the
bell shaped hula was slightly less because the individuals on the shorter ropes
underwent less competition compared to those at the same location and on the

Pole and pontoon hulas in the port of Rotterdam
145
same height within the hula with all ropes of the same length. This means that
the horizontal food supply played a more important role in the competition than
the vertical one. Also at the end of the ropes there is slightly more space to
settle and less competition and this works in favour for the average biomass on
shorter ropes.
No competition for food due to the location of the ropes within the pontoon hulas
by means of the biomass on the ropes could be demonstrated in the
Pistoolhaven. This is probably due to the size of the pontoon hulas in which the
ropes on the inside still had a short distance to the edge of the pontoon hula. By
varying the number of ropes a density dependent biomass production was
shown. This means that the amount of food in the water column was limited. An
additional aspect is that by the violent turbulence of the water by the propellers
of ships the risk of rubbing against each other of the ropes increases at higher
rope densities which cause the release of blue mussels and thus further limits
the increase in biomass.
The higher biomass on the ropes of the pontoon hulas in the Scheurhaven in
July compared with the biomass on the ropes of the pontoon hulas in the
Pistoolhaven, could be the result of lower and stronger fluctuating salinity in the
Pistoolhaven. Also the higher activity of ships near the pontoon hulas in the
Scheurhaven will have caused more flow of water and hence provided a greater
food supply.
Considering one rope on a pontoon hula as a single individual the maximum
biomass on a rope in the absence of competition with other ropes at a certain
moment has been calculated for the month November 2009, from the figure the
optimal density for biomass production was estimated at 4 to 8 ropes m-2
. This is
consistent with the findings of Brienne (1960) who found the best growth of
mussels at a density of approximately 9 ropes m-2
.
Blue mussels filter their food together with inorganic silt out of the water column
and excrete the remains as pseudofaeces. This has a positive impact on the
transparency, which benefits algal growth and thus the oxygen concentration of
the water. By the ingestion of large quantities of organic material from the water
column the Blue mussel contributes to a rapid recirculation of nutrients and
these are again used in the production of phytoplankton and benthic macroalgae
(see Newell, 2004 for a comprehensive overview). Brzowowska et al. (2012)
also showed that it is possible to improve seawater quality and attain high
efficiency of removal of some heavy metals from raw seawater using the filtering
activity of Mytilus sp. This would make easily moveable pontoon hulas suitable
for quickly reducing the concentration of toxic substances in case of
emergencies within a harbour before further distribution takes place.

Chapter 6
146
Taking the above into account, ecological engineering in the port of Rotterdam
with simple structures like pole hulas and pontoon hulas on a much larger scale
could strongly enhance biological production and biodiversity and the water
quality in the remains of the Rhine-Meuse estuary. This might have a positive
impact on both the ecology of the rivers Rhine and Meuse and the North Sea.
Furthermore it contributes to the ambition of the Rotterdam Port Authority to
enhance the ecological value of the port wherever possible (Stuurgroep Regie
Buitenruimte, 2004, De Wit et al., 2007).
In conclusion, succession on pole hulas above MLWL leads to a seaweed
dominated community. Succession on pole hulas below MLWL and on pontoon
hulas leads to a Blue mussel dominated community. Both pole hulas and
pontoon hulas contribute to the bioproductivity and biodiversity of the polyhaline
harbours of the port of Rotterdam. Pole hulas prevent settlement of the exotic
Pacific oyster and this may strengthen the weakened position of the Blue mussel
in the Rotterdam port area. Pole and pontoon hulas are successful tools for
ecological engineering within harbours in the estuarine and marine environment.
Acknowledgements
The authors wish to thank the Port of Rotterdam Authority for financing, support
and involvement during the course of the experiment, Rijkswaterstaat of the
Dutch Ministry of Infrastructure and the Environment for cofinancing the
experiment, Smit BV Harbour Towage and the Dutch Maritime Pilots
Organization Rotterdam Rijnmond (Loodswezen) to use their mooring pontoons
and mooring poles to attach the hulas. Special thanks go to Martin Versteeg for
diving in the Scheurhaven. Furthermore we are grateful to all those who in often
difficult conditions have contributed to the monitoring above and below the water
surface in the ever busy port of Rotterdam.

Pole and pontoon hulas in the port of Rotterdam
147
References
Admiraal, W., Van der Velde, G., Smit, H., Cazemier, W.G., 1993. The rivers
Rhine and Meuse in The Netherlands: present state and signs of ecological
recovery. Hydrobiologia, 265: 97-128.
Anonymous, 1999. De kwaliteit van de waterbodem in het Rotterdamse
havengebied 1981-1998. Rijkswaterstaat, Directie Zuid-Holland,
Gemeentelijk Havenbedrijf Rotterdam.
Anonymous, 2006. De kwaliteit van de waterbodem in het Rotterdamse
havengebied 1998-2005. Syncera Water B.V. In opdracht van Havenbedrijf
Rotterdam N.V. en Rijkswaterstaat, dienst Zuid-Holland.
Bij de Vaate, A., Breukel, R., Van der Velde, G., 2006. Long-term developments
in ecological rehabilitation of the main distributaries in the Rhine delta: fish
and macroinvertebrates. Hydrobiologia, 565: 229-242.
Bompais, X., Dardignacet, M.-J., Guy, P., 1991. Les filières pour l'élevage des
moules: (guide pratique). IFREMER, Plouzané, France. ISBN 2-905434-36-
8.
Borsje, B.W., Van Wesenbeeck, B.K., Dekker, F., Paalvast, P., Bouma, T.J.,
Van Katwijk, M.M., De Vries, M.B., 2011. How ecological engineering can
serve coastal protection. Ecological Engineering, 37: 113-122.
Brienne, H., 1960. Essai de culture de moules sur cordes dans le Pertuis Breton.
Science et Pêche, 83/84: 1-4.
Brzozowska, R., Sui, Z., Ho Kang, K., 2012. Testing the usability of sea mussel
(Mytilus sp.) for the improvement of seawater quality - An experimental
study. Ecological Engineering, 39: 133-137.
Burt, J., Bartholomew, A., Sale, P.F., 2011. Benthic development on large-scale
engineered reefs : A comparison of communities among breakwaters of
different age and natural reefs. Ecological Engineering, 37: 191-198.
Chavez, L.A., Chew, K.K., 1975. Mussel culture studies in Puget Sound,
Washington. Proceedings of the annual meeting - World Mariculture
Society, 6: 185-191.
Chesney, E.J. Jr., Iglesias, J., 1979. Seasonal distribution, abundance and
diversity in the inner Ria de Aosa, Northwest Spain. Estuarine Coastal
Marine Science, 8: 227-239.
Cook, E.J., Jahnke, M., Kerckhof, F., Minchin, D., Faasse, M., Boos, K., Ashton,
G., 2007. European expansion of the introduced amphipod Caprella mutica
Schurin 1935. Aquatic Invasions, 2: 411-421.
Crooks, J.A., 1998. Habitat alteration and community-level effects of an exotic
mussel, Musculista senhousia. Marine Ecology Progress Series, 162: 137-
152.

Chapter 6
148
Dankers, N.M.J.A., Dijkman, E.M., De Jong, M.L., De Kort, Meijboom, A., 2004.
De verspreiding en uitbreiding van de Japanse oester in de Nederlandse
Waddenzee. Alterra-rapport 909. Alterra, Wageningen.
De Wit, C.T., 1960. On competition. Verslagen landbouwkundig onderzoek, 66.
De Wit, P.C.B., Bolier, G., Paalvast, P., Van der Velde, G., De Vries, M.B., 2007.
Contribution to the development of ecological goals and indicators for the
aquatic environment in ports. Challenges in the port of Rotterdam area.
New Delta. Ports and nature, striking a new balance. Report Theme 2,
NEW! Delta project.
Dittmann, S., 1990. Mussel beds – amensalism or amelioration for intertidal
fauna? Helgoland Marine Research, 44: 335-352.
Duursma, E.K., Engel, H., Martens, Th.J.M. (eds.), 1982. De Nederlandse Delta.
Een compromis tussen milieu en techniek in de strijd tegen het water.
Uitgave van Natuur en Techniek, Maastricht, DIHO, Yerseke en RWS
Deltadienst, Den Haag.
Genzano, G.N., Excoffon, A.C., Acuna, F.H., Zamponi, M.O., 2003. Hydroid
colonies as primary substrata for recruits of the mussel Mytilus edulis
platensis front off Mar del Plata, Argentina. Ophelia, 57: 53-61.
Huisman, P., Cramer, W., Van Ee, G., Hooghart, J.C., Salz, H., Zuidema, F.C.,
1998. Water in the Netherlands. Netherlands Hydrological Society, Delft,
the Netherlands. ISBN 9080356522.
Iglesias, J., 1981. Spatial and temporal changes in the demersal fish community
of the Ria de Arosa (NW Spain). Marine Biology, 65: 199-208.
Jones, N.V., 1988. A dynamic estuary. Man, Nature and the Humber. Hull
University Press. ISBN 9780859584692.
Koivisto, M.E., Westerbom, M., 2010. Habitat structure and complexity as
determinants of biodiversity in blue mussel beds on sublittoral rocky shores.
Marine Biology, 157: 1463-1474.
Lesueur, P., Lesourd, S., 1999. Sands, channels and mudflats: sediment
transport and morphologic changes. The Seine-Aval scientific programme.
Leuven, R.S.E.W., Ragas, A.M.J., Smits, A.J.M., Van der Velde, G. (eds.), 2006.
Living rivers: trends and challenges in science and management.
Hydrobiologia, 565: 1-371.
Loo, L.O., Rosenberg, R., 1983. Mytilus edulis culture: growth and production in
Western Sweden. Aquaculture, 35: 137-150.
López-Jamar, E., Iglesias, J., Otero, J.J., 1984. Contribution of infauna and
mussel-raft epifauna to demersal fish diets. Marine Ecology Progress
Series, 15: 13-18.
Middelkoop, M., Van Hasselen, C.O.G., 1999. Twice a River. Rhine and Meuse
in the Netherlands. ISBN 9036952239. RIZA report 99.003.

Pole and pontoon hulas in the port of Rotterdam
149
Newell, R.I.E., 2004. Ecosystem influences of natural and cultivated populations
of suspension-feeding bivalve mollusks: a review. Journal of Shellfish
Research, 23: 51-64.
Mazouni, N., Gaertner, J.-C., Deslous-Paoli, J.-M., 2001. Composition of
biofouling communities on suspended oyster cultures: an in situ study of
their interactions with the water column. Marine Ecology Progress Series,
214: 93-102.
Odum, H.T., Odum, B., 2003. Concepts and methods of ecological engineering.
Ecological Engineering, 20: 339-361.
Paalvast, P., 1995. Oriënterend onderzoek naar de levensgemeenschappen op
hard substraat en op bij laag water droogvallende platen (zacht substraat)
in de Voordelta en het estuariene deel van de Noordrand. Ecoconsult. In
opdracht van Rijkswaterstaat, Directie Zuid-Holland.
Paalvast, P., 1998. Ecologische waardering van de oevers in het Rotterdamse
havengebied. Calandkanaal, Beerkanaal, Hartelkanaal en Nieuwe
Waterweg. Ecoconsult. In opdracht van het Rijksinstituut voor Kust en Zee,
Middelburg. Rijkswaterstaat, directie Zuid-Holland.
Paalvast, P., 2002. Historische ontwikkeling estuariene ecotopen in de
Noordrand van het benedenrivierengebied. In opdracht van het
Rijksinstituut voor Kust en Zee/RIKZ. Ecoconsult, rapportnr. 2002.02.
Paalvast, P., 2008. Monitoring van de effecten van de MOT olieverontreiniging in
januari 2007 op de levensgemeenschappen van het intergetijdengebied in
het Beer- en Calandkanaal in 2007. Ecoconsult rapportnr. 200801. In
opdracht van het Havenbedrijf Rotterdam NV.
Paalvast, P., Van der Velde, G., 2011. Distribution, settlement and growth of first
year individuals of the shipworm Teredo navalis L. (Bivalvia: Teredinidae) in
the port of Rotterdam area, the Netherlands. International Biodeterioration
and Biodegradation, 65: 379-388.
Pulfrich, A., 1996. Attachment and settlement of post-larval mussels (Mytilus
edulis L.) in the Schleswig-Holstein Wadden Sea. Journal of Sea Research,
36: 239-250.
Reky, Z., 1992. Die Elbe. Ein Lebenslauf. Eine Ausstellung des Deutschen
Historischen Museums Berlin in Zusammenarbeit mit dem Deutschen
Hygiene-Museum Dresden, dem Altonaer Museum, dem Museum für
Hamburgische Geschichte und dem Nationalmuseum Prag. 450 Seiten mit
300 Abbildungen. Nicolaische Verlagsanstalt Berlin.
Romero, P., Gonzalez-Gurriaran, E., Penas, E., 1982. Influence of mussel rafts
on spatial and seasonal abundance of crabs in Ria de Arousa, north-west
Spain. Marine Biology, 72: 201–210.

Chapter 6
150
Smits, A.J.M., Nienhuis, P.H., Saeijs, H.L.F., 2006. Changing estuaries,
changing views. Hydrobiologia, 565: 339-355.
Stuurgroep Regie Buitenruimte, 2004. Haven Natuur Plan 2004. Rekening
houden met de natuur, de gewoonste zaak voor wereldhaven Rotterdam.
Havenbedrijf Rotterdam N.V.
Thiel, M., Ulrich, N., 2002. Hard rock versus soft bottom: the fauna associated
with intertidal mussel beds on hard bottoms along the coast of Chile, and
considerations on the functional role of mussel beds. Helgoland Marine
Research, 56: 21-30.
Tydeman, P., 1996. Ecologisch profiel van de wilde litorale mosselbank (Mytilus
edulis L.). Watersysteemverkenningen 1996. Rapport RIKZ-96.026. ISBN
90-369-0415-3.
Van Haaren, T., Soors, J., 2009. Sinelobus stanfordi (Richardson, 1901): A new
crustacean invader in Europe. Aquatic Invasions, 4: 703-711.
Veverica, K., 1982. Culture of Mussels: A Review of the Status, Techniques,
Problems, and Possibilities. Department of Fisheries and Wildlife, Oregon
State University. MSc-thesis.
Wolff, W.J., 1978. The degradation of ecosystems in the Rhine. In: The
breakdown and restoration of ecosystems. Holdgate, M.W., Woodman, M.J.
(eds.). Plenum Press, New York, 167-187.
Wolff, W.J., 2005. Non-indigenous marine and estuarine species in The
Netherlands. Zoölogische Mededelingen, Leiden 79, 1-116.


Chapter 7
Synthesis
Peter Paalvast

Chapter 7
154

Synthesis
155
Broader perspective and developments elsewhere
Over the last two millennia the original estuarine area of the river Rhine and
Meuse radically changed by natural processes such as sea level rise,
sedimentation, erosion and vegetation development but in particular in the last
century by infrastructural works as new waterways, damming, harbour
construction and dredging leading to changes in tidal regimes and discharges of
river water via the various distributaries (chapter 1).
The loss of the natural soft substrate intertidal ecotopes, the rise of hard
substrate intertidal ecotopes (Fig. 1) and changes from natural to manmade
estuarine waters during the 19th and 20
th century in the area (the Noordrand)
where the port of Rotterdam nowadays is situated are described in detail
(chapter 2). Besides the impact of harbour extension and “improvement” of the
rivers for navigation major morphological changes in the water systems in a few
particular periods drastically affected the soft sediment ecotopes of the
Noordrand. The excavation of the Nieuwe Waterweg and the disconnection of
the Scheur from the Brielsche Maas together with the necessary land
reclamation between 1868 and 1872 reduced the soft sediment estuarine area
of the Brielsche Maas by 44%, of the Nieuwe Waterweg by 28% and that of the
total area by 33% in just 4 years! However the closure of the Brielsche Maas in
1950 combined with the development of the Botlek harbour system was in fact
the final blow for this part of the estuary and compared to 1835 less than 1% of
the soft sediment estuarine ecotopes remained. With the development of
Europoort and Maasvlakte 1 the last untouched dunes were wiped off the map.
Within the Noordrand due to human interventions over time the hydrology
changed from one driven by the tides and river discharge to a hydrology that is
controlled by man via the management of the Haringvliet sluices. The entire
package of historical interventions has led to a significant increase in tidal range
and a further penetration of the salt wedge land inwards (chapter 1).
In other European estuaries similar events took place. Large parts of the
intertidal zone were reclaimed, ports developed exponentially in the 20th century
and deepening of the navigation channel for the ever growing vessels became
common practice. A number of examples are discussed below.
In the Dutch-Belgian Westerschelde estuary between 1800 and 1995 the
estuarine area (water surface included) dropped from some 450 km2 to 310 km
2
by polderisation (Van der Weck, 2007). For navigation to mainly Antwerpen
(Belgium) the navigation channel has been deepened several times. The
historical changes in tidal range were the strongest 80 km stream upwards in the
estuary near Antwerpen where the mean tidal range changed from 3.25 m in

Chapter 7
156
1650 to 4.5 m in 1850 and 5.4 m in 2000 (Van den Berg et al., 1996, De Kramer,
2002).
In the Elbe-estuary most of the intertidal habitats were turned into land for
agriculture before 1500 (DHBM, 1992). In the 20th century however 66% of the
land outside the dikes, 11% of the intertidal zone and 27% of the shallow water
area disappeared. The growth of the port of Hamburg and dredging for greater
depth of the navigation channel led near Hamburg to an increase of the average
tidal range from 1.8 m to 3.5 m between 1840 and 2000 with the highest
increase between 1950 and 2000 (ARGE-ELBE, 2001).
In the Seine estuary the first embankments started in mid 19th century and at the
end of that century the first works for the stabilization of the navigation channel
started and continued until 1975 (Guézennec, 1999, Foussard et al., 2010). In
1834 the intertidal soft sediment zone of the Seine estuary near the mouth
amounted 13,000 ha and this area has been reduced to 3,000 ha in 1985
(Avoine, 1981, Avoine, 1985) and to 2,900 ha in 1992 a total reduction of 78%
(Avoine, 1995). There are no good time series of water levels in the Seine
estuary, but due to the many human interventions in the Seine water system the
low water level dropped 1.6 m at Rouen (120 km from the mouth, current tidal
range approx. 2.2 m) and 1.0 m at Tancarville (20 km from the mouth, current
tidal range approx. 6 m). The high water levels remained similar (data provided
by GIP-Seine-Aval, Rouen, France). The volume of the estuary at high tide
dropped from 1.6*109 m
3 to 0.84*10
9 m
3. As a consequence of all the
interventions the penetration of the tide stream upwards was reduced and the
turbidity zone and salinity limit of 0.5 moved 40 km downstream between 1955
and 1978 (Guillard and Romana, 1984). A particular phenomenon the
“mascaret”, a tidal bore, is now no longer present in the estuary upstream le
Havre, because of two large training walls on both sides of the navigation
channel in the outer estuary (Avoine, 1995).
Within the Loire estuary the intertidal soft sediment habitats amounted 5,423 ha
in 1821. Around 1992 64% of the intertidal zone had disappeared as a result of
human activity (Migniot, 1997) such as port development, but also sand
extractions upstream Nantes (Marion, 1998, Brière et al., 2010). The navigation
channel was considerably deepened (from 10 m to 18 m near St-Nazaire)
between 1980 and 2000 (Anonymous, 1984, Sogreah, 2006). Between the
beginning and the end of the 20th century the tide influence upstream the Loire
changed from 63 km to 105 km. Also the salinity front moved further upstream
from 36 km in 1957 to 70 km in 1992 (Marion, 1998). The maximum tidal range
changed at Nantes from 1881 from 2 m to 7 m in 1992!

Synthesis
157
To protect the infrastructural works such as harbours, quays and shores in the
estuary a variety of hard substrates is used including wood. Today in the
brackish and saline waters in the Netherlands only tropical hardwood is used.
But no matter what type of hardwood is chosen it will be over time impaired to
some degree by shipworm attacks (Koninklijk Instituut voor de Tropen, 1972).
The shipworm, Teredo navalis, a wood boring bivalve, has been found also
recently in wooden panels in the Rotterdam port area (Fig. 1) in the harbours of
Europoort and Maasvlakte 1, the Dintelhaven at the Hartelkanaal, the
Berghaven at the Nieuwe Waterweg and at one occasion some 20 km upstream
the mouth of the estuary in the Botlek harbour system (see Fig. 1, Chapter 3). It
can be questioned if this shipworm has always been in the area, since its first
appearance in this part of the Delta region in 1730 where nowadays the port of
Rotterdam is situated. Several factors determine the shipworm to be able to
establish and maintain. Crucial are salinity and water temperature. The
shipworm thrives from a salinity of 10 and reproduces when the water
temperature is higher than 11 to 12 ˚C. The optimum water temperature for the
shipworm lies in the range of 15 ˚C and 25 ˚C. Between the end of April and the
end of October the current water temperatures in the Rotterdam port area are in
this range (Paalvast and Van der Velde, 2011) and it is unlikely that since its first
appearance in the Dutch coastal waters temperatures would have been limiting.
The historical isohalines that are presented in the introduction for 1907 and 1908
and before 1970 justify the conclusion that before 1970 the shipworm was
unable to settle in Brielsche Maas, Nieuwe Waterweg, Scheur and Nieuwe
Maas. A possible exception is the Berghaven at Hoek van Holland. Around 1970
Beer- and Calandkanaal and adjacent harbours (Europoort and Maasvlakte 1)
were connected to the sea and the Nieuwe Waterweg, and turned into a large
polyhaline area. From that moment, the shipworm had opportunities in the area
to settle. Perhaps the animal was absent in the first 10 to 15 years after 1970
due to the severe pollution of river water and sediment, but especially after 1985
with the improved water quality it would have settled at first in driftwood and
softwood pontoons. By weathering of many hardwood mooring poles and
fenders made from basralokus and azobé, the shipworm also could settle
therein. This is evidenced by the intense degree of shipworm infection in the
outer three to five cm of the many hardwoods that were dragged out of the Beer-
and Calandkanaal in recent years (personal observations by the author).
Paalvast and Van der Velde (2011) suggested that T. navalis individuals drilling
in hardwood in the port of Rotterdam need extra energy (chapter 3).
The average body length growth of first year shipworms in the Beer- and
Calandkanaal in 2006 was twice as high as observed by Kristensen (1979) in
the waters around Denmark. Such data are of particular interest in order to
Chapter 7
158
estimate the potential damage that may inflict borers. The results of this study, in
particular the rate of body length growth of the shipworm, have drawn the
attention of archaeologists (Eriksen et al., 2013), that are deeply concerned
about the expansion of the shipworm, T. navalis, in the southern Baltic Sea
(Gregory, 2010). T. navalis has been spreading out from the western part of the
Baltic since a penetration of salt water from the North Sea in 1993 (Manders and
Luth, 2004). The fear is that this further expansion is the result of warming of sea
water due to global climate change and that this could lead to a massive loss of
unique archaeological shipwrecks (Bjordal et al., 2012). In the Baltic Sea around
100,000 shipwrecks are present of which at least 6,000 are of high
archaeological value (Olsson, 2006). Climate change scenario simulations
however show a future decrease in both surface and bottom salinity, a decrease
that is mainly due to the expected increase in river run-off and a deepening of
the permanent halocline (Krämer et al., 2013). So the expansion might be a
temporary one once the salinity drops below survival limits as a result of more
precipitation and higher river discharges, but by then many historical ships might
have been destroyed completely.
Another location where several shipworm species, including T. navalis, are
active is the Venice Lagoon. In the lagoon are about 22,000 wooden navigation
marks (so called briccoles) and between 5,000 and 10,000 mooring poles that
are threatened by shipworms (Ghirardini et al., 2010).
The evidence that in the port of Rotterdam area shipworms feed mainly on
seston is provided by the stable isotope analysis (chapter 4). The results
showed stable isotope values (δ13
C, δ15
N) for T. navalis that are similar to those
of the filter feeders Mytilus edulis and Crassostrea gigas, which species were
attached to the wood were the shipworm T. navalis was boring in. This is the first
proof that the main food source of T. navalis is seston and that its presence in
wood is for shelter (Fig. 1) rather than food in spite of symbiotic probably
cellulolytic bacteria (Popham and Dickson, 1973).
Many old quays in the eastern part of the port of Rotterdam are build on fir and
oak wood. Both types of wood can be easily destructed by T. navalis. At low
river discharge, that mainly occur during summer, salinities at the bottom of the
harbours reach values within the range for shipworm survival and growth
(chapter 3). Damage of wooden structures in the eastern part of the port of
Rotterdam might occur if low river discharges persist over time. Longer periods
of low river discharges are predicted caused by future climate change. This
creates possibilities for the shipworm to extend upstream in the port of
Rotterdam area. This possible extension in the eastern part of the port of
Rotterdam with increasing risk of damage is elaborated using four different
climate scenarios (chapter 5, Fig. 1). Based on the low river discharges that

Synthesis
159
have occurred under the prevailing climate conditions with the associated
salinity in the eastern harbour area, the risk of damage has been estimated in
the order of once every 36 years. This seems a low risk but given the speed at
which wooden foundations of quays may be affected by the shipworm, it might
lead to serious damage. The worst case KNMI scenario (W+) is an air
temperature rise of 2 ˚C with a strong change in air circulation over Europe
towards 2050 compared to 1990. Under this scenario the risk of damage
increases to once every 3 years. However, even at no or just minor global
warming, measures should be taken to protect vulnerable wooden constructions
from shipworm attacks. Nowadays many harbours in the eastern part of the port
of Rotterdam lose their function as the cargo is more and more handled at
Maasvlakte 1 and 2 because of the growing size of ships. By shoaling of
harbours that have fallen into disuse with sediment dredged elsewhere to a level
at which the wooden foundations of the old quays are below the sediment
bottom they can be protected from attacks by the shipworm.
The pollution of the port area, that reached the highest levels in the 1960s and
1970s, was not only the result of untreated discharges by industry in the area
itself, but was primarily carried in by the Rhine from industrial, urban, agricultural
and mining areas in the river catchment. The pollution of sediment and water
was so severe that virtually nearly all life from the water disappeared. The
heavily polluted harbour sludge was initially stored in dump sites along the Oude
Maas, for which estuarine meadows, willow coppice and reed and rush beds
were sacrificed. A large dump site is located on the territory of the city
Vlaardingen with an area of nearly 600 hectares filled with a several metres thick
layer of contaminated harbour sludge dumped in the period 1958-1970. Also,
large quantities of heavily contaminated harbour sludge were dumped in the sea
near the coast in the 1970s and 1980s. Partly due to protests from the
environmental movement two large storage depots for contaminated harbour
sludge were built on the Maasvlakte 1 called Slufter and Papegaaienbek (Fig.
11, chapter 1). In 2006 the harbour sludge (1.2 million m3) of the Papegaaienbek
was pumped to the Slufter. The policy of the port of Rotterdam, international
collaboration and a stricter environmental legislation drastically reduced the
pollution and most of the nowadays dredged harbour sludge can be discharged
without much environmental risk at sea. The improvement of the aquatic
environment after 1971 has led to the (re)colonisation of many species in the
estuarine ecosystem of the Rotterdam port area and as a consequence
biodiversity increased. The increase in biodiversity positively influences
ecosystem services such as water quality and nutrient recirculation by filtration,
shore protection due to wave attenuation by helophytes and other macrophytes,

Chapter 7
160
but also by sessile animals such as oysters and mussels in the sub- and
intertidal zone. Recreation benefits by an increasing variety of birds that can be
observed feeding in the harbours and along the shores and the increasing
number of fish species has made the port of Rotterdam an important site for
recreational fishing. However, there are also practical disadvantages such as the
rapid fouling of pontoons and buoys that need more frequent cleaning. Amongst
the flora and fauna that settled in the port of Rotterdam area are many invasive
alien species. Some of them like the Japanese seaweed, Sargassum muticum,
has not developed into a pest outcompeting native species as it does in many
other locations where it has been introduced (Critchley et al., 1990), and might
be considered in the Rotterdam port as habitat enrichment of the polyhaline
harbours. Other species like the invasive Asian shore crab Hemigrapsus takanoi
seems to replace the native Common shore crab, Carcinus maenas. Gollasch et
al. (2008) summarises the introduced species in the North Sea region and their
dominant introduction vectors. For the port of Rotterdam the main vectors are
ship hulls and ballast water. Both the intake and discharge of ballast water in the
port of Rotterdam still takes place without treatment although many steps are
taken forwards to do treatment on a global basis (Gollasch et al., 2007, David
and Gollasch, 2008, Tsolaki and Diamadopoulos, 2009). The port of Rotterdam
is mainly a ballast water exporting port, with an intake more than twice as much
from, than the discharge into the harbour system (Anonymus, 2008). Both intake
(77.2 million m3 per year) and discharge (34.8 million m
3 per year) quantities are
considerable. For some harbours this means that on a yearly basis its total
volume is used for the intake of ballast water and half of its volume for the
discharge of ballast water.
The hard substrate and soft water bottom in the western part of the port of
Rotterdam including the Botlek, the harbours of Vlaardingen and Maassluis and
the river banks of Nieuwe Maas, Scheur and Nieuwe Waterweg below the high
water level show a very low species richness because of daily and seasonal
salinity fluctuations (personal observations). The hard substrate (Paalvast, 1998)
and the soft sediment bottom (Crayemeersch et al., 1998) of the Beer- and
Calandkanaal harbour system are much richer in species because of more
stable high salinity conditions. The infra soft-bottom sublittoral benthic
macroinvertebrate fauna however is unable to evolve to stable communities as
the sea floor is continuously disturbed by dredging. To give an impression about
the quantities involved, the sediment transport of the river Rhine towards the
Noordrand is in the order of 3-4 million tonnes dry weight per year of which
roughly half becomes deposited in the port, while the remainder is directly
transported to the North Sea (Salomons, 2001).The amount of marine sediments

Synthesis
161
entering the port, however, exceeds by far the contribution from the river which
leads to a total amount of dredging of about 20 million m3 per year. This means
that almost 1 metre of the top layer of the whole sea floor of the Beer- and
Calandkanaal harbour system is removed on a yearly basis.
The underwater environment of the port of Rotterdam is designed for harbour
and industrial activities only. It is mainly made up of concrete and steel
structures that stand perpendicular into the water column creating a dull
monotonous environment. The fouling communities on these underwater
structures in the polyhaline western part of the port of Rotterdam in 1998 were
dominated by Mytilus edulis, the Blue mussel. From approximately that year
Crassostrea gigas, the Pacific oyster, spread over the harbours and settled on
all the hard substrate from subtidal to half way the intertidal zone, at the same
time outcompeting the Blue mussel (Paalvast personal observations between
1995 and 2012). The Blue mussel is nowadays almost confined to a zone of
about one metre around the low water level. The results of the pilot with the pole
hulas (hula skirt like filamentous structures with 6 mm thick and 60 cm long
strings attached around poles) and pontoon hulas (raft like structures with 15
mm thick and up to 150 cm long ropes) (chapter 6, Fig. 1), hanging in the water
column as an enrichment of the underwater habitat, clearly showed that they can
strengthen the weakened position of the Blue mussel in the port of Rotterdam.
The Pacific oyster was unable to settle on the strings and ropes, and was also
absent on poles on which hulas were attached. On both strings and ropes the
Blue mussel developed in short time and was the dominating species with
coverage rates of around 100% with a wet biomass of over 2 kg per m rope after
four months of growth. Within these dense layers of blue mussels many mobile
soft-bottom amphipods and young ragworms were found in the interstices that
were filled with sediment. This shows that in harbour systems where the top
layer of the sea floor is continuously disturbed by the propellers of ships, and
where dredging is common practice, hula systems potentially offer a refugium for
animals that normally inhabit the soft sediments on the sea floor. It also shows
the potential of hula systems to improve biodiversity and increase bioproductivity
from which the whole estuarine harbour ecosystem might benefit.
The article “Pole and pontoon hulas: an effective way of ecological engineering
to increase productivity and biodiversity in the hard-substrate environment of the
port of Rotterdam” has been noticed in China and Australia and the used
method is considered also here as a possible innovative tool in harbour design
for the mitigation of the loss of marine or estuarine nature (Ma et al., 2012,
Grech et al., 2013). Hula like structures can also be applied in nutrient-enriched
fresh water in combination with floating artificial reed beds and a pilot is currently
underway in a UK reservoir (Mclaughlan and Aldridge, 2013).

Chapter 7
162
Future developments
Between 1980 and 2005, the water temperature at the bottom of the North Sea
locally increased between 1 and 6 ˚C with direct effects on several fish species
in a northward shift of their distribution or to greater depths (see Wiltshire and
Manly, 2004, Perry et al., 2005, Marsh and Kent, 2006, Dulvy et al., 2008). This
increase in water temperature also affects the distribution of marine borers. In
the 1960s and 1970s T. navalis was the only shipworm species in the Tagus
estuary. In 2009 T. navalis was no longer observed and was displaced by
Lyrodus pedicellatus and Nototeredo norvegica (Borges et al., 2010). L.
pedicellatus has already expanded northwards and has been found near
Portsmouth in England. L. pedicellatus is active all year round (Murphy et al.,
Figure 1 Main results of this study.

Synthesis
163
2009). It should not be ruled out that in the near future one of these species
might settle in wood in the deeper parts of the polyhaline area of the port of
Rotterdam, e.g. in the vicinity of the cooling water discharge area of the
Maasvlakte power station.
From hell to haven: Improving the ecosystem of the port of Rotterdam
On the 2nd of October 2013 the port of Rotterdam, Rijkswaterstaat, the City of
Rotterdam and the World Wildlife Fund signed an agreement to develop over a
period of 10 years a nature friendly intertidal zone along the south bank of the
Nieuwe Waterweg with a length of 5 km. Within this zone a brackish vegetation
and intertidal sand and mud flat will develop over time. The total surface area
accounts some 20 ha. This is only 0.4 percent of the 4,745 ha of soft estuarine
intertidal ecotopes that existed around 1835 in the Noordrand, but this action
might be a first step towards ecological restoration in this part of the Rhine-
Meuse estuary. However, more measures can be taken along Scheur and
Nieuwe Waterweg by overlaying the bare banks above high water with sediment
in particular sand and so creating artificially a dune habitat for plants and
associated fauna. Along the shores of the Scheur and Nieuwe Waterweg several
small spots are present where sediment has been left or has accumulated and
such communities developed (Paalvast, 1998, 2001).
As a measure to limit the risk of shipworm attacks the shoaling of harbours in the
eastern part of the port of Rotterdam that have become in disuse, has been
suggested above. The depth of these harbours can easily be reduced to about 2
m at low tide using dredged material from elsewhere in the harbour area (for
example the Waalhaven). This will lower the channel detention of the area and
thus the salt intrusion on the river. Disused quays that are in bad state can be
demolished and turned into nature friendly tidal banks, so restoring gradients
formerly common to estuaries. However economic activities do not allow
shoaling of harbours and demolishing quays everywhere in the port of
Rotterdam, but the pole and pontoon hula experiment demonstrated that with
rather simple measures the ecosystem can be improved. Pole hulas can be
easily attached to poles throughout the port of Rotterdam from the fresh and
oligohaline waters in the eastern to the polyhaline waters in the western part
creating a structure rich environment with a large surface for all sorts of algae
and macroinvertebrate fauna to settle and grow. Other mobile macroinvertebrate
fauna such as shrimps, prawns and crabs but also fish and diving water fowl will
profit from the increase in primary and secondary production that structural
enrichment and increase of intertidal and subtidal surface area will bring. If
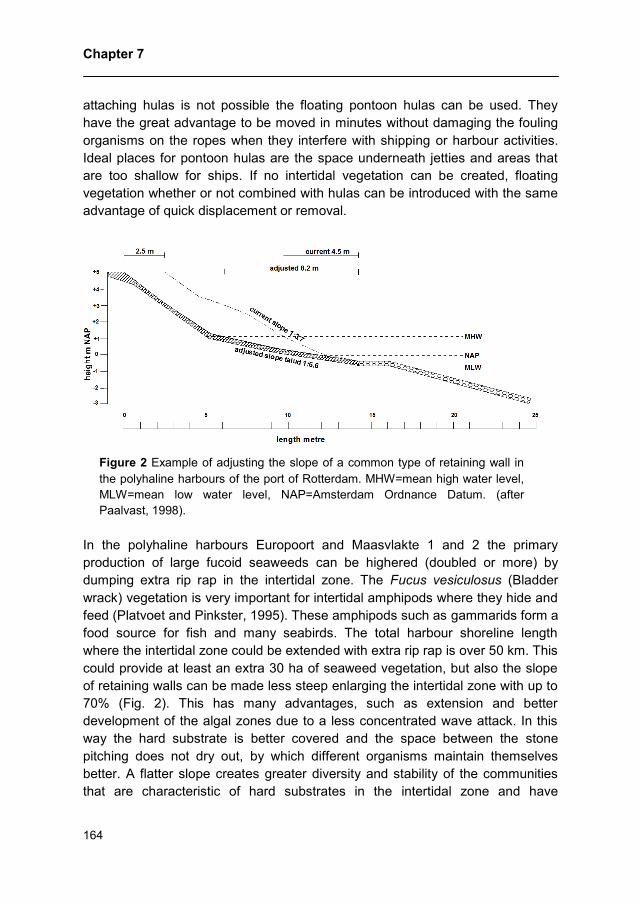
Chapter 7
164
attaching hulas is not possible the floating pontoon hulas can be used. They
have the great advantage to be moved in minutes without damaging the fouling
organisms on the ropes when they interfere with shipping or harbour activities.
Ideal places for pontoon hulas are the space underneath jetties and areas that
are too shallow for ships. If no intertidal vegetation can be created, floating
vegetation whether or not combined with hulas can be introduced with the same
advantage of quick displacement or removal.
In the polyhaline harbours Europoort and Maasvlakte 1 and 2 the primary
production of large fucoid seaweeds can be highered (doubled or more) by
dumping extra rip rap in the intertidal zone. The Fucus vesiculosus (Bladder
wrack) vegetation is very important for intertidal amphipods where they hide and
feed (Platvoet and Pinkster, 1995). These amphipods such as gammarids form a
food source for fish and many seabirds. The total harbour shoreline length
where the intertidal zone could be extended with extra rip rap is over 50 km. This
could provide at least an extra 30 ha of seaweed vegetation, but also the slope
of retaining walls can be made less steep enlarging the intertidal zone with up to
70% (Fig. 2). This has many advantages, such as extension and better
development of the algal zones due to a less concentrated wave attack. In this
way the hard substrate is better covered and the space between the stone
pitching does not dry out, by which different organisms maintain themselves
better. A flatter slope creates greater diversity and stability of the communities
that are characteristic of hard substrates in the intertidal zone and have
Figure 2 Example of adjusting the slope of a common type of retaining wall in
the polyhaline harbours of the port of Rotterdam. MHW=mean high water level,
MLW=mean low water level, NAP=Amsterdam Ordnance Datum. (after
Paalvast, 1998).

Synthesis
165
therefore within the artificial harbour system higher values for nature than steep
slopes.
There are also many variations possible in the way concrete, basalt or limestone
blocks of the revetment of the slope of retaining walls can be placed that are
washed twice a day by the tides. If revetment blocks are placed in an alternating
manner (Fig. 3) the habitat of the eulittoral and supralittoral zone becomes more
differentiated, sediment and organic material accumulates providing room to
many more species compared to blocks placed in a uniform manner. Also the
variation in type of blocks and space between them is crucial for determining
biodiversity and productivity (Borsje et al., 2011).
Paalvast (1998, 2005) proposed the creation of artificial tide pools in the
eulittoral zone of Beer- and Calandkanaal. In 2011 the first artificial tide pools
were constructed despite the warning of the author that they were built at a
location that was characterized by heavy sedimentation of sand. The argument
to construct the tide pools anyway was motivated by the fact that the computer
model did not show any significant sedimentation. Within a few months the pools
were completely filled with sand. This proves once again that the results of
model calculations should be compared with the experience gained in the field
and that computer models alone form a weak base for nature development.
Quays are constructed for the mooring of vessels that should not be hampered
by structures to improve the ecosystem. With simple measures much
improvement in structure richness can be gained within the space below many
of the quays. However, roughening of concrete subtidally as a measure to
Figure 3 Setting revetment blocks in an alternating manner to create a more
differentiated habitat on the slope of retaining walls.

Chapter 7
166
improve structure richness, apart from hulas, is useless as within a short period
of time the fouling organisms themselves and their remains (dead barnacles,
shells of oysters) turn the smooth concrete into a rough layer. The same
accounts for the intertidal zone of perpendicular concrete quays. An experiment
in a polyhaline harbour of the port of Rotterdam with concrete slabs with holes,
slits and rough structure to improve biodiversity and production did not show any
improvement in fouling compared with smooth concrete (Paalvast, 2010). In all
cases the fouling community consisted of a thin layer of small green algae and
barnacles in low densities. The main reason for the poor development is the long
low water period of about 8 hours causing the fouling community to dry out
completely. Only a few species withstand these conditions. More success is to
be expected of larger open structures in quay walls around mean low water
where communities do not dry out because of the lapping of the water (see
Paalvast, 1998).
When the above mentioned possibilities for the improvement of biodiversity and
productivity are carried out, the port of Rotterdam might become a haven for
estuarine nature!
References
Anonymous, 1984. Rapport final du comité scientifique pour l'environnement de
l'estuaire de la Loire. Rapports Scientifiques et Techniques 55. Publications
du centre national pour l’exploitation des océans.
Anonymous, 2008. Ballast water quantities Port of Rotterdam. Ballast water
intake and discharge February 2008. Royal Haskoning, the Netherlands.
Avoine J., 1981. L’estuaire de la Seine: Sédiments et dynamique sédimentaire.
Thèse. L’Universitité de Caen, Caen, France. 236 pp. + annexes.
Avoine, J., 1985. Évolution hydrodynamique et sédimentaire de l’estuaire de la
Seine. Actes du colloque: L’estuaire de la Seine, enjeux écologique et
économiques. Gemel-DRAE-CIQV.
Avoine, J., 1995. Port autonome Du Havre - Synthèse des connaissances sur
l'estuaire de la Seine - Partie 2 – Sédimentologie.
Björdal, C.G., Nilsson, T., 2008. Reburial of shipwrecks in marine sediments: a
long-term study on wood degradation. Journal of Archaeological Science,
35: 862-872.

Synthesis
167
Björdal, C.G., Gregory, D., Manders, M., Al-Hamdani, Z., Appelqvist, C.,
Haverhand, J., Dencker, J., 2012. Strategies for protection of wooden
underwater cultural heritage in the Baltic Sea against marine borers. The
EU Project ‘WreckProtect’. Conservation and Management of
Archaeological Sites, 14: 201-214.
Becker, G., 1959. Biological investigations on marine borers in Berlin–Dahlem.
In: Marine boring and fouling organisms. Ray, D.J. (ed.), University of
Washington Press, Seattle, 62–76.
Bjordal, C.G., Nilsson, T., 2008. Reburial of shipwrecks in marine sediments: a
long-term study on wood degradation. Journal of Archaeological Science,
35: 862-872.
Borges, L.M.S., Valente, A.A., Palma, P., Nunes, L., 2011. Changes in the wood
boring community in the Tagus estuary: a case study. Marine Biodiversity
Records, 3: 1-7.
Böhnke-Henrichs, A., De Groot, R., 2010. A pilot study on the consequences of
an Open Haringvliet Scenario for changes in ecosystem services and their
monetary value. Wageningen University, 79 pp.
Borsje, B.W., Van Wesenbeeck B.K., Dekker, F., Paalvast, P., Bouma, T.J., Van
Katwijk, M.M., De Vries, M.B., 2011. How ecological engineering can serve
in coastal protection. Ecological Engineering, 37: 113-122.
Brière, C., Giardino, A., Winterwerp, H., 2010. Analyse de la morphologie du
chenal de Nantes et étude de sa restauration. Phase 1 : Evolutions
passées et fonctionnement actuel. Programme de restauration de l’estuaire
en aval de Nantes - études préalables à la tranche expérimentale - Année
2009. Deltares, Delft.
Church, J.A., White, N.J., 2011. Sea-level rise from the late 19th to the early
21st century. Surveys in Geophysics, 32: 585-602.
Craeymeersch, J.A., Brummelhuis, E.B.M., Dimmers, W., Sistermans, W., 1998.
Macrobenthos in het Rotterdamse havengebied (Nieuwe Waterweg,
Beerkanaal, Calandkanaal). NIOO-CEMO Rapporten 1998-4.
Critchley, A.T., Farnham, W.F., Yoshida, T., Norton, T.A., 1990. A bibliography
of the invasive alga Sargassum muticum (Yendo) Fensholt (Fucales,
Sargassaceae). Botanica Marina, 33: 551-562.
David, M., Gollasch, S., 2008. EU shipping in the dawn of managing the ballast
water issue. Marine Pollution Bulletin, 56: 1966-1972.
De Kramer, J., 2002. Waterbeweging in de Westerschelde, een literatuurstudie.
ICG-rapport 02/6, Universiteit Utrecht, Faculteit Ruimtelijke
Wetenschappen, ISBN 90-77079-08-4. 69 pp.
Dulvy, N.K., Rogers, S.I., Jennings, S., Stelzenmüller, V., Dye, S.R., Skjoldal,
H.R., 2008. Climate change and deepening of the North Sea fish

Chapter 7
168
assemblage: a biotic indicator of warming seas. Journal of Applied Ecology,
45: 1029-1039.
Eriksen, A.M., Gregory, D.J., Botfeldt, K., 2013. The survival of Teredo navalis L.
in timber wrapped in TERRAM4000 and a plastic membrane. International
Biodeterioration & Biodegradatio, 86 : 86-91.
Foussard, V., Cuvilliez, A., Fajon, P., Fisson, C., Lesueur, P., Macur, O., 2010.
Evolution morphologique d’un estuaire anthropisé de 1800 à nos jours. GIP
Seine-Aval, Rouen, France, 45 pp.
Gregory, D., 2010. Shipworm Invading the Baltic? International Journal of
Nautical Archaeology, 39: 431-431.
Ghirardini, A.V., Losso, C., Libralato, G., Zanella, M., Keppel, E., Sigovini, M.,
Tagliapietra, D., 2010. Sea water piling: Traditional or alternative materials?
An integrated biological and exotoxicological evaluation in Venice Lagoon
(Italy). Rapport Commission International Mer Méditerranée, 39: 697.
Gollasch, S., David, M., Voigt, M., Dragsund, E., Hewitt, C., Fukuyo, Y., 2007.
Critical review of the IMO international convention on the management of
ships’ ballast water and sediments. Harmful algae, 6: 585-600.
Gollasch, S., Haydar, D., Minchin, D., Reise, K., Wolff, W.J., 2008. Introduced
aquatic species of the North Sea coasts. Biological invasions in Marine
Ecosystems: Ecological Management and Geographic Perspectives,
Springer, Berlin, 507-528.
Grech, A., Bos, M., Brodie, J., Coles, R., Dale, A., Gilbert, R., Hamann, M.,
Marsh, H. Neil, K., Pressey, R.L., Rasheed, M.A., Sheaves, M., Smith, A.,
2013. Guiding principles for the improved governance of port and shipping
impacts in the Great Barrier Reef. Marine Pollution Bulletin, 75 : 8-20.
Guézennec, L., 1999. Hydrodynamique et transport en suspension du matériel
particulaire fin dans la zone fluviale d’un estuaire macrotidal: l’exemple de
l’estuaire de la Seine (France). Thèse de l’Université de Rouen. Agence de
l’Eau Seine Normandie.
Guillaud, J.F., Romana, A., 1984. La gestion des estuaires en France. Norois,
121, 97-112.
Haring, J., 1977. De geschiedenis van de ontwikkeling van de waterbeweging en
het profiel van de rivieren in het Noordelijke Deltabekken over de perioden
1870 - 1970 – 1976. Deel I – De periode 1870 – 1970. Rijkswaterstaat.
Directie Waterhuishouding en Waterbeweging. District Zuidwest.
Memorandum No. 44.011.02.
Krämer, I., Borenäs, K., Daschkeit, A., Filies, C., Haller, I., Janßen, H., Karstens,
S., Kūle, L., Lapinskis, J., Varjopuro, R., 2012. Climate change impacts on
infrastructure in the Baltic Sea Region. Coastline Reports, 55.

Synthesis
169
Koninklijk Instituut voor de Tropen, 1972. Shipworm experiments during the
period 1938-1970. A comparative study of the resistance of tropical timber
to shipworm. Communication No. 62 of the Department of Agricultural
Research.
Ma, C., Wang, Y., Zhang, X.C., Zhang, G.Y., 2013. Suitability analysis of
ecological restoration for coastal area under transportation construction.
Applied Mechanics and Materials, 256: 1965-1968.
Manders, M., Luth, F., 2004. Safeguarding. Moss Project Final Report.
Mclaughlan, C., Aldridge, D.C., 2013. Cultivation of zebra mussels (Dreissena
polymorpha) within their invaded range to improve water quality in
reservoirs. Water Research, 47: 4357-4369.
Marion, L., 1998. La description des zone d’intérêt biologique des estuaires. In:
Les estuaires français. Évolution naturelle et artificielle. Auger, C., Verrel,
J.L. (eds.). Éditions IFREMER. ISBN 2-905434-95-3. 29-44.
Marsh, R., Kent, E., 2006. Impacts of climate change on sea temperature.
Marine Climate Change Impacts Annual Report Card 2006: Online
Summary Reports (www.mccip.org.uk) Buckley, P.J., Dye, S.R., Baxter,
J.M. (eds.). Marine Climate Change Impacts Partnership, Lowestoft, UK.
Migniot, C., 1997. Bilan de l’hydrologie et de l’hydrosédimentaire de l’estuaire de
la Loire au cours des deux dernières décennies. In : Hydrosédimentaire.
Estuaire de la Loire. Rapports de synthèse de l’Apeel 1984-1994. Migniot,
C., Le Hir, P. (éds.), 1: 1-62.
Murphy, P., Thackray, D., Wilson, E., 2009. Coastal heritage and climate change
in England: assessing threats and priorities. Conservation and Management
of Archaeological Sites, 11: 9-15.
Olsson, A., 2006. The Rutilus Project. Strategies for a sustainable development
of the underwater cultural heritage in the Baltic Sea region. The Swedish
Maritime Museums. Stockholm.
Paalvast, P., 1998. Ecologische waardering van de oevers in het Rotterdamse
havengebied. Calandkanaal, Beerkanaal, Hartelkanaal en Nieuwe
Waterweg. Ecoconsult. In opdracht van het Rijksinstituut voor Kust en Zee,
Middelburg. Rijkswaterstaat, directie Zuid-Holland.
Paalvast, P., 2001. Hard op weg naar zacht. Natuurvriendelijk experimenteren
met harde oeverconstructies. Een discussienotitie. In opdracht het
Gemeentelijk Havenbedrijf Rotterdam.
Paalvast, P., 2005. Voorstel voor de inpassing van kunstmatige getijdenpoelen
in het aan te passen oevertalud aan de kopse kant van de Hartelhaven. In
opdracht van het Havenbedrijf Rotterdam NV. Ecoconsult, rapport nr. 2005-
02.

Chapter 7
170
Paalvast, P., 2010. Vrijhangende substraten en Ecobetonplaten. Monitoring
2009. In opdracht van Deltares. Ecoconsultrapport nr. 2010-02.
Perry, A.L., Low, P.J., Ellis, J.R., Reynolds, J.D., 2005. Climate change and
distribution shifts in marine fishes. Science, 308: 1912-1915.
Platvoet, D., Pinkster, S., 1995. Changes in the amphipod fauna (Crustacea) of
the Rhine, Meuse and Scheldt estuary due to the ‘Delta Plan’ coastal
engineering works. Netherlands Journal of Aquatic Ecology, 29: 5-30.
Popham, J.D., Dickson, M.R.,1973. Bacterial associations in the teredo Bankia
australis (Lamellibranchia: Mollusca). Marine Biology, 19: 338-340.
Sogreah, 2006. Mission d’étude, d’approfondissement et d’évaluation de
scenarios visant à améliorer le fonctionnement hydro-sédimentaire de
l’estuaire de la Loire. Expertise et connaissance du système estuarien.
Tome 1 – Analyse historique. GIP-Loire Estuaire.
Staf Deltacommissaris, 2013. Delta Programme 2014. Working on the delta.
Promising solutions for tasking and ambitions. Ministry of Infrastructure and
Environment.
Tsolaki, E., Diamadopoulos, E., 2010. Technologies for ballast water treatment:
a review. Journal of Chemical Technology and Biotechnology, 85: 19-32.
Van den Berg, J.H., Jeuken, C.J.L., Van der Spek, A.J.F., 1996. Hydraulic
processes affecting the morphology and evolution of the Westerschelde
estuary. In: Estuarine shores: evolution, environment and human
alterations. Nordstrom, K.F., Roman, C.T. (eds.): 157-184.
Van der Weck, A., 2007. Milieueffectrapport Verruiming vaargeul Beneden-
Zeeschelde en Westerschelde. Achtergronddocument Systeembeschrijving
Schelde-estuarium. Een visie op de macro-morfologische ontwikkeling.
Consortium ARCADIS – Technum.
Wiltshire, K.H., Manly, B.F., 2004. The warming trend at Helgoland Roads, North
Sea: phytoplankton response. Helgoland Marine Research, 58: 269-273.


Summary

Summary
174

Summary
175
Virtually every square metre of the Netherlands has been turned over by the
hands of man changing the natural dynamic landscape into a typical Dutch
cultural landscape of polders, dikes, restrained rivers, closed estuaries, et
cetera. A part of the Netherlands that has been altered strongly is the port of
Rotterdam area in the south west of the Netherlands including nowadays the
Rhine-Meuse estuary (chapter 2). With the growth of the port of Rotterdam the
now so-called Noordrand, comprising the tidal rivers Brielsche Maas, Botlek,
Scheur, Nieuwe Waterweg and Nieuwe Maas was turned from a soft sediment
environment into a hard substrate one. Around 1835 these tidal rivers were
characterised by soft substrate ecotopes as reed and rush beds, tidal willow
coppice (grienden in Dutch), estuarine meadows, sand and mud flats, beaches
and dunes. Hard substrate was mainly found in the harbours along the Nieuwe
Maas as quay walls. The total estuarine area of the Noordrand around 1835
measured 8,375 ha, 3,543 ha of tidal river, 74 ha of tidal harbour, 4,745 of soft
substrate ecotopes and only 16 ha of intertidal hard substrate ecotopes.
Between 1835 and 1880 the area of the port of Rotterdam grew slightly to 90 ha,
but the total estuarine area shrunk by 19% mainly by the disappearance of more
than half of the area of soft estuarine ecotopes by land reclamation related to the
excavation of the Nieuwe Waterweg and river training works along the Nieuwe
Maas. The hard intertidal substrate ecotopes, shore defences, quay walls, piers
and groynes doubled to 32 ha. From 1880 till WWII (1940) the port surface
extended from 90 ha to 750 ha and the hard intertidal substrate increased
accordingly to 95 ha. After the WWII till 1970 the port of Rotterdam itself
underwent an enormous growth to almost 4,000 ha. Because of the closure of
the Brielsche Maas, the development of the Botlek, Europoort and Maasvlakte I
harbour systems the soft estuarine ecotopes were reduced to 17 ha, less than 4
‰ of the 4,745 ha in 1835. The tidal river area decreased also by 30% due to
the loss of the Brielsche Maas. The intertidal hard substrate on the other hand
increased from 95 ha around 1940 till 338 ha in 1970. The shoreline of the
Noordrand consisted in 2008 of 344 km of hard substrate and only 1 km of soft
substrate. Nowadays this part of the Rhine-Meuse estuary can be considered as
completely petrified. Within the Noordrand due to human interventions over time
the hydrology changed from one driven by the tides and river discharge to a
hydrology that is controlled to a great extend by man via the management of the
Haringvliet sluices. The entire package of historical interventions has led to a
significant increase in tidal range and a further penetration of the salt wedge
land inwards.
The demolishing of wooden constructions (quay walls, sluices, dike defences) by
the shipworm (Teredo navalis) in the 18th century was in fact the onset for the

Summary
176
petrification of the estuary. It is nonetheless very unlikely that the shipworm after
its first appearance in 1730 in the Dutch coastal waters could have been present
in the Noordrand (chapter 7). The construction of Europoort and Maasvlakte I
however created salinity conditions for the shipworm to settle. Until 2003 nothing
was known about the presence of the shipworm in the port of Rotterdam area.
With the aid of wooden panels between 2004 and 2008 the distribution of the
first year shipworms, settlement, growth and the degree of damage has been
studied (chapter 3). The shipworms were found all over the western polyhaline
harbours (Beer- and Calandkanaal) and on occasion in harbours nearby that
showed large seasonal and daily fluctuations in salinity. In 2006 the shipworm
was found in fir panels 20 km upstream from the polyhaline harbours in the
Botlek, demonstrating their ability to travel with the tidal currents over
considerable distances and to settle once the abiotic conditions become
favourable. In the first season after settlement they showed a substantial body
length growth rate of 0.18 cm day-1
in 2006. The longest shipworm found was in
2006 and measured 36.8 cm after 4-5 months of growth after settlement. The
maximum damage consisted of the disappearance of 12.4 % of the wood of a fir
panel in 4-5 months after settlement.
The question arose, “What is the main food source of the shipworm T. navalis?”.
Does the shipworm feeds on wood or on seston filtered from the water column?
The question has been approached by stable isotope analysis of soft bodies of
the shipworm, Mytilus edulis (Blue mussel) and Crassostrea gigas (Pacific
oyster) both known as filter feeders and attached to the same wood as the
shipworm was boring in (chapter 4). It was demonstrated that the shipworm T.
navalis is mainly feeding on seston by filter feeding instead of by wood
consumption. T. navalis showed similar stable isotope values (δ13
C, δ15
N) as M.
edulis and C. gigas.
Based on water temperature data between 2003 and 2008 it is clear that the
shipworm could have performed its boring activity 94% of the time year round.
The historical river discharges of the Rhine indicate that the shipworm could
have settled once in 36 years for a short period of time in the eastern part of the
port of Rotterdam where digestible wood underneath quays is available (chapter
3). This threw up new questions, “Will climate change by global warming affect
the distribution of the shipworm in the port of Rotterdam area?” and “Will climate
change by global warming increase the risk of damage of vulnerable structures
by the shipworm?”. Both questions were answered by applying the effects of
four climate change scenarios for the Netherlands on river discharge and salt
intrusion (chapter 5). Global warming will cause dry and warmer summers and
decreased river discharges. Lower river discharges lead to an extension of the
salinity gradient in upstream direction in summer. As a consequence of this the

Summary
177
shipworm might expand its distribution stream upwards and attack wooden
structures. Scenarios with a temperature increase of one and two degrees
Celsius by 2050 compared to 1990 with a weak change in air circulation above
Europe will lead to an increased chance of shipworm damage upstream to once
in 27 and 22 years, respectively. However with a strong change in air circulation,
the chance of shipworm damage increases to once in 6 and 3 years,
respectively. The expansion of the shipworm stream upwards will also be
manifest in other Northwest European estuaries and will even be stronger in
Southern Europe.
The reduction of the severe pollution created chances for many plant and animal
species to settle in the ports’ aquatic environment. However the underwater
environment is designed for harbour activities only. With a pilot study (chapter 6)
with hanging underwater structures made of strings (6 mm thick and 55 cm long)
and ropes (12 mm thick and 150 cm long), respectively called ‘pole hulas’ and
‘pontoon hulas’, it was shown that biodiversity and production could significantly
be improved in the polyhaline harbours. Pole hulas (hula skirt like structures)
were attached to mooring poles, while pontoon hulas (raft like structures) were
placed in the open space of mooring pontoons. Both structures were rapidly
colonized by a variety of organisms. M. edulis was the dominating species after
a few months. In the dense layer of M. edulis on both pole hulas and pontoon
hulas many mobile soft-bottom amphipods and young ragworms occurred,
demonstrating that colonisation on these structures compensates for biodiversity
loss of bottom fauna due to dredging and disturbance by propellers of ships. No
settlement of the exotic C. gigas was observed on the strings of the pole hulas,
the ropes of the pontoon hulas and not on poles with hulas. This oyster has
colonised the western part of the Rotterdam port probably since the 1990s. The
wet biomass of blue mussels (including shells) on pole hulas was found to be
positively correlated with depth and was between 4.4-11.4 times higher
compared to biomass on reference poles. Biomass production on the ropes of
pontoon hulas was density dependent, and optimal density of ropes was
estimated at 4 to 8 ropes m-2
. Also limitation of food by competition was shown
as biomass (mainly M. edulis) on ropes of pontoon hulas decreased to a half
from the edge to the heart of the hula. The experiment proved that ecological
engineering in the port of Rotterdam with simple structures such as pole and
pontoon hulas strongly enhances sessile biological production and biodiversity,
that is likely to have a positive impact on local water quality, and, if applied at
larger scales, positive influences the ecosystem in the remains of Rhine-Meuse
estuary.

Summary
178
In the synthesis (chapter 7) the results of this study are placed in a broader
perspective and compared with developments elsewhere. Soft sediment ecotope
losses occurred in most large western European estuaries, and tidal ranges and
lengths of salinity gradients changed dramatically in the last two centuries.
Worldwide, there are concerns about the range expansion of shipworms related
to global warming and many studies are carried out to prevent shipworm
damage. The pole and pontoon hula experiment has been recognized as an
innovative tool for the improvement of the habitat of harbours. More simple
measures are described that could help to turn the port of Rotterdam in the
direction of a haven for estuarine nature.


Samenvatting

Samenvatting
182

Samenvatting
183
Vrijwel elke vierkante meter van Nederland is wel door de mens op de schop
genomen waardoor het natuurlijke dynamische landschap is veranderd in een
typisch Nederlands cultuurlandschap van polders, dijken, beteugelde rivieren,
afgesloten zeearmen, enzovoorts. Een deel van Nederland dat het sterkst door
de mens is veranderd, is wel het Rotterdamse havengebied in het zuidwesten
van Nederland dat tegenwoordig het belangrijkste deel van het Rijn-
Maasestuarium omvat (hoofdstuk 2). Met de groei van de haven van Rotterdam
is het gebied, dat nu de Noordrand wordt genoemd en de getijdenrivieren
Brielsche Maas, Botlek, Scheur, Nieuwe Waterweg en Nieuwe Maas omvatte,
veranderd van een omgeving van zachte substraten in een die gedomineerd
wordt door hard substraat. Rond 1835 werden deze getijdenrivieren
gekarakteriseerd door ecotopen van het zachte substraat zoals riet- en
biezenvelden, grienden, grasgorzen, zand- en slikplaten, stranden en duinen.
Hard substraat werd nagenoeg alleen gevonden in de havens langs de Nieuwe
Maas in de vorm van kademuren. Het totale estuariene oppervlak van de
Noordrand bedroeg toen 8375 ha, verdeeld in 3543 ha getijdenrivier, 74 ha
getijdenhavens, 4745 ha aan zachtsubstraatecotopen en slechts 16 ha aan
hardsubstraatgetijdengebied. Tussen 1835 en 1880 groeide het (natte)
oppervlak van het Rotterdamse havengebied slechts licht tot 90 ha, maar het
totale estuariene oppervlak kromp met 19%, voornamelijk door het verdwijnen
van meer dan de helft van het areaal van zachtsubstraatecotopen door de
aanleg van de Nieuwe Waterweg en rivierregulatiewerken langs de Nieuwe
Maas. Het harde getijdensubstraat, zoals oeververdedigingen, kademuren,
pieren en kribben verdubbelde tot 32 ha. Vanaf 1880 tot aan de Tweede
Wereldoorlog (WWII) (1940) breidde het havenoppervlak zich uit van 90 ha tot
750 ha en het harde getijdensubstraat tot 95 ha. Na WWII onderging de haven
een enorme groei tot bijna 4000 ha in 1970. Door het afsluiten van de Brielsche
Maas en de ontwikkeling van de haven- en industriegebieden Botlek, Europoort
en Maasvlakte I werd het areaal zacht estuarien substraat gereduceerd tot 17
ha, minder dan 4‰ van de 4745 ha in 1835. Het getijdenrivieroppervlak nam af
met 30% door het verlies van de Brielsche Maas. Het harde getijdensubstraat
daarentegen nam tussen 1940 en 1970 toe van 95 ha tot 338 ha. De oeverlijn
van de Noordrand bestond in 2008 voor 344 km uit hard en voor 1 km uit zacht
substraat. In de Noordrand is ten gevolge van ingrepen door de mens in de loop
der tijd de door de getijden en rivierafvoer bepaalde hydrologie voor een groot
deel veranderd in een hydrologie die in sterke mate wordt bepaald door de
sturing met de Haringvlietsluizen.

Samenvatting
184
De enorme schade die in de 18de
eeuw door de paalworm (Teredo navalis) aan
houten constructies werd aangericht, is de aanleiding geweest om steeds meer
steen te gaan gebruiken. Het is twijfelachtig of de paalworm na zijn eerste
verschijning in 1730 in de Nederlandse kustwateren, in wat nu de Noordrand is,
aanwezig is geweest (hoofdstuk 7). De aanleg van Europoort en Maasvlakte I
hebben echter saliniteitscondities gecreëerd die gunstig zijn voor de paalworm
om zich te vestigen. Tot 2003 was er niets bekend over de aanwezigheid van de
paalworm in het Rotterdamse havengebied. Tussen 2004 en 2008 is met behulp
van houten testplankjes de verspreiding, vestiging, groei en de mate van schade
van eerstejaarspaalwormen bestudeerd (hoofdstuk 3). De paalwormen werden
gevonden in de westelijke polyhaliene havens (Beer- en Calandkanaal) en zo nu
en dan in nabijgelegen havens met een dagelijkse en jaarlijkse fluctuatie in het
zoutgehalte. In 2006 werden paalwormen in vurenhouten testplankjes 20 km
stroomopwaarts van de grote polyhaliene havens in de Botlek gevonden. Dit
toont aan dat ze in staat zijn zich met de getijdenstromen over aanzienlijke
afstanden in het estuarium te verplaatsen, en zich te vestigen als de abiotische
condities dat toelaten. In het eerste seizoen na vestiging in 2006 vertoonden de
paalwormen een lichaamslengtegroei van 0,18 cm per dag van het lichaam. De
langste paalworm werd gevonden in 2006 die na een groeiperiode van 4-5
maanden na vestiging een lengte van 36,8 cm had bereikt. De maximale schade
bestond uit het verdwijnen van 12,4% van het hout van een testplank binnen
een periode van 4-5 maanden na vestiging.
De vraag rees, “Wat is de hoofdvoedselbron van de paalworm, T. navalis?”,
“Leeft de paalworm van hout of van seston gefilterd uit de waterkolom?”. De
vraag is beantwoord door stabiele isotopenanalyse van het lichaam van de
paalworm en van Mytilus edulis (Gewone mossel) en van Crassostrea gigas
(Japanse oester), filtreerders die op het hout zaten waar de paalworm zich had
ingeboord (hoofdstuk 4). Er kon worden aangetoond dat de paalworm, T.
navalis, zich hoofdzakelijk voedt met seston door filter feeding. T. navalis
vertoonde dezelfde stabiele isotoopwaarden (δ13
C, δ15
N) als M. edulis en C.
gigas.
Op basis van de gemeten watertemperaturen tussen 2003 en 2008 werd het
duidelijk dat de paalworm 94% van de tijd zijn booractiviteit heeft kunnen
uitoefenen. Het verloop van de historische rivierafvoeren van de Rijn (1901 t/m
2008) laat zien dat de paalworm zich een keer in de 36 jaar in het westelijk
havengebied, waar voor de paalworm kwetsbaar hout aanwezig is, zou hebben
kunnen vestigen (hoofdstuk 3). Dit riep de volgende vragen op, “Heeft
klimaatsverandering door stijging van de luchttemperatuur gevolgen voor de
verspreiding van de paalworm in het Rotterdamse havengebied?” en “Wordt
door klimaatsverandering door stijging van de luchttemperatuur de kans groter

Samenvatting
185
dat kwetsbare structuren door de paalworm worden aangetast?”. Beide vragen
zijn beantwoord door de effecten van vier klimaatveranderingscenario’s voor
Nederland toe te passen op rivierafvoer en zoutindringing (hoofdstuk 5).
Wereldwijde luchttemperatuurstijging veroorzaakt droge en warmere zomers en
verlaagde rivierafvoer. Verlaagde rivierafvoer leidt tot een verdere
stroomopwaartse zoutindringing in de zomer. Een gevolg hiervan is dat de
paalworm zijn verspreiding stroomopwaarts kan uitbreiden en houten structuren
kan aantasten. Klimaatveranderingscenario’s met een temperatuurstijging van
een of twee graden Celsius tegen 2050 vergeleken met 1990 met een zwakke
verandering in de luchtcirculatie boven Europa zullen leiden tot een toename
van de kans op paalwormschade tot respectievelijk eens in de 27 en 22 jaar.
Echter bij sterke verandering van de luchtcirculatie boven Europa, neemt de
kans toe tot respectievelijk eens in de 6 en 3 jaar. De uitbreiding van de
paalworm stroomopwaarts zal zich ook in andere Noordwest-Europese estuaria
voordoen en mogelijk nog nadrukkelijker in Zuid-Europa.
De afname van de ernstige waterverontreiniging heeft kansen gecreëerd voor de
vestiging van vele planten- en diersoorten in het aquatische milieu van de
Rotterdamse haven. De ruimte onder water is echter alleen voor
havenactiviteiten ingericht. In een pilotstudie (hoofdstuk 6) met onderwater-
hangende substraten gemaakt van touwtjes (6 mm dik en 55 cm lang) en
touwen (12 mm dik en 150 cm lang), respectievelijk paalhula’s en pontonhula's
genoemd, is aangetoond dat deze de biodiversiteit en bioproductie in de
polyhaliene havens significant kunnen verhogen. Paalhula's (op Hawaiiaanse
rokjes lijkende structuren) werden rond palen gebonden, terwijl de pontonhula's
(drijvende structuren met daaronder aan een netwerk hangende touwen) in de
open ruimte van pontons werden geplaatst. Beide touwstructuren werden binnen
zeer korte tijd door een variatie aan organismen gekoloniseerd. M. edulis was na
een paar maanden de dominante soort. In de dichte laag mosselen kwamen
veel vlokreeftachtigen en borstelwormen van de zachte waterbodem voor. Dit
toonde aan dat de kolonisatie van deze structuren compenseert voor de afname
in biodiversiteit van het macrozoöbenthos van de zachte waterbodem ten
gevolge van baggeren en omwoeling door sterke waterstroming veroorzaakt
door scheepsschroeven. Op de touwtjes van de paalhula's, de touwen van de
pontonhula’s en op de palen met hula’s werd geen vestiging van C. gigas
waargenomen. Deze exotische oester heeft het westelijk deel van de
Rotterdamse haven sinds de jaren 90 van de vorige eeuw gekoloniseerd. De
natte biomassa (inclusief schelpen) van de mosselen op de paalhula’s was
tussen de 4,4 tot 11,4 keer hoger vergeleken met de biomassa op
referentiepalen. De biomassaproductie op de touwen van de pontonhula’s was

Samenvatting
186
dichtheidsafhankelijk en geschat is dat de optimale touwdichtheid tussen de 4 à
8 touwen per m2 ligt. Ook werd aangetoond dat het voedsel door competitie
beperkend was, omdat de biomassa (voornamelijk van de mossel) op de touwen
van de pontonhula’s van de rand van de hula tot aan het hart met 50% afnam.
Het experiment toonde aan dat “ecological engineering” in het Rotterdamse
havengebied met eenvoudige structuren als paalhula’s en pontonhula’s de
sessiele biologische productie en de biodiversiteit enorm kunnen versterken. Dit
heeft waarschijnlijk een positief effect op de lokale waterkwaliteit en kan, indien
toegepast op grotere schaal, het ecosysteem van dit restant van het Rijn-
Maasestuarium positief beïnvloeden.
In de synthese (hoofdstuk 7) zijn de resultaten van deze studie geplaatst in een
breder perspectief en vergeleken met ontwikkelingen elders. De afname van het
areaal van zachtsubstraatecotopen heeft zich in de meeste grote Europese
estuaria voorgedaan, en ook zijn getijverschillen en de lengte van de
zoutgradiënt in de laatste twee eeuwen dramatisch veranderd. Wereldwijd
neemt de bezorgdheid toe over de uitbreiding van het verspreidingsgebied van
de paalworm in relatie tot opwarming van de aarde. Veel studies worden
uitgevoerd om schade door paalwormen te voorkomen. Het hula-experiment
wordt herkend als een innovatieve methode om de habitat van havens te
verbeteren. Meer eenvoudige maatregelen zijn beschreven die kunnen helpen
de haven van Rotterdam in de richting van een “haven for estuarine nature” te
loodsen.


Dankwoord

Dankwoord
190

Dankwoord
191
Een dankwoord beginnen is lastig want met wie moet je beginnen? Hoe heeft
het allemaal zo ver kunnen komen? Het begon ongeveer 10 jaar geleden toen ik
met Bram bij de Vaate sprak over het gaan opschrijven van mijn weder-
waardigheden als zelfstandige. Hij bracht me in contact met Gerard van der
Velde, mijn copromotor. Ik zeg bedankt Bram! Bij Gerard is het motto “Wie A
zegt moet B zeggen”, en dus moet je afmaken waar je aan begonnen bent. Dat
ging gelukkig nooit onder dwang, maar je hield hoe dan ook het gevoel dat je
eraan moest werken. Gerard welgemeende dank aan jou voor de uitstekende
begeleiding, het samenwerken, de discussies, de tips en de stimulans om door
te gaan. Tijdens de doctoraalfase in Wageningen was dat wel anders! Waar
waren die begeleiders en professoren toen eigenlijk? Enfin hun onzichtbaarheid
heeft ongetwijfeld bijgedragen om als zelfstandige door te gaan in de aquatische
ecologie. Henk Siepel bedankt dat je mijn promotor bent. Emiel van Velzen en
Piet Jan Zijlstra mijn dank dat jullie bij de verdediging van het proefschrift mij ter
zijde wilden staan.
Met studenten van de “Afdeling Dierecologie & Ecofysiologie” van de Radboud
Universiteit is er gewerkt aan het project “Ecological Goals and Indicators”,
onderdeel van het New Delta project “Ports and nature striking a new balance”.
Resultaten die hier uit voortvloeiden zouden gebruikt worden voor dit
proefschrift. Helaas er ging het een en ander mis en zal publicatie van de
resultaten pas in 2014 plaats gaan vinden. Desalniettemin wil ik de voormalige
studenten Saskia Meuffels, Cindy van Orsouw, Bas Budel, Daniël Bakker,
Mireille Dorothaal en Sietse van der Zwart bedanken voor hun inzet. Hier moet
ik zeker ook de analiste van de afdeling, Marij Orbons noemen die zich door de
vele emmers en potten met steurgarnalen heen heeft weten te werken. Veel lof
hier voor, ik ga er nog mee aan de slag.
Hoofdstuk 2 een verhandeling over de historische ontwikkeling van estuariene
ecotopen in de Noordrand van het noordelijk deltabekken zou niet hebben
kunnen worden geschreven zonder de door Ernst Lofvers, Waterdienst
Rijkswaterstaat, Lelystad en Marjolein Bons, Meetdienst Rijkswaterstaat Zuid-
Holland, Rotterdam aangeleverde gedigitaliseerde historische rivierkaarten. Ook
hiervoor dank. Wie ik hier zeker niet mag vergeten is André de Kwaasteniet oud-
medewerker van het Havenbedrijf Rotterdam NV die mij in 1997 alle tekeningen
van de kademuren en oevers van Europoort en Maasvlakte 1 heeft aangeleverd,
wat me op de gedachte van “petrifying the estuary” heeft gebracht. Maar ook
Cor Mooiman oud-medewerker van het Havenbedrijf Rotterdam NV vergeet ik
niet voor het aanleveren van allerhande gegevens omtrent de havenbekkens.
Van onschatbare waarde was ook Peter Charpentier voor het opsnorren van

Dankwoord
192
soms vage literatuur uit duistere krochten in een tempo waarvoor op zijn minst
een knieval uit dankbaarheid op zijn plaats is. Met dezelfde inzet heeft hij ook
veel literatuur aangeleverd voor de overige hoofdstukken van dit proefschrift.
De paalwormartikelen die een groot deel van het proefschrift beslaan, zijn tot
stand gekomen doordat medewerkers van het Havenbedrijf Rotterdam NV zich
zorgen maakten om bevindingen omtrent dit dier in de haven van Bremerhaven.
Mijn dank gaat uit naar Nicolette Ammerlaan, Piet Louwen, Sjaak Teeuwen,
Maarten Meijler, Yme Ottema en Martin Minnaard, allen van het Havenbedrijf
Rotterdam NV, voor het faciliteren van het onderzoek in de periode van 2003 tot
en met 2009. Jan Saarloos van Firma Simons bv dank ik voor het maken van de
plankjes voor het onderzoek en het beschikbaar stellen van grote hoeveelheden
door paalworm aangetast hout uit de haven die mij wijsheid brachten en
waarmee ik tevens verschillende jaren mijn huis heb kunnen verwarmen.
Lambèr Hulsen van het Havenbedrijf Rotterdam NV zag erop toe dat de
SIMONA-berekeningen goed verliepen en Vincent Beijk van Rijkswaterstaat
leverde de omrekeningsfactoren voor de rivierafvoer aan, waardoor de
klimaatseffecten op de verspreiding van de paalworm ingeschat konden worden.
Beide heren, top!
Via het project “Ecological Goals and Indicators” heb ik Mindert de Vries van
Deltares leren kennen. Hiervoor ben ik Pim de Wit van het Havenbedrijf
Rotterdam NV die mij voor het project uitnodigde om mee te werken en denken
dank verschuldigd. Ik bedank Mindert in het bijzonder, omdat ik eindelijk via hem
mijn onderwaterhangendesubstratenideeën kwijt kon. Zijn enthousiasme heeft
(en wellicht ook de riante medefinanciering via WINN-subsidie van
Rijkswaterstaat) het havenbedrijf over de streep getrokken om het experiment in
de haven aan te gaan. De financiële rompslomp, de coördinatie en alles wat
rondom het project geregeld moest worden lag in handen van Sander
Cornelissen van het Havenbedrijf Rotterdam NV en Bregje van Wesenbeeck
van Deltares. Ik ben dankbaar dat ze dit allemaal in goede banen hebben weten
te leiden. De paalhula’s zijn gemaakt door de mannen van Zeilmakerij de Bruijn
& Meijer te Vlaardingen, die ik zeer erkentelijk ben voor het meedenken
waardoor de duurzaamheid van deze hula’s van dien aard is dat deze na bijna 5
jaar nog ongeschonden rond de palen in Scheur- en Pistoolhaven zitten. Niet in
de laatste plaats dank ik mijn vrouw Adrienne Woerdenbagch voor het snijden
van de talloze touwtjes en touwen die in paalhula’s (10 km touw in 8339 touwtjes
van 120 cm) en pontonhula's (1682 m touw in 1150 touwen van 40 tot 160 cm)
zijn verwerkt, en het assisteren bij het veldwerk. De pontonhula’s zijn door
ondergetekende zelf geconstrueerd maar zonder de hulp van een drietal

Dankwoord
193
jongemannen zouden niet op tijd de 1150 touwen aan het netwerk kunnen zijn
vastgemaakt. Goed werk is geleverd door Tim van Dorp, Jens Kooij en Rutger
van Houwelingen. Dankbaar gebruik heb ik gemaakt van de veelzijdige
technische vaardigheden van de Marcellen van Deltares, respectievelijk
Grootenboer en Busink!
Het boven water halen van de monitoringsstrengen van de paalhula’s was niet
altijd even gemakkelijk. Ikzelf heb menigmaal vanaf een werkponton met een
assistent zittend op mijn benen om niet de haven in te glijden tot aan mijn middel
ondersteboven in het water gehangen om ze te pakken te krijgen. Marinus
Eigenraam is op een warme zomerdag spontaan de Pistoolhaven ingedoken
omdat hij geen andere mogelijkheid zag de strengen te pakken te krijgen. Een
uitkomst bij de laatste bemonstering was natuurlijk de oud-medewerker van de
“Afdeling Dierecologie & Ecofysiologie” Martin Versteeg die zich in zijn droge
duikpak hees om op professionele wijze de klus te klaren. Martin fantastisch, het
heeft veel aan de resultaten toegevoegd! Hier nogmaals lof voor Marij Orbons
voor het determineren van de beestenboel die tussen de mosselen van de
hula’s zat.
Het hulaproject zou niet hebben kunnen plaatsvinden zonder de belangeloze
medewerking van het Loodswezen en Smit Harbour Towage. Hierbij hebben
Peter van Dijk van het Loodswezen, Jan-Pieter Steunebrink en André van der
Kaaij, beiden van Smit, een belangrijke rol gespeeld.
En natuurlijk ook dank aan hen die verder nog een bijdrage aan dit proefschrift
hebben geleverd.


Curriculum vitae

Curriculum vitae
196

Curriculum vitae
197
Peter Paalvast werd op 10 februari 1952 als 12-ponder (circa “one Stone”)
geboren in de wijk ’t Stort te Maassluis. Na drie maanden verhuisde het gezin
naar Vlaardingen. Hier werd de lagere school en het leeuwendeel van de HBS
doorlopen. Na een jaar praeses van de leerlingenvereniging Universia van het
Groen van Prinstererlyceum te zijn geweest, werd het schoolgaan een periode
wat minder interessant gevonden. Uiteindelijk werd eindexamen gedaan op het
Spieringshoeklyceum te Schiedam. De motivatie om biologie te gaan studeren
kwam mede voort uit de discussies tijdens de biologielessen van Joop van
Lenteren (thans emeritus hoogleraar Entomologie Wageningen University) en
Koos Slob (thans emeritus hoogleraar in de fysiologie en pathofysiologie van de
seksualiteit aan de Erasmus Universiteit Rotterdam) over milieuvervuiling en
overbevolking en wat daar aan te doen. In 1972 werd aangevangen met de
studie biologie aan de Landbouwhogeschool te Wageningen (nu Wageningen
University). Hele dagen college en practica, avondpractica en werkcollege op
zaterdagochtend was toen nog gewoon. Na het behalen van het
kandidaatsexamen (met 50% extra studiepunten) werd de doctoraalfase in 1977
begonnen met elektrofysiologisch onderzoek (chemoreceptie) aan het koolwitje
(Pieris brassicae) in relatie tot de eiafzetting op zijn gastplant onder begeleiding
van prof. dr. Louis Schoonhoven. Hierna werd 6 maanden stage gelopen op het
biologisch station Tour du Valat in de Camargue, waar naast het meedraaien in
het gedragsonderzoek aan paarden onder leiding van dr. Patrick Duncan, een
eigen onderzoek werd gedaan naar het markeringsgedrag van de paarden met
urine en feces. Dit leverde de eretitel “merdologiste de la Camargue” op. In 1978
werd begonnen aan een studie betreffende de inter- en intraspecifieke relaties
van zeekraal binnen de gezoneerde vegetatie van de schorren aan de
Oosterschelde met dr. ir. Wim Beeftink van het toenmalige Delta Instituut voor
Hydrobiologisch Onderzoek (nu Koninklijke NIOZ) als begeleider. De vrijheid
was groot zodat een bijna geheel eigen invulling aan het onderzoek kon worden
gegeven. De studie werd afgesloten met een onderzoek voor STINAPA
Nederlandse Antillen (gestimuleerd door dr. Ingvar Kristensen) onder
verantwoording van dr. Chris Geerlings naar het voorkomen en het gedrag van
geiten in het Christoffelpark te Curaçao en het Washington Slagbaai Nationaal
Park te Bonaire, waarvan de gegevens zijn gebruikt voor het opstellen van een
begrazingsonderzoek in beide parken. Gedurende de studie waren er voor een
cumulatieve duur van een ongeveer een jaar aanstellingen als student-assistent
bij de vakgroepen Experimentele Diermorfologie en Celbiologie, Fysiologie der
Dieren en Plantensystematiek aan de Landbouwuniversiteit Wageningen.
Na het behalen van het doctoraalexamen in september 1979 zou begin 1980
begonnen worden met een promotieonderzoek bij de vakgroep Natuurbeheer
van de Landbouwhogeschool naar de nichedifferentiatie van grote herbivoren in

Curriculum vitae
198
Nigeria. Op het laatste moment bleek daar geen geld meer voor beschikbaar te
zijn. Een jaar werd als onbezoldigd gastmedewerker bij de vakgroep Algemene
Visteelt en Visserij doorgebracht, en werd een onderwijsbevoegdheid in de
biologie behaald. Na het behalen van de bevoegdheid tot lesgeven werd tien
maanden lang voor enkele uren gewerkt voor de Gemeentelijke Stichting
Avondlyceum te Rotterdam en de Openbare School voor MAVO te Rozenburg.
In 1982 werd een aanstelling als docent in het middelbaar en hoger
laboratoriumonderwijs aan de Stichting van Leeuwenhoek Instituut te Delft
aanvaard. Deze aanstelling zou duren tot en met 1990 waarbij de
arbeidsovereenkomst een kleine 20 keer werd ontbonden en even vaak weer
werd overeengekomen als gevolg van splitsing in MBO en HBO en veelvuldige
fusies met andere onderwijsinstellingen. In de periode 1990-1991 werd een jaar
aan de Hogeschool Zeeland gedoceerd en een bijdrage geleverd aan het
curriculum voor de opleiding Aquatische Ecotechnologie.
Prof. dr. Marinus Werger van de Universiteit van Utrecht was het die in 1983
adviseerde eens te gaan praten met de afdeling Terreinbeheer van de
Duinwaterleiding van ’s-Gravenhage (nu Dunea) om daar als zelfstandige
vegetatiekundig onderzoek te gaan doen. Hier was echter geen ruimte voor,
maar wel voor onderzoek naar de samenstelling van de vispopulaties in de
infiltratievijvers in het door het bedrijf beheerde duingebied. Hiermee was in feite
Ecoconsult geboren. Tot op heden zijn onder de Ecoconsultvlag een honderdtal
veld- en bureaustudies verricht voor onder andere Rijkswaterstaat, LNV,
Havenbedrijf Rotterdam NV, Deltares, Hoogheemraadschap Hollands
Noorderkwartier en GIP-Seine Aval te Rouen in Frankrijk.
Van 1994 tot en met 2010 is jaarlijks een bijdrage geleverd aan de
masteropleiding IMACOF (Ingénierie des Milieux Aquatiques et des Corridors
Fluviaux) van de “Université François Rabelais de Tours” in Frankrijk in de vorm
van colleges en excursies.
Peter Paalvast is getrouwd met Adrienne Woerdenbagch, heeft een zoon, een
dochter, en is opa van Tom (11 september 2012) en Daniël (5 februari 2014).

Curriculum vitae
199
Publications in peer-reviewed journals
Paalvast, P., Van der Velde, G., 2014. Long term anthropogenic changes and
ecosystem service consequences in the northern part of the complex
Rhine-Meuse estuarine system. Ocean & Coastal Management, 92: 50-64.
Paalvast, P., Van der Velde, G., 2013. What is the main food source of the
shipworm (Teredo navalis)? A stable isotope approach. Journal of Sea
Research, 80: 58-60.
Paalvast, P., Van Wesenbeeck, B.K., Van der Velde, G., De Vries, M.B., 2012.
Pole and pontoon hulas: An effective way of ecological engineering to
increase productivity and biodiversity in the hard-substrate environment of
the port of Rotterdam. Ecological Engineering, 44: 199-209.
Paalvast, P., Van der Velde, G., 2011. New threats of an old enemy: The
distribution of the shipworm Teredo navalis L. (Bivalvia: Teredinidae)
related to climate change in the Port of Rotterdam area, the Netherlands.
Marine Pollution Bulletin, 62: 1822-1829.
Paalvast, P., Van der Velde, G., 2011. Distribution, settlement, and growth of
first-year individuals of the shipworm Teredo navalis L. (Bivalvia:
Teredinidae) in the Port of Rotterdam area, the Netherlands. International
Biodeterioration & Biodegradation, 65: 379-388.
Borsje, B.W., Van Wesenbeeck B.K., Dekker, F., Paalvast, P., Bouma, T.J., Van
Katwijk, M.M., De Vries, M.B., 2011. How ecological engineering can serve
in coastal protection. Ecological Engineering, 37: 113-122.
Huiskes, A.H.L., De Munck, W., Paalvast, P., Schat, H., 1980. Some aspects of
the population dynamics of Salicornia spp. Acta Botanica Neerlandica, 29:
208-209.
Book chapters
Paalvast, P., 1981. De Camargue. In “Encyclopedie van de natuur van Europa”.
Deel III. Flora en fauna in en bij de zoete wateren (redactie J.G. van
Gelderen, J. van de Kam & C. Laban). Uitgeverij Het Spectrum BV,
Utrecht/Antwerpen. p. 826-827.
Reports
Paalvast, P., 2013. Inventarisatie natuurwaarden elastocoast op een
stroomhoofd voor de Pettemer zeewering. In opdracht van Hoogheem-
raadschap Hollands Noorderkwartier. Ecoconsultrapport nr: 2013-01.

Curriculum vitae
200
Paalvast, P., 2012. Verruwd hardsubstraat strandhoofden Petten en Groote
Keeten en de vestiging van mosselbroed. In opdracht van Hoogheem-
raadschap Hollands Noorderkwartier. Ecoconsultrapport nr: 2012-02.
Paalvast, P., Noordhuis, R., 2012. Gevolgen van klimaatverandering voor
beroepsbinnenvisserij en sportvisserij in Nederland. Knelpuntanalyse
Deltaprogramma Zoetwater. In opdracht van Deltares, Ecoconsultrapport
nr: 2012-01.
Paalvast, P., 2011. Quick Scan broedval Callantsoog e.o. In opdracht van
Hoogheemraadschap Hollands Noorderkwartier. Ecoconsultrapport nr:
2011-06.
Paalvast, P., 2011. Vismigratie Haringvliet. T0. Vegetatie buitendijkse gebieden,
waterplanten, macrozoöbenthos. In opdracht van Rijkswaterstaat Zuid-
Holland. Ecoconsultrapport nr. 2011-05.
Paalvast, P. 2011. Resultaten van de monitoring pontonhula’s 2010. Een Rijke
Dijkproject. Ecoconsultrapport nr. 2011-03.
Paalvast, P., 2011. Rijke Berm Oosterschelde monitoring getijdenpoelen 2008-
2010. Een Rijke Dijkproject. Ecoconsultrapport nr. 2011-02.
Paalvast, P., 2011. Pilotstudie Ecobeton. Zuiderhavenhoofd IJmuiden 2008-
2010. Een Rijke Dijkproject. Ecoconsultrapport nr. 2011-01.
De Vries, M., Hulsman, H., Paalvast, P., Van der Wal, M., 2010. Water
INNovatie: Een Rijke Dijk voor Maasvlakte 2. Ecologische optimalisatie van
harde zeewering draagt bij aan een duurzame haven. © Deltares, 2010.
Paalvast, P., 2010. Vrijhangende substraten en Ecobetonplaten. Monitoring
2009. In opdracht van Deltares. Ecoconsultrapport nr. 2010-02.
Paalvast, P., 2010. De paalworm (Teredo navalis) in het Rotterdamse
Havengebied. Stand van zaken 2009. Risicoanalyse. In opdracht van het
Havenbedrijf Rotterdam NV. Ecoconsultrapport nr. 2010-01.
Paalvast, P., 2009. De paalworm (Teredo navalis) in het Rotterdamse
Havengebied. Stand van zaken 2008. In opdracht van het Havenbedrijf
Rotterdam NV. Ecoconsult, rapport nr. 2009-05.
Paalvast, P. 2009. Rijke Berm Oosterschelde tussenrapportage 2009. In
opdracht van Deltares. Ecoconsult, rapport nr. 2009-04.
Paalvast, P. 2009. X-blocks Zuiderhavenhoofd IJmuiden tussenrapportage
2009. In opdracht van Deltares. Ecoconsult, rapport nr. 2009-03.
Paalvast, P. 2009. Ecoplaten Zuiderhavenhoofd IJmuiden tussenrapportage
2009. In opdracht Deltares. Ecoconsult, rapport nr. 2009-02.
Paalvast, P. 2009. Zwavelecoplaten Zuiderhavenhoofd IJmuiden tussen-
rapportage 2009. In opdracht Deltares. Ecoconsult, rapport nr. 2009-01.
Paalvast, P. 2008. Rijke Berm Oosterschelde tussenrapportage 2008. In
opdracht van WL | Delft Hydraulics. Ecoconsult, rapport nr. 2008-04.
Curriculum vitae
201
Paalvast, P. 2008. Zwavelecoplaten Zuiderhavenhoofd IJmuiden tussen-
rapportage 2008. In opdracht van WL | Delft Hydraulics. Ecoconsult, rapport
nr. 2008-03.
Paalvast, P., 2008. De paalworm (Teredo navalis) in het Rotterdamse Haven-
gebied. Stand van zaken 2007. In opdracht van het Havenbedrijf Rotterdam
NV. Ecoconsult, rapport nr. 2008-02.
Paalvast, P., 2008. Monitoring van de effecten van de MOT olieverontreiniging
op 18 januari 2007 op de levensgemeenschappen van het intergetijden-
gebied in het Beer- en Calandkanaal in 2007. In opdracht van het
Havenbedrijf Rotterdam NV. Ecoconsult, rapport nr. 2008-01.
Paalvast, P., 2007. Concept Pilotstudie Ecobeton Zuiderhavenhoofd IJmuiden.
In opdracht van WL | Delft Hydraulics. Ecoconsult, rapport nr. 2007-08
Paalvast, P., 2007. Hard op weg naar zacht. Evaluatie 2003-2006. In opdracht
van het Havenbedrijf Rotterdam NV. Ecoconsult, rapport nr. 2007-07.
Paalvast, P., 2007. Pilotstudie toepassing “Reefblocks” in het Rotterdamse
havengebied. In opdracht van WL | Delft Hydraulics. Ecoconsult, rapport nr.
2007-06.
Paalvast, P., 2007. Pilotstudie vrijhangende substraten en ecoplaten in het
Rotterdamse havengebied. conceptversie 01. In opdracht van WL | Delft
Hydraulics. Ecoconsult, rapport nr. 2007-05.
Paalvast, P., 2007. Pakket van eisen voor hangende substraten en ecoplaten in
het Rotterdamse havengebied. In opdracht van WL/Delft Hydraulics.
Ecoconsult, rapport nr. 2007-04.
Bij de Vaate, A., Klink, A., Paalvast, P., 2007. Macrozoobenthos in the Lower
Seine: a survey from the perspective of the European Water Framework
Directive. In order of GIP Seine-Aval, Rouen. Ecoconsult, report nr. 2007-
03.
Paalvast, P., 2007. De paalworm (Teredo navalis) in het Rotterdamse
Havengebied. Stand van zaken 2006. In opdracht van het Havenbedrijf
Rotterdam NV. Ecoconsult, rapport nr. 2007-02.
Bij de Vaate, A., Klink, A., Paalvast, P. 2007. Recolonisation potential of
macroinvertebrates in the Lower Seine. In order of GIP Seine-Aval, Rouen.
Ecoconsult, report nr. 2007-01.
De Wit, P.C.B., Bolier, G., Paalvast, P., Van der Velde, G., De Vries, M.B., 2007.
Contribution to the Development of Ecological Goals and Indicators for the
Aquatic Environment in Ports. Challanges in the Port of Rotterdam Area.
Report Theme 2, NEW! Delta project. Ports and nature, striking a new
balance.

Curriculum vitae
202
Paalvast, P., 2006. The crustaceans of the Port of Rotterdam. Séminaire
“Indicateurs estuariens”. Rouen, les 19 & 20 juin 2006. Université de
Rouen. GIP Seine Aval. Presentation and abstract.
Paalvast, P., 2006. The Rhine-Meuse estuary: an extremely managed
environment. In North-Atlantic Estuaries: Problems and Perspectives; 39-
42. Project Coordinator: Jean-Claude Dauvin. Seine-Aval Special Issue.
Paalvast, P., Belgraver, N., 2006. Banque de photos des berges de la Seine
Aval entre Poses et le Vieux Port. Manual and database. In order of GIP
Seine-Aval, Rouen. Ecoconsult, report nr. 2006-08.
Paalvast, P., Bij de Vaate, A., Klink, A., 2006. Quick scan of the freshwater part
of the river Seine estuary. In order of GIP Seine-Aval, Rouen. Ecoconsult,
report nr. 2006-07.
Bij de Vaate, A., Klink, A., Paalvast, P., 2006. Ecological status of tidal
freshwater sections of some rivers in Europe. In order of GIP Seine-Aval,
Rouen. Ecoconsult, report nr. 2006-06.
Paalvast, P., 2006. Beheer van de Haringvlietsluizen volgens de Kier. Monitoring
wieren, vastlegging T0-situatie. In opdracht van Rijkswaterstaat, dir. Zuid-
Holland. Ecoconsult, rapport nr. 2006-05.
Paalvast, P., 2006. Monitoring van bodemfauna onder het beheerprogramma de
Kier voor de Haringvlietsluizen. Plan van aanpak. In opdracht van
Rijkswaterstaat, dir. Zuid-Holland. Ecoconsult, rapport nr. 2006-04.
Paalvast, P., 2006. Monitoring van kreeftachtigen onder het beheerprogramma
de Kier voor de Haringvlietsluizen. Plan van aanpak. In opdracht van
Rijkswaterstaat, dir. Zuid-Holland. Ecoconsult, rapport nr. 2006-03.
Paalvast, P., 2006. Aanplantproef Dintelhaven. Evaluatie-2005. In opdracht van
het Havenbedrijf Rotterdam NV. Ecoconsult, rapport nr. 2006-02.
Paalvast, P., 2006. De paalworm (Teredo navalis) in het Rotterdamse Haven-
gebied. Stand van zaken 2005. In opdracht van het Havenbedrijf Rotterdam
NV. Ecoconsult, rapport nr. 2006-01.
Paalvast, P., 2005. Hard op weg naar zacht. Evaluatie 2004-2005. In opdracht
van het Havenbedrijf Rotterdam NV. Ecoconsult, rapport nr. 2005-03.
Paalvast, P., 2005. Voorstel voor de inpassing van kunstmatige getijdenpoelen
in het aan te passen oevertalud aan de kopse kant van de Hartelhaven. In
opdracht van het Havenbedrijf Rotterdam NV. Ecoconsult, rapport nr. 2005-
02.
Paalvast, P., 2005. De paalworm in het Rotterdamse Havengebied in 2003 en
2004. In opdracht van het Havenbedrijf Rotterdam NV. Ecoconsult, rapport
nr. 2005-01.

Curriculum vitae
203
Paalvast, P., 2004. De Paalworm in het Rotterdamse havengebied in 2004. In
opdracht van het Havenbedrijf Rotterdam NV. Ecoconsult, rapport nr. 2004-
03.
Paalvast, P., 2004. Voorstel voor aanpassing van de voorgestelde werken in de
oeverzone achter het remmingswerk van de voormalige Hartelsluis. In
opdracht van het Havenbedrijf Rotterdam NV. Ecoconsult, rapport nr. 2004-
02.
Paalvast, P., 2004. Research proposal ecological goals and indicators. Plan
Theme 2 - North-West Europe Delta Interreg 3B programme Establishment
of Ecological Goals and Indicators. In opdracht van het Havenbedrijf
Rotterdam NV. Ecoconsult, rapport nr. 2004-01.
Paalvast, P., 2004. Implementation Plan Theme 2 - North-West Europe Delta
Interreg 3B programme Establishment of Ecological Goals and Indicators.
In opdracht van het Havenbedrijf Rotterdam NV.
Paalvast, P., 2003. Verzilting van het oostelijk havengebied. Kansen voor de
paalworm? Ecoconsult, rapport nr. 2003-02.
Paalvast, P., 2002. Beheer van de Haringvlietsluizen volgens de Kier. Monitoring
wieren, vastlegging T0-situatie. In opdracht van Rijkswaterstaat, dir. Zuid-
Holland. Ecoconsult, rapport nr. 2002-03.
Paalvast, P., 2002. Historische ontwikkeling estuariene ecotopen in de
Noordrand van het benedenrivierengebied vanaf 1880 tot heden. In
opdracht van het Rijksinstituut voor Kust en Zee/RIKZ. Ecoconsult, rapport
nr. 2002-02.
Paalvast, P., 2001. Referentie-estuaria Noordrand. Een beschrijving van het
estuarium van de rivieren Elbe, Seine, Taag, Humber en St. Croix. In
opdracht van het Rijksinstituut voor Kust en Zee/RIKZ. Ecoconsult, rapport
nr. 2001-03.
Paalvast, P., 2001. Monitoring hardsubstraatorganismen Hartelkanaal T0, T1,
T2 en T3. In opdracht van Rijkswaterstaat, dir. Zuid-Holland.
Paalvast, P., 2001. Hard op weg naar zacht. Natuurvriendelijk experimenteren
met harde oeverconstructies. Een discussienotitie. In opdracht het
Gemeentelijk Havenbedrijf Rotterdam.
Paalvast, P., 2000. Bemonsteringsmethoden voor estuariene crustaceeën in het
noordelijk deltagebied. In opdracht van: het Rijksinstituut voor Kust en
Zee/RIKZ.
Paalvast, P., 2000. Doorstroming. Een natuurontwikkelingsproject in de Dordtse
Biesbosch. Monitoring 1991 - 1997. Rijkswaterstaat, Directie Zuid-Holland.
Notanummer: AP/3563610/2000/002.
Paalvast, P., 2000. Zoet Zout Zuid-Holland. Autoecologie van enige karak-
teristieke estuariene organismen. RIZA werkdocument nr.: 2000.24x.

Curriculum vitae
204
Paalvast, P., Van der Velden, J., 1999. Submerse waterplanten en biezen in de
noordrand van het benedenrivierengebied in 1994 en 1998. Ecoconsult.
Rijkswaterstaat, dir. Zuid-Holland.
Paalvast, P., Karssemeijer, J., 1999. Natuurlijk nat! Kansrijke natte natuur-
ontwikkeling voor de planperiode, 1999-2010. ICES Deltanatuur. In
opdracht van LNV, dir. Zuidwest.
Paalvast, P., Karssemeijer, J., 1999. Vernatten natuurlijk! Kansrijke natte
natuurontwikkeling voor de eerste planperiode, 1999-2002. ICES
Deltanatuur. In opdracht van LNV, dir. Zuidwest.
Paalvast, P., 1999. Inrichtingsschetsen voor het voormalige industrieterrein
Boskalis-Oosterwijk. Ecoconsult.
Paalvast, P., Hiddema, P., 1998. Herinrichting Zanen Verstoep Terrein,
startinformatie eerste projectgroep-vergadering. RWS, notanummer:
APV/98-286
Paalvast, P., Hiddema, P., 1998. Herinrichting Opperduit, startinformatie eerste
projectgroepvergadering. RWS, notanummer: APV-Opp001
Paalvast, P., 1998. Vegetatieontwikkeling in het mondingsgebied van het
Haringvliet bij vier alternatieven voor het beheer van de Haringvlietsluizen.
Werkgroep Ecologie en Landschap. MER Beheer Haringvlietsluizen.
Rijkswaterstaat, directie Zuid-Holland. RWS, notanummer: apv/98-210
Paalvast, P., Peters, H., Van Sprundel, L., 1998. MER Beheer Haringvliet-
sluizen. Over de grens van zout en zoet. Hoofdrapport. RWS, notanummer:
apv 98/186. ISBN: 90-369-4802.
Paalvast, P., Iedema, W., Ohm, M., Posthoorn, R. (red.), 1998. Milieu-
effectrapport over een ander beheer van de Haringvlietsluizen. Over de
grens van zout en zoet. Deelrapport ecologie en landschap. RIZA rapport
98051. RWS, notanummer: apv 98/103. ISBN: 90-369-5205-0.
Paalvast, P., 1998. Ecologische waardering van de oevers in het Rotterdamse
Havengebied. Een handreiking voor het beheer. Calandkanaal, Beerkanaal,
Hartelkanaal en Nieuwe Waterweg. Ecoconsult. In opdracht van het
Rijksinstituut voor Kust en Zee, Middelburg.
Paalvast, P., Limpens, J., 1998. Nieuwe Waterweg. Flora-inventarisatie oevers.
Ecoconsult. In opdracht van Rijkswaterstaat, RIKZ Middelburg.
Paalvast, P., 1997. Benedenrivieren-Econet. Inventarisatie basisgegevens.
Ecoconsult. In opdracht van Rijkswaterstaat, RIZA Arnhem.
Paalvast, P., Postma, R., 1997. Ecologisch belangrijke gebieden langs de Rijn.
Een inventarisatie. Ecoconsult. In opdracht van Rijkswaterstaat, RIZA
Arnhem.

Curriculum vitae
205
Paalvast P. (red.), Kerkhofs, S., 1997. Ecotopenkaart Maas/Carte des Ecotopes
de la Meuse. Verslag van de workshop gehouden te Luik. 23-25/04/97.
Ecoconsult. In opdracht van Rijkswaterstaat, RIZA Arnhem.
Paalvast, P. (red.), Vanhemelrijk, J., 1997. Natuurontwikkeling Volkerak-
Zoommeer 1995. Ecoconsult & Ecologische Adviesbureau Vanhemelrijk. In
opdracht van Rijkswaterstaat, RIZA Lelystad.
Van Rooij, S.A.M., Lofvers, E., Paalvast, P., Posthoorn, R., 1997. Ruimte voor
estuariene ecotopen. Ecotopenverdeling in het Haringvliet-estuarium bij
verschillende alternatieven voor het beheer van de Haringvlietsluizen.
Werkgroep Ecologie en Landschap. MER Beheer Haringvlietsluizen.
Rijkswaterstaat, RIZA. RIZA rapport 97.096. ISBN 90-369-5147-x.
Paalvast, P., Vanhemelrijk, J., 1997. Inventarisatie van natuurontwikkelings-
projecten langs rivieren. Fase I. Ecoconsult. Ecologisch Adviesbureau
Vanhemelrijk. In opdracht van Rijkswaterstaat, RIZA Arnhem.
Vanhemelrijk, J., Paalvast, P., 1997. Inventarisatie van natuurontwikkelings-
projecten langs buitenlandse rivieren. Ecologisch Adviesbureau
Vanhemelrijk. Ecoconsult. In opdracht van Rijkswaterstaat, RIZA Arnhem.
Paalvast, P., Limpens, J., Simons, J., 1996. Ecotopen achter langsdammen.
Rheingau Duitsland. In opdracht van Rijkswaterstaat, RIZA Arnhem.
Paalvast, P., 1996. Water- en Oeverplanten Noord. In opdracht van Rijkswater-
staat, Directie Zuid-Holland.
Paalvast, P., 1996. Water- en Oeverplanten Dordtsche Kil. In opdracht van
Rijkswaterstaat, Directie Zuid-Holland.
Ohm, M., Paalvast, P. (ed.), Van der Velden, J.A., 1996 . Hard Substrate Com-
munities and the Fishfauna in an open Rhine Estuary: the Nieuwe
Waterweg. In opdracht van Rijkswaterstaat, Directie Zuid-Holland. Poster
en abstract voor Rijnsymposium Koblenz.
Paalvast, P., 1995. Ecologische waarde van Langsdammen. Ecoconsult. In
opdracht van Rijkswaterstaat, RIZA, Arnhem.
Paalvast, P., 1995. Oriënterend onderzoek naar de levensgemeenschappen op
hard substraat en op bij laag water droogvallende platen (zacht substraat)
in de Voordelta en het estuariene deel van de Noordrand. In opdracht van
Rijkswaterstaat, Directie Zuid-Holland.
Paalvast, P., 1995. Amoebes Benedenrivieren. Doelvariabelen. Producenten &
Plantensoorten. 2e gewijzigde druk. Ecoconsult. In opdracht van
Rijkswaterstaat, Directie Zuid-Holland.
Paalvast, P., 1995. Biologische Monitoring Benedenrivierengebied. Voorstel
voor een Regionaal Aanvullend Meetnet. Ecoconsult. In opdracht van
Rijkswaterstaat, Directie Zuid-Holland.

Curriculum vitae
206
Paalvast, P., 1994. Overzicht Biologische Informatie Benedenrivierengebied.
1985 t/m 1994. Ecoconsult. In opdracht van Rijkswaterstaat, Directie Zuid-
Holland.
Paalvast, P., 1994. Amoebes Benedenrivieren. Doelvariabelen. Producenten &
Plantesoorten. In opdracht van Rijkswaterstaat, Directie Zuid-Holland.
Paalvast, P., 1993. "La Moyenne Meuse" als referentie voor de Grensmaas?
Een inventarisatie. Reports of the project "Ecological Rehabilitation of the
River Meuse". Report nr. 16a-1993. Ecoconsult. In opdracht van
Rijkswaterstaat, RIZA.
Paalvast, P., 1993. "La Moyenne Meuse" comme reference pour la Grensmaas?
Un inventair. Reports of the project "Ecological Rehabilitation of the River
Meuse". Report nr. 16b-1993. Ecoconsult. In opdracht van Rijkswaterstaat,
RIZA.
Paalvast, P., 1992. Referentie-onderzoek Grensmaas in Frankrijk. Sector tussen
St-Mihiel en Verdun. Ecoconsult. In opdracht van Rijkswaterstaat, RIZA.
Paalvast, P., 1991. Een verkennend onderzoek naar de mogelijkheden van
visstandbeheer t.b.v. de ecologische optimalisatie van de infiltratieplassen
van het duingebied Meijendel. Ecoconsult. In opdracht van het
Duinwaterbedrijf Zuid-Holland.
Paalvast, P., 1991. Vispopulaties in de infiltratiepannen van het Duinwaterbedrijf
Zuid-Holland. Meijendelmededeling.
Paalvast, P., 1990. Inventarisatie van de vispopulaties van pan 13.1 en 14.1 van
het Duinwaterbedrijf Zuid-Holland. Ecoconsult. In opdracht van het
Duinwaterbedrijf Zuid-Holland.
Paalvast, P., 1986. Voorstel voor onderzoek naar het functioneren van de
infiltratievijvers als aquatisch ecosysteem van de Duinwaterleiding van ‘s-
Gravenhage. Ecoconsult. In opdracht van de Duinwaterleiding van ‘s-
Gravenhage.
Paalvast, P., 1985. Oriënterend onderzoek naar de samenstelling van de
vispopulaties in de infiltratievijvers van de Duinwaterleiding van 's-
Gravenhage. Ecoconsult. In opdracht van de Duinwaterleiding van ‘s-
Gravenhage.