Ecological risks of pesticides in freshwater ecosystems ...
128
Ecological risks of pesticides in freshwater ecosystems Part 1: Herbicides
Transcript of Ecological risks of pesticides in freshwater ecosystems ...

Ecological risks of pesticides in freshwater ecosystems
Part 1: Herbicides

The research presented in this report is financially supported by STOWA and The Netherlands Ministry ofAgriculture, Nature Management and Fisheries. The translation of the report from Dutch into English wassponsored by the European Crop Protection Association.

Ecological risks of pesticides in freshwater ecosystems
Part 1: Herbicides
T.C.M. Brock, J. Lahr and P.J. Van den Brink
Alterra-Rapport 088
Alterra, Green World Research, Wageningen, 2000

ABSTRACT
Brock, T.C.M., Lahr, J. & Van den Brink, P.J., 2000. Ecological risks of pesticides in freshwater ecosystems Part1: Herbicides. Wageningen, Alterra, Green World Research. Alterra-Rapport 088. 124 pp.; 12 fig.; 9tab.; 20 app.
A literature review of freshwater model ecosystem studies with herbicides was performed 1) to assessthe NOECecosystem for individual compounds, 2) to compare these threshold levels with water qualitystandards, and 3) to evaluate the ecological consequences of exceeding these standards. Studies werejudged appropriate for this purpose when 1) the test systems simulated a realistic freshwatercommunity, 2) the experimental design was generally sound (ANOVA or regression design; exposureconcentrations described) and 3) when published in 1980 and later. Almost half of the collectedpapers did not meet these selection criteria. Effects were classified according to their magnitude andduration. The most sensitive endpoints for photosynthesis inhibitors, the most widely studied groupof herbicides, were responses related to community metabolism and the structure of phytoplankton,periphyton and macrophytes. These endpoints showed a clear dose-response relationship. The criteriaas set by the Uniform Principles appeared to provide sufficient protection for aquatic ecosystemsagainst herbicides. Possible exceptions are the herbicides with an auxin-simulating mode of action,because aquatic macrophytes appeared to be more sensitive to these substances than algae. Functionalresponses of communities in phytoplankton-dominated ecosystems sometimes recovered rapidlythrough shifts in algae species composition and adaptation. Indirect effects on the zooplankton insuch systems generally occurred at higher concentrations than primary effects. Adequate studies inmacrophyte-dominated systems were rare, but in several experiments a pronounced long-term declineof macrophytes was observed at chronic concentrations only slightly above the NOECecosystem . Thismay result in considerable indirect effects on the macrophyte-associated fauna. The most importantmodifying factors with respect to types of effects and recovery rates following the application ofherbicides to freshwater ecosystems are also discussed.
Keywords: ecological risk assessment, herbicides, freshwater ecosystems, microcosms, mesocosms,ecotoxicology, aquatic ecology, water quality
ISSN 1566-7197
This report can be ordered by paying 50,00 Dutch guilders into bank account number36 70 54 612 in the name of Alterra, Wageningen, The Netherlands, with reference to Alterra-Rapport 088. This amount is inclusive of VAT and postage.
© 2000 Alterra, Green World Research,P.O. Box 47, NL-6700 AA Wageningen (The Netherlands).Phone: +31 317 474700; fax: +31 317 419000; e-mail: [email protected]
No part of this publication may be reproduced or published in any form or by any means, or stored ina data base or retrieval system, without the written permission of Alterra.
Alterra assumes no liability for any losses resulting from the use of this document.
Alterra is the amalgamation of the Institute for Forestry and Nature Research (IBN) and the WinandStaring Centre for Integrated Land, Soil and Water Research (SC). The merger took place on 1 January2000.
Project 20-10074 [Alterra-Rapport 088/HM/08-2000]

Contents
LIST OF ABBREVIATIONS 7
PREFACE 9
1 INTRODUCTION 11
2 MATERIAL AND METHODS 132.1 Collected literature 132.2 Criteria for the selection of suitable (semi) field studies 132.3 Endpoints and recovery 142.4 Criteria for the classification of effect classes 152.5 Comparison of herbicides 172.6 Comparison of ecological threshold values with criteria 18
3 AVAILABLE INFORMATION 213.1 Used studies 213.2 Photosynthesis inhibitors 213.3 Auxin simulators 223.4 Other herbicides (growth inhibitors) 22
4 APPLICATION METHOD AND BEHAVIOUR IN SURFACE WATER 25
5 SENSITIVE ENDPOINTS 275.1 Hormesis 275.2 Photosynthesis inhibitors 285.3 Auxin simulators 315.4 Other herbicides (growth inhibitors) 34
6 INDIRECT EFFECTS 37
7 RECOVERY 41
8 EVALUATION OF THE SETTING OF CRITERIA 438.1 Photosynthesis inhibitors 438.2 Auxin simulators 448.3 Other herbicides (growth inhibitors) 45
9 GENERAL DISCUSSION 47
10 CONCLUSIONS 49
11 RECOMMENDATIONS FOR ECOSYSTEM EXPERIMENTS WITHHERBICIDES 51
12 REFERENCES 53
APPENDICES 63


Alterra-Rapport 088 7
LIST OF ABBREVIATIONS
ASTM American Society for Testing and Materials, Philadelphia14C (radioactive) carbon-14CAB Chemical Abstracts2,4-D 2,4-dichlorophenoxy acetic acid2,4-D BBE butoxyl ester of 2,4-D2,4-DP 2,4-dichlorophenolDLO Agricultural Research Department, Wageningen, The NetherlandsDMF dimethylformamideDMSO dimethylsulphoxide acidDNOC dinitro-orthocresolDO dissolved oxygenDOC dissolved organic carbonDT50 half-life value for degradationEC50 concentration at which effects occur in 50% of the number of test
organismsEPA Environmental Protection Agency (USA)EU European Union, Brusselsgm-EC50 geometric mean of different EC50 values of the same test speciesHRAC Herbicide Resistance Action Committee, LeverkusenLOEC lowest concentration at which an effect is observedLOECeco LOEC for the most sensitive endpoint studied in the ecosystemLC50 concentration at which mortality occurs in 50% of the number of test
organismsLNV Ministry of Agriculture, Nature Management and Fisheries, The
NetherlandsMCPA methoxychlorophenoxy acetic acidMCPP mecopropMPC Maximum Permissible ConcentrationMSMA monosodiummethyl arsenateNefyto Dutch Association of Agrochemical Industries, The HagueNOEC highest concentration at which no effect is observedNOECeco NOEC for the most sensitive endpoint studied in the ecosystemNW4 Fourth Memorandum Water ManagementOECD Organisation for Economic Co-operation and Development, ParisPCB polychlorobiphenylPD Plant Protection Service, Wageningen, The NetherlandsPOC Particulate Organic CarbonRIKZ National Institute for Coastal and Marine Management, Middelburg, The
NetherlandsRIVM National Institute of Public Health and the Environment, Bilthoven, The
NetherlandsRIZA National Institute for Inland Water Management and Waste Water
Management, Lelystad, The NetherlandsSTOWA Foundation for Applied Water Research, Utrecht2,4,5-T 2,4,5-trichlorophenoxy acetic acidTUgsa Toxic Units on the basis of the most sensitive standard alga; concentration
active ingredient in the water (Cw) divided by the gm-EC50 of the mostsensitive standard alga
UP Uniform Principles (registration criteria for crop protection productsaccording to the EU)
WU Wageningen University


Alterra-Rapport 088 9
PREFACE
This report on the ecological risks of herbicides in freshwater ecosystems is atranslation of a STOWA/SC-DLO report from Dutch. The reference of the originalreport is:
Lahr, J., van den Brink, P.J. & Brock, T.C.M. (1998): Ecologische risico's vanbestrijdingsmiddelen in zoetwater ecosystemen, deel 1: herbiciden. STOWApublicatie 98-30, Utrecht.
The translation of the report from Dutch into English was sponsored by theEuropean Crop Protection Association. Theo Brock (Alterra) was responsible for thefinal editing of the English version.
During the past years, researchers of Alterra - in collaboration with WageningenUniversity (WU), the National Institute of Public Health and the Environment(RIVM), and the National Institute for Inland Water Management and Waste WaterManagement (RIZA) - conducted experiments in artificial ecosystems with theobjective to validate the water quality criteria for pesticides. Other (foreign) researchinstitutes also conducted experiments of which the results have been published in thescientific literature. This information can also be used to establish ecologicalthreshold values for pesticides in surface water.
This report is the first of the project “Ecological risks of pesticides in surface water”and deals with the herbicides. The second report of the project will discuss theecological risks of insecticides. The research project, which was financially supportedby STOWA and The Netherlands Ministry of Agriculture, Nature Management andFisheries, aims to provide insight into the correctness of the applied water qualitycriteria and the ecological consequences of criteria being exceeded. For this, resultsof experiments with individual herbicides in aquatic (semi) field situations have beencollected and evaluated. The project results allow a better estimation of the ecologicalrisk of calculated and measured pesticide concentrations in surface waters. Thisknowledge is also useful for the interpretation of (semi) field studies in the context ofthe registration policy of pesticides.
René van Wijngaarden (Alterra) made an important contribution in developing theprocedure to evaluate the literature. The library staff of Alterra made an importantcontribution through their attentive assistance in collecting the literature. FromSTOWA, the project was initiated by Sjoerd Klapwijk and guided by Bas van derWal, and from LNV by Her de Heer. The report was also discussed with Gertie Arts(Alterra), Margriet Beek (RIZA), Jolande de Jonge (RIZA), Jos Notenboom (RIVM),Erik van de Plassche (RIVM), and Dick Vethaak (RIKZ). Their constructivecriticism has gratefully been used.

10 Alterra-Rapport 088

Alterra-Rapport 088 11
1 INTRODUCTION
This report presents an analysis of the actual ecological risks of herbicides infreshwater ecosystems. Actual risks are understood to be risks that have beenestimated on the basis of experimental observations in (semi) field experiments. InThe Netherlands, various reports have been published in which the aquaticecotoxicology of pesticides are discussed (e.g., Ordelman et al., 1993; Crommentuijnet al., 1997; Teunissen-Ordelman et al., 1997). These reports present information onphysico-chemical properties, presence in surface water, toxicity to aquatic organisms,and criteria-setting. Results of controlled (semi) field experiments with herbicideshave, however, hardly been included in these reports. A comparison of the sensitivityof aquatic species between laboratory tests and micro/mesocosm experiments hasbeen presented by Emans et al. (1992) and Jak et al. (1994) for a limited number ofherbicides. A recent overview of the ecological impact of herbicides in freshwaterecosystems, however, is lacking. This report attempts to fill this gap by presenting areview of the available information on ecological effects of herbicides in freshwaterecosystems.
The available literature shows that descriptive hydrobiological field research intoeffects of herbicides is scarce, and that such field research is often difficult tointerpret due to the spatial and temporal variation in environmental conditions andthe lack of a well-described, untreated reference system. This is the reason why thedata presented in this report are mainly based on experiments in aquatic modelecosystems, also called –depending on their dimensions- microcosms (relativelysmall) or mesocosms (relatively large). An advantage of these experimentalecosystems constructed by the researcher is that they can be replicated. This offersthe possibility to do research at the ecosystem level under controlled conditions.These systems also have the advantage that several concentrations of a pollutant canbe tested at the same time, and that responses in treated systems can be comparedwith controls.
Microcosms and mesocosms are constructed by collecting parts of naturalecosystems and bringing these into an artificial housing or by enclosing parts ofexisting ecosystems in the field (enclosures). These test systems are considered as anexperimental tool bridging the gap between controlled laboratory experiments andthe variable and complex conditions in the field. In other words they link trueexperimental reproducibility and ecological realism (Figure 1). For a discussion ofthe advantages and shortcomings of such systems in comparison with natural aquaticecosystems we refer to Brock et al. (1993a; 1995).
The objectives of the literature review presented in this report are:
a) compiling an inventory of the NOECeco and LOECeco values for individualherbicides in surface water as these have been established experimentally bymeans of freshwater model ecosystems (microcosms, mesocosms) or adequate

12 Alterra-Rapport 088
field studies. The NOECeco is the highest tested concentration at which no, orhardly, effects on the structure and the functioning of the studied (model)ecosystem are observed; the LOECeco is the lowest tested concentration at whichclear effects occur. It is also investigated whether it is necessary to make adistinction between exposure regime and application frequency (single versusmultiple);
b) comparison of these NOECeco’s with registration and water quality criteriaderived for herbicides in surface water;
c) evaluation of the ecological consequences of criteria being exceeded, includingindirect (secondary) effects and recovery time.
Sales of herbicides in The Netherlands in 1995 amounted to 3 070 000 kg activeingredient, about 28% of the total amount of pesticides sold in The Netherlands(Nefyto, 1996). Herbicides are classified into a number of chemical groups withdifferent modes of action. The anilids (212 000 kg), dinitroalkyl phenols (151 000 kg),phenoxycarbon acids (phenoxyacetic acids and phenoxypropionic acids and esters:414 000 kg), thiocarbamates (196 000 kg), triazines and triazinones (412 000 kg), ureacompounds (349 000 kg) and aminophosphonates (344 000 kg) are the mostfrequently used herbicides in The Netherlands (Nefyto, 1996). For this study wehave classified the herbicides into three groups on the basis of differences in mode ofaction, i.e.: photosynthesis inhibitors, auxin simulators and other substances. This lastgroup can also be considered as growth inhibitors because the mechanism of mostcompounds in this group can broadly be considered as such.
Figure 1. Experimental ecosystems as bridge to the field.
Alterra-Rapport 088 13
2 MATERIAL AND METHODS
2.1 Collected literature
The literature database present at Alterra served as basis for the study. This databasehas been formed over the years and is kept up-to-date by means of the literaturebulletins ‘Chemical Abstracts’ and ‘Currents Contents’. The existing database waschecked for possible gaps through a specific literature search, for which theprogramme ‘Winspirs’ (version 2.0) was used. This programme was used to searchthe databases of ‘Agris Current’ (1980 - today), ‘Biological Abstracts’ (December1989 – today), and ‘CAB-Abstracts’ (1980 – today). Publications up to and includingJune 1997 have been included in this literature search.
2.2 Criteria for the selection of suitable (semi) field studies
The following criteria were applied in the selection of the studies:
1. The test system is representative of a realistic freshwater community (organismsrepresent various trophic levels, primary producers are most important in case ofherbicides, but consumers and decomposers are preferably also present).
2. The description of the experimental set-up is adequate and unambiguous.
3. The exposure concentrations that are relevant for the study can be derived (atleast the nominal concentrations are known) and harmful solvents have not beenused to apply the herbicide.
4. The investigated ‘endpoints’ (parameters selected as measuring target) aresensitive to the substance and the effects can reasonably be expected to berelated to the modes of action of herbicides. Especially primary producers (suchas phytoplankton, periphyton, macrophytes) are considered as sensitiveendpoints for herbicides.
5. The effects are statistically significant and show an unambiguous dose-effectrelationship, or the observed effects are in agreement with a dose effectrelationship from additional studies.
6. For the establishment of a NOECeco, at least the lowest test concentration withina study should not show a consistent effect that can be attributed to thetreatment; the concentration above the NOECeco shows a clear effect (LOECeco).
7. Toxicity data of standard test organisms (at least one algal species) and/or waterquality criteria (MPC’s) should be known for the comparison of fieldconcentrations with criteria concentrations.

14 Alterra-Rapport 088
8. The study was published in 1980 or later.
Subsequently, the selected studies were classified according to mode of action of theherbicides (photosynthesis inhibitors, auxin simulators, growth inhibitors), exposureregime (single, multiple, or continuous exposure), and type of test system (stagnantor running). Many of the evaluated studies in running water were conducted inrecirculating systems, which means that the exposure is in fact comparable to that ina stagnant system. Studies with dosing of a herbicide in (non-recirculating) runningwater were only sporadically found.
2.3 Endpoints and recovery
Besides effects on structural endpoints (such as densities of algae and biomass ofaquatic plants), important effects on functional endpoints are also to be expected inexperiments with herbicides. This especially concerns effects on primary production.This can be measured indirectly as a decrease of DO (the amount of dissolvedoxygen) and pH. Another possibility is the direct measurement of primaryproduction and respiration by incubation of water samples or substrates withperiphyton or plants and by measuring the dynamics of 14C.
An advantage of experiments conducted outdoors in comparison with modelecosystem experiments conducted in the laboratory is that more realistic informationcan be obtained about the recovery of disturbed populations and ecosystemfunctions after termination of the stress. We consider an endpoint in a stressedsystem recovered if this, after a significant increase or decrease as direct or indirectresult of the treatment, becomes consistent again with the normal range of thecontrol systems. On theoretical grounds, the recovery of affected endpoints in (semi)field situations may occur if:• the toxic substance disappears and/or the biological availability of the substance
decreases to such an extent that the critical threshold values are ‘underceeded’,and;
• the other relevant environmental conditions (such as food supply, nutrients,temperature) do still, or again, meet the requirements of the affected populations,and;
• the generation time of the affected species is shorter than the duration of thestudy, and;
• recolonisation from outside the system can take place in case of completedisappearance of species.
Microcosm studies that have been conducted in the laboratory do in many cases notmeet the two last-mentioned boundary conditions. These experiments generally onlyyield information on recovery of populations which possess resistant life stages andwhich can complete their life cycle in a short period in the microcosm.
Adaptation is regularly observed in studies with herbicides (see references Figure 12).This is in particular reported for phytoplankton and periphyton, probably due to
Alterra-Rapport 088 15
their short generation time. There are two types of adaptation. In the first case, themost sensitive algae disappear but less sensitive species increase in number due todecreased competition for nutrients, CO 2 etc. (adaptation of the community).Adaptation may, however, also occur within a population of a single species, inwhich case the resistant individuals reproduce until the population recovers.Functional endpoints, such as primary production, may, in case of continuousexposure to the herbicide, recover as a result of adaptation, despite a prolongedchange in species competition. In most studies, adaptation is not directly measured(e.g. by an increased tolerance towards the pesticide), but the occurrence of thephenomenon is also deduced from the fact that functional parameters and/orindividual populations recover while the substance remains present in the system fora long time.
2.4 Criteria for the classification of effect classes
The effects of treatments with herbicides described in the literature are classifiedaccording to sensitivity of the response of the studied endpoints. The endpoints aresubdivided into eight groups: community metabolism, phytoplankton, periphyton,macrophytes, zooplankton, macrocrustaceans and insects, molluscs, and fish andamphibians. The effects reported on these endpoint are classified into five effectsclasses that are based on the following criteria:
Class 1: ‘effect could not be demonstrated’• no effects observed as result of the treatment (primarily, statistical significance
plays an important role for this criterion), and• observed differences between treatment and controls show no clear causal
relationship.
Class 2: ‘slight effect’• effects reported in terms of ‘slight’; ‘transient’, and• short-term and/or quantitatively restricted response of sensitive endpoints, and• effects only observed at individual samplings.
Class 3: ‘pronounced short-term effect’• clear response of sensitive endpoints, but total recovery within 8 weeks after the
last application, and• effects reported as ‘temporary effects on several sensitive species’; ‘temporary
elimination sensitive species’; ‘temporary effects on less sensitivespecies/endpoints’, and
• effects observed at some subsequent samplings.
Class 4: ‘pronounced effect in short-term study’• clear effects (such as strong reductions of functional endpoints and elimination
of sensitive species) observed, but the study is too short to demonstrate completerecovery within 8 weeks after (the last) application of the pesticide.

16 Alterra-Rapport 088
Class 5: ‘pronounced long-term effect’• clear response of sensitive endpoints and recovery time of sensitive endpoints is
longer than 8 weeks after the last application, and• effects reported as ‘long-term effects on many sensitive species/endpoints’;
‘elimination sensitive species’; ‘effects on less sensitive species/endpoints’ and/orother similar descriptions, and
• effects observed at various subsequent samplings.
For all eight groups of endpoints, it was established for each studied concentration ofeach study into which effect class the response could be classified. Plotting theseresults against the tested (nominal) concentrations yields a picture of the reportedeffects and at which concentrations these occur (see Figure 3 as example).
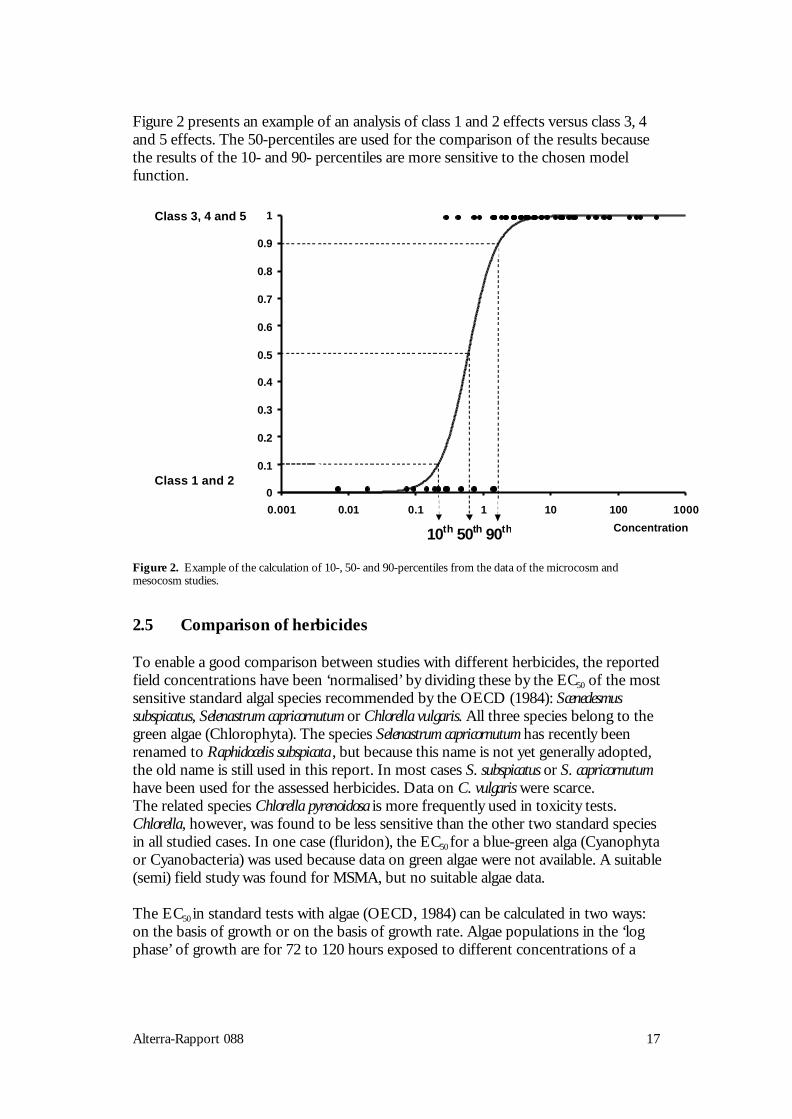
To present a summary of all obtained results (and their variation), the data aspresented in Figure 3 have also been analysed with logistic regression; a distinctionwas made between studies with a single and with multiple/chronic applications, forwhich the effect classes were reduced to a binary variable (yes/no; 0/1). The effectclasses were classified in three different ways: no versus slight and clear effect (Class1 versus 2,3,4,5); no and light versus clear effect (Class 1,2 versus 3,4,5) and recoveryversus no recovery within 8 weeks (class 1,2,3 versus 5). The first classification canbe considered as a ‘worst case’; all effects, however small, are included. The secondclassification is somewhat more liberal, slight effects occurring at a single samplingare not considered as negative. The third classification determines whether or not theendpoint has been able to recover within 8 weeks. Class 4 effects are not taken intoconsideration in this classification because the duration of these studies was too shortto determine whether or not the studied endpoints did recover within 8 weeks. Thefollowing logistic model was used for these calculations:
1y = ——————— ,
1 + e-b(Ln(x)-a)
in which y is the response variable (yes/no effect; yes/no recovery), x is theconcentration expressed in TUgsa, a is the concentration at which for 50% of thestudies an effect or no recovery has been reported, and b is the slope of the sigmoidcurve at this concentration.The 10-, 50- and 90-percentiles have been calculated by means of this function; i.e.,those fitted concentrations (expressed in TUgsa; for calculation see Section 2.5) forwhich it is predicted that in 10, 50 and 90%, respectively, of the studies an effect orno recovery occurs. The 95% confidence intervals for these percentiles have alsobeen calculated. A distinction has been made between functional and structuralendpoints. The response of community metabolism has been used as functionalendpoint, the most sensitive measured response of the primary producers asstructural endpoint. The calculations have been performed with the GENSTATstatistical programme (Payne & Lane, 1993).
Alterra-Rapport 088 17
Figure 2 presents an example of an analysis of class 1 and 2 effects versus class 3, 4and 5 effects. The 50-percentiles are used for the comparison of the results becausethe results of the 10- and 90- percentiles are more sensitive to the chosen modelfunction.
Figure 2. Example of the calculation of 10-, 50- and 90-percentiles from the data of the microcosm andmesocosm studies.
2.5 Comparison of herbicides
To enable a good comparison between studies with different herbicides, the reportedfield concentrations have been ‘normalised’ by dividing these by the EC50 of the mostsensitive standard algal species recommended by the OECD (1984): Scenedesmussubspicatus, Selenastrum capricornutum or Chlorella vulgaris. All three species belong to thegreen algae (Chlorophyta). The species Selenastrum capricornutum has recently beenrenamed to Raphidocelis subspicata , but because this name is not yet generally adopted,the old name is still used in this report. In most cases S. subspicatus or S. capricornutumhave been used for the assessed herbicides. Data on C. vulgaris were scarce.The related species Chlorella pyrenoidosa is more frequently used in toxicity tests.Chlorella, however, was found to be less sensitive than the other two standard speciesin all studied cases. In one case (fluridon), the EC50 for a blue-green alga (Cyanophytaor Cyanobacteria) was used because data on green algae were not available. A suitable(semi) field study was found for MSMA, but no suitable algae data.
The EC50 in standard tests with algae (OECD, 1984) can be calculated in two ways:on the basis of growth or on the basis of growth rate. Algae populations in the ‘logphase’ of growth are for 72 to 120 hours exposed to different concentrations of a
0
0.1
0.2
0.3
0.4
0.5
0.6
0.7
0.8
0.9
1
0.001 0.01 0.1 1 10 100 1000
Concentration
Class 3, 4 and 5
Class 1 and 2
10th 50th 90th

18 Alterra-Rapport 088
substance. The measured endpoints may range from number of cells and biovolumeto wet or dry weight or chlorophyll-a content of the population. In the case ofgrowth, the EC50 is calculated as the concentration at which there is a 50% reductionof one of these parameters in comparison with the control after 72-120 hours. In thecase of growth rate, the EC50 is derived from the slope of the growth curves. Bothvalues are not necessarily the same.
The publications of Crommentuijn et al. (1997), Solomon et al. (1966) (atrazine),Fairchild et al. (1977) and the references from the papers on the evaluated (semi) fieldstudies were used as first information source of the toxicity data, followed by asearch in on-line literature data bases for some substances. In case more EC50’s wereavailable for algae, the geometric mean of these was calculated for the most sensitivespecies. This procedure was followed because deviating EC50 values (if any) are thusgiven less weight. The geometric mean of available EC50 values for the selectedstandard test species is in the following of this report referred to as ‘gm-EC50’. Whenestablishing the gm-EC50, no distinction has been made between those based ongrowth or on growth rate because the variation between the EC50’s per alga speciesdue to the different sources was larger than the variation due to the appliedcalculation method and/or endpoints.
One of the objectives of this report is the mutual comparison of experiments withdifferent herbicides, for which the tested concentrations have been normalised fortheir toxicity to the most sensitive standard test alga; the water concentration astested in the different experiments has been divided by the gm-EC50 of the mostsensitive standard alga. The unit of the resulting variable is defined as TUgsa (ToxicUnit of the most sensitive standard alga).
Besides the EC50 values for standard algae, the available data for duckweed, Lemnaspp., were collected. This concerned tests with different species for which OECDprotocols do not yet exist. The duration of these tests ranges from 4 days to 3 weeks.Seven days is recommended in a provisional document of the ASTM (1997).
All collected toxicity data for standard algae and duckweed are included in theappendices. Only the gm-EC50’s or the water concentrations expressed in TUgsa arepresented in the following of the main report.
Although it is likely that algae are the most sensitive test species for herbicides,attention has also been paid to the toxicity of the evaluated substances to Daphniaand fish. For one substance, triallate, the acute 48-h LC50 value for Daphnia is similarto that for standard algae. This value is also reported in Appendix 18. Fish are –forall studied substances- less sensitive than standard algae.
2.6 Comparison of ecological threshold values with criteria
The ecological threshold values (NOECeco’s) obtained from (semi) field studies arecompared with the criteria applied in The Netherlands. For pesticides in surface

Alterra-Rapport 088 19
water, a distinction can be made between registration criteria and water qualitycriteria. The water quality criteria are based on the Maximum PermissibleConcentration (MPC). In case more than 4 adequate chronic toxicity data for aquaticorganisms are available, the MPC is established according to the method describedby Aldenberg & Slob (1993). In case less than 4 chronic NOEC’s are available, theMPC is determined according to the modified EPA-method as described byCrommentuijn et al. (1997).
Registration criteria are based on the criteria described in the Uniform Principles(EU, 1997). According to the Uniform Principles, the concentration of a pesticide insurface water may not be higher than 0.01 x the acute L(E)C50 for fish or Daphnia and0.1 x the EC50 for algae in the first tier of the risk assessment. In addition, theaverage exposure concentration may not be higher than 0.1 x the chronic NOEC forDaphnia (21 days) and fish (28 days) in case of prolonged exposure. Within the Dutchlegal framework, however, for algae the first-tier criterion of 0.1 x NOEC is applied.In the second tier there may be a deviation from the above-mentioned registrationcriteria provided that it is demonstrated by means of an adequate risk assessment thatthe actual risk to aquatic organisms is acceptable.
Criteria according to the Uniform Principles (UP criterion) are in this reportestablished on the basis of toxicity data for algae species according to OECDprotocols. These were in all cases the most sensitive group of standard test species.We define a liberal and a conservative UP criterion. The lowest EC50 value reportedin the literature for one of the above-mentioned standard algae is taken as a basis forthe calculation of the conservative UB criterion by dividing this value by a factor 10.The liberal UP criterion is established by dividing the gm-EC50 described in thepreceding section by a factor 10.

20 Alterra-Rapport 088

Alterra-Rapport 088 21
3 AVAILABLE INFORMATION
3.1 Used studies
A number of 124 studies describing the effects of herbicides on an aquatic system werefound in the literature, of which 29 had to be dropped immediately because the studieshad not been conducted in (entirely) fresh water or because they had been publishedbefore 1980, and their experimental design usually was not in line with recent guidelines.Of the remaining 95 studies, 39 (41%) did not meet the evaluation criteria described inSection 2.2 of this report. An important reason for this was in many cases an inadequatestatistical basis of the data. This was in particular found in experiments with a so-calledregression design, and in which the various treatments were not replicated. But thequality of the statistical analyses of the replicated studies was also quite often belowstandard. Most publications of this last group, however, have been included in thereview. In some cases, the effects in unreplicated studies were so clear that they could inthe end still be used. The observed effects should in such cases, however, be madeplausible by the results of better conducted and comparable experiments by otherauthors or by a good correlation with acute toxicity data.
First, extensive summaries have been prepared of the selected studies; these werethen included in a spreadsheet where each study was allocated a study number. Aconcise version of these summaries is presented in Appendices 1-20 of this report,where the herbicides are arranged per individual compound in the order of increasingconcentrations.
3.2 Photosynthesis inhibitors
This group includes the triazines/triazinones and the urea compounds. Thesesubstances block the electron transport in the Hill reaction of photosystem II, whichmeans that primary producers such as higher plants and algae can no longer supplytheir energy need (Van Rijn et al., 1995). Important representatives of the triazines areatrazine and simazine, and representatives of the urea compounds are isoproturon,linuron, monolinuron and diuron. Most of these products are used as herbicides inarable farming and horticulture; they are applied as residual (soil-applied) herbicides.
Table 1 presents a review of the 37 studies with photosynthesis inhibitors that werefound to meet the criteria. The studies include 7 active ingredients of which atrazinewas by far the most elaborately studied compound (over half of the number ofstudies in the table). Most of the experiments were conducted in stagnantexperimental systems. Hexazinone is the only mentioned substance that is notregistered in The Netherlands.
Products from the group of the photosynthesis inhibitors are very frequently foundin fresh water in The Netherlands. In a study of large surface waters Phernambucq et

22 Alterra-Rapport 088
al. (1996) found traces of atrazine and simazine in just about 100% of all samples.Diuron and isoproturon were found in more than 50% of the cases. The highesttriazine concentrations that were found during various monitoring studies were 14µg/L atrazine, 2.5 µg/L simazine and 1.1 µg/L terbutryn (Ordelman et al., 1993).This in particular concerned regional waters. Maximum concentrations in the largernational waters were lower. The highest urea compound concentrations in nationalwaters were 43, 4.0 and 2.2 µg/L for diuron, isoproturon and linuron, respectively(Teunissen-Ordelman et al., 1997). It can, however, not be excluded that themaximum concentrations of these substances in the regional areas will be higher butthe particular report does not include data on this.
3.3 Auxin simulators
The group of auxin simulators includes different groups of phenoxycarbon acids.These are taken up by the roots or the leaves of plants and imitate the action of theauxin hormone that regulates the growth of plants. Because phenoxycarbon acids donot decompose in plants, these are literally growing to death (Van Rijn et al., 1995).The effects of phenoxyacetic acid 2,4-D were studied in half of the 8 adequatestudies (Table 2). Studies with 2,4,5-T, the pyridine compounds picloram andclopyralid, and the pyridyloxy acetic acid trichlopyr were also found. Manyexperiments with substances from this group were published before 1980 and/orwere found to be inadequate for other reasons. Studies with the well-knownhormone-type herbicides such as the frequently used products MCPA, mecoprop(MCPP) and dichlorprop (2,4-DP) could therefore not be evaluated in the context ofthis review. Of the substances in Table 2, 2,4-D, clopyralid and trichlopyr areregistered in The Netherlands.Phernambucq et al. (1996) found 2,4-D in over 10% of the samples from nationalwaters in The Netherlands; 2,4,5-T was found in about 4% of the cases. Themaximum 2,4-D concentration found in national waters was 23 µg/L.
3.4 Other herbicides (growth inhibitors)
The group of other herbicides in the context of this report includes all products thathave no direct photosynthesis-inhibiting or hormone-simulating effect. Most of thesesubstances have a growth- or cell-division-inhibiting effect by disrupting biosynthesis andgrowth processes in the cell. The number of suitable studies in this category was 11.Diquat was the most frequently studied compound. The studies are presented in Table 3.
The bipiridyl compounds diquat and paraquat disrupt the plant’s photosystem-I byforming harmful oxygen radicals (superoxides) that affect plant tissue. Fluridon is a4-pyridon that disrupts carotene synthesis. Metsulfuron-methyl is a sulfonyl-ureawhich, contrary to the related urea compounds, does not disrupt photosynthesis butinhibits amino acid synthesis and cell division. Alachlor is one of the anilids. Thisgroup probably affects protein and fatty acid synthesis and decreases cell division androot elongation in plants. Triallate is one of the thiocarbamates and trifluralin is a

Alterra-Rapport 088 23
dinitroanilin. Both compounds also inhibit cell division and elongation. Finally, themode of action of MSMA, an organo-arsenic compound, is not known.
Table 1. Ecosystem experiments with photosynthesis-inhibiting herbicides included in this report.
Active Test system Water regime Dose Location Reference(s); [Study no.]ingredient
atrazine microcosms, lab. stagnant single USA, Georgia Brockway et al., 1984; [11]1atrazine exp. ponds stagnant single France, Paris Baturo et al., 1995; [6]atrazine microcosms, lab. stagnant single USA, Missouri Johnson,1986; [7]atrazine microcosms, lab. stagnant single USA, Oregon Stayet al, 1989; [11]atrazine exp. streams, lab. recirculating single USA, Vermont Guessner et al., 1996; [5]atrazine exp. streams, outd. recirculating single USA, Texas Moorhead et al., 1986; [17]atrazine exp. ponds stagnant single USA, Montana Fairchild et al., 1994; [13]atrazine microcosms, lab. stagnant single USA, Oregon Stay et al, 1985; [14]atrazine natural stream flow-through two pulses USA, Nebraska Jurgensen et al., 1990; [19]atrazine exp. ponds stagnant multiple USA, Kansas DeNoyelles et al., 1982; [10]
Dewey, 1986Kettle et al., 1987DeNoyelles et al., 1989DeNoyelles et al., 1994
atrazine enclosures in lake stagnant multiple Canada, Ontario Hamilton et al., 1987; [15]additive &single
atrazine microcosms, lab. flow-through constant USA, Georgia Brockway et al., 1984; [11]IIatrazine microcosms, lab. flow-through constant USA, Virginia Pratt et al., 1988; [2]atrazine enclosures in pond stagnant constant Germany, Bayern Jüttner et al., 1995; [3]atrazine microcosms, lab. stagnant constant Netherl, Wageningen Van den Brink et al., 1995; [4]atrazine enclosures in lake stagnant multiple Canada, Ontario Herman et al., 1986; [18]
additive Hamilton et al., 1988Hamilton et al., 1989
atrazine exp. streams, outd. recirculating constant USA, Texas Kosinski, 1984; [8]Kosinski & Merkle, 1984
atrazine exp. swamp flow-through constant USA, Minnesota Detenbeck et al., 1996; [9]atrazine exp. streams, outd? recirculating constant USA, Ohio Krieger et al., 1988; [12]atrazine microcosms, lab. flow-through constant USA, Georgia Hamala & Kollig, 1985; [16]simazine enclosures in swamp stagnant single Canada, Manitoba Goldsborough et al. '83; [21]
Goldsborough et al. 1986simazine enclosures in pond stagnant single Canada, Manitoba Goldsborough et al. '85; [22]simazine enclosures in swamp stagnant single Canada, Manitoba Gumey et al., 1989; [23]simazine microcosms in pond stagnant single USA, Virginia Jenkins et al., 1990; [24]terbutryn enclosures in swamp stagnant single Canada, Manitoba Goldsborough et al. '83; [21]
Goldsborough et al. 1986terbutryn enclosures in swamp stagnant single Canada, Manitoba Gumey et al., 1989; [23]terbutryn enclosures in pond stagnant single USA, Alabarna Struve et al., 1991; [25]terbutryn microcosms, lab. flow-through pulse UK, Bristol Paterson et al., 1987; [38]hexazinone enclosures in lake stagnant single Canada, Ontario Thompson et al., 1993a; [28]
Thompson et al., 1993 ahexazinone exp. streams, lab. & flow-through pulse Canada, Ontario Kreutzweiser et al., 1995; [26]
exp. streams, outd.hexazinone exp. streams, outd. flow-through pulse Canada, Ontario Kreutzweiser et al., 1992; [27]linuron enclosures in pond stagnant single UK, Kent Stephenson et al., 1984; [29]linuron microcosms, lab. stagnant constant Netherl., Wageningen Van den Brink et al., '97; [30]
Cuppen et al., 1997isoproturon microcosms, lab. stagnant single France, Bordeaux Feurtet-Mazel et al., '96; [31]isoproturon microcosms, lab. stagnant single France, Bordeaux Pérès et al., 1996; [32]isoproturon microcosms, lab. stagnant single Germany, München Traunspurger et al., '96; [42]diuron microcosms, lab. stagnant single USA, Minnesota Flum & Shannon, 1987; [20]

24 Alterra-Rapport 088
Table 2. Ecosystem experiments with auxin-simulating herbicides included in this report.
Active Test system Water regime Dose Location Reference(s); [Study no]ingredient
2,4-D exp. ponds stagnant single not mentioned Boyle, 1980; [33]2,4-D enclosures in pond stagnant single Can., Saskatchewan Forsyth et al., 1997; [34]2,4-D microcosms & lake stagnant single USA, Kentucky Kobriae & White, 1996; [35]2,4-D exp. ponds stagnant single Canada, Ontario Scott et al., 1981; [44]
Stephenson & Mackie, 1986Sherry, 1994
2,4,5-T microcosms, lab. stagnant single Japan Sugiura, 1992; [46]picloram enclosures in pond stagnant single Can., Saskatchewan Forsyth et al., 1997; [34]clopyralid enclosures in pond stagnant single Can., Saskatchewan Forsyth et al., 1997; [34]trichlopyr exp. streams, outd. flow-through pulse Can., Ontario Kreutzwelser et al., '92; [27]
Table 3. Ecosystem experiments with other groups of herbicides included in this report. Most substances have agrowth-inhibiting effect.
Active Test system Water regime Dose Location Reference(s); [Study no]ingredient
diquat microcosms, lab. stagnant constant & Germany Draxl et al., 1991; [36]single
diquat microcosms, lab. stagnant single USA, Pennsylvania Barreiro et al, 1994; [37]diquat microcosms, lab. stagnant single USA, Pennsylvania Pratt et al., 1990; [45]diquat microcosms, lab. flow-through pulse UK, Bristol Paterson et al., 1987; [38]paraquat exp. streams, outd. recirculating constant USA, Texas Kosinski, 1984; [8]
Kosinski & Merkle, 1984fluridon enclosures in pond stagnant single USA, Alabama Struve et al., 1991; [25]metsulfuron- enclosures in lake stagnant single Canada, Ontario Thompson et al., '93a; [28]methyl Thompson et al., 1993alachlor exp. streams, lab. recirculating single USA, Nebraska Spawn et al., 1997; [39]triallate microcosms, lab. stagnant single USA, Missouri Johnson, 1986; [7]trifluralin microcosms, lab. stagnant single USA, Missouri Johnson, 1986; [7]MSMA exp. streams, outd. recirculating constant USA, Texas Kosinski, 1984; [8]
Kosinski & Merkle, 1984
The nomenclature and classification of the above-mentioned products tend to showdifferences; we have followed the Nederlandse Gewasbeschermingsgids (Dutch CropProtection Guide, PD, 1996). Publications by Dejonckheere & Steurbaut (1966),Tomlin (1994), Van Rijn et al., (1995) and HRAC (1996) were used to describe themodes of action. Metsulfuron-methyl and triallate are registered in The Netherlands.No suitable studies were found for the frequently applied product glyphosate(Roundup), an amino-phosphonate that inhibits the amino acid synthesis of theplant.
From this group of other compounds trifluralin was found in waters in TheNetherlands (Phernambuq et al., 1996). The compound was, however, only found insome of the measurements; the maximum was 0.01 µg/L.

Alterra-Rapport 088 25
4 APPLICATION METHOD AND BEHAVIOUR INSURFACE WATER
The solubility of most herbicides in water is too low to be able to prepare a veryconcentrated aqueous solution. Concentrated solutions are, however, often desirablefor the experimental application of a herbicide in micro- and mesocosms, in whichcase organic solvents are used to prepare these. It is, however, known for mostsolvents used (ethanol, methanol, acetone) that these may be toxic to algae; they are,e.g., also used for the extraction of photopigments, such as chlorophyll, from plantmaterial. Hess (1980) found that cells of the alga Clamydomonas eugametos weredamaged at more than 10 mL/L (1% v/v) ethanol or dimethylsulfoxide (DMSO); thelimit for acetone was 5 mL/L (0.5% v/v). St. Laurent et al. (1992) reported NOECvalues of the same order of magnitude for Selenastrum capricornutum for methanol andacetone of 6.8 and 2.3 mL/L, respectively. Bérard (1996) observed shifts in species innatural phytoplankton communities at 0.5 mL/L ethanol, methanol, DMSO anddimethylformamide (DMF). Ethanol also had an inhibiting effect on chlorophyll-a inthe same experiment.
It is not clear whether direct toxicity to algae may also be the cause of sometimesenormous effects on the oxygen concentrations observed at still lower ethanolconcentrations. Feurtet-Mazel et al. (1996), e.g., found clear effects of ethanol at 0.5mL/L and below in microcosms. And it can be derived from other experiments thatethanol may reduce oxygen concentrations to almost zero even at concentrations of2.0-2.9 µL/L (Lay et al., 1984; Peichl et al., 1984, 1985; Lampert et al., 1989;Neugebaur, 1990). At the same time, these experiments show a strong pH decreaseand in some cases zooplankton even disappears. Lynch et al. (1985) dosedexperimental streams with atrazine and a PCB, for which the solvents acetone andDMSO were used, both at a concentration of 69 µL/L. Strong reductions of grossprimary production and community respiration (periphyton) were observed in thetreated streams as well as in the streams only dosed with the solvent. Because thecalculation of these parameters was based on the course of the oxygen concentrationin the systems, it is likely that also here reductions in the amount of dissolved oxygenwere the cause of the reductions in production and respiration. The drift ofmacroinvertebrates in the controls of this experiment also increased as a result ofsolvents. A possible explanation for the reductions in the oxygen concentrations byorganic solvents is suggested by Feurtet-Mazel et al. (1996), i.e., a direct or indirecteffect on the activity of (heterotrophic) bacteria. Without further additional research,however, it cannot be fully excluded that there is a direct toxic effect on algae under(temporary) reduction of the oxygen production.
It will be clear from the above that alternative, non-toxic solvents and methods ofapplication are to be preferred in experiments with herbicides. It can only beconcluded beyond doubt whether these carriers do or do not affect the results whenthe experiments include controls with as well as without organic solvents. All studies

26 Alterra-Rapport 088
of which we suspected that the solvent could have caused or masked the results (seethe above-mentioned syndrome of effects) have been excluded from this report.
In most (semi) field studies evaluated in this report, the products were directly mixedinto the water column. Injection and pouring on the water surface were the mostfrequently used methods for stagnant systems. Dosing in running systems usuallytook place via the main tank that fed the system with water or via dripping into thestream itself. In four studies the herbicide was applied with sprayers and in twostudies leaching was simulated by mixing the compounds with wet soil beforepouring this slurry into the system. Pellets of 2,4-D BBE were used in the study ofScott et al. (1988).
Half life values of several weeks to some months were measured for the triazine andurea compounds in the studies included in this report. Atrazine is the most persistentcompound with half life values (DT50’s) up to more than 6 months (DeNoyelles et al.,1982). The other herbicides are also relatively persistent. The reported DT50 valuesare usually higher than two weeks. According to the classification of Van Rijn et al.(1995) this means that the studied herbicides are ‘moderately degradable’ to ‘verypersistent’.
The studies are classified into three types: stagnant systems, recirculating (runningwater) systems and running water (non-recirculating) systems. The first two typeshave been combined because the exposure regime was the same; the substanceremained in the system and was not discharged. Studies conducted in running watersystems, in which the contaminated water was not again circulated, are, however,treated as a separate category. These systems were dosed in the form of pulses, wherebesides the nominal pulse concentration the duration of the pulse is an importantfactor. There were only a few of such studies; the results of these are only brieflydiscussed.
In most cases we used the reported nominal concentrations in the test systems asthese are given by the authors. In the studies where these concentrations wereverified by chemical analyses, they showed good correspondence with the foundvalues. We used the maximum measured peak concentration in case of single andmultiple dosing in stagnant and recirculating systems. The experiments are, in as faras exposure is concerned, classified into two groups: a single dose on the one handand a multiple or constant exposure on the other. Experiments of the last group arein the following of this report referred to as studies with multiple application.

Alterra-Rapport 088 27
5 SENSITIVE ENDPOINTS
The measured endpoints in the studies are subdivided into eight groups, where adistinction is made between functional and structural endpoints. Most measuredfunctional endpoints concerned the metabolism of the communities present. Theseinclude reductions of the amount of dissolved oxygen by direct inhibition of primaryproduction (14C uptake) or indirectly as a result of the disappearance of the primaryproducers themselves. In many studies, community respiration was also measured orderived. Besides primary producers, the heterotrophic community plays animportant role in processes related to respiration. There were, however, hardlystudies in which these organisms were investigated explicitly. Effects on nutrients,minerals, pH, alkalinity, conductivity and organic matter are discussed under theindirect effects in Chapter 6. Other functional endpoints, such as organic matterdegradation (decomposition) and microbial activity, were hardly measured in thesestudies. Kersting (1994) gives a review of responses of functional endpoints inpesticides-stressed freshwater ecosystems.
The consulted studies show large differences in taxonomic level of the presentedbiological data. Algae and periphyton, e.g., are only studied at species level in a third ofthe publications. Most studies are limited to the larger taxonomic units (Chlorophyta,Bacillariophyta, Cyanophyta etc.), or chlorophyll-a or metabolism are measured. Negativeeffects on Chlorophyta, the most frequently occurring and most frequently studied groupof algae, are reported in many cases, but Bacillariophyta, Cyanophyta and Pyrrophyta arealso found to be sensitive in many studies. It cannot be established unambiguouslywhich groups of algae or aquatic plants are most sensitive to herbicides. This is one ofthe reasons why the structural endpoints for a generic picture are divided into sevenfairly broad groups: phytoplankton, periphyton, macrophytes, zooplankton,macrocrustaceans and aquatic insects, molluscs, and finally the fish and amphibians(tadpoles). This classification broadly corresponds with the review by Brock & Budde(1994). Structural properties include parameters such as abundance (numbers, density,cover by aquatic plants etc.), species composition, biomass, diversity of a group oforganisms, and chlorophyll-a concentrations (measure of the biomass of primaryproducers). The biomass of fish (weight) is also considered as a structural property of thefish population. Effects of herbicides on microorganisms were studied so infrequentlythat these have not been included in the review.
5.1 Hormesis
Hormesis is the phenomenon that toxic substances may at low, sub-lethalconcentrations have a stimulating effect on organisms, especially on growth. It is afairly common phenomenon that can be observed in a wide range of toxicants andorganisms (Stebbing, 1982). There is no univocal explanation for hormesis but itcould signify regulatory overcorrections by the mechanisms that control biosynthesis(Stebbing, 1982).

28 Alterra-Rapport 088
Hormesis was observed in several cases in the herbicide studies reported here, inparticular for substances with an auxin-s(t)imulating effect (Kobriae & White, 1996;Forsyth et al., 1997). This is not difficult to explain because the effect of thesecompounds is based on the (over)stimulation of growth. For these substances thediagnosis of hormesis also strongly depends on the time of the observations. Asubstance such as 2,4-D initially causes an increase in growth of (aquatic) plants, latercausing the plant to die. Hormesis was also observed in some studies withphotosynthesis inhibitors and the group of other herbicides: atrazine and periphyton(Pratt et al., 1988), atrazine and phytoplankton (Jüttner et al., 1995), diquat and periphyton(Paterson & Wright, 1987), and triallate and primary production (Johnson, 1986).
None of the consulted studies, however, was explicitly aimed at the detection ofhormesis. The examples that were found usually concerned a slight and temporary effect.An additional factor is that it is very hard to distinguish hormesis from indirect positiveeffects within the complex communities of (semi) field experiments. Also because little isknown about the ecological relevance of the phenomenon, we did not include hormesisas an important ecological effect in this evaluation. At concentrations at which therewere indications of hormesis, we assumed that this had no negative effect on thecommunity and the ecosystem. These effects are therefore classified into Class 1.
5.2 Photosynthesis inhibitors
Figure 3 summarises the observed effects (expressed in classes) as these were found inthe different studies, and at which concentrations (expressed in TUgsa) these occurred.The most sensitive endpoints for photosynthesis inhibitors in stagnant or recirculatingtest systems are community metabolism and the structure of the phytoplankton,periphyton and macrophyte populations. Clear effects are observed from about 0.1 TUgsa
(Figure 3 A-D); no effects are observed at lower levels. The figure also shows a cleardose-effect relationship for these endpoints. The number of studies in which negativeeffects are reported as well as the class of the effects (Figure 3 A-D) increase withincreasing concentrations. The figure also shows that the effects classified into class 4and 5 start to occur at lower normalised concentrations (TUgsa) in the multiple orchronically dosed ecosystems than in the single dosed systems.
Figure 4 shows that the logistic regression in most cases yields 10- and 90-percentilevalues with a wide variation. The 10-percentile for, e.g., no or slight versus cleareffect of functional endpoints is 0.216 TUgsa (0.070-0.662) for a single load and 0.095TUgsa (0.032-0.280) for multiple applications. Because the 50-percentiles are theparameters with the lowest uncertainty, these are used for the comparison of theresults of functional and structural endpoints and of single and multiple applications.
The functional endpoints react somewhat stronger to a single and multipleapplication of a photosynthesis inhibitor than the structural endpoints related toprimary production (Figure 3A-D; Figure 4A and B). This may be because theseparameters often have a small ecological variation and can be measured fairlyaccurately.

Alterra-Rapport 088 29
Figure 3. Classified effects of herbicides with a photosynthesis-inhibiting effect in (semi) field studies withstagnant or recirculating test systems. The effects are classified into a functional category (communitymetabolism; A) and into several categories structural endpoints (B-H). The effects are also classified according tomagnitude and duration. 1 = no effect, 2 = slight effect, 3 = clear short-term effect (< 8 weeks), 4 = clear effectin short-term study (recovery moment unknown), 5 = clear long-term effect (> 8 weeks). For an extensivedescription of the effect classes we refer to Section 2.4. The small closed circles (•) indicate the experiments witha single application. The large open circles (¡) indicate the experiments with multiple or continuous exposure.TUgsa: Toxic Unit on basis of the EC50 of the most sensitive standard alga (see Section 2.5).
Community metabolism
0
1
2
3
4
5
0.001 0.01 0.1 1 10 100 1000
TUgsa
Eff
ect
clas
sPhytoplankton
0
1
2
3
4
5
0.001 0.01 0.1 1 10 100 1000
TUgsa
Eff
ect
clas
s
Periphyton
0
1
2
3
4
5
0.001 0.01 0.1 1 10 100 1000
TUgsa
Eff
ect c
lass
Macrophytes
0
1
2
3
4
5
0.001 0.01 0.1 1 10 100 1000
TUgsa
Eff
ect
clas
s
Zooplankton
0
1
2
3
4
5
0.001 0.01 0.1 1 10 100 1000
TUgsa
Eff
ect
clas
s
Macrocrustacea and insects
0
1
2
3
4
5
0.001 0.01 0.1 1 10 100 1000
TUgsa
Eff
ect
clas
s
Molluscs
0
1
2
3
4
5
0.001 0.01 0.1 1 10 100 1000
TUgsa
Eff
ect c
lass
Fish and tadpoles
0
1
2
3
4
5
0.001 0.01 0.1 1 10 100 1000
TUgsa
Eff
ect c
lass

30 Alterra-Rapport 088
Figure 4. 10-, 50- and 90-percentile values (expressed in TUgsa with 95% confidence intervals) as calculated bymeans of logistic regression for the most sensitive functional and structural endpoints after a single or multipleapplication of a photosynthesis inhibitor. The values are calculated for 3 classifications, A: no versus slight andclear effect, B: no and slight versus clear effect, and C: recovery versus no recovery within 8 weeks. When theclassification ‘no versus slight and clear’ effect is taken, a 50-percentile value of 0.17 TUgsa is calculated for thefunctional endpoints after a single application of a photosynthesis inhibitor. This means that it is predicted thatthe functional endpoints show a slight or clear response at a concentration of 0.17 Tugsa in 50% of the studies.
Figure 5. Classified effects of herbicides with a photosynthesis-inhibiting effect in (semi) field studies withstagnant or recirculating running test systems. The effects on the most sensitive endpoints in the separate studiesare presented. The effects are also classified according to magnitude and duration. 1 = no significant effect, 2 =slight effect, 3 = clear short-term effect (< 8 weeks), 4 = clear effect in short-term study (recovery momentunknown), 5 = clear long-term effect (> 8 weeks). The closed circles (•) indicate the experiments with a singleapplication.; the large open circles (¡) indicate the experiments with multiple exposure.
Photosynthesis inhibitors: no effect versus slight and clear effects, (class 1 versus 2,3,4,5)
Functional endpoints Structural endpoints
0.01
0.1
1
10
Single Multiple Single Multiple
TU
gsa
10th percentile 50th percentile 90th percentile
Photosynthesis inhibitors: no or slight effect versus clear effect(class 1,2 versus 3,4,5)
Functional endpoints Structural endpoints
0.01
0.1
1
10
Single Multiple Single Multiple
TU
gsa
10th percentile 50th percentile 90th percentile
Photosynthesis inhibitors: recovery versus no recovery within 8 weeks, (class 1,2,3 versus 5)
Functional endpoints Structural endpoints
0.01
0.1
1
10
100
1000
10000
Single Multiple Single Multiple
TU
gsa
10th percentile 50th percentile 90th percentile
Most sensitive endpoints
0
1
2
3
4
5
0.001 0.01 0.1 1 10 100 1000
TUgsa
Eff
ect
clas
s

Alterra-Rapport 088 31
Figure 5 shows the classified effects on the most sensitive endpoints. Only slighteffects on the most sensitive endpoints may be expected at a load around 0.1 TUgsa
(Figure 4A, 5). Slight to clear effects may be expected at higher doses ((Figure 4B, 5).At doses of 1 TUgsa and higher it is to be expected that the recovery of sensitiveendpoints takes more than 8 weeks (Figure 4C, Figure 5; see also Chapter 7).
There are probably only indirect effects at concentrations higher than 1 TUgsa on theother four structural groups (Figure 3E-H). These are discussed in Chapter 6. Theonly exception is a possible toxicity of linuron to rotifers at 15, 50 and 150 µg/L(Cuppen et al., 1997) and to Cladocera and Copepoda at 1000 µg/L linuron(Stephenson & Kane, 1984).
Three substances with a photosynthesis-inhibiting effect were pulse-dosed in runningsystems. Pulses of 24 hours with a maximum concentration of 100 µg/L (1.5 TUgsa)atrazine had no effect on periphyton of a natural stream (Jurgensen & Hoagland,1990). After an equally long exposure in a flow-through system terbutryn (maximum50 µg/L; 18.5 TUgsa) neither had an effect on periphyton and the aquatic plant Elodeacanadensis. Hexazinone in artificial steams, finally, hardly had negative effects onperiphyton and on drift of evertebrates at 2700 to 82 000 µg/L (60-1800 TUgsa). Inshort, the effects of herbicides in running systems are much less serious than of thesame concentrations in stagnant and recirculating ecosystems.
5.3 Auxin simulators
The number of suitable studies with substances with an auxin-simulating effect ismuch lower than those with the photosynthesis inhibitors (Figure 6). Studies with aconstant exposure were not found and data about the effects on periphyton andmolluscs are totally lacking (Figure 6 C and G). The picture of these compoundspresented by the remaining endpoints contrasts sharply with the photosynthesisinhibitors. Macrophytes are the most sensitive organisms. The turning point for thisgroup is between 0.003 and 0.01 TUgsa (Figure 6 D), whereas phytoplankton is lesssensitive; here, the first population effects are only observed from 2 TUgsa (Figure 6B). The turning point for community metabolism (primary production) lies betweenthese two values, at about 0.05 TUgsa (Figure 6 A). The observed effects onmacrocrustaceans, insects, fish and tadpoles are indirect effects (Chapter 6). Allpoints in Figure 6, except Figure 6 D, only concern 2,4-D. The Figure for aquaticplants (6 D) also includes observations for picloram and clopyralid.

32 Alterra-Rapport 088
Figure 6. Classified effects of herbicides with an auxin-simulating effect in (semi) field studies with stagnant orrecirculating test systems. The effects are classified into a functional category (community metabolism; A) andinto several categories structural endpoints (B-H). The effects are also classified according to magnitude andduration. 1 = no significant effect, 2 = slight effect, 3 = clear short-term effect (< 8 weeks), 4 = clear effect inshort-term study (recovery moment unknown), 5 = clear long-term effect (> 8 weeks). For an extensivedescription of the effect classes we refer to Section 2.4. The figure only includes studies with a single application.TUgsa: Toxic Unit on basis of the EC50 of the most sensitive standard alga (see Section 2.5).
Community metabolism
0
1
2
3
4
5
0.0001 0.001 0.01 0.1 1 10 100
TUgsa
Eff
ect c
lass
Phytoplankton
0
1
2
3
4
5
0.0001 0.001 0.01 0.1 1 10 100
TUgsa
Eff
ect c
lass
Periphyton
0
1
2
3
4
5
0.0001 0.001 0.01 0.1 1 10 100
TUgsa
Eff
ect
clas
s
Macrophytes
0
1
2
3
4
5
0.0001 0.001 0.01 0.1 1 10 100
TUgsaE
ffec
t cl
ass
Zooplankton
0
1
2
3
4
5
0.0001 0.001 0.01 0.1 1 10 100
TUgsa
Eff
ect
clas
s
Macrocrustaceans en insects
0
1
2
3
4
5
0.0001 0.001 0.01 0.1 1 10 100
TUgsa
Eff
ect
clas
s
Molluscs
0
1
2
3
4
5
0.0001 0.001 0.01 0.1 1 10 100
TUgsa
Eff
ect
clas
s
Fish and tadpoles
0
1
2
3
4
5
0.0001 0.001 0.01 0.1 1 10 100
TUgsa
Eff
ect
clas
s

Alterra-Rapport 088 33
Figure 7. 10-, 50- and 90-percentile values (expressed in TUgsa with 95% confidence intervals) as calculated bymeans of logistic regression for the functional and structural endpoints (split into phytoplankton andmacrophytes) after a single application of an auxin simulator. The values could only be calculated for theclassification (class 1 versus 4,5).* confidence intervals could not be calculated.
Figure 8. Classified effects of herbicides with an auxin-simulating effect in (semi) field studies with stagnant orrecirculating running test systems. The effects on the most sensitive endpoints are presented. The effects are alsoclassified according to magnitude and duration. 1 = no significant effect, 2 = slight effect, 3 = clear short-termeffect (< 8 weeks), 4 = clear effect in short-term study (recovery moment unknown), 5 = clear long-term effect(> 8 weeks). The figure only includes studies with a single application.
Due to the restricted number of data, logistic regression could only be performed onclassification 1 versus classifications 4 and 5 as result of a single application (Figure7). Because Figure 6 shows a large difference in response between aquatic plants andphytoplankton, the percentiles for these groups are calculated separately. Asexpected, the threshold values calculated for the macrophytes are much lower thanthose for phytoplankton and community metabolism. The 50-percentile for theeffects on macrophytes after a single application of an auxin simulator is 0.007(0.001-0.034) TUgsa. The criterion given in the UP (0.1 TUgsa) does therefore notguarantee protection of the macrophytes in case an auxin simulator is applied. Figure8 presents the classified effects on the most sensitive endpoints. All effects reportedfor a dose below 0.1 TUgsa are effects on macrophytes (cf. Figure 7 and 6 D).
No suitable studies with running test systems were found for auxin-simulatingherbicides.
Most sensitive endpoints
0
1
2
3
4
5
0.0001 0.001 0.01 0.1 1 10 100
TUgsa
Eff
ect c
lass
Auxin simulators: no versus clear effect(class 1 versus 4,5), single application
0.0001
0.001
0.01
0.1
1
10
100
Functional Phytoplankton Macrophytes
TU
gsa
10th percentile 50th percentile 90th percentile
*

34 Alterra-Rapport 088
5.4 Other herbicides (growth inhibitors)
With one observation in Class 4 at a concentration of 0.17 TUgsa, periphyton seemsto be the most sensitive to the group of other herbicides (Figure 9 C). Therepresentative substances in this figure are alachlor, diquat and paraquat. Thisobservation is based on the results of a single study into the effects of alachlor on thespecies composition of periphytic algae (Spawn et al., 1997). Effects of alachlor onother parameters than species composition (such as cell density and chlorophyllconcentration of the periphyton) were only found at 1.7 TUgsa. Negative effects onphytoplankton start to occur at 1 to 2 x EC50 (Figure 9 B). The structure of thephytoplankton and periphyton communities seem to be the most sensitive endpointsfor these growth-inhibiting herbicides. Aquatic plants are possibly somewhat lesssensitive but this cannot be said with certainty due to the small number of studies(Figure 9 D). The effect on structural characteristics of primary producers probablyonly has measurable consequences for community metabolism at higherconcentrations (first observed effects at 6 TUgsa, Figure 9 A). Nothing is knownabout the effects of this group of herbicides on macro-invertebrates, fish andtadpoles (Figure 9 F, G, H).
Figure 10 confirms the earlier presented picture; after a single application, thestructural endpoints are more sensitive than the functional endpoints. The 50-percentile for these endpoints is 0.64 (0.07-6.14) TUgsa and 53 TUgsa (14-199),respectively. The same picture does not exist for a multiple application, but thisevaluation is only based on one study.
Figure 11 indicates that if effects would be expected at a dose of 0.1 TUgsa, thesewould probably only be slight. It is also clear that the number of studies is too smallto draw a clear conclusion.
Figure 9 E shows that the first effects on zooplankton are observed at 0.3 TUgsa forstandard algae. All effects shown in the figure in Class 4 concern the product triallatein the study of Johnson (1986). This substance probably has a direct effect onzooplankton. Johnson (1986) himself gives an EC50 of 57 µg/L for Daphnia magna.This concentration corresponds with 1.2 TUgsa. This would explain a direct toxiceffect of triallate in the study. When triallate is ignored, (indirect) effects onzooplankton are only observed around 6 TU.

Alterra-Rapport 088 35
Figure 9. Classified effects of ‘other group’ herbicides (mainly with a growth-inhibiting effect) in (semi) fieldstudies with stagnant or recirculating running test systems. The effects are classified into a functional category(community metabolism; A) and into several categories structural endpoints (B-H). The effects are also classifiedaccording to magnitude and duration. 1 = no significant effect, 2 = slight effect, 3 = clear short-term effect (< 8weeks), 4 = clear effect in short-term study (recovery moment unknown), 5 = clear long-term effect (> 8 weeks).For a further description of the effect classes we refer to Section 2.4. The small closed circles (•) indicate theexperiments with a single application; the large open circles (¡) indicate the experiments with multiple orcontinuous exposure. TUgsa: Toxic Unit on basis of the EC50 of the most sensitive standard alga (Section 2.5).
Phytoplankton
0
1
2
3
4
5
0.01 0.1 1 10 100 1000
TUgsa
Eff
ect
clas
s
Periphyton
0
1
2
3
4
5
0.01 0.1 1 10 100 1000
TUgsa
Eff
ect
clas
s
Macrophytes
0
1
2
3
4
5
0.01 0.1 1 10 100 1000
TUgsaE
ffec
t cl
ass
Zooplankton
0
1
2
3
4
5
0.01 0.1 1 10 100 1000
TUgsa
Eff
ect
clas
s
Macrocrustaceans and insects
0
1
2
3
4
5
0.01 0.1 1 10 100 1000
TUgsa
Eff
ect
clas
s
Molluscs
0
1
2
3
4
5
0.01 0.1 1 10 100 1000
TUgsa
Eff
ect
clas
s
Fish and tadpoles
0
1
2
3
4
5
0.01 0.1 1 10 100 1000
TUgsa
Eff
ect
clas
s
Community metabolism
0
1
2
3
4
5
0.01 0.1 1 10 100 1000
TUgsa
Eff
ect
clas
s

36 Alterra-Rapport 088
The only study with this group of herbicides in running systems concerns diquat. In aflow-through system, Paterson & Wright (1987) found no significant effect on thesurvival of Elodea canadensis in case of 24-hour exposure to pulses of 5 and 10 µg/L(0.1 and 0.2 TUgsa). Mortality was observed at 50 µg/L (1 TUgsa). All threeconcentrations showed a positive effect on the periphyton density which used E.canadensis as substrate. This should, however, probably be attributed to the leakage ofnutrients from (slightly) affected plants.
Figure 10. 10-, 50- and 90-percentile values (expressed in TUgsa with 95% confidence intervals) as calculated bymeans of logistic regression for the functional and structural endpoints after single or multiple application of aherbicide belonging to the group of other herbicides (mainly with a growth-inhibiting effect). The values couldbe calculated for one classification, no and slight versus clear effect. Confidence intervals could not be calculatedfor functional endpoints at a multiple application.
Figure 11. Classified effects of herbicides belonging to the group of other herbicides (mainly with a growth-inhibiting effect) in (semi) field studies with stagnant or recirculating running test systems. The effects on themost sensitive endpoints are presented. The effects are also classified according to magnitude and duration. 1 =no significant effect, 2 = slight effect, 3 = clear short-term effect (< 8 weeks), 4 = clear effect in short-term study(recovery moment unknown), 5 = clear long-term effect (> 8 weeks). The small closed circles (•) indicate theexperiments with a single application; the large open circles (¡) indicate the experiments with multiple exposure.
Most sensitive endpoints
0
1
2
3
4
5
0.01 0.1 1 10 100 1000
TUgsa
Eff
ect c
lass
Growth inhibitors: no or slight effect versus clear effect(class 1,2 versus 3,4,5)
Functional endpoints Structural endpoints
0.01
0.1
1
10
100
1000
Single Multiple Single Multiple
TU
gsa
10th percentile 50th percentile 90th percentile

Alterra-Rapport 088 37
6 INDIRECT EFFECTS
Figure 12 summarises the indirect effects of herbicides as these were observed in theavailable studies. In this figure no distinction is made according to concentrationlevel but the observed indirect effects usually originate from experiments in whichrelatively high concentrations have been studied (> 0.1 TUgsa). Because the exactmechanism for indirect effects is difficult to establish in most cases, the shownroutes are in fact based on appraisals of the best explanations, in which thediscussions by the various authors of the papers as well as our own perceptions haveplayed an important role. The figure should be interpreted as a presentation of thepossible routes that follow from the observations. A number of effects, however, areoccurring so frequently in combination with each other that the correspondingroutes should be considered as most plausible explanation.
It has been observed for all groups of primary producers (phytoplankton, periphytonand macrophytes) that the disappearance of certain species may lead to an increase ofother species within the same group. Primary producers mutually compete fornutrients, space, CO2, and light. Reduced competition of sensitive species maytherefore shift the community towards less sensitive species. Shifts in species are inparticular observed in phytoplankton and periphyton. Primary production oftenrecovers after some time whereas the shift in species lasts much longer. This meansthat the ecosystem function often recovers as a result of other species taking over therole of the disappeared species (functional redundancy).
The disappearance of primary producers could in many cases be observed directly inthe form of a decrease of the oxygen concentration and/or the pH of the water. In asingle case oxygen depletion possibly caused a reduction of zooplankton. The mostfrequently suggested cause of negative effects on zooplankton and other herbivorousinvertebrates, however, was the decrease of primary producers (algae andmacrophytes) as source of food.

38 Alterra-Rapport 088

Alterra-Rapport 088 39
Death of primary producers and reduced primary production may also cause otherchanges in water quality. A significant increase in the amount of nutrients was themost frequently reported secondary effect besides reduced oxygen concentrationsand pH. At the same time, a higher alkalinity, conductivity, turbidity and DOC(amount of dissolved organic carbon) were also found in some cases. This can easilybe explained by the release of dissolved substances and particles that were until thenpart of the biomass of the primary producers. Next, an increase in nutrients mayhave a stimulating effect on less sensitive primary producers (especially algae), whichmay in turn result in a positive effect on the herbivores that feed on these algae, andfinally even in an increase of predatory fish. Increases of certain herbivores may,however, also be caused by reduced competition with herbivores that disappear.
The most dramatic secondary effects were observed in the studies in whichelimination of macrophytes occurred. Besides the above-mentioned effects on waterquality and on herbivores this may lead to drastic shifts in the aquatic community byhabitat destruction. The organisms for which aquatic plants play an important roleinclude periphyton, crustaceans, aquatic insects (especially the larvae), molluscs, butalso certain fish and tadpole species. All these groups may disappear or decrease innumbers as a result of mortality of macrophytes, where it makes no differencewhether herbivorous or predatory species are involved. The disappearance of thevegetation may in some cases lead to a bloom of phytoplankton. This is possiblycaused by decreased shading, as a result of which more light can penetrate the water,and the release of nutrients by the decomposition of dead plant material. There isthus a shift from a macrophyte- to a plankton-dominated ecosystem. Finally, as aresult of the death of macrophytes there may be a (temporary) positive effect on thedestruents in the community (microorganisms and macroinvertebrates), which mayresult in an increase in respiration (decrease in the amount of oxygen) and anincreased amount of edible microorganisms for some zooplankton andmacroinvertebrate species.
Figure 3 F and H show that in some studies with photosynthesis-inhibitors negativeeffects on macrocrustaceans, aquatic insects, fish and tadpoles already occur at 0.2TUgsa. In most cases this concerns habitat destruction by the disappearance of aquaticplants. The turning point for this effect is about the same as that for the macrophytesand is very close to the NOECeco. Indirect effects on zooplankton (viaphytoplankton) only arise at 0.9 TUgsa and on molluscs (via periphyton) at 9 TUgsa
(Figure 3 E and G). The indirect effects of auxin simulators were hardly studied(Figure 6). Indirect effects of the other herbicides on zooplankton probably onlyoccur at 6 TUgsa (Figure 9 E).
Figure 12. (page 38) Schematic presentation of the indirect effects of herbicides in aquatic (semi) fieldexperiments. The explanations given for the observations are partly based on the discussions of the variousauthors of publications that were consulted and partly on our own interpretation. The dotted lines, e.g., indicatethe routes postulated by the authors of this report. The numbers refer to the study numbers given in Tables 1 - 3.The direct negative effects on primary producers are presented in Figures 3, 6, and 9.

40 Alterra-Rapport 088
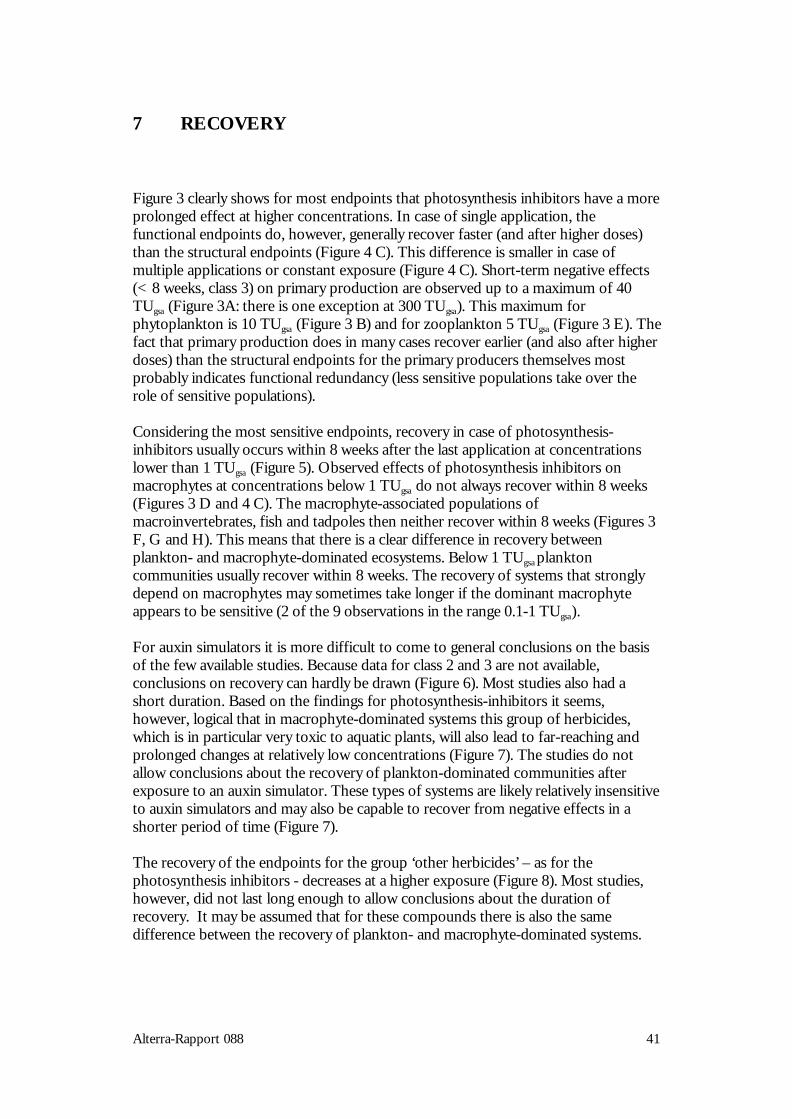
Alterra-Rapport 088 41
7 RECOVERY
Figure 3 clearly shows for most endpoints that photosynthesis inhibitors have a moreprolonged effect at higher concentrations. In case of single application, thefunctional endpoints do, however, generally recover faster (and after higher doses)than the structural endpoints (Figure 4 C). This difference is smaller in case ofmultiple applications or constant exposure (Figure 4 C). Short-term negative effects(< 8 weeks, class 3) on primary production are observed up to a maximum of 40TUgsa (Figure 3A: there is one exception at 300 TUgsa). This maximum forphytoplankton is 10 TUgsa (Figure 3 B) and for zooplankton 5 TUgsa (Figure 3 E). Thefact that primary production does in many cases recover earlier (and also after higherdoses) than the structural endpoints for the primary producers themselves mostprobably indicates functional redundancy (less sensitive populations take over therole of sensitive populations).
Considering the most sensitive endpoints, recovery in case of photosynthesis-inhibitors usually occurs within 8 weeks after the last application at concentrationslower than 1 TUgsa (Figure 5). Observed effects of photosynthesis inhibitors onmacrophytes at concentrations below 1 TUgsa do not always recover within 8 weeks(Figures 3 D and 4 C). The macrophyte-associated populations ofmacroinvertebrates, fish and tadpoles then neither recover within 8 weeks (Figures 3F, G and H). This means that there is a clear difference in recovery betweenplankton- and macrophyte-dominated ecosystems. Below 1 TUgsa planktoncommunities usually recover within 8 weeks. The recovery of systems that stronglydepend on macrophytes may sometimes take longer if the dominant macrophyteappears to be sensitive (2 of the 9 observations in the range 0.1-1 TUgsa).
For auxin simulators it is more difficult to come to general conclusions on the basisof the few available studies. Because data for class 2 and 3 are not available,conclusions on recovery can hardly be drawn (Figure 6). Most studies also had ashort duration. Based on the findings for photosynthesis-inhibitors it seems,however, logical that in macrophyte-dominated systems this group of herbicides,which is in particular very toxic to aquatic plants, will also lead to far-reaching andprolonged changes at relatively low concentrations (Figure 7). The studies do notallow conclusions about the recovery of plankton-dominated communities afterexposure to an auxin simulator. These types of systems are likely relatively insensitiveto auxin simulators and may also be capable to recover from negative effects in ashorter period of time (Figure 7).
The recovery of the endpoints for the group ‘other herbicides’ – as for thephotosynthesis inhibitors - decreases at a higher exposure (Figure 8). Most studies,however, did not last long enough to allow conclusions about the duration ofrecovery. It may be assumed that for these compounds there is also the samedifference between the recovery of plankton- and macrophyte-dominated systems.
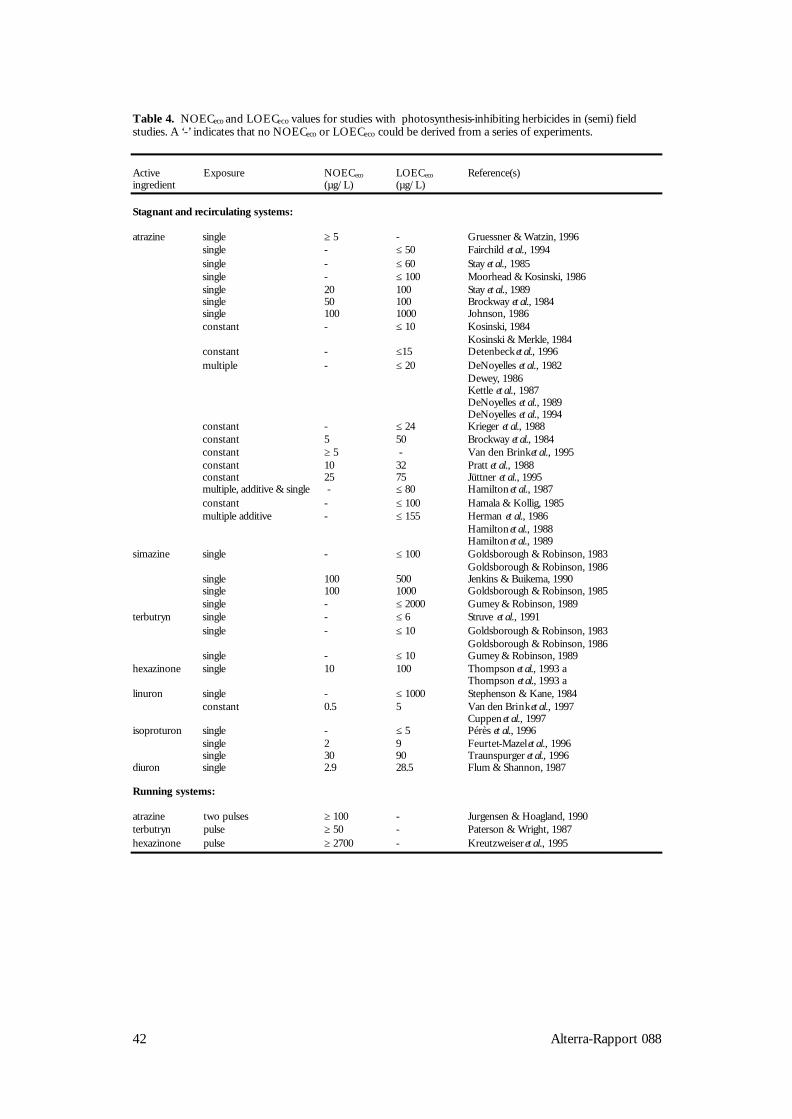
42 Alterra-Rapport 088
Table 4. NOECeco and LOECeco values for studies with photosynthesis-inhibiting herbicides in (semi) fieldstudies. A ‘-’ indicates that no NOECeco or LOECeco could be derived from a series of experiments.
Active Exposure NOECeco LOECeco Reference(s)ingredient (µg/L) (µg/L)
Stagnant and recirculating systems:
atrazine single ≥ 5 - Gruessner & Watzin, 1996single - ≤ 50 Fairchild et al., 1994single - ≤ 60 Stay et al., 1985single - ≤ 100 Moorhead & Kosinski, 1986single 20 100 Stay et al., 1989single 50 100 Brockway et al., 1984single 100 1000 Johnson, 1986constant - ≤ 10 Kosinski, 1984
Kosinski & Merkle, 1984constant - ≤15 Detenbeck et al., 1996multiple - ≤ 20 DeNoyelles et al., 1982
Dewey, 1986Kettle et al., 1987DeNoyelles et al., 1989DeNoyelles et al., 1994
constant - ≤ 24 Krieger et al., 1988constant 5 50 Brockway et al., 1984constant ≥ 5 - Van den Brink et al., 1995constant 10 32 Pratt et al., 1988constant 25 75 Jüttner et al., 1995multiple, additive & single - ≤ 80 Hamilton et al., 1987constant - ≤ 100 Hamala & Kollig, 1985multiple additive - ≤ 155 Herman et al., 1986
Hamilton et al., 1988Hamilton et al., 1989
simazine single - ≤ 100 Goldsborough & Robinson, 1983Goldsborough & Robinson, 1986
single 100 500 Jenkins & Buikema, 1990single 100 1000 Goldsborough & Robinson, 1985single - ≤ 2000 Gumey & Robinson, 1989
terbutryn single - ≤ 6 Struve et al., 1991single - ≤ 10 Goldsborough & Robinson, 1983
Goldsborough & Robinson, 1986single - ≤ 10 Gumey & Robinson, 1989
hexazinone single 10 100 Thompson et al., 1993 aThompson et al., 1993 a
linuron single - ≤ 1000 Stephenson & Kane, 1984constant 0.5 5 Van den Brink et al., 1997
Cuppen et al., 1997isoproturon single - ≤ 5 Pérès et al., 1996
single 2 9 Feurtet-Mazel et al., 1996single 30 90 Traunspurger et al., 1996
diuron single 2.9 28.5 Flum & Shannon, 1987
Running systems:
atrazine two pulses ≥ 100 - Jurgensen & Hoagland, 1990terbutryn pulse ≥ 50 - Paterson & Wright, 1987hexazinone pulse ≥ 2700 - Kreutzweiser et al., 1995
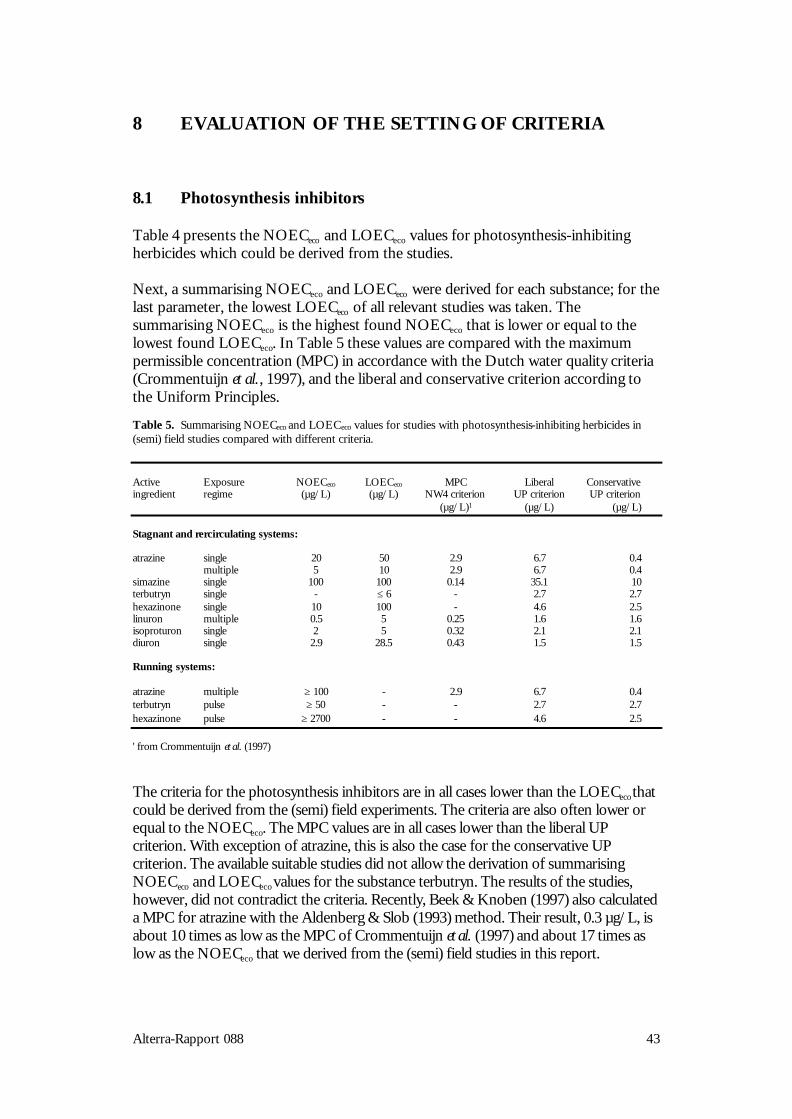
Alterra-Rapport 088 43
8 EVALUATION OF THE SETTING OF CRITERIA
8.1 Photosynthesis inhibitors
Table 4 presents the NOECeco and LOECeco values for photosynthesis-inhibitingherbicides which could be derived from the studies.
Next, a summarising NOECeco and LOECeco were derived for each substance; for thelast parameter, the lowest LOECeco of all relevant studies was taken. Thesummarising NOECeco is the highest found NOECeco that is lower or equal to thelowest found LOECeco. In Table 5 these values are compared with the maximumpermissible concentration (MPC) in accordance with the Dutch water quality criteria(Crommentuijn et al., 1997), and the liberal and conservative criterion according tothe Uniform Principles.
Table 5. Summarising NOECeco and LOECeco values for studies with photosynthesis-inhibiting herbicides in(semi) field studies compared with different criteria.
Active Exposure NOECeco LOECeco MPC Liberal Conservativeingredient regime (µg/L) (µg/L) NW4 criterion UP criterion UP criterion
(µg/L)1 (µg/L) (µg/L)
Stagnant and rercirculating systems:
atrazine single 20 50 2.9 6.7 0.4multiple 5 10 2.9 6.7 0.4
simazine single 100 100 0.14 35.1 10terbutryn single - ≤ 6 - 2.7 2.7hexazinone single 10 100 - 4.6 2.5linuron multiple 0.5 5 0.25 1.6 1.6isoproturon single 2 5 0.32 2.1 2.1diuron single 2.9 28.5 0.43 1.5 1.5
Running systems:
atrazine multiple ≥ 100 - 2.9 6.7 0.4terbutryn pulse ≥ 50 - - 2.7 2.7hexazinone pulse ≥ 2700 - - 4.6 2.5
' from Crommentuijn et al. (1997)
The criteria for the photosynthesis inhibitors are in all cases lower than the LOECeco thatcould be derived from the (semi) field experiments. The criteria are also often lower orequal to the NOECeco. The MPC values are in all cases lower than the liberal UPcriterion. With exception of atrazine, this is also the case for the conservative UPcriterion. The available suitable studies did not allow the derivation of summarisingNOECeco and LOECeco values for the substance terbutryn. The results of the studies,however, did not contradict the criteria. Recently, Beek & Knoben (1997) also calculateda MPC for atrazine with the Aldenberg & Slob (1993) method. Their result, 0.3 µg/L, isabout 10 times as low as the MPC of Crommentuijn et al. (1997) and about 17 times aslow as the NOECeco that we derived from the (semi) field studies in this report.

44 Alterra-Rapport 088
8.2 Auxin simulators
The NOECeco and LOECeco values for auxin-simulating substances are per studypresented in Table 6.
Table 6. NOECeco and LOECeco values for studies with auxin-simulating herbicides in (semi) field studies.
Active Exposure NOECeco LOECeco Reference(s)ingredient (µg/L) (µg/L)
Stagnant and recirculating systems:
2,4-D single 10 100 Forsyth et al., 1997single - ≤ 500 Boyle, 1980single - ≤ 1000 Scott et al., 1981; Stephenson & Mackie, 1986
Sherry, 1994single - ≤ 2000 Kobriae & White, 1996
2,4,5-T single 10000 100000 Sugiura, 1992picloram single ≥ 100 - Forsyth et al., 1997clopyralid single ≥ 100 - Forsyth et al., 1997
Running systems:
trichlopyr pulse (1 hour) 320 3200 Kreutzweiser et al., 1992
Table 7 compares the summarising NOECeco and LOECeco values from these studieswith the criteria. The MPC value derived by Crommentuijn et al. (1997) for 2,4-Dshows good agreement with the (semi) field studies. For 2,4,5-T, however, thiscriterion is a factor 1000 lower than the NOECeco. This NOEC, however, is based ona single study (Sugiura, 1992) that has been conducted in a plankton-dominatedsystem without aquatic plants. In view of the high sensitivity of macrophytes to thesecompounds it is to be expected that the NOECeco and LOECeco values will beconsiderably lower in a macrophyte-dominated ecosystem. The UP criteria for 2,4-D,which are based on standard tests with algae, do not offer adequate protectionbecause macrophytes are much more sensitive than algae. This is possibly also thecase for picloram and clopyralid. This could, however, not be verified on the basis ofthe studies with these substances. The UP criteria neither seem to offer protectionagainst trichlopyr in running systems. The measured effect in the particular studyconcerned the survival of some invertebrates. An explanation for this effect cannotbe given. The LC50 for Daphnia magna , e.g., is 133 000 µg/L. The MPC for 2,4-Destimated by Beek & Knoben (1997) is about 4 µg/L, comparable to that ofCrommentuijn et al. (1997).
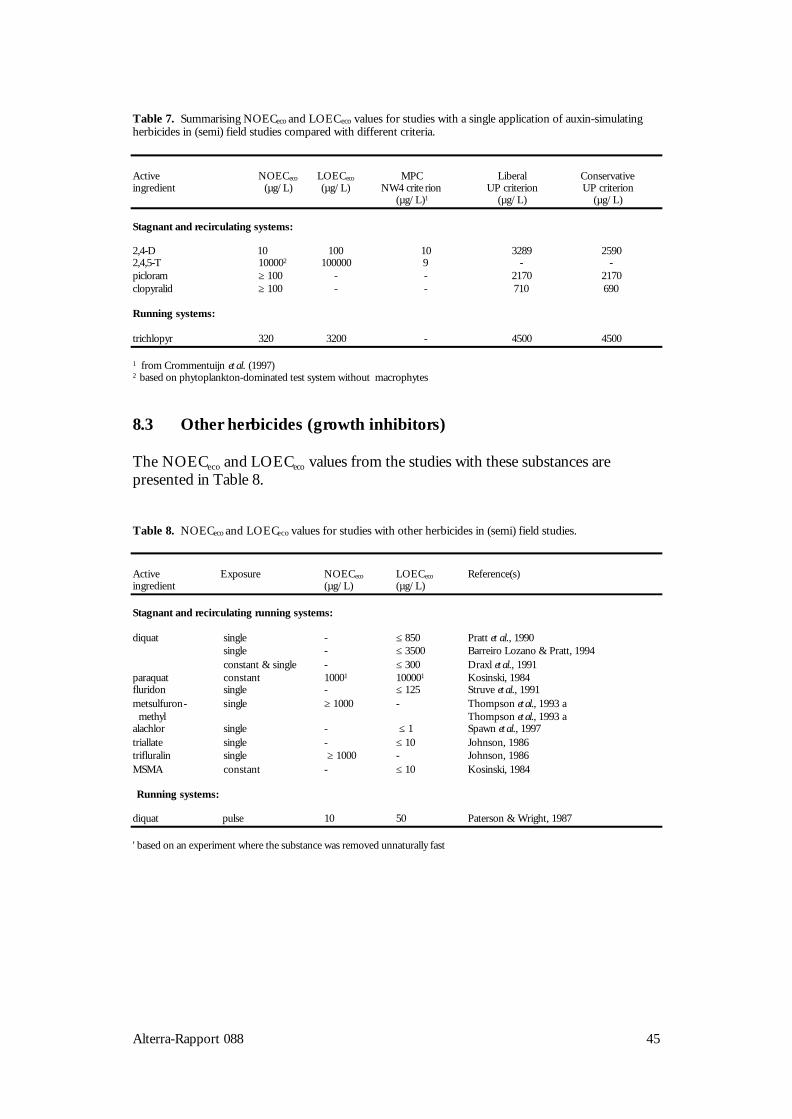
Alterra-Rapport 088 45
Table 7. Summarising NOECeco and LOECeco values for studies with a single application of auxin-simulatingherbicides in (semi) field studies compared with different criteria.
Active NOECeco LOECeco MPC Liberal Conservativeingredient (µg/L) (µg/L) NW4 crite rion UP criterion UP criterion
(µg/L)1 (µg/L) (µg/L)
Stagnant and recirculating systems:
2,4-D 10 100 10 3289 25902,4,5-T 100002 100000 9 - -picloram ≥ 100 - - 2170 2170clopyralid ≥ 100 - - 710 690
Running systems:
trichlopyr 320 3200 - 4500 4500
1 from Crommentuijn et al. (1997)2 based on phytoplankton-dominated test system without macrophytes
8.3 Other herbicides (growth inhibitors)
The NOECeco and LOECeco values from the studies with these substances arepresented in Table 8.
Table 8. NOECeco and LOECeco values for studies with other herbicides in (semi) field studies.
Active Exposure NOECeco LOECeco Reference(s)ingredient (µg/L) (µg/L)
Stagnant and recirculating running systems:
diquat single - ≤ 850 Pratt et al., 1990single - ≤ 3500 Barreiro Lozano & Pratt, 1994constant & single - ≤ 300 Draxl et al., 1991
paraquat constant 10001 100001 Kosinski, 1984fluridon single - ≤ 125 Struve et al., 1991metsulfuron- single ≥ 1000 - Thompson et al., 1993 a methyl Thompson et al., 1993 aalachlor single - ≤ 1 Spawn et al., 1997triallate single - ≤ 10 Johnson, 1986trifluralin single ≥ 1000 - Johnson, 1986MSMA constant - ≤ 10 Kosinski, 1984
Running systems:
diquat pulse 10 50 Paterson & Wright, 1987
' based on an experiment where the substance was removed unnaturally fast

46 Alterra-Rapport 088
The number of suitable studies with these herbicides was rather scarce and they wereoften also of a lower quality than, e.g., those with the photosynthesis inhibitors. Inmost cases it was not possible to establish NOECeco and LOECeco values per study sothat ‘higher or equal’ or ‘lower or equal’ value will have to do. This also sets limits tothe conclusions that can be drawn when these values are compared with the NW4and UP criteria (Table 9). The criteria for diquat, paraquat, fluridon, alachlor, andtriallate are in any case not in conflict with the experimental data that have beenfound. The UP criterion for metsulfuron-methyl, however, is very low in comparisonwith the results of the experiment of Thompson et al. (1993a, 1993b) and the same istrue for trifluralin (study of Johnson, 1986). In the study of Kosinski (1984) andMerkle & Kosinski (1984), paraquat was removed in an artificial way. This maypossibly explain why the UP criteria for paraquat are much lower than the NOECeco
and LOECeco values. A UP criterion could not be established for MSMA becausealgae data are lacking.
Table 9. Summarising NOECeco and LOECeco values for studies with single or multiple application of aherbicide of the group of ‘other herbicides (growth inhibitors)’ compared with different criteria. The experimentswith the substances diquat, paraquat and MSMA were conducted with multiple exposure; experiments with allother substances with single exposure.
Active NOECeco LOECeco MPC Liberal Conservativeingredient (µg/L) (µg/L) NW4 criterion UP criterion UP criterion
(µg/L)1 (µg/L) (µg/L)
Stagnant and recirculating systems:
diquat - ≤ 300 - 5.2 3.4paraquat 10002 100002 - 56 56fluridon - ≤ 125 - 7.4 7.4metsulfuron-methyl ≥ 1000 - - 19 19alachlor - ≤ 1 - 0.6 0.6triallate - ≤ 10 1.9 4.7 4.7trifluralin ≥ 1000 - 0.037 6.7 6.7MSMA - ≤ 10 - - -
Running systems:
diquat 10 50 - 5.2 3.4
1 from Crommentuijn et al. (1997)2 based on an experiment where the substance was removed unnaturally fast

Alterra-Rapport 088 47
9 GENERAL DISCUSSION
Only 11 of the 20 herbicides discussed in this report are registered in TheNetherlands, and not all these substances are used on a large scale. Considering theiruse and presence in surface water, the data on atrazine, simazine, linuron,isoproturon, diuron, and 2,4-D are in particular relevant in the Dutch context.Unfortunately, no adequate studies were found for other compounds that arerelevant in The Netherlands. Examples of substances for which it would, in thecontext of ecological criteria-setting, be meaningful to conduct studies in aquaticmodel ecosystems are mecoprop, metolachlor, propachlor, MCPA, dichlobenil,glyphosate and DNOC.
Atrazine is the only substance for which earlier literature reviews on ecological riskshave been published. Eisler (1989) concluded that the first effects of atrazine onaquatic plants in single species tests occur at 1.5 µg/L. Huber (1993, 1994) put theturning point for ecological effects of atrazine at 20 µg/L. In her review ofexperiments in ‘split ponds’, Draxl (1994) also reports effects on physico-chemicalparameters, macrophytes and zooplankton at this value. Lower concentrations,however, were not tested. Solomon et al. (1996) recently published a very extensivereview of atrazine in North-American surface waters. These authors conclude thatthe disturbance of aquatic ecosystems starts at an exposure concentration above 20µg/L but that ecologically important effects only start to occur at 50 µg/L andhigher. Different studies in this report, however, clearly show that there may beconsiderable effects at 20 µg/L and lower (Table 4; see, e.g., also study no. 10). TheNOECeco of 5 µg/L that comes forward from our study is therefore a safer thresholdvalue.
The criteria derived by Crommentuijn et al. (1997), which have also been included inthe Fourth Memorandum Water Management (NW4), offer adequate protectionagainst ecological effects in freshwater ecosystems for all herbicides in this report.This criterion could for some compounds (e.g. trifluralin) possibly be adjustedupwards on the basis of these studies. The conservative and liberal UP criteria,calculated in this report on the basis of algae tests, generally also seem to be adequatefor photosynthesis- and growth-inhibiting herbicides. For substances with an auxin-simulating effect, such as 2,4-D, UP criteria based on algae data, however,underestimate the risk because the compounds have a specific effect on higheraquatic plants.
In case ecological threshold values for herbicides are exceeded, the very first effectsoccur in primary producers, for which community metabolism and the densities andbiomass of algae and macrophytes are sensitive endpoints. There is an importantdifference between effects in plankton- and in macrophyte-dominated systems.Recovery and adaptation (recovery of functionality) in plankton-systems is morerapid and indirect effects on higher trophic levels (zooplankton) are only observed athigher concentrations. Recovery usually takes longer in ecosystems in which

48 Alterra-Rapport 088
macrophytes play an important role, while in some studies indirect effects by habitatdestruction are already found at concentrations just above the threshold value.
It follows from the above that more attention should be paid to the effects ofherbicides on higher aquatic plants in the context of ecological risk assessment andcriteria-setting for herbicides. It has frequently been argued that algae tests cannotalways act as substitute for higher aquatic plants (e.g., Sortkjaer, 1984; Benenati,1990: Wang, 1991; Lewis, 1995a). Fletcher (1990) concluded on the basis of ananalysis of available pesticide data that algae tests did not detect a response in 20% ofthe cases where vascular plants did show a response. The most frequently usedaquatic plants in toxicity tests are various Lemna spp. (the organisation ASTM in theUSA has recently published a protocol for a 7-day growth inhibition test for L. gibba;ASTM, 1997a). Besides the toxicity data on algae, Appendices 1-20 to this reportpresent the data we found on Lemna. The results of these tests were of the sameorder of magnitude as those for standard algae for most of the photosynthesis- andgrowth-inhibiting herbicides. This was, however, not the case for sulfonylureacompounds such as metsulfuron-methyl and chlorosulfuron (Appendix 16; Fairchildet al., 1997); the EC50 for Lemna was up to a factor 400 lower for these substances.Lemna was less sensitive than algae to phenoxycarbon acids such as 2,4-D (Appendix8) and clopyralid (Appendix 11) whereas field experiments show that rooting aquaticplants are very sensitive to this group of substances. For auxin-simulators this thusmeans that also tests with Lemna may underestimate the ecological risk. It is thereforeessential for auxin-simulating herbicides that tests are conducted with relevantmacrophytes, preferably rooting aquatic plants, besides the usual standard tests withaquatic organisms. Such tests have not often been performed in the past becausethey are awkward to conduct and last long (Lewis, 1995b). At the moment, however,especially in North America, quite some progress has been made with thedevelopment of standard tests with rooting aquatic plants (Freemark et al., 1990;ASTM, 1997b).

Alterra-Rapport 088 49
10 CONCLUSIONS
• Provided that the experimental design meets a number of criteria (Section 2.2),the results of (semi) field experiments in freshwater ecosystems yield, afternormalisation of the test concentrations, a well interpretable picture of theecological effects of groups of herbicides with the same mode of action.
• Due to their effect on community metabolism, in particular on the oxygenregime, organic solvents that are used for the application of herbicides toexperimental systems may, even at very low concentrations (ethanol possiblyalready from 2 µL/L), have a disturbing effect on the ecosystem.
• The most sensitive endpoints for the detection of negative effects of herbicidesin aquatic ecosystems are community metabolism (decrease of oxygen and pH;increase of nutrients, alkalinity, conductivity, etc.), the structure ofphytoplankton and periphyton communities (density, biomass, speciescomposition, chlorophyll content) and the structure of the macrophytecommunity (cover, biomass).
• The functional endpoints are more sensitive to photosynthesis inhibitors than thestructural endpoints. Macrophytes are most sensitive to auxin simulators. The fewavailable studies show that structural endpoints, algae in particular, are possiblymore sensitive to growth inhibitors than functional endpoints. The most sensitiveendpoint generally determines the recovery rate of the ecosystem.
• Generally, too few data are available on ecological effects in aquatic (semi) fieldsituations of herbicides other than photosynthesis inhibitors.
• Generally, effects due to multiple applications are already observed at lower(peak) concentrations than after a single application.
• Sometimes, a positive effect of low herbicide concentrations is observed onsensitive endpoints (hormesis). Usually, this phenomenon, is temporary. Theecological relevance of hormesis has insufficiently been studied.
• The ecological threshold levels for herbicides with a photosynthesis- or growth-inhibiting effect in stagnant and recirculating running test systems are generallyequal to 0.1 times the geometric mean of the found EC50 values for the mostsensitive standard alga. These levels are between 0.001 and 0.01 times thegeometric mean of these EC50 values for substances that simulate the effect ofthe plant growth hormone auxin.
• For various reasons, less sensitive species often increase in number whensensitive primary producers disappear. This may lead to recovery of functional

50 Alterra-Rapport 088
endpoints while the effect on the structure of the ecosystem continues(functional redundancy).
• At concentrations higher than 0.1 times the geometric mean of the EC50 valuesof the most sensitive standard alga there is a considerable difference between theeffects of herbicides in systems that are dominated by plankton or bymacrophytes. Plankton-dominated communities adapt more rapidly at populationand/or community level and, as a result, recover more rapidly than macrophyte-dominated systems. Below the geometric mean of the EC50 values of the mostsensitive standard test alga, plankton-communities usually recover within 8 weeksfrom stress by photosynthesis inhibitors. The recovery of macrophyte-dominatedsystems may take longer if the dominant macrophyte appears to be sensitive.
• Indirect effects of photosynthesis inhibitors at higher trophic levels (consumersand predators) are only observed at concentrations around the EC50 for thestandard alga. In systems dominated by aquatic plants, indirect effects on highertrophic levels as a result of habitat destruction are already observed as soon asthe macrophytes disappear.
• Various indirect effects at ecosystem level may be observed at concentrationshigher than 0.1-1 times the EC50 of the most sensitive standard alga. Someregularly reported indirect effects of herbicides are algal bloom (as a result ofdecreased competition for space, light and nutrients with sensitive primaryproducers such as macrophytes) and disappearance of macrophyte-associatedanimal populations by habitat destruction (as a result of the disappearance ofmacrophytes).
• The MPC values derived by Crommentuijn et al. (1997) appear to offer adequateprotection of freshwater ecosystems against all herbicides in this study. A slightupward adjustment seems to be possible for some substances. Criteria based onalgae tests in compliance with the Uniform Principles of the European Union aregenerally also adequate to prevent ecological effects of photosynthesis- andgrowth-inhibiting herbicides but these underestimate the threshold values forauxin-simulating compounds up to a factor 100. Because Lemna is insufficientlysensitive to these substances, toxicity tests with rooting aquatic plants will in thiscase have to bring a solution.

Alterra-Rapport 088 51
11 RECOMMENDATIONS FOR ECOSYSTEMEXPERIMENTS WITH HERBICIDES
The studies evaluated in this report show that (semi) field experiments, provided thatthey are properly executed (see criteria in Section 2.2), present a uniform picture forgroups of herbicides with a similar mode of action. The evaluation shows, however,that a number of lessons can be derived for future experiments.
• Several organic solvents that are used as ‘carrier’ for the application of pesticidesmay even at very low concentrations cause effects on the metabolism of modelecosystems. A minimum requirement is that the same concentrations of thesesolvents are added to the controls to allow establishment of the net effect of thepesticide. Controls with and without solvent may produce evidence whether ornot solvents do affect the systems. It is even better, however, to use water ascarrier. In case the water-solubility of the pesticides is insufficient, alternativeapplication methods can be sought. Goldsborough & Robinson (1985) andGurney & Robinson (1989), e.g., used micromesh sachets from which theherbicide dissolved in the water. Another elegant method is vapour-drying of thepesticide in the experimental system with highly volatile solvents. This can bedone before the experimental system is filled with water (Sugiura, 1992).
• Further (semi) field studies into the ecological threshold values with othersubstances than photosynthesis inhibitors would be useful. Generally, too littleinformation is available on the effects of these substances at ecosystem level.
• It is advisable that test systems for the ecological risk assessment of herbicides inshallow surface water contain higher aquatic plants. The reasons for this arealready given in Chapter 9.
• More attention should be paid to effects on the heterotrophic component ofaquatic ecosystems. Some studies clearly show that the death of primaryproducers, such as aquatic plants, causes indirect effects in destruents andbacteria.
• For studies with herbicides it is important that structural as well as functionalendpoints are measured. Functions may recover by functional redundancy oradaptation before the structural endpoints are back to the original level. Here, itis thus important that the taxonomic level of the study is adequate to be able todetect changes in species composition of primary producers (e.g. algae).

52 Alterra-Rapport 088

Alterra-Rapport 088 53
12 REFERENCES
Abou-Waly H., Abou-Setta M.M., Nigg H.N., Mallory L.L. (1991) Growth response offreshwater algae, Anabaena flos-aquae and Selenastrum capricornutum to atrazine andhexazinone herbicides. Bull Environ Contam Toxicol 46: 223-229
Aldenberg T, W. Slob (1993) Confidence limits for hazardous concentrations based onlogistically distributed NOEC toxicity data. Ecotoxicol Environ Safety 25(1): 48-63
ASTM (1997a) Standard guide E1415-91 for conducting static toxicity tests with Lemnagibba G3. American Society for Testing and Materials, West Conshohoken, PA
ASTM (1997b) Standard guide E1814-96 for conducting renewal phytotoxicity tests withfreshwater emergent macrophytes. American Society for Testing and Materials, WestConshohoken, PA
Barreiro-Lozano R., Pratt J.R. (1994) Interaction of toxicants and communities: the roleof nutrients. Environ Toxicol Chem 13: 361-368
Baturo W., Lagadic L., Caquet T. (1995) Growth, fecundity and glycogen utilization inLymnaea palustris exposed to atrazine and hexachlorobenzene in freshwater mesocosms.Environ Toxicol Contam 14: 503-511
Beaumont G., Bastin R., Thenien H.P. (1976) Effets physiologiques de l'atrazine á dosessublétales sur Lemna minor L. 1. lnfluence sur la croissance, la teneur en chlorophylle, enprotéines et en azote soluble et total. Naturaliste Can 103: 527-533
Beek M.A., Knoben R.A.E. (1997) Ecotoxicologische risico's van stoffen inwatersystemen. Stapsgewijze beoordeling gebaseerd op verschillen in gevoeligheid tussensoorten. Rapport 97.064, RIZA, Lelystad
Benenati F. (1990) Keynote address: plants - keystone to risk assessment. In: Wang W,Gorsuch JW, Lower WR (eds.) Plants for toxicity assessment. ASTM STP 1 09 1,American Society for Testing of Materials, Philadelphia, pp 5-13
Bérard A. (1996) Effect of organic four solvents (sic) on natural phytoplanktonassemblages: consequences for ecotoxicological experiments on herbicides. Bull EnvironContam Toxicol 57: 183-190
Blythe T.O., Grooms S.M., Frans R.E. (1979) Determination and characterization of theeffects of fluometuron and MSMA on Chlorella. Weed Science 27: 294-299
Boyle T.P. (1980) Effects of the aquatic herbicide 2,4-D DMA on the ecology ofexperimental ponds. Environ Pollut (Ser A) 21: 35-49Bringman G., Kühn R. (1978) Testing of substances for their threshold: modelorganisms Microcystis (Diplocystis) aeruginosa and Scenedesmus quadricauda. Mitt Internat VereinLimnol 21: 275-284
Brock T.C.M., Bos A.R., Crum S.J.H., Gylstra R. (1995) The model ecosystem approachin ecotoxicology as illustrated with a study on the fate and effects of an insecticide in

54 Alterra-Rapport 088
stagnant freshwater microcosms. In: Hock B., Niessner R. (Eds), ImmunologicalDetection of Pesticides, Research Report Deutsche Forschungsgemeinschaft, pp 167-185.
Brock T.C.M., Budde B.J. (1994) On the choice of structural parameters and endpointsto indicate responses of freshwater ecosystems to pesticide stress. In: Hill I.R., HeimbachF., Leeuwangh P., Matthiessen P. (eds) Freshwater field tests for hazard assessment ofchemicals. Lewis Publishers, Boca Raton, FL, pp 19-56
Brock T., Crum S., Leeuwangh P., Lucassen W., van Wijngaarden R. (1993)Modelecosystemen: brug naar het veld. Lotgevallen en effecten van een insecticide inmicro- en mesocosms. Landschap 10: 23-36
Brockway D.L., Smith P.D., Stancil F.E. (1984) Fate and effects of atrazine in smallaquatic microcosms. Bull Environ Contam toxicol 32: 345-353
Crommentuijn T., Kalf D.F., Polder M.D., Posthumus R., Van de Plassche E.J. (1997)Maximum permissible concentrations and negligible concentrations for pesticides.Rapport nr. 601501 002 (+Annex), RIVM, Bilthoven
Cuppen J.G.M., Van den Brink P.J., Van der Woude H., Zwaardemaker N., BrockT.C.M. (1997) Sensitivity of macrophyte-dominated freshwater microcosms to chroniclevels of the herbicide linuron. 11. Community metabolism and invertebrates. EcotoxicolEnviron Saf 38: 25-35
Davis P.E., Pillai C.G.P., Truelove B. (1976) Effects of prometryn, diuron, fluometuronand MSMA on Chlorella and two fungi. Weed Science 24: 587-593
Dejonckheere W.P.E., Steurbaut W (1996) Pesticiden. Gebruik en milieurisico's.Monografieën Stichting Leefmilieu. Uitgeverij Pelckmans, Kapellen, België
DeNoyelles F., Kettle W.D., Sinn D.E. (1982) The responses of plankton communitiesin experimental ponds to atrazine, the most heavily used pesticide in the United States.Ecology 63: 1285-1293
DeNoyelles F., Kettle W.D., Fromm C.H., Moffett M.F., Dewey S.L. (1989) Use ofexperimental ponds to assess the effects of a pesticide on the aquatic environment.Miscellaneous Publications no. 75, Entom Soc Am, pp 41-56
DeNoyelles Jr. F., Dewey S.L., Huggins D.G., Kettle W.D. (1994) Aquatic mesocosms inecological effects testing: detecting direct and indirect effects of pesticides. In: GraneyRL, Kennedy J.H., Rodgers J.H. jr. (eds) Aquatic mesocosm studies in ecological riskassessment. Lewis Publishers, Boca Raton, FL, pp 577-603
Detenbeck N.E., Hermanutz R., Allen K., Swift M.C. (1996) Fate and effects of theherbicide atrazine in flow-through wetland mesocosms. Environ Toxicol Chem 15(6):937-946
Dewey S.L. (1986) Effects of the herbicide atrazine on aquatic insect communitystructure and emergence. Ecology 67: 148-162
Draxl R. (1990) Vergleich von Single-Species-Tests, Labor- und Freilandtestsystemenund deren Bedeutung bei der Abschätzung der Umweltgefährlichkeit vonPflanzenschutzmitteln. Thesis, TU München-Weihenstephan, Germany

Alterra-Rapport 088 55
Draxl R., Neugebaur K.E., Zieris F-J., Huber W. (1991) Comparison of the ecologicaleffects of diquat on laboratory multispecies and outdoor freshwater systems. Verh IntVerein Limnol 24: 2269-2271
Draxl R., Neugebaur K.E., Zieris F-J., Huber W. (1994) Response of aquatic outdoormicrocosms of the 'split- pond' type to chemical contamination. In: Hill I.R., HeimbachF., Leeuwangh P., Matthiessen P. (eds) Freshwater field tests for hazard assessment ofchemicals. Lewis Publishers, Boca Raton, FL, pp 323-330
Eisler R. (1989) Atrazine hazards to fish, wildlife, and invertebrates: a synoptic review.Biological Report 85(1.18), Contaminant Hazard Reviews Report no. 18, US Fish andWildlife Service, US Department of the Interior
Emans, H.J.B., Okkerman, P.C., Van de Plassche, E.J., Sparenburg, P.M. & Canton, J.H.(1992). Validation of some extrapolation methods with toxicity data derived from multi-species experiments on organic compounds and metals in aquatic ecosystems. RIVM-Report no 679102014, Bilthoven, The Netherlands
EU (1997) Commission proposal for a council directive establishing Annex VI toDirective 91/414/EEC concerning the placing of plant protection products on themarket. Off J Eur Comm C240: 1-23
Fairchild J.F., La Point T.W., Schwartz T.R. (1994) Effects of herbicide and insecticidemixture in aquatic mesocosms. Arch Environ Contam Toxicol 27: 527-533
Fairchild J.F., Ruessler D.S., Haverland P.S., Carlson A.R. (1997) Comparative sensitivityof Selenastrum capricornutum and Lemna minor to sixteen herbicides. Arch Environ ContamToxicol 32: 353-357
Feurtet-Mazel A., Grollier T., Grousselle M., Ribeyre F., Boudou A. (1996) Experimentalstudy of bioaccumulation and effects of the herbicide isoproturon on freshwater rootedmacrophytes. Chemosphere 32: 1499-1512
Fletcher J.S. (1990) Use of algae versus vascular plants to test for chemical toxicity. In:Wang W., Gorsuch J.W., Lower W.R. (eds.) Plants for toxicity assessment. ASTM STP1091, American Society for Testing of Materials, Philadelphia, pp 33-39
Flum T.F., Shannon L.J. (1987) The effects of three related amides on microecosystemstability. Ecotoxicol Environ Saf 13: 239-252
Forsyth D.J., Martin P.A., Shaw G.G. (1997) Effects of herbicides in two submersedaquatic macrophytes Potamogeton pectinatus L. and Myriophyllum sibiricum Komarov, in aprairie wetland. Environ Pollut 95: 259- 268
Foy C.L., Hiranpradit H. (1977) Herbicide movement with water and effect ofcontaminant levels on non-target organisms. OWRT project A-046-VA, Virginia WaterResource Center, NTIS, PB263285 Resource Research Center, Microfiche (quoted inCrommentuijn et al., 1997)
Francois D.L., Robinson G.G.C. (1990) Indices of triazine toxicity in Chlamydomonasgeitleri Ettl. Aquat Toxicol 16:205-228
Freemark K., MacQuarrie P., Swanson S., Peterson H. (1990) Development ofguidelines for testing pesticide toxicity to nontarget plants for Canada. In: Wang W.,
56 Alterra-Rapport 088
Gorsuch J.W., Lower, W.R. (eds.) Plants for toxicity assessment. ASTM STP 1091,American Society for Testing of Materials, Philadelphia, pp 14-29
Gaggi C., Sbrilli G., Hasab el Naby A.M., Bucci M., Duccini M., Bacci E. (1995)Toxicity and hazard ranking of strazine herbicides using Microtox, two green algalspecies and a marine crustacean. Environ Toxicol Chem 14: 1065-1069
Geyer H., Scheunert I., Korte F. (1985) The effects of organic environmental chemicalson the growth of the alga Scenedesmus subspicatus: a contribution to environmentalbiology. Chemosphere 14: 1355-1369
Goldborough L.G., Robinson G.G.C. (1983) The effect of two triazine herbicides onthe productivity of freshwater marsh periphyton. Aquat Toxicol 4: 95-112
Goldsborough L.G., Robinson G.G.C. (1985) Effect of an aquatic herbicide onsediment nutrient flux in a freshwater marsh. Hydrobiologia 122: 121-128
Goldborough L.G., Robinson G.G.C. (1986) Changes in periphytical algal communitystructure as a consequence of short herbicide exposures. Hydrobiologia 139: 177-192
Gramlich J.V., Frans R.E. (1964) Kinetics of Chlorella inhibition byherbicides. Weeds 12: 184-189
Gruessner B., Watzin M.C. (1996) Response of aquatic communities from a Vermontstream to environmentally realistic atrazine exposure in laboratory microcosms.Environ Toxicol Chem 15: 410-419Gurney S.E., Robinson G.G.C. (1989) The influence of two triazine herbicides on theproductivity, biomass and community composition of freshwater marsh periphyton.Aquatic Botany 36: 1-22
Hamala J.A., Kollig H.P. (1985) The effects of atrazine on periphyton communities incontrolled laboratory ecosystems. Chemosphere 14: 1391-1408
Hamilton PB, Jackson G.S., Kaushik N.K., Solomon K.R. (1987) The impact ofatrazine on lake periphyton communities including carbon uptake dynamics using trackautoradiography. Environ Pollut 46: 83-103
Hamilton P.B., Jackson G.S., Kaushik N.K., Solomon K.R., Stephenson G.L. (1988)The impact of two applications of atrazine on the plankton communities of in situenclosures. Aquat Toxicol 13: 123-140
Hamilton P.B., Lean D.R.S., Jackson G.S., Kaushik N.K., Solomon K.R. (1989) Theeffect of two applications of atrazine on the water quality of freshwater enclosures.Environ Pollut 60: 291-304
Hawxby K., Tubea B., Ownby J., Basler E. (1977) Effects of various classes ofherbicides on four species of algae. Pestic Biochem Physiol 7: 203-209
Herman D., Kaushik N.D., Solomon K.R. (1986) Impact of atrazine on periphyton infreshwater enclosures and some ecological consequences. Can J Fish Aquat Sci 43:1917-1925
Hess (1980) A Chlamydomonas algal bioassay for detecting growth inhibitor herbicides.Weed Sci 28: 515-520

Alterra-Rapport 088 57
Hoberg J.R. (1991) Atrazine technical - Toxicity to the freshwater green alga Selenastrumcapricornutum. SLI report 91-1-3600, Springborn Laboratories, Wareham, MA (quoted inSolomon et al., 1996)
Hoberg (1993a) Atrazine technical - Toxicity to duckweed (Lemna gibba). SLI report 93-11-5053, Springborn Laboratories, Wareham, MA (quoted in Solomon et al., 1996)
Hoberg (1993b) Atrazine technical - Toxicity to duckweed (Lemna gibba). SLI report 93-4-4755, Springborn Laboratories, Wareham, MA (quoted in Solomon et al., 1996)
HRAC (1996) Classification of herbicides according to mode of action. HerbicideResistance Action Committee, Leverkusen, Germany
Huber W. (1993) Ecotoxicological relevance of atrazine in aquatic systems. EnvironToxicol Chem 12: 1865- 1881
Huber W. (1994) Atrazine in aquatic test systems: an evaluation of ecotoxicological risks.In: Hill I.R., Heimbach F., Leeuwangh P., Matthiessen P. (eds) Freshwater field tests forhazard assessment of chemicals. Lewis Publishers, Boca Raton, FL, pp 273-286
IRC (1997) International Commission zum Schutze des Rheins (IKSR), ArbeitsgruppeGewasserqualität (quoted in Crommentuijn et al., 1997)
Jak, R.G., H.P.M. Schobben, M.C.Th. Scholten & C.C. Karman (1994). Een vergelijkingvan ecotoxicologische effecten gemeten in mesocosmexperimenten met laboratoriumtoxiciteitsgegevens. TNO-rapport R 94/139, Delft, The Netherlands
Jenkins D.O., Buikema Jr. A.L. (1990) Response of a winter plankton food web tosimazine. Environ Toxicol Chem 9: 693-705
Johnson B.T. (1986) Potential impact of selected agricultural chemical contaminants on anorthern prairie wetland: a microcosm evaluation. Environ Toxicol Chem 5: 473-485
Jurgensen T.A., Hoagland K.D. (1990) Effect of short-term pulses of atrazine onattached algal communities in a small stream. Arch Environ Contam toxicol 19: 617-623
Jüttner I., Peither A., Lay J.P., Kettrup A., Ormerod S.J. (1995) An outdoor mesocosmstudy to assess ecotoxicological effects of atrazine on a natural plankton community.Arch Environ Contam Toxicol 29:435-441
Källqvist T., Romstad R. (1994) Effects of agricultural pesticides on planktonic algae andcyanobacteria: examples of interspecies sensitivity variations. Norw J Agric Sci Suppl 13:117-131
Kersting K. (1994) Functional endpoints in field testing. In: Hill I.R., Heimbach F.,Leeuwangh P., Matthiessen P. (eds.) Freshwater field tests for hazard assessment ofchemicals. Lewis Publishers, Boca Raton, FL, pp 57-81
Kettle W.D., DeNoyelles Jr. F., Heacock B.D., Kadoum A.M. (1987) Diet andreproductive success of bluegill recovered from experimental ponds treated withatrazine. Bull Environ Contam Toxicol 38: 47-53
58 Alterra-Rapport 088
Kirby M.F., Sheahan D.A. (1994) Effects of atrazine, isoproturon, and mecoprop on themacrophyte Lemna minor and the alga Scenedesmus subspicatus. Bull Environ ContamToxicol 53: 120-126
Knauf W., Schultze E-F. (1972) Langzeiteinfluss subletaler Herbiziddosen auf einigeVertreter der Wasserfauna und -flora am Beispiel von Linuron und Monolinuron.Schreibe Ver. Wass. Boden Lufthyg. 37: 231-239
Kobriaei M.E., White D.S. (1996) Effects of 2,4-dichlorophenoxyacetic acid onKentucky algae: simultaneous laboratory and field toxicity testings. Arch EnvironContam Toxicol 31: 571 -580Kosinski R.J. (1984) The effect of terrestrial herbicides on the community structure ofstream periphyton. Environ Pollut Ser A 36: 165-189
Kosinski R.J., Merkle M.G. (1984) The effect of four terrestrial herbicides on theproductivity of artificial stream algal communities. J Environ Qual 13: 75-82
Krieger K.A., Baker D.B., Kramer J.W. (1988) Effects of herbicides on stream Aufwuchsproductivity and nutrient uptake. Arch Environ Contam Toxicol 17: 299-306
Kreutzweiser D.P., Holmes S.B., Behmer D.J. (1992) Effects of the herbicideshexazinone and triclopyr ester on aquatic insects. Ecotoxicol Environ Saf 23: 364-374
Kreutzweiser D.P., Capell S.S., Sousa B.C. (1995) Hexazinone effects on streamperiphyton and invertebrate communities. Environ Toxicol Chem 14: 1521-1527
Lampert W., Fleckner W., Pott E., Schober U., Störkel K.U. (1989) Herbicide effects onplanktonic systems of different complexity H.ydrobiologia 188/199: 415-424
Lay J.P., Müller A., Peichl L., Klein W., Korte F. (1984) Longterm effects of theherbicides atrazine and dichlobenil upon the phytoplankton density and physico-chemical conditions in compartments of a freshwater pond. Chemosphere 13: 821-832
Lefebvre-Drouet E., Calvet R. (1978) La detection et Ie dosage des herbicides l'aide deschlorelles: recherches sur les conditions expérimentales optimales et application l'analysede plusieurs herbicides. Weed Res 18: 33-39
Lewis M.A. (1995a) Use of freshwater plants for phytotoxicity testing: a review. EnvironPollut 87: 319-336
Lewis M.A. (1995b) Chapter 4. Algae and vascular plant tests. In: Rand G.M. (ed)Fundamentals of aquatic fate and risk assessment. 2nd ed. Taylor and Francis,Washington, D-C, pp 135-169
Liu L.C., Cedeno-Maldonado A. (1974) Effects of fluometuron, prometryne, ametryneand diuron on growth of two Lemna species. J Agric Univ Puerto Rico 58(4): 483-488
Lynch T.R., Johnson H.E., Adams W.J. (1985) Impact of atrazine andhexachlorobiphenyl on the structure and function of model stream ecosystems. EnvironToxicol Chem 4: 399-413
Maule A., Wright S.J.L. (1984) Herbicide effect on the population growth of some greenalgae and cyanobacteria. J Appl Bacteriol 57: 369-379

Alterra-Rapport 088 59
Millie D.F., Greene D.A., Johnson P.B. (1990) Effects of the cartenoid-inhibitingherbicide, fluridone, on Oscillatoria agardhii Gomont (Cyanobacteria). Aquat Toxicol 16:41-52
Moorhead D.L., Kosinski R.J. (1986) Effect of atrazine on the productivity of artificialstream algal communities. Bull Environ Contam Toxicol 37: 330-336
NEFYTO (1996) Landbouw en chemische gewasbescherming in cijfers (gegevens over1995). Nederlandse Stichting voor Fytofarmacie, Den Haag
Neugebaur K., Zieris F.J., Huber W. (1990) Ecological effects of atrazine on twooutdoor artificial freshwater ecosystems. Z Wasser Abwasser Forsch 23: 11-17
OECD (1984). Alga, growth inhibition test. Guideline for testing of chemicals no. 201.OECD, Paris
Ordelman H.G.K., van Noort P.C.M., van Steenwijk J.M., ten Hulscher T.E.M., EversH.G. (1993) Triazinen. Watersysteemverkenningen 1996. Een analyse van deproblematiek in aquatisch milieu. RIZA nota 93.036/RIKZ rapport 93.050,Lelystad/Den Haag
Paterson D.M., Wright S.J.L. (1987) A continuous-flow model ecosystem for studyingeffects of herbicides on aquatic plants. Weed Sci 35:704-710
Payne R.W., Lane P.W. (1993) Genstat 5 Release 3 reference manual. Clarendon Press,Oxford, England.
PD (1996) Gewasbeschermingsgids. Handboek voor de bestrijding van ziekten, plagenen onkruiden en de toepassing van groeiregulatoren in de land- en tuinbouw en hetopenbaar groen. Plantenziektenkundige Dienst, Wageningen
Peichl L.V., Lay J.P., Korte F. (1984) Wirkung von Dichlobenil und Atrazin auf diePopulationsdichte von Zooplanktern in einem aquatischen Freilandsystem. Z WasserAbwasser Forsch 17: 134-145
Peichl L.V., Lay J.P., Korte F. (1985) Wirkung von Atrazin und 2,4-Dichiorphenoxy-essigsäure auf die Populationsdichte von Phyto- und Zooplankton in einem aquatischenFreilandsystem. Z Wasser Abwasser Forsch 18: 217-222
Pérès F., Florin D., Grollier T., Feurtet-Mazel A., Coste M., Ribeyre F., Ricard M.,Boudou A. (1996) Effects of the phenylurea herbicide isoproturon on periphytic diatomcommunities in freshwater indoor microcosms. Environ Pollut 94: 141-152
Phernambucq A.J.W., Geenen J.P.W., Barreveld H.L., Molegraaf P. (1996) Speuren naarsporen III. Verkennend onderzoek naar milieuschadelijke stoffen in de zoete en zoutewateren van Nederland. Metingen 1993. Rapport RIKZ-96.016/Nota RIZA 96.035,Den Haag/Lelystad
Pratt J.R., Bowers N.J., Niederlehner B.R., Cairns Jr. J. (1988) Effects of atrazine onfreshwater microbial communities. Arch Environ Contam Toxicol 17: 449-457
Pratt J.R., Bowers N.J., Cairns Jr. J. (1990) Effect of sediment on estimates of diquattoxicity in laboratory microcosms. Wat Res 24(1): 51-57

60 Alterra-Rapport 088
Rodgers J. (1991) Effect of atrazine on Selenastrum capricornutum, Lemna minor and Elodeacanadensis. Rapport Archive 5386, Ciba-Geigy Corporation, Greensboro, NC (quoted inSolomon et al., 1996)
Schäfer H., Hettler H., Fritsche U., Pitzen G., Röderer G., Wenzel A. (1994) Biotestsusing unicellular algae and ciliates for predicting long-term effects of toxicants.Ecotoxicol Environ Safety 27: 64-81
Scott B.F., Painter D.S., Nagy E., Dutka B.J., Taylor W.D. (1 98 1) Fate and effects of2,4-D formulations as herbicides in aquatic ecosystem. Part 1. Environment Canada,National Water Research Institute, Burlington, Ontario
Sherry J. (1994) Effects of 2,4-Dichlorophenoxyacetic acid on fungal propagules infreshwater ponds. Environ Toxicol Water Qual 9: 209-221
Snel J.F.H., Vos J.H., Gylstra R., Brock T.C.M. (1998) Inhibition of photosystem II (PSII) electron transport as a convenient endpoint to assess stress of the herbicide linuronon freshwater plants. Aquat Ecol 32: 113-123
Solomon KR., Baker D.B., Richards R.P., Dixon K.R., Klaine S.J., La Point T.W.,Kendall R.J., Weisskopf C.P., Giddings J.M., Giesy J.P., Hall Jr. L.W., Williams W.M.(1996) Ecological risk assessment of atrazine in North American surface waters. EnvironToxicol Chem 15: 31-76
Sortkjaer 0. (1984) Macrophytes and macrophyte communities as test systems inecotoxicological studies of aquatic systems. Ecological Bulletins 36: 75-80
Spawn R.L., Hoagland K.D., Siegfried B.D. (1997) Effects of alachlor on an algalcommunity from a midwestern agricultural stream. Environ Toxicol Chem 16: 785-793
St.-Laurent C., Blaise P., MacQuarrie P., Scroggins R., Trottier B. (1992) Comparativeassessment of herbicide phytotoxicity to Selenastrum capricornutum using microplate andflask bioassay procedures. Environ Toxicol Water Qual Int J 7: 35-48
Stay F.S., Larsen D.P., Katko A., Rohm C.M. (1985) Effects of atrazine on communitylevel responses in Taub microcosms. In: Boyle TP (ed) Validation and predictability oflaboratory methods for assessing the fate and effects of contaminants in aquaticecosystems. ASTM Special technical Publication no. 865, Philadelphia, pp 75- 90
Stay F.S., Katko A., Rohm C.M., Fix M.A., Larsen D.P. (1989) The effects of atrazine onmicrocosms developed from four natural plankton communities. Arch Environ ContamToxicol 18: 866-875
Stebbing A.R.D. (1982) Hormesis: the stimulation of growth by low levels of inhibitors.Sci Tot Environ 22: 213- 234
Stephenson M., Mackie G.L. (1986) Effects of 2,4-D treatment on natural benthicmacroinvertebrate communities in replicate artificial ponds. Aquat Toxicol 9: 243-251
Stephenson R.R., Kane D.F. (1984) Persistence and effects of chemicals in smallenclosures in ponds. Arch Environ Contam Toxicol 13: 313-326
Alterra-Rapport 088 61
Struve M.R., Scott J.H., Bayne D.R. (1991) Effects of fluridone and terbutryn onphytoplankton and water quality in isolated columns of water. J Aquat Plant Manage 29:67-76
Sugiura K. (1992) A multispecies laboratory microcosm for screening ecotoxicologicalimpacts of chemicals. Environ Toxicol Chem 11: 1217-1226
Tamerus H. (1996) De effecten van de herbiciden atrazine, metolachloor en diuron opde groei van fytoplankton. LWD-notitie 96-1, RIVM, Bilthoven
Taraldsen J.E., Norberg-King T.J. (1990) New method for determining effluent toxicityusing duckweed (Lemna minor). Environ Toxicol Chem 9: 761-767
Teunissen-Ordelman H.G.K., van Noort P.C.M., van Steenwijk J.M., Beek M.A., FaasenR., Frintrop P.C.M. (1997a) Fenylureumherbiciden. Watersysteemverkenningen 1996.Een analyse van de problematiek in aquatisch milieu. RIZA rapport 97.002, Lelystad
Thompson D.G., Holmes S.B., Thomas D., MacDonald L., Solomon K.R. (1993a)Impact of hexazinone and metsulfuron methyl on the phytoplankton community of amixed- wood/boreal forest lake. Environ Toxicol Chem 12: 1695-1707
Thompson D.G., Holmes S.B., Wainio-Keizer K., MacDonald L., Solomon K.R. (1993)Impact of hexazinone and metsulfuron methyl on the zooplankton community of aboreal forest lake. Environ Toxicol Chem 12: 1709-1717
Tomlin C. (1994) The pesticide manual, incorporating the agrochemicals handbook. 10thed. British Crop Protection Council, Farnham, UK
Traunspurger W., Schäfer H., Remde A. (1996) Comparative investigation on the effectof a herbicide in single species tests and aquatic microcosms. Chemosphere 33: 1129-1141
Turbak S., Olson S.B., Mcfeters G.A. (1986) Comparison of algal assay systems fordetecting waterborne herbicides and metals. Water Res 20: 91-96
USEPA (1994) Environmental effect branch oneliner toxdata file (1991-1994).Environmental Protection Agency, Washington, DC (quoted in Solomon et al., 1996)
Van den Brink P.J., Van Donk E., Gylstra R., Crum S.J.H., Brock T.C.M. (1995) Effectsof chronic low concentrations of the pesticides chlorpyrifos and atrazine in indoorfreshwater microcosms. Chemosphere 31: 3181-3200
Van den Brink P.J., Hartgers E.M., Fettweis U., Crum S.J.H., Van Donk E., BrockT.C.M. (1997) Sensitivity of macrophyte-dominated freshwater microcosms to chroniclevels of the herbicide linuron. 1. Primary producers. Ecotoxicol Environ Saf 38: 13-24
Van Rijn J.P., Van Straalen N.M. and Willems J. (1995) Handboek bestrijdingsmiddelen.Gebruik en milieu-effecten. VU Uitgeverij, Amsterdam
Van Wijngaarden R.P.A., Van den Brink P.J., Crum S.J.H., Oude Voshaar J.H., BrockT.C.M. and Leeuwangh P. (1996) Effects of the insecticide Dursban 4E (activeingredient chlorpyrifos) in outdoor experimental ditches: 1. comparison of short-termtoxicity between the laboratory and the field. Environ Toxicol Chem 15: 1133--1142
62 Alterra-Rapport 088
Van Wijngaarden R.P.A., Van Geest G., Brock T.C.M. (1998) Ecologische risico's vanbestrijdingsmiddelen in zoetwater ecosystemen. II. Insecticiden. STOWA Rapport 98-31
Véber K., Zaharadnik J., Breyl I., Krédl F. (1981) Toxic effect and accumulation ofatrazine in algae. Bull Environ Contam Toxicol 27: 872-876
Versteeg D.J. (1990) Comparison of short- and long-term toxicity test results for thegreen alga, Selenastrum capricornutum. In: Wang W., Gorsuch J.W., Lower W.R. (eds.)Plants for toxicity assessment. ASTM STP 1091, American Society for Testing ofMaterials, Philadelphia
Wang W. (1990) Literature review on duckweed toxicity testing. Environ Res 52: 7-22
Wang W. (1991) Literature review on higher plants for toxicity testing. Water Air SoilPollut 59: 381-400
Wejnar R., Hausdörfer R., Schmidt M., Weissenhorn F. (1992) Untersuchungen überPhotosynthese-Pigmente bei Lemnaceen. XIII. Vergleichende analyse der Bleichwirkungder Herbizide Amitrol, Diuron und Paraquat unter besonderer Berücksichtung derNOEC. Angew Bot 66: 210-212
Wong P.K., Chang L. (1988) The effects of 2,4-D herbicide and organophosphorusherbicides on growth, photosynthesis, and chlorophyll-a synthesis of Chlamydomonasreinhardtii (mt +). Environ Pollut 55: 179-189

Alterra-Rapport 088 63
APPENDICES

64 Alterra-Rapport 088

Alterra-Rapport 088 65
Appendix 1
Substance: atrazinetriazine
Available laboratory toxicity data for (standard) green algae (Chlorophyta)._________________________________________________________________________________________________Species Exposure Endpoint EC50 NOEC Reference
duration (h) (µg/L) (µg/L)
Scenedesmus subspicatus 96 area below the 110 40 Geyer et al. 1985curve
96 cell production 21 - Kirby & Sheahan 199472 growth rate 120 - Tamerus 199672 growth 72 22 Shäfer et al. 1994
Scenedesmus parvus 72 growth rate 27 7 Tamerus 1996
Selenastrum capricornutum 120 ? 1201) - USEPA 199496 ? 1301) - Hoberg 199196 ? 50 - Versteeg 1990120 ? 551) 151) Hoberg 199396 cell count 41) 0.51) Rodgers 1991120 growth rate 218 70 Abou-Waly et al . 199196 growth 235 75 Fairchild et al. 199772 growth rate 54 14 Tamerus 199672 growth rate 110 - Källqvist & Romstad 1994? ? 592) - Turbak et al. 198696 growth 147 - Gaggi et al. 1995
Chlorella vulgaris 144 growth rate 421 132 Véber et al. 1981
Chlorella pyrenoidosa 120 growth 175 - Gramlich & Frans 1964120 ? 2821) - USEPA 199496 growth 60 - Maule & Wright 1984
Chlamydomonas geitleri 72 growth 481 326 François & Robinson 1990
Chlamydomonas reinhardi 72 growth 350 120 Schäfer et al. 1994
Available laboratory toxicity data for duckweed (Lemnaceae)._________________________________________________________________________________________________Species Exposure Endpoint EC50 NOEC Reference
duration (d) (µg/L) (µg/L)
Lemna gibba 14 density 501) 8.31) Hoberg 1993a14 biomass 221) 8.31) Hoberg 1993a7 Increase in density 1801) - Hoberg 199114 density 371) - Hoberg 1993b14 biomass 451) 7.71) Hoberg 1993b5 ? 1701) - USEPA 1994
Lemna minor 4 ? - 101) Rodgers 199120 wet weight ±150 - Beaumont et al. 19764 density 56 - Kirby & Sheahan 19944 wet weight 60 - Kirby & Sheahan 19944 chlorophyll 62 - Kirby & Sheahan 19944 density 153 75 Fairchild et al. 1997
1) quoted in Solomon et al. 19962) quoted in Källgvist & Romstad 1986
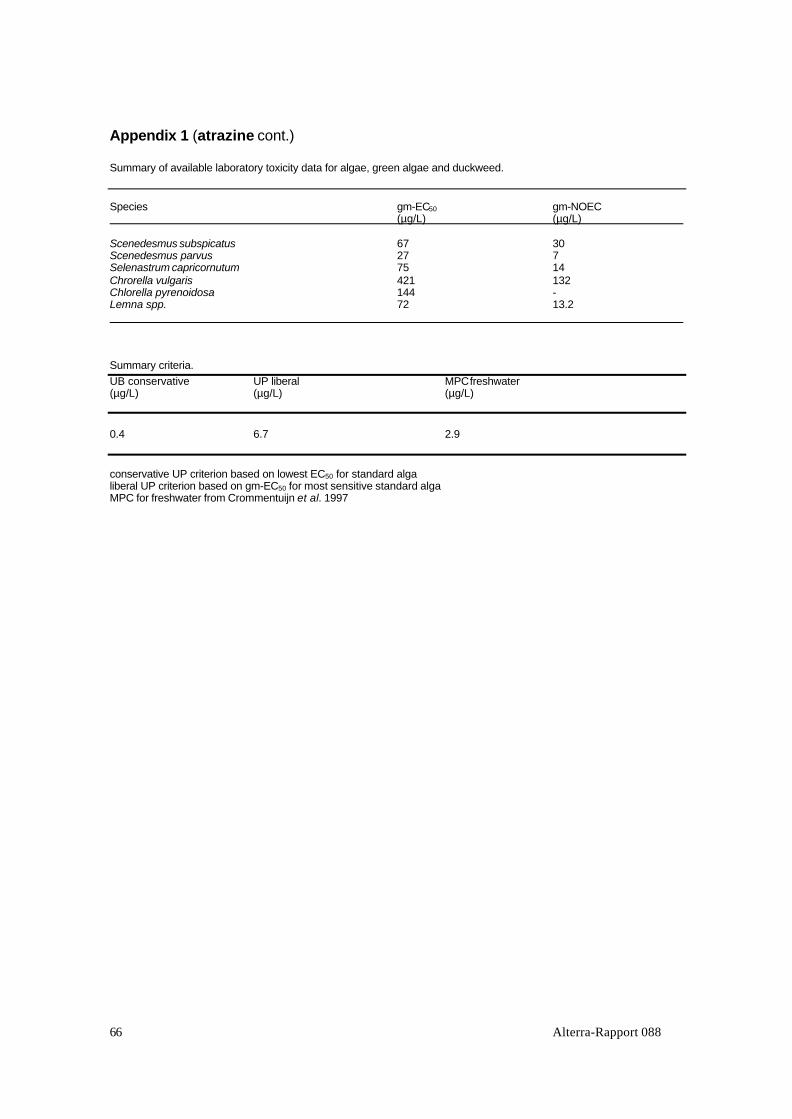
Alterra-Rapport 08866
Appendix 1 (atrazine cont.)
Summary of available laboratory toxicity data for algae, green algae and duckweed.
Species gm-EC50 gm-NOEC (µg/L) (µg/L)
Scenedesmus subspicatus 67 30Scenedesmus parvus 27 7Selenastrum capricornutum 75 14Chrorella vulgaris 421 132Chlorella pyrenoidosa 144 -Lemna spp. 72 13.2
Summary criteria.UB conservative UP liberal MPC freshwater(µg/L) (µg/L) (µg/L)
0.4 6.7 2.9
conservative UP criterion based on lowest EC50 for standard algaliberal UP criterion based on gm-EC50 for most sensitive standard algaMPC for freshwater from Crommentuijn et al. 1997
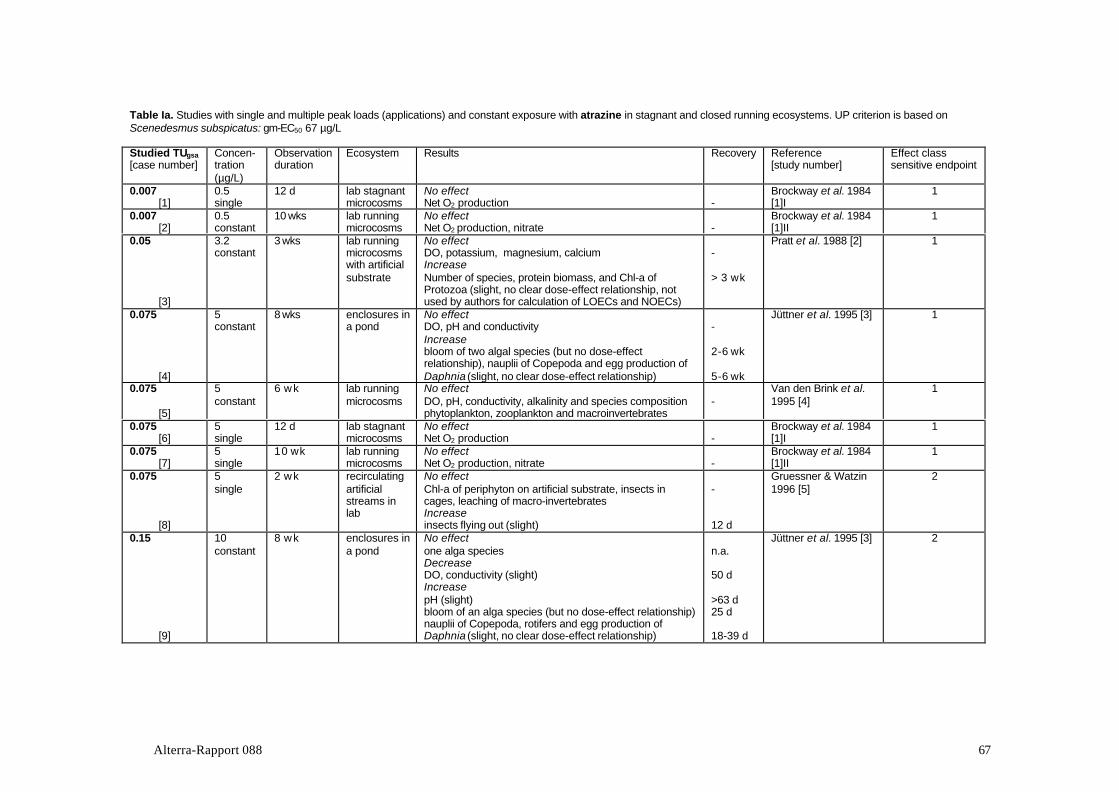
Alterra-Rapport 088 67
Table Ia. Studies with single and multiple peak loads (applications) and constant exposure with atrazine in stagnant and closed running ecosystems. UP criterion is based onScenedesmus subspicatus: gm-EC50 67 µg/L
Studied TUgsa
[case number]Concen-tration(µg/L)
Observationduration
Ecosystem Results Recovery Reference[study number]
Effect classsensitive endpoint
0.007[1]
0.5single
12 d lab stagnantmicrocosms
No effectNet O2 production -
Brockway et al. 1984[1]I
1
0.007[2]
0.5constant
10 wks lab runningmicrocosms
No effectNet O2 production, nitrate -
Brockway et al. 1984[1]II
1
0.05
[3]
3.2constant
3 wks lab runningmicrocosmswith artificialsubstrate
No effectDO, potassium, magnesium, calciumIncreaseNumber of species, protein biomass, and Chl-a ofProtozoa (slight, no clear dose-effect relationship, notused by authors for calculation of LOECs and NOECs)
-
> 3 wk
Pratt et al. 1988 [2] 1
0.075
[4]
5constant
8 wks enclosures ina pond
No effectDO, pH and conductivityIncreasebloom of two algal species (but no dose-effectrelationship), nauplii of Copepoda and egg production ofDaphnia (slight, no clear dose-effect relationship)
-
2-6 wk
5-6 wk
Jüttner et al. 1995 [3] 1
0.075
[5]
5constant
6 wk lab runningmicrocosms
No effectDO, pH, conductivity, alkalinity and species compositionphytoplankton, zooplankton and macroinvertebrates
-Van den Brink et al.1995 [4]
1
0.075[6]
5single
12 d lab stagnantmicrocosms
No effectNet O2 production -
Brockway et al. 1984[1]I
1
0.075[7]
5single
10 wk lab runningmicrocosms
No effectNet O2 production, nitrate -
Brockway et al. 1984[1]II
1
0.075
[8]
5single
2 wk recirculatingartificialstreams inlab
No effectChl-a of periphyton on artificial substrate, insects incages, leaching of macro-invertebratesIncreaseinsects flying out (slight)
-
12 d
Gruessner & Watzin1996 [5]
2
0.15
[9]
10constant
8 wk enclosures ina pond
No effectone alga speciesDecreaseDO, conductivity (slight)IncreasepH (slight)bloom of an alga species (but no dose-effect relationship)nauplii of Copepoda, rotifers and egg production ofDaphnia (slight, no clear dose-effect relationship)
n.a.
50 d
>63 d25 d
18-39 d
Jüttner et al. 1995 [3] 2

Alterra-Rapport 08868
Table Ia. Continued . Studies with single and multiple peak loads (applications) and constant exposure with atrazine in stagnant and closed running ecosystems. UP criterion isbased on Scenedesmus subspicatus: gm-EC50 67 µg/L
Studied TUgsa
[case number]Concen-tration(µg/L)
Observationduration
Ecosystem Results Recovery Reference[study number]
Effect classsensitive endpoint
0.15
[10]
10constant
3 wk lab runningmicrocosmswith artificialsubstrates
No effectDO, potassium, magnesium, calciumIncreasenumber of species, protein biomass andChl-a Protozoa (slight, no clear dose-effect relationship,not used by authors for calculation of LOECs andNOECs)
-
>3 wk
Pratt et al. 1988 [2] 1
0.15
[11]
10single
4 wk lab stagnantmicrocosms
No effectpH, conductivity, alkalinity (day 30), microbial activitiy inthe sediment, biomass of an alga species (day 30),biomass of macrophytes (day 30), survival of DaphniamagnaDecreasegross primary production (slight)
-
7 d
Johnson 1986 [7] 2
0.15
[12]
10constant
3 wk recirculatingartificialstreams
Decreasegross primary productionbiovolume of periphyton on artificial substrate
>21 d>21 d
Kosinski 1984Kosonski & Merkle1984 [8]
4
0.22
[13]
15constant
107 d artificial flow-throughswamp
No effectChl-a and biomass of periphyton in bioassays, growth oftwo aquatic plants in bioassays, survival of Daphniamagna in bioassays, growth of fathead minnow andtadpolesDecreaseDO, metabolism of periphyton in bioassaysIncreasenutrients
-
?
?
Detenbeck et al. 1996[9]
4

Alterra-Rapport 088 69
Table Ia. Continued . Studies with single and multiple peak loads (applications) and constant exposure with atrazine in stagnant and closed running ecosystems. UP criterion isbased on Scenedesmus subspicatus: gm-EC50 67 µg/L.
Studied TUgsa
[case number]Concen-tration(µg/L)
Observationduration
Ecosystem Results Recovery Reference[study number]
Effect classsensitive endpoint
0.30
[14]
20multiple
1 yr experimen-tal ponds
No effectisopods and dragonflies in bioassays, zooplanktoncommunity, biomass of four fish species after one year,snails in bioassaysDecreaseDO, pH14C-uptake and biomass phytoplanktoncover by floating and submerged aquatic plantsnumber of insects flying outbiomass of tadpoles and number of young of a single fishspeciesChangecomposition of phytoplankton species (Increase indinoflagellates)
-
7 d-<1 m7-20 d> 1 yr?>1yr
>136 d
DeNoyelles et al.1982Dewey 1986Kettle et al. 1987DeNoyelles et al.1989DeNoyelles et al.1994[10]
5
0.30[15]
20single
42 d Leflermicrocosms
No effectpH, primary production -
Stay et al. 1989 [11] 1
0.36
[16]
24constant
20 d recirculatingartificialstreams
No effectuptake of phosphorous, silicium and nitrogen byperiphytonDecreaseChl-a and biomass of periphyton
-
?
Krieger et al. 1988[12]
4
0.37
[17]
25constant
8 wk enclosures ina pond
No effectone alga speciesDecreaseDO, conductivity (slight)IncreasepH (slight)bloom of an alga species (but no dose-effect relationship)nauplii of Copepoda, rotifers and egg production ofDaphnia (slight, no clear dose-effect relationship)
-
50->63 d
>63 d21d
18-42 d
Jüttner et al. 1995 [3] 2
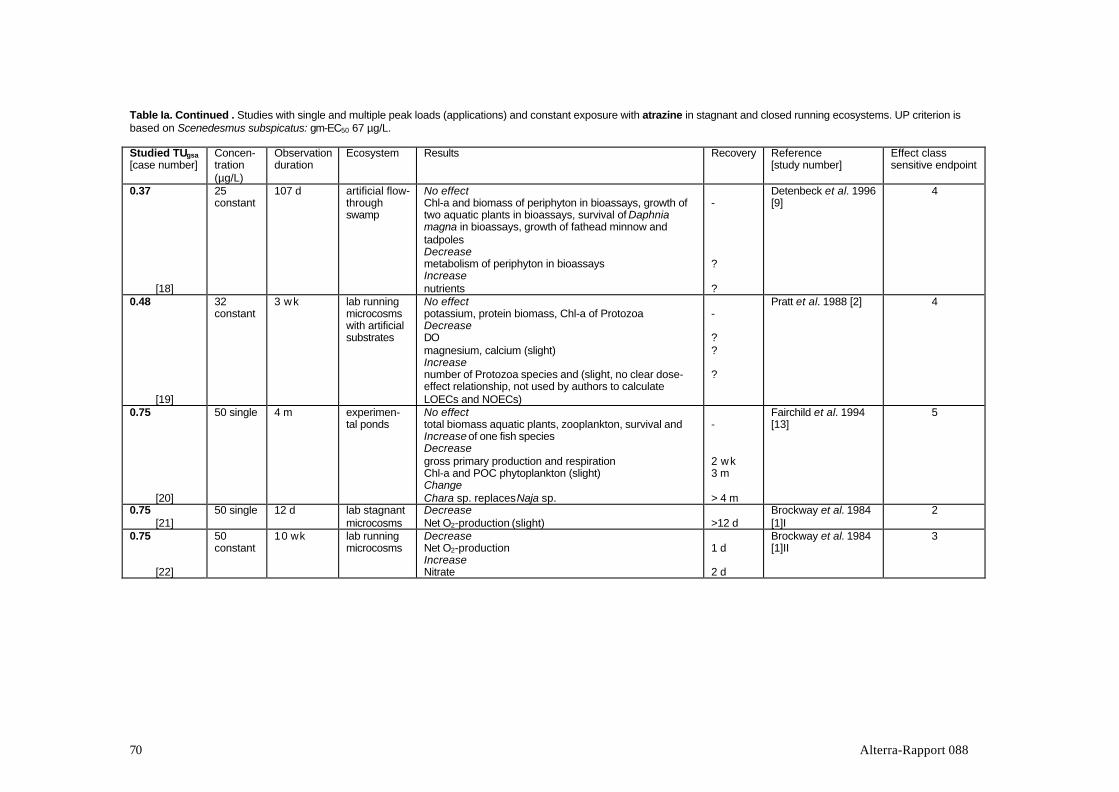
Alterra-Rapport 08870
Table Ia. Continued . Studies with single and multiple peak loads (applications) and constant exposure with atrazine in stagnant and closed running ecosystems. UP criterion isbased on Scenedesmus subspicatus: gm-EC50 67 µg/L.
Studied TUgsa
[case number]Concen-tration(µg/L)
Observationduration
Ecosystem Results Recovery Reference[study number]
Effect classsensitive endpoint
0.37
[18]
25constant
107 d artificial flow-throughswamp
No effectChl-a and biomass of periphyton in bioassays, growth oftwo aquatic plants in bioassays, survival of Daphniamagna in bioassays, growth of fathead minnow andtadpolesDecreasemetabolism of periphyton in bioassaysIncreasenutrients
-
?
?
Detenbeck et al. 1996[9]
4
0.48
[19]
32constant
3 wk lab runningmicrocosmswith artificialsubstrates
No effectpotassium, protein biomass, Chl-a of ProtozoaDecreaseDOmagnesium, calcium (slight)Increasenumber of Protozoa species and (slight, no clear dose-effect relationship, not used by authors to calculateLOECs and NOECs)
-
??
?
Pratt et al. 1988 [2] 4
0.75
[20]
50 single 4 m experimen-tal ponds
No effecttotal biomass aquatic plants, zooplankton, survival andIncrease of one fish speciesDecreasegross primary production and respirationChl-a and POC phytoplankton (slight)ChangeChara sp. replaces Naja sp.
-
2 wk3 m
> 4 m
Fairchild et al. 1994[13]
5
0.75[21]
50 single 12 d lab stagnantmicrocosms
DecreaseNet O2-production (slight) >12 d
Brockway et al. 1984[1]I
2
0.75
[22]
50constant
10 wk lab runningmicrocosms
DecreaseNet O2-productionIncreaseNitrate
1 d
2 d
Brockway et al. 1984[1]II
3

Alterra-Rapport 088 71
Table Ia. Continued . Studies with single and multiple peak loads (applications) and constant exposure with atrazine in stagnant and closed running ecosystems. UP criterion isbased on Scenedesmus subspicatus: gm-EC50 67 µg/L.
Studied TUgsa
[case number]Concen-tration(µg/L)
Observationduration
Ecosystem Results Recovery Reference[study number]
Effect classsensitive endpoint
0.75
[23]
50constant
107 d artificial flow-throughswamp
No effectChl-a and biomass of periphyton in bioassays, growth oftwo aquatic plants in bioassays, survival of Daphniamagna in bioassays, growth of fathead minnow andtadpolesDecreaseMetabolisms of periphyton in bioassaysIncreasenutrients
-
?
?
Detenbeck et al. 1996[9]
4
0.90
[24]
60 single 60 d Taubmicrocosms
DecreaseDO, 14C-uptake, net primary production, respiration14C-uptake/Chl-a
20-27 d53 d
Stay et al. 1985 [14] 3
1.1
[25]
75constant
8 wk enclosures ina pond
No effectOne alga species, rotifersDecreaseDOConductivity (slight)Nauplii of CopedodaIncreasepH (slight)bloom of an alga species (but no dose-effect relationship)egg production of Daphnia (slight, no clear dose-effectrelationship)
-
>63 d50 d53 d
>63 d46 d
35 d
Jüttner et al. 1995 [3] 5
1.1
[26]
75constant
107 d artificial flow-throughswamp
No effectChl-a and biomass of periphyton in bioassays, growth oftwo aquatic plants in bioassays, survival of Daphniamagna in bioassays, growth of fathead minnow andtadpolesDecreaseMetabolism of periphyton in bioassaysIncreasenutrients
-
?
?
Detenbeck et al. 1996[9]
4

Alterra-Rapport 08872
Table Ia. Continued . Studies with single and multiple peak loads (applications) and constant exposure with atrazine in stagnant and closed running ecosystems. UP criterion isbased on Scenedesmus subspicatus: gm-EC50 67 µg/L.
Studied TUgsa
[case number]Concen-tration(µg/L)
Observationduration
Ecosystem Results Recovery Reference[study number]
Effect classsensitive endpoint
1.2
[27]
80multiple
60 d enclosures ina large lake
Decreasenumber, biomass and Chl-a of periphytonChangespecies composition of periphyton
49 d
223 d
Hamilton et al. 1987[15]
5
1.5
[28]
100multiple
1 yr experimentalponds
No effectisopodes and dragonflies, zooplankton community,biomass of two fish species after one year, snails inbioassaysDecreaseDO, pH14C-uptake and biomass phytoplanktoncover by emerged and submerged aquatic plantsnumber of insects flying outbiomass of tadpoles and two fish species
-
± 1 m20 d>1 yr?>1 yr
DeNoyelles et al.1982Dewey 1986Kettle et al. 1987DeNoyelles et al.1989DeNoyelles et al.1994 [10]
5
1.5
[29]
100single
60 d Taubmicrocosms
DecreaseDO, 14C-uptake, net primary production, respiration14C-uptake/Chl-a
25-32 d53 d
Stay et al. 1985 [14] 3
1.5[30]
100single
42 d Leflermicrocosms
DecreasepH, primary production >42 d
Stay et al. 1989 [11] 4
1.5
[31]
100constant
5 wk runningmicrocosms
Decreaseprimary productionnumber of species, Chl-a and biomass of periphytonChangespecies composition of periphyton
20 d>20 d
>20 d
Hamala & Kollig 1985[16]
4
1.5[32]
100single
12 d lab stagnantmicrocosms
Decreasenet O2 production >7 d
Brockway et al. 1984[1]I
4
1.5
[33]
100constant
10 wk lab runningmicrocosms
Decreasenet O2 productionIncreasenitrate
1 d
2 d
Brockway et al. 1984[1]II
3

Alterra-Rapport 088 73
Table Ia. Continued . Studies with single and multiple peak loads (applications) and constant exposure with atrazine in stagnant and closed running ecosystems. UP criterion isbased on Scenedesmus subspicatus: gm-EC50 67 µg/L.
Studied TUgsa
[case number]Concen-tration(µg/L)
Observationduration
Ecosystem Results Recovery Reference[study number]
Effect classsensitive endpoint
1.5
[34]
100single
4 wk lab stagnantmicrocosms
No effectpH, conductivity, alkalinity (day 30), microbial activity insediment, biomass of an alga species (day 30), biomassof macrophytes (day 30), survival of Daphnia magnaDecreasegross primary production (slight)
-
7 d
Johnson 1986 [7] 2
1.5
[35]
100single
1 wk recircula-ting artificialstreams
No effectconductivity, alkalinity, soluble reactive phosphorous,respirationspecies composition of periphyton (study probably tooshort)DecreasepH, net primary production
-
-
7 d
Moorhead & Kosinski1986 [17]
3
1.5
[36]
100single
3 wk recirculatingartificialstreams
No effectbiovolume of periphyton on artificial substrateDecreasegross primary production
-
3 d
Kosinski 1984Kosinski & Merkle1984 [8]
3
1.6
[37]
110constant
3 wk lab runningmicrocosmswith artificialsubstrates
No effectpotassium, calcium, number of species, protein biomassand Chl-a ProtozoaDecreaseDOmagnesium (slight)
-
??
Pratt et al. 1988 [2] 4
2.0
[38]
134constant
20 d recirculatingartificialstreams
No effectsilicium uptake by periphytonDecreaseuptake of phosporous and nitrate by periphyton (slight)Chl-a and biomass of periphyton
-
??
Krieger et al.1988 [12] 4

Alterra-Rapport 08874
Table Ia. Continued . Studies with single and multiple peak loads (applications) and constant exposure with atrazine in stagnant and closed running ecosystems. UP criterion isbased on Scenedesmus subspicatus: gm-EC50 67 µg/L.
Studied TUgsa
[case number]Concen-tration(µg/L)
Observationduration
Ecosystem Results Recovery Reference[study number]
Effect classsensitive endpoint
2.1
[39]
140multiple
60 d enclosures ina large lake
No effectnumbers, biomass, Chl-a and 14C-uptake of periphytonChangespecies composition of periphyton
-
>56 d
Hamilton et al. 1987[15]
5
2.3
[40]
155multiple
294 d enclosures ina large lake
No effectsulphate, phosphorous, silicium, chloride, magnesium,potassium, rotifersDecreaseDOC, POC (slight)DO, 14C-uptake water14C-uptake periphytonChl-a and biomass of periphytonnumbers of one Cladocera, number of young ofzooplankton (slight)Increaseammonium (light)nitrate, nitriteChangespecies composition phytoplankton, species compositionperiphyton
-
90 d67-90 d14 d>294 d65-288 d
90 d>288 d
>294 d
Herman et al. 1986Hamilton et al. 1988Hamilton et al. 1989[18]
5
3.0
[41]
200multiple
1 yr experimentalponds
No effect14C-uptake of phytoplankton, isopods and dragonflies inbioassays, zooplankton community, biomass of two fishspecies after one year, snails in bioassaysDecreaseDO, pHbiomass phytoplanktoncover by emerged and submerged aquatic plantsnumber of insects flying outBiomass of tadpoles and two fish species
-
± 1 m20 d>1 yr?> 1 yr
DeNoyelles et al.1982Dewey 1986Kettle et al. 1987DeNoyelles et al.1989DeNoyelles et al.1994 [10]
5

Alterra-Rapport 088 75
Table Ia. Continued . Studies with single and multiple peak loads (applications) and constant exposure with atrazine in stagnant and closed running ecosystems. UP criterion isbased on Scenedesmus subspicatus: gm-EC50 67 µg/L.
Studied TUgsa
[case number]Concen-tration(µg/L)
Observationduration
Ecosystem Results Recovery Reference[study number]
Effect classsensitive endpoint
3.0
[42]
200constant
8 wk enclosures ina pond
No effectrotifersDecreaseDOconductivity (slight)alga species (Mallomonas sp.) (slight)alga species (Cryptomonas sp.)Nauplii of CopepodaIncreasepH (slight)egg production of Daphnia (slight, no clear dose effectrelationship)
-
>63 d50 d35 d>56 d53 d
>63 d35 d
Jüttner et al. 1995 [3] 5
3.0
[43]
200single
60 d Taubmicrocosms
DecreaseDO, 14 C uptake net primary production, respiration,14C uptake/Chl-a
32-35 d>53 d
Stay et al. 1985 [14] 5
3.0[44]
200single
42 d Leflermicrocosms
DecreasepH, primary production >42 d
Stay et al. 1989 [11] 4
5.0
[45]
337constant
3 wk lab runningmicrocosmswith artificialsubstrates
DecreaseDO, K+
magnesium, calcium (slight)number of species, protein biomass andChl-a Protozoa
???
Pratt et al. 1988 [2] 4
5.4
[46]
360constant
8 wk enclosures ina pond
DecreaseDOconductivity (slight)rotifers (slight)alga species (Mallomonas sp.) (slight)alga species (Cryptomonas sp.)Nauplii of Copepodaegg production of Daphnia (slight)IncreasepH (slight)
>63 d50 d25d35 d>56 d53 d39 d
>63 d
Jüttner et al. 1995 [3] 5

Alterra-Rapport 08876
Table Ia. Continued . Studies with single and multiple peak loads (applications) and constant exposure with atrazine in stagnant and closed running ecosystems. UP criterion isbased on Scenedesmus subspicatus: gm-EC50 67 µg/L.
Studied TUgsa
[case number]Concen-tration(µg/L)
Observationduration
Ecosystem Results Recovery Reference(study number)
Effect classsensitive endpoint
7.5
[47]
500multiple
1 yr experimentalponds
No effectisopods and dragonflies in bioassays, biomass of two fishspecies after one year, snails in bioassaysDecreaseDO, pH14C-uptake phytoplanktonbiomass phytoplanktonnumber of one Copepoda speciescover by emerged, floating and submerged aquatic plantsnumber of insects flying outbiomass of tadpoles and two fish species and number ofyoung of one fish speciesChangespecies composition phytoplankton (and Decrease allimportant species)
-
± 1 m20-60 d20-60 d?>1 yr?>1 yr
>63 d
DeNoyelles et al.1982Dewey 1986Kettle et al. 1987DeNoyelles et al.1989DeNoyelles et al.1994 [10]
5
7.5
[48]
500single
60 d Taubmicrocosms
DecreaseDO, 14C-uptake, net primary production, respiration, 14C-uptake/Chl-a
>53 dStay et al. 1985 [14] 5
7.5[49]
500single
42 d Leflermicrocosms
DecreasepH, primary production >42 d
Stay et al. 1989 [11] 4
7.5[50]
500single
12 d lab stagnantmicrocosms
Decreasenet O2 production >12 d
Brockway et al. 1984[1]I
4
15
[51]
1000single
60 d Taubmicrocosms
DecreaseDO, 14C-uptake, net primary production, respiration, 14C-uptake/Chl-a
>53 dStay et al. 1985 [14] 5
15[52]
1000single
42 d Leflermicrocosms
DecreasepH, primary production >42 d
Stay et al. 1989 [11] 4
15
[53]
1000single
4 wk lab stagnantmicrocosms
No effectmicrobial activity in sediment, survival of Daphnia magnaDecreasepH, gross primary productionbiomass of one alga species (day 30), biomassmacrophytes (day 30)IncreasepH, alkalinity (day 30)
-
>28 d>30 d
>28 d
Johnson 1986 [7] 4

Alterra-Rapport 088 77
Table Ia. Continued . Studies with single and multiple peak loads (applications) and constant exposure with atrazine in stagnant and closed running ecosystems. UP criterion isbased on Scenedesmus subspicatus: gm-EC50 67 µg/L.
Studied TUgsa
[case number]Concen-tration(µg/L)
Observationduration
Ecosystem Results Recovery Reference[study number]
Effect classsensitive endpoint
15
[54]
1000single
1 wk recirculatingartificialstreams
No effectconductivity, alkalinity, soluble reactive phosphorous,respirationspecies composition periphyton (study probably too short)DecreasepH, net primary production
-
-
7 d
Moorhead & Kosinski1986 [17]
3
15
[55]
1000single
3 wk recirculatingartificialstreams
Decreasegross primary productionbiovolume periphyton on artificial substrate
> 21 d14 d
Kosinski 1984Kosinski & Merkle1984 [8]
4
23
[56]
1560multiple
60 d enclosures ina large lake
Decreasenumber, biomass, Chl-a and 14C-uptake of periphytonChangespecies composition periphyton
21-35 d
>56 d
Hamilton et al. 1987[15]
5
75
[57]
5000single
60 d Taubmicrocosms
DecreaseDO, 14C-uptake, net primary production, respiration,14C-uptake/Chl-a
>53 dStay et al. 1985 [14] 5
75[58]
5000single
42 d Leflermicrocosms
DecreasepH, primary production >42 d
Stay et al. 1989 [11] 4
75[59]
5000single
12 d lab stagnantmicrocosms
Decreasenet O2 production >12 d
Brockway et al. 1984[1]I
4
149
[60]
10000single
1 wk recirculatingartificialstreams
No effectconductivity, alkalinity, soluble reactive phosphorous,respirationspecies composition periphyton (study probably too short)DecreasepH, net primary production
-
-
> 7 d
Moorhead & Kosinski1986 [17]
4
149
[61]
10000single
3 wk recirculatingartificialstreams
Decreasegross primary productionbiovolume periphyton on artificial substrate
> 21 d> 21 d
Kosinski 1984Kosinski & Merkle1984 [8]
4

Alterra-Rapport 08878
Table Ib. Multiple applications of atrazine in an open running ecosystem. UP criterion is based on Scenedesmus subspicatus : gm-EC50 67 µg/L. Exposure is two times 24 hours withan interval of 14 days. Observation duration concerns period after each treatment.
Studied Tugsa
[case number]Studiedconc.(µg/L)
Observationduration
Ecosystem Results Recovery Reference(study number)
Effect classsensitive endpoint
0.03
[1]
2 14 d stream No effectash-free dry weight periphytoncell density algae
--
Jurgensen & Hoagland1990 [19]
1
0.48
[2]
30 14 d stream No effectash-free dry weight periphytoncell density algae
--
Jurgensen & Hoagland1990 [19]
1
1.5
[3]
100 14 d stream No effectash-free dry weight periphytoncell density algae
--
Jurgensen & Hoagland1990 [19]
1

Alterra-Rapport 088 79
Appendix 2
Substance: simazinetriazine
Available laboratory toxicity data for standard green algae (Chlorophyta).
Species Exposure Endpoint EC50 NOEC Referenceduration (hour) (µg/L) (µg/L)
Selenastrum capricornutum 72 growth rate 350 - Källqvist & Romstad 199496 growth 1240 600 Fairchild et al. 199796 ? 100 - Versteeg 1990
Chlorella pyrenoidosa 110 growth - 521) Foy & Hiranpradit 1977
Chlamydomonas geitleri 72 growth rate 863 - François & Robinson 199072 growth 1109 - François & Robinson 1990
Available laboratory toxicity data for duckweed (Lemnaceae).
Species Exposure Endpoint EC50 NOEC Referenceduration (days) (µg/L) (µg/L)
Lemna minor 4 density 166 75 Fairchild et al. 1997
1) quoted in Crommentuijn et al. 1997
Summary of available laboratory toxicity data for algae, green algae and duckweed.
Species gm-EC50 gm-NOEC(µg/L) (µg/L)
Selenastrum capricornutum 351 600Chlorella pyrenoidosa - 52Chlamydomonas geitleri 878 -Lemna spp. 166 75
Summary criteria.
UP conservative UP liberal MPC freshwater(µg/L) (µg/L) (µg/L)
10 35.1 0.14
conservative UP criterion based on lowest EC50 for standard algaliberal UB criterion based on gm-EC50 for most sensitive standard algaMPC for freshwater from Crommentuijn et al. 1997

Alterra-Rapport 08880
Table 2. Single peak loads simazine in stagnant ecosystems. UB criterion is based on Selenastrum capricornutum: gm-EC50 351 µg/L.
Studied Tugsa
[case number]Studied conc.(µg/L)
Observationduration
Ecosystem Results Recovery Reference[study number]
Effect classsensitive endpoint
0.28
[1]
100 6 wk enclosuresin a swamp
No effectnitrate, siliciumChl-a and biovolume periphyton14C uptake periphytonDecreaseDOChangespecies composition periphyton (slight)
---
< 1 wk
± 2 wk
Goldsborough &Robinson 1983Goldborough &Robinson 1986 [21]
3
0.28
[2]
100 24 d enclosuresin a swamp
No effectDOsiliciumIncreaseammonium (slight)phosphorous (slight)
--
??
Goldsborough &Robinson 1985 [22]
2
0.28
[3]
100 21 d bottles ofnaturalwater in apond
No effectDO, pH, nitrate, ammoniumcell density and species composition phytoplanktonjuvenile Copepodanumbers and species composition rotifersnumbers of bacteria
-----
Jenkins & Buikema1990 [24]
1
1.4
[4]
500 21 d bottles ofnaturalwater in apond
No effectnitratejuvenile Copepodanumbers of bacteriaDecreaseDO, pHcell density phytoplanktonIncreaseammoniumnumbers and species composition rotifersChangespecies composition phytoplankton and rotifers
---
??
??
?
Jenkins & Buikema1990 [24]
4

Alterra-Rapport 088 81
Table 2. Continued – 1. Single peak loads simazine in stagnant ecosystems. UP criterion is based on Selenastrum capricornutum: gm-EC50 351 µg/L.
Studied Tugsa
[case number]Studied conc.(µg/L)
Observationduration
Ecosystem Results Recovery Reference[study number]
Effect classsensitive endpoint
2.8
[5]
1000 6 wk enclosuresin a swamp
DecreaseChl-a and biovolume periphyton14C uptake periphytonDOIncreasenitrate and siliciumChangespecies composition periphyton
> 3 wk> 3 wk< 1 wk
< 1 wk
> 3 wk
Goldsborough &Robinson 1983Goldborough &Robinson 1986 [21]
4
2.8
[6]
1000 24 d enclosuresin a swamp
DecreaseDOIncreasesilicium (slight)ammoniumphosphorous (slight)
n.a.
n.a.??
Goldsborough &Robinson 1985 [22]
4
2.8
[7]
1000 21 d bottles ofnaturalwater in apond
No effectjuvenile Copepodanumbers of bacteriaDecreaseDO, pH, nitratecell density phytoplanktonIncreaseammoniumnumbers and species composition of rotifersChangespecies composition periphyton
--
??
??
?
Jenkins & Buikema1990 [24]
4
5.7
[8]
2000 86 d enclosuresin a swamp
No effectsiliciumcell density periphytonDecreaseDO, 14C uptake periphytonChl-a (slight)biovolume periphyton, 14C uptake benthic algaeIncreaseammonium and phosphorousChangespecies composition periphyton
--
14 d14 d> 80 d
14 d
> 80 d
Gurney & Robinson1989 [23]
5
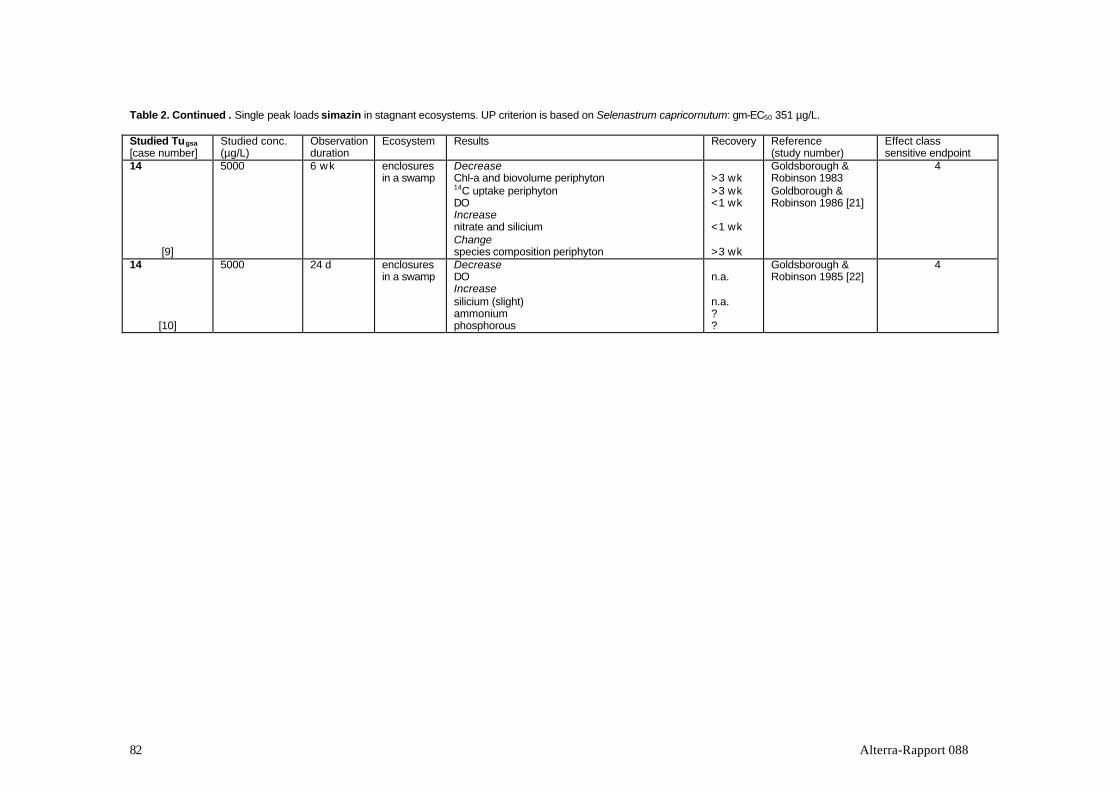
Alterra-Rapport 08882
Table 2. Continued . Single peak loads simazin in stagnant ecosystems. UP criterion is based on Selenastrum capricornutum: gm-EC50 351 µg/L.
Studied Tugsa
[case number]Studied conc.(µg/L)
Observationduration
Ecosystem Results Recovery Reference(study number)
Effect classsensitive endpoint
14
[9]
5000 6 wk enclosuresin a swamp
DecreaseChl-a and biovolume periphyton14C uptake periphytonDOIncreasenitrate and siliciumChangespecies composition periphyton
>3 wk>3 wk<1 wk
<1 wk
>3 wk
Goldsborough &Robinson 1983Goldborough &Robinson 1986 [21]
4
14
[10]
5000 24 d enclosuresin a swamp
DecreaseDOIncreasesilicium (slight)ammoniumphosphorous
n.a.
n.a.??
Goldsborough &Robinson 1985 [22]
4
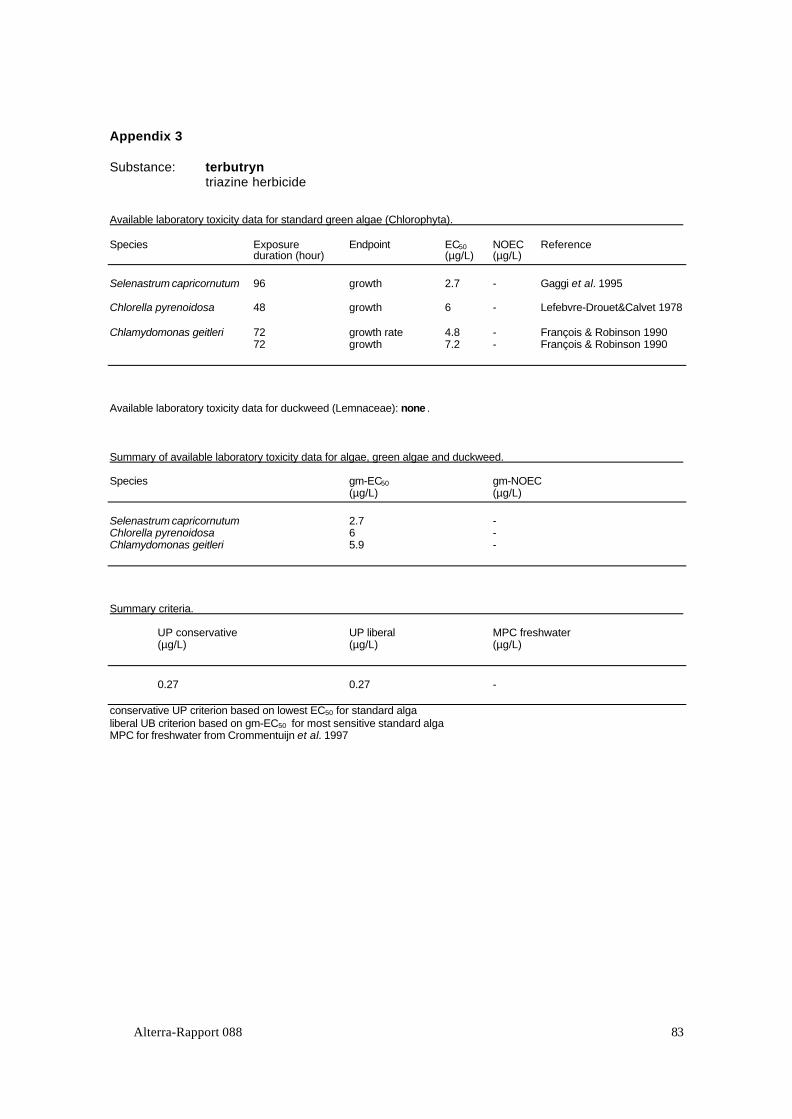
Alterra-Rapport 088 83
Appendix 3
Substance: terbutryntriazine herbicide
Available laboratory toxicity data for standard green algae (Chlorophyta).
Species Exposure Endpoint EC50 NOEC Referenceduration (hour) (µg/L) (µg/L)
Selenastrum capricornutum 96 growth 2.7 - Gaggi et al. 1995
Chlorella pyrenoidosa 48 growth 6 - Lefebvre-Drouet&Calvet 1978
Chlamydomonas geitleri 72 growth rate 4.8 - François & Robinson 199072 growth 7.2 - François & Robinson 1990
Available laboratory toxicity data for duckweed (Lemnaceae): none .
Summary of available laboratory toxicity data for algae, green algae and duckweed.
Species gm-EC50 gm-NOEC(µg/L) (µg/L)
Selenastrum capricornutum 2.7 -Chlorella pyrenoidosa 6 -Chlamydomonas geitleri 5.9 -
Summary criteria.
UP conservative UP liberal MPC freshwater(µg/L) (µg/L) (µg/L)
0.27 0.27 -
conservative UP criterion based on lowest EC50 for standard algaliberal UB criterion based on gm-EC50 for most sensitive standard algaMPC for freshwater from Crommentuijn et al. 1997

Alterra-Rapport 08884
Table 3a. Single peak loads of terbutryn in stagnant ecosystems. UP criterion based on Selenastrum capricornutum: gg-EC50 2.7 µg/L.
Studied Tugsa
[case number]Studied conc.(µg/L)
Observationduration
Ecosystem Results Recovery Reference[study number]
Effect classsensitive endpoint
2.2
[1]
6 2 m enclosuresin a fishpond
No effectturbidity, ammonia, nitrite, CODnumbers and species composition of phytoplanktonDecreaseDO (slight)Chl-a
--
8 wk4 wk
Struve et al. 1991[25]
3
3.7
[2]
10 6 wk enclosuresin a swamp
DecreaseChl-a and biovolume periphyton14C uptake periphytonDOIncreasenitrate and siliciumChangespecies composition periphyton
>3 wk3 wk<1 wk
<1 wk
>3 wk
Goldsborough &Robinson 1983Goldsborough &Robinson 1986 [21]
4
3.7
[3]
10 86 d enclosuresin a swamp
No effectsiliciumcell density periphytonDecreaseDO, 14C uptake periphytonChl-a (slight)biovolume periphyton, 14C uptake benthic algaeIncreaseammonium and phosphorousChangespecies composition periphyton
--
21 d21 d>80 d
21 d
>80 d
Gurney & Robinson1989 [23]
5
4.4
[4]
12 2 m enclosuresin a fishpond
No effectammonia, nitrite, CODnumbers of phytoplanktonDecreaseDOturbidityChl-aChangespecies composition phytoplankton
--
8 wk?6 wk
?
Struve et al. 1991[25]
4

Alterra-Rapport 088 85
Table 3a. Continued . Single peak loads of terbutryn in stagnant ecosystems. UP criterion based on Selenastrum capricornutum: gm-EC50 2.7 µg/L
Studied Tugsa
[case number]Studied conc.(µg/L)
Observationduration
Ecosystem Results Recovery Reference[study number]
Effect classsensitive endpoint
8.9
[5]
24 2 m enclosuresin a fishpond
No effectammonia, nitrite, CODnumbers of phytoplanktonDecreaseDOturbidityChl-aChangespecies composition phytoplankton
--
8 wk?6 wk
?
Struve et al. 1991[25]
4
37
[6]
100 6 wk enclosuresin a swamp
DecreaseChl-a and biovolume periphyton14C uptake periphytonDOIncreasenitrate and siliciumChangespecies composition periphyton
>3 wk>3 wk<1 wk
<1 wk
>3 wk
Goldborough &Robinson 1983Goldborough &Robinson 1986[21]
4
370
[7]
1000 6 wk enclosuresin a swamp
DecreaseChl-a and biovolume periphyton14C uptake periphytonDOIncreasenitrate and siliciumChangespecies composition periphyton
> 3 wk> 3 wk<1 wk
<1 wk
>3 wk
Goldborough &Robinson 1983Goldborough &Robinson 1986[21]
4

Alterra-Rapport 08886
Table 3b. Single peak loads of terbutryn in an open running ecosystem. UB criterion is based on Selenastrum capricornutum: gm-EC50 2.7 µg/L. Exposure duration is 24 hours.
Studied Tugsa
[case number]Studied conc.(µg/L)
Observationduration
Ecosystem Results Recovery Reference[study number]
Effect classsensitive endpoint
1.9
[1]
5 21 d runningsystem withaquaticplants
No effectperiphyton on Elodeasurvival Elodea canadensis
--
Paterson & Wright1987 [38]
1
3.7
[2]
10 21 d runningsystem withaquaticplants
No effectperiphyton on Elodeasurvival Elodea canadensis
--
Paterson & Wright1987 [38]
1
19
[3]
50 21 d runningsystem withaquaticplants
No effectperiphyton on Elodeasurvival Elodea canadensis
--
Paterson & Wright1987 [38]
1

Alterra-Rapport 088 87
Appendix 4
Substance: hexazinonetriazinone
Available laboratory toxicity data for standard green algae (Chlorophyta).
Species Exposure Endpoint EC50 NOEC Referenceduration (hour) (µg/L) (µg/L)
Selenastrum capricornutum 96 growth 24.5 - St. Laurent et al. 1992120 growth rate 85 - Abou-Waly et al. 1991
Available laboratory toxicity data for duckweed (Lemnaceae): none .
Summary of available laboratory toxicity data for algae, green algae and duckweed.
Species gm-EC50 gm-NOEC(µg/L) (µg/L)
Selenastrum capricornutum 46 -
Summary criteria.
UB conservative UP liberal MPC freshwater(µg/L) (µg/L) (µg/L)
2.5 4.6 -
conservative UP criterion based on lowest EC50 for standard algaliberal UP criterion based on gm-EC50 for most sensitive standard algaMPC for freshwater from Crommentuijn et al. 1997

Alterra-Rapport 08888
Table 4a. Single peak loads of hexazinone in a stagnant ecosystem. UP criterion is based on Selenastrum capricornutum: gm-EC50 46 µg/L.
Studied Tugsa
[case number]Studied conc.(µg/L)
Observationduration
Ecosystem Results Recovery Reference[study number]
Effect classsensitive endpoint
0.22
[1]
10 77 d enclosuresin a lake
No effectnumbers of zooplanktonDecreaseDO (slight)biomass phytoplankton (slight)
-
42 d14 d
Thompson et al.1993aThompson et al.1993b [28]
2
2.2
[2]
100 77 d enclosuresin a lake
DecreaseDObiomass phytoplanktonnumbers of zooplankton
49 d>77 d<77 d
Thompson et al.1993aThompson et al.1993b [28]
5
22
[3]
1000 77 d enclosuresin a lake
DecreaseDObiomass phytoplanktonnumbers of zooplankton
49 d>77 d<77 d
Thompson et al.1993aThompson et al.1993b [28]
5
217
[4]
10000 77 d enclosuresin a lake
DecreaseDObiomass phytoplanktonnumbers of zooplankton
49 d>77 d<77 d
Thompson et al.1993aThompson et al.1993b [28]
5

Alterra-Rapport 088 89
Table 4b. Single peak loads of hexazinone in an open running ecosystem. UP criterion is based on Selenastrum capricornutum: gm-EC50 46 µg/L. Exposure was 12 hours or 1 hour.
Studied Tugsa
[case number]Studied conc.(µg/L)
Observationduration
Ecosystem Results Recovery Reference[study number]
Effect classsensitive endpoint
59
[1]
2700 3 d lab runningsystem
No effectChl-a periphytonDecreaseoxygen production periphyton (slight)
-
3 h
Kreutzweiser et al.1995 [26]
2
59
[2]
2700 14 d artificialstreamsoutdoors
No effectChl-a periphytondrift and density macroinvertebrates
--
Kreutzweiser et al.1995 [26]
1
200
[3]
9200 48 h openartificialstreams
No effectdrift of some benthic insect larvaesurvival of some benthic insect larvae
--
Kreutzweiser et al.1992 [27]
1
1783
[4]
82000 48 h openartificialstreams
No effectsurvival of some benthic insect larvaeIncreasedrift of some benthic insect larvae
?
?
Kreutzweiser et al.1992 [27]
4
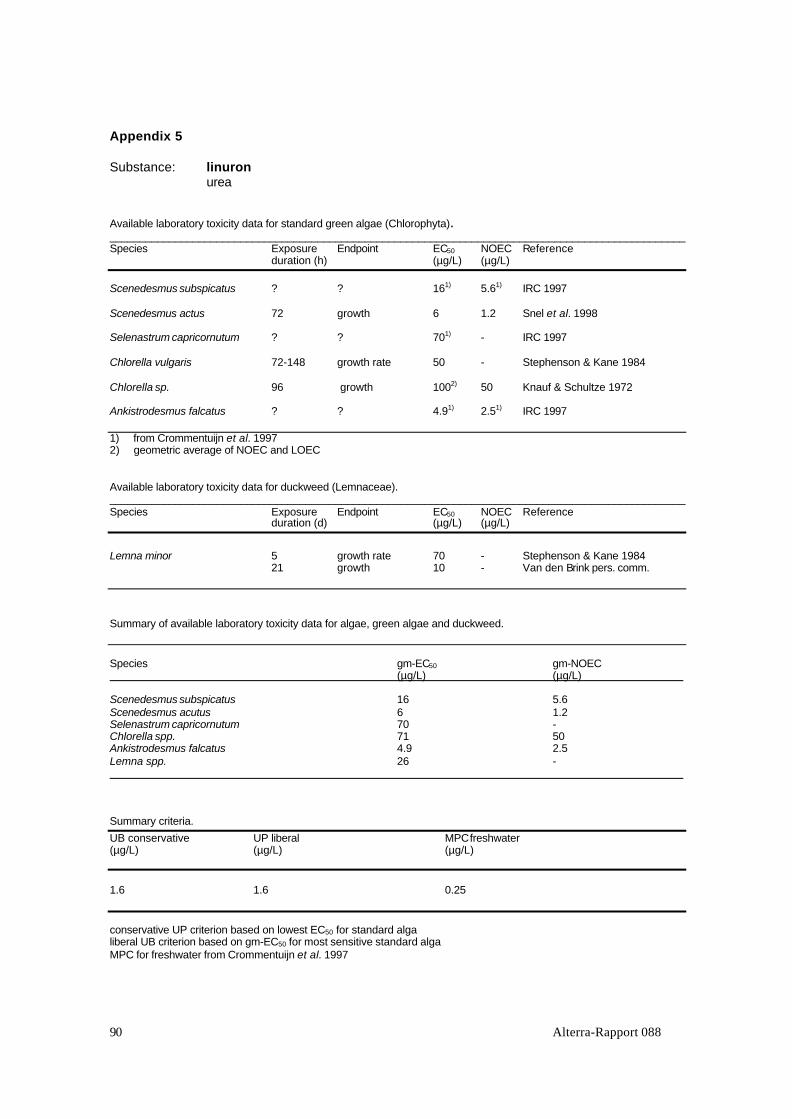
Alterra-Rapport 08890
Appendix 5
Substance: linuron urea
Available laboratory toxicity data for standard green algae (Chlorophyta)._________________________________________________________________________________________________Species Exposure Endpoint EC50 NOEC Reference
duration (h) (µg/L) (µg/L)
Scenedesmus subspicatus ? ? 161) 5.61) IRC 1997
Scenedesmus actus 72 growth 6 1.2 Snel et al. 1998
Selenastrum capricornutum ? ? 701) - IRC 1997
Chlorella vulgaris 72-148 growth rate 50 - Stephenson & Kane 1984
Chlorella sp. 96 growth 1002) 50 Knauf & Schultze 1972
Ankistrodesmus falcatus ? ? 4.91) 2.51) IRC 1997
1) from Crommentuijn et al. 19972) geometric average of NOEC and LOEC
Available laboratory toxicity data for duckweed (Lemnaceae)._________________________________________________________________________________________________Species Exposure Endpoint EC50 NOEC Reference
duration (d) (µg/L) (µg/L)
Lemna minor 5 growth rate 70 - Stephenson & Kane 198421 growth 10 - Van den Brink pers. comm.
Summary of available laboratory toxicity data for algae, green algae and duckweed.
Species gm-EC50 gm-NOEC (µg/L) (µg/L)
Scenedesmus subspicatus 16 5.6Scenedesmus acutus 6 1.2Selenastrum capricornutum 70 -Chlorella spp. 71 50Ankistrodesmus falcatus 4.9 2.5Lemna spp. 26 -
Summary criteria.
UB conservative UP liberal MPC freshwater(µg/L) (µg/L) (µg/L)
1.6 1.6 0.25
conservative UP criterion based on lowest EC50 for standard algaliberal UB criterion based on gm-EC50 for most sensitive standard algaMPC for freshwater from Crommentuijn et al. 1997

Alterra-Rapport 088 91
Table 5. Studies conducted with single peak loads and constant exposure of linuron in stagnant ecosystems. UP criterion is based on Scenedesmus subspicatus : gm-EC50 16 µg/L.
Studied Tugsa
[case number]Studied conc.(µg/L)
Observationduration
Ecosystem Results Recovery Reference[study number]
Effect classsensitive endpoint
0.03
[1]
0.5 constant 5 wk labstagnantmicrocosms
No effectDO, pHconductivity, alkalinity, potassium, calcium, nitrate,sodium, ammonium, phosphorousspecies composition and Chl-a phytoplanktonspecies composition and Chl-a periphytongrowth and final weight Elodea in bioassaysno. of Cladocera, Copepoda, rotifers, Ostracodanumbers of athropods and molluscsdecomposition organic matter
---------
Van den Brink et al.1997Cuppen et al. 1997[30]
1
0.3
[2]
5 constant 5 wk labstagnantmicrocosms
No effectconductivity, potassium, calcium, nitrate, sodium,ammonium, phosphorousChl-a phytoplanktonspecies composition and Chl-a periphytonfinal weight Elodea in bioassaysnumbers of Cladocera, Copepoda, Ostracodanumbers of anthropods and molluscsdecomposition organic matterDecreaseDO, pH,growth Elodea in bioassaysIncreasealkalinityChangespecies composition phytoplankton
-
------
<5 wk?
<5 wk
<5 wk
Van den Brink et al.1997Cuppen et al. 1997[30]
4
0.9
[3]
15 constant 5 wk labstagnantmicrocosms
No effectpotassium, calcium, nitrate, sodium, ammonium,phosphorous; Chl-a phytoplanktonspecies composition and Chl-a periphytonfinal weight Elodea in bioassaysnumbers of Cladocera, Copepoda, Ostracodanumbers of anthropodes and mollusksdecomposition organic substanceDecreaseDO, pHgrowth Elodea in bioassaysnumbers of rotifersIncreaseconductivity, alkalinityChangespecies composition phytoplankton
-------
<5 wk?>5 wk
<5 wk
<5 wk
Van den Brink et al.1997Cuppen et al. 1997[30]
5

Alterra-Rapport 08892
Table 5. Continued. Studies conducted with single peak loads and constant exposure of linuron in stagnant ecosystems. UP criterion based on S. subspicatum: gm-EC50 16 µg/L.
Studied Tugsa
[case number]Studied conc.(µg/L)
Observationduration
Ecosystem Results Recovery Reference[study number]
Effect classsensitive endpoint
3.1
[4]
50 constant 5 wk labstagnantmicrocosms
No effectpotassium, calcium, nitrate, sodium, ammonium,phosphorous; Chl-a phytoplankton; numbers ofCopepoda; numbers of anthropods and molluscsdecomposition organic matterDecreaseDO, pHgrowth and final weight Elodea in bioassaysnumbers of rotifers, OstracodaIncreaseconductivity, alkalinityChl-a periphytonnumbers of CladoceraChangespecies composition phytoplanktonspecies composition periphyton
----
>5 wk>5 wk>5 wk
>5 wk?5 wk
?>5 wk
Van den Brink et al.1997Cuppen et al. 1997[30]
4
9.4
[5]
150 constant 5 wk labstagnantmicrocosms
No effectsodium, ammonium, phosphorousdecomposition organic substanceDecreaseDO, pHgrowth and final weight Elodea in bioassaysnumbers of rotifers, Ostracodanumbers of athropods and molluscsIncreaseconductivity, alkalinity, potassium, calcium, nitrateChl-a phytoplanktonChl-a periphytonnumbers of Cladocera and CopepodaChangespecies composition phytoplanktonspecies composition periphyton
--
>5 wk>5 wk>5 wk>5 wk
>5 wk<5 wk?5 wk
>5 wk>5 wk
Van den Brink et al.1997Cuppen et al. 1997[30]
4
63
[6]
1000 single 42 d enclosuresin a pond
No effectChl-a phytoplanktonnumbers of molluscs and oligochatesDecreaseDO, pHquantity of macrophytesnumbers of Cladocera and Copepodanumbers of arthropodsIncreaseAlkalinity
--
>42 d>28 d>42 d>49 d
>42 d
Stephenson & Kane1984 [29]
4

Alterra-Rapport 088 93
Appendix 6
Substance: isoproturonurea
Available laboratory toxicity data for standard green algae (Chlorophyta).
Species Exposure Endpoint EC50 NOEC Referenceduration (hour) (µg/L) (µg/L)
Scenedesmus subspicatus 96 growth 21 - Kirby & Sheahan 1994
Chlorella pyrenoidosa 48 growth 40 - Lefebvre-Drouet&Calvet 1978
Chlamydomonas reinhardi 72 ? 40 - Traunspurger et al. 1996
Available laboratory toxicity data for duckweed (Lemnaceae)._________________________________________________________________________________________________Species Exposure Endpoint EC50 NOEC Reference
duration (d) (µg/L) (µg/L)
Lemna minor 10 growth 33 - Kirby & Sheahan 1994
Summary of available laboratory toxicity data for algae, green algae and duckweed.
Species gm-EC50 gm-NOEC(µg/L) (µg/L)
Scenedesmus subspicatus 21 -Chlorella pyrenoidosa 40 -Chlamydomonas reinhardi 40 -Lemna spp. 33 -
Summary criteria.
UB conservative UP liberal MPC freshwater(µg/L) (µg/L) (µg/L)
2.1 2.1 0.32
conservative UP criterion based on lowest EC50 for standard algaliberal UB criterion based on gm-EC50 for most sensitive standard algaMPC for freshwater from Crommentuijn et al. 1997

Alterra-Rapport 08894
Table 6. Studies conducted with single peak loads and constant exposure to isoproturon in stagnant ecosystems. UP criterion is based on Scenedesmus subspicatus : gm-EC50 21µg/L.
Studied Tugsa
[case number]Studied conc.(µg/L)
Observationduration
Ecosystem Results Recovery Reference[study number]
Effect classsensitive endpoint
0.10
[1]
2 single 3 wk labstagnantmicrocosms
No effectbiomass Elodea densabiomass Ludwigia natansDecreaseDO (slight)
--
>21 d
Feurtet-Mazel et al.1996 [31]
2
0.29
[2]
6 single 71 d labstagnantmicrocosms
Decreasedensity and species composition Bacillariophytawithin periphyton
71 dPérès et al. 1996[32]
3
0.38
[3]
8 constant viasediment
71 d labstagnantmicrocosms
Decreasedensity and species composition Bacillariophytawithin periphyton
71 d Pérès et al. 1996[32]
3
0.43
[4]
9 single 3 wk labstagnantmicrocosms
No effectbiomass Ludwigia natansDecreaseDObiomass Elodea densa
-
>21 d>21 d
Feurtet-Mazel et al.1996 [31]
4
0.48
[5]
10 single 56 d labstagnantmicrocosms
No effectproduction of carbon dioxide & methane sedimentdensity and species composition phytoplanktonnumbers and species composition zooplanktonnumbers of nematodes, Phyllopodanumbers of snails and Puntius (fish) in cages
-----
Traunsprunger et al.1996 [42]
1
1.0
[6]
21 constant viasediment
71 d labstagnantmicrocosms
Decreasedensity and species composition Bacillariophytawithin periphyton
>71 dPérès et al. 1996[31]
5
1.4
[7]
30 single 56 d labstagnantmicrocosms
No effectproduction of carbon dioxide & methane sedimentdensity and species composition phytoplanktonnumbers and species composition zooplanktonnumbers of nematodes, Phyllopodanumbers of snails and Puntius (fish) in cages
-----
Traunsprunger et al.1996 [42]
1
1.5
[8]
31 single 3 wk labstagnantmicrocosms
No effectbiomass Ludwigia natansDecreaseDObiomass Elodea densa
-
>21 d>21 d
Feurtet-Mazel et al.1996 [31]
4

Alterra-Rapport 088 95
Table 6. Continued. Studies conducted with single peak loads and constant exposure to isoproturon in stagnant ecosystems. UP criterion is based on Scenedesmus subspicatus :gm-EC50 21 µg/L.
Studied Tugsa
[case number]Studied conc.(µg/L)
Observationduration
Ecosystem Results Recovery Reference[study number]
Effect classsensitive endpoint
1.7
[9]
35 constant viasediment
71 d labstagnantmicrocosms
Decreasedensity and species composition Bacillariophytawithin periphyton
>71 dPérès et al. 1996[32]
5
3.0
[10]
62 3 wk labstagnantmicrocosms
No effectbiomass Ludwigia natansDecreaseDObiomass Elodea densa
-
>9 d>21 d
Feurtet-Mazel et al.1996 [31]
4
4.3
[11]
90 56 d labstagnantmicrocosms
No effectdensity and species composition phytoplanktonnumbers and species composition zooplanktonnumbers of nematodes, Phyllopodanumbers of snails and Puntius (fish) in cagesDecreaseproduction of carbon dioxide & methane sediment
----
>56 d
Traunsprunger et al.1996 [42]
5
4.8
[12]
100 3 wk labstagnantmicrocosms
No effectbiomass Ludwigia natansDecreaseDObiomass Elodea densa
-
>21 d>21 d
Feurtet-Mazel et al.1996 [31]
4
6.0
[13]
125 3 wk labstagnantmicrocosms
DecreaseDObiomass Ludwigia natansbiomass Elodea densa
>21 d>21 d>21 d
Feurtet-Mazel et al.1996 [31]
4
12
[14]
250 3 wk labstagnantmicrocosms
DecreaseDObiomass Ludwigia natansbiomass Elodea densa
>21 d>21 d>21 d
Feurtet-Mazel et al.1996 [31]
4
24
[15]
500 3 wk labstagnantmicrocosms
DecreaseDObiomass Ludwigia natansbiomass Elodea densa
>21 d>21 d>21 d
Feurtet-Mazel et al.1996 [31]
4
48
[16]
1000 3 wk labstagnantmicrocosms
DecreaseDObiomass Ludwigia natansbiomass Elodea densa
>21 d>21 d>21 d
Feurtet-Mazel et al.1996 [31]
4

Alterra-Rapport 08896
Appendix 7
Substance: diuronurea
Available laboratory toxicity data for standard green algae (Chlorophyta).
Species Exposure Endpoint EC50 NOEC Referenceduration (hour) (µg/L) (µg/L)
Scenedesmus subspicatus 72 growth 72 10 Schäfer et al. 199472 growth rate 36 5 Tamerus 1996
Scenedesmus parvus 72 growth rate 27 7 Tamerus 1996
Selenastrum capricornutum 72 growth rate 15 3 Tamerus 1996
Chlorella pyrenoidosa 72 growth - 2.31) Davis et al. 197696 growth 25 - Maule & Wright 1984
Available laboratory toxicity data for duckweed (Lemnaceae)._________________________________________________________________________________________________Species Exposure Endpoint EC50 NOEC Reference
duration (d) (µg/L) (µg/L)
Lemna major 7 number 41 2.31) Liu & Cedeño-Maldonado 1974
Lemna gibba 14 biomass ±23 - Wejnar et al. 1992
Lemna perpusila 7 number 15 2.31) Liu & Cedeño-Maldonado 1974
1) derived from data
Summary of available laboratory toxicity data for algae, green algae and duckweed.
Species gm-EC50 gm-NOEC(µg/L) (µg/L)
Scenedesmus subspicatus 51 7Scenedesmus parvus 27 7Selenastrum capricornutum 15 3Chlorella pyrenoidosa 25 2.3Lemna spp. 24 2.3
Summary criteria.
UP conservative UP liberal MPC freshwater(µg/L) (µg/L) (µg/L)
1.5 1.5 0.43
conservative UP criterion based on lowest EC50 for standard algaliberal UP criterion based on gg-EC50 for most sensitive standard algaMPC for freshwater from Crommentuijn et al. 1997

Alterra-Rapport 088 97
Table 7. Single peak loads of diuron in a stagnant ecosystem. UP criterion is based on Selenestrum capricornutum:: gm-EC50 15 µg/L.
Studied Tugsa
[case number]Studied conc.(µg/L)
Observationduration
Ecosystem Results Recovery Reference[study number]
Effect classsensitive endpoint
0.02
[1]
0.29 42 d labstagnantmicrocosms
No effectDO -
Flum & Shannon1987 [20]
1
0.19
[2]
2.9 42 d labstagnantmicrocosms
No effectDO -
Flum & Shannon1987 [20]
1
1.9
[3]
28.5 42 d labstagnantmicrocosms
DecreaseDO ?
Flum & Shannon1987 [20]
4
19
[4]
285 42 d labstagnantmicrocosms
DecreaseDO ?
Flum & Shannon1987 [20]
4
190
[5]
2850 42 d labstagnantmicrocosms
DecreaseDO >42 d
Flum & Shannon1987 [20]
4
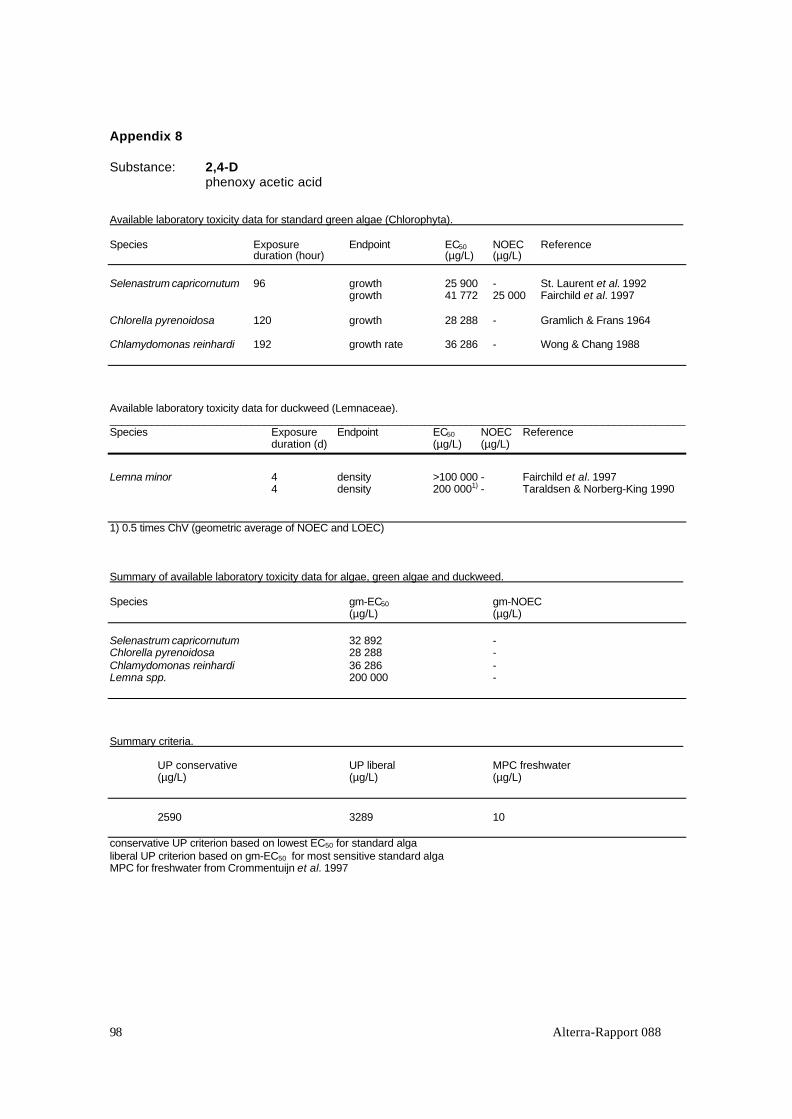
Alterra-Rapport 08898
Appendix 8
Substance: 2,4-Dphenoxy acetic acid
Available laboratory toxicity data for standard green algae (Chlorophyta).
Species Exposure Endpoint EC50 NOEC Referenceduration (hour) (µg/L) (µg/L)
Selenastrum capricornutum 96 growth 25 900 - St. Laurent et al. 1992growth 41 772 25 000 Fairchild et al. 1997
Chlorella pyrenoidosa 120 growth 28 288 - Gramlich & Frans 1964
Chlamydomonas reinhardi 192 growth rate 36 286 - Wong & Chang 1988
Available laboratory toxicity data for duckweed (Lemnaceae)._________________________________________________________________________________________________Species Exposure Endpoint EC50 NOEC Reference
duration (d) (µg/L) (µg/L)
Lemna minor 4 density >100 000 - Fairchild et al. 19974 density 200 0001) - Taraldsen & Norberg-King 1990
1) 0.5 times ChV (geometric average of NOEC and LOEC)
Summary of available laboratory toxicity data for algae, green algae and duckweed.
Species gm-EC50 gm-NOEC(µg/L) (µg/L)
Selenastrum capricornutum 32 892 -Chlorella pyrenoidosa 28 288 -Chlamydomonas reinhardi 36 286 -Lemna spp. 200 000 -
Summary criteria.
UP conservative UP liberal MPC freshwater(µg/L) (µg/L) (µg/L)
2590 3289 10
conservative UP criterion based on lowest EC50 for standard algaliberal UP criterion based on gm-EC50 for most sensitive standard algaMPC for freshwater from Crommentuijn et al. 1997

Alterra-Rapport 088 99
Table 8. Single peak loads of 2,4-D in stagnant ecosystems. UP criterion is based on Selenastrum capricornutum: gm-EC50 32 892 µg/L.
Studied Tugsa
[case number]Studied conc.(µg/L)
Observationduration
Ecosystem Results Recovery Reference[study number]
Effect classsensitive endpoint
0.0003[1]
10 60 d enclosures ina pond
No effectsurvival Potamogeton pectinatus and Myriophylumsibiricumweight Myriophylum sibiricumIncreaseweight Potamogeton pectinatus
-
-
>60 d
Forsyth et al. 1997[34]
1
0.003
[2]
100 60 d enclosures ina pond
No effectsurvival Potamogeton pectinatusDecreaseweight Potamogeton pectinatus and Myriophylumsibiricumsurvival Myriophylum sibiricum
-
>60 d
>60 d
Forsyth et al. 1997[34]
5
0.015
[3]
500 16 wk experimentalponds
No effectconductivity, turbidity, redox potential, alkalinity, pHnitrogen, phosphorousgross primary productionChl-a phytoplanktonabundance Najas sp.numbers of zooplanktonash-free dry weight of benthic macroinvertebratessize and weight of bluegillsDecreaseabundance of Sagittaria montividensisIncreasecover submerged aquatic plants
--------
?
?
Boyle 1980 [33] 4
0.030
[4]
1000 16 wk experimentalponds
No effectconductivity, turbidity, redox potential, pHnitrogen, phosphorousgross primary productionChl-a phytoplanktonabundance Najas sp.cover submerged aquatic plantsnumbers of zooplanktonash-free dry weight of benthic macroinvertebratesDecreaseabundance of Sagittaria montividensisIncreasealkalinitysize bluegills (slight)weight bluegills
--------
?
?>16 wk>16 wk
Boyle 1980 [33] 4

Alterra-Rapport 088100
Table 8. Continued. Single peak loads of 2,4-D in stagnant ecosystems. UP criterion is based on Selenastrum capricornutum: gm-EC50 32 892 µg/L.
Studied Tugsa
[case number]Studied conc.(µg/L)
Observationduration
Ecosystem Results Recovery Reference[study number]
Effect classsensitive endpoint
0.030
[5]
1000 338 d experimental ponds
No effectturbidity, DO, alkalinity, POCammonia, nitrogen, phosphorous, siliciumDecreasecarbon uptake Myriophyllum stemsdensity Elodea, Potamogeton, Typha,Myriophyllumdiversity macroinvertebratesIncreaseDOC, nitratedensity CharaChangespecies composition micro-organisms
--
>20 d>57 d
>338 d
??
114 d
Scott et al. 1981Stephenson &Mackie 1986Sherry 1994 [44]
5
0.061
[6]
2000 8 d lake, field No effectpH, alkalinityChl-a phytoplanktonDecreaseDO (slight)gross primary production and respiration, density ofmacrophytesIncreasenitrate, phosphorousdensity and biovolume phytoplankton
--
5 d>7 d
>8 d?
Kobriae & White1996 [35]
4
0.061
[7]
2000 8 d bottles oflake water
No effectDO, pH, alkalinitynitrate, phosphorousrespirationChl-a phytoplanktondensity and biovolume phytoplanktonIncreasegross primary production
-----
?
Kobriae & White1996 [35]
1
0.30
[8]
10 000 8 d bottles oflake water
No effectDO, pH, alkalinitynitrate, phosphorousgross primary production and respirationChl-a phytoplanktondensity and biovolume phytoplankton
-----
Kobriae & White1996 [35]
1
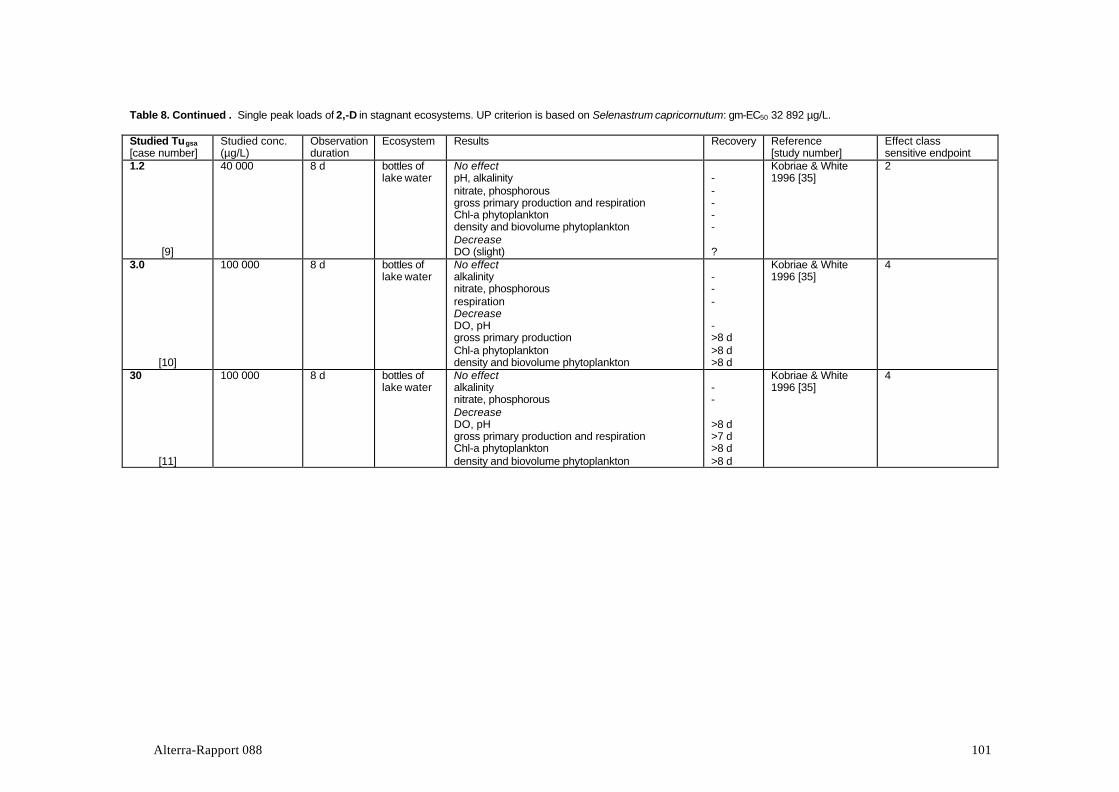
Alterra-Rapport 088 101
Table 8. Continued . Single peak loads of 2,-D in stagnant ecosystems. UP criterion is based on Selenastrum capricornutum: gm-EC50 32 892 µg/L.
Studied Tugsa
[case number]Studied conc.(µg/L)
Observationduration
Ecosystem Results Recovery Reference[study number]
Effect classsensitive endpoint
1.2
[9]
40 000 8 d bottles oflake water
No effectpH, alkalinitynitrate, phosphorousgross primary production and respirationChl-a phytoplanktondensity and biovolume phytoplanktonDecreaseDO (slight)
-----
?
Kobriae & White1996 [35]
2
3.0
[10]
100 000 8 d bottles oflake water
No effectalkalinitynitrate, phosphorousrespirationDecreaseDO, pHgross primary productionChl-a phytoplanktondensity and biovolume phytoplankton
---
->8 d>8 d>8 d
Kobriae & White1996 [35]
4
30
[11]
100 000 8 d bottles oflake water
No effectalkalinitynitrate, phosphorousDecreaseDO, pHgross primary production and respirationChl-a phytoplanktondensity and biovolume phytoplankton
--
>8 d>7 d>8 d>8 d
Kobriae & White1996 [35]
4

Alterra-Rapport 088102
Appendix 9
Substance: 2,4,5-Tphenoxy acetic acid
Available laboratory toxicity data for standard algae (Chlorophyta and Cyanophyta)_______________________________
Species Exposure Endpoint EC50 NOEC Referenceduration (hour) (µg/L) (µg/L)
Scenedesmus quadricauda 192 growth - >220 000 Bringman & Kühn 1978
Microcystis aeruginosa 192 growth - 52 000 Bringman & Kühn 1978(Cyanophyta)
Available laboratory toxicity data for duckweed (Lemnaceae): none .
Summary of available laboratory toxicity data for algae, green algae and duckweed.
Species gm-EC50 gm-NOEC(µg/L) (µg/L)
Scenedesmus quadricauda - >220 000Microcystis aeruginosa (Cyanophyta) - 52 000
Summary criteria.
Up conservative UP liberal MPC freshwater(µg/L) (µg/L) (µg/L)
- - 9
conservative UP criterion based on lowest EC50 for standard algaliberal UP criterion based on gm-EC50 for most sensitive standard algaMPC for freshwater from Crommentuijn et al. 1997

Alterra-Rapport 088 103
Table 9. Single peak loads of 2,4,5-T in a stagnant ecosystem. No toxicity data om algae found.
Studied Tugsa
[case number]Studied conc.(µg/L)
Observationduration
Ecosystem Results Recovery Reference[study number]
Effect classsensitive endpoint
-
[1]
100 25 d lab stagnantmicrocosms
No effectPrimary production and respirationdensity phytoplanktondensity rotifersdensity oligochaetesdensity micro-organisms
-----
Sugiura 1992 [46] 1
-
[2]
1000 25 d lab stagnantmicrocosms
No effectPrimary production and respirationdensity phytoplanktondensity rotifersdensity oligochaetesdensity micro-organisms
-----
Sugiura 1992 [46] 1
-
[3]
10000 25 d lab stagnantmicrocosms
No effectPrimary production and respirationdensity phytoplanktondensity rotifersdensity oligochaetesdensity micro-organisms
-----
Sugiura 1992 [46] 1
-
[4]
100000 25 d lab stagnantmicrocosms
No effectrespirationdensity phytoplanktondensity rotifersdensity oligochaetesDecreaseprimary productionChlorelladensity micro-organisms (afterwards Increase)
----
14 d21 d>25 d
Sugiura 1992 [46] 4

Alterra-Rapport 088104
Appendix 10
Substance: piclorampyridine
Available laboratory toxicity data for standard green algae (Chlorophyta).
Species Exposure Endpoint EC50 NOEC Referenceduration (hour) (µg/L) (µg/L)
Selenastrum capricornutum 96 growth 21 700 - St. Laurent et al. 1992
Available laboratory toxicity data for duckweed (Lemnaceae): none .
Summary of available laboratory toxicity data for algae, green algae and duckweed.
Species gm-EC50 gm-NOEC(µg/L) (µg/L)
Selenastrum capricornutum 21 700 -
Summary criteria.
UP conservative UP liberal MPC freshwater(µg/L) (µg/L) (µg/L)
2170 2170 -
conservative UP criterion based on lowest EC50 for standard algaliberal UP criterion based on gm-EC50 for most sensitive standard algaMPC for freshwater from Crommentuijn et al. 1997
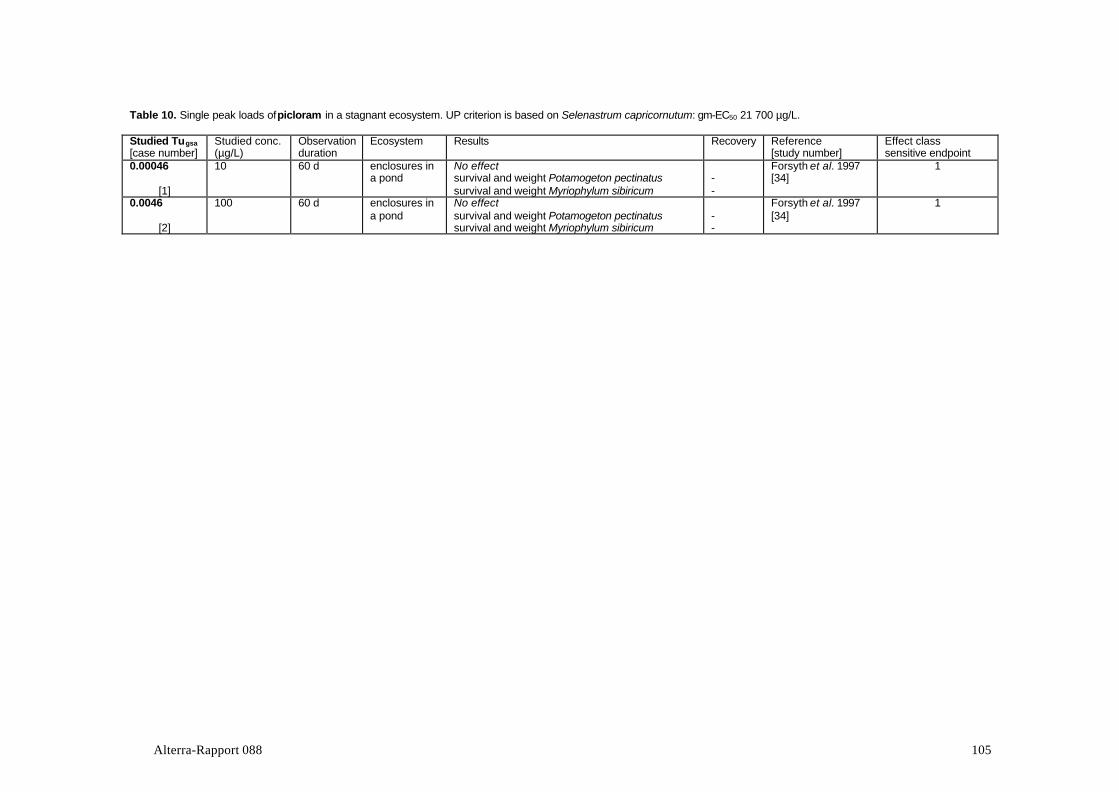
Alterra-Rapport 088 105
Table 10. Single peak loads of picloram in a stagnant ecosystem. UP criterion is based on Selenastrum capricornutum: gm-EC50 21 700 µg/L.
Studied Tugsa
[case number]Studied conc.(µg/L)
Observationduration
Ecosystem Results Recovery Reference[study number]
Effect classsensitive endpoint
0.00046
[1]
10 60 d enclosures ina pond
No effectsurvival and weight Potamogeton pectinatussurvival and weight Myriophylum sibiricum
--
Forsyth et al. 1997[34]
1
0.0046
[2]
100 60 d enclosures ina pond
No effectsurvival and weight Potamogeton pectinatussurvival and weight Myriophylum sibiricum
--
Forsyth et al. 1997[34]
1

Alterra-Rapport 088106
Appendix 11
Substance: clopyralidpyridine
Available laboratory toxicity data for standard green algae (Chlorophyta).
Species Exposure Endpoint EC50 NOEC Referenceduration (hour) (µg/L) (µg/L)
Selenastrum capricornutum 96 cell density 6 900 - Tomlin 1994cell volume 7 300 - Tomlin 1994
Available laboratory toxicity data for duckweed (Lemnaceae)._________________________________________________________________________________________________Species Exposure Endpoint EC50 NOEC Reference
duration (d) (µg/L) (µg/L)
Lemna gibba 4 ? 89 000 - Tomlin 1994
Summary of available laboratory toxicity data for algae, green algae and duckweed.
Species gm-EC50 gm-NOEC(µg/L) (µg/L)
Selenastrum capricornutum 7 097 -Lemna spp. 89 000 -
Summary criteria.
UB conservative UP liberal MPC freshwater(µg/L) (µg/L) (µg/L)
690 710 -
conservative UP criterion based on lowest EC50 for standard algaliberal UB criterion based on gm-EC50 for most sensitive standard algaMPC for freshwater from Crommentuijn et al. 1997

Alterra-Rapport 088 107
Table 11. Single peak loads of clopyralid in a stagnant ecosystem. UP criterion is based on Selenastrum capricornutum: gm-EC50 7 097 µg/L.
Studied Tugsa
[case number]Studied conc.(µg/L)
Observationduration
Ecosystem Results Recovery Reference[study number]
Effect classsensitive endpoint
0.0014
[1]
10 60 d enclosures ina pond
No effectsurvival and weight Potamogeton pectinatussurvival Myriophylum sibiricumIncreaseweight Myriophylum sibiricum
--
>60 d
Forsyth et al. 1997[34]
1
0.014
[2]
100 60 d enclosures ina pond
No effectsurvival and weight Potamogeton pectinatussurvival and weight Myriophylum sibiricum
--
Forsyth et al. 1997[34]
1

Alterra-Rapport 088108
Appendix 12
Substance: trichlopyrpyridiloxy acetic acid
Available laboratory toxicity data for standard green algae (Chlorophyta).
Species Exposure Endpoint EC50 NOEC Referenceduration (hour) (µg/L) (µg/L)
Selenastrum capricornutum 120 ? 45 000 - Tomlin 1994
Available laboratory toxicity data for duckweed (Lemnaceae): none .
Summary of available laboratory toxicity data for algae, green algae and duckweed.
Species gm-EC50 gm-NOEC(µg/L) (µg/L)
Selenastrum capricornutum 45 000 -
Summary criteria.
UP conservative UP liberal MPC freshwater(µg/L) (µg/L) (µg/L)
4 500 4 500 -
conservative UP criterion based on lowest EC50 for standard algaliberal UP criterion based on gm-EC50 for most sensitive standard algaMPC for freshwater from Crommentuijn et al. 1997

Alterra-Rapport 088 109
Table 12. Single peak loads of trichlopyr in an open running ecosystem. UP criterion is based on Selenastrum capricornutum: gm-EC50 45 000 µg/L. Exposure duration was one hour.
Studied Tugsa
[case number]Studied conc.(µg/L)
Observationduration
Ecosystem Results Recovery Reference[study number]
Effect classsensitive endpoint
0.0071
[1]
320 48 h open artificialstreams
No effectdrift of (some) benthic insect larvaesurvival of (some) benthic insect larvae
--
Kreutzweiser et al.1992 [27]
1
0.071
[2]
3 200 48 h open artificialstreams
Decreasesurvival of (some) benthic insect larvaeIncreasedrift of (some) benthic insect larvae
?
?
Kreutzweiser et al.1992 [27]
4
0.71
[3]
32 000 48 h open artificialstreams
Decreasesurvival of (some) benthic insect larvaeIncreasedrift of (some) benthic insect larvae
?
?
Kreutzweiser et al.1992 [27]
4
7.1
[4]
320 000 48 h open artificialstreams
Decreasesurvival of (some) benthic insect larvaeIncreasedrift of (some) benthic insect larvae
?
?
Kreutzweiser et al.1992 [27]
4

Alterra-Rapport 088110
Appendix 13
Substance: diquat (dibromide)bipyridilium
Available laboratory toxicity data for standard green algae (Chlorophyta).
Species Exposure Endpoint EC50 NOEC Referenceduration (hour) (µg/L) (µg/L)
Selenastrum capricornutum 96 growth 34.2 - St. Laurent et al. 199296 growth 80 44 Fairchild et al. 1997
Available laboratory toxicity data for duckweed (Lemnaceae)._________________________________________________________________________________________________Species Exposure Endpoint EC50 NOEC Reference
duration (d) (µg/L) (µg/L)
Lemna minor 4 density 18 <11 Fairchild et al. 1997
Summary of available laboratory toxicity data for algae, green algae and duckweed.
Species gm-EC50 gm-NOEC(µg/L) (µg/L)
Selenastrum capricornutum 52 44Lemna spp. 18 <11
Summary criteria.
UP conservative UP liberal MPC freshwater(µg/L) (µg/L) (µg/L)
3.4 5.2 -
conservative UP criterion based on lowest EC50 for standard algaliberal UP criterion based on gm-EC50 for most sensitive standard algaMPC for freshwater from Crommentuijn et al. 1997

Alterra-Rapport 088 111
Table 13a. Chronic studies and single peak loads of diquat in stagnant ecosystems. UP criterion is based on Selenastrum capricornutum: gm-EC50 52 µg/L.
Studied Tugsa
[case number]Studied conc.(µg/L)
Observationduration
Ecosystem Results Recovery Reference[study number]
Effect classsensitive endpoint
5.8
[1]
300 single+constant
4 m lab stagnantmicrocosms
DecreaseDO, pHnumbers of Cryptophytasurvival Elodea canadensisnumbers of Alona costatatotal density Cladoceranumbers of nauplii, copepodits and fully grownCopepodaIncreaseconductivitynumbers of Conjugophytanumbers of Simocephalus vetulustotal density algae
?>2½ m>4 m??>2½ m
2½ m>2½ m??
Draxl et al. 1991 [36] 5
16
[2]
850 single 3 wk labmicrocosmswith artificialsubstrate
No effectDObiomass protein periphytonDecreasenumber of species of Protozoa periphyton
--
>3 wk
Pratt et al. 1990 [45] 4
19
[3]
1000 single+constant
4 m lab stagnantmicrocosms
DecreaseDO, pHnumbers of Cryptophytasurvival Elodea canadensisnumbers of Alona costatatotal density Cladoceranumbers of nauplii, copepodits and fully grownCopepodaIncreaseconductivitynumbers of Conjugophytanumbers of Simocephalus vetulustotal density algae
?>4 m>4 m??>4 m
4 m4 m??
Draxl et al. 1991 [36] 5
38
[4]
2000 single 3 wk labmicrocosmswith artificialsubstrate
No effectbiomass protein periphytonDecreaseDOnumber of species of Protozoa periphyton
-
>3 wk>3 wk
Pratt et al. 1990 [45] 4
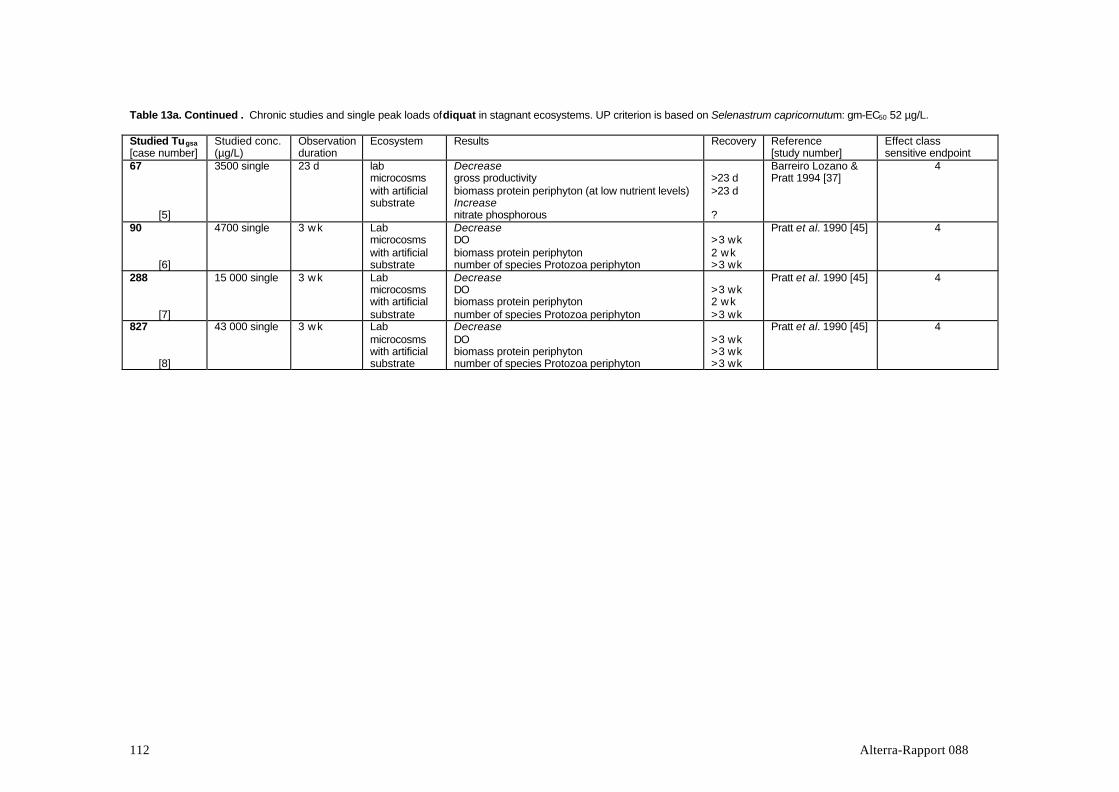
Alterra-Rapport 088112
Table 13a. Continued . Chronic studies and single peak loads of diquat in stagnant ecosystems. UP criterion is based on Selenastrum capricornutum: gm-EC50 52 µg/L.
Studied Tugsa
[case number]Studied conc.(µg/L)
Observationduration
Ecosystem Results Recovery Reference[study number]
Effect classsensitive endpoint
67
[5]
3500 single 23 d labmicrocosmswith artificialsubstrate
Decreasegross productivitybiomass protein periphyton (at low nutrient levels)Increasenitrate phosphorous
>23 d>23 d
?
Barreiro Lozano &Pratt 1994 [37]
4
90
[6]
4700 single 3 wk Labmicrocosmswith artificialsubstrate
DecreaseDObiomass protein periphytonnumber of species Protozoa periphyton
>3 wk2 wk>3 wk
Pratt et al. 1990 [45] 4
288
[7]
15 000 single 3 wk Labmicrocosmswith artificialsubstrate
DecreaseDObiomass protein periphytonnumber of species Protozoa periphyton
>3 wk2 wk>3 wk
Pratt et al. 1990 [45] 4
827
[8]
43 000 single 3 wk Labmicrocosmswith artificialsubstrate
DecreaseDObiomass protein periphytonnumber of species Protozoa periphyton
>3 wk>3 wk>3 wk
Pratt et al. 1990 [45] 4

Alterra-Rapport 088 113
Table 13b. Single peak loads of diquat in an open runningt ecosystem. UP criterion is based on Selenastrum capricornutum: gm-EC50 52 µg/L. Exposure duration 24 hours.
Studied Tugsa
[case number]Studied conc.(µg/L)
Observationduration
Ecosystem Results Recovery Reference(study number)
Effect classsensitive endpoint
0.10
[1]
5 21 d runningsystem withaquatic plants
No effectsurvival Elodea canadensisIncreaseperiphyton on Elodea
-
>14 d
Paterson & Wright1987 [38]
1
0.19
[2]
10 21 d runningsystem withaquatic plants
No effectsurvival Elodea canadensisIncreaseperiphyton on Elodea
-
>21 d
Paterson & Wright1987 [38]
1
0.96
[3]
50 21 d runningsystem withaquatic plants
No effectsurvival Elodea canadensisIncreaseperiphyton on Elodea
>21 d
>14 d
Paterson & Wright1987 [38]
4

Alterra-Rapport 088114
Appendix 14
Substance: paraquat (dichloride)bipyridilium
Available laboratory toxicity data for standard green algae (Chlorophyta).
Species Exposure Endpoint EC50 NOEC Referenceduration (hour) (µg/L) (µg/L)
Selenastrum capricornutum 96 growth 559 114 Fairchild et al. 1997
Chlamydomonas eugametos 48 growth 116 - Hess 1980
Available laboratory toxicity data for duckweed (Lemnaceae)._________________________________________________________________________________________________Species Exposure Endpoint EC50 NOEC Referenc e
duration (d) (µg/L) (µg/L)
Lemna minor 4 density 51 14 Fairchild et al. 1997
Lemna gibba 20 biomass - 2.6 Wejnar et al. 1992
Summary of available laboratory toxicity data for algae, green algae and duckweed.
Species gm-EC50 gm-NOEC(µg/L) (µg/L)
Selenastrum capricornutum 559 114Chlamydomonas eugametos 116 -Lemna spp. 51 6
Summary criteria.
UP conservative UP liberal MPC freshwater(µg/L) (µg/L) (µg/L)
56 56 -
conservative UP criterion based on lowest EC50 for standard algaliberal UP criterion based on gm-EC50 for most sensitive standard algaMPC for freshwater from Crommentuijn et al. 1997

Alterra-Rapport 088 115
Table 14. Single peak loads of paraquat in a closed running ecosystem. UP criterion is based on Selenastrum capricornutum: gm-EC50 559 µg/L.
Studied Tugsa
[case number]Studied conc.(µg/L)
Observationduration
Ecosystem Results Recovery Reference[study number]
Effect classsensitive endpoint
0.018
[1]
10 constant 3 wk recirculatingartificialstreams
No effectgross primary productionbiovolume periphyton on artificial substrate
--
Kosinski 1984Kosinski & Merkle1984 [8]
1
0.18
[2]
100 single 3 wk recirculatingartificialstreams
No effectgross primary productionbiovolume periphyton on artificial substrate
--
Kosinski 1984Kosinski & Merkle1984 [8]
1
1.8
[3]
1000 single 3 wk recirculatingartificialstreams
No effectgross primary productionbiovolume periphyton on artificial substrate
--
Kosinski 1984Kosinski & Merkle1984 [8]
1
18
[4]
10 000 single 3 wk recirculatingartificialstreams
No effectbiovolume periphyton on artificial substrateDecreasegross primary production
-
7 d
Kosinski 1984Kosinski & Merkle1984 [8]
3

Alterra-Rapport 088116
Appendix 15
Substance: fluridon4-pyridon
Available laboratory toxicity data for algae. ______ ___
Species Exposure Endpoint EC50 NOEC Referenceduration (hour) (µg/L) (µg/L)
Chlamidomonas eugametos 48 growth 14821) 3291) Hess 1980(Chlorophyta)
Oscillatoria agardhii 96 growth 742) 9.12) Millie et al. 1990(Cyanophyta)
1) deduced from raw data2) deduced by means of DEBtox
Available laboratory toxicity data for duckweed (Lemnaceae): none .
Summary of available laboratory toxicity data for algae and duckweed.
Species gm-EC50 gm-NOEC(µg/L) (µg/L)
Chlamidomonas eugametos 1482 -Oscillatoria agardhii 74 9.1
Summary criteria.
UP conservative UP liberal MPC freshwater(µg/L) (µg/L) (µg/L)
7.4 7.4 -
conservative UP criterion based on lowest EC50 for algae (due to the absence of toxicity data for standard algae)liberal UP criterion based on gm-EC50 for most sensitive algae (due to the absence of toxicity data for standard algae)MPC for freshwater from Crommentuijn et al. 1997

Alterra-Rapport 088 117
Table 15. Single peak loads of fluridon in a stagnant ecosystem. UP criterion is based on Oscillatoria agardhii: gm-EC50 74 µg/L.
Studied Tugsa
[case number]Studied conc.(µg/L)
Observationduration
Ecosystem Results Recovery Reference[study number]
Effect classsensitive endpoint
1.7
[1]
125 2 m enclosures ina fish pond
No effectDO, turbidity, CODammonia, nitrate, nitrite, phosphorous,species composition phytoplanktonDecreasedensity phytoplanktonChl-a phytoplankton
--
-
5 wk5 wk
Struve et al. 1991[25]
3

Alterra-Rapport 088118
Appendix 16
Substance: metsulphuron-methylsulphonylurea
Available laboratory toxicity data for standard green algae (Chlorophyta).
Species Exposure Endpoint EC50 NOEC Referenceduration (hour) (µg/L) (µg/L)
Selenastrum capricornutum 96 growth 190 <19 Fairchild et al. 1997
Available laboratory toxicity data for duckweed (Lemnaceae).
Species Exposure Endpoint EC50 NOEC Referenceduration (d) (µg/L) (µg/L)
Lemna minor 4 density 0.4 <0.2 Fairchild et al. 1997
Summary of available laboratory toxicity data for algae, green algae and duckweed.
Species gm-EC50 gm-NOEC(µg/L) (µg/L)
Selenastrum capricornutum 190 <19Lemna spp. 0.4 <0.2
Summary criteria.
UP conservative UP liberal MPC freshwater(µg/L) (µg/L) (µg/L)
19 19 -
conservative UP criterion based on lowest EC50 for standard algaliberal UP criterion based on gg-EC50 for most sensitive standard algaMPC for freshwater from Crommentuijn et al. 1997

Alterra-Rapport 088 119
Table 16. Single peak loads of metsulfuron-methyl in a stagnant ecosystem. UP criterion is based on Selenastrum capricornutum: gm-EC50 190 µg/L.
Studied Tugsa
[case number]Studied conc.(µg/L)
Observationduration
Ecosystem Results Recovery Reference[study number]
Effect classsensitive endpoint
0.053 10 77 d enclosures ina lake
No effectbiomass phytoplanktonnumbers of zooplanktonDecreaseDO (slight)
--
>77 d
Thompson et al.1993aThompson et al.1993b [28]
2
0.53 100 77 d enclosures ina lake
No effectbiomass phytoplanktonnumbers of zooplanktonDecreaseDO (slight)
--
>77 d
Thompson et al.1993aThompson et al.1993b [28]
2
2.6 500 77 d enclosures ina lake
No effectbiomass phytoplanktonnumbers of zooplanktonDecreaseDO (slight)
--
>77 d
Thompson et al.1993aThompson et al.1993b [28]
2
5.3 1000 77 d enclosures ina lake
No effectbiomass phytoplanktonnumbers of zooplanktonDecreaseDO (slight)
--
>35 d
Thompson et al.1993aThompson et al.1993b [28]
2
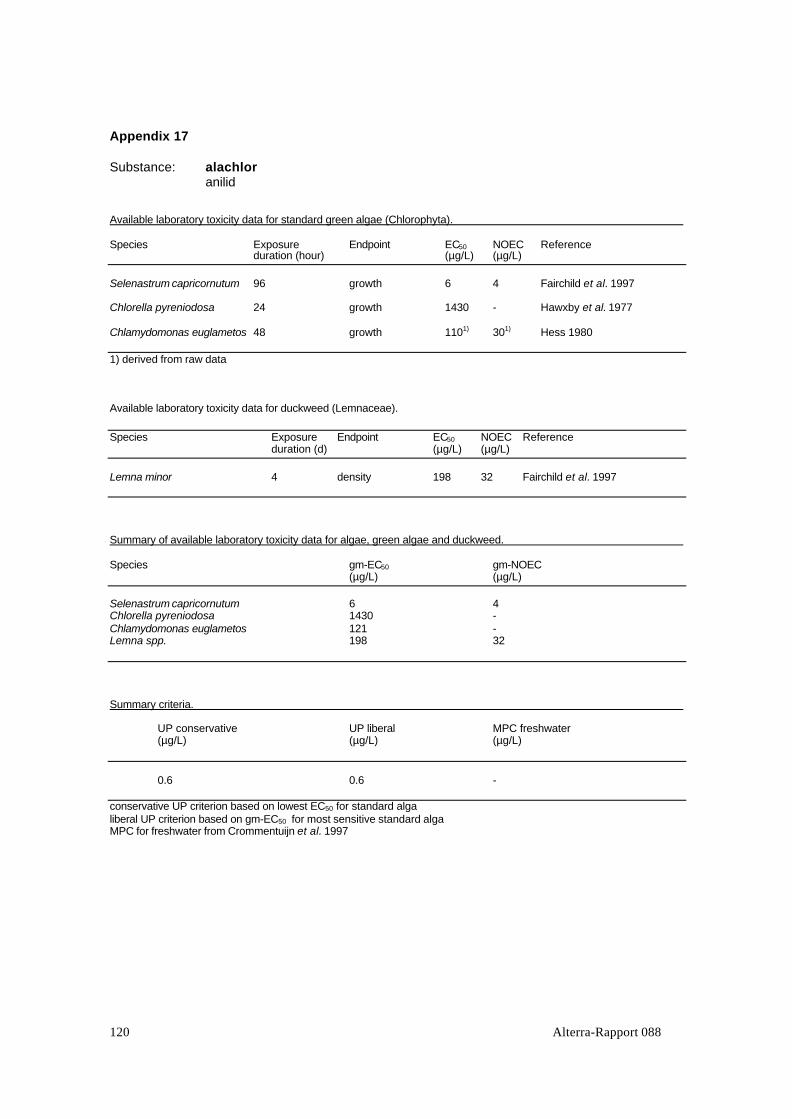
Alterra-Rapport 088120
Appendix 17
Substance: alachloranilid
Available laboratory toxicity data for standard green algae (Chlorophyta).
Species Exposure Endpoint EC50 NOEC Referenceduration (hour) (µg/L) (µg/L)
Selenastrum capricornutum 96 growth 6 4 Fairchild et al. 1997
Chlorella pyreniodosa 24 growth 1430 - Hawxby et al. 1977
Chlamydomonas euglametos 48 growth 1101) 301) Hess 1980
1) derived from raw data
Available laboratory toxicity data for duckweed (Lemnaceae).
Species Exposure Endpoint EC50 NOEC Referenceduration (d) (µg/L) (µg/L)
Lemna minor 4 density 198 32 Fairchild et al. 1997
Summary of available laboratory toxicity data for algae, green algae and duckweed.
Species gm-EC50 gm-NOEC(µg/L) (µg/L)
Selenastrum capricornutum 6 4Chlorella pyreniodosa 1430 -Chlamydomonas euglametos 121 -Lemna spp. 198 32
Summary criteria.
UP conservative UP liberal MPC freshwater(µg/L) (µg/L) (µg/L)
0.6 0.6 -
conservative UP criterion based on lowest EC50 for standard algaliberal UP criterion based on gm-EC50 for most sensitive standard algaMPC for freshwater from Crommentuijn et al. 1997

Alterra-Rapport 088 121
Table 17. Single peak loads of alachlor in a closed running ecosystem. UP criterion is based on Selenastrum capricornutum: gm-EC50 6 µg/L.
Studied Tugsa
[case number]Studied conc.(µg/L)
Observationduration
Ecosystem Results Recovery Reference[study number]
Effect classsensitive endpoint
0.17
[1]
1 21 d recirculatingartificialstreams
No effectDOnitrogen, phosphorousChl-a periphyton on artificial substratedensity periphyton on artificial substrateChangespecies composition periphyton on artificial substrate
----
>21 d
Spawn et al. 1997[39]
4
1.7
[2]
10 21 d recirculatingartificialstreams
No effectDOnitrogen, phosphorousDecreaseChl-a periphyton on artificial substratedensity periphyton on artificial substrateChangespecies composition periphyton on artificial substrate
--
>21 d14 d
>21 d
Spawn et al. 1997[39]
4
5.0
[3]
30 21 d recirculatingartificialstreams
No effectDOnitrogen, phosphorousDecreaseChl-a periphyton on artificial substratedensity periphyton on artificial substrateChangespecies composition periphyton on artificial substrate
--
>21 d14 d
>21 d
Spawn et al. 1997[39]
4
17
[4]
100 21 d recirculatingartificialstreams
No effectDOnitrogen, phosphorousDecreaseChl-a periphyton on artificial substratedensity periphyton on artificial substrateChangespecies composition periphyton on artificial substrate
--
>21 d>21 d
>21 d
Spawn et al. 1997[39]
4
167
[5]
1000 21 d recirculatingartificialstreams
No effectDOnitrogen, phosphorousDecreaseChl-a periphyton on artificial substratedensity periphyton on artificial substrateChangespecies composition periphyton on artificial substrate
--
>21 d>21 d
>21 d
Spawn et al. 1997[39]
4

Alterra-Rapport 088122
Appendix 18
Substance: triallatethiocarbamate
Available laboratory toxicity data for test organisms.
Species Exposure Endpoint EC50 NOEC Referenceduration (hour) (µg/L) (µg/L)
Selenastrum capricornutum 96 growth 47 12.5 Fairchild et al. 1997
Daphnia magna ? ? 57 - Johnson 1986
Available laboratory toxicity data for duckweed (Lemnaceae).
Species Exposure Endpoint EC50 NOEC Referenceduration (d) (µg/L) (µg/L)
Lemna minor 4 density >10 000 - Fairchild et al. 1997
Summary of available laboratory toxicity data for algae, green algae and duckweed.
Species gm-EC50 gm-NOEC(µg/L) (µg/L)
Selenastrum capricornutum 47 12.5Lemna spp. >10 000 -
Summary criteria.
UP conservative UP liberal MPC freshwater(µg/L) (µg/L) (µg/L)
0.57 0.57 1.9
conservative UP criterion based on lowest EC50 for Daphnialiberal UP criterion based on gm-EC50 for DaphniaMPC for freshwater from Crommentuijn et al. 1997

Alterra-Rapport 088 123
Table 18. Single peak loads of triallate in a stagnant ecosystem. UP criterion is based on Daphnia magna: gm-EC50 57 µg/L. For comparison with other studies the EC50 ofSelenastrum capricurnutum was used: gm-EC50 47 µg/L
Studied Tugsa
[case number]Studied conc.(µg/L)
Observationduration
Ecosystem Results Recovery Reference[study number]
Effect classsensitive endpoint
0.21
[1]
10 28 d lab stagnantmicrocosms
No effectpH, alkalinity, conductivitygross primary productionmicrobial activity in sedimentbiomass Selenastrum capricornutumbiomass macrophytesDecreasesurvival Daphnia magna
-----
>3 d
Johnson 1986 [7] 4
2.1
[2]
100 28 d lab stagnantmicrocosms
No effectpH, alkalinity, conductivitymicrobial activity in sedimentbiomass macrophytesDecreasebiomass Selenastrum capricornutumsurvival Daphnia magnaIncreasegross primary production
---
?>3 d
21 d
Johnson 1986 [7] 4
21
[3]
1000 28 d lab stagnantmicrocosms
No effectpH, alkalinity, conductivitymicrobial activity in sedimentbiomass macrophytesDecreasebiomass Selenastrum capricornutumsurvival Daphnia magnaIncreasegross primary production
---
?>3 d
28 d
Johnson 1986 [7] 4

Alterra-Rapport 088124
Appendix 19
Substance: trifluralindinitroanilin
Available laboratory toxicity data for standard green algae (Chlorophyta).
Species Exposure Endpoint EC50 NOEC Referenceduration (hour) (µg/L) (µg/L)
Selenastrum capricornutum 96 growth 673 150 Fairchild et al. 1997
Chlamydomonas euglametos 48 growth 1511) 361) Hess 1980
Available laboratory toxicity data for duckweed (Lemnaceae).
Species Exposure Endpoint EC50 NOEC Referenceduration (d) (µg/L) (µg/L)
Lemna minor 4 density 170 75 Fairchild et al. 1997
1) deduced from raw data
Summary of available laboratory toxicity data for algae, green algae and duckweed.
Species gm-EC50 gm-NOEC(µg/L) (µg/L)
Selenastrum capricornutum 673 150Chlamydomonas euglametos 151 -Lemna minor 170 75
Summary criteria.
UP conservative UP liberal MPC freshwater(µg/L) (µg/L) (µg/L)
67 67 0.037
conservative UP criterion based on lowest EC50 for standard algaliberal UP criterion based on gm-EC50 for most sensitive standard algaMPC for freshwater from Crommentuijn et al. 1997

Alterra-Rapport 088 125
Table 19. Single peak loads of trifluralin in a stagnant ecosystem. UP criterion is based on Selenastrum capricurnutum: gm-EC50 673 µg/L.
Studied Tugsa
[case number]Studied conc.(µg/L)
Observationduration
Ecosystem Results Recovery Reference[study number]
Effect classsensitive endpoint
0.015
[1]
10 28 d lab stagnantmicrocosms
No effectpH, alkalinity, conductivitygross primary productionmicrobial activity in sedimentbiomass Selenastrum capricornutumbiomass macrophytessurvival Daphnia magna
------
Johnson 1986 [7] 1
0.15
[2]
100 28 d lab stagnantmicrocosms
No effectpH, alkalinity, conductivitygross primary productionmicrobial activity in sedimentbiomass Selenastrum capricornutumbiomass macrophytessurvival Daphnia magna
------
Johnson 1986 [7] 1
1.5
[3]
1000 28 d lab stagnantmicrocosms
No effectpH, alkalinity, conductivitymicrobial activity in sedimentbiomass Selenastrum capricornutumbiomass macrophytessurvival Daphnia magnaIncreasegross primary production
-----
28 d
Johnson 1986 [7] 1

Alterra-Rapport 088126
Appendix 20
Substance: MSMA (monosodium methylarsonate)organoarsenic
Available laboratory toxicity data for standard green algae (Chlorophyta).
Species Exposure Endpoint EC50 NOEC Referenceduration (hour) (µg/L) (µg/L)
Chlorella pyreniodosa 96 density etc. - >3.106 Blythe et al. 197972? growth - >810 Davis et al. 1976
Available laboratory toxicity data for duckweed (Lemnaceae): none .
Summary of available laboratory toxicity data for algae, green algae and duckweed.
Species gm-EC50 gm-NOEC(µg/L) (µg/L)
Chlorella pyreniodosa - -
Summary criteria.
UP conservative UP liberal MPC freshwater(µg/L) (µg/L) (µg/L)
- - -
conservative UP criterion based on lowest EC50 for algaliberal UP criterion based on gm-EC50 for most sensitive algaMPC for freshwater from Crommentuijn et al. 1997

Alterra-Rapport 088 127
Table 20. Single peak loads and constant exposure to MSMA in a closed running ecosystem. No data on Selenastrum capricurnutum available.
Studied Tugsa
[case number]Studied conc.(µg/L)
Observationduration
Ecosystem Results Recovery Reference[study number]
Effect classsensitive endpoint
-
[1]
10 constant 3 wk recirculatingartificialstreams
No effectgross primary productionDecreasebiovolume periphyton on artificial substrate
-
>21 d
Kosinski 1984Kosinski & Merkle1984 [8]
4
-
[2]
100 single 3 wk recirculatingartificialstreams
No effectgross primary productionbiovolume periphyton on artificial substrate
--
Kosinski 1984Kosinski & Merkle1984 [8]
1
-
[3]
1000 single 3 wk recirculatingartificialstreams
No effectgross primary productionbiovolume periphyton on artificial substrate
--
Kosinski 1984Kosinski & Merkle1984 [8]
1
-
[4]
10 000 single 3 wk recirculatingartificialstreams
No effectgross primary productionDecreasebiovolume periphyton on artificial substrate
-
>21 d
Kosinski 1984Kosinski & Merkle1984 [8]
4

Alterra-Rapport 088128