ECOLOGICAL OPPORTUNITY AND THE RATE OF ... - The Mahler … · OF MORPHOLOGICAL EVOLUTION IN THE...
15
ORIGINAL ARTICLE doi:10.1111/j.1558-5646.2010.01026.x ECOLOGICAL OPPORTUNITY AND THE RATE OF MORPHOLOGICAL EVOLUTION IN THE DIVERSIFICATION OF GREATER ANTILLEAN ANOLES D. Luke Mahler, 1,2 Liam J. Revell, 3 Richard E. Glor, 4 and Jonathan B. Losos 1 1 Department of Organismic and Evolutionary Biology, and Museum of Comparative Zoology, Harvard University, Cambridge, Massachusetts 02138 2 E-mail: [email protected] 3 National Evolutionary Synthesis Center, Durham, North Carolina 27705 4 Department of Biology, University of Rochester, Rochester, New York 14627 Received September 12, 2009 Accepted April 7, 2010 The pace of phenotypic diversification during adaptive radiation should decrease as ecological opportunity declines. We test this prediction using phylogenetic comparative analyses of a wide range of morphological traits in Greater Antillean Anolis lizards. We find that the rate of diversification along two important axes of Anolis radiation—body size and limb dimensions—decreased as opportunity declined, with opportunity quantified either as time elapsed in the radiation or as the diversity of competing anole lineages inferred to have been present on an island at different times in the past. Most previous studies of the ecological opportunity hypothesis have focused on the rate of species diversification; our results provide a complementary perspective, indicating that the rate of phenotypic diversification declines with decreasing opportunity in an adaptive radiation. KEY WORDS: Adaptive radiation, Anolis, density-dependent, diversification, diversity-dependent, macroevolution, niche-filling, ecological saturation. According to the ecological theory of adaptive radiation, ecologi- cal opportunity is a primary factor regulating the tempo of diversi- fication (Lack 1947; Rensch 1959; Carlquist 1974; Schluter 2000; Gillespie et al. 2001; Gavrilets and Vose 2005; Ito and Dieckmann 2007; Harmon et al. 2008; Gavrilets and Losos 2009). As lineages proliferate and the diversity of competing species increases, eco- logical opportunity is expected to decline and the pace of diversi- fication is expected to slow (Sepkoski 1978; Walker and Valentine 1984; Schluter 2000; Freckleton and Harvey 2006; Gavrilets and Losos 2009). Most often, empirical studies of the tempo of evolu- tion during adaptive radiation have focused on patterns of lineage diversification—measuring rates of speciation and extinction over time in a diversifying lineage. These studies test a specific predic- tion of the ecological theory of adaptive radiation: that greater ecological opportunity will increase the likelihood of lineage divergence. Traditionally, such investigations have been conducted by paleontologists charting patterns of radiation in fossil lineages over geological timescales (Simpson 1953; Stanley 1979; Raup 1985; Peters 2005; Alroy et al. 2008; Alroy 2009; Benton 2009). For many taxa, lineage diversity increased rapidly in the early Phanerozoic, subsequently slowing in a manner con- sistent with ecological saturation (Sepkoski 1978, 1982, 2002; Gould 1989). In addition, rates of cladogenesis are often ob- served to have increased following mass extinctions, suggesting the occurrence of ‘diversification recoveries’ driven by ecological opportunity (Sepkoski 1982, 2002; Erwin et al. 1987; Erwin 2001). 2731 C 2010 The Author(s). Journal compilation C 2010 The Society for the Study of Evolution. Evolution 64-9: 2731–2745
Transcript of ECOLOGICAL OPPORTUNITY AND THE RATE OF ... - The Mahler … · OF MORPHOLOGICAL EVOLUTION IN THE...

ORIGINAL ARTICLE
doi:10.1111/j.1558-5646.2010.01026.x
ECOLOGICAL OPPORTUNITY AND THE RATEOF MORPHOLOGICAL EVOLUTION IN THEDIVERSIFICATION OF GREATER ANTILLEANANOLESD. Luke Mahler,1,2 Liam J. Revell,3 Richard E. Glor,4 and Jonathan B. Losos1
1Department of Organismic and Evolutionary Biology, and Museum of Comparative Zoology, Harvard University,
Cambridge, Massachusetts 021382E-mail: [email protected]
3National Evolutionary Synthesis Center, Durham, North Carolina 277054Department of Biology, University of Rochester, Rochester, New York 14627
Received September 12, 2009
Accepted April 7, 2010
The pace of phenotypic diversification during adaptive radiation should decrease as ecological opportunity declines. We test this
prediction using phylogenetic comparative analyses of a wide range of morphological traits in Greater Antillean Anolis lizards.
We find that the rate of diversification along two important axes of Anolis radiation—body size and limb dimensions—decreased
as opportunity declined, with opportunity quantified either as time elapsed in the radiation or as the diversity of competing
anole lineages inferred to have been present on an island at different times in the past. Most previous studies of the ecological
opportunity hypothesis have focused on the rate of species diversification; our results provide a complementary perspective,
indicating that the rate of phenotypic diversification declines with decreasing opportunity in an adaptive radiation.
KEY WORDS: Adaptive radiation, Anolis, density-dependent, diversification, diversity-dependent, macroevolution, niche-filling,
ecological saturation.
According to the ecological theory of adaptive radiation, ecologi-
cal opportunity is a primary factor regulating the tempo of diversi-
fication (Lack 1947; Rensch 1959; Carlquist 1974; Schluter 2000;
Gillespie et al. 2001; Gavrilets and Vose 2005; Ito and Dieckmann
2007; Harmon et al. 2008; Gavrilets and Losos 2009). As lineages
proliferate and the diversity of competing species increases, eco-
logical opportunity is expected to decline and the pace of diversi-
fication is expected to slow (Sepkoski 1978; Walker and Valentine
1984; Schluter 2000; Freckleton and Harvey 2006; Gavrilets and
Losos 2009). Most often, empirical studies of the tempo of evolu-
tion during adaptive radiation have focused on patterns of lineage
diversification—measuring rates of speciation and extinction over
time in a diversifying lineage. These studies test a specific predic-
tion of the ecological theory of adaptive radiation: that greater
ecological opportunity will increase the likelihood of lineage
divergence.
Traditionally, such investigations have been conducted by
paleontologists charting patterns of radiation in fossil lineages
over geological timescales (Simpson 1953; Stanley 1979; Raup
1985; Peters 2005; Alroy et al. 2008; Alroy 2009; Benton
2009). For many taxa, lineage diversity increased rapidly in
the early Phanerozoic, subsequently slowing in a manner con-
sistent with ecological saturation (Sepkoski 1978, 1982, 2002;
Gould 1989). In addition, rates of cladogenesis are often ob-
served to have increased following mass extinctions, suggesting
the occurrence of ‘diversification recoveries’ driven by ecological
opportunity (Sepkoski 1982, 2002; Erwin et al. 1987; Erwin
2001).
2 7 3 1C© 2010 The Author(s). Journal compilation C© 2010 The Society for the Study of Evolution.Evolution 64-9: 2731–2745

D. LUKE MAHLER ET AL.
Recently, neontologists have begun to test for the signature
of ecological opportunity in the form of diversity-dependent1 pat-
terns of diversification using time-calibrated phylogenies of extant
taxa (Nee et al. 1992; Harvey et al. 1994; Mooers and Heard 1997;
Phillimore and Price 2009). Several studies have provided sup-
port for the ecological opportunity hypothesis by documenting a
temporal slowdown in species diversification rate (e.g., Lovette
and Bermingham 1999; Weir 2006; Phillimore and Price 2008;
McPeek 2008), and at least one study has documented a decrease
in the rate of cladogenesis associated with an increase in the in-
ferred number of lineages in a clade (Rabosky and Lovette 2008).
These studies, both paleontological and molecular phyloge-
netic, assume that observed decreases in the rate of species diver-
sification are primarily due to increasing saturation of niche space
and a decline of ecological opportunity as a clade acquires more
species during the course of its radiation. However, rates of species
diversification may vary for reasons unrelated to ecological op-
portunity, a possibility that must be considered when interpreting
lineage diversification patterns. For example, in so-called non-
adaptive radiations, species richness does not strongly correlate
with ecological diversity, and some such radiations exhibit appar-
ent diversity-dependent diversification patterns even though they
are largely composed of ecologically similar “allospecies” (Kozak
et al. 2006; Rundell and Price 2009), which suggests that some
process unrelated to ecological interactions within communities
is regulating species proliferation. One potential solution to this
problem is to test for the signature of ecological opportunity in
patterns of morphological evolution, which may be more directly
affected by niche-filling and the erosion of ecological opportunity
than species diversification rate (Ricklefs and Travis 1980; Roy
and Foote 1997; Yoder et al. 2010).
Indeed, studies of paleontological data have found evidence
for a relationship between ecological opportunity and the rate of
morphological evolution. As with lineage diversification, in many
taxa, the rate of increase in morphological disparity was great-
est early during the Cambrian explosion and declined through
time; disparity also increased dramatically following mass ex-
tinction events in many clades (Ward 1980; Saunders and Swan
1984; Gould 1989; Foote 1992, 1994, 1996, 1997; Wagner 1995;
Friedman 2010; reviewed in Erwin 2007).
1We prefer the term “diversity-dependent” to “density-
dependent” when describing models in which diversification is
influenced by the number of species present. Although the lat-
ter term has been used widely to describe such models (but see
McPeek 2008; Rabosky 2009), it may be unintentionally confused
with “density-dependent” phenomena in population ecology (in
which the density of individuals, not species, is of interest). “Diver-
sity” more accurately describes the density of species, and indeed,
early ecological diversification models were described by their au-
thors as “diversity-dependent” (dating at least to Sepkoski 1978).
Such paleontological investigations, however, have been nec-
essarily restricted to organisms with exceptional fossil records,
and rely on methods that are inapplicable to a wealth of recent
radiations—including many extant groups for which we have a
rich understanding of ecology and microevolution. To date, few
studies have employed phylogenetic methods to test the effect of
ecological opportunity on phenotypic diversification using neon-
tological data (e.g., Harmon et al. 2003; Burbrink and Pyron
2010). In this study, we investigate whether the rate of ecological
diversification slows during the course of adaptive radiation by
estimating rates of morphological evolution in five ecological trait
axes in the well-studied adaptive radiation of Greater Antillean
anoles.
A critical aspect of any test involving historical ecological
opportunity is the manner in which such opportunity is estimated
over the course of an evolutionary radiation. We take two ap-
proaches. First, we examine whether the rate of phenotypic evo-
lution slows with time (we refer to this as the time model). This
model assumes that all clade members co-occur in the same area,
and that the greater species diversity that accrues through time
translates into reduced ecological opportunity, with such oppor-
tunity declining linearly with time.
However, these assumptions may not always hold true, par-
ticularly for clades that have diversified at an uneven pace, or
in multiple geographically disjunct areas. For these reasons, we
introduce a second method to test for the role of ecological oppor-
tunity, which we call the lineage diversity model. This model more
explicitly measures ecological opportunity by estimating the num-
ber of competing lineages from within a radiation that are present
in the same geographic area (see Nee et al. 1992 and Rabosky
and Lovette 2008 for application of similar models to patterns of
lineage diversification rather than phenotypic evolution).
In the radiation of Greater Antillean Anolis, the lineage di-
versity and time models predict different patterns of evolutionary
diversification because anoles have colonized and radiated on four
large islands for the most part independently, with in situ diver-
sification occurring at different times on different islands (Losos
et al. 2006; Losos 2009). For example, when the first lineage to
reach Jamaica arrived and began to radiate, diversification was
already well underway in Cuba and Hispaniola. Therefore, time
since the beginning of the radiation does not capture the differ-
ence in the timing of decline of ecological opportunity among the
islands of the Greater Antilles.
In the present study, we use new quantitative, likelihood-
based phylogenetic methods to test the ecological opportunity
hypothesis for the pace of evolutionary diversification in Greater
Antillean anoles. We ask if the rate of phenotypic diversification
for ecologically relevant traits was constant over time, or whether
it varied as a function of the diversity of competing lineages or
time since the origin of the radiation.
2 7 3 2 EVOLUTION SEPTEMBER 2010
OPPORTUNITY AND RATE IN ANOLIS LIZARDS
ANOLES AS A MODEL SYSTEM FOR THE STUDY
OF DIVERSIFICATION
Anolis lizards found on Greater Antillean islands—Cuba, Hispan-
iola, Jamaica, and Puerto Rico—are a model system for investi-
gating adaptive radiation (Williams 1983; Schluter 2000; Losos
2009). Anoles are primarily arboreal lizards distinguished by their
adhesive toepads, extensible throat flap (the dewlap), and remark-
able range of diversity in both size and shape. Much of the diver-
sity of anoles results from adaptation to different microhabitat and
dietary resources. Some of the strongest evidence for adaptation
and specialization comes from the observation that similar suites
of microhabitat specialists, termed ecomorphs, have evolved inde-
pendently on each island of the Greater Antilles (Williams 1983;
Losos et al. 1998), suggesting that deterministic ecological pro-
cesses have been largely responsible for moderating the outcome
of diversification in anoles on these islands. Each ecomorph class
is morphologically and ecologically distinct, and the species in
them are similar in a wide variety of morphological characteris-
tics, including relative limb lengths and toepad shape, as well as
preferred habitat and behavior (reviewed in Losos 2009).
Greater Antillean anoles are the result of a single overwater
colonization event from a mainland source population (Nicholson
et al. 2005). Although portions of the extant Greater Antillean is-
lands have been interconnected at various points in their histories,
most anole diversification appears to have occurred subsequent
to island fragmentation (Hedges 2006; Losos 2009). In general
terms, diversification began first on the islands of Hispaniola and
Cuba, followed fairly rapidly by the occupation of Puerto Rico by
two lineages which did not diversify (Fig. 1). Later, diversification
proceeded greatly on Puerto Rico after the arrival of a third lin-
eage and on Jamaica, which probably was underwater until some
point during the Oligocene (Buskirk 1985). Thus, the pattern of
diversification was heterogeneous, as lineage diversity was low at
different times on different islands.
MethodsSAMPLING
We conducted near-comprehensive sampling of Greater Antillean
anole species to create phylogenetic and morphometric datasets.
We first sampled molecular sequence data from 187 anole species
occurring throughout the New World tropics to generate a time-
calibrated phylogenetic estimate for Anolis. For the comparative
analyses, we pruned the 87 (primarily non-Greater Antillean)
species not included in our morphological dataset to obtain a
tree with 100 species. Nineteen Greater Antillean species were
not included in our analysis either because molecular sequence
data were unavailable (17 species) or because specimens of suf-
ficient quality were not available for measurement (2 species).
Because the majority of these species are closely related to and
morphologically similar to species included in our analysis, their
exclusion is unlikely to artifactually produce an apparent pat-
tern of decreased rate of diversification through time; rather,
if anything, it may have made such a pattern more difficult to
detect.
PHYLOGENY
The phylogenies used in this study were generated from a contin-
uous ∼1500 bp fragment of mitochondrial DNA data extending
across six complete genes (ND2, tRNATrp, tRNAAla, tRNAAsn,
tRNACys, and tRNATyr) and the origin of light-strand replication,
before ending shortly after the start of COI (Rabosky and Glor, un-
publ. ms.). Time-calibrated trees were inferred using partitioned
Bayesian analyses and the uncorrelated relaxed clock algorithms
implemented by the program BEAST (Drummond and Rambaut
2007) with a root age arbitrarily set to a uniform distribution be-
tween 95 and 105. For these analyses, we used the majority rule
consensus of two independent 40 million generation partitioned
analyses implemented in MrBayes with one cold and three in-
crementally heated chains as a starting tree. This consensus tree
was highly concordant with trees generated from Bayesian anal-
yses of a more sparsely taxon-sampled dataset comprised of five
nuclear loci. To ensure that our results were robust to phyloge-
netic uncertainty, we conducted comparative analyses on a set of
898 trees from the stationary distribution of the Bayesian phy-
logenetic analysis on mtDNA data generated using the program
BEAST.
MORPHOLOGICAL MEASUREMENTS
We measured 22 morphological traits from preserved specimens
(specimens per species: mean = 7.9; range = 1–19), focusing on
traits of established ecological significance (Losos 2009). A single
investigator (DLM) obtained all measurements from adult males,
employing strict controls for measurement drift and other sources
of bias (the first 1/3 of the measurements taken were discarded
and retaken as a precaution against measurement “burnin”). We
natural log transformed raw measurements and averaged indi-
vidual values to obtain species mean values for each trait. We
controlled for the effect of lizard size (represented by snout-to-
vent length, SVL) by performing a phylogenetic linear regression
of each trait on ln(SVL) (Grafen 1989; Rohlf 2001) to obtain
residual values for each species (following Revell 2009; note that
we separately regressed tail length on SVL using a dataset in-
cluding only individuals with intact tails). We then performed a
phylogenetic principal component analysis (PCA) on the residu-
als, extracted the eigenstructure of the PC axes from a correlation
matrix, and obtained PC scores for the original species (Revell
2009). We used body size and PC scores for the first four PC axes
(eigenvalues greater than one) for our analyses of evolutionary
rate.
EVOLUTION SEPTEMBER 2010 2 7 3 3

D. LUKE MAHLER ET AL.
2 7 3 4 EVOLUTION SEPTEMBER 2010

OPPORTUNITY AND RATE IN ANOLIS LIZARDS
ESTIMATING ECOLOGICAL OPPORTUNITY AND RATE
To test the hypothesis that the rate of phenotypic evolution in
Caribbean Anolis has varied as a function of ecological opportu-
nity, we (1) estimated opportunity as the richness of sympatric
lineages at each node in the tree (for the lineage diversity model)
or as the relative age of each node (for the time model), (2) calcu-
lated independent contrasts for body size and values on the four
PC axes obtained from our morphometric dataset, and (3) used a
model-fitting analysis to ask if the rate of morphological evolution
is predicted by estimates of lineage diversity or time.
To measure lineage diversity at internal nodes, we estimated
the number of anole lineages present on an island at the time
that a focal lineage on that island was undergoing speciation.
Uncertainty exists in the reconstruction of both the geography of
the node at which lineage divergence is occurring, as well as the
geographic location of all other lineages present at that time, many
of which might occur on the same island as the diverging lineage.
To incorporate uncertainty in ancestral reconstruction of island
occupancy, we developed a new three-step method to estimate
island lineage diversity at each internal node in the tree while
accounting for the maximum likelihood probabilities that each
node occurred at a variety of possible geographic locations. This
procedure is illustrated in Figure 2 and described in detail here.
In Step 1, we estimated the geographic location of each node
in the tree using a maximum likelihood reconstruction of an-
cestral island status in which the model of character evolution
was discrete and all transition rates were equal (implemented by
the ace function of ape in R; Pagel 1994; Paradis 2006; R Core
Development Team). This reconstruction provides a set of proba-
bilities that the ancestral species at a particular internal node was
found on each of the four Greater Antillean isles (termed marginal
probabilities).
In Step 2, for each node in the tree, we used these recon-
structed localities to estimate the number of lineages present on
each island at the time of occurrence of that particular node. To
do this, we summed the marginal probabilities estimated for each
island at all earlier nodes (including those that were not direct
ancestors), obtaining lineage richness estimates for each island at
the time of the node of interest. This method investigates every
node from the root of the tree to the time of interest, adding to a
cumulative tally of geographic location each time a node is inves-
tigated (e.g., if an early node is reconstructed as having occurred
on Cuba, one species is added to the lineage score for Cuba, and
zero species are added to the scores of the other candidate islands).
This exercise produces an estimate of the number of species that
occurred on each island at the time of occurrence of the focal
node. In practice, the geography of many nodes is ambiguously
reconstructed, which is why marginal probabilities are used for
this tally—adding marginal probabilities records the accumula-
tion of lineages at a particular location in direct proportion to the
maximum likelihood probability that those lineages accumulated
there.
In Step 3, for each node in the tree, we combined information
about the number of contemporaneous lineages present on each
island with our estimate of the geographic location of that par-
ticular node to estimate the node’s “lineage diversity” value. We
calculated the element-by-element product of the vector of island-
specific lineage diversity values (from Step 2) and the vector of
marginal probabilities from the node of interest (from Step 1) to
obtain lineage diversity at the focal node. This final sum is the
weighted mean of the estimated lineage diversities on each island
at the time of our focal node, where the weights are derived from
the marginal probability that the node species resides on each of
the four Greater Antillean islands.
Next, to estimate rate, we calculated standardized indepen-
dent contrasts from the size and PCA data using the pic function
of the R package ape (Felsenstein 1985; Paradis 2006). Using
values for independent contrasts and estimates of lineage diver-
sity, we then fit a model in which the expected variance of the
contrasts varies as a function of lineage diversity. The variance
of standardized independent contrasts is an estimate of the evo-
lutionary rate because the mean square of the contrasts in a clade
has an expectation that is equivalent to the Brownian motion
rate parameter for this clade (Revell et al. 2007; Revell 2008).
To fit the lineage diversity model, we used the principle of maxi-
mum likelihood and maximized the following equation for the log
likelihood:
log[L(σ2
0,ψ)] =
n−1∑i=1
[−1
2c2
i
/(ψ · li + σ2
0
)
− 1
2log
(ψ · li + σ2
0
) − 1
2log(2π)
]. (1)
In this equation, which is based on the normal probability
density function, σ20 is the rate of phenotypic evolution when the
number of co-occurring lineages is 0, and ψ is the slope of the
relationship between rate and the number of lineages. The slope,
←−−−−−−−−−−−−−−−−−−−−−−−−−−−−−−−−−−−−−−−−−−−−−−−−−−−−−−−−−−−−−−−−−−−−−−−−−−−−−−−−−−−−−−−−−−−−−−−−−−−−−−−−−−−−−−−−−−−−−−−−−−−−−−−−−−−−−−−−−−−Figure 1. The Bayesian maximum clade credibility phylogeny for the Greater Antillean radiation of Anolis lizards, in which branch lengths
are calibrated to represent relative time. The maximum likelihood estimate of geographic history based on current species distributions
is mapped onto the tree. Character states at internal nodes have been resolved unambiguously by assigning them their most probable
states. Branches, lizards, and islands are colored by geography. Arrows and lizards indicate inferred colonization events, in which the
colonizing lizard is colored to match its source.
EVOLUTION SEPTEMBER 2010 2 7 3 5

D. LUKE MAHLER ET AL.
X1 X
2X
3
Red Island
Yellow Island
Blue Island
Island LineageRichness at Time (Y)
Weighted Island Lineage Contribution
SUMLineage Diversity Estimate of Node (Y) 1.054
⎥⎥⎥
⎦
⎤
⎢⎢⎢
⎣
⎡
⎥⎥⎥
⎦
⎤
⎢⎢⎢
⎣
⎡
⎥⎥⎥
⎦
⎤
⎢⎢⎢
⎣
⎡
⎥⎥⎥
⎦
⎤
⎢⎢⎢
⎣
⎡
⎥⎥⎥
⎦
⎤
⎢⎢⎢
⎣
⎡
++++++
508.0
095.0
451.0
455.0
102.0
443.0
117.1
927.0
017.1
455.0
102.0
443.0
372.0385.0360.0
285.0309.0333.0
344.0366.0307.0
=
Marginal Probabilityof Node (Y)
Marginal Probabilityof Node (Y)
=xx
Figure 2. Method for estimating lineage diversity at Node Y using maximum likelihood ancestral reconstruction of historical values for
island geography (three islands are represented by different colors). In general terms, for Node Y, the diversity of sympatric competing
lineages is estimated by multiplying the probability that Node Y occurred on a particular island by the maximum likelihood estimate of
the number of competing lineages also present on that same island. See text for further explanation.
ψ, is simply the slope of the best-fitting linear model for the
change in rate per unit change in lineage diversity on an island.
Thus, negative values of ψ indicate the decrease in evolutionary
rate expected on average due to the addition of a new lineage to
an island. The terms ci and li are the phylogenetic contrast score
and the estimated lineage diversity at node i, respectively, and the
summation is performed over all n − 1 internal nodes in the tree.
To maximize this equation, we used numerical optimization
on a grid with predefined bounds. We defined the bounds based
on some simple constraints on possible values for σ20 and ψ; for
example σ20 > 0 and ψ · lmax + σ2
0 > 0 (i.e., the evolutionary rate
cannot be negative).
To fit the time model, we scaled the tree to unit length to make
the results from trees in the posterior distribution more directly
comparable, and measured relative time as the ages of nodes on
each tree. We then fit a model in which the expected variance
of contrasts changed as a linear function of relative time using
maximum likelihood. We again maximized equation (1) to obtain
the log likelihood, but this time replaced the lineage diversity
term li with the term ti for time from the root of the tree. Our time
model is similar to the node height test of Freckleton and Harvey
(2006), although the model-fitting procedure is different—their
method calculates the correlation between the absolute value of
phylogenetic contrasts and time from the root of the tree, whereas
our method models the variance of contrasts as a function of time
from the root of the tree.
We also calculated the likelihood of a model in which there is
a single rate of phenotypic evolution for the entire phylogeny (the
“single rate model”). The single evolutionary rate, σ20, was here
found by maximizing the following equation for the likelihood:
log[L(σ2
0
)] =n−1∑i=1
[−1
2c2
i
/σ2
0 − 1
2log
(σ2
0
) − 1
2log(2π)
], (2)
which is maximized for
σ20 = 1
n − 1
n−1∑i=1
c2i , (3)
where n is the number of species (not contrasts). Note that the
single rate model is a special case of both the lineage diversity
and the time models, in which the rate of phenotypic evolution
does not change with changes in lineage diversity or the passage
of time, respectively (hence, in eq. 1, when li [or ti ] is fixed at
zero, σ20 is an estimate of the rate of phenotypic evolution across
the whole tree).
We compared our three alternative models (single rate, lin-
eage diversity, and time) using the small sample corrected Akaike
2 7 3 6 EVOLUTION SEPTEMBER 2010
OPPORTUNITY AND RATE IN ANOLIS LIZARDS
information criterion (AICc), computed as follows:
AICc = 2k − 2 log(L) + 2k(k + 1)
n − k − 2. (4)
The number of parameters, k, in our models is k = 2 for
the lineage diversity and time models and k = 1 for the constant
rate model. The model with the lowest AICc is the best-fitting
model (Akaike 1974). Our approach differs from the typical size
correction of Hurvich and Tsai (1989) by subtracting 2 instead of
1 in the denominator of the final term because n is the number
of species, not contrasts, as before. Model comparison results are
presented as �AICc scores (in which the best-fit model has the
score 0), and as AICc weights (Table 2). We follow the criteria of
Burnham and Anderson (2002) for evaluating levels of empirical
support for individual models compared using AICc.
We performed all analyses, including phylogenetic size cor-
rection and PCA, estimation of ecological opportunity and evolu-
tionary rates, and model comparison on each of 898 trees sampled
randomly from the posterior distribution of the Bayesian analysis
conducted in BEAST. To summarize our results, we averaged our
results over all 898 trees and accounted for both phylogenetic
uncertainty as well as error variance in our MLEs to estimate the
standard error associated with our parameter estimates (details
are provided in Appendix S1). For ease of presentation, we pro-
vide results from the Bayesian maximum clade credibility (MCC)
topology (Drummond and Rambaut 2007) for the PCA and in the
graphical illustrations of the evolutionary rate (results were qual-
itatively similar among trees).
We conducted a simulation analysis to quantify error and
bias for our parameter estimation and model-selection procedures,
as well as to test the sensitivity of these methods to historical
extinction. In brief, we found our methods to be highly effective
at identifying the correct model of evolution, even when data were
evolved on phylogenies that underwent considerable extinction.
High levels of extinction decreased the power of our methods to
identify patterns of decreasing rates of evolution with declining
ecological opportunity and biased our estimates of the rates of
decline, but did not substantially increase the likelihood of falsely
favoring an opportunity model. A detailed description of this
analysis can be found in Appendix S2.
We performed all size correction, PCA, and opportunity and
rate estimation using scripts written in R, whereas we maximized
likelihood equations for our models using MATLAB scripts. All
programs and computer scripts are available from the authors
upon request.
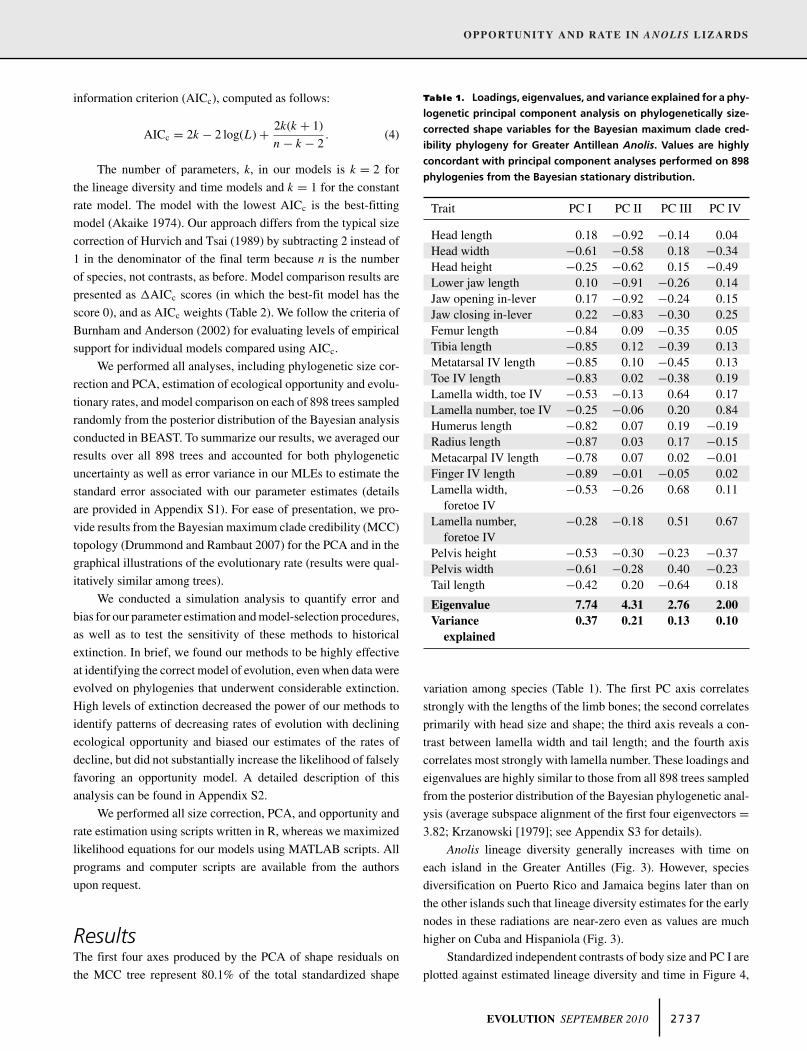
ResultsThe first four axes produced by the PCA of shape residuals on
the MCC tree represent 80.1% of the total standardized shape
Table 1. Loadings, eigenvalues, and variance explained for a phy-
logenetic principal component analysis on phylogenetically size-
corrected shape variables for the Bayesian maximum clade cred-
ibility phylogeny for Greater Antillean Anolis. Values are highly
concordant with principal component analyses performed on 898
phylogenies from the Bayesian stationary distribution.
Trait PC I PC II PC III PC IV
Head length 0.18 −0.92 −0.14 0.04Head width −0.61 −0.58 0.18 −0.34Head height −0.25 −0.62 0.15 −0.49Lower jaw length 0.10 −0.91 −0.26 0.14Jaw opening in-lever 0.17 −0.92 −0.24 0.15Jaw closing in-lever 0.22 −0.83 −0.30 0.25Femur length −0.84 0.09 −0.35 0.05Tibia length −0.85 0.12 −0.39 0.13Metatarsal IV length −0.85 0.10 −0.45 0.13Toe IV length −0.83 0.02 −0.38 0.19Lamella width, toe IV −0.53 −0.13 0.64 0.17Lamella number, toe IV −0.25 −0.06 0.20 0.84Humerus length −0.82 0.07 0.19 −0.19Radius length −0.87 0.03 0.17 −0.15Metacarpal IV length −0.78 0.07 0.02 −0.01Finger IV length −0.89 −0.01 −0.05 0.02Lamella width, −0.53 −0.26 0.68 0.11
foretoe IVLamella number, −0.28 −0.18 0.51 0.67
foretoe IVPelvis height −0.53 −0.30 −0.23 −0.37Pelvis width −0.61 −0.28 0.40 −0.23Tail length −0.42 0.20 −0.64 0.18
Eigenvalue 7.74 4.31 2.76 2.00Variance 0.37 0.21 0.13 0.10
explained
variation among species (Table 1). The first PC axis correlates
strongly with the lengths of the limb bones; the second correlates
primarily with head size and shape; the third axis reveals a con-
trast between lamella width and tail length; and the fourth axis
correlates most strongly with lamella number. These loadings and
eigenvalues are highly similar to those from all 898 trees sampled
from the posterior distribution of the Bayesian phylogenetic anal-
ysis (average subspace alignment of the first four eigenvectors =3.82; Krzanowski [1979]; see Appendix S3 for details).
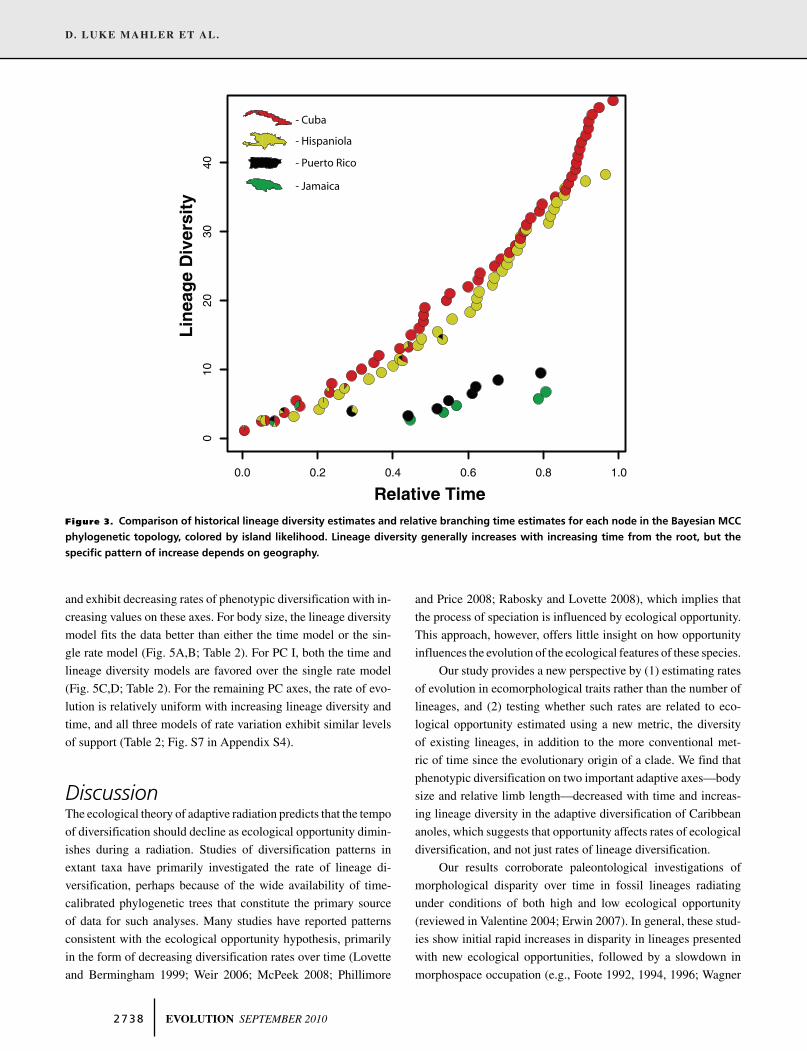
Anolis lineage diversity generally increases with time on
each island in the Greater Antilles (Fig. 3). However, species
diversification on Puerto Rico and Jamaica begins later than on
the other islands such that lineage diversity estimates for the early
nodes in these radiations are near-zero even as values are much
higher on Cuba and Hispaniola (Fig. 3).
Standardized independent contrasts of body size and PC I are
plotted against estimated lineage diversity and time in Figure 4,
EVOLUTION SEPTEMBER 2010 2 7 3 7
D. LUKE MAHLER ET AL.
Figure 3. Comparison of historical lineage diversity estimates and relative branching time estimates for each node in the Bayesian MCC
phylogenetic topology, colored by island likelihood. Lineage diversity generally increases with increasing time from the root, but the
specific pattern of increase depends on geography.
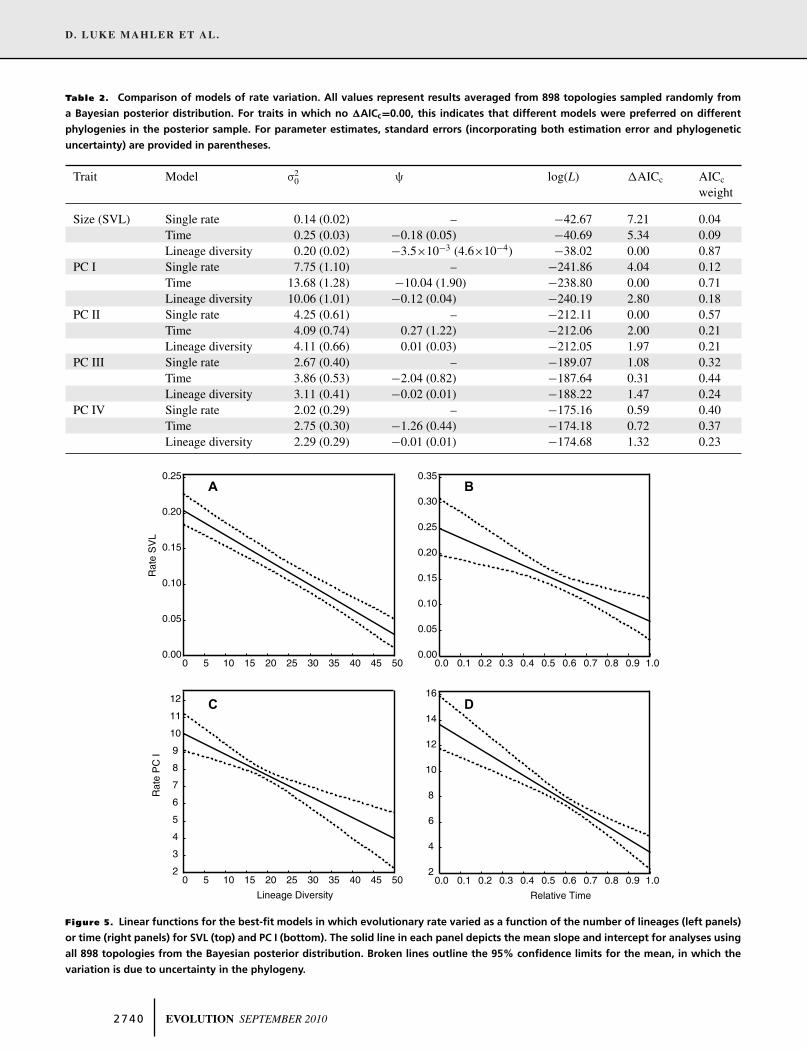
and exhibit decreasing rates of phenotypic diversification with in-
creasing values on these axes. For body size, the lineage diversity
model fits the data better than either the time model or the sin-
gle rate model (Fig. 5A,B; Table 2). For PC I, both the time and
lineage diversity models are favored over the single rate model
(Fig. 5C,D; Table 2). For the remaining PC axes, the rate of evo-
lution is relatively uniform with increasing lineage diversity and
time, and all three models of rate variation exhibit similar levels
of support (Table 2; Fig. S7 in Appendix S4).
DiscussionThe ecological theory of adaptive radiation predicts that the tempo
of diversification should decline as ecological opportunity dimin-
ishes during a radiation. Studies of diversification patterns in
extant taxa have primarily investigated the rate of lineage di-
versification, perhaps because of the wide availability of time-
calibrated phylogenetic trees that constitute the primary source
of data for such analyses. Many studies have reported patterns
consistent with the ecological opportunity hypothesis, primarily
in the form of decreasing diversification rates over time (Lovette
and Bermingham 1999; Weir 2006; McPeek 2008; Phillimore
and Price 2008; Rabosky and Lovette 2008), which implies that
the process of speciation is influenced by ecological opportunity.
This approach, however, offers little insight on how opportunity
influences the evolution of the ecological features of these species.
Our study provides a new perspective by (1) estimating rates
of evolution in ecomorphological traits rather than the number of
lineages, and (2) testing whether such rates are related to eco-
logical opportunity estimated using a new metric, the diversity
of existing lineages, in addition to the more conventional met-
ric of time since the evolutionary origin of a clade. We find that
phenotypic diversification on two important adaptive axes—body
size and relative limb length—decreased with time and increas-
ing lineage diversity in the adaptive diversification of Caribbean
anoles, which suggests that opportunity affects rates of ecological
diversification, and not just rates of lineage diversification.
Our results corroborate paleontological investigations of
morphological disparity over time in fossil lineages radiating
under conditions of both high and low ecological opportunity
(reviewed in Valentine 2004; Erwin 2007). In general, these stud-
ies show initial rapid increases in disparity in lineages presented
with new ecological opportunities, followed by a slowdown in
morphospace occupation (e.g., Foote 1992, 1994, 1996; Wagner
2 7 3 8 EVOLUTION SEPTEMBER 2010

OPPORTUNITY AND RATE IN ANOLIS LIZARDS
A B
DC
Figure 4. Absolute values of standardized phylogenetically independent contrasts of morphological traits for the Bayesian MCC phy-
logeny of Greater Antillean Anolis. (A) and (B) show body size contrasts with increasing lineage diversity and relative time, respectively.
(C) and (D) show PC I contrasts with increasing lineage diversity and relative time, respectively. Dashed lines show the expected stan-
dard deviation of the contrasts under the best-fit model in which the evolutionary rate varies as a function of the number of lineages
(left panels) or time (right panels). Colors represent the islands on which nodes occurred, estimated using maximum likelihood, as in
Figure 3.
1995). Such patterns match those observed in Anolis, in which
rates of morphological evolution are high early in the radiation
and when the diversity of competing lineages is low. Unlike most
of these paleontological studies, however, previous work on the
ecology and behavior of anoles allowed us to investigate traits
that have been demonstrated to be adaptively important. Conse-
quently, our observation of decreasing rates of evolution in these
traits with declining ecological opportunity can be directly inter-
preted as a decrease in the rate of adaptive differentiation.
OPPORTUNITY, RATE, AND ECOMORPHOLOGY
IN ANOLIS
Greater Antillean anoles are well known as an example of repli-
cated adaptive radiation, in which diversification on different
islands has produced similar outcomes despite largely indepen-
dent histories. We estimated rates of evolution for a set of eco-
morphologically significant traits that vary substantially among
species specialized to use different parts of the environment
(Williams 1983; Losos 2009). We found support for the ecological
EVOLUTION SEPTEMBER 2010 2 7 3 9
D. LUKE MAHLER ET AL.
Table 2. Comparison of models of rate variation. All values represent results averaged from 898 topologies sampled randomly from
a Bayesian posterior distribution. For traits in which no �AICc=0.00, this indicates that different models were preferred on different
phylogenies in the posterior sample. For parameter estimates, standard errors (incorporating both estimation error and phylogenetic
uncertainty) are provided in parentheses.
Trait Model σ20 ψ log(L) �AICc AICc
weight
Size (SVL) Single rate 0.14 (0.02) – −42.67 7.21 0.04Time 0.25 (0.03) −0.18 (0.05) −40.69 5.34 0.09Lineage diversity 0.20 (0.02) −3.5×10⁻³ (4.6×10⁻⁴) −38.02 0.00 0.87
PC I Single rate 7.75 (1.10) – −241.86 4.04 0.12Time 13.68 (1.28) −10.04 (1.90) −238.80 0.00 0.71Lineage diversity 10.06 (1.01) −0.12 (0.04) −240.19 2.80 0.18
PC II Single rate 4.25 (0.61) – −212.11 0.00 0.57Time 4.09 (0.74) 0.27 (1.22) −212.06 2.00 0.21Lineage diversity 4.11 (0.66) 0.01 (0.03) −212.05 1.97 0.21
PC III Single rate 2.67 (0.40) – −189.07 1.08 0.32Time 3.86 (0.53) −2.04 (0.82) −187.64 0.31 0.44Lineage diversity 3.11 (0.41) −0.02 (0.01) −188.22 1.47 0.24
PC IV Single rate 2.02 (0.29) – −175.16 0.59 0.40Time 2.75 (0.30) −1.26 (0.44) −174.18 0.72 0.37Lineage diversity 2.29 (0.29) −0.01 (0.01) −174.68 1.32 0.23
Figure 5. Linear functions for the best-fit models in which evolutionary rate varied as a function of the number of lineages (left panels)
or time (right panels) for SVL (top) and PC I (bottom). The solid line in each panel depicts the mean slope and intercept for analyses using
all 898 topologies from the Bayesian posterior distribution. Broken lines outline the 95% confidence limits for the mean, in which the
variation is due to uncertainty in the phylogeny.
2 7 4 0 EVOLUTION SEPTEMBER 2010
OPPORTUNITY AND RATE IN ANOLIS LIZARDS
opportunity hypothesis in both body size and relative limb lengths.
For body size, we found that the lineage diversity model was
most favored, which suggests that increased numbers of compet-
ing anole lineages led to a decrease in rates of body size evolution.
The ecological opportunity hypothesis was also supported for rel-
ative limb lengths (PC I), but in this case, the ecological models of
time and lineage diversity both exhibited statistically comparable
levels of support (Burnham and Anderson 2002).
The ecological significance of body size and relative limb
lengths is well established in anoles. In anole communities, inter-
specific body size differences are associated with differences in
both diet and habitat use (Schoener 1968, 1969, 1970, 1975; Lister
1976; Pacala and Roughgarden 1982; reviewed in Losos 2009),
and likely evolved in response to interspecific competition among
anole species (Schoener 1970; Roughgarden and Pacala 1989;
Losos 1992, 2009; Roughgarden 1995). Similarly, the functional
and behavioral significance of variation in limb length is well
established (e.g., Losos 1990; Irschick and Losos 1998, 1999)
and sympatric species that occupy dissimilar microhabitats dif-
fer in relative limb lengths (Williams 1983; reviewed in Losos
2009).
We did not find substantial support for the role of ecolog-
ical opportunity in the evolution of the remaining three trait
axes, primarily representing head and toepad dimensions and
tail length. Although variation in these traits is also related to
ecological variation), the lack of a relationship with ecologi-
cal opportunity may stem from several causes. First, some of
these traits, such as head dimensions, are also the target of
sexual selection (Lailvaux et al. 2004; Herrel et al. 2007); be-
cause the intensity of sexual selection need not be related to
ecological opportunity, rates of evolution of such traits might
not be expected to be correlated with opportunity. Also, Greater
Antillean anoles exhibit a pattern of evolution in which adapta-
tion to different structural habitats (e.g., twigs, canopy, bushes)
evolved early in the radiation, but subsequent diversification
along other resource axes (e.g., thermal microhabitats) contin-
ued throughout the radiation (e.g., Glor et al. 2003; Losos 2009).
Some of the traits on these three axes may be involved in this
secondary aspect of anole differentiation, and therefore exhibit
comparatively constant rates of evolution throughout the radi-
ation. An additional possibility is that we may not have de-
tected a signature of ecological opportunity due to sampling er-
ror, which is expected to be more problematic for increasingly
minor PC axes (the role of sampling error is explored further in
Appendix S5).
THE MARK OF ECOLOGY ON DIVERSIFICATION
The result that rates of morphological evolution in anoles are cor-
related with historical estimates of ecological opportunity sug-
gests that ecological processes may influence patterns of lineage
diversification. However, this relationship may be generally dif-
ficult to detect, particularly because diversification often occurs
over large geographical scales. Under scenarios in which lin-
eage diversity is primarily distributed allopatrically, members of
a diversifying lineage will interact little with each other. In such
cases, ecological opportunity will usually be determined by a di-
verse suite of interacting species that are not closely related, and
it may therefore be much more difficult to estimate opportunity
using phylogenetic methods.
We suggest that the present methods for estimating past eco-
logical opportunity and testing its relationship to patterns of phe-
notypic evolution will be most powerful when ecological interac-
tions are primarily among members of a single clade, as is often
the case in adaptive radiations on islands and in lakes (e.g., Fryer
1996; Baldwin and Sanderson 1998; Grant 1998; Chiba 2004,
reviewed in Leigh et al. 2007; Losos and Ricklefs 2009). On
continents, it may be much harder to estimate ecological oppor-
tunity (although in some continental radiations, relatives interact
particularly intensely, as in the North American wood warblers;
MacArthur 1958; Rabosky and Lovette 2008). Of course, follow-
ing mass extinctions, evolutionary recovery is often dominated by
a small number of clades that radiate widely and rapidly—even in
biogeographically large regions, such as continents (Erwin 2001).
In such scenarios, the methods presented here may also detect the
signature of declining opportunity in the phenotypic pattern of
diversification.
Anoles provide an ideal system to test whether rates of phe-
notypic evolution exhibit a relationship with historical estimates
of ecological opportunity in continental as well as in island radi-
ations. In addition to radiating in the Caribbean, two anole clades
have diversified in neotropical mainland habitats (Nicholson et al.
2005; Pinto et al. 2008). Although we presently lack the phyloge-
netic data necessary to adequately estimate ecological opportunity
and rates of evolution in these clades, examination of these taxa
is an exciting avenue for future investigation.
ASSUMPTIONS, POSSIBLE SOURCES OF ERROR,
AND FURTHER DEVELOPMENT OF ECOLOGICAL
OPPORTUNITY MODELS
A number of potential sources of error may influence the inter-
pretation of results obtained using our method, but none of these
are of particular concern to the present study. Here, we briefly
detail two caveats associated with this method, and we provide
a more detailed exploration of model assumptions and additional
potential biasing factors in Appendix S5.
First, our methods do not directly account for extinction. For
the lineage diversity model, our procedure provides an unbiased
estimate of the lineage diversity at each node under a pure-birth
process (i.e., no extinction), but the reconstructed lineage diversity
at internal nodes will be biased downwards under more realistic
EVOLUTION SEPTEMBER 2010 2 7 4 1
D. LUKE MAHLER ET AL.
scenarios involving some degree of extinction. However, we eval-
uated the sensitivity of our method to extinction via simulation and
found the method to perform well under a wide range of constant
relative extinction rates (described in Appendix S2). In phyloge-
nies in which the ratio of extinction to speciation was increased,
our methods experienced a modest reduction in the power to de-
tect the effect of ecological opportunity on diversification (i.e.,
increased Type II error), but did not tend to falsely select eco-
logical opportunity models when data were evolved under pure
Brownian motion (i.e., Type I error was not elevated appreciably
by extinction). Apparently, constant extinction does not produce
a phenotypic pattern resembling the signature of ecological op-
portunity, although at high levels, it may make such a signature
more difficult to detect.
Second, we warn that our lineage diversity model only gen-
erates an estimate of ecological opportunity—one that assumes
that the competitive factors influencing rates of evolution may
be approximated using the lineage diversity of entire islands in
the Greater Antilles. In reality, this may be an imprecise measure
of local ecological opportunity because species diversity values
in local communities were certainly not as high as on entire is-
lands (each species does not occur everywhere on the island). It
is difficult to obtain more accurate estimates of historical lineage
diversity at the community level using comparative data, but one
possible solution is to transform estimates of island lineage diver-
sity so that they scale more closely with maximum community
diversity estimates for each island. To do this, we log transformed
lineage diversity estimates, which depresses large lineage richness
values relative to small values. Such a transformation is appropri-
ate, because maximum community richness increases with island
size in Greater Antillean anoles, but with a much lower slope than
island species richness (Losos 2009). Reanalyzing our data this
way, we obtained similar results that further support the ecological
opportunity hypothesis (see Appendix S5).
The lineage diversity model may be developed further in
a number of ways. For example, the lineage diversity estimator
might be modified to infer geographical location of lineages along
branches rather than only at the nodes of the phylogeny to esti-
mate contemporaneous diversity values at the time of occurrence
of a focal node. The authors are currently exploring one poten-
tial branch-based approach in which stochastic character mapping
methods (Bollback 2006) are used to reconstruct geographic his-
tory along branches. Also, future models may specifically con-
sider whether rates of evolution are exceptional on the branches
representing colonization of new regions (our current model as-
signs phenotypic diversification to the island of the ancestral node,
even if one of the descendant lineages colonized another island;
see Supporting Information for further discussion, including a
test in which nodes associated with such events were removed).
Nonetheless, the method presented herein is both highly tractable
and provides clear results showing a decrease in evolutionary rate
with ecological opportunity in Anolis.
ConclusionsAccording to the ecological theory of adaptive radiation, ecologi-
cal processes are responsible for generating many of the dominant
patterns in the evolutionary history of life (Lack 1947; Simpson
1953; Schluter 2000). Here we report evidence for ecological
controls on rates of phenotypic evolution—rates of body size and
limb length evolution in Anolis lizards are a function of the diver-
sity of competing lineages. The ecological pattern is strongest for
body size, a trait with a well-established role in the structuring
of ecological communities across metazoans (Hutchinson 1959;
Peters 1983; Calder 1984; LaBarbera 1989), as well as in anoles.
Our results provide a phenotypic perspective on the study of
diversification rates in species radiations, and support a model in
which macroevolutionary diversification is bounded by ecological
limits. Further testing of such limits, as well as exploration of how
they shape diversity patterns in clades and regions, promises to
be a rewarding avenue for future evolutionary research.
ACKNOWLEDGMENTSWe thank D. Collar, L. Harmon, A. Herrel, B. Langerhans, and C.Marshall for helpful discussions, constructive criticism, and methodolog-ical advice. Also, A. Harrison, C. Infante, J. Kolbe, M. Munoz, T. Ord, T.Sanger, and Y. Stuart provided useful feedback on an early presentationof this work. For access to specimens and museum facilities, we thankJ. Rosado, J. Martinez, J. Woodward, and T. Takahashi (Museum ofComparative Zoology, Harvard University), S. Poe and T. Giermakowski(Museum of Southwestern Biology, University of New Mexico), A.Resetar, M. Kearney, and H. Voris (Field Museum, Chicago), L. Dıazand O. Garrido (National Museum of Natural History, Havana), andL. Rodrıguez Schettino, A. Chamizo Lara, V. Rivalta Gonzalez, A.Rodrıguez, and R. Alonso (Institute of Ecology and Systematics, Havana).We are grateful to M. Munoz, D. Chang, K. Fenstermacher, and especiallyH. Frank for collecting toepad data, and to Y. Stuart, T. Hagey, B. Falk,S. Perkins, D. Scantlebury, J. Ng, and M. Landestoy for assistance andcompany in the field. Permission to collect specimens in the DominicanRepublic was granted by the Secretarıa de Estado de Medio Ambiente yRecursos Naturales (permit # 0001181). Financial support was providedby the David Rockefeller Center for Latin American Studies and the De-partment of Organismic and Evolutionary Biology at Harvard University,as well as the National Science Foundation and the National EvolutionarySynthesis Center.
LITERATURE CITEDAkaike, H. 1974. A new look at the statistical model identification. IEEE
Trans. Automat. Control 19:716–723.Alroy, J. 2009. Speciation and extinction in the fossil record of North American
mammals. Pp. 301–323 in R. Butlin, J. Bridle, and D. Schluter, eds.Speciation and patterns of diversity. Cambridge Univ. Press, Cambridge,UK.
Alroy, J., M. Aberhan, D. J. Bottjer, M. Foote, F. T. Fursich, P. J. Harries,A. J. W. Hendy, S. M. Holland, L. C. Ivany, W. Kiessling, et al. 2008.
2 7 4 2 EVOLUTION SEPTEMBER 2010

OPPORTUNITY AND RATE IN ANOLIS LIZARDS
Phanerozoic trends in the global diversity of marine invertebrates. Sci-ence 321:97–100.
Baldwin, B. G., and M. J. Sanderson. 1998. Age and rate of diversification ofthe Hawaiian silversword alliance (Compositae). Proc. Natl. Acad. Sci.USA 95:9402–9406.
Benton, M. J. 2009. The red queen and the court jester: species diversity andthe role of biotic and abiotic factors through time. Science 323:728–732.
Bollback, J. P. 2006. SIMMAP: stochastic character mapping of discrete traitson phylogenies. BMC Bioinformatics 7:88.
Burbrink, F. T., and R. A. Pyron. 2010. How does ecological opportunityinfluence rates of speciation, extinction, and morphological diversifica-tion in New World ratsnakes (Tribe Lampropeltini)? Evolution 64:934–943.
Burnham, K. P., and D. R. Anderson. 2002. Model selection and multi-modal inference: a practical-theoretic approach. 2nd ed. Springer-Verlag,New York.
Buskirk, R. E. 1985. Zoogeographic patterns and tectonic history of Jamaicaand the northern Caribbean. J. Biogeogr. 12:445–461.
Calder, W. A. III. 1984. Size, function, and life history. Harvard Univ. Press,Cambridge, MA.
Carlquist, S. 1974. Island biology. Columbia Univ. Press, New York.Chiba, S. 2004. Ecological and morphological patterns in communities of
land snails of the genus Mandarina from the Bonin Islands. J. Evol.Biol. 17:131–143.
Drummond, A. J., and A. Rambaut. 2007. BEAST: Bayesian evolutionaryanalysis by sampling trees. BMC Evol. Biol. 7:214.
Erwin, D. H. 2001. Lessons from the past: Biotic recoveries from mass ex-tinctions. Proc. Natl. Acad. Sci. USA 98:5399–5403.
———. 2007. Disparity: morphological pattern and developmental context.Palaeontology 50:57–73.
Erwin, D. H., J. W. Valentine, and J. J. Sepkoski. 1987. A comparative study ofdiversification events: the early Paleozoic vs. the Mesozoic. Evolution41:1177–1186.
Felsenstein, J. 1985. Phylogenies and the comparative method. Am. Nat.125:1–15.
Foote, M. 1992. Paleozoic record of morphological diversity in blastozoanechinoderms. Proc. Natl. Acad. Sci. USA 89:7325–7329.
———. 1994. Morphological disparity in Ordovician-Devonian crinoids andthe early saturation of morphological space. Paleobiology 20:320–344.
———. 1996. Ecological controls on the evolutionary recovery of post-Paleozoic crinoids. Science 274:1492–1495.
———. 1997. The evolution of morphological diversity. Annu. Rev. Ecol.Syst. 28:129–152.
Freckleton, R. P., and P. H. Harvey. 2006. Detecting non-Brownian trait evo-lution in adaptive radiations. PLoS Biol. 4:e373.
Friedman, M. 2010. Explosive morphological diversification of spiny-finnedteleost fishes in the aftermath of the end-Cretaceous extinction. Proc. R.Soc. Lond. B 277:1675–1683.
Fryer, G. 1996. Endemism, speciation, and adaptive radiation in great lakes.Environ. Biol. Fish. 45:109–131.
Gavrilets, S., and J. B. Losos. 2009. Adaptive radiation: contrasting theorywith data. Science 323:732–737.
Gavrilets, S., and A. Vose. 2005. Dynamic patterns of adaptive radiation. Proc.Natl. Acad. Sci. USA 102:18040–18045.
Gillespie, R. G., F. G. Howarth, and G. K. Roderick. 2001. Adaptive radiation.Pp. 25–44 in S. A. Levin, ed. Encyclopedia of biodiversity, vol. 1,Academic Press, New York.
Glor, R. E., J. J. Kolbe, R. Powell, A. Larson, and J. B. Losos. 2003. Phyloge-netic analysis of ecological and morphological diversification in Hispan-iolan trunk-ground anoles (Anolis cybotes group). Evolution 57:2383–2397.
Gould, S. J. 1989. Wonderful life: the Burgess Shale and the nature of history.Norton, New York.
Grafen, A. 1989. The phylogenetic regression. Phil. Trans. R. Soc. Lond. B326:119–157.
Grant, P. R., ed. 1998. Evolution on islands. Oxford Univ. Press, Oxford, UK.Harmon, L. J., J. A. Schulte II, A. Larson, and J. B. Losos. 2003. Tempo and
mode of evolutionary radiation in iguanian lizards. Science 301:961–964.
Harmon, L. J., J. Melville, A. Larson, and J. B. Losos. 2008. The role of ge-ography and ecological opportunity in the diversification of day geckos(Phelsuma). Syst. Biol. 57:562–573.
Harvey, P. H., R. M. May, and S. Nee. 1994. Phylogenies without fossils.Evolution 48:523–529.
Hedges, S. B. 2006. Paleogeography of the Antilles and the origin of WestIndian terrestrial vertebrates. Ann. Mo. Bot. Gard. 93:231–244.
Herrel, A., L. D. McBrayer, and P. M. Larson. 2007. Functional basis forsexual differences in bite force in the lizard Anolis carolinensis. Biol. J.Linn. Soc. 91:111–119.
Hurvich, C. M., and C.-L. Tsai. 1989. Regression and time series modelselection in small samples. Biometrika 76:297–307.
Hutchinson, G. E. 1959. Homage to Santa Rosalia, or why are there so manykinds of animals? Am. Nat. 93:145–159.
Irschick, D. J., and J. B. Losos. 1998. A comparative analysis of the ecologicalsignificance of maximal locomotor performance in Caribbean Anolis
lizards. Evolution 52:219–226.———. 1999. Do lizards avoid habitats in which performance is submaximal?
The relationship between sprinting capabilities and structural habitat usein Caribbean anoles. Am. Nat. 154:293–305.
Ito, H. C., and U. Dieckmann. 2007. A new mechanism for recurrent adaptiveradiations. Am. Nat. 170:E96–E111.
Kozak, K. H., D. W. Weisrock, and A. Larson. 2006. Rapid lineage accumula-tion in a non-adaptive radiation: phylogenetic analysis of diversificationrates in eastern North American woodland salamanders (Plethodontidae:Plethodon). Proc. R. Soc. Lond. B 273:539–546.
Krzanowski, W. J. 1979. Between-group comparisons of principal compo-nents. J. Am. Stat. Assoc. 74:703–707.
LaBarbera, M. 1989. Analyzing body size as a factor in ecology and evolution.Annu. Rev. Ecol. Syst. 20:97–117.
Lack, D. 1947. Darwin’s finches. Cambridge Univ. Press, Cambridge, UK.Lailvaux, S. P., A. Herrel, B. VanHooydonck, J. J. Meyers, and D. J. Irschick.
2004. Performance capacity, fighting tactics, and the evolution of life-stage male morphs in the green anole lizard (Anolis carolinensis). Proc.R. Soc. Lond. B 271:2501–2508.
Leigh, E. G., Jr., A. Hladik, C. M. Hladik, and A. Jolly. 2007. The biogeogra-phy of large islands, or how does the size of the ecological theater affectthe evolutionary play? Rev. Ecol. (Terre Vie) 62:105–168.
Lister, B. C. 1976. The nature of niche expansion in West Indian Anolis lizardsII: evolutionary components. Evolution 30:677–692.
Losos, J. B. 1990. Ecomorphology, performance capability, and scaling ofWest Indian Anolis lizards: an evolutionary analysis. Ecol. Monogr.60:369–388.
———. 1992. A critical comparison of the taxon-cycle and character-displacement models for size evolution of Anolis lizards in the LesserAntilles. Copeia 1992:279–288.
———. 2009. Lizards in an evolutionary tree: ecology and adaptive radiationof anoles. Univ. of California Press, Berkeley, CA.
Losos, J. B., and R. E. Ricklefs. 2009. Adaptation and diversification onislands. Nature 457:830–836.
Losos, J. B., T. R. Jackman, A. Larson, K. de Queiroz, and L. RodrıguezSchettino. 1998. Historical contingency and determinism in replicatedadaptive radiations of island lizards. Science 279:2115–2118.
EVOLUTION SEPTEMBER 2010 2 7 4 3

D. LUKE MAHLER ET AL.
Losos, J. B., R. E. Glor, J. J. Kolbe, and K. Nicholson. 2006. Adaptation,speciation, and convergence: a hierarchical analysis of adaptive radiationin Caribbean Anolis lizards. Ann. Mo. Bot. Gard. 93:24–33.
Lovette, I. J., and E. Bermingham. 1999. Explosive speciation in the NewWorld Dendroica warblers. Proc. R. Soc. Lond. B 266:1629–1636.
MacArthur, R. H. 1958. Population ecology of some warblers of northeasternconiferous forests. Ecology 39:599–619.
McPeek, M. A. 2008. The ecological dynamics of clade diversification andcommunity assembly. Am. Nat. 172:E270–E284.
Mooers, A. Ø., and S. B. Heard. 1997. Inferring evolutionary process fromphylogenetic tree shape. Q. Rev. Biol. 72:31–54.
Nee, S., A. Ø. Mooers, and P. H. Harvey. 1992. Tempo and mode of evolu-tion revealed from molecular phylogenies. Proc. Natl. Acad. Sci. USA89:8322–8326.
Nicholson, K. E., R. E. Glor, J. J. Kolbe, A. Larson, S. B. Hedges, andJ. B. Losos. 2005. Mainland colonization by island lizards. J. Biogeogr.32:929–938.
Pacala, S., and J. Roughgarden. 1982. Resource partitioning and interspe-cific competition in two two-species insular Anolis lizards communities.Science 217:444–446.
Pagel, M. 1994. Detecting correlated evolution on phylogenies: a generalmethod for the comparative analysis of discrete characters. Proc. R.Soc. Lond. B 255:37–45.
Paradis, E. 2006. Analysis of phylogenetics and evolution with R. Springer,New York.
Peters, R. H. 1983. The ecological implications of body size. Cambridge Univ.Press, Cambridge, UK.
Peters, S. E. 2005. Geologic constraints on the macroevolutionary history ofmarine animals. Proc. Natl. Acad. Sci. USA 102:12326–12331.
Phillimore, A. B., and T. D. Price. 2008. Density-dependent cladogenesis inbirds. PLoS Biol. 6:e71.
———. 2009. Ecological influences on the temporal pattern of speciation.Pp. 240–256 in R. Butlin, J. Bridle, and D. Schluter, eds. Speciation andpatterns of diversity. Cambridge Univ. Press, Cambridge, UK.
Pinto, G., D. L. Mahler, L. J. Harmon, and J. B. Losos. 2008. Testing theisland effect in adaptive radiation: rates and patterns of morphologicaldiversification in Caribbean and mainland Anolis lizards. Proc. R. Soc.Lond. B 275:2749–2757.
R Development Core Team. 2009. R: a language and environment for statisticalcomputing. R Foundation for Statistical Computing ISBN 3-900051-07–0.
Rabosky, D. L. 2009. Heritability of extinction rates links diversificationpatterns in molecular phylogenies and fossils. Syst. Biol. 58:629–640.
Rabosky, D. L. and I. J. Lovette. 2008. Density-dependent diversificationin North American wood warblers. Proc. R. Soc. Lond. B 275:2363–2371.
Raup, D. M. 1985. Mathematical models of cladogenesis. Paleobiology 11:42–52.
Rensch, B. 1959. Evolution above the species level. Columbia Univ. Press,New York.
Revell, L. J. 2008. On the analysis of evolutionary change along singlebranches in a phylogeny. Am. Nat. 172:140–147.
———. 2009. Size-correction and principal components for interspecificcomparative studies. Evolution 63:3258–3268.
Revell, L. J., L. J. Harmon, R. B. Langerhans, and J. J. Kolbe. 2007. Aphylogenetic approach to determining the importance of constraint onphenotypic evolution in the neotropical lizard, Anolis cristatellus. Evol.Ecol. Res. 9:261–282.
Ricklefs, R. E., and J. Travis. 1980. A morphological approach to the studyof avian community organization. Auk 97:321–338.
Rohlf, F. J. 2001. Comparative methods for the analysis of continuous vari-ables: geometric interpretations. Evolution 55:2143–2160.
Roughgarden, J. 1995. Anolis lizards of the Caribbean: ecology, evolution,and plate tectonics. Oxford Univ. Press, Oxford, UK.
Roughgarden, J. D., and S. Pacala. 1989. Taxon cycle among Anolis lizardpopulations: review of evidence. Pp. 403–432 in D. Otte, and J. Endler,eds. Speciation and its consequences. Academy of Natural Science,Philadelphia, PA.
Roy, K., and M. Foote. 1997. Morphological approaches to measuring biodi-versity. Trends Ecol. Evol. 12:277–281.
Rundell, R. J., and T. D. Price. 2009. Adaptive radiation, nonadaptive radiation,ecological speciation and nonecological speciation. Trends Ecol. Evol.24:394–399.
Saunders, W. B., and A. R. H. Swan. 1984. Morphology and morphologic di-versity of mid-Carboniferous (Namurian) ammonoids in time and space.Paleobiology 10:195–228.
Schluter, D. 2000. The ecology of adaptive radiation. Oxford Univ. Press,Oxford, UK.
Schoener, T. W. 1968. The Anolis lizards of Bimini: resource partitioning ina complex fauna. Ecology 49:704–726.
———. 1969. Size patterns in West Indian Anolis lizards: I. size and speciesdiversity. Syst. Zool. 18:386–401.
———. 1970. Size patterns in West Indian Anolis lizards: II. Correlations withthe size of particular sympatric species – displacement and convergence.Am. Nat. 104:155–174.
———. 1975. Presence and absence of habitat shift in some widespread lizardspecies. Ecol. Monogr. 45:233–258.
Sepkoski, J. J., Jr. 1978. A kinetic model of Phanerozoic taxonomic diversityI. Analysis of marine orders. Paleobiology 4:223–251.
———. 1982. A compendium of fossil marine families. Milw. Public Mus.Contrib. Biol. Geol. 51:1–125.
———. 2002. A compendium of fossil marine animal genera. Bull. Am.Paleontol. 363:1–560.
Simpson, G. G. 1953. The major features of evolution. Columbia Univ. Press,New York.
Stanley, S. M. 1979. Macroevolution. W. H. Freeman, San Francisco.Valentine, J. W. 2004. On the origin of phyla. Univ. of Chicago Press, Chicago.Wagner, P. J. 1995. Testing evolutionary constraint hypotheses with early
Paleozoic gastropods. Paleobiology 21:248–272.Walker, T. D., and J. W. Valentine. 1984. Equilibrium models of evolutionary
species diversity and the number of empty niches. Am. Nat. 124:887–899.
Ward, P. D. 1980. Comparative shell shape distributions in Jurassic-Cretaceousammonites and Jurassic-Tertiary nautilids. Paleobiology 6:32–43.
Weir, J. T. 2006. Divergent patterns of species accumulation in lowland andhighland neotropical birds. Evolution 60:842–855.
Williams, E. E. 1983. Ecomorphs, faunas, island size, and diverse end pointsin island radiations of Anolis. Pp. 326–370 in R. B. Huey, E. R. Pianka,and T. W. Schoener, eds. Lizard ecology: studies of a model organism.Harvard Univ. Press, Cambridge, MA.
Yoder, J. B., E. Clancey, S. Des Roches, J. M. Eastman, L. Gentry, W. K.W. Godsoe, T. Hagey, D. Jochimsen, B. P. Oswald, J. Robertson, et al.2010. Ecological opportunity and the origin of adaptive radiations. J.Evol. Biol. In press.
Associate Editor: G. Hunt
2 7 4 4 EVOLUTION SEPTEMBER 2010

OPPORTUNITY AND RATE IN ANOLIS LIZARDS
Supporting InformationThe following supporting information is available for this article:
Appendix S1. Description of the estimation of the variances of our maximum likelihood estimators.
Appendix S2. Extinction and method performance.
Appendix S3. Quantifying similarity of principal component axes among the phylogenies used in our analysis.
Appendix S4. The relationship between ecological opportunity and rates of evolution for trait axes PC II–IV.
Appendix S5. Discussion of additional model assumptions and potential biasing factors.
Appendix S6. Supplementary literature cited.
Supporting Information may be found in the online version of this article.
Please note: Wiley-Blackwell is not responsible for the content or functionality of any supporting information supplied by the
authors. Any queries (other than missing material) should be directed to the corresponding author for the article.
EVOLUTION SEPTEMBER 2010 2 7 4 5