Ecological investigations into the causes and … · Ecological investigations into the causes and...
21
Ecological investigations into the causes and consequences of cyanobacterial diversity David W. Armitage Department of Integrative Biology University of California, Berkeley, CA MBL Microbial Diversity Final Report, Summer 2011
Transcript of Ecological investigations into the causes and … · Ecological investigations into the causes and...
Ecological investigations into the causes and consequences of
cyanobacterial diversity
David W. Armitage Department of Integrative Biology University of California, Berkeley, CA
MBL Microbial Diversity Final Report, Summer 2011

Abstract
I investigated the relationship between the diversity of cyanobacteria, a globally‐important group of
oxygenic phototrophs, to the mechanisms driving community assembly and ecosystem function. I ran a
laboratory experiment looking for effects of increased diversity in nested, randomized, artificially‐
assembled cyanobacterial communities on gross rates of oxygen evolution. The expectation of increased
photosynthetic rates with increasing species diversity was not found, but the experiment suffered from
a lack of replication and proper controls. Additionally, I analyzed a 454 16s amplicon library of
cyanobacteria occupying depth layers of salt marsh benthic mats differing in age. I found strong
evidence for phylogenetic clustering in the uppermost, light‐and‐oxygen saturated layer and a decrease
in clustering toward random and overdispersed‐patterns with depth. Further analysis may shed light on
the mechanisms of community assembly (competition vs. habitat filtering vs. neutrality) along a gradient
of habitat quality.
Introduction
There is a severe disconnect between traditional ecological theory and the underpinnings of
microbial ecology. On one hand, a unifying framework of ecological dynamics is never to be built
without explicit consideration of the huge (and underexplored) diversity within the “other two domains”
of Bacteria and Archaea. Likewise, while microbiologists often ask questions regarding the “who,”
“what,” and “how” of a system, they often neglect arguably the most important aspect of their system –
the “why.” Microbes are responsible for carrying out or significantly facilitating the majority of global
nutrient fluxes, and possess a diversity of traits capable of surmounting nearly any physiological
challenge. Moreover, current technologies such as genomic sequencing and “big data” analytics allow
researchers a first glimpse into the hypersaturated world of microbes. It stands to reason, then, that the
branches of ecology traditionally reserved for eukaryotic organisms (i.e. those working at the
community/population level) might benefit greatly from considering life from the perspective of the
prokaryote.
An organism’s genotype and phenotype are nonrandom with respect to phylogeny. The
consequence of this genotype‐phenotype association to the organism is its fundamental niche, which
can be malleable via phenotypic and/or genotypic adaptation. Traits, or aspects of an organism’s
phenotype conferring some function within that niche, are often shared among a number of taxa. If a
number of highly functional trait characteristics are shared among closely‐related taxa, we would label
them as being highly‐conserved, or synapomorphic. On the other hand, certain traits may be
independently‐evolved within multiple lineages (e.g. thorns in plants, wings in animals). These traits are
known as convergent, or homoplasious. Thus, an increase in the genotypic diversity of a community
inherently carries with it an increase in the community’s trait diversity. A major question that ecological
theory seeks to inform now is: how does the nonindependent variation evident at lower levels of
biological complexity (molecular to organismal) influence the emergent properties of whole ecosystems,
and can we use them to predict their dynamics?” And on the contrary, “how do these ecosystem
properties feedback on the lower levels, and where do we look to detect their effects?”
Recent experimental and theoretical exercises have revealed a clear trend – biodiversity seems
to be important to the functioning of ecosystems (Balvanera et al. 2006). Economic valuation of
hypothetical natural products and pollination aside, a species‐rich community simply outperforms a
monoculture in fulfilling many key roles crucial for maintaining any semblance of homeostasis, such as
production of biomass and nutrient cycling. There are a number of potential mechanisms which drive
this relationship, and the two foremost and encompassing, niche complimentarity and the selection
effect can be best conceptualized using the Price equation from population genetics (Loreau & Hector,
2001). If a community is comprised of N species, each with a yield in monoculture of M and relative yield
in the community RY = Yobs/M, then the effects of selection and complimentarity can be partitioned by
the equation
where ΔY is the difference between the observed and expected yield for the community. The first term
in the equation measures niche complementarily. That is, because two species cannot, by definition,
completely share a niche, certain unused niche breadth is available to a second species that enters a
community. Since this unused niche breadth often encompasses access to growth substrate, it is easy to
understand how a more diverse community will yield more than a single‐species monoculture. The
second term in the equation partitions out the selection effect, which means that an increase in
community richness from a monoculture to a mixed community will likely result in the recruitment of
high‐yield species, or those that possess a set of traits which allow them to produce a large amount of
biomass relative to the other community members.
Diversity patterns of genotypes (and hence phenotypes and traits) within a community can be
measured in a number of ways, such as variance of a particular trait, entropic measurements of discrete
units (eg. Simpson’s and Shannon’s indices), and distance‐based methods (eg. phylogenetic distance).
For microbes, the species concept completely breaks down, and phylogenetic distance (PD) measures
are the most appropriate diversity index. One strength of using PD measurements with microbes is that
they can be targeted to particular functional genes to measure not only the genotypic distance among
individuals, but can often approximate the variation among the traits conferred by those genes among a
set of taxa. Patterns of species occurrence can also be interpreted in the light of phylogenetic distances.
For example, since traits are more likely to be shared between closely‐related taxa, and since trait
similarity correlates to niche similarity, it stands to reason that closely related taxa compete more
strongly than distant relatives. If the local community assembly is strongly shaped by interspecific
interations (eg. predation, competition), then the observed members of the community would

represent a subset of a regional species pool that is more distantly related to each other than would be
expected by chance (i.e. overdispersed), due to the competitive exclusion of closely‐related species
sharing significant traits. On the other hand, if habitat filtering is a stronger driver than competition in
community assembly, then an opposite trend might be seen – closely‐related species that share key
traits will coexist in such a community more often that would be predicted by chance (i.e. clustered).
These arguments rely on the assumption that fundamental traits are synapomorphic within a
monophyletic clade, hence niches are conserved. It is also reasonable to take an alternate view, that
traits are phylogenetically convergent, and homologous traits are abundant. Here, the ecological
processes that shape the phylogenetic structure of the community manifest in different ways. For
example, competitive exclusion in a system with highly convergent traits would result in an apparently
randomly‐assembled community, while habitat filtering would result in an overdispersed system, where
distantly‐related species sharing key traits can thrive (Vamosi et al. 2009).
My project focuses on the biological diversity of the photoautotrophic cyanobacteria. These
organisms are responsible for between 30% and 100% of the photosynthetic fixation of CO2 to oxygen
on earth. Since these organisms are nearly ubiquitous in marine, freshwater, and terrestrial habitats
(including the photosynthetic cells of all plants), and represent a tremendously important, monophyletic
functional group, I chose to explore some of the causes and consequences of their community
composition both in‐situ and under laboratory conditions.
A key niche axis in the cyanobacteria are their chlorophyll pigments. The relative peaks of
absorbance spectra have been successfully used model population dynamics of pelagic bacteria, and
offer a reasonable start to investigate the potential for niche complimentarity among these taxa (Stomp
et al. 2004). However, there are clearly a number of highly‐successful cyanobacteria taxa that can
achieve a tremendous relative biomass, given the right conditions. The organisms responsible for such

blooms (eg. Microcystis) can produce toxins that inhibit the growth of other competing and predatory
species, and can thus strongly shape the resultant ecosystem function.
My goal in this project is twofold: 1) to determine whether there is a significant effect of species
richness on rates of oxygen evolution (an ecosystem function), and if so, to partition out the
contributions of complimentarity and selection effect. My second goal 2) was to describe the
phylogenetic architecture of a naturally‐assembled community and search for general patterns in its
average relatedness across a coarse temporal and light/oxygen gradient.
Methods
Experiment
I obtained 10 isolate species of common freshwater cyanobacteria from Carolina Biological
Supply (fig. 1). These isolates were diluted to an OD650 of 0.1 and added to 25ml flasks in combinations
of 1, 3, 6, and 9 species (fig. 2). Before inoculation into communities, I used a Cary 50 UV‐vis
spectrophotometer to measure the absorbance spectra from 300 – 800 nm (the visible spectrum) for
each species. I then identified significant peaks in each absorbance spectra corresponding to a particular
arrangement of the chlorophyll pigments and associated carotenoids (fig. 3). I used the pairwise
differences between species absorbance peaks binned within 400‐500, 500‐650, and 650‐800nm to
make predictions about niche complementarity effects for species in polyculture. That is, all else being
equal, the combination of species with the greatest differences between absorbance peaks should show
the greatest increase in yield compared to monoculture. To predict when the selection effect might
contribute to ecosystem function, I identified species with the greatest yield (gross photosynthetic rates)
in monoculture (fig. 4). These species, when added to a community, should exert a strong relative effect
on ecosystem function compared to systems where those species are absent.
The species pools were randomized and nested for each treatment (table 1). For example, for
example, treatment 1‐1 included 25ml of only one species, Cylindrospermum sp.. Treatment 1‐3
included 8.3 ml of Cylindrospermum and the same amount of two other randomly‐chosen species.
Treatment 1‐6 and 1‐9 added species accordingly, keeping the relative abundances of all species initially
equal. These microcosms were incubated on a shaker in a 25° C incubator with a 16/8 hour light/dark
cycle. I inoculated the cultures with BG‐11 medium.
After a one‐week acclimation period, I began measuring the photosynthetic rates of each
artificially‐assembled community. To accomplish this, I used the Unisense MicOx microrespiration
system. This technique makes use of a microelectrode sensor inserted into an airtight 4ml respiration
chamber to measure the concentration of dissolved oxygen in a sample. Exactly 3ml of each community
were added to these chambers, submerged in a 25° C water bath wallpapered with tinfoil, briefly stirred,
given 1ml fresh medium. These communities were placed under a 100W halogen lightbulb and given 24
hours to acclimate before measurements were taken.
I measured the gross photosynthetic rate using the light‐dark method. Briefly, it involves placing
a dark box over the respiration chamber, blocking out all light. After 30 minutes of dark, I removed the
box, returning light to the samples. The difference in slope between the dark O2 concentration (uM/l),
and the light concentration (respiration + gross photosynthesis) equals the gross photosynthetic rate (in
nM O2 hr‐1). I fit both hyperbolic and linear regression functions to the average gross photosynthesis
rates. The explanatory variable was richness treatments (1, 3, 6, and 9). I selected the best‐fit model
using Akaike’s information criterion (AIC).
Community phylogenetics
I used the 454 16s amplicon library collected from Sippewissett salt marsh microbial mat in the
2010 course. These samples represented young and old mats and were divided among layers

corresponding to depth. I used the QIIME software suite and the R statistical computing package to
analyze all data. I began by selecting OTUs from both young and old mats at 97% percent identity using
the uclust algorithm. Next, I searched for and eliminated potential chimeric sequences using
ChimeraSlayer. I assigned taxonomic identity using the Ribosomal Database Projects 16s database. From
this set, I extracted sequences belonging to members of the phylum Cyanobacteria for further analysis.
This reduced set of sequences were aligned to the Greengenes 16s gold reference database using
PyNAST. I used these aligned sequences to build maximum‐likelihood trees in RAxML for each mat’s
cyanobacterial community. I also constructed a presence/absence matrix for each cyanobacteria OTU
per layer of each mat.
In R, I calculated the total distance matrices for all OTUs within each mat’s phylogeny.
Additionally, I pruned each phylogeny to include only those OTUs that were present within a particular
layer. This gave me 5 distance matrices for the young mat (total, NM1, NM2, NM3, and NM4 layers) and
old mat (total, green, pink, brown, sand layers). For each of these trees, I calculated the mean
phylogenetic distances (MPD) and mean nearest taxon distances (MNTD). Briefly, the MPD measure the
average distance between 16s sequences for all species represented in a particular community. MPD
decreases with increased phylogenetic clustering. MNTD is a slightly different metric which measures
the mean distance from any OTU to its nearest neighbor OTU. Because phylogenetic signal (i.e.
overdispersion or clustering) can manifest in a number of ways, it is important to take a
multidimensional approach incorporating a number of informative metrics.
Once each observed MPD and MNTD value was calculated for each mat layer, I used a null‐
model approach to determine the phylogenetic structure of the community. This involves building a null
distribution of MPD and MNTD values for a community phylogeny where the terminal branches have
been randomly reshuffled. These reshuffled tip labels can either be sampled from the local phylogeny

(each mat layer) or the regional phylogeny (the entire mat phylogeny). The significance of an observed
MPD/MNTD value can then be found from its Z‐value with the equation
.
Multiplying this value by ‐1 gives the net relatedness/nearest taxon indices (NRI & NTI) which can be
used to describe the phylogenetic structure of the sample community. If the NRI is greater than 1.96
(corresponding to α = 0.05), it suggests that the local community is significantly phylogenetically
clustered. If the value is less than ‐1.96, it is overdispersed. If it lies between these values, the
phylogenetic structure is random.
Results
Experiment
The light‐dark method appeared to work quite well for estimating gross photosynthetic rates.
Linear models fit the data very well and the confidence intervals around slopes were quite small. In a
monoculture, two species had gross photosynthetic rates that were outliers from the rest: Anabaena
and Microcystis (fig. 3). Additionally, comparisons of spectral absorbance peaks indicated that Lyngbia,
Merismopedia, and Gloeotrichia had absorbance spectra that were outliers from the rest of the species
pool (fig. 2).
A linear model best approximated the relationship between species richness and net
productivity, however when compared to an intercept‐only model (analogous to Ho in a null‐hypothesis
framework), there was no significant decrease in AIC value (ΔAIC = 2), indicating that there was no
apparent relationship between productivity and diversity in this experiment (fig. 4). A Wald test verified

this finding. Because there was no relationship between diversity and productivity, I could not use Price
equation to partition the differences into selection and niche complimentarity effects. This dearth of
significance does not necessarily indicate such a relationship does not exist, but more data, standardized
measurement procedures, replication, and a longer acclimation period are required to thoroughly test
these predictions. It is noteworthy that while nonsignificant, the slope of the diversity‐gross
photosynthesis relationship is positive. Furthermore, I anticipated that since the 9‐species treatments
share the most taxa, their rates of gross photosynthesis would be more similar to each other than the
other treatments. This pattern did not manifest, however, and the variance for the 9‐species treatments
was greater than both the one and six‐species communities.
I also calculated the differences in gross photosynthetic rates between two treatments (figs 5 &
6). It is interesting to note that this measure generally appears to increase with the addition of two
species to a monoculture and from six to nine species, but is negative for the three‐to‐six species
treatments.
Community phylogenetics
The net relatedness and nearest taxon indices were significantly positive for the green portions
of young and old mats (figs 8 & 9), indicating phylogenetic clustering. Additionally, there was evidence
for phylogenetic clustering in the second (pink) layer of the young mat, and evidence for phylogenetic
overdispersion in the brown layer of the young mat (figs 10 & 11). The other mat layers (sand layer in
young and old mats, pink layer in old mat, and brown layer in old mat) had phylogenies that were
distributed randomly.

Discussion
A lack of effect in the biodiversity‐ecosystem function experiment may have resulted from a lack
of appropriate replication and stratification. One potential explanation for these patterns, if they are
unbiased, would be a strong degree of contingency in community assembly. This would be the case if,
for example, the photosynthetic rate (or biomass) of species X was facilitated by the presence of species
Y and suppressed by the presence of species Z.
The phylogenetic pattern of coexisting cyanobacterial taxa within mat layers showed striking
patterns. If we assume that within the cyanobacteria, access to light and oxygen (hence, depth in the
sand) represents the major niche axis on which competition occurs, then it might be expected that
genes which code for these traits are conserved within a lineage. Thus, given a particular set of abiotic
conditions, phylogenetic clustering should signify environmental filtering from the regional pool of
species (here, the entire mat). The green layer of the young Sippewissett mat had twice the number of
OTUs as the second highest layer, and the old green layer had 3 times as many OTUs. This suggests that
the optimal niche for the cyanobacteria is in the oxygen & light saturated zone. There was no evidence
for phylogenetic clustering beyond this layer of the mat, with the exception of the pink layer in the
young mat. Further analysis should determine to what extent the species pool of the consecutive layers
are nested subsets of the higher layers. If this is the case, then it implies that species are being lost in a
nonrandom way, since with random species loss, clustering would also manifest at lower levels. If these
communities are nested with depth, they are losing more closely‐related taxa than would be expected
by chance. This might imply that the incidence of competitive exclusion increases with shrinking niche
space (in terms of O2 and light availability).
Temporally, the phylogenetic structure of the mat’s green layer appears stable (clustered).
Regrettably, I do not have metadata describing the estimated age of the mat, and while it could be
considered “younger” than the old mat, a taxonomic investigation of the mat’s phylogenetic signal at a
greater temporal resolution would be invaluable for discerning patterns of community assembly and
potentially the effects of contingency in recruitment to the mat.
Acknowledgements
I would like to thank my wonderful classmates, TA’s and professors for six weeks’ worth of stimulating
conversation and entertainment. I could not imagine spending this time with any other subset of the
regional scientist pool. Among those who significantly inspired the ideas in this paper were Chunck P.,
Libusha K., Ryan R., David V., Jen G., Leah B., Ashley S., Otto C., Emil R., and J. Overmann.
Literature Cited Balvanera P, Pfisterer AB, Buchmann N, He JS, Nakashizuka T, Raffaelli D, Schmid B. 2006. Quantifyin the
evidence for biodiversity effects on ecosystem functioning and services. Ecology letters 9: 1146‐1156.
Loreau M, Hector A. 2001. Partitioning selection and complementarity in biodiversity experiments. Nature 412: 72‐76.
Stomp M, Huisman J, de Jongh F, Veraart AJ, Gerla D, Rijkeboer M, Ibelings BW, Wollenzein UIA, Stal LJ. 2004. Adaptive divergence in pigment composition promotes phytoplankton biodiversity. Nature 432: 104‐107.
Vamosi SM, Heard SB, Vamosi JC, Webb CO. 2009. Emergint patterns in the comparative analysis of phylogenetic community structure. Molecular Ecology 18: 572‐592.
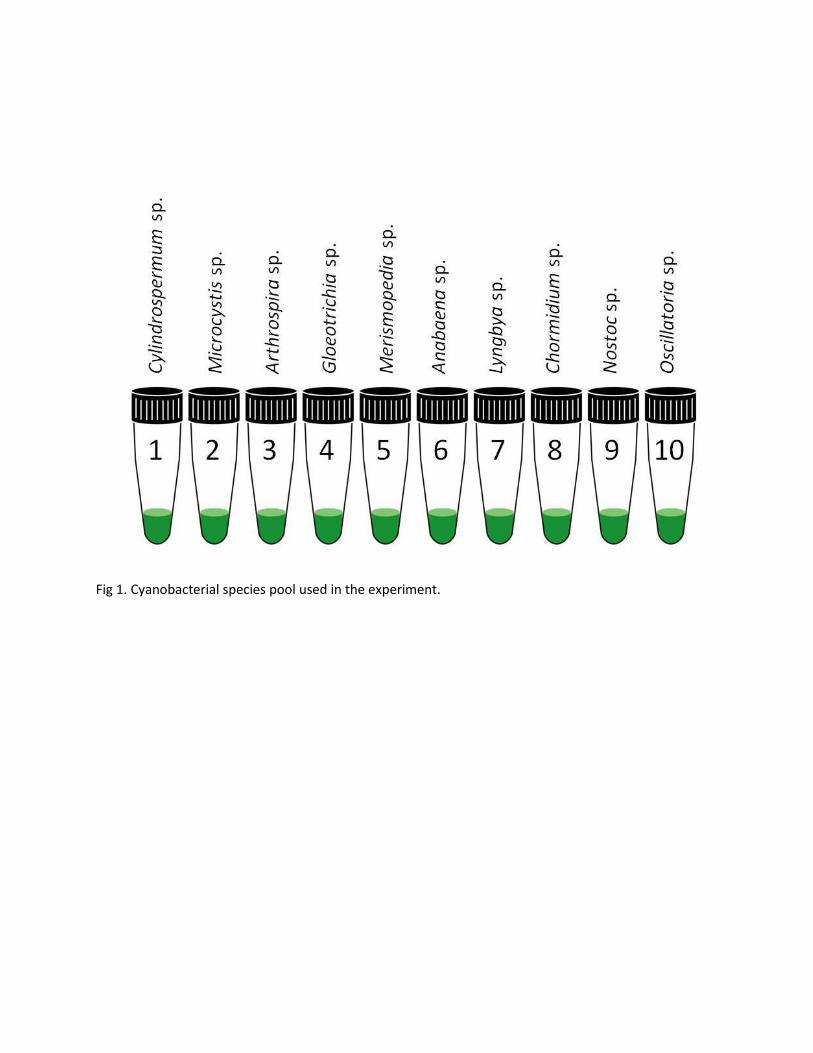
Fig 1. Cyanobacterial species pool used in the experiment.

Table 1. Matrix of experimental design. 1’s indicate the species is present in the community. Trial Species sp_1 sp_2 sp_3 sp_4 sp_5 sp_6 sp_7 sp_8 sp_9 sp_10
1 1 1 0 0 0 0 0 0 0 0 0 1 3 1 0 0 1 0 0 0 0 1 0 1 6 1 1 1 1 0 1 0 0 1 0 1 9 1 1 1 1 1 1 1 1 1 0
2 1 0 1 0 0 0 0 0 0 0 0 2 3 0 1 0 1 0 0 1 0 0 0 2 6 0 1 0 1 1 0 1 1 1 0 2 9 0 1 1 1 1 1 1 1 1 1
3 1 0 0 1 0 0 0 0 0 0 0 3 3 0 0 1 0 0 1 0 0 1 0 3 6 1 0 1 0 0 1 1 0 1 1 3 9 1 0 1 1 1 1 1 1 1 1
4 1 0 0 0 1 0 0 0 0 0 0 4 3 0 0 0 1 0 1 0 1 0 0 4 6 1 0 0 1 1 1 0 1 1 0
4 9 1 1 0 1 1 1 1 1 1 1
5 1 0 0 0 0 1 0 0 0 0 0 5 3 1 1 0 0 1 0 0 0 0 0 5 6 1 1 1 0 1 0 0 0 1 1 5 9 1 1 1 0 1 1 1 1 1 1
6 1 0 0 0 0 0 1 0 0 0 0 6 3 0 0 0 1 0 1 0 0 0 1 6 6 0 0 1 1 0 1 0 1 1 1 6 9 1 1 1 1 0 1 1 1 1 1
7 1 0 0 0 0 0 0 1 0 0 0 7 3 1 0 0 0 0 0 1 1 0 0 7 6 1 0 1 0 0 0 1 1 1 1 7 9 1 1 1 1 1 0 1 1 1 1
8 1 0 0 0 0 0 0 0 1 0 0 8 3 1 0 0 0 0 0 0 1 0 1 8 6 1 0 1 1 0 1 0 1 0 1 8 9 1 1 1 1 1 1 0 1 1 1
9 1 0 0 0 0 0 0 0 0 1 0 9 3 0 0 1 0 0 0 0 0 1 1 9 6 1 0 1 1 0 0 1 0 1 1
9 9 1 1 1 1 1 1 1 0 1 1
10 1 0 0 0 0 0 0 0 0 0 1 10 3 0 1 0 0 0 0 1 0 0 1 10 6 0 1 0 0 1 1 1 1 0 1 10 9 1 1 1 1 1 1 1 1 0 1

sp_1sp_2sp_3sp_4sp_5sp_6sp_7sp_8sp_9sp_10
sp_1sp_2sp_3sp_4sp_5sp_6sp_7sp_8sp_9sp_10
sp_1sp_2sp_3sp_4sp_5sp_6sp_7sp_8sp_9sp_10
1
2
3
450 500 550 600 650
Fig 2. Location of absorbance peaks for a particular species. X axis is wavelength (nm).

Fig 3. Gross photosynthetic rates for species in monoculture. Ranked from highest to lowest.
Fig 4. The (lack of) relationship between cyanobacterial richness and gross photosynthetic rate.

Fig 5. Difference in gross photosynthetic rates between richness treatments. For example, treatment 1, the three‐species community had a gross photosynthetic rate ~ 900 nmol/hr greater than the 1 species community. Bracketed numbers indicate which species were added to the community.

Fig 6. Differences in net photosynthetic rates between species additions 1‐3, 3‐6, and 6‐9.
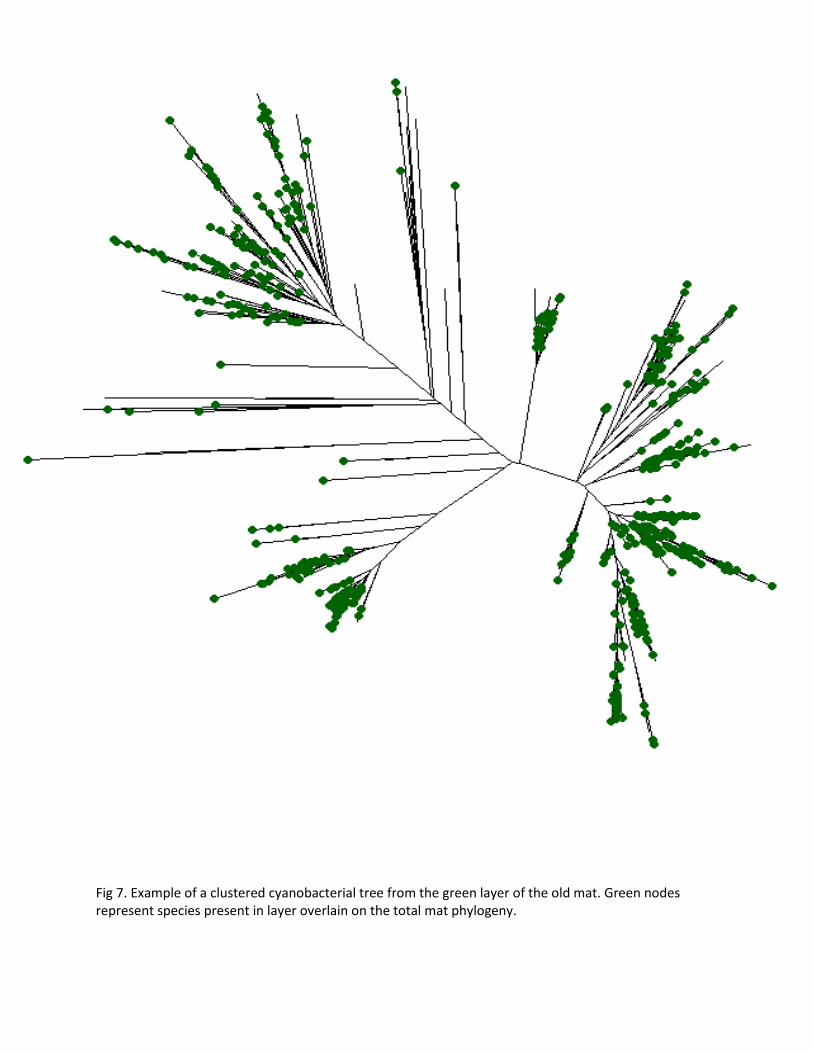
Fig 7. Example of a clustered cyanobacterial tree from the green layer of the old mat. Green nodes represent species present in layer overlain on the total mat phylogeny.

Fig 8. Net relatedness index for the young mat. Gray dashed lines indicate+/‐ 1.96 cutoff for significant clustering or overdispersion.
Fig 9. Net relatedness index for the old mat. Gray dashed lines indicate+/‐ 1.96 cutoff for significant clustering or overdispersion.

Fig 10. Nearest taxon index for the young mat. Gray dashed lines indicate+/‐ 1.96 cutoff for significant clustering or overdispersion.
Fig 11. Nearest taxon index for the young mat. Gray dashed lines indicate+/‐ 1.96 cutoff for significant clustering or overdispersion.