
ECOLOGICAL FOOTPRINT OF SLEAT - uni-flensburg.de · especially Rab Lees, and the Sleat Community...
96
Transcript of ECOLOGICAL FOOTPRINT OF SLEAT - uni-flensburg.de · especially Rab Lees, and the Sleat Community...


Ecological Footprint of Sleat II
ECOLOGICAL FOOTPRINT OF SLEAT
PROJECT TEAM
Anita Bohara A.B.M. Aminul Islam
Dechen Dema Diliza Nyasulu
Elena Simeonova Engila Maharjan Mishra
Fumi Harahap Harriet Zulu
Khetsiwe Khumalo Kevo Luc Tossou Marcela Umaña
SUPERVISORS
Dr. Dieter Klein Dipl.-Ing. Wulf Boie
International Class 2008

Ecological Footprint of Sleat III
March, 2008
Acknowledgement In carrying out this study we received support of various forms from many individuals and
organizations. We thus would like to heartily express our gratitude for all this support extended to
us in terms of organization, making contacts and providing the necessary information to prepare
this report.
Our sincere thanks go to the Highlands and Islands Community Energy Company (HICEC),
especially Rab Lees, and the Sleat Community Trust (SCT) for whom this study was done, for
initiating and supporting us during the research.
The HIE Community Land Unit, Highland Council, Highlands and Islands Enterprise and Clan
Donald Estate are all appreciated for providing vital pieces of information needed for this study
through their presentations and our meetings and discussions with them.
We extend special thanks to Donald MacGregor and Angus Robertson (Sleat Renewables Ltd) for
their friendly cooperation and in coordinating the various institutions and individuals who were
involved in the study.
Special thanks go to Henry Mains (SCT) for his caring friendliness and tireless effort to help us in
every possible way to make our research easier.
Our gratitude goes also to the Gaellic College “Sabhal Mor Ostaig” and its staffs for the support
and the facilities provided to us during our study.
We express our appreciation to the people of Sleat for their warm welcome, assistance in our field
research and the opportunity given to explore the culture of this region. Without them this study
would not have been completed.
Our sincere heartfelt gratitude is extended to all who made our stay in Sleat a memorable one.
The research team is very grateful to our supervisors from the University of Flensburg, Dipl.Ing.
Wulf Boie and Dr. Dieter Klein for their support, academic guidance and patience before and
during the study.

Ecological Footprint of Sleat IV
Last but not the least, we greatly recognize and thank the Deutscher Akademischer Austausch
Dienst (DAAD, German Academic Exchange Service), for its financial support which allowed us to
do this International Class 2008.
Ecological Footprint of Sleat V
EXECUTIVE SUMMARY The ecological footprint of Sleat Peninsula was conducted by SESAM students from the University
of Flensburg (Germany) in coordination with the Highland and Island Community Energy
Company (HICEC) and the Sleat Community Trust (SCT). The aim of the study was to determine
the ecological footprint of Sleat Peninsula and develop and assess alternative scenarios towards
sustainability.
The ecological footprint is a sustainability indicator, which expresses the relationship between
humans and the natural environment. The ecological footprint accounts the use of natural
resources by a region's population. It considers the amount of productive land and water
ecosystems in hectares with an average global biocapacity (gha) that Sleat requires to provide the
goods and services that it consumes and to assimilate the wastes that it produces.
This study also emphasised on the CO2 emissions (Carbon footprint). It focused on direct energy,
water, transportation, material, waste and food. The following were the findings of the study:
Ecological Footprint
The total ecological footprint for Sleat in 2007 was 4,927.49 gha which translates to 5.82 gha
per capita.
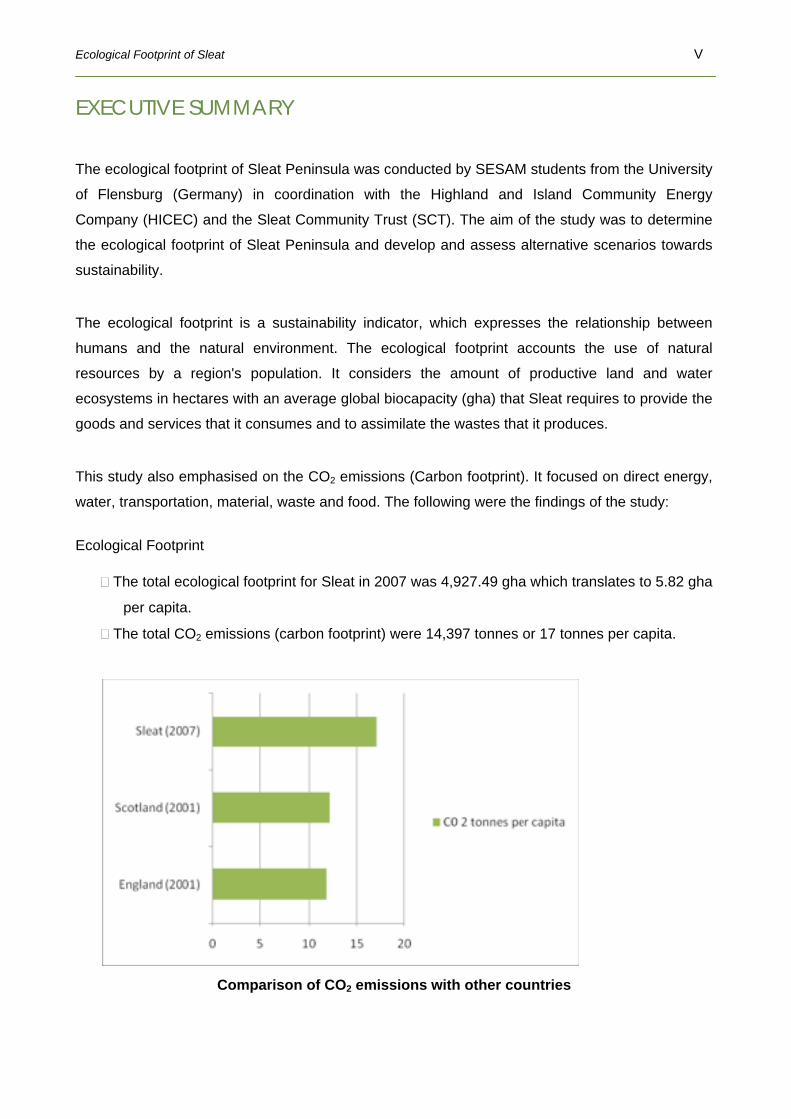
The total CO2 emissions (carbon footprint) were 14,397 tonnes or 17 tonnes per capita.
Comparison of CO2 emissions with other countries

Ecological Footprint of Sleat VI
The figure compares CO2 emissions of Sleat with that of Scotland and England 2001.
Direct energy
The total consumption of direct energy was 16.6 GWh of direct energy.
The annual CO2 emissions from direct energy use were 4,283 tonnes.
The ecological footprint for direct energy was 971 gha (1.147 gha per capita)
Water
The total water consumption was 130.10 mega litres.
The energy required to supply and treat waste water was 168,730 kWh
The total CO2 emissions from water supply were 72.10 tonnes (0.085 tonnes per capita).
The ecological footprint of water supply was 15.39 gha (0.02 per capita)
Transportation
The total kilometers travelled by car, public transport and air were over 14 million.
The total CO2 emissions from transportation were 4,044 tonnes (4.77 tonnes per capita).
The ecological footprint of transport was 1,330 gha (1.57 gha per capita).
Material
The CO2 emissions from material were 4,511 tonnes (5.3 tonnes per capita).
The total material ecological footprint was 970 gha (1.15 gha per capita).
Waste
The total waste generated was 475 tonnes.
The CO2 emissions from waste were 837 tonnes (0.99 tonnes per capita).
The total ecological footprint of waste was 764 gha (0.90 gha per capita).
Food
The total food consumption was 483 tonnes
The CO2 emissions from food were 650 tonnes (0.77 tonnes per capita).
The ecological footprint for food was 1,033 gha (1.03 gha per capita)
Several scenarios were developed to show the impacts of future options on ecological and carbon
footprint. The next below shows the summarized impacts of these scenarios.

Ecological Footprint of Sleat VII
Summary Impacts of Scenarios Scenario CO2 saving (tonnes) Carbon footprint reduction (%)
Direct Energy Biomass Heating for college and part of residential homes 485 11% of total energy footprint
Small Embedded Generation from wind energy 113 3% of total energy footprint
Transportation Car Sharing 4 people 1,110 27% of total transport footprint Car Sharing 3 people 986 24% of total transport footprint Car Sharing 2 people 740 18% of total transport footprint Better shopping and service facilities in Sleat 145 4% of total transport footprint
Fuel switch to LPG for cars which travel more than 35,000 km per year
219 5% of total transport footprint
Waste Highland Targets of waste management (13% composting, 23 % recycling, 27% waste to energy)
140 17% of total waste footprint
Centralized Composting Plant 171 20% of total waste footprint Source: SESAM, 2008
A scenario with a wind farm of 5 MW capacity was simulated to see its benefits in CO2 savings.
However, due to the responsibility principle of the study, the CO2 savings are shared among all
users of electricity. This gives minimal savings when distributed to all users. If the CO2 saving is
attributed to Sleat residents, the carbon footprint can be reduced substantially. The above
scenarios illustrate the potential of different options for reducing the ecological and carbon footprint
of Sleat. They represent only a certain set of options that aim to include some of the most feasible
in both short and medium term solution.
As the ecological footprint is a useful indicator and monitoring tool to measure the progress of the
community towards sustainability over time, it can be used to raise awareness among the
members of the community on the impacts of their consumption.

Ecological Footprint of Sleat VIII

Ecological Footprint of Sleat IX
TABLE OF CONTENT
CHAPTER 1: INTRODUCTION……………………………………………………………………... 1
CHAPTER 2: ECOLOGICAL FOOTPRINT……………………………………………………….. 2
2.1. Calculation Methods………………………………………………………………………… 7
2.2. Boundaries…………………………………………………............................................... 8
2.3. Double Counting………………………………………….………………………………….. 9
CHAPTER 3: METHODOLOGY OF THE STUDY…………………..…………………………… 10
3.1. Approach And Methods……………………………………………….……………………. 10
3.2. Defining Boundaries………………………….……………………….……………………. 10
3.3. Data Collection…………………………………………………….………………………... 12
3.4. Major Assumptions And Limitations……………………………………………….……… 13
3.5. Biocapacity…………………………………………………….…………………..………… 13
3.6. Categories……………………………………………….……………………………………… 15
3.6.1. Direct Energy……………………………………………….…………………………. 15
3.6.2. Water……………………………………………….…………………………………... 16
3.6.3. Transportation……………………………………………….………………………... 17
3.6.4. Material And Waste……………………………………………….………………….. 18
3.6.5. Food……………………………………………………………….……………………. 20
3.6.6 Built Land..……………………………………………….……………………………... 20
CHAPTER 4: CURRENT SITUATION...................................................................................... 21
4.1. Sectors……………………………………………….………………………………………. 21
4.1.1. Residential Sector……………………………………………….……………………. 21
4.1.2. Public Sector……………………………………………….………………………….. 21
4.1.3. Commercial Sector…………………..………………………….……………………. 21
4.1.4. Agriculture And Forestry…………………….………………….……………………. 22
4.2. Categories……………………………………………….…………………………………... 22
4.2.1. Direct Energy……………………………………………….…………………………. 22
4.2.2. Water……………………………………………….…………………………………... 22
4.2.3. Transportation……………………………………………….……………………….... 22
4.2.4. Waste……………………………………………….………………………………….. 23
4.2.5. Food……………………………………………….……………………………………. 23
Ecological Footprint of Sleat X
CHAPTER 5: RESULTS OF THE STUDY................................................................................. 24
5.1. Biocapacity…………………………………………………….……………………..………. 24
5.2. Total Ecological Footprint…………………………………………….……………………. 24
5.3. Direct Energy…………………………………………………….…….……………………. 26
5.4. Water……………………………………………….………………………………………… 29
5.5. Transportation………………………………………………………….……………………. 30
5.6. Material…………………………………………………….………………...………………. 34
5.7. Waste…………………………………………………….…………………………..………. 36
5.8. Food……………………………………………….…………………………………………. 38
CHAPTER 6: SUSTAINABILITY ASSESSMENT..................................................................... 42
CHAPTER 7: ALTERNATIVE SCENARIO DEVELOPMENT.................................................... 45
7.1. Direct Energy……………………………………………….……………………………….. 45
7.1.1. Biomass Heating Scenario…………………………………….……………………... 46
7.1.2. Wind Energy For Electricity Generation…………………………………………….. 47
7.1.3. Energy Efficiency……………………………………………….……………………... 48
7.2. Transportation……………………………………………….………………………………. 49
7.3. Waste Management……………………………………………….……………………….. 50
CHAPTER 8: CONCLUSIONS.................................................................................................. 52
GLOSSARY.............................................................................................................................. 53
REFERENCES......................................................................................................................... 55
ANNEXES................................................................................................................................ 56
ANNEX 1 QUESTIONNAIRES................................................................................................. 56
Annex 1.1 Household Brief Questionnaire……………………………………………….………... 56
Annex 1.2 Household Extended Questionnaire ……………………………………….…………. 57
Annex 1.3 Hotels Brief Questionnaire………………………………….…….……………………. 61
Annex 1.4 Small Businesses Brief Questionnaire……………………………………..…………. 63
Annex 1.5 College Brief Questionnaire……………………………………………….…………… 64
Annex 1.6 Schools Brief Questionnaire……………………………………………….……..……. 67
Annex 1.7 Medical Center Brief Questionnaire…………………………………………………... 69
ANNEX 2. FORMULAS USED IN THIS REPORT.................................................................. 71

Ecological Footprint of Sleat XI
ANNEX 3. CONVERSION TABLES........................................................................................ 74 ANNEX 4. SUMMARY CALCULATION.................................................................................. 76
Annex 4.1 Material Footprint Calculation……………………………………………….…………. 76
Annex 4.2 Waste Footprint Calculation……………………………………………….………….... 77
Annex 4.3 Food Footprint Calculation………………………………………….………………….. 78
Annex 4.4 Transportation Footprint Calculation……………………………………………….….. 79
Annex 4.5 Biocapacity Calculation…………………………………………………………………. 80
Annex 4.6 Energy Calculation……………………………………………….…………..…………. 81
LIST OF ABBREVIATIONS CFL : Compact Florescent Lamp
CO2 : Carbon Dioxide
DEFRA : Department for Environment, Food and Rural Affairs
ECIP : European Common Indicator Programme
EFW : Energy from waste
EF : Ecological Footprint
GEMIS : Total Emission Model of Integrated Systems
GIS : Geographic Information
HICEC : Highland and Islands Community Energy Company
IEA : International Energy Agency
IPCC : International Panel for Climate Change
LPG : Liquid Petroleum Gas
MSW : Municipal Solid Waste
RCV : Refuse Collection Vehicle
SCT : Sleat Community Trust
SEPA : Scottish Environment Protection Agency
SESAM : Sustainable Energy System and Management
SMO : Sabhal Mor Ostaig
WWF : World Wide Fund for Nature
UK : United Kingdom
LIST OF UNITS t : tonnes

Ecological Footprint of Sleat XII
m2 : Square meter
MJ : Mega Joule
l : Litre
gha : Global hectare
ha : Hectare
KJ : Kilo Joule
Km : Kilometer
KWh : Kilowatt hour
LIST OF TABLES Table 2.1 Example: Sheep rearing on 1 ha pasture land in Scotland…………………………. 5
Table 2.2 Example for boundary issues……………………………………………….………….. 8
Table 3.1 Categories Included and Not Included in the Study………………………………….. 11
Table 3.2 List of Data Sources……………………………………………….…………..………… 12
Table 3.3 Conversion Factor and CO2 Emission Factor………………………………………… 15
Table 3.4 Waste Production per capita from Different Sources……………………………….... 19
Table 5.1 Total Direct Energy Consumption and CO2 Emissions According to Fuel Type….. 27
Table 5.2 Total Direct Energy Consumption and Ecological Footprint …...…………………… 28
Table 5.3 Energy Consumption for Water and CO2 emissions………………………….……… 29
Table 5.4 Comparison of Scotland and Sleat passenger km per capita……………………….. 31
Table 5.5 CO2 Emissions by Transportation Mode………………………………………………. 32
Table 5.6 Transport Footprint by Sector……………………………………………….………….. 33
Table 5.7 Footprint and CO2 emissions by Material Categories………………………………... 35
Table 5.8 Waste Composition for Sleat in 2007…….………………………………………….…. 36
Table 5.9 Food consumption profile of Sleat residents in 2007……….………………………. 38
Table 5.10 Food Consumption Profile of Sleat and other Regions……………………………... 40
Table 7.1 Biomass Heating Scenario……………………………………………….……………… 46
Table 7.2 Small Embedded Wind Generation Scenario…………………………………………. 48
Table 7.3 Energy Efficiency Scenarios……………………………………………….……………. 48
Table 7.4 Transport Footprint Development Scenarios………………………………………….. 49
Table 7.5 Summary of impact reduction options…………………….…….…………..…………. 50
LIST OF FIGURES Figure 2.1 World Ecological Footprint 2003……………………………………………….………. 6
Figure 2.2 Ecological Footprint of Selected Countries (2001) ………………………………….. 7
Figure 5.1 Types of Land in Sleat……………………………………………….…………..……... 24

Ecological Footprint of Sleat XIII
Figure 5.2 Ecological Footprint by Categories ……………………………………………….…... 25
Figure 5.3 Ecological Footprint by Land Types………………………………………………...…. 25
Figure 5.4 CO2 Emissions (tonnes) according to the categories ………………………………. 26
Figure 5.5 Comparison of direct energy footprint with other studies…………………………… 27
Figure 5.6 Percentage Share of Direct Energy Footprint by Sector……………………………. 28
Figure 5.7 Percentage Share of Direct Energy Footprint by Fuel Type ……………………….. 29
Figure 5.8 Water Footprint (gha) ……………………………………………….…………..……… 30
Figure 5.9 Passenger km by Transport Mode……………………………………………….……. 31
Figure 5.10 Purpose of Vehicle Use……………………………………………….…………..…... 32
Figure 5.11 Comparison of Sleat Transport Footprint with Other Studies……………………... 33
Figure 5.12 Comparison material and waste……………………………………………….……... 34
Figure 5.13 Material Ecological Footprint by Sector……………………....…………..…………. 35
Figure 5.14 Recycling Rates in the Highland Area……………………………………………….. 37
Figure 5.15 Waste Ecological Footprint for Sleat Residential and Commercial/Public Sectors.. 37
Figure 5.16 Items Waste Footprint ……………………………………………….…………..……. 38
Figure 5.17 Food Ecological Footprint for Sleat Residents and Tourists………………………. 40
Figure 5.18 Comparison with Other Footprint Studies…………………………………………… 40
Figure 6.1 Sleat´S Ecological Footprint Compared With National Biocapacity and Global
Earthshare……………………………………………….…………..……………..…. 43
Figure 6.2 Comparison of Total Ecological Footprint with Other Studies (gha/capita) ………. 43
Figure 7.1 Comparison of CO2 Emissions From Direct Energy Consumption In Base Case And
Alternative Scenarios (Transport Not Included) ………………………….……….. 45

Ecological Footprint of Sleat 1
Background of the study The Sleat peninsula comprises of the south
eastern tip of the Isle of Skye in the Highland
council area of Scotland. The population of
Sleat in 2007 was 847 with 378 households1.
The Sleat Community Trust (SCT) was set up
in September 2003. The main objective of the
Trust is to identify the needs and aspirations
of local residents and lead the sustainable
regeneration of the community2.
There are several Trust’ projects in progress
which include woodchip supply company, and
community wind energy development. The
Trust was interested to find out the impacts of
the community’s current energy consumption
and related CO2 emissions on the environment as well as the contribution of their projects to
overall sustainability.
The Trust contacted the Highland and Islands Community Energy Company (HICEC) for
assistance in conducting the ecological footprint study with emphasis on the Carbon footprint.
Apart from determining the ecological footprint of the Sleat peninsula, the objective of the study
was to develop and assess alternatives scenarios towards sustainability.
On invitation by HICEC, the study was done by students of the department of Sustainable Energy Systems and Management (SESAM) of the University of Flensburg, Germany in collaboration with the Sleat Community Trust. The SESAM students conducted the study from 16 February to 19
1 Adapted from Sleat Community Trust, 2005, p.5
2 www.sleatcommunitytrust.co.uk, printed on 10.03.2008
CHAPTER 1: INTRODUCTION
Camus Croise
Duisdale
Teangue Toravaig
Saasaig
Kilmore
KilbegSabhal mor Ostaig
Armadale
Ardvasar
Ord
Tarskavaig
Achnacloich
Broadford
MAP OF SLEAT PENINSULA

Ecological Footprint of Sleat 2
March, 2008.
The ecological footprint is a sustainability indicator, which expresses the relationship between
humans and their natural environment. The Ecological Footprint (EF) is a resource accounting tool,
like a bank statement, that tell us on one hand how many resources do we have and on the other
hand how many of these resources do we use. That means on one hand we have our capital
which is our ecological assets and on the other hand is our expenditure (our production and
consumption). The ecological footprint then helps us to see to what extent we are dipping to the
overall capital or to what extent we are living within the means that nature provides us. “The
Ecological Footprint account documents how much of the annual regenerative capacity of the
biosphere, expressed in mutually exclusive hectares of biologically productive land or sea area, is
required to renew the resource throughput of a defined population in a given year, with the
prevailing technology and resource management of that year”3.
The largest share of the ecological footprint is caused by direct and indirect energy consumption,
also known by most people as the carbon footprint. Carbon footprint has become a widely used
term and concept in many public debates and is mainly associated with the threat of global climate
change. Though widely used there is still some confusion on what it really means and what it
measures and what unit is to be used4. Without a well defined methodology this makes carbon
footprint almost impossible to compare as it is still not clear on what to include and exclude with
such an approach.
The Global Footprint Network5 interprets the Carbon footprint as a synonym for the 'fossil fuel
footprint' or the demand on 'CO2 area' or 'CO2 land',where CO2 land6 refers to the land (mainly
forest land) needed to absorb that fraction of fossil CO2 that is not absorbed by the ocean.
3 Wackernagel et al, 2005, p. 4
4 Wiedmann et al 2007, p. 2
5 Global footprint network is an organization which is in forefront of Ecological footprint.
6 http://www.footprintnetwork.org/gfn_sub.php?content=glossary, printed on 10.03.2008
CHAPTER 2: ECOLOGICAL FOOTPRINT
Ecological Footprint of Sleat 3
Wiedmann (2007) defines carbon footprint as “a measure of the exclusive total amount of carbon
dioxide emissions that is directly and indirectly caused by an activity or is accumulated over the life
stages of a product”7. This definition is widely compatible with the well defined ecological footprint
methodology. Wiedmann proposes to express the carbon footprint in tonnes of CO2. In our study
we expressed the carbon footprint in both, global hectares and tonnes of CO2.
The methodological approach of the ecological footprint has been well defined and developed with
clear standards over the past decade. Moreover the ecological footprint is broader, than a pure
carbon footprint and gives a holistic picture of humanity’s demands on the biosphere. Rather than
concentrating only on the land needed to sequester CO2, the ecological footprint goes much further
in considering the total land area much essential for human survival.
The basic understanding behind the concept of the ecological footprint is that the Earth’s land area
is of an absolute and limited magnitude, whereas the number of human beings is increasing, as
well as the use of land associated with all human activities. All human activities require the use of
land, primarily biologically productive land, on both local and global levels. Therefore rather than
asking how many people the earth can support, the footprint analysis ask how much land is
needed to support humanity8. Biologically productive land provides the majority of the earth’s
biomass and concentrates the bulk of the biosphere’s regenerative capacity. In 2003 this land was
estimated to be only 11.2 billion hectares or roughly one quarter of the earth’s surface. Where
arable land is only 10%, forest and woodlands are 33%, pasture land is 23% and build land
constitute only 2%. The remaining surface area consists of lower productivity categories including
deserts, polar ice caps, and deep oceans, which is about 32%.9
Hence, to calculate the ecological footprint, the land and sea area of a community or nation is
divided into different basic types10; these are:
1. Bioproductive land; this is land required to produce crops, grazing (pasture), timber (forest)
etc. The use of these land types is usually calculated separately, using the following three sub-
categories:
a) Arable or crop land
b) Pasture land
7 Ibid p.4
8 Wackernagel et al (2000), p. 60
9 Wackernagel et al, ( 2005) p. 8
10 Chambers et al. 2000, p.62

Ecological Footprint of Sleat 4
c) Forested land
2. Bioproductive sea and inland space; area
required to supply fish and seafood.
3. Built land; this is land used for buildings, roads
and all other infrastructure.
4. Energy land (land and sea area required for
the absorption of carbon emissions)
5. Biodiversity land (area of land and water that
would need to be set-aside to preserve
biodiversity)
In an ecological footprint analysis the land
necessary for the protection of biological diversity
is often set at 12 per cent of the total consumption
of land, according to recommendations from the
World Commission’s report “Our Common
Future” (1987)11.
To make possible comparisons between countries, which have different bioproductive capabilities,
the ecological footprint is expressed in a standard unit of global hectares (gha). One global hectare
is equivalent to one hectare of biologically productive space with world average productivity. Two
conversion factors are used to standardize local hectares into global hectares.
1. Yield Factor; this factor accounts for the differences between countries in the productivity
of a given land type. Each country has its own yield factors, one for each land type of
productive area and it varies each year12. This factor is much dependent on the local
yield.
2. Equivalence factor; this factor captures the productivity difference among land-use
categories, for instance arable land has a higher productivity than the other land types.
This factor is the same for each land type across the globe and is different for each year.
11 Chambers, 2000, P. 65
12 Wackernagel et al, ( 2005) Pg. 11
Example 1: A cooked meal of fish and potatoes would require arable land to grow the potatoes, bioproductive Sea land to provide the fish, and 'energy' land to re-absorb the carbon emitted during processing and cooking.
Example 2: Driving a car requires built land for roads, and parking the car, as well as 'energy' land (forested area) to reabsorb the carbon emissions generated from fuel use. In addition, energy and materials are used for construction and maintenance of the vehicle.
BOX 2.1

Ecological Footprint of Sleat 5
Table 2.1 Example: Sheep rearing on 1 ha pasture land in Scotland
Physical area: 1 ha
Equivalence factor: 0.49
1 ha of pasture land in Scotland has the same productivity as 0.49 ha world average arable land
Yield factor 2.7 Scottish farmers rear 2.7 times the number of sheep of world average farmers
Footprint 1.39 gha 0.49*2.7*1ha
The Ecological Footprint relies on two fundamental concepts: the ecological footprint itself, and the
biocapacity. In more economic terms, these would correspond respectively to human demand on
the environment, and to the environmental supply. Biocapacity or biological capacity is defined as
the capacity of ecosystems to produce useful biological materials and to absorb waste materials
generated by humans, using current management schemes and extraction technologies13. Hence
biocapacity refers to the bioproductive supply that is available within a certain area.
Once the ecological footprint is calculated a sustainability assessment is carried out. This is done
by comparing the footprint with available biocapacity. By comparing the ecological footprint
(demand) with biocapacity (supply) it is possible to assess the ecological sustainability of current
consumption14.
When the total calculated Footprint is compared with the total biocapacity, this reveals whether
existing natural capital is sufficient to support consumption and production patterns. If the
calculated Footprint of a population exceeds total biocapacity available, to support that population
it means that, that a country or population runs what is called an ecological deficit. This basically
means that the area or the country’s area alone cannot meet its population’s consumption
demand. Conversely, an ecological reserve exists when the biocapacity of a region exceeds its
population's Footprint. Generally, an ecological deficit means that a country is either importing
biocapacity through trade or liquidating its ecological assets15. In a modern economy it cannot be
expected that each area meets its population’s demand. An urban area with a high population
density will always have a footprint that is larger than its biocapacity, while rural areas require a
biocapacity that is larger than its footprint to support the urban population.
13 http://www.footprintnetwork.org/gfn_sub.php?content=glossary 10.03.2008
14 Chambers et al 2004 p. 58
15 Wackernagel et al 2005, p. 19

Ecological Footprint of Sleat 6
On the other hand if Ecological deficits is not balanced through trade it means local demand is met
through the overuse of domestic resources, resulting in degraded cropland and grazing land,
depleted fisheries, degraded forests, and the accumulation of carbon emissions in the global
atmosphere. This phenomenon is called ecological overshoot, which basically refers to a state in
which biological resources are used more rapidly than the biosphere can replenish them or
assimilate their waste, thereby violating the principle of strong sustainability16.
Biological capacity can also be expressed per person (or per capita): For instance there were 11.2
billion hectares of biologically productive land and water on this planet in 200317 and the available
global biocapacity per capita was 1.8 hectares. This figure is also known as the fair earth share, as
it indicates the average amount of biocapacity available on this planet per person. However in the
same year the global Ecological Footprint was 14.1 billion global hectares, or 2.2 global hectares
per person18. This shows an overshoot of 23%. The global ecological footprint for 2003 is show in
Figure 2.1.
Figure 2.1 World Ecological Footprint 2003
Source: Wackernagel et al, ( 2007), Vol: 4 No: 1 pg 2
Humanity’s footprint first grew larger than global biocapacity in the 1990’s. This overshoot has
been increasing every year since, with demand exceeding supply by about 23 % in 2003. This
means that it took approximately a year and three months for the Earth to produce the ecological
resources we used in that year. The CO2 footprint, also called carbon footprint, from the use of 16 Ibid p. 20
17 Wackernagel et al, 2005, p. 4
18 Living Planet Report, p.14

Ecological Footprint of Sleat 7
fossil fuels, was the fastest growing component, increasing more than nine times from 1961 to
2003.
What is more interesting is to note the global inequality that exists among nations in terms of
ecological impact. The footprint analyses of nations shows that a disproportionate amount of
productive area is required to support the lifestyles of those in industrialized countries. The largest
portion of the ecological footprint of these nations is mainly due to the high energy consumption.
Energy is the drive engine of the economies of these countries and the CO2 emissions from the
energy activities makes up more than half of the total ecological footprint. The ecological footprint
of selected countries is shown in Figure 2.2.
Figure 2.2 Ecological Footprint of Selected Countries (2001)
Source: Birch et al 2006
2.1 Calculation Methods Two distinct methods are used for calculating Ecological Footprints: component-based and
compound Foot printing19. The component-based method is a bottom up, approach. It sums up all
the Ecological Footprints of all relevant components of a population’s resource consumption and
waste production. This is achieved by first breaking down the resource flow into different
components and identifying all the individual items, and amounts thereof, that a given population
consumes, and second, assessing the Ecological Footprint of each component using life-cycle
data.
19 Wackernagel et al, 2005

Ecological Footprint of Sleat 8
Meanwhile the compound method is a top down approach. This method uses national production,
as well as import and export data to determine the total consumption of a nation and thereof
calculating the footprint. Hence it is mainly used on the level of areas where such statistical data
are available (i.e nations, regions, districts). However this method faces the challenges of data
availability at local community levels like Sleat where exports and imports of goods and services
are not available.
2.2 Boundaries The ecological footprint analysis faces boundary issues in relation to what to include and what to
exclude. Therefore it is important to define the boundaries of the ecological footprint clearly so that
the range of activities included in each study is clearly understood. Moreover this is essential in
order to compare any footprint study with other footprint studies. The selection of study boundaries
depends strongly on the specific goals of the Footprint study. There are two principles of defining a
boundary of the study.
1. Geographical (administrative) boundaries – This is based on whether the study should
calculate footprints within the geographical or administrative border. In this case this means
all activities that occur within the geographical boundaries of that community or country.
2. Responsibility boundaries - Based on the consumption of local residents regardless of
where it occurs either within the boarders or outside.
Table 2.2 Examples for boundary issues
Geographical boundaries Responsibility boundaries
Sleat resident uses train from Mallaig to Fort William
Footprint is attributed to Lochaber area Footprint is attributed to Sleat
Slaughter house in Inverness Footprint is attributed to Inverness
Footprint is shared among all communities served by the slaughter house.
Coal power plant in London Footprint is attributed to London
Footprint shared among all electricity consumers in England
Problem: It is not always possible to stick 100% to one approach. Consumption by tourists for
example is always difficult to completely separate from that of residents. Consumption of a small
business that provides service to customers outside the region is difficult to separate from the
residential consumption of its owner.

Ecological Footprint of Sleat 9
2.3 Double Counting Double counting is one of the common mistakes which should be avoided when calculating the
ecological footprint. Double counting refers to counting the impact of the same product or service
more than once. For instance if the total energy consumption of a nation is already calculated,
accounting for the energy used to supply and treat water would in this case result into double
counting. Similarly, if food consumption of a local restaurant has already been captured it will be
double counting if eating out of the local residents is also taken into account. In order not to
exaggerate human demand on nature, it is important to be more than careful to avoid double
counting.

Ecological Footprint of Sleat 10
This chapter discusses the methodology that was used for this study. The reference year for the
study was 2007. All formulas and conversion factors which were used for calculating the ecological
footprint are attached as Annexes 2 and 3.
3.1 Approach and methods The Ecological Footprint of Sleat was calculated mainly using the component method. However,
the compound method was used where statistical data was available. Both methods are explained
in Chapter 2.
The impact areas according to activities were divided into Direct Energy, Water, Transportation,
Material, Waste and Food. The component method was used to calculate the footprint of the Direct
Energy, Transportation, Food and Material, where local data was collected though questionnaires.
Waste and Water footprint were calculated using the compound method with statistical data for
Sleat from the Municipal Waste department of Highland Council and Scottish Water respectively.
Ecological supply or biocapacity was calculated for the Sleat Peninsula according to defined land
types – Arable, Pasture, Sea land, Forest and Built-up Land.
3.2 Defining boundaries The responsibility principle was applied to define the boundaries of this study. As explained in
Chapter 2, this means that all consumption of Sleat residents is attributable to the Sleat area.
Therefore, the consumption of Sleat residents when they are outside Sleat is still part of their
ecological footprint.
According to Scotland’s footprint study conducted in 2004, the responsibility principle is compatible
with other global, regional, city studies, and sustainability assessments using the average earth
CHAPTER 3: METHODOLOGY OF THE STUDY

Ecological Footprint of Sleat 11
share20. In addition, based on the European Common Indicators21 emissions (especially CO2)
generated by a community has to be considered both inside and outside the area.
Tourism is one of the main
activities in Sleat Peninsula. It
was not possible to completely
separate consumption of
tourists from that of residents.
Therefore, a part of the
ecological footprint of Sleat is
attributable to tourists. Box 3.2
explains how tourists’
consumption was estimated.
The Table 3.1 explains what was included and excluded in Sleat ecological footprint for
2007:
Table 3.1 Categories Included and Not Included in the Study
Included Not Included
Direct Energy (excluding transport) and Water
• Energy and water consumption within Sleat region in all sectors.
• Energy and Water consumption of tourist staying in hotels, B&B and self catering accommodation
• Energy and water consumption of Sleat resident outside Sleat boundaries.
• Domestic water, which is provided through local sources.
Transportation •All modes of travel of Sleat residents
•Tourist transportation to and within Sleat
Material
• Long lifetime material consumption within Sleat region in all sectors. Short lifetime material considered under waste.
• The material required for infrastructure both private (new houses) and shared e.g. road
20 Best Food Forward, 2004, p.59
21 It is a tool for sustainable policy making for urban and local perspective in European Union.
Tourists’ food consumption was separated from resident’s consumption in hotels. The average tourist food consumption was assumed to be similar with resident’s daily food consumption. The total tourist food consumption was calculated by multiplying total number of bed nights in hotels with the average daily food consumption. The tourists’ food consumption was deducted from the total food consumption in Sleat. Part of Sleat direct energy consumption, waste and water attributable to tourist could not be separated.
BOX 3.2

Ecological Footprint of Sleat 12
Table 3.1 Categories Included and Not Included in the Study
Waste • Waste generation within Sleat
region in all sectors. • Waste treatment outside Sleat
boundaries
• Bulk waste (considered as material).
• Construction waste( assumed to be reused).
• The specific waste produced by commercial sector which are not collected by Municipal Solid Waste (MSW)
Food • Food consumption by resident
and tourist within Sleat. • Average eating outside by Sleat
resident.
• Food consumption of self catering tourist.
Source: SESAM, 2008
3.3 Data collection
The required data to calculate the ecological footprint of Sleat Community was collected under the
following categories
Direct energy
Water
Transportation
Material
Waste
Food
Data was gathered by using extended (more detailed) and brief (short and less detailed)
questionnaires. The extended questionnaire was used to collect detailed information on the above
categories and it was administered through face to face interview. The brief questionnaire was
used to get information on key questions to cover a wider section of Sleat Community. Both
questionnaires are attached as Annexes 1.1 and 1.2.
The brief questionnaires were sent out to 320 households through post. Out of the 320 brief
questionnaires, 55 were returned. Face to Face Interviews were done using extended
questionnaires. The sample for the interview was selected randomly according to the household
size and house type. 58 households were interviewed using extended questionnaires. Therefore,
the total sample size was 113 which represent 30% of the total.

Ecological Footprint of Sleat 13
Data was also collected from primary school, college, medical centre, hotels and small businesses
utilising specific detailed questionnaires. Two hotels out of 5 and 8 small businesses were
interviewed. Data from households and hotels was extrapolated to derive the total consumption
respectively. Specific data sources on the different categories are mentioned in Chapter 3.5.
3.4 Major assumptions and limitations
Assumptions: 12% of the total biocapacity was set apart for the other species as biodiversity area as
explained in chapter 2.
The fuel consumption and mileage of diesel boats was very minimal hence it was included in
the diesel cars.
The household bin waste composition was assumed to be similar with that of the Highlands.
The recycled waste composition was assumed to be similar with that of Skye and Lochalsch.
Holiday cottages were assumed to be heated to 14 degrees when they are not occupied.
Tourists’ daily food consumption was assumed to be same as that of residents.
Limitations: Data on residential energy consumption and transport is largely based on the experience of the
residents over the past year. It can therefore be assumed that these data rather represent
average data over the past years than data of 2007.
Information from some of the major hotels was not provided. Therefore information for these
hotels was extrapolated from that of hotels which responded to the questionnaire.
3.5 Biocapacity Biocapacity is expressed as local or global average biocapacity. The global average biocapacity is
referred to as the average 'earthshare' which is 1.8 gha per capita as explained in Chapter 2. The
local biocapacity of Sleat is calculated in this study.
Data Sources The following data sources were used to collect required data.

Ecological Footprint of Sleat 14
Table 3.2
List of Data Source
Data on: Source:
Total land area of Sleat Highlands and Islands Enterprise, Community land unit, GIS maps and “KMAP mapping tool”, 2007
Forest land in Sleat Forestry Commission; “Forest Research, Biometrics, Surveys and Statistics” - Division Woodlands, “Land Cover Scotland project”, 2002
Built land in Sleat Highlands and Islands Enterprise, Community land unit, “Ordnance Survey Strategy Small Urban Areas”, 2007
Cropland in Sleat Skye Forum, “Isle of Skye data atlas”, p.137
Inland water in Sleat Highlands and Islands Enterprise, Community land unit, “Ordnance Survey Strategy Inland Water”, 2007
Sea land of Sleat Derived from “Best Foot Forward Island State – An Ecological Footprint Analysis of the Isle of Wight, p.35
Equivalence factor National Footprint Accounts comments October-November 2007
Yield factor for pasture land in Sleat Information from local farmers
Yield factor for the rest of the land types
Best Foot Forward, 2004 (Scotland Footprint), 2002
The local biocapacity of Sleat has been estimated by following the steps.
1. The different land use types within Sleat Peninsula were defined by using the area types used in
the National Footprint Accounts of other regions in Scotland.
2. The total area of each type of land use was determined with information from sources
mentioned above. The pasture land area was derived as a difference between the total land area
in Sleat and the total area of cropland, forest, built land, and inland water.
3. Both equivalence and yield factors were then applied to each land use type, in order to convert
the physical available area of each land use type into global hectares (gha).
Ecological Footprint of Sleat 15
3.6 Categories
3.6.1 Direct Energy Direct energy includes energy used by households, hotels, small businesses, college, primary
school and medical centre used for;
- Lighting
- Space and water heating
- Electrical appliances, communication and entertainment
- Stationary machines
The direct energy sources used in Sleat include electricity, Liquefied Petroleum Gas (LPG), Oil,
Wood, Coal and Peat.
Data Sources The data on direct energy gathered from the questionnaire provided details on the fuel types used
in Sleat. This data was collected on units of energy consumption or expenditure on the energy.
The information on the expenditure was converted into consumption units using the average unit
price. All energy consumptions were converted into the standard unit of kilowatt hours (kWh).
Conversion figures were obtained from the Inter-governmental Panel for Climate Change (IPCC).
CO2 emissions related to direct energy sources in Scotland were obtained from Scottish Energy
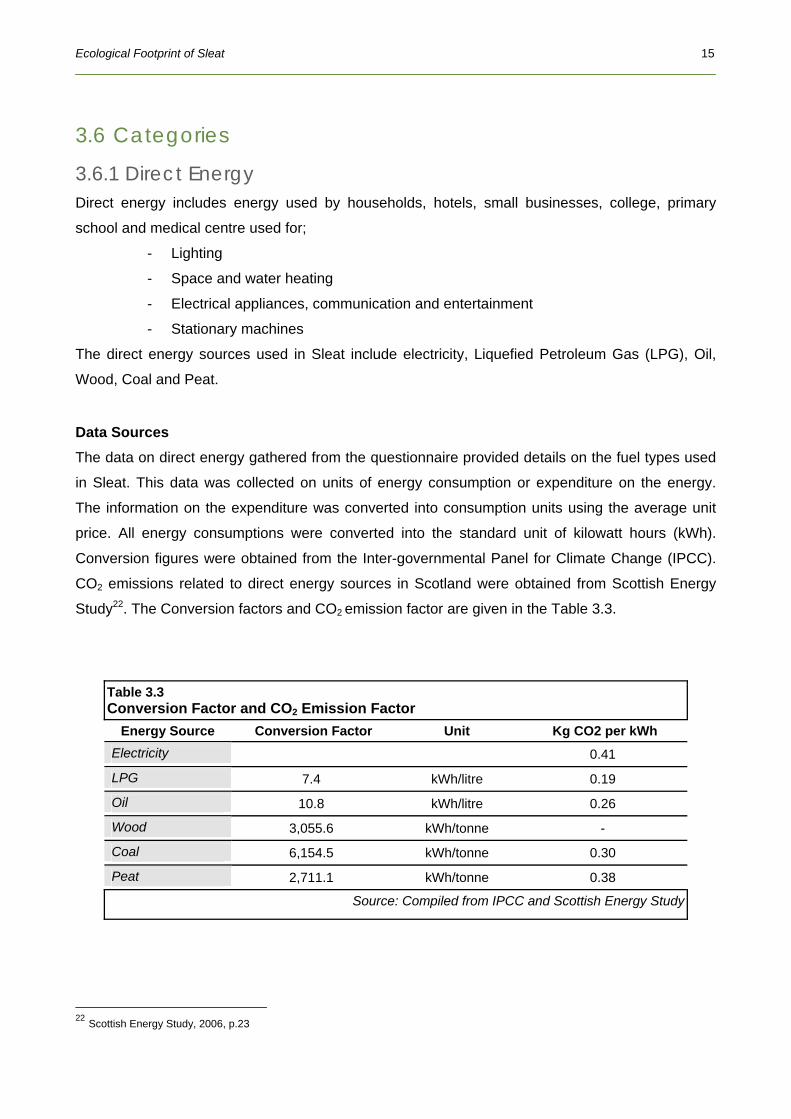
Study22. The Conversion factors and CO2 emission factor are given in the Table 3.3.
Table 3.3 Conversion Factor and CO2 Emission Factor
Energy Source Conversion Factor Unit Kg CO2 per kWh Electricity 0.41
LPG 7.4 kWh/litre 0.19
Oil 10.8 kWh/litre 0.26
Wood 3,055.6 kWh/tonne -
Coal 6,154.5 kWh/tonne 0.30
Peat 2,711.1 kWh/tonne 0.38
Source: Compiled from IPCC and Scottish Energy Study
22 Scottish Energy Study, 2006, p.23

Ecological Footprint of Sleat 16
CO2 emissions due to direct energy use were calculated according to the fuel type. The data on
the sustainable yield of forest in Sleat was taken from the Renewable Energy Study of Sleat23. The
embodied energy for the fuel wood, wood chip and the wind turbine were taken from the GEMIS
4.2 software developed by Oeko Institute in 200424.
Direct Energy Ecological Footprint Calculation Direct energy consumption in the footprint calculation for each sector was done by the fuel type
and related CO2 emission. The energy land (forest area) required to sequester CO2 emissions from
the direct energy use was calculated.
The embodied energy is the sum of all energy inputs used during all stages of a product’s entire
life cycle, e.g. the embodied energy of wood chips is the energy used to harvest, chip and
transport wood chip.
The embodied energy for fuel wood, wood chip and wind turbine are used to calculate the energy
land requirement to sequester CO2 emissions.
Additionally, the fuel wood and wood chip require area to grow, which is calculated taking into
account sustainable yield of forest. Similarly the wind turbines need area for their foundation and
access road.
The sum of land requirements gives the total ecological footprint for direct energy. The mass of
CO2 emissions from electricity generation, combustion of fossil energy carriers and the embodied
energy of fuel wood, woodchips, wind turbine represent the carbon footprint.
3.6.2 Water The water component includes energy required to supply water, treat wastewater and collect waste
water from septic tanks. Domestic water, which is provided through local sources such as wells or
boreholes, was not included.
23 Renewable Energy Device Solutions, 2006, p.68
24 Oeko Institute, 2004 in GEMIS 4.2

Ecological Footprint of Sleat 17
Data Sources
Since water consumption is not metered, information on the total water consumption was collected
from Scottish Water. The data on energy required for water supply, treatment, quantity of water
supplied and water leakage was obtained from Scottish Water.
Water Ecological Footprint Calculation
The CO2 emission from the energy required represents the carbon footprint for water supply and
waste water. It is then converted into energy land to calculate the ecological footprint for water.
It was not possible to breakdown the total water footprint into different sectors since the information
gathered was not disaggregated for the whole Sleat community.
3.6.3 Transportation Transportation includes all modes of travel used by Sleat residents ranging from walking, bicycle,
car (including taxi), bus, boat, tractor, train, ferry and airplanes.
Data sources
Fuel consumption and passenger km travelled were the main data sets used to derive the
transport footprint in Sleat. This information was collected through interviews with households. The
college students were also interviewed for the study to have the full representation of the
populations´ travel mileage. There are 100 full time students but only 85 are residing at the
campus.
Transport Footprint Calculation
The Footprint for transport was calculated utilizing the distances covered for each sector and the
fuel consumption. The fuel consumption was used to estimate the related CO2 emissions for each
mode of transportation which represents the carbon footprint of transport. The energy land
required to sequester the CO2 emissions from transportation was calculated.
The built land required for road transportation was also calculated as indicated in Annex 2. The
UK average road space demand of 0.06 gha per 10,000 passengers Km was used to estimate the
built land for roads25. The summation of built land and energy land for all modes of transportation
gave the total ecological footprint for transport.
25 Chambers et al,2000, p.74

Ecological Footprint of Sleat 18
3.6.4 Material and waste In this study, materials and waste are grouped together. Data on waste production were used as
an indicator for the material consumption. Short life time products were considered as part of the
residential waste. As data on bulk waste was not available data on the consumption of long life
time products were collected through the questionnaires.
The waste was categorized according to Municipal Solid Waste (MSW) from the Highland Council
(plastic, paper, glass, textiles, hazardous waste, and organic waste) where as material was divided
according to material bought by Sleat residential, public and commercial sectors in the past year.
In addition, the material required for infrastructure both private (new houses) and shared e.g. the
UK road network was considered.
Data Sources
The information on type and quantity of materials bought was collected from household, public and
commercial sectors through questionnaire. The sub categories of material bought by residents are
shown in Annex 4.
The average weight of each material was taken from Furniture Reuse Network26. The percentages
of the material make up are assumed in order to calculate the material ecological footprint in the
different land types.
Sleat residents benefit from infrastructure in other parts of the country, such as hospitals,
Universities and other government services. The material requirement for thisshared infrastructure
is based on UK data on construction material and was taken from the ecological footprint study of
Inverness.
Information collected from Municipal Waste Department of Highland Council includes the following:
total waste data both landfill and recycled,
waste proportion of household and commercial sector,
waste composition of household bin in Highland,
recycling waste composition of Skye and Lochalsh,
waste treatment location and freight transport.
26 http://www.crn.org.uk/projects/tonnage/frnweights2005.pdf, printed on 11.03.2008

Ecological Footprint of Sleat 19
Waste production per capita gathered from the questionnaire was cross checked with the data
from the Municipal Waste Department, Scotland and UK as shown in the table below:
Table 3.4 Waste Production per capita from Different Sources
Source Waste production per capita (kg/capita/a)
SESAM Survey 2008 322.7
Municipal waste department data 349.47
National UK (DETR 2000) 441
Scotland (2004) 375.57
It was found that the waste production per capita had 8% difference from the data provided by
Municipal Waste Department. However, the survey did not cover the entire public and commercial
sector in Sleat, therefore, data from municipal waste department was used. Composting data
gathered from the questionnaire was used to calculate the composting rate in Sleat.
Material and Waste Footprint Calculation
Material for furniture was segregated into different types of raw materials like wood, plastic, steel,
etc to calculate the ecological footprint. For the rest of materials, the raw materials were not
segregated.
The ecological footprint for shared infrastructure for Sleat was derived from the average shared
infrastructure ecological footprint per capita in the UK (0.923 ha/capita)27. The ecological footprint
for houses built in 2007 was calculated by using the material’s embodied energy and energy used
for transportation of these materials.
The waste ecological footprint considers the following:
1. The total embodied energy of the landfill waste.
2. 49% of the embodied energy of recycled waste28.
3. Energy used to transport waste.
Energy requirements of landfill processing, which is approximately 80 MJ per tonne29.
27 Birch R et al,2004, p.62
28 Best Foot Forward, 2004, p. 64
29 Wiedmann, p.38

Ecological Footprint of Sleat 20
3.6.5 Food Food includes animal and plant based products and beverages.
Data Sources
Quantity of food consumed by residential, public, and commercial sectors was gathered from the
questionnaires. The food categories listed in the questionnaires were based on the Family Food
survey30.
Data was collected in terms of unit weight, except eggs (number), tea and coffee (cups) and beer
and wine (volume). All food categories were converted into unit weight (kg) to calculate the
ecological footprint.
The food consumption data of college students was collected from the canteen. The estimation of
tourists’ food consumption was explained in 3.2 above.
Food Ecological Footprint Calculation
The ecological footprint of food considers the productive area (forest land, crop land, pasture land,
and sea land) required to supply the food/drinks products. It also considers the energy land
required to sequester the CO2 emissions from the embodied energy of food. The mass of CO2
emissions from embodied energy represents the carbon footprint of the food consumed in Sleat.
3.6.6 Builtland This component includes all areas that have been built on like roads, houses etc. Data Sources The built land data for Sleat was collected from Highlands and Islands Enterprise, Community land
unit, “Ordnance Survey Strategy for Small Urban Areas”, 2007.
Built Land Ecological Footprint Calculation To calculate ecological footprint of built land, crop yield factor and equivalence factor were used.
However this gave a result of 2.7 gha per capita, which more than 5 times than that of an average
Scottish residents. Therefore, the data was not used as it was considered not reliable.
30 Defra 2006

Ecological Footprint of Sleat 21
4.1 Sectors This chapter shows the current situation in Sleat as to the various sectors (residential, public and
commercial), as well as the categories on which the EF is based on.
4.1.1 Residential Sector Sleat had 366 households in 200531. Based on the interpolation of the population figures from the
Sleat Community Plan, Sleat had 378 households with a total population of 847 in 2007. There are
four main types of housing units in Sleat namely, detached, semi-detached, terraced house and
flat/maisonette.
4.1.2 Public Sector There is one primary school in Sleat with approximately 60 pupils. The school is divided into
nursery, lower and upper primary. The school has a canteen and serves lunch for the students.
The Sabhal Mor Ostaig college has around 100 students, 85 of them residing in the college
student hostel. All college students are considered as Sleat residents. The college has catering
facilities. The students usually take their meal in the college canteen.
Sleat community is served by one medical centre.
4.1.3 Commercial Sector The commercial sectors includes hotels, restaurants, shops and offices. There are five
hotels in Sleat. These are :
Ardvasar Hotel
Kinloch Lodge
31 A community Plan for Sleat, 2005
CHAPTER 4: CURRENT SITUATION

Ecological Footprint of Sleat 22
Isle of Ornsay Hotel
Toravaig Hotel
Duisdale House
4.1.4 Agriculture and Forestry Sleat has the following forest reserves namely Tormore, Lord Sainsbury and Kinloch. These
forests are used as source of wood fuel as well as for commercial timber products32. Sleat does
not have good soils for agriculture. As a result, the share of cropland is very small (275.4 ha) There
is however a substantial amount of sheep rearing.
4.2 Categories
4.2.1 Direct Energy All the energy requirements are met through imports except fuel wood and peat. Electricity for the
Sleat Peninsula is supplied by the national grid. Presently, there is no electricity generation in
Sleat. Fuel wood is locally supplied with the major supplier being the Clan Donald Land Trust while
peat is cut individually by the residents. Electricity is mainly used for lighting, heating, cooking,
communication and entertainment. LPG and Oil are used for heating and cooking.
4.2.2 Water Water for Sleat is supplied by Scottish water based in Broadford with few households having their
own water supply. Waste water is collected by tankers and treated in Broadford.
4.2.3 Transportation The A851 is the main dual carriage way under construction in Sleat running from Broadford down
to the ferry terminal at Armadale with the total distance of 24.15Km (15miles). There are also 2
peripheral single track roads leaving the main road connecting the outlying townships in
Tarskavaig, Torkavaig and the Aird of Sleat with distances of 27.37km (17miles) and 7km (4.35
miles) respectively.
The main modes of travel by road in Sleat are private cars and two public bus services running
from Ardvasar to Broadford and a school bus to Portree. There is one taxi service and two
privately owned school buses which operate within Sleat.
32 Sleat Community, Renewable Energy Study, p.68
Ecological Footprint of Sleat 23
The other mode of travel is by ferry from Armadale to Mallaig. Currently there is no connecting
service linking the townships that lie outside the A851, to the Public Bus Service or the Ferry.
4.2.4 Waste The largest portion of Municipal Solid Waste (MSW) arising from Sleat Peninsula is collected by
compacting refuse-collection vehicles (RCVs) once a week on Fridays and Thusdays. The total
mass of MSW collected by RCV in 2007 was 423 ton. All RCV collected waste ends up at the
transfer station in Portree. Furthermore, the waste is transported by articulated lorry by road to
Falkrik landfill site33.
There are two recycling points in Sleat which are located at Sabhal Mor Ostaiag College and
Armadale Pier (recycle waste including paper, can and glass). Papers and cans are collected
together once a month while glasses are collected separately. The lorry also collects waste from
other 188 recycling points in Highlands which end up at the transfer station in Inverness. From
there they are sent to the recycling location: glasses are recycled near Glasgow, the papers are
sent to a paper mill in Cheshire and the cans are sent to a steel factory in South
Wales. Afterwards, all recycle products are sent back to Inverness34. Other solid waste such as
plastic, textiles, and batteries end up in landfill. Many Sleat residents dispose recyclable waste in
Broadford, Portree, and Inverness while some send their old clothes to the charity shop in
Broadford.
4.2.5 Food Sleat residents purchase their food from supermarkets in Broadforad, Portree and Inverness.
Some of them grow their own food and raise animal.
33 Email correspondent with Ewan Huc Waste Management Officer, Highland Council
34 Ibid

Ecological Footprint of Sleat 24
The detailed results of the ecological footprint analysis of Sleat for the year 2007 are presented in
this chapter with a focus on biocapacity and the total footprint as well as the various categories
(direct energy, water, transportation, materials, waste and food)
5.1 Biocapacity The geographical size of Sleat is 17,124.82 hectares (171 km2). The figure 5.1 below shows the
land type distribution in Sleat. The predominant land type in Sleat is pasture land.
Figure 5.1 Types of Land in Sleat
The forest land is the second largest
land type. The total biocapacity of Sleat
is 26,458.31 gha (31.24 gha per capita)
assuming that biodiversity share is 12%.
The low population density of Sleat
(5/km²) is one of the reasons which
leads to a high per capita local
biocapacity. The data entered for the
calculation of biocapacity is attached as
Annex 4.5.
Source: SESAM, 2008
5.2 Total ecological footprint The total ecological footprint of Sleat in 2007 was 4,927.49 gha which translates to 5.82 gha per
capita. Material and waste was the highest. The break down of the ecological footprint by
categories is shown in the Figure 5.2.
CHAPTER 5: RESULTS OF THE STUDY

Ecological Footprint of Sleat 25
Figure 5.2 Ecological Footprint by Categories
Source: SESAM, 2008
The ecological footprint disaggregated into land types help in understanding more detailed
resource demands. Figure 5.3 shows a breakdown of Sleat’s residents’ ecological footprint by land
types. Energy land (land required to absorb CO2 emissions) was the highest land type with 76%.
This shows the importance of energy in meeting lifestyle needs either through direct energy (e.g.
electricity, gas, oil) or indirect energy (e.g. embodied energy in materials, food).
Figure 5.3 Ecological Footprint by Land Types
Source: SESAM, 2008

Ecological Footprint of Sleat 26
The total CO2 emissions (carbon footprint) were 14,397 tonnes which corresponds to 17 tonnes
per capita. The CO2 emissions according to the categories are shown in the Figure 5.4 below.
Figure 5.4 CO2 Emissions (tonnes) according to the categories
Source: SESAM, 2008
Material and waste category has the highest CO2 emissions. This is due to the accumulation of
embodied energy during the process of converting raw materials into final products. This shows
how important waste minimization initiatives could be in reducing CO2 emissions.
The ecological footprint of these categories is in detail discussed in the following sections.
5.3 Direct Energy Direct Energy Consumption
The total direct energy consumption of Sleat’s residents for lighting, space and water heating,
electrical appliances, communication, entertainment and stationary machines in 2007 was 16.6
GWh. The total annual CO2 emissions (carbon footprint) from direct energy consumption were
4,283 tonnes. The per capita CO2 emissions were 5.05 tonnes per capita.
Table 5.1 shows the energy consumption and related CO2 emissions according to different fuel
type.

Ecological Footprint of Sleat 27
Table 5.1 Total Direct Energy Consumption and CO2 Emissions According to Fuel Type
Fuel type Annual consumption Unit Consumption
(GWh/y) Annual CO2
emissions (tonnes) Electricity 5,387,692 kWh 5.4 2,187
LPG 549,238 litres 4.0 768
Oil 452,85 litres 4.9 1,266
Wood 674 tonnes 2.1 4
Coal 28 tonnes 0.2 52
Peat 6 tonnes 0.02 6
TOTAL 16.6 4,283
Source: SESAM, 2008
The total direct energy consumption of Sleat households was higher than the average
consumption of Scottish households. The total direct energy consumption for Scotland was 12.8
MWh per capita where as per capita consumption for Sleat was 15.5 MWh. This includes all the
domestic, commercial and public sectors.
Total Direct Energy Ecological Footprint
The total ecological footprint for direct energy in 2007 was 971 gha which translates to 1.147 gha
per capita. This accounts for 20% of the total ecological footprint.
Figure 5.5 showing the comparison of direct energy footprint of Sleat with other footprint studies is
given below:
Figure 5.5 Comparison of direct energy footprint with other studies
Source: SESAM, 2008

Ecological Footprint of Sleat 28
The Scotland study was conducted with 2001 data and the Highland study with 2006 data.
Table 5.2 shows the ecological footprint of direct energy of the Sleat resident’s according to the
sectors.
Table 5.2 Total Direct Energy Consumption and Ecological Footprint
Sector Fuel Type Total
Consumption (GWh/y)
Total Ecological Footprint (gha)
CO2 emissions (tonnes)
Electricity 2.8 242.06 1,134.15 LPG 2.2 90.24 422.82 Oil 4.6 254.28 1,191.43 Wood 2.1 57.66 3.94 Coal 0.2 11.13 52.13
Residential
Peat 0.02 1.29 6.02 Electricity 1.9 160.38 755.59 LPG 0.9 36.40 170.54 Oil 0.3 14.47 67.79
Commercial
Wood 0 .003 0.10 0.007 Electricity 0.73 63.53 297.67 LPG 0.92 37.31 174.82 Public
Oil 0.025 1.39 6.5
TOTAL 16.60 971.00 4283.39
Source: SESAM, 2008
Figure 5.6 Percentage Share of Direct Energy Footprint by Sector
Direct Energy Footprint by Sector
The residential sector has the highest share in
the total footprint of Sleat followed by
commercial and public sector. Figure 5.6 shows
the percentage share of direct energy footprint
by sectors.
Source: SESAM, 2008

Ecological Footprint of Sleat 29
Figure 5.7 Percentage Share of Direct Energy Footprint by Fuel Type
Direct Energy Footprint by Fuel Type
Electricity and oil are major energy
sources in Sleat. Figure 5.7 shows the
percentage share of the direct energy
footprint by fuel type.
Source: SESAM, 2008
Direct Energy Footprint by Land Type
The total footprint of direct energy footprint comprises of the energy land (land required to
sequester CO2 emission) and forest land (land required to grow the trees for amount the wood
being consumed). The total forest land in the footprint was 56.92 gha where as the total energy
land was 914.18 gha.
5.4 Water Water Consumption
The total water consumption by Sleat residents in 2007 was 130.10 million litres. The total
leakages were 16.39 million litres in the same year. According to the Scottish Water office in
Broadford, the energy required to supply and treat waste water was 168, 730 kWh.
The total CO2 emissions due to water consumption were 72.10 tonnes. Table 5.3 shows the
component breakdown of CO2 emissions related to energy used to supply and treat waste water.
Table 5.3 Energy Consumption for Water and CO2 emissions
Water Demand Energy Consumption Unit CO2 (tonnes)
Water Supply and Treatment 168,730.00 kWh 68.50
Transport 595.45 Litres 3.59
Total 72.10
Source: SESAM, 2008 with data from Scottish Water

Ecological Footprint of Sleat 30
Water Footprint
The ecological footprint of water consumed in Sleat was 15.39 gha which correspond to 0.02 gha
per capita. This is equal to Scotland 2001 water footprint per capita. Figure 5.8 shows the water
footprint.
Figure 5.8 Water Footprint (gha)
Source: SESAM, 2008
The ecological footprint of waste water treatment was calculated using the total energy
consumption of the waste water treatment plant in Broadford for 2007. It was difficult to allocate
part of the energy consumption of the waste water treatment plant to Sleat as data on the total
number of communities served by this plant was not available.
5.5 Transportation The total kilometres travelled by the Sleat residents in 2007 were over 14 million of which the major
contribution came from personal car travel. Air travel was the second highest. Figure 5.9 shows
passenger km by mode of transport.

Ecological Footprint of Sleat 31
Figure 5.9 Passenger km by Transport Mode
Source: SESAM, 2008
This translates into 17,000 passenger km per Sleat resident , compared to a Scottish average of
13,000 passenger km per capita in 2001(see Table 5.4). However the Scottish data on air travel in
2001 might not represent todays reality, considering the boom of cheap airlines in the past years.
Table 5.4 Comparison of Scotland and Sleat passenger km per capita
Scotland (2001) Sleat (2007)
Mode of travel Passenger Km /capita Passenger Km /capita
Car and van 10, 733 12, 115
Bus & coach 918 1, 363
Rail, tram, metro etc 880 299
Air travel 539 3, 731
Total (km) 13, 070 17, 508
Source: SESAM, 2008
According to the study, there were 565 personal cars in Sleat (2007) giving an average of 1.6 cars
per household. The total fuel consumption of personal cars was 637,745 litres in 2007.
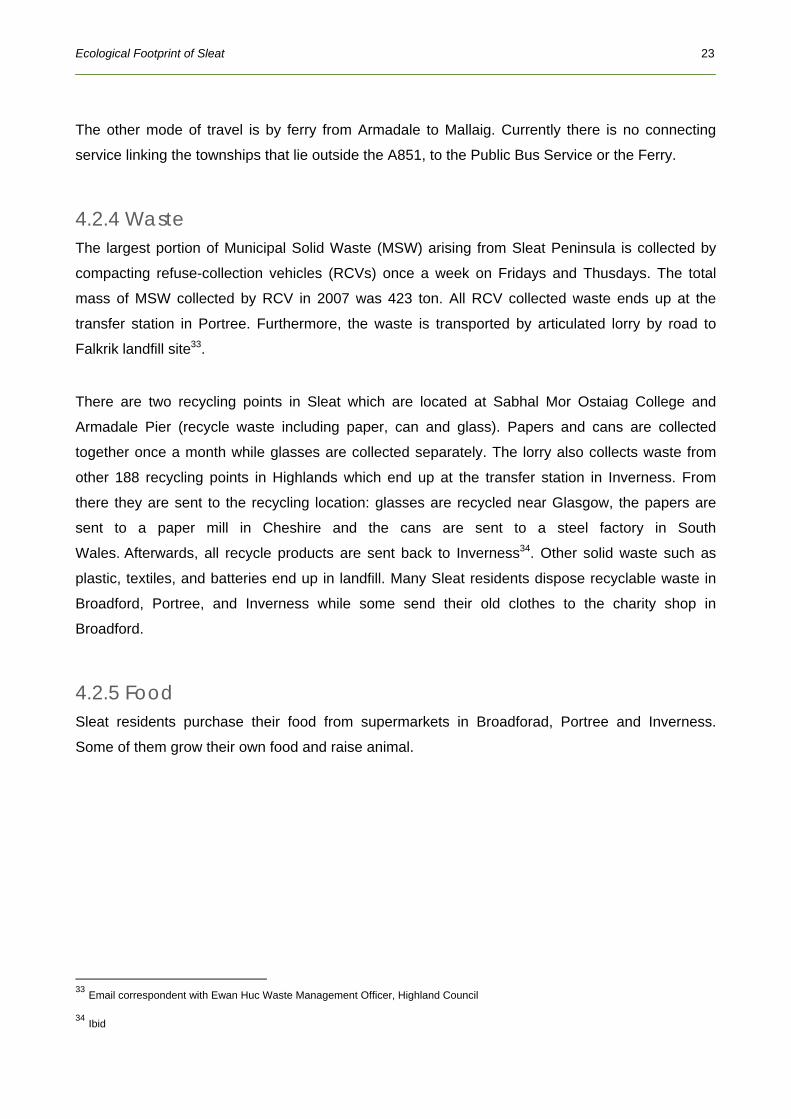
The purpose of car usage was for shopping, work, leisure and business. Figure 5.10 summaries
the uses of personal cars. From the graph, it shows that shopping was the main purpose of using a
car, due to the fact that there is no supermarket, bank or other amenities in Sleat. Therefore,
improved shopping and service facilities in Sleat could reduce travel mileage as proposed in
chapter 7.
Ecological Footprint of Sleat 32
Figure 5.10 Purpose of Vehicle Use
Source: SESAM, 2008
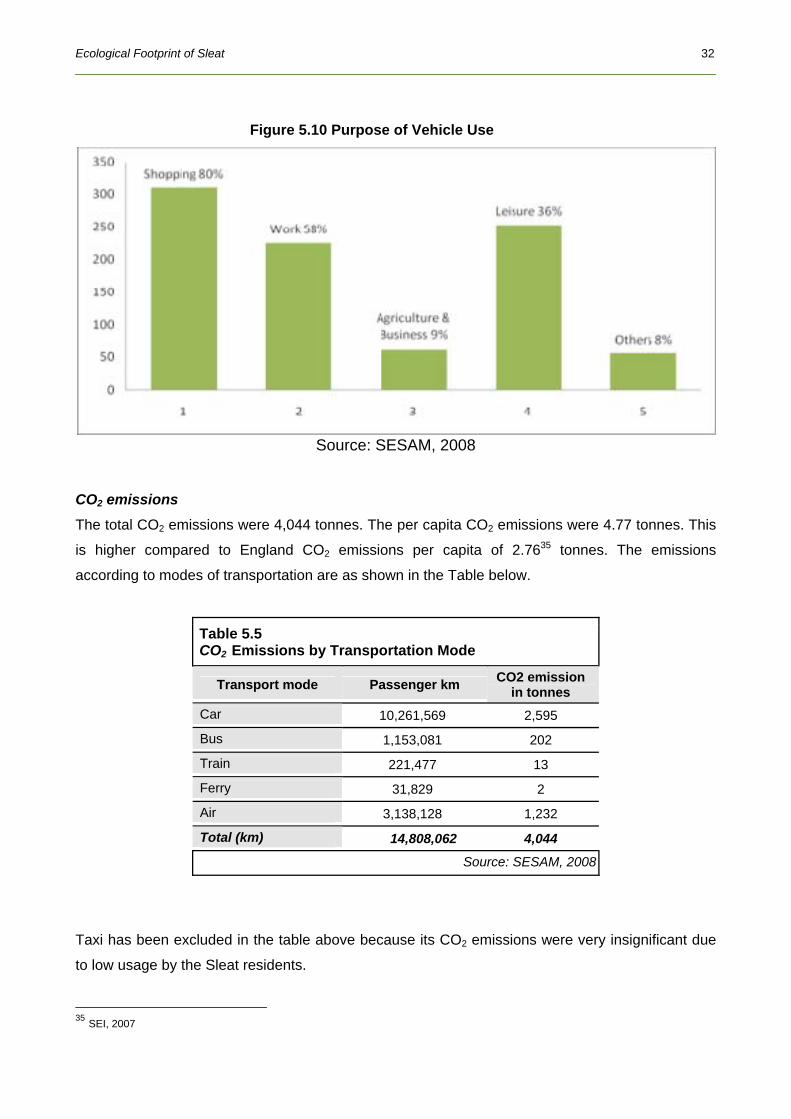
CO2 emissions
The total CO2 emissions were 4,044 tonnes. The per capita CO2 emissions were 4.77 tonnes. This
is higher compared to England CO2 emissions per capita of 2.7635 tonnes. The emissions
according to modes of transportation are as shown in the Table below.
Table 5.5 CO2 Emissions by Transportation Mode
Transport mode Passenger km CO2 emission in tonnes
Car 10,261,569 2,595
Bus 1,153,081 202
Train 221,477 13
Ferry 31,829 2
Air 3,138,128 1,232
Total (km) 14,808,062 4,044
Source: SESAM, 2008
Taxi has been excluded in the table above because its CO2 emissions were very insignificant due
to low usage by the Sleat residents.
35 SEI, 2007

Ecological Footprint of Sleat 33
Transportation Footprint
Transport represents 23% of the Sleat Footprint and is 1,330 gha (1.57gha per capita). The figure
below shows the ecological footprint of Sleat compared with UK and Scotland.
Figure 5.11 Comparison of Sleat Transport Footprint with Other Studies
Source: SESAM, 2008, Best Foot Forward 2004, SEI 2003
Sleat has a higher transport footprint than Scotland and the United Kingdom because Sleat
residents’ usage of public transportation is low. In addition to this, Sleat residents travel a lot by
air. Broadford, which is 15 miles away is the nearest place where Sleat residents do much of their
shopping. Hence, this increases the transport footprint.
Transportation Footprint by Sector
Households account for about 88% of the total mileage with a footprint of 967.28 gha. The sector
wise footprint is shown in the table below.
Table 5.6 Transport Footprint by Sector
Water Demand Residential Commercial Public -Passenger km (1000 km) 13,088.92 306.22 1,395
% of transport mode-km 88.50 2.07 9
Total CO2 Emissions in tonnes 3,456.18 264.49 328
% of CO2 emission 85.36 6.53 8
Ecological Footprint of Sleat 34
Table 5.6 Transport Footprint by Sector
Built land (gha) 111.27 111.27 111.27
Total Footprint for transport 953.90 174.36 197
% of transport footprint 72% 13% 15% Source: SESAM, 2008
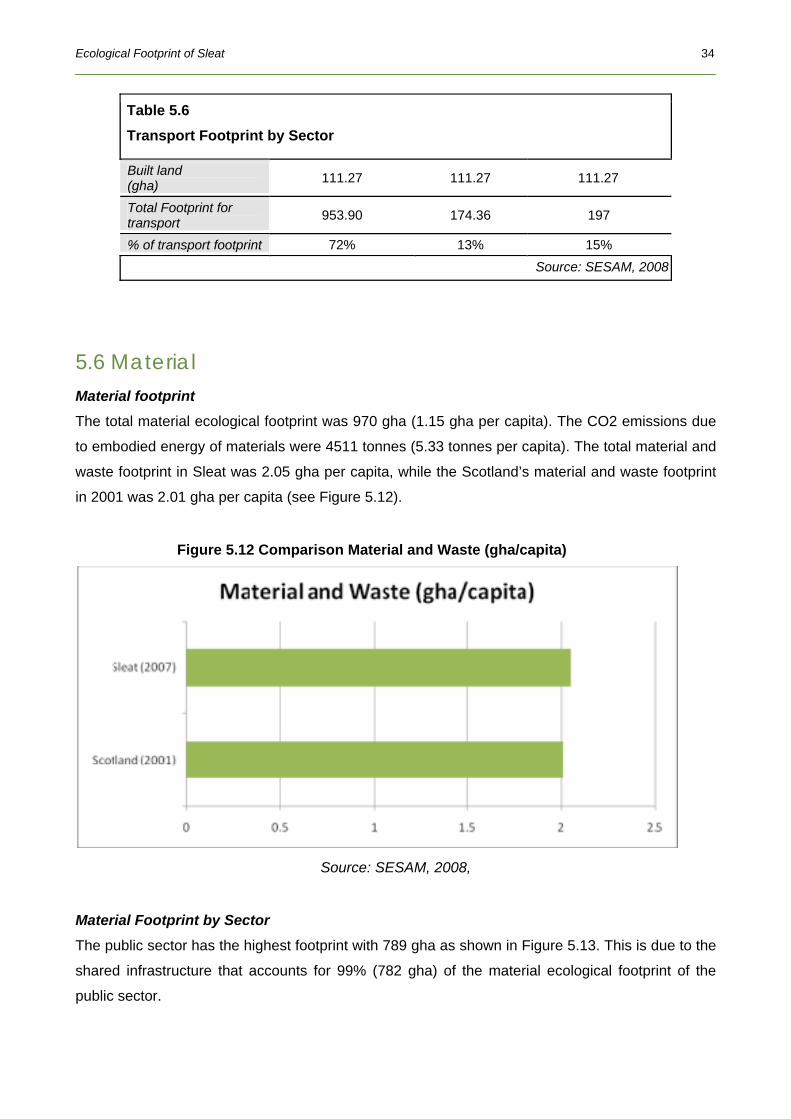
5.6 Material Material footprint
The total material ecological footprint was 970 gha (1.15 gha per capita). The CO2 emissions due
to embodied energy of materials were 4511 tonnes (5.33 tonnes per capita). The total material and
waste footprint in Sleat was 2.05 gha per capita, while the Scotland’s material and waste footprint
in 2001 was 2.01 gha per capita (see Figure 5.12).
Figure 5.12 Comparison Material and Waste (gha/capita)
Source: SESAM, 2008,
Material Footprint by Sector
The public sector has the highest footprint with 789 gha as shown in Figure 5.13. This is due to the
shared infrastructure that accounts for 99% (782 gha) of the material ecological footprint of the
public sector.

Ecological Footprint of Sleat 35
Figure 5.13 Material Ecological Footprint by Sector
Source: SESAM, 2008
Material Footprint by Items
Shared infrastructure has the highest footprint with 81% whereas housing is 10% of the material
footprint (see table below).
Table 5.7 Footprint and CO2 emissions by Material Categories
Items Ecological Footprint (gha)
CO2 emissions (tonnes)
Kitchen Appliances 26.12 122.37 Entertainment 6.55 30.697 Office Equipment 21.02 98.49 Other appliances 0.55 2.59 Car 22.27 104.34 Furniture 14.59 34.76 New houses 97.10 454.94 Shared infrastructure 781.78 3663.04
Source: SESAM, 2008

Ecological Footprint of Sleat 36
5.7 Waste Waste generation
The study shows that 475 tonnes of waste was generated in Sleat in 2007. The waste was divided
into recycled and land fill waste. The composted waste was not taken into account in the waste
footprint to avoid double counting.
The total recycled waste was 52 tonnes and 423 tonnes of waste were land fill waste.
The composition of waste from both household and commercial sectors is given in Table 5.8. The
organic waste was the largest component with 29% of the total waste generated. Paper waste was
the next largest quantity of waste generated from both sectors with 27%.
Table 5.8 Waste Composition for Sleat in 2007
Household Commercial/public
Land fill waste Recycled waste Land fill waste Recycled waste
[ton/a] [ton/a] [ton/a] [ton/a]
Plastic 23 - 10 -
Paper 77 13 33 6
Glass 26 19 11 8
Textiles 11 3 5 1
Metal 8 1 4 0.3
Hazardous 53 - 23 0.2
Organic waste 97 - 42 -
Source: SESAM, 2008 based on Municipal Waste Department of Highland Council data
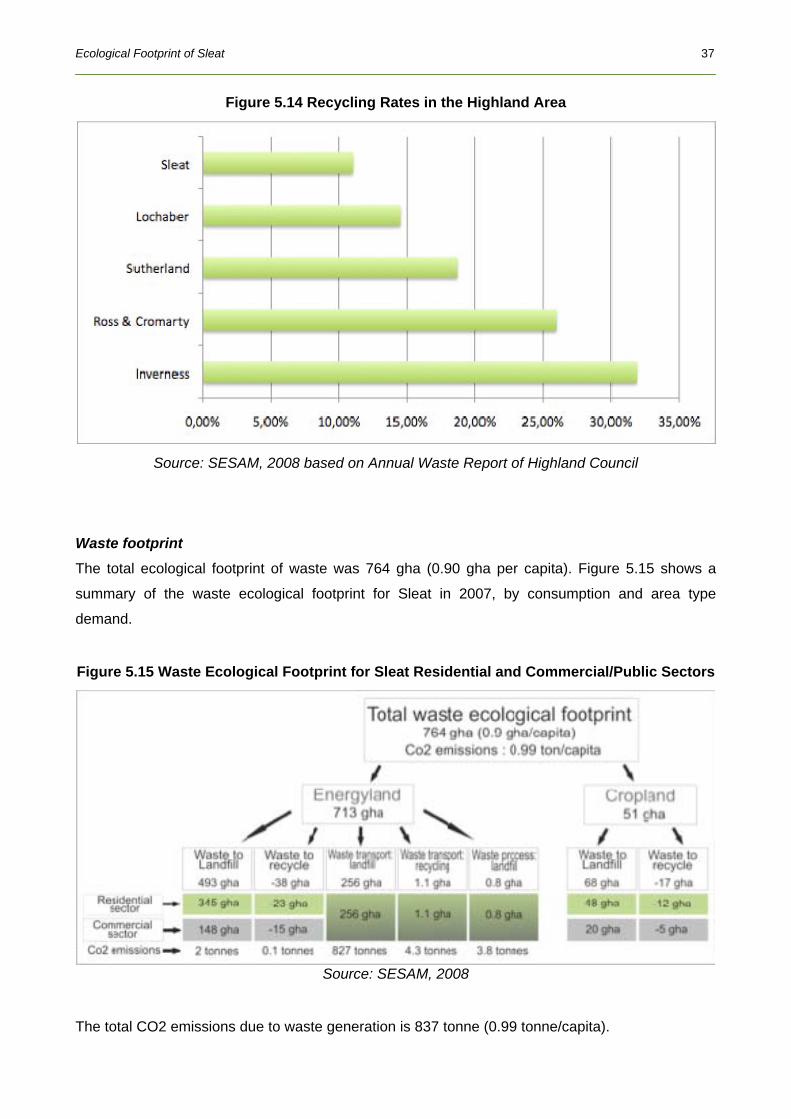
Comparing with other areas in Highland, Sleat has the lowest recycling rate of 11% as shown in
figure 5.14.
Ecological Footprint of Sleat 37
Figure 5.14 Recycling Rates in the Highland Area
Source: SESAM, 2008 based on Annual Waste Report of Highland Council
Waste footprint
The total ecological footprint of waste was 764 gha (0.90 gha per capita). Figure 5.15 shows a
summary of the waste ecological footprint for Sleat in 2007, by consumption and area type
demand.
Figure 5.15 Waste Ecological Footprint for Sleat Residential and Commercial/Public Sectors
Source: SESAM, 2008
The total CO2 emissions due to waste generation is 837 tonne (0.99 tonne/capita).

Ecological Footprint of Sleat 38
Waste Footprint by Items
Among the different waste materials hazardous has the highest footprint with 181 gha (see Figure
5.16), as the embodied energy from this materials are is very high. The lowest was glass with 10
gha.
Figure 5.16 Items Waste Footprint
Source: SESAM, 2008
5.8 Food
Food consumption
The total food consumption in Sleat for 2007 was 483 tonnes. This includes food consumed by
residents and tourists. (Pet consumption is not considered (see Box 5.1)).
The total food consumed in Sleat by residents (excluding tourist) in 2007 was 457 tonnes. This
translates to an annual per capita consumption of 540 kilograms of which 2.7% was consumed
outside home. The tourists accounted for 5.3% of the total consumption.
The annual food consumption profile of Sleat residents is shown in Table 5.9. Milk and milk
products were the largest quantity of food consumed with followed by vegetables and fruits.
Table 5.9 Food consumption profile of Sleat residents in 2007
Eating at home Eating out* Total eating
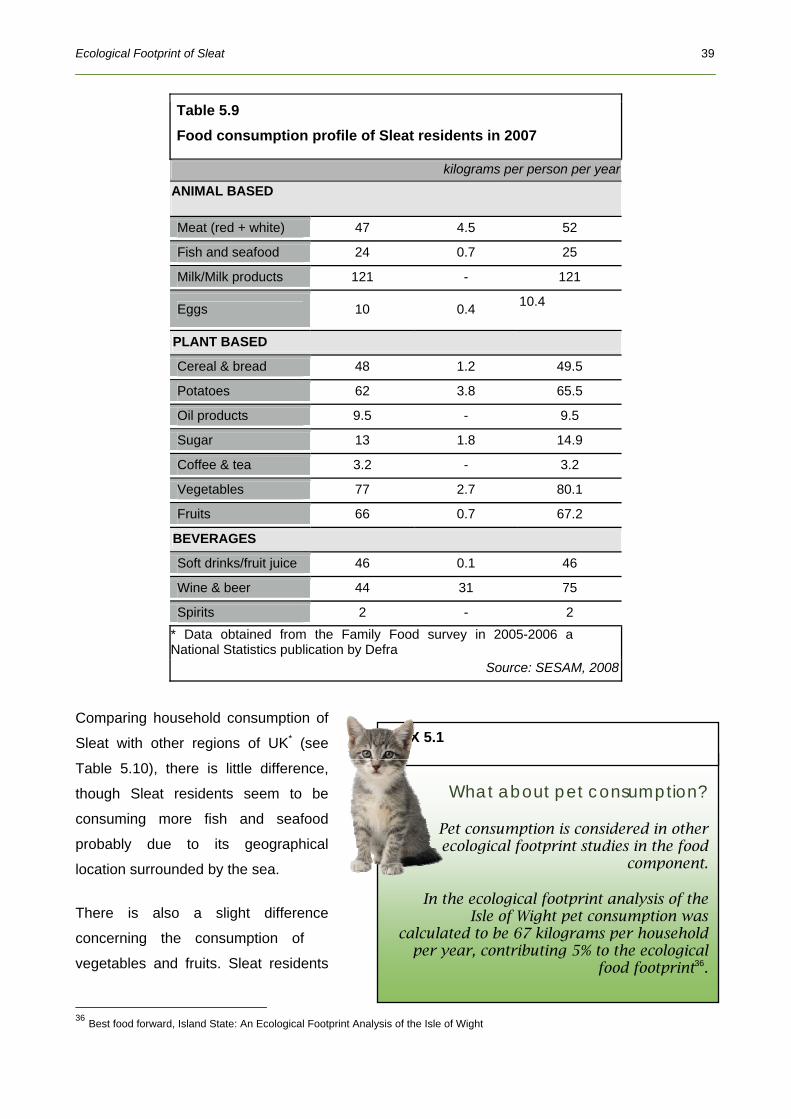
Ecological Footprint of Sleat 39
Table 5.9 Food consumption profile of Sleat residents in 2007
kilograms per person per year ANIMAL BASED
Meat (red + white) 47 4.5 52
Fish and seafood 24 0.7 25
Milk/Milk products 121 - 121
Eggs 10 0.4 10.4
PLANT BASED
Cereal & bread 48 1.2 49.5
Potatoes 62 3.8 65.5
Oil products 9.5 - 9.5
Sugar 13 1.8 14.9
Coffee & tea 3.2 - 3.2
Vegetables 77 2.7 80.1
Fruits 66 0.7 67.2
BEVERAGES
Soft drinks/fruit juice 46 0.1 46
Wine & beer 44 31 75
Spirits 2 - 2 * Data obtained from the Family Food survey in 2005-2006 a National Statistics publication by Defra
Source: SESAM, 2008
Comparing household consumption of
Sleat with other regions of UK* (see
Table 5.10), there is little difference,
though Sleat residents seem to be
consuming more fish and seafood
probably due to its geographical
location surrounded by the sea.
There is also a slight difference
concerning the consumption of 36 vegetables and fruits. Sleat residents
36 Best food forward, Island State: An Ecological Footprint Analysis of the Isle of Wight
What about pet consumption?
Pet consumption is considered in other ecological footprint studies in the food
component.
In the ecological footprint analysis of the Isle of Wight pet consumption was
calculated to be 67 kilograms per household per year, contributing 5% to the ecological
food footprint36.
BOX 5.1

Ecological Footprint of Sleat 40
consume 28% more vegetables and 11% more fruits.
Table 5.10 Food Consumption Profile of Sleat and other Regions
Sleat* North West** Scotland** England**
grams per person per year
ANIMAL BASED
Meat (red + white) 1021 1118 1046 1046
Fish and seafood 492 161 142 164
Milk/Milk products 2540 2286 2070 2130
Eggs 197 90 96 120
PLANT BASED Cereal & bread 948 1642 1611 1601
Potatoes 1301 864 780 828
Oil products 184 190 172 184
Sugar 205 140 127 133
Vegetables 1592 1034 907 1145
Fruits 1307 1116 1104 1243
BEVERAGES Soft drinks/fruit juice 885 1735 2209 1768
Alcoholic drinks 37 928 822 802 * Data obtained from the Family Food survey in 2005-2006 a National Statistics publication by Defra
**Source: SESAM, 2008
Total Food Ecological Footprint
The ecological footprint for food by residents and tourists in 2007 was 1033 gha. The tourists were
responsible for 15% (158 gha) of the total food ecological footprint. The footprint per capita
excluding tourists was 1.03 gha.
Figure below shows the detailed footprint according to the land types required for food production.
The CO2 emissions due to embodied energy in food were 650 tonnes in Sleat (0.77 tonnes per
capita). In comparison this is lower than England’s per capita CO2 emissions of 1 tonne per capita
for food.

Ecological Footprint of Sleat 41
Figure 5.17 Food Ecological Footprint for Sleat Residents and Tourists
Source: SESAM, 2008
Figure 5.18 Comparison with Other Footprint Studies
Comparing the food footprint with other
ecological footprints studies, Sleat has
the lowest food ecological footprint (see
Figure 5.18). This might be due to the
higher consumption of fruits and
vegetables. The food footprint of Sleat
did not include soups and ice cream.
However, it is still comparable with
Scotland’s footprint study, as the
footprint of these items is less that
0.001 gha.
Source: SESAM, 2008
Food ecological footprint by sector
The study found that the residential sector was the highest with 849 gha, followed by the
commercial sector (hotel) with 95 gha. The public sector (college) had the lowest share with
52 gha.

Ecological Footprint of Sleat 42
The footprint of Sleat measured the demand of the residents on the biocapacity to estimate the
area’s sustainability. The total biocapacity of Sleat was 31 gha/capita. The biocapacity of Sleat is
high partly because the population density is low compared to other regions. Despite the
biocapacity of Sleat being high, Sleat residents are highly dependent on products and services
outside Sleat. Moreover, it is difficult to compare the footprint of small communities like Sleat with
their biocapacity. This is mainly because resources and land space of any nation are not equally
distributed. For example, people living in cities need more space to provide what they consume
while they are concentrated in a small area. They are highly dependent on land space outside the
cities. Therefore, in this study the ecological footprint of Sleat is compared with national and global
biocapacity.
The ecological footprint of Sleat was 5.82 gha/capita, whereas national biocapacity is 4.53
gha/capita. This is an indication that the current consumption and waste generation in Sleat is not
sustainable. By comparing Sleat’s footprint with the average global biocapacity (earth share) of
1.8 gha/capita, it is possible to measure ecological sustainability. This assessment indicates that a
Sleat resident is using 3 times more than the average earth share. This is higher than the a
Scottish resident who is using 2.5 times more than the earth share. Figure 6.1 shows Sleat´s
ecological footprint compared to the national (Scotland) and global biocapacity.
Figure 6.1 Sleat´S Ecological Footprint Compared
CHAPTER 6: SUSTAINABILITY ASSESSMENT

Ecological Footprint of Sleat 43
With National Biocapacity and Global Earthshare
Source: SESAM, 2008 and Best Foot Forward, 2001
Compared with other regional ecological footprints, as can be seen in the figure below, the
ecological footprint of Sleat is the second highest after Inverness.
Figure 6.2 Comparison of Total Ecological Footprint with Other Studies (gha/capita)
Source: SESAM, 2008
Findhorn has the lowest footprint, however a different methodology was used to calculate the
footprint therefore it can not be exclusively compare with other studies.
The carbon footprint of Sleat is 14,397.49 tonnes which corresponds to 17 compared to a Scottish
average of 12.2 tonnes/capita.

Ecological Footprint of Sleat 44
Although the ecological footprint of Sleat is high, there are several opportunities to improve the
utilization of resources thereby reducing ecological demand. To show some of the possibilities that
could lead Sleat residents towards sustainable lifestyle, several scenarios are presented in the
next Chapter.

Ecological Footprint of Sleat 45
This chapter discusses the impacts of alternative scenarios developed to show the impacts of
future options on the reduction of the ecological and carbon footprint. National and regional
strategies were also used to identify the scenarios. The scenarios focus on alternatives of meeting
people’s demand with lower impact on the supply side and reducing the levels of consumption on
the demand side. These scenarios present the picture on what could happen if certain actions are
taken. For each scenario, the reduction in the Ecological Footprint resulting from the suggested
measures has been estimated.
7.1 Direct Energy Direct energy contribution to the ecological footprint of Sleat was 20 % of the total footprint.
Alternative scenarios were identified according to the already existing plans and project ideas in
Sleat. The scenarios analyze the generation of energy from renewable sources (biomass and
wind) and the reduction of energy demand through energy efficiency measures.
Figure below shows an overview of possible savings in carbon emissions according to the different
scenarios.
Figure 7.1 Comparison of CO2 Emissions From Direct Energy Consumption In Base
Case And Alternative Scenarios (Transport Not Included)
Source: SESAM 2008
CHAPTER 7: ALTERNATIVE SCENARIO DEVELOPMENT
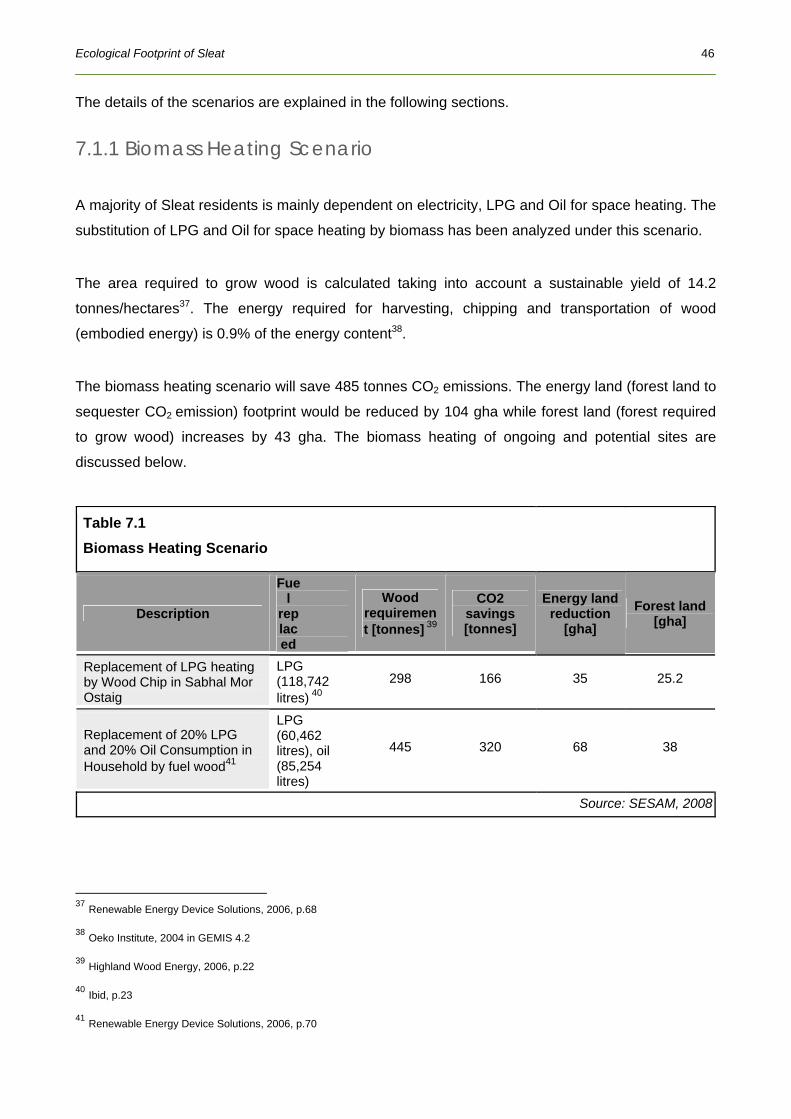
Ecological Footprint of Sleat 46
The details of the scenarios are explained in the following sections.
7.1.1 Biomass Heating Scenario A majority of Sleat residents is mainly dependent on electricity, LPG and Oil for space heating. The
substitution of LPG and Oil for space heating by biomass has been analyzed under this scenario.
The area required to grow wood is calculated taking into account a sustainable yield of 14.2
tonnes/hectares37. The energy required for harvesting, chipping and transportation of wood
(embodied energy) is 0.9% of the energy content38.
The biomass heating scenario will save 485 tonnes CO2 emissions. The energy land (forest land to
sequester CO2 emission) footprint would be reduced by 104 gha while forest land (forest required
to grow wood) increases by 43 gha. The biomass heating of ongoing and potential sites are
discussed below.
Table 7.1 Biomass Heating Scenario
Description
Fuel
replaced
Wood requirement [tonnes] 39
CO2 savings [tonnes]
Energy land reduction
[gha] Forest land
[gha]
Replacement of LPG heating by Wood Chip in Sabhal Mor Ostaig
LPG (118,742 litres) 40
298 166 35 25.2
Replacement of 20% LPG and 20% Oil Consumption in Household by fuel wood41
LPG (60,462 litres), oil (85,254 litres)
445 320 68 38
Source: SESAM, 2008394041
37 Renewable Energy Device Solutions, 2006, p.68
38 Oeko Institute, 2004 in GEMIS 4.2
39 Highland Wood Energy, 2006, p.22
40 Ibid, p.23
41 Renewable Energy Device Solutions, 2006, p.70

Ecological Footprint of Sleat 47
7.1.2 Wind Energy for Electricity Generation Sleat Peninsula has excellent wind resource and is suitable for large scale wind development. The
possibility of the wind energy development is hindered by limitations of grid for export of electricity
generated42.
Nevertheless it was interesting to analyze the impact of a large scale wind generation on the
carbon emissions and energy footprint. This scenario also analyses the option of developing the
small and micro embedded wind generation identified in the Sleat Renewable Energy Study.
The embodied energy of a wind turbine is 3% of the energy production. The land requirement
associated with a wind turbine is 333.33 m2 for a capacity of 1 MW and 284.21 m2 for capacity of
100 kW43.
a) Large Scale Wind Turbine
This scenario considers the development of a wind farm of 5 MW (5 x 1 MW) capacity in Sleat. If
this wind farm operates 3500hrs in a year at full capaciy, the total electricity generated will be 17.5
GWh per year. This can easily replace the total energy demand in Sleat which is 16.5 GWh/year.
If the wind energy generated is considered as part of national energy mix, total CO2 savings are
attributed to the whole of Scotland rather than Sleat. Even though there are no CO2 emissions
from the generation of electricity by the wind farm, CO2 emissions due to embodied energy of the
wind plant are taken into account and added to the total CO2 emissions from electricity generation
in Scotland. This however does not offer any meaningful CO2 savings as the electricity generated
from the Sleat wind farm is very low compared to national generation.
Nevertheless, if we consider that the CO2 savings under this scenario are only attributed to Sleat ,
4065 tonnes of CO2 could be saved and the direct energy footprint could be reduced by
924.31gha. The footprint for the embodied energy of the wind farm will be 45.91 gha which
includes energy land of 45.49 gha and built land of 0.415 gha.
b) Small embedded wind energy generation
The Sleat Renewable Energy Study identified three small wind sites for Clan Donald Land Trust,
Sabhal Mor Ostaig and Fearann Eileann larmain. These wind sites will have total built land
42 Ibid, p.22-23
43 Oeko Institute, 2004 in GEMIS 4.2

Ecological Footprint of Sleat 48
footprint of 0.21 gha. The CO2 savings and the net energy land footprint reduction are shown in
the table below:
Table 7.2 Small Embedded Wind Generation Scenario
Wind Site Capacity (MWh/year)
CO2 Saving (tonnes)
Energy Land Reduction
(gha) Clan Donald Land Trust (50kW,)
170 69 14
Fearann Eileann larmain (15 kW)
80 32 7
Shabal Mor Ostaig (30 kW)
30 12 2.6
Source: SESAM, 2008
7.1.3 Energy Efficiency The energy consumption could be reduced by the application of simple energy efficiency
measures which could further reduce CO2 emissions. For this scenario only the introduction of
Compact Fluorescent Lamp (CFL) lamps and loft insulation were considered.44 a) CFL
Table 7.3 Energy Efficiency Scenarios
Description Energy savings [kWh]
CO2 savings [tonnes]
Energy land reduction [gha]
Replacement of a 60 watt incandescent bulb with a 20 Watt CFL bulbs in each house
19,315.80 7.8 1.674
Loft insulation in 20 households
104,000 44 27.37 6.4
Source: SESAM, 2008
44 http://www.nationalinsulationassociation.org.uk/housholder/householder-nia.html 10.03.2008

Ecological Footprint of Sleat 49
The above energy efficiency scenarios show that simple energy efficiency measures can have
significant impact on the reduction of direct energy footprint of Sleat.
7.2 Transportation Scenarios for transport will mainly focus on personal travel because it contributes to 63% of
transportation ecological footprint. This amounts to 2593 tonnes of CO2 emissions. The main
scenarios developed are soft policies built on flexibility and responsibility in change of behaviour
and attitude towards car usage.
Three scenarios were developed on car sharing of households and these are; 4 people sharing the
car, 3 people sharing the car and 2 people sharing the car. The car sharing scenarios take into
account the car occupancy rate of 1 for Sleat which is derived from the household car ownership of
1.5 from the study. The car sharing of 4, 3 and 2 people reduces the car carbon footprint by 27%,
24% and 18% respectively.
The fourth scenario assumes that there are improved shopping and service facilities in Sleat,
which influences residents to travel to Broadford. This reduces the car carbon footprint by 4% .
The summary of the scenarios discussed above are shown in Table 7.4.
Table 7.4 Transport Footprint Development Scenarios
Scenarios
Business As Usual
Distances (million
passenger km)
Scenario Distances
(million passenger
km)
Business As Usual
Footprint Scenario Footprint
Percentage Reduction (from total
transportation footprint)
4 people per car 2.4 0.18 27% 3 people per car 3.3 0.23 24% 2 people per car 4.8 0.35 18% Improved Shopping Facilities in Sleat
9.7
8.7
0.7
0.63 4%
Source: SESAM, 2008
The last scenario is based on switching of fuel from diesel to LPG. The cars which travelled more
than 35,000 km per year were considered under this scenario. The LPG cars have proven to be
economically viable if they travel at least 35,000 km. SESAM 2008 survey has shown that 40 cars
in Sleat have a yearly total distance travel of 35,000 km. The usage of LPG as fuel for these cars

Ecological Footprint of Sleat 50
leads to a CO2 emissions savings of 220 tonnes. This represents a reduction of 5% on the
transport carbon footprint of Sleat.
7.3 Waste Management The new area waste plan targets in 2010 are 13% composting rate, 27% recycling rate, 33% of
waste to landfill and 27% Energy from Waste (EfW). As mentioned in the result part of waste
component that Sleat has reached the composting target in 2007 (17%). However an improvement
is needed in recycling rate, which was 11% in 2007 to achieve 2010 Highland’s target.
The total landfill organic waste generated in Sleat region last year was 3 tonnes /week, which was
30% from total waste generated in Sleat. There is big potential to improve the waste management
of the organic waste by composting. Through SESAM 2008 survey, it was found that residents who
are willing to compost, mentioned that limited space in their house or odour from the waste were
obstacles towards composting. Therefore it would be beneficial for the community to have the a
centralized composting plant.
Due to the big potential of the waste management in Sleat Peninsula, two scenarios were
developed according to the strategies.
1. To recycle 27% of household waste, to generate energy from waste with 27% of total waste
and dispose 33% of total waste to landfill
2. To compost 80% of total organic waste generated in 2010, with 27% of recycling rate
The table below shows the comparison among between the total ecological footprint (gha), per
capita ecological footprint (gha/P) and the total CO2 emissions (ton) of the Sleat in 2007
footprint,compared to the result from scenario 1 and 2 in Sleat 2010.
Table 7.5 Summary of impact reduction options
Description Total EF EF
percapita
Carbon EF
Carbon EF per capita
Total CO2 emissions
CO2 emission per capita
[gha/a] [gha/P/a] [gha/a] [gha/P/a] [ton/a] [ton/P/a]
2007 Base Case 764 0.90 713.00 0.84 837 0.99
2010 Waste growth rate:2% annually 796 0.94 742.05 0.88 857 1.01

Ecological Footprint of Sleat 51
Table 7.5 Summary of impact reduction options
Scenario 1
Highland target waste plan 2010 composting rate 13% ,recycling rate 27%, Efw 27%, landfill 33%
566 0.67 562.12 0.66 714 0.84
Scenario 2
Community composting plant, with 80% organic waste composted, and recycling rate of 27%
558 0.66 555.39 0.66 686 0.81
Source: SESAM, 2008
As seen from the table the waste footprint in 2010 rises by 4%. The 2010 footprint was calculated
using the Highland annual waste growth rate of 2%. By implementing Scenario 1, the waste
ecological footprint will be reduced by 29% while with scenario 2, 30% will be reduced. In terms of
CO2 emissions, for scenario 1 and 2, the reduction would be 17% and 20% respectively.
The lowest waste footprint could be attained from scenario 2, due to the reduction of the mileage to
transport the waste to landfill, as well as the footprint of landfill processing.
The increase of recycling waste will increase CO2 emissions due to transportation of waste to the
recycling centre. However, the overall footprint will be reduced as 51% of the embodied energy of
recycled waste will be recovered.
All the scenarios above looked at the potential for different ways of dealing with the current amount
of waste, in order to recover at least some of its value. However, it is always good to reduce the
amount of waste created in the first place.
Ecological Footprint of Sleat 52
The main objective of this study was to determine the ecological footprint of Sleat Peninsula and
develop and assess alternatives scenarios towards sustainability. The result of the study shows
that the ecological footprint of Sleat residents is 4,927.49 gha. It is worth mentioning that the
findings of the study have raised a number of important facts:
● Material and Waste has the highest ecological footprint with 35%. This shows the importance
of employing waste minimization initiatives as suggested in Chapter 7 to reduce carbon
footprint.
● Car Travel accounts for 27% of the ecological footprint of Sleat. The proposed scenarios for
transportation in Chapter 7 can contribute in reducing the carbon footprint.
● Direct energy consumption accounts for 20% of the ecological footprint of the community. This
supports the necessity to promote renewable energy and energy efficiency programs. The
responses of the survey show that the community is aware of the opportunities that can be
exploited from such initiatives. The implementation of the planned projects of the Sleat Trust
would contribute considerably towards reducing carbon footprint of Sleat.
It is anticipated that the results of this study will be useful and assist in making informed decisions.
The analysed ecological footprint is a useful indicator and monitoring tool to measure the progress
of the community towards sustainability over time. Furthermore, the results of the study can be
used to raise awareness among the members of the community on the impacts of their
consumption and lifestyle. As this is the first study done in Sleat, it is hoped that it will be used as
a baseline for follow up studies to be conducted to monitor the effectiveness of future renewable
and energy efficiency projects of the Sleat Community Trust.
CHAPTER 8: CONCLUSIONS

Ecological Footprint of Sleat 53
GLOSSARY Biocapacity or biological capacity: The capacity of ecosystems to produce useful biological
materials and to absorb waste materials generated by humans, using current management
schemes and extraction technologies. How much of renewable resources are made available by
the biosphere’s regenerative capacity?
Biological productive land/area: Is land and water (both marine and inland) area that supports
significant photosynthetic activity and biomass accumulation that can be used by humans.
Carbon footprint: is the measure of the impact human activities have on the environment in terms
of the amount of greenhouse gases produced measured in units of carbon dioxide. In other words
it is the demand human activities places on biocapacity in terms of the amount of land required to
sequester CO2 emissions from all energy activities.
Double counting: refers to counting the same Footprint area more than once. In order not to
exaggerate human demand on nature, it is important to be more than careful to avoid double
counting.
Ecological debt: Is the imbalance between human demand on biocapacity and the available
biocapacity. If you take more than your fair share of the earth's finite natural resources you run up
an ecological debt. If you have a lifestyle that pushes an ecosystem beyond its ability to renew
itself, you run up an ecological debt.
Ecological deficit: When a country’s ecological footprint exceeds the biologically productive area
of its borders, the country runs an ecological deficit. Therefore this is the difference between the
biocapacity and Ecological Footprint of a country or region. The opposite of an ecological deficit is
ecological reserve. A country or region is said to have an ecological reserve when its biocapacity
exceeds its ecological footprint. In this case the calculated ecological footprint is lower or less than
the available biocapacity.
Embodied energy: This is the sum total of all energy inputs used during all stages of a service,
material or product's entire life cycle. This account for energy used from raw material extraction,
transport, manufacture, use and dispose of the product. Footprint studies often use embodied
energy when tracking trade of goods.
Ecological Overshoot: occurs when humanity’s demand on the biosphere exceeds the available
biological capacity of the planet.

Ecological Footprint of Sleat 54
Equivalence Factor: This is the ratio between the worlds average potential productivity of a given
bioproductive area and the world average potential productivity of all biproductive areas. The
equivalence factor is one of the key factors that allow land of different types to be converted into
the common unit of global hectares. This factor is constant for all countries however vary for each
year.
Global hectare: is one hectare of biologically productive space with world-average productivity.
Global hectare is a common, standardized unit used for reporting the land area needed to support
natural resources consumption of the area under study. Global hectares allow the meaningful
comparison of the ecological footprints of different countries, which use different qualities and
mixes of land types. Therefore the use of global hectares recognizes that different types of land
have a different ability to produce useful goods and services for humans. For example one hectare
of cropland can produce a greater quantity of useful and valuable food products than a single
hectare of grazing land. Hence by converting both cropland and pasture into global hectares, they
can be compared on an equal basis.
Yield factor: This is the ratio between productivity of a given land type to the global world average
productivity of the same world type. Within a given land type, such as cropland, the ability of an
area to produce useful goods and services can vary dramatically based on factors such as climate,
topography, or prevailing management. Yield factors therefore, allow different areas of the same
land type to be compared based on the common denominator of yield. Yield factors are calculated
for each land type in each nation every year.

Ecological Footprint of Sleat 55
REFERENCES Ambiente Italia, (2001): European Common Indicators: Towards a Local Sustainability Profile,
Methodology Sheet, Luxemburg
Barret, J, Simmons Craig (2003): An ecological footprint of the UK, Providing a tool to measure the
sustainability of local authorities, Best Foot forward, Stockholm Environment Institute, 2003
Barrett, J et al, G. (2002): A Material Flow Analysis and Ecological Footprint of York: Technical
Report, Stockholm Environment Institute, Sweden.
Best foot forward (1998): Island State: An ecological footprint analysis of the Isle of Wight, London,
UK.
Birch R., Barrett J, and Weidman T. (2004): Ecological Footprint of Inverness, Stockholm
Environment Institute, Sweden
Chambers N., et al (2004): Scotland’s footprint: A Resource Flow and Ecological Footprint of
Scotland, Best Foot Forward, UK.
Chambers, N., Simmons, C. & Wackernagel, M., (2000): Sharing Nature's Interest: Ecological
footprints as an indicator of sustainability, Earthscan, London.
DEFRA, (2006): Family Food survey in 2005-2006 a National Statistics publication, Department for
environment, food and rural affairs (DEFRA), UK.
Food Standards Agency Scotland (2004): Response of the report of the working group on
monitoring Scottish dietary targets, Scotland.
Forestry Commission (2002): Forest Research, Biometrics, Surveys and Statistics - Division
Woodlands, Land Cover Scotland project, UK
Global Footprint Network, (2002): World-Wide Fund for Nature, Living Planet Report Gland,
Switzerland.
Global Footprint Network, (2006): WWF, Living Planet Report Gland, Switzerland.

Ecological Footprint of Sleat 56
Highland Council (2007): Annual Waste Report, Highland Council.
Highland Wood Energy Ltd. (2006): Feasibility Study: Incorporation of Wood Heating at FAS,
Shabal Mor Ostaig, Sleat, Isle of Skye, Fort William.
Highlands and Islands Enterprise, Community land unit (2007): Ordnance Survey Strategy Small
Urban Areas, Highlands and Islands Enterprise, Scotland.
Highlands and Islands Enterprise, Community land unit (2007): Ordnance Survey Inland Water,
Highlands and Islands Enterprise, Scotland.
IPCC (2006): 2006 IPCC Guideline for National Greenhouse Gas Inventories, IGES, Japan
Lillemor Lewan, Craig Simmons (2001): The use of Ecological Footprint and Biocapacity Analyses
as Sustainability Indicators for Sub national Geographical Areas: A Recommended Way Forward,
Oslo.
Oeko Istitute (2004): GTZ in GEMIS 4.2, 1995-2004, Oeko-Institut, Freiburg.
Oeko Istitute (2004): Material Flow Analysis of Sustainable biomass use for energy in GEMIS 4.2
Oeko-Institut, Freiburg.
Renewable Energy Device Solutions, (2006): Sleat Community Trust Renewable Energy Study,
Sleat
Scottish Energy Study (2006): Volume 1: Energy in Scotland Supply & Demand, Scotland.
Simmons, C. et al. (2000): Two feet - Two Approaches a component-based model of Ecological
Footprinting, Ecol Econ UK
Stockholm Environment Institute(2007): Footprint Comparison tool, Stockholm Environment
Institute ,York
Skye Forum, (1993): Isle of Skye data atlas, Skye Forum, Scotland
Sleat Community Trust (2006): A Community Plan for Sleat, Isle of Skye, Sleat

Ecological Footprint of Sleat 57
UNCTAD, Info Comm Market Information in the Commodities Area (2006): Crop, National food
survey committee, National Food Survey. UK.
Wackernagel M. and Kitzes J, (2007): Current Method for calculating National Ecological Footprint
Account, 2007, Science for Environmental and sustainable society, Vol. 4. No1, Research Centre
for Sustainability and Environment Shiga University, UK.
Wiedmann, T. and Minx, J. (2007): A Definition of Carbon Footprint; Durham, United Kingdom
Wiedmann, Tommy et al. (2003): Sustainability Rating for Homes the Ecological Footprint
Component, University of York, UK
World-Wide Fund for Nature International, United Nations Environment Programme, (2002): World
Conservation Monitoring Centre, Redefining Progress & Centre for Sustainability Studies, UK
Internet websites http://assets.panda.org/downloads/lpr2002.pdf 23/13/2007 printed on 10.03.2008
http://www.crn.org.uk/projects/tonnage/frnweights2005.pdf, printed on 11.03.2008
http://www.nationalinsulationassociation.org.uk/housholder/householder-nia.html 10.03.2008
http://www.footprintnetwork.org/gfn_sub.php?content=glossary, printed on 10.03.2008
http://www.surveymonkey.com/s.aspx?sm=%2fQqZUJEIs3Vs1XhZ6asVPg%3d%3d printed on
10.03.2008
www.sleatcommunitytrust.co.uk printed on 10.03.2008
http://statistics.defra.gov.uk/esg/publications/efs/2006cal/default.asp printed on 10.03.2008
http://r0.unctad.org/infocomm/anglais/cotton/crop.htm#rendements printed on 11.03.2008
Map Highlands and Islands Enterprise(2007): Community land unit, GIS maps and KMAP mapping tool.

56
ANNEXES
ANNEX 1. QUESTIONNAIRES Annex 1.1 Household Brief Questionnaire
Questionnaire for Ecological/Carbon Footprint Study
The way we eat, travel, use energy, water, materials, and dispose of our waste affects
the quality of our environment.
To maintain our life, we need land to produce food, energy and materials. We need
space for our houses, roads and waste disposal. If the productive area available on
the earth is divided by the total population, then 4.5 acres would be available for each
person for sustainable way of life. However, our consumption is exceeding what
nature can sustainably support: our “ecological footprint” is larger than 4.5 acres per
person. The ecological footprint of an average Scot is 13.22 acres while for a
Zambian it is only 1.48 acres. If we continue to deplete our nature’s resources the
future generations will have nothing left. To ensure the same quality of life for future
generation, we need to learn to live on smaller footprint.
Energy is one of the main areas where we can effectively reduce our footprint. Energy
is used directly for e.g. lighting, heating and transport and indirectly, embodied in the
products we use in our daily lives.
This Ecological/Carbon Footprint study is envisaged to assess the impacts of the
activities of the community of Sleat on the environment and also provides the basis
for suggestions on how the community can minimize such impacts through use of
renewable energy. Therefore we rely on the inputs of this survey for successful
completion of the ecological/carbon footprint study. We are looking forward to your
kind cooperation. Your responses will be treated strictly confidential and none of this
information will connect with any particular names or addresses.
1. Please indicate your housing type.
1 Detached (single family dwelling) 2 Semi Detached 3 Terraced house 4 Flat/maisonette 5 Other (please specify) _______________________
2. How many bedrooms does your house have? __________________
3. Please fill in the types of vehicles, fuel used and their mileage in the table below.
4. How much money in total does your household as a whole spend on food weekly (buy
in Supermarket)?
5. If you purchase food from local farmer or produce and consume on your own, please
indicate the type and quantity of food: _________________________________________________________________________
_________________________________________________________________________
6. If you purchased any major furniture and electrical appliances in past year, please indicate the type and quantity: _________________________________________________________________________
_________________________________________________________________________
7. Check the types of energy source used by your household annually. If you know the figures, please fill in the quantity consumed or cost.

57
8. How could you personally contribute towards a more sustainable lifestyle?
________________________________________________________________________
________________________________________________________________________
9. What do you think the community can do to contribute towards more sustainable
lifestyle? ________________________________________________________________________
THANK YOU FOR YOUR ANSWERS.
Annex 1.2 Household Extended Questionnaire
HOUSEHOLD CATEGORY
1. Please indicate your housing type.
1 Detached (single family dwelling) 2 Semi Detached 3 Terraced house 4 Flat/maisonette 5 Other (please specify) _______________________
2. What is the area/size of the house? ____________________ (square feet) OR _____________________ (square metres)
3. How many bedrooms does your house have? __________________
4. How many people lived your house on average per weekday and weekend in the
past year?
5. Do you use any of your bedrooms for bed and breakfast? 1 Yes Go to question 6
2 No
6. What was the total number of bed nights in your B&B in the past year? _________________________________________________________________

58
ENERGY
7. Please estimate how much energy your household consumed in the past year.
(If you have your utility bills, please check them; otherwise please give us an estimate.)
8. Where and how do you think you can reduce your energy consumption?
____________________________________________________________________________
____________________________________________________________
HOUSEHOLD TRANSPORTATION
9. Did you own a vehicle in the past year? 1 Yes 2 No Go to question 11
10. Please fill in the types of vehicles, fuel used and their mileage in the past year
in the table below.
11. Do you own a bicycle?
1 Yes 2 No Go to question 13
12. What do you use your bicycle for? 1 Leisure 2 Shopping 3 Work 4 Other (Please specify) _____________________________________
13. What means of transport do you use for going to work?
1 Car 2 Bus 3 Motorbike 4 Bicycle/walk 5 Others
14. What means of public transport do you use when travelling outside Sleat? Please
fill in the approximate mileage travelled last year.
15. How often did you travel by air transport last year? (times)

59
16. Where did you go by air transportation?
17. Would you be able and willing to reduce your travel mileage?
1 Yes 2 No Go to question 19
18. How would you reduce your travel mileage?
1 Bicycling 2 Walking 3 Public transport 4 Sharing car 4 Others (Please specify)______________________________________
19. What measures should the community of Sleat put in place to reduce the mileage? 1 Bicycle tracks 2 Walking tracks 3 Public transport 4 Car Sharing Scheme 4 Others (Please specify)______________________________________
FOOD CONSUMPTION
20. What type of plant and animal based food your families consume at home? Please check the box, which corresponds to the type of food you eat at home (If you know how much you consumed please fill the consumption column)
21. How much money in total does your household spend for eating inside house weekly?
1. In supermarket
2. From farmer, fisherman

60
22. How many times do the members of your household eat out of Sleat region per
week, on average? (Include stops at drive-through and fast-food restaurants)
MATERIAL AND WASTE 23. Did you purchase any furniture and electrical appliances and other equipments
in the past year? 1 Yes Go to question 24 2 No
24. Please list the items you purchased.
____________________________________________________________________
____________________________________________________________________
____________________________________________
Note: Number & Type of Material (furniture)
25. How many bags of waste per week do you dispose?
26. Are you able and willing to compost your waste?
1 Yes 2 No
27. What was the water consumption of your household in the past year?
____________________________________________________________________

61
Annex 1.3 Hotels Brief Questionnaire HOTELS
FOOD CONSUMPTION
1. What is the amount of food cooked or served in your hotel in the past year
(2007)?
r
2. What was the total number of bed nights in the past year?
______________________________________________
MATERIAL AND WASTE
3. Did you purchase any furniture and electrical appliances and other equipments
in the past year? 1 Yes Go to question 4 2 No
4. Please list the items you purchased. _____________________________________________________________________
_________________
Note: Number & Type of Material (furniture)
5. How many bags of garbage per week do you dispose?
ENERGY

62
6. Please estimate how much energy your hotel consumes annually. (If you have your utility bills, please check them; otherwise please give us an estimate.)
7. Where and how do you think you can reduce your energy consumption? ________________________________________________________________________
_
8. What was the water consumption of your hotel in the past year? _______________________________________________________________________
TRANSPORT
9. Does the hotel have its own means of transportation? 1 Yes Go to question 9 2 No
10. Please fill in the table below.

63
Annex 1.4 Small Businesses Brief Questionnaire SMALL BUSINESSES
ENERGY
1. Please estimate how much energy your business consumed last year. (If you
have your utility bills, please check them; otherwise please give us an estimate.)
2. Where and how do you think you can reduce your energy consumption?
____________________________________________________________________________
MATERIAL AND WASTE
3. Did you purchase any furniture and electrical appliances and other equipments
in the past year? 1 Yes Go to question 4 2 No
4. Please list the items you purchased.
_____________________________________________________________________
_________________
Note: Number & Type of Material (furniture)
5. How many bags of waste per week do you dispose?
6. Do you produce any other kind of waste that was not listed in the previous table?
TRANSPORT
7. Please fill in the types of vehicles used for your business, their fuel consumption
and their mileage in the table below.

64
PRODUCTION
8. Please indicate the product and the quantity of the product that you produced,
exported outside Sleat or sold to local people in the past year. If you sell your product to local people, please indicate the average price.
Annex 1.5 College Brief Questionnaire COLLEGE
FOOD CONSUMPTION 1. How much money did the college spend on food in the past year? _______________________________________________________________________
2. What is the amount of food cooked or served for students in the past year?

65
3. How many full time students did the College have in the past year? 1 Campus Residents ________________ 2 Non Campus Residents ____________
4. Please fill in the information for the short courses held in the past year.
5. How many staff did the college have in the past year? 1 Sleat Residents ________________ 2 Non Sleat Residents ____________
6. Did you purchase any furniture and electrical appliances and other equipments
in the past year? 1 Yes Go to question 7 2 No
7. Please list the items you
purchased.
8. How many bags of waste per week do you produce?
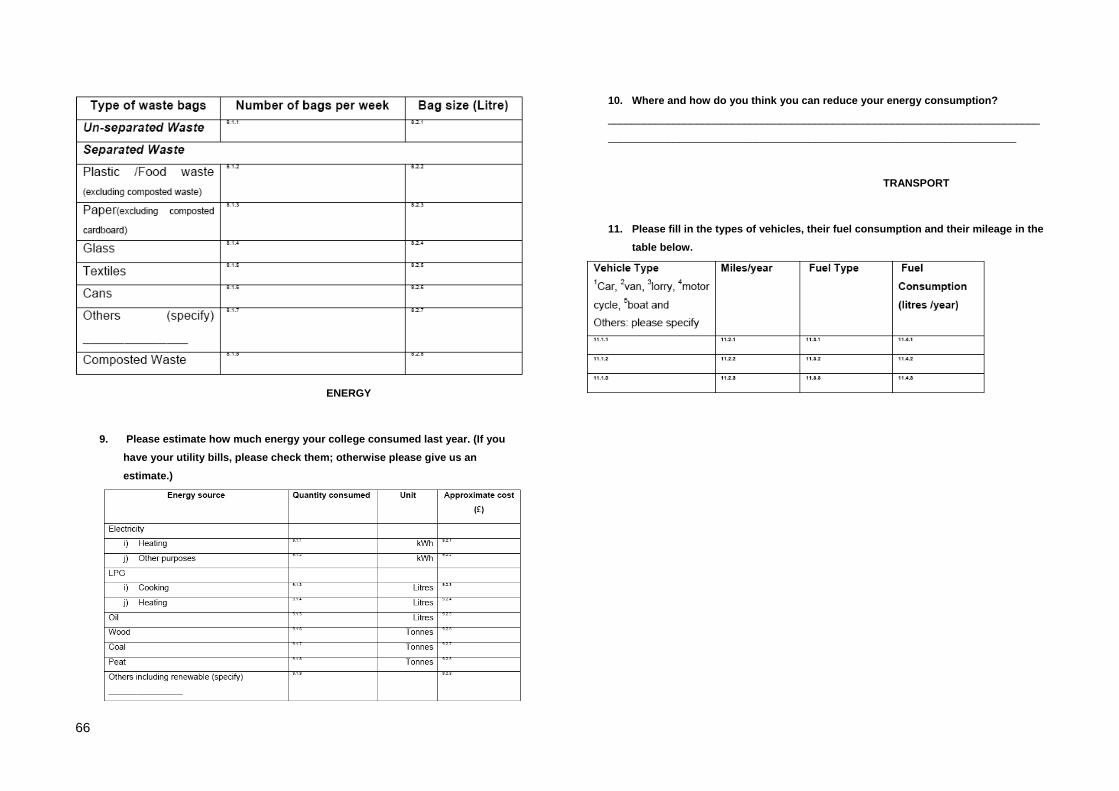
66
ENERGY
9. Please estimate how much energy your college consumed last year. (If you
have your utility bills, please check them; otherwise please give us an estimate.)
10. Where and how do you think you can reduce your energy consumption? _________________________________________________________________________
_____________________________________________________________________
TRANSPORT
11. Please fill in the types of vehicles, their fuel consumption and their mileage in the
table below.

67
Annex 1.6 Schools Brief Questionnaire SCHOOLS
FOOD CONSUMPTION
1. How much money did the school spend on food in the past year? _______________________________________________________________________
2. What is the amount of food cooked or served for students in the past year?
3. How many staff did the school have in the past year? 1 Sleat Residents ________________ 2 Non Sleat Residents ____________
4. Did you purchase any furniture and electrical appliances and other equipments
in the past year? 1 Yes Go to question 5 2 No
5. Please list the items you purchased.

68
6. How many bags of waste per week do you dispose?
7. Do you produce any other kind of waste that was not listed in the previous table?
ENERGY
8. Please estimate how much energy the school consumed last year. (If you have
your utility bills, please check them; otherwise please give us an estimate.)
9. Where and how do you think you can reduce your energy consumption?
____________________________________________________________________________
TRANSPORT
10. Does the school use its own or hired means of transportation? 1 Yes Go to question 11 2 No
11. Please fill in the types of vehicles, their fuel consumption and their mileage in the
table below.

69
Annex 1.7 Medical Center Brief Questionnaire
MEDICAL CENTRE
ENERGY
1. Please estimate how much energy the medical centre consumed last year. (If you
have the utility bills, please check them; otherwise please give us an estimate.)
2. Where and how do you think you can reduce your energy consumption? _____________________________________________________________________________
_______________________________________________________________________
MATERIAL AND WASTE
1. Did you purchase any furniture and electrical appliances and other equipments in the past year?
1 Yes Go to question 4

70
2 No
2. Please list the items you purchased.
____________________________________________________________________
_____________________________________________________________
Note: Number & Type of Material (furniture)
3. How many bags of waste per week do you dispose?
4. Do you produce any other kind of waste that was not listed in the previous table?

71
ANNEX 2. FORMULAS USED IN THIS REPORT Direct Energy Ecological Footprint CO2 emission (tonnes) =CO2 emission factor for different fuel (tonnes/kWh) x quantity of energy
consumed (kWh)
CO2 area (ha) = (CO2 emission (tonnes) x Carbon responsibility)/CO2 sequestration factor (t/CO2
ha yr)
Ecological Footprint of Direct Energy (gha) = CO2 area (ha) x equivalence factor for forest land
(gha/ha)
Area to grow the wood (ha) =Quantity of wood consumption (tonnes)/sustainable yield of the forest
(tonnes/hectare)
Ecological foot print of Forest Land (gha) =Area required to grow the wood (ha) x equivalence
factor for forest land (gha/ha)
Ecological Footprint of Built Land (gha) =Built area required (ha) x equivalence factor for built land
(gha/ha)
Transport Ecological Footprint Car Travel
Total Carbon Emissions (Kg) = Total fuel consumption (liters) x uplift factor x weight of C02 per liter
of fuel (Kg)
Ecological Footprint Energy Land(gha) = Total Carbon Emissions (Kg) x Carbon responsibility
/Sequestration Rate (t/CO2/ha/yr) x Equivalence factor of forest land (gha/ha)
Ecological Fooprint Built Land for Road (gha) = Total Road Area (ha) x Road Share x Equivalence
factor of built land (gha/ha)
Air Travel
Total Carbon Emissions = Total distance traveled(Km) x Carbon emission per passenger Kg/Km x
Uplift factor 1x Uplift factor 2
Ecological footprint for energy land (gha) = Total Carbon Emissions x Carbon responsibility/
Sequestration Rate (t/CO2/ha/yr) x Equivalence factor of forest land (gha/ha)

72
Material Ecological Footprint Energy Land (ha) = Weight of material(ton) x Emboided energy of material (MJ/ton) x CO2
emission (kg/kwh) x Carbon responsibility/Sequestration rate (t/CO2/ha/yr)
Ecological Footprint of Energy Land (gha) = Energy Land (ha) x Equivalence factor for energy
land(gha/ha)
Ecological Footprint of Forest Land (gha) = Weight of paper (ton) x (Volume of wood (m3/ton) /
average yield (m3/ha/y)) x equivalence factor for forest land (gha/ha)
Waste Ecological Footprint Energy Land(ha) = Total landfilled waste generated (ton) x emboided energy of waste(MJ/ton) x
CO2 emission(kg/kWh) x Carbon responsibility/Sequestration rate(t/CO2/ha/yr)
Ecological footprint of Landfilled Waste (gha)= Energy land (ha) x Equivalence factor for energy
land (gha/ha)
Ecological Footprint of Forest Land (gha) = Paper waste (ton) x [Volume of wood (m3/ton) /
average yield (m3/ha/y)] x equivalence factor for forest land (gha/ha)
Ecological Footprint of Recycled Waste (gha ) = Total embodied energy x % embodied energy
savings for recycling x carbon responsibility x equivalence factor of energy land(gha/ha) x [CO2
emission (kg CO2/kWh) /sequestration rate (ton CO2/ha/a)]
Ecological Footprint of Waste Transportation(gha) = [emission factor kg CO2/km x travel distance
(km/y) / average load per waste truck (tonnes) ] x uplift factor /CO2 emission sequestration x
equivalence factor of energy land(gha/ha)
Food Ecological Footprint Step 1:
Area(ha) =Total consumption of food (kg) x Yield(kg/ha)
Step 2:
Energy Land (ha) = Area (ha) x Emboided energy(MJ/kg) x CO2 emission(kg/kwh) x Carbon
responsibility/Sequestration rate(t/CO2/ha/yr)
Step 3:

73
Ecological Footprint of Energy Land (gha) = Energy Land (ha) x Equivalence factor for energy land
(gha/ha)
Ecological Footprint of Crop Land (gha) = Total consumption from crop land (kg) x Equivalence
factor for crop land(gha/ha )/Yield factor(kg/ha)
Ecological Footprint of Sea Land (gha) =Total consumption from sea land (kg) x Equivalence factor
for sea land/Yield factor (kg/ha)
Ecological Footprint of Pasture Land (gha) = Total food consumption from pasture land (kg)
X Equivalence factor for pasture land / Yield factor (kg/ha)
ANNEX 3. CONVERSION TABLES
Length
Area
Volume

74
Time
Mass
Energy
Source:IPCC

76
ANNEX 4. SUMMARY CALCULATION Annex 4.1 Material Footprint Calculation

77
Annex 4.2 Waste Footprint Calculation

78
Annex 4.3 Food Footprint Calculation

79
Annex 4.4 Transportation Footprint Calculation
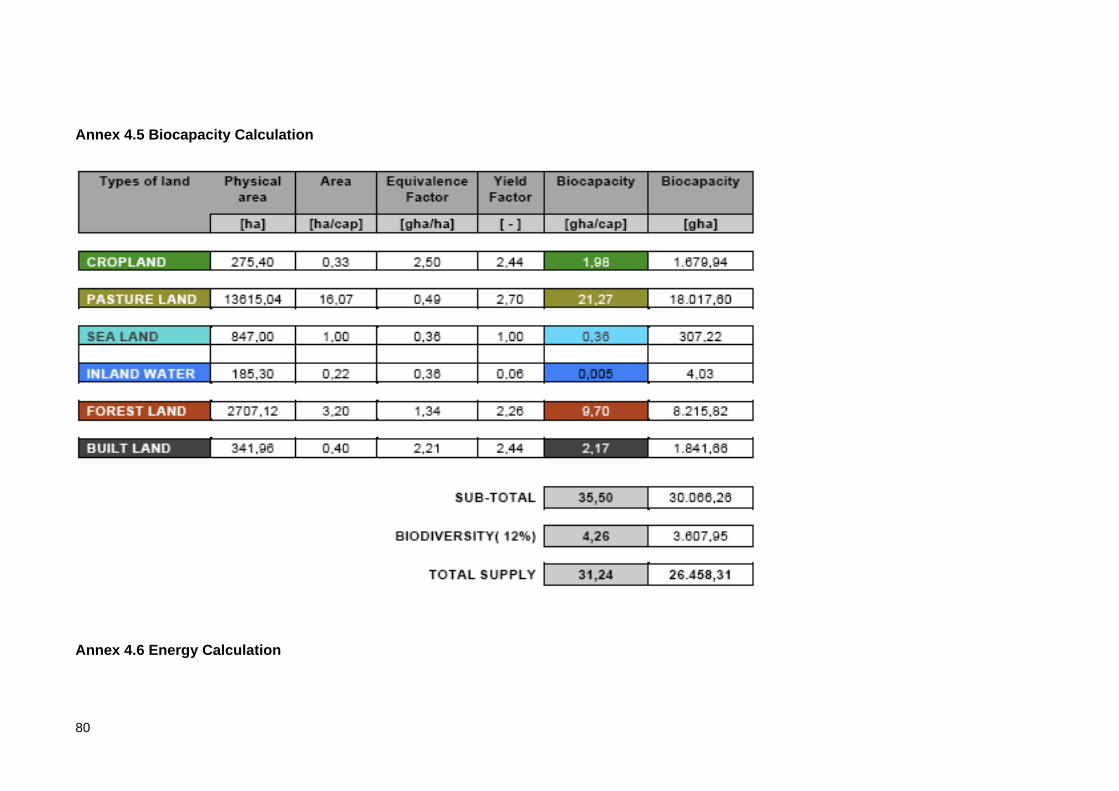
80
Annex 4.5 Biocapacity Calculation
Annex 4.6 Energy Calculation

81

82