Establishing Predominance of English for Specific Purposes ...
Contents lists available at ScienceDirect
Ecological Economics
journal homepage: www.elsevier.com/locate/ecolecon
Analysis
An Integrative Methodological Framework for Setting EnvironmentalCriteria: Evaluation of Public Preferences
Maryam Ramina, Vincent Y.S. Chenga, Dong-Kyun Kima, Felicity J. Nia, Aisha Javeda,Noreen E. Kellya, Cindy Yanga, Sarah Midlane-Jonesb, Shan Mugalingamb,George B. Arhonditsisa,⁎
a Ecological Modelling Laboratory, Department of Physical & Environmental Sciences, University of Toronto, Toronto, Ontario M1C1A4, Canadab Lower Trent Conservation, Trenton, Ontario K8V 5P4, Canada
A R T I C L E I N F O
Keywords:Bay of QuinteDecision MakingPublic PerceptionBayesian InferenceWater QualityAdaptive Management Implementation
A B S T R A C T
The main objective of the present study is to introduce public preferences into the development of water-qualitycriteria that effectively balance environmental concerns and socioeconomic values. A novel feature of our re-search is the analysis of subjective public judgments with Bayesian inference techniques, which are ultimatelyconnected with environmental conditions through mathematical modeling. Our case study is the Bay of Quinte,Ontario, Canada; an embayment at the northeastern end of Lake Ontario with a long history of eutrophication,characterized by frequent and spatially extensive algal blooms and predominance of toxic cyanobacteria. In thisstudy, we present a major survey to determine public opinions on water quality in the area. Our survey wasconducted among a random sample of 1527 local residents and tourists during the summers of 2013 and 2014.The key findings of the survey were: (i) fishing (29%) and beauty of the area (20%) were the main reasons forpublic use of the Bay of Quinte; (ii) among different water-quality problems, the public chose the algal scums(26%) and the integrity of fish populations (22%) as the main issues; (iii) only 30% of the returning visitorsnoticed that the clarity of water is better now relative to the prevailing conditions five years ago; (iv) there is adramatic change in public sentiment between the beginning and end of the summer season; and (v) a substantialportion of local residents were willing to contribute financially towards the restoration of the bay. Our modelinganalysis suggests that the likelihood of public satisfaction increases significantly when the total phosphorusconcentrations fall below the critical levels of 20–25 μg L−1, which however is a difficult target to achieve evenunder significantly reduced nutrient-loading conditions. Other biological variables such as chlorophyll a con-centrations, harmful algal blooms, and toxin levels in locations frequently used by the public appear to moreclosely influence their satisfaction level.
1. Introduction
In 1987, the International Joint Commission (IJC) amended theGreat Lakes Water Quality Agreement (GLWQA), a binational treatybetween the United States and Canada, to effectively address the on-going pollution issues threatening the physical, chemical, and biolo-gical integrity of the Great Lakes (Krantzberg, 2012a). The growingappreciation of the complex policy decisions required to restore andmaintain the ecological integrity against the cumulative effects of amultitude of tightly intertwined stressors has also brought about a shifttowards an holistic ecosystem management (Zhang and Arhonditsis,2008; Krantzberg, 2012a). The GLWQA provided the framework toguide the management of 43 severely degraded waterbodies, referred to
as Areas of Concern (AOCs), and restore beneficial uses that have beenimpaired, known collectively as Beneficial Use Impairments, or BUIs(Sproule-Jones, 1999; George and Boyd, 2007). Generally, BUIs reflectpoor ecological status, in terms of water and sediment quality, habitatdegradation, and/or impairments that might adversely affect humanhealth (George and Boyd, 2007).
Remedial Action Plans (RAPs) have been developed and im-plemented to streamline the ecosystem management process as follows:initial designation of a site as an AOC and identification of BUIs; es-tablishment of desirable (or “delisting”) environmental goals, objec-tives and actions towards ecosystem restoration; final assessment of theprogress until all metrics have been met, and the system is ready to bedelisted as an AOC (George and Boyd, 2007). RAPs have been based on
https://doi.org/10.1016/j.ecolecon.2018.01.009Received 18 June 2017; Received in revised form 2 December 2017; Accepted 8 January 2018
⁎ Corresponding author.E-mail address: [email protected] (G.B. Arhonditsis).
Ecological Economics 147 (2018) 298–311
0921-8009/ © 2018 Elsevier B.V. All rights reserved.
T

a variety of stakeholders from a range of sectors, including but notlimited to governmental organizations, academia, industry, agriculture,and conservation agencies (Krantzberg, 2012b), with several AOCsencouraging active participation from local community members. Todate, seven out of 43 AOCs have been delisted through this process(White Lake, Deer Lake, Presque Isle Bay, Oswego River, CollingwoodHarbor, Severn Sound, Wheatley Harbor), while two other AOCs are “inrecovery” status (Jackfish Bay, Spanish Harbor); the latter classificationimplies that all RAP actions to restore water quality and ecosystemhealth have been completed, but more time is needed for the en-vironment to recover and for environmental quality objectives to beachieved. The GLWQA marks a novel approach in environmental gov-ernance through the incorporation of citizen participation into trans-boundary environmental protection between Canada and the UnitedStates (Krantzberg, 2012a). Community participation provides valuableexperiential knowledge, deeper understanding of facts, recognition ofnatural variability and uncertainty, and incorporation of human valuesand beliefs (Perkins, 2011; Dietz, 2013). Including citizens in the de-cision making process also helps legitimize decisions and promotesfunding (Krantzberg, 2003). A characteristic example of public con-sultation was the Ashtabula River and Harbor (Ohio, US), where localcitizens not only accepted taxation to support the clean-up of the localAOC, but also formed a successful partnership with governmentalbodies that facilitated the local remediation efforts (Lichtkoppler andBlaine, 1999).
Integrating stakeholder and public values with scientific evidenceand cost–benefit analyses can be a challenging task, since decisionmaking in environmental restoration projects involves inherent trade-offs among sociopolitical, environmental, ecological, and economicfactors (Cangelosi, 2001; Nelson et al., 2009; De Groot et al., 2010;Wegner and Pascual, 2011). Stakeholder and public values can easilybecome intractable during the decision making process, as they cannotbe translated easily into monetary values or quantitative terms (Kikeret al., 2005). Conversely, stakeholders and public have played a keyrole in encouraging governmental bodies to take more responsibility, aswell as in minimizing the risk of future polarization (Krantzberg,2012b). Public involvement may be as simple as having water usersgive feedback on the esthetic and water-quality changes of a waterbody(e.g., Carroll and Strang, 2014). Public participation is not unique to theCanadian or American AOCs in the Great Lakes area (e.g., Warrineret al., 1996; Irvin and Stansbury, 2004). For example, Papillion Creek(Nebraska, US), a heavily degraded watershed with flooding issues, is acase where public participation was unsuccessful, in part due to theirlimited power to forcefully guide the decision making process (Irvinand Stansbury, 2004). The Grand River watershed (Ontario, Canada)has elicited public consultation regarding issues of resource manage-ment, groundwater contamination, and urban development (Warrineret al., 1996). Comparative analysis of all of these issues provided acontextually rich account of the circumstances under which publicconsultation in watershed management can be beneficial for the localrestoration efforts (Warriner et al., 1996). Along the same line ofthinking, Warriner et al. (1996) highlighted the importance of givingcommunity members an active role in the decision making process,arguing in favor of the notion that ecologically minded societies shouldembrace direct rather than representative democracy. The motivationfor increased citizen participation is founded on the assumption that ifcitizens become active participants in the policy-making process, gov-ernance will become more democratic and effective. One more reasonfor citizen participation is that ecosystem services embody character-istics of public goods, so we need to employ methodologies that capturetheir collective character. As a result, policies will be developed withimpartial consideration of citizen preferences, and the public will be-come more understanding of the challenges underlying the decisionsmade by government administrators (Irvin and Stansbury, 2004).
The objective of this paper is to present a Bayesian methodologicalframework that engages the perspective of the public on the criteria-
setting process through the development of predictive linkages amongmeasurable water-quality variables, such as total phosphorus (TP) andchlorophyll a (Chla) levels, and the anticipated public response. TheBay of Quinte (Ontario, Canada) is used as a case study to understandthe decision making process and the type of information contributedthrough citizen participation practices. Based on surveys of visitors andlocal residents of the Bay of Quinte, we attempt to elucidate the level ofpublic satisfaction with the prevailing conditions in the system. Ourframework addresses the urgent need for novel policy analysis toolsthat bring a shift towards a more democratic and effective governancethrough (i) the introduction of the preferences of primary users/con-sumers of ecosystem services, which has been a major oversight of thecontemporary environmental management practices; and (ii) the abilityto iteratively update our beliefs by accounting for the significantvariability in space and time as well as the uncertainty with ourknowledge of the ecosystem functioning.
2. Methods
2.1. Module 1: Public Survey
The first module of our framework involves the public survey toaddress questions pertinent to the Beneficial Uses of the Bay of QuinteAOC. We prepared a questionnaire to assess the perceptions of bothlocal residents and tourists. The questionnaire comprised twenty-two(22) questions, surveying their preferential uses, their perceptions/concerns about the bay, and their demographic information (Pleaserefer to our Supporting Information). All the representatives from theRAP technical team and the University of Toronto Research EthicsCommittee reviewed the questionnaire (RIS Prod ID 00028997). Somemodifications were also implemented based on public feedback. Wevisited the Bay of Quinte and conducted random surveys of local re-sidents and tourists from May to September in 2013 and in 2014 (a totalof 25 visits). Average survey length was approximately three minutesper person. A total of 721 individuals were surveyed in 2013 and 806individuals in 2014 (N=1527). The main sites were four towns in theupper (Trenton, Belleville, and Deseronto) and middle bay (Picton),where we could access high population numbers to facilitate our survey(Fig. 1).
2.2. Module 2: Bayesian Modeling of Public Perception
The second module aims to assess public perception of the pre-vailing water-quality conditions according to the socio-economic status(e.g., age, gender, education level and income) of the respondents atdifferent locations and periods of the year. Public perception analysisfocused on two important questions: (i) What is the level of public sa-tisfaction with the current state of the Bay of Quinte? (ii) How does thesocio-economic status of respondents relate to their satisfaction? Toassess public satisfaction, we developed a multinomial model thatquantifies the likelihood of a certain public sentiment/attitude in timeand space. The governing equations are as follows:
Y p N~Multinomial( , )ijk ijk ij
∑=p ϕ ϕ/ijk ijk ijk
= +ln ϕ α β( )ijk ik jk
∑ ∑ =α β, 0ik jk
α β N, ~ (0, 10000)ik jk
where Yijk is the number (counts) of public response for five satisfactionlevels k; in group category j (age, amount willing to donate, educationlevel, and gender) in different months (May to August) or locations iwith a given sample size Nij; pijk refers to the probability of the public
M. Ramin et al. Ecological Economics 147 (2018) 298–311
299

response as determined by the latent variable φijk; the two coefficientsαik and βjk are drawn from the uninformative (flat) distributions and areused to delineate the relative importance of time or space i and de-mographic category j, respectively, in shaping the level of public sa-tisfaction.
2.3. Module 3: Linkages Between Ecological Conditions and PublicSatisfaction
The third module links the level of public satisfaction with the trophicstatus of the Bay of Quinte. Specifically, we connected the public sa-tisfaction responses with the prevailing water-quality conditions a fewdays prior to or after the date of the survey (i.e., Chla and TP con-centrations). The Bayesian configuration of the third module is structu-rally similar to the modeling exercise in the second module. The onlydifference is that the latent variable φijk is determined by the prevailingwater-quality conditions, Ci, such as Chla or TP concentrations:
= +ln ϕ β β ln C( ) · ( )ijk jk jk i0 1
where the regression intercept β0jk and slope β1jk are drawn from non-informative prior distributions.
2.4. Module 4: Linkage Between Management Strategies and PublicSatisfaction
We used the process-based eutrophication model developed by Kimet al. (2013) to predict the prevailing water-quality conditions in theBay of Quinte in response to nutrient loading reduction strategies.Specifically, Kim et al. (2013) advanced the mechanistic foundation of aTP mass-balance model, originally developed by Minns et al. (2004)and more recently modified by Zhang et al. (2013). The model ex-plicitly simulates macrophyte dynamics; the role of dreissenids; and thefate and transport processes of phosphorus in the sediments of the Bayof Quinte, such as particulate sedimentation dependent upon thestanding algal biomass, sediment resuspension, sorption/desorption inthe sediment particles, and organic-matter decomposition. The spatialvariability of various external and internal TP flux in the differentsegments of the Bay of Quinte are provided in our Supporting In-formation section (Fig. SI 1; see also Kim et al., 2013). The projectedsystem responses to nutrient loading management strategies weresubsequently associated with the public satisfaction levels through theBayesian modeling network presented in the third module (Fig. 2).
2.5. Bayesian Implementation
Bayesian inference was used as a means for estimating modelparameters in the second and third modules, whereby our prior beliefs
regarding the question at hand are quantitatively updated by takinginto account existing water-quality measurements. Bayesian inferencetreats each parameter θ as a random variable and uses the likelihoodfunction to express the relative plausibility of obtaining different valuesof this parameter given the available data from the system (Gelmanet al., 2004):
∫=
⋅
⋅P θ data P θ P data θ
P θ P data θ dθ( | ) ( ) ( | )
( ) ( | )θ
where P(θ) represents the prior distribution of the model parameter θ, P(data|θ) indicates the likelihood of data observation given the differentθ values, and P(θ|data) is the posterior probability representing ourupdated beliefs on the θ values, contingent upon the empirical knowl-edge from the system. The denominator is often referred to as themarginal distribution of the available data (Gelman et al., 2004) andacts as a scaling constant that normalizes the integral of the area underthe posterior probability distribution. To obtain sequences of realiza-tions from the posterior distribution, we used Markov-chain MonteCarlo (MCMC) sampling available in the WinBUGS software (Lunnet al., 2000). For each of the models examined, we used three chainswith 50,000 iterations, by keeping every 10th iteration to minimizeserial correlation. The first 5000 samples were discarded to eliminatethe effect of the initial parameter values assigned (burn-in), and con-vergence was assessed qualitatively by visually inspecting (i) plots ofthe Markov chains for mixing and stationarity and (ii) the corre-sponding density plots of the pooled posterior Markov chains for un-imodality. We also assessed convergence quantitatively using themodified Gelman–Rubin convergence statistic (Brooks and Gelman,1998). The accuracy of the posterior parameter values was examined byensuring that the Monte Carlo error for all parameters was< 5% of thesample standard deviation.
3. Results
3.1. Module 1: Public Survey
The public primarily used the Bay of Quinte for fishing (29%),beauty of the system (20%), and other activities (18%), e.g., farmer'smarket, leisurely walk, and picnicking (Fig. 3a). The qualities ofgreatest importance to the public were absence of algal scums (26%),sport-fish abundance (22%), followed by less dirt in the water and noodor (16%) (Fig. 3b). The majority of the public was dissatisfied withthe water-quality conditions of the bay, including the water clarity(Fig. 4a,b). Their responses to aquatic plants as a major disturbancewere mixed; whereas half of the respondents (50.1%) did not seeaquatic plants as being a major disturbance, 30.4% and 19.5% sawaquatic plants as a major and somewhat major disturbance, respectively
Fig. 1. Map of the Bay of Quinte and main locations surrounding the Bay.
M. Ramin et al. Ecological Economics 147 (2018) 298–311
300

Fig. 2. Engagement and perspective of local people, sta-keholders and policy makers on the criteria-setting processand the identification of the optimal water-quality criteriathat effectively balance between environmental concernsand socioeconomic values. Our framework aims to establishthe missing causal link between model predictions andstakeholder/public perceptions.
400
300
200
100
0
400
500
300
200
100
0
swim
ming
fishin
g
bay b
eauty
picnic
king
jet sk
iing
cano
eing/k
ayak
ing
moroti
zed b
oatin
g
Tubing
/Wate
r skii
ngoth
er
water t
empe
ratur
e
little
wate
r colo
r
little
wate
r odo
r
no al
gal s
cums
spor
t fish
popu
lation
s
little
dirt
in the
wate
roth
er
Num
ber
of R
espo
nses
Num
ber
of R
espo
nses
What are you using the Bay of Quinte for?
What qualities of the water do you believe areimportant to be able to use the Bay?
Water Qualities
Activities
(a)
(b)
Fig. 3. Bar graphs depicting (a) the public usage of the Bay of Quinte, and (b) the qualities of water the public respondents believe to be important.
M. Ramin et al. Ecological Economics 147 (2018) 298–311
301

(Fig. 5a). After revealing to the interviewees that aquatic plants re-present an important habitat that may play an important role in con-serving fish populations, only 4.3% felt the same way regarding theirearlier skepticism about their presence in the system, but 34.03% of therespondents were still not completely convinced that aquatic plantsmay help conserving fish populations (Fig. 5b).
More than two-thirds (68%) of the public surveyed used the bay atleast once per month (Fig. SI-2). Of the respondents who had visited thebay more than once, 47% were in the area within the past year, andabout a quarter (26% and 27%) had visited within the past five years ormore than five years ago, respectively (Fig. 6a). The most noticeablechange by the public was water clarity, followed by the odor of water,fish catch, weed, and algae (Fig. 6b). Although there were both positiveand negative public perceptions related to the changes in each of theabove attributes, we witnessed more positive than negative feedbackand the public was generally willing to come back to the Bay of Quinte.
Public satisfaction was examined in time and space by categorizingthe summer period into four months, May to August, and the study areainto four locations, from upper to lower Bay of Quinte, Trenton,Belleville, Deseronto, and Picton. Public satisfaction declined dramati-cally from the beginning to the end of the summer season (Fig. 7a,b).The highest percentage of respondents felt that water clarity and smellhad improved during our survey in May. This percentage graduallydecreased in June and July. In August, more than half of the re-spondents reported that water clarity and smell had worsened (Fig. 7a).A similar pattern was found with the level of satisfaction regarding the
water-quality conditions of the bay, except that the negative perceptionmanifested itself earlier, i.e., in July rather than in August (Fig. 7b).Public satisfaction also varied dramatically by region. While more thana quarter of the responses indicated satisfaction with the conditions inTrenton, less satisfied was the public in Deseronto and Picton, withBelleville being the worst (Fig. 7c).
We examined public satisfaction according to different demographiccharacteristics; namely, age, gender, education, and proximity of re-sidence to the bay. Each demographic, except gender, was partitionedinto five categories. All demographic groups - according to age, edu-cation, and location of residence in proximity to the bay - were gen-erally dissatisfied with the state of the bay (Figs SI 3–5). We did not findany significant differences with respect to the satisfaction level amongthe various age demographics. In relative terms, the younger (< 18 and18–25) and 50–65 age groups were more dissatisfied than other agegroups (Fig. SI 3; see also following multinomial modeling results).Participants with high-school education displayed the lowest satisfac-tion, whereas individuals with university-level education were rela-tively neutral in their perception (Fig. SI 4). The most distinct shift inthe satisfaction level was displayed with the location of residence re-lative to the bay (Fig. SI 5). The public who identified their residency asbeing close to the shoreline was generally more dissatisfied. Lastly, inresponse to the question whether the public realizes that the Bay ofQuinte is listed as an AOC, 55% replied “yes”, which means that justabove half of the public was aware that the bay is still considered animpaired area still subject to remedial measures. When asked as to
(a)
(b)
0
100
200
300
400
500
600
700
800
1=Completely agree(Completely
satisfied)
2=Agree(Satisfied)
3=Neutral 4=Disagree(Dissatisfied)
5=Strongly disagree(Strongly
dissatisfied)
Num
ber
of R
espo
nses
Public Beliefs
The water of the Bay of Quinte is clear today
0
100
200
300
400
500
600
700
1=Completely agree(Completely
satisfied)
2=Agree(Satisfied)
3=Neutral 4=Disagree(Dissatisfied)
5=Strongly disagree(Strongly
dissatisfied)
Num
ber
of R
espo
nses
Degree of Satisfaction
The conditions of the Bay are perfect for my uses today
Fig. 4. Bar graphs depicting (a) the public opinion on theclarity of the Bay, and (b) the public opinion on the con-ditions of the Bay being perfect for their use.
M. Ramin et al. Ecological Economics 147 (2018) 298–311
302

whether they feel the system was close to being delisted as an AOC, asimilar percentage (53%) of the public did not believe that the Bay ofQuinte will be restored in the near future.
3.2. Module 2: Bayesian Modeling of Public Perception
What is the level of public satisfaction in relation to their demo-graphic group? The Bayesian multinomial model described in thesecond module predicted the level of satisfaction in space and time andacross different characteristics of the survey participants; such as localsor tourists, age, gender, and education. All age groups of local residentswere predicted to hold negative opinions, with the 50–65 age grouppredicted to be the most dissatisfied (Table 1). Regarding the local/tourist classification, the likelihood of public satisfaction with thecurrent state of the Bay of Quinte was low among local residents, whowere generally more dissatisfied than tourists (Tables 1 to 4). For localresidents, the satisfaction levels were fairly similar among the differentage groups compared to the tourists, with the degree of dissatisfactionranging from 55%–65%, as opposed to dissatisfaction levels between44%–68% across the tourist age groups (Table 1). A more detailedprediction by month (Table SI 1) reinforces our earlier results thatpublic perception became exceedingly negative as the summer seasonprogressed. In a similar manner, our predictions by location instead ofmonth showed that the<18 and 50–65 age groups in Quinte Westwere mostly dissatisfied (Table SI 2). Interestingly, there were
practically no differences in regard to the public satisfaction betweengenders (Table 2), while a more detailed breakdown by month andlocations provided very similar results as stated above (Tables SI 3 andSI 4). In predicting public satisfaction by education and local/touristclassification, there was a slight increase in the likelihood of being sa-tisfied with higher education levels for both locals and tourists, with theonly exception being the lowest-education (some high school) group,which was the most satisfied group for both tourists and local residents.The tourists with the lowest education levels were by far the most sa-tisfied. The dissatisfaction level of different education groups amongthe local residents studied showed much less divergence (50%–63%)than the dissatisfaction levels of the tourists (29%–62%) (Table 3).Dissecting the perceptions by month and location showed very similarresults to those stated above (Tables SI 5 and SI 6). Lastly, our modelingresults reinforce our earlier finding that the public perception shiftedfrom mainly positive in May to overwhelmingly negative in August forboth locals and tourists (Table 4).
How does the socio-economic status of the respondents relate totheir satisfaction and their willingness to donate? Our Bayesian multi-nomial modeling exercise also identified a presumably causal associa-tion between donation levels to support the local restoration efforts andtheir level of satisfaction with the prevailing water-quality conditions.A substantial proportion of local residents, across all age groups, werepredicted to be willing to contribute financially towards the restorationof the Bay of Quinte (Tables 5 and SI 7–SI 11). Senior tourists were also
(a)
(b)
0
100
200
300
400
500
tahwemoSoNseY
Num
ber
of R
espo
nses
Response
Do you feel that the aquatic plants are a major disturbance?
700
600
500
400
300
200
100
0yes no somewhat
Response
Num
ber
of R
espo
nses
Do you still feel that aquatic plants are a majordisturbance, although they represent a favorable
habitat for fish?
Fig. 5. Bar graphs depicting (a) the public opinion onwhether or not aquatic plants are a major disturbance,and (b) whether or not the respondents feel the same,knowing that aquatic plants are favorable habitats forfish.
M. Ramin et al. Ecological Economics 147 (2018) 298–311
303

predicted to be willing to donate higher amounts (Table 5), while se-parating the tourists by gender showed that female tourists are moti-vated to donate more than male tourists (Table SI 7). The amount thatlocal residents are willing to donate increases with education level fromhigh school to university level, while the opposite was true for tourists(Table SI 8). Counter to the response of the tourists, local residents werealso willing to donate more during May and June than July or August(Table SI 9). Overall, the locals were marginally more motivated todonate than the tourists (Table SI 10). Interestingly, the more satisfiedlocals were willing to donate more than their dissatisfied counterparts,whereas the most dissatisfied tourists expressed greater willingness tocontribute (Table SI 11). A more detailed analysis of the willingness ofthe local/tourist groups to donate in relation to public satisfaction bymonth revealed similar results as above; that is, the tendency fortourists to donate more in July and August while the local residentsseem more supportive in May and June (Table SI 12). A similar analysison the willingness to donate in relation to public satisfaction by loca-tion showed that tourists in Quinte West were by far the most generousgroups, especially the ones that were dissatisfied. In contrast, donationamount within the local residents did not vary much by location (TableSI 13).
3.3. Module 3: Linkages Between Ecological Conditions and PublicSatisfaction
In the third module, our Bayesian multinomial modeling predicted
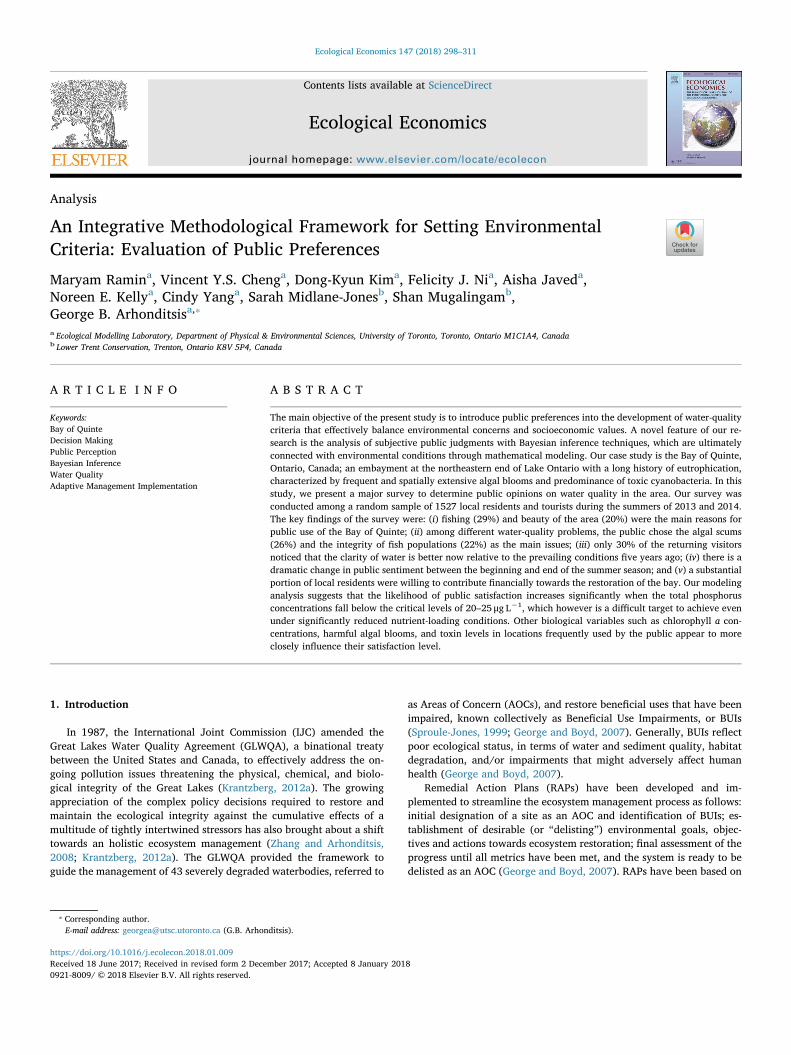
public perception of water-quality as a function of Chla (Fig. 8) and TPconcentrations (Fig. SI 6). Public satisfaction was predicted to de-crease significantly from 80% to< 5% as phytoplankton biomass in-creased from< 3 μg Chla L−1 to ~50 μg Chla L−1. The most sig-nificant drop in percentage of public satisfaction occurred within the0–10 μg Chla L−1 range, from 80% to nearly 20%, and it graduallydeclined to< 5% as phytoplankton biomass increased from 10 to50 μg Chla L−1 (Fig. 8 top left). The exact opposite pattern was pre-dicted when our modeling exercise focused on the public dissatisfac-tion level (Fig. 8 bottom left). Percentage of dissatisfaction increaseddramatically from 5 to> 60% as phytoplankton abundance increasedfrom 0 to 10 μg Chla L−1, and it plateaued to> 85% as Chla con-centration increased to 50 μg Chla L−1. The variability of neutralperception was comparatively much lower, from 9% to 17% across the1–50 μg Chla L−1 range, with the peak of 17% occurring when theChla concentration was 5 μg L−1 (Fig. 8, top right). Lastly, we calcu-lated a weighted average of the three-perception categorical scheme(specified numerically as satisfied= 1, neutral = 3, and dis-satisfied= 5) to predict the total perception as a function of Chlaconcentration (Fig. 8, bottom right). The latter exercise reinforced thepattern of negative perception that increases linearly from 1 to10 μg Chla L−1, and remains strongly negative for higher phyto-plankton biomass levels. We found similar results when public per-ception was modeled as a function of TP (Fig. SI 6); namely, publicsatisfaction fell below 20% once the 30 μg TP L−1 was exceeded (Fig.SI 6 top left), and public dissatisfaction correspondingly increased
less w
eeds
more w
eeds
less f
ish ca
ught
more f
ish ca
ught
smell
wor
sene
d
smell
impr
oved
clarit
y dec
lined
clarit
y inc
rease
d
more a
lgae
less a
lgae
other
Public Beliefs
Latest Visit
What changes have you noticed?
If this is not your first visit, when did you lastvisit this place?
within last year within last 5 years more than 5 years ago
400
500
300
200
100
0
400
300
200
100
0
Num
ber
of R
espo
nses
Num
ber
of R
espo
nses
(a)
(b)
Fig. 6. Bar graphs depicting (a) the public use of the Bay of Quinte, and (b) qualitative changes noticed.
M. Ramin et al. Ecological Economics 147 (2018) 298–311
304

Fig. 7. Pie graphs depicting (a) month-to-month variability ofthe observed changes over the previous five years, (b) month-to-month variability of the level of satisfaction with the Bay ofQuinte, and (c) variability of the level of satisfaction with theBay of Quinte across different locations in the area.
M. Ramin et al. Ecological Economics 147 (2018) 298–311
305

above 60–70% with ambient TP levels above 25–30 μg TP L−1 (Fig. SI6 bottom left).
3.4. Module 4: Linkage Between Management Strategies and PublicSatisfaction
After linking public sentiment with the trophic state of the Bay ofQuinte, we used a process-based eutrophication model to assess hownutrient loading management reductions can change nutrient con-centrations and subsequently public perception (Kim et al., 2013). Wealso used the empirical TP-Chla relationship, developed by Zhang et al.(2013), to assess the public perception in response to a potential declinein phytoplankton biomass. Predictions of public satisfaction with waterquality are shown at two locations (U2, U3) in the upper bay in 2005(Fig. 9 top row) and 2008 (Fig. 9 bottom row), based on tributary in-flow TP concentrations (TPnon-point) and flushing rate, ρ (year−1), or thenumber of times the system flushes in one year. These two locationsoften experience high TP (> 50 μg L−1) and Chla (> 40 μg L−1) con-centrations and represent the core area of the Bay of Quinte AOC (seealso Kim et al., 2013; Zhang et al., 2013; Arhonditsis et al., 2016).Recent empirical evidence suggests that frequent cyanobacterialblooms, associated with toxic species of the genus Microcystis, wereobserved in these locations, despite a great deal of effort to reduce TPloading over the past three decades (Shimoda et al., 2016). Moreover, asignificant amount of ambient phosphorus stemmed from internal nu-trient recycling derived from macrophytes and dreissenids (Arhonditsiset al., 2016). When simulating the 2005 conditions, our exercise in-dicated that public perception in location U2 (a segment from themouth of Moira River, comprising the Big Bay, Muscote Bay, and NorthPoint Bay) would have been consistently negative regardless of the
TPnon-point and flushing rate considered (Fig. 9 top left panel). Whensimulating the 2008 conditions, however, not only did perception movecloser to neutral from dissatisfied, but also the variability of theflushing rate and TPnon-point induced changes that distinctly affectedpublic perception (Fig. 9 bottom left panel). In location U3 (an areainfluenced by the inflows of Napanee River, extending to the outlet ofHay Bay), during the 2005 simulations, public perception was morenegative than that projected in U2 and quite sensitive to the variabilityof the hydrodynamic regime and external loading (Fig. 9 top right).Similar to the U2 segment, however, the predicted public perception atU3 improved in the 2008 simulations, and the sensitivity to bothflushing rates and tributary TP inflow concentrations also increased(Fig. 9 bottom right panel). An alternative assessment of public sa-tisfaction with water quality, based on predictions of ambient TP con-centrations at two locations (U2, U3) in the upper Bay of Quinte in the2005 and 2008 simulations, is also shown in Fig. SI 7. Overall, ourmodeling exercise, using the integrated eutrophication-public percep-tion model, showed that public satisfaction appears to be more re-sponsive to phytoplankton biomass rather than ambient TP variability.
4. Discussion
We have presented a novel methodological protocol that strives tointegrate public perspective into the criteria-setting process and toidentify the optimal water-quality targets that balance effectively be-tween environmental concerns and socioeconomic values. We first fo-cused on addressing two major questions: (i) What is the level of publicsatisfaction with the current state of the Bay of Quinte? (ii) How doesthe socio-economic status of respondents relate to their satisfaction? Weanswered these questions through our public survey data by estimatingthe likelihood of a certain public sentiment/ attitude for a given periodof the year, location, and demographic group. We then linked typicallymeasured water-quality variables, such as TP and Chla concentrations,to public responses in order to predict the anticipated sentiment of end-users relative to projected changes in the trophic state of the bay.Furthermore, we showcased the ability of the framework to connect thepredicted public satisfaction level with a mathematical model that si-mulates the interplay among phosphorus, phytoplankton, macrophytes,and dreissenids. The presented methodological framework thus aims toserve as a policy analysis tool for setting environmental targets in theBay of Quinte area, while explicitly considering the public preferences
Table 1Likelihood (%) of Public Satisfaction level (Satisfied, Neutral, Dissatisfied) by age.
Age Satisfied Neutral Dissatisfied Satisfied Neutral Dissatisfied
< 18 26% 10% 64% 27% 18% 55%
18-25 23% 18% 59% 29% 18% 53%
26-35 33% 12% 55% 29% 28% 44%
36-49 20% 23% 57% 34% 17% 49%
50-65 25% 11% 65% 21% 11% 68%
> 65 23% 17% 60% 35% 9% 56%
Public Satisfaction (Local) Public Satisfaction (Tourist)
Table 2Likelihood (%) of Public Satisfaction level (Satisfied, Neutral, Dissatisfied) by gender.
Gender Satisfied Neutral Dissatisfied Satisfied Neutral Dissatisfied
Male 26% 15% 59% 28% 17% 54%
Female 23% 16% 61% 32% 19% 50%
Satisfaction (Local) Satisfaction (Tourist)
Table 3Likelihood (%) of Public Satisfaction level (Satisfied, Neutral, Dissatisfied) by education.
Education Satisfied Neutral Dissatisfied Satisfied Neutral Dissatisfied
Some High School 36% 10% 54% 57% 14% 29%
High School 23% 14% 63% 21% 17% 62%
College 24% 17% 59% 36% 13% 51%
University 22% 28% 50% 34% 27% 39%
Post-grad 33% 8% 59% 40% 25% 35%
Satisfaction (Local) Satisfaction (Tourist)
Table 4Likelihood (%) of Public Satisfaction level (Satisfied, Neutral, Dissatisfied) by month.
Month Satisfied Neutral Dissatisfied Satisfied Neutral Dissatisfied
May 59% 14% 27% 53% 10% 37%
June 47% 21% 32% 48% 21% 31%
July 15% 16% 69% 14% 20% 66%
August 8% 10% 82% 12% 12% 76%
Satisfaction (Local) Satisfaction (Tourist)
Table 5Willingness to donate among groups (local/tourist) by age.
Age < 5 5-50 50-100 >100 < 5 5-50 50-100 >100
< 18 61% 27% 10% 2% 54% 36% 9% 0%
18-25 47% 28% 16% 8% 53% 37% 10% 0%
26-35 47% 44% 7% 2% 54% 32% 12% 2%
36-49 40% 36% 7% 17% 51% 42% 3% 5%
50-65 40% 43% 9% 8% 48% 21% 14% 17%
> 65 52% 30% 5% 12% 35% 29% 18% 18%
Donation (Local) ($) Donation (Tourist) ($)
M. Ramin et al. Ecological Economics 147 (2018) 298–311
306
and likelihood of satisfaction.Our public survey primarily showed that both local residents and
tourists value the Bay of Quinte as a recreational venue. However, thepublic is dissatisfied with the current conditions of the bay. The publicappeared to be concerned as to whether the fish community is sus-tainable but are nevertheless ambivalent about the proliferation ofmacrophytes in the littoral zone, even though they create a favorablefish habitat. Despite the negative sentiment of the survey respondents,our results also suggest that the majority of respondents plan to returnto the bay, which in turn may potentially reflect their appreciation thatthe clarity and odor of the water have improved, fish are being caught,weeds and algae have been reduced, and the bay is closer to beingdelisted as an AOC. However, their willingness to return may also stemfrom the fact that the Bay of Quinte is one of the few viable destinationsfor recreation in the vicinity of the ever-growing Greater Toronto Area.Thus, users recreate in a substandard environment and may be ex-periencing a psychological discomfort, which could lead either to lowertheir standards for environmental quality or even to subconsciouslyraise their perception of the quality of the actual conditions; a processalso known as cognitive dissonance (Festinger and Carlsmith, 1959).Simply put, in order to alleviate their emotional discomfort with one ofthe few recreational destinations in the area, the public may be sub-consciously driven to change its perception of what constitutes accep-table water-quality and esthetic conditions (Dickerson et al., 1992;Thøgersen, 2004; Osbaldiston and Schott, 2012; Ferguson, 2016). Ineither case, the lessening of their degree of dissatisfaction with theprevailing water-quality conditions of the bay could end up having anegative effect on the public support for further investment of fundsand other resources to promote ecosystem restoration.
Our findings can be used to draw parallels with other studies thatgauged public sentiment towards environmental rehabilitation in otherwaterbodies, including AOCs. For example, Johnsen et al. (1992) ex-amined public perception and attitudes regarding the restoration efforts
in the Lower Green Bay and Fox River AOC, and their survey revealedthat the public widely supported the mandate of the local RAP althoughthey were poorly informed about their activities. In a similar manner,assessing public perception across the entire Great Lakes basin, Maacket al. (2014) found that most residents were supportive of policies thathave a direct connection to pollution prevention, such as the regula-tions that reduce the release of pharmaceuticals and other contaminantsentering the Great Lakes, even if the cost of drugs increases as a result ofthe companies' compliance with these regulations. In another study,Marks and Bergelin (2006) surveyed residents' opinions on their viewsof Saratoga Lake as a water resource, whereby they attempted to shedlight on how recreational activities, household economic levels, anddegree of proximity to Saratoga Lake influence public perception. Thesame study challenged the notion that individuals who reside close to awaterbody are the ones that are more engaged with restoration actions.By contrast, our results rendered support to this notion in that residentsin proximity to the Bay of Quinte appear to be more motivated andbetter informed about the local water-quality issues (see our Fig. SI 5).Marks and Bergelin (2006) also found that use of the system for re-creational purposes by an individual along with its income were the twoprimary factors influencing the perception of Saratoga Lake as a newsource of drinking water. In particular, the residents believed that usinga small lake as a water source would accentuate the water level fluc-tuations, thus affecting its long-term sustainability for recreation. Thesame study also suggested that the lack of public understanding of thewater quality and contamination issues greatly affects how opinions areformed and proposed that by increasing the level of communication andeducation within the community, stakeholders might be able to providebetter solutions that are beneficial to local residents (Marks andBergelin, 2006). In our examination of public appreciation with in-dividuals with varying education levels, we found a weakly positiverelationship between public satisfaction and education. This couldimply that a more educated individual may be more informed of the on-
0%
20%
40%
60%
80%
100%
0 10 20 30 40 50 60
Publ
ic P
erce
ptio
n (%
)
Chla ( g/L)
Public Perception = 1,2 (Satisfied)
0%
5%
10%
15%
20%
0 10 20 30 40 50 60
Publ
ic P
erce
ptio
n (%
)
Chla ( g/L)
Public Perception = 3 (Neutral)
0
1
2
3
4
5
0 10 20 30 40 50 60
Publ
ic R
espo
nse
Chla ( g/L)
Public Perception = Total (Weighted Average)
0%
20%
40%
60%
80%
100%
0 10 20 30 40 50 60
Publ
ic P
erce
ptio
n (%
)
Chla ( g/L)
Public Perception = 4,5 (Dissatisfied)
Fig. 8. Public perception of water quality as a function of the total chlorophyll a (Chla) concentrations in the Bay of Quinte. The first three panels depict the likelihood of the public to beSatisfied (Public Perception= 1,2), Neutral (Public Perception=3), and Dissatisfied (Public Perception=4,5), while the fourth one indicates the change in the sentiment(1=Completely satisfied, 5= Strongly dissatisfied) as a function of the ambient Chla concentrations.
M. Ramin et al. Ecological Economics 147 (2018) 298–311
307

going restoration efforts, as well as more cognizant of the ecosystemcomplexity and the associated uncertainty.
Our survey identified fishing as one of the main attractions drawingthe public to the Bay of Quinte. Recreational fishing provides importanteconomic benefits to the bay, through tourism and other business op-erations, such as equipment rentals, supplies, and accommodations foranglers (Ewaschuk, 2005). Earlier estimates of angler expendituresshowed that $4 million CAD (non-adjusted for inflation) were spent juston rental accommodations between May and October of 1984 and up to$6 million (non-adjusted) in direct expenditures by open-water anglers(Trushinski, 1986). Ice-fishing anglers contributed an additional $1million (non-adjusted) in direct expenditures during the 1984–85season (Trushinski, 1986). In 1994, during the peak of the walleye re-creational fishery, total expenditure (direct and invested) attributed towalleye angling was estimated to be $11.9 million for the bay (non-adjusted for inflation). However, due to the decline in walleye popu-lation beginning in the mid-1990s, total walleye angler expenditureshad decreased to $4.9 million in 2000 (Ewaschuk, 2005). Total directangler expenditure had also decreased from over $6 million during1996–1997 to $2 million (Ewaschuk, 2005). Nonetheless, angling op-portunities for numerous other species, such as largemouth bass and
sunfish, have increased, due to the proliferation of aquatic macro-phytes, which provide a favorable habitat for these species. Despite theactive fishing industry in the bay, the Beneficial Use “Restrictions onFish Consumption” is still considered impaired due to the high con-tamination levels recorded. Based on approximately 40 years of con-taminant data from different locations in Lake Ontario, Visha et al.(2016) showed that despite the declining trends in PCBs for both laketrout and walleye, the corresponding maximum threshold exposurelevels of sensitive demographic groups are frequently exceeded(> 80%). Moreover, new chemicals have started to accumulate; mostnotably, PBDEs (polybrominated diphenyl ethers), used in fire re-tardants in plastic consumer products, and PFOS (per-fluorooctanesulfonic acid), used in fire-extinguishing foam, stain re-pellents, and food packaging. Government and industry have takenmeasures to eliminate these contaminants and reduce their effects, butthe Great Lakes will need time to recover and a great deal of re-mediation effort is still required.
Tourism is one of the top industries to the economy of the Bay ofQuinte area, based on the number of related local businesses. In 2012,3.2 million people visited the bay for tourism purposes (on average,> 3million per year during 2008–2012), with fishing as the primary
Fig. 9. Prediction of Public Satisfaction(1=Completely Satisfied, 5= StronglyDissatisfied) for water quality at two locations(U2, U3) in the upper Bay of Quinte in 2005(above) and 2008 (below), based on tributaryinflow TP concentrations and Flushing Rate, ρ(year−1) or the number of times the system flu-shes in one year).
M. Ramin et al. Ecological Economics 147 (2018) 298–311
308

attraction for 400,000 of the visitors (McParland, 2016). In monetaryterms, tourism represents a $120-million industry, valued at more than$75 million in Belleville alone; money spent in the region from visitorsoutside a 45 km radius (Williams, 2016a). The sports and event tourismindustry alone is worth more than $14 million per year in the region,and it is projected to increase to $40 million (Williams, 2016b). Oursurvey showed that locals tend to be more dissatisfied than tourists inall demographic categories with the current state of the bay, probablybecause they live locally and may have higher standards and expecta-tions than visitors. While there is no difference in perception betweengenders for both local residents and tourists, our survey showed that theage demographic groups are characterized by some variability. Middle-aged and senior citizens (50–65 and>65) appear to be the most dis-satisfied with the prevailing conditions, and this response is somewhatsurprising given that these age groups have experienced the historicallyworst water quality in the Bay of Quinte during the 1970s. We surmisethat senior citizens tend to spend more time near the water, and so theyhave higher standards for the bay. The younger demographic groups(< 18 and 18–25) also tend to be more dissatisfied; a sentiment thatmay have its roots in the water activities that this group is typicallyinvolved, e.g., fishing, canoeing, kayaking, windsurfing, wakeboarding,and beach activities. As mentioned earlier, the education level has littlebearing on public perception, since individuals with education levels attwo ends of the spectrum did not have distinctly different views. Thisfinding contradicts the popular notion (e.g., Van Liere and Dunlap,1980; Jones and Dunlap, 1992; Scott and Willits, 1994) that educationis moderately (but consistently) associated with greater concern forenvironment problems (Brody et al., 2005). From the perspective ofdonation level, there was also no clear evidence that the education levelshapes one's perception of environmental hazard risks (Mileti, 1975;Burton et al., 1978; Kunreuther, 1978; Sorensen, 1983; Pilisuk et al.,1987; Saarinen, 1982; Steele et al., 1990).
Efforts to reduce phosphorus in detergents, along with upgrades atlocal waste water treatment plants, resulted in substantial decline ofpoint-source loadings since the 1970s, prompting a significant decreasein nutrient concentration and phytoplankton biomass levels in the Bayof Quinte (Minns et al., 2011). However, the establishment of invasivezebra and quagga mussels in the mid-1990s complicated the system'srestoration. TP concentrations in the post-dreissenid period have sinceshown significant within-year variability, characterized by relativelylow spring and fall levels, 10–15 μg TP L−1, and high summer con-centrations, > 50 μg TP L−1 (Munawar et al., 2011). This recurringpattern matches closely with the dramatic change in public sentiment,from positive to negative between the beginning and the end of thesummer season. The end-of-summer nutrient peaks may stem from thecomplex interplay among macrophytes, dreissenids, and sediment di-agenesis, which appears to modulate nutrient recycling in the Bay ofQuinte (Kim et al., 2013). The post-dreissenid period has also beencharacterized by an increase of the cyanophyte Microcystis spp. Al-though the actual mechanisms that trigger these blooms are not clearyet, the formation of “scums” on the water surface (Jacoby et al., 2000)as well as the fact that some strains of Microcystis spp. are toxin pro-ducers (Brittain et al., 2000) have profound implications for the es-thetics and other beneficial uses in the bay. For example, one of themost common species of this cyanobacterium, M. aeruginosa, producesthe hepatotoxin microcystin-LR (Repavich et al., 1990; Watson et al.,2008). Interestingly, counter to BUI #9 (Restrictions on Drinking WaterConsumption or Taste and Odor Problems) and BUI #10 (Beach Clos-ings), the delisting criteria for BUI #8: “Eutrophication or UndesirableAlgae” do not explicitly consider the frequency of violations of totalmicrocystin or microcystin-LR threshold levels.
The delisting objective for Bay of Quinte has been to reduce TPconcentration by 25% in the upper Bay of Quinte, such that the seasonal(May–September) average TP concentration is reduced from 40 to30 μg L−1 and Chla achieves a concentration of 12 μg L−1 in the ab-sence of zebra mussels (with zebra mussels, a further 2–3 μg L−1 Chla
reduction should be anticipated) in the upper Bay of Quinte. Based onsamples collected from the upper bay (Belleville) during the 2000s,these objectives are relatively frequently achieved (Munawar et al.,2011). More importantly, even if the targeted criteria are met, ourmodel predicts the likelihood of public satisfaction to be<20%. Thelikelihood of public satisfaction increases significantly when TP con-centrations fall below the critical levels of 20–25 μg L−1, respectively,but this target is extremely difficult to be achieved even under the mostoptimistic nutrient-loading scenarios (Kim et al., 2013). Given that thepredicted level of satisfaction does not change dramatically within therange of TP concentrations attainable in the system, currently or in thenear future, it is important to keep in mind that TP is simply a “meansto an end” for water quality, and not “the end” itself. Other biologicalvariables such as Chla concentrations, harmful algal blooms, and toxinlevels in critical areas for public use may be more sensible (or more“relatable”) for tracking the public satisfaction vis-à-vis the progress ofthe system during the delisting process. On a positive note, our surveyshowed that the majority of the public is satisfied when Chla con-centrations remain below the 10 μg L−1 threshold and the appreciationlevel increases dramatically for every incremental decrease of thephytoplankton abundance levels.
We found that a substantial portion of local residents are willing tocontribute financially towards the restoration of the Bay of Quinte, andso do tourists who are dissatisfied and have higher expectations forwater quality. In the same context, Johnsen et al. (1992) documentedthat users are not necessarily more supportive of environmental im-provements than non-users of a system, especially if support is definedin monetary terms. Instead, both groups argued that financial supportshould come from industries through pollution fees. Users were also lessinclined relative to non-users to support fishing and hunting fees(Johnsen et al., 1992). Davey and Vertrees (1999) also found that thetime spent for recreation in a particular system is not always a factor tofoster a pro-environmental stance nor are other demographic char-acteristics. Likewise, we did not find any distinctly different trendsbetween each of the demographic groups examined and their will-ingness to donate in support of remediation efforts. To promote moreactive engagement in restoration, Pereira et al. (2005) emphasized theimportance of educating the public (through, for example, informalenvironmental education programs, temporary exhibitions, informativeboard signs) about ecosystem features and their carrying capacity, theimpacts of human activities on ecosystem integrity and beauty, thecomplexity of management decisions, and the expected time lag be-tween implementation of management strategies and observable out-comes. These activities of social learning may also demonstrate otherpossible benefits that conservation can bring to local communities(Pinkerton, 1994; Webler et al., 1995; Schusler et al., 2003; Zhanget al., 2016). Previous studies have demonstrated the importance ofactive local participation in environmental programs to improve land-scape perception and appreciation (Múgica and De Lucio, 1996).Gobster (1995) showed that people interacting directly with the land-scape usually develop a sense of ecological esthetics and an enhancedunderstanding and appreciation of ecosystem management activities.Education and outreach are critically important to engaging residents inenvironmentally sustainable behaviors and provide opportunities foreveryone to learn about the importance of environmental protectionand stewardship of the Bay of Quinte watershed.
5. Conclusions
Our public survey showed that (i) fishing (29%) and beauty of thesystem (20%) were the main reasons for public to use the Bay of Quinte;(ii) among different water-quality problems, the public chose the algalscums (26%) and the integrity of fish populations (22%) as the mainissues; (iii) the majority of the public (62%) believed that the water isnot clear; (iv) only 30% of the public, who visited the Bay previously,noticed that the clarity of the water is better now relative to the
M. Ramin et al. Ecological Economics 147 (2018) 298–311
309
conditions 5 years ago; (v) there was a dramatic change in the sentimentof the public between the beginning and the end of the summer season;and (vi) there was a substantial portion of the local residents that werewilling to financially contribute towards the restoration of the Bay ofQuinte; particularly individuals who had higher expectations about thewater quality. Through our modeling exercise, we found that the like-lihood of public satisfaction with the bay's status increases significantlyonly when TP concentrations fall below the critical levels of20–25 μg L−1, respectively. Nonetheless, this target is difficult to beachieved even under significantly reduced nutrient-loading conditions.Other biological variables such as Chla concentrations, harmful algalblooms, and toxin levels in locations frequently used by the publicappeared to more closely influence their satisfaction level. Although thelatter finding offers a suite of variables to focus on during the delistingprocess, it should be noted that the current gap in our understanding ofthe mechanisms that trigger toxic blooms hampers the ability to drawcredible forecasts and thus inevitably adds another layer of uncertaintyto the delisting processes.
The Bay of Quinte has a long history of eutrophication, character-ized by frequent and spatially extensive algal blooms and predominanceof toxic cyanobacteria, and as such is a characteristic example of de-listing decisions that have to be made in the face of uncertainty. Giventhe inevitable risk of unexpected ecosystem responses to the on-goingrestoration efforts, we believe that the effective integration of themultitude of factors (scientific understanding, public knowledge, andstakeholder perspectives) involved in the environmental policy-makingprocess is the only defensible strategy to impartially determine whether(and when) the system can be delisted as an Area of Concern. Ourframework responds to the urgent need for policy analysis tools thatextract subjective judgments from public sentiment and directly con-nect them with the prevailing environmental conditions. Sound publicknowledge of the multidimensional properties of ecosystem services areone of the pillars of our approach, which can only be achieved throughsystematic knowledge building. Our data provide evidence on whichgroups of the population we need to invest more resources to do so andthe characteristics of the population that are more amenable to embraceenvironmental remedial efforts.
Acknowledgments
This project was undertaken with financial support fromEnvironment and Climate Change Canada. Additional funding for Dr.Maryam Ramin was provided by a MITACS Elevate PostdoctoralFellowship. The authors are grateful to Weitao Zhang (City of Toronto),Peter Doris (Ministry of Agriculture, Food and Rural Affairs), BryonKeene, Christine McClure (Quinte Conservation), Andrew Morley(Ontario Ministry of the Environment and Climate Change), KristinGeater, Rimi Kalinauskas, Sue Watson, Ram Yerubandi, VeroniqueHiriart-Baer, and Agnes Blukacz-Richards (Environment and ClimateChange Canada), Kenneth Minns, Marten Koops, Sue Doka, ScottMillard, Mark Fitzpatrick, and Mohiuddin Munawar (Fisheries andOceans Canada) for providing invaluable feedback throughout thisproject.
Appendix A. Supplementary data
Supplementary data to this article can be found online at https://doi.org/10.1016/j.ecolecon.2018.01.009.
References
Arhonditsis, G.B., Kim, D., Shimoda, Y., Zhang, W., Watson, S., Dittrich, M., Geater, K.,Mcclure, C., Keene, B., Richards, A., Long, T., Rao, Y.R., Kalinauskas, R., 2016.Integration of best management practices in the Bay of Quinte Watershed with thephosphorus dynamics in the receiving water body: what do the models predict?Aquat. Ecosyst. Health Manag. 19, 1–18. http://dx.doi.org/10.1080/14634988.2016.1130566.
Brittain, S.M., Wang, J., Babcock-Jackson, L., Carmichael, W.W., Rinehart, K.L., Culver,D.A., 2000. Isolation and characterization of microcystins, cyclic heptapeptidehe-patotoxins from a Lake Erie strain of Microcystis aeruginosa. J. Great Lakes Res. 26,241–249. http://dx.doi.org/10.1016/S0380-1330(00)70690-3.
Brody, S.D., Highfield, W., Peck, B.M., 2005. Exploring the mosaic of perceptions forwater quality across watersheds in San Antonio, Texas. Landsc. Urban Plan. 73,200–214. http://dx.doi.org/10.1016/j.landurbplan.2004.11.010.
Brooks, S.P., Gelman, A., 1998. Alternative methods for monitoring convergence ofiterative simulations. J. Comput. Graph. Stat. 7, 434–455.
Burton, I., Kates, R., White, G., 1978. The Environment as Hazard. Oxford UniversityPress, New York.
Cangelosi, A. (Ed.), 2001. Revealing the Economic Value of Protecting the Great Lakes.Northeast-Midwest Institute, Washington, DC.
Carroll, E., Strang, D., 2014. St. Clair River Area of Concern: Status of the Degradation ofAesthetics Beneficial Use Impairment. Available from: http://www.friendsofstclair.ca/www/pdf/Degradation%20of%20Aesthetics%20-%20SCR%20AOC%20-%20BUI%20Assessment%20Report%20-%20February%2016,%202016.pdf.
Davey, A.L., Vertrees, R.L., 1999. Comparative analysis of stakeholders' attitudes towardthe human-environment relationship in two Great Lakes Areas of Concern. Toledo J.Gt. Lakes Law. Sci. Policy 2, 13–30. http://dx.doi.org/10.1525/sp.2007.54.1.23.
De Groot, R.S., Alkemade, R., Braat, L., Hein, L., Willemen, L., 2010. Challenges in in-tegrating the concept of ecosystem services and values in landscape planning, man-agement and decision making. Ecol. Complex. 7, 260–272. http://dx.doi.org/10.1016/j.ecocom.2009.10.006.
Dickerson, C.A., Thibodeau, R., Aronson, E., Miller, D., 1992. Using cognitive dissonanceto encourage water conservation. J. Appl. Soc. Psychol. 22, 841–854. http://dx.doi.org/10.1111/j.1559-1816.1992.tb00928.x.
Dietz, T., 2013. Bringing values and deliberation to science communication. Proc. Natl.Acad. Sci. U. S. A. 110 (Suppl), 14081–14087. http://dx.doi.org/10.1073/pnas.1212740110.
Ewaschuk, M., 2005. Backgrounder – Bay of Quinte Fish Habitat Management Plan. Bayof Quinte Remedial Action Plan. pp. 98.
Ferguson, M.D., 2016. The effects of environmental conditions on coping and sa-tisfaction—a study of Great Lakes water-based outdoor recreationists. In: A DoctoralDissertation in Recreation, Park and Tourism Management & Human Dimensions ofNatural Resources and the Environment. The Pennsylvania State University.
Festinger, L., Carlsmith, J.M., 1959. Cognitive consequences of forced compliance. J.Abnorm. Soc. Psychol. 58, 203–210.
Gelman, A., Carlin, J.B., Stern, H.S., Rubin, D.B., 2004. Bayesian Data Analysis. Chapman& Hall/CRC Boca Raton, FL, USA.
George, T.K., Boyd, D., 2007. Limitations on the development of quantitative monitoringplans to track the progress of beneficial use impairment restoration at Great Lakes ofConcern. J. Great Lakes Res. 33, 686–692. http://dx.doi.org/10.3394/0380-1330(2007)33.
Gobster, P.H., 1995. Aldo's Leopold ecological aesthetic. Integrating aesthetic and bio-diversity values. J. Forest. 93, 6–10.
Irvin, R., Stansbury, J., 2004. Citizen participation in decision making: is it worth theeffort? Public Adm. Rev. 64, 55–65.
Jacoby, J.M., Collier, D.C., Welch, E.B., Hardy, F.J., Crayton, M., 2000. Environmentalfactors associated with a toxic bloom of Microcystis aeruginosa. Can. J. Fish. Aquat.Sci. 57, 231–240. http://dx.doi.org/10.1139/cjfas-57-1-231.
Johnsen, P.K., Knaap, G.J., Smith, L.J., 1992. Public perceptions and attitudes towardenvironmental rehabilitation of the Lower Green Bay Watershed. Coast. Manag. 20,9–23. http://dx.doi.org/10.1080/08920759209362159.
Jones, R.E., Dunlap, R.E., 1992. The social bases of environmental concern: have theychanged over time? Rural. Sociol. 57, 28–47.
Kiker, G.A., Bridges, T.S., Varghese, A., Seager, P.T.P., Linkov, I., 2005. Application ofmulticriteria decision analysis in environmental decision making. Integr. Environ.Assess. Manag. 1, 95–108. http://dx.doi.org/10.1897/IEAM_2004a-015.1.
Kim, D.K., Zhang, W., Rao, Y.R., Watson, S., Mugalingam, S., Labencki, T., Dittrich, M.,Morley, A., Arhonditsis, G.B., 2013. Improving the representation of internal nutrientrecycling with phosphorus mass balance models: a case study in the Bay of Quinte,Ontario, Canada. Ecol. Model. 256, 53–68. http://dx.doi.org/10.1016/j.ecolmodel.2013.02.017.
Krantzberg, G., 2003. Keeping remedial action plans on target: lessons learned fromCollingwood Harbour. J. Great Lakes Res. 29, 641–651. http://dx.doi.org/10.1016/S0380-1330(03)70467-5.
Krantzberg, G., 2012a. Renegotiation of the 1987 Great Lakes Water Quality agreement:from confusion to promise. Sustain. For. 4, 1239–1255. http://dx.doi.org/10.3390/su4061239.
Krantzberg, G., 2012b. The remedial action plan program, historical and contemporaryoverview. In: Grover, V., Krantzberg, G. (Eds.), Great Lakes Lessons in ParticipatoryGovernance. Scientific Research Publishing, pp. 245–256.
Kunreuther, H., 1978. Limited Knowledge and Insurance Protection. John Wiley & Sons,New York.
Lichtkoppler, F.R., Blaine, T.W., 1999. Environmental awareness and attitudes ofAshtabula County voters concerning the Ashtabula River Area of Concern:1996–1997. J. Great Lakes Res. 25, 500–514. http://dx.doi.org/10.1016/S0380-1330(99)70758-6.
Lunn, D.J., Thomas, A., Best, N., Spiegelhalter, D., 2000. WinBUGS – a Bayesian mod-elling framework: concepts, structure, and extensibility. Stat. Comput. 10, 325–337.http://dx.doi.org/10.1023/A:1008929526011.
Maack, E., Mills, S.B., Borick, C.P., Gore, C., Rabe, B.G., 2014. Environmental policy inthe Great Lakes Region: current issues and public opinion. In: Issues in Energy andEnvironmental Policy, Number 10, . http://closup.umich.edu/files/ieep-2014-glprn-great-lakes.pdf.
M. Ramin et al. Ecological Economics 147 (2018) 298–311
310

Marks, J., Bergelin, C., 2006. Recreation, Economic Status, and Proximity to SaratogaLake: Saratoga Springs residents' Views of the Proposed Municipal Water Sources.Skidmore College, Saratoga Spring, NY.
McParland, C., 2016. Low Loonie Could Boost Tourism in Bay of Quinte. QNetNews.ca.http://www.qnetnews.ca/?p=72818, Accessed date: 30 July 2016.
Mileti, D.M., 1975. Natural Hazard Warning Systems in the United States: A ResearchAssessment. University of Colorado, Institute of Behavioral Science, Boulder, CO.
Minns, C.K., Moore, J.E., Seifried, K.E., 2004. Nutrient loads and budgets in the Bay ofQuinte, Lake Ontario, 1972 to 2001. In: Canadian Manuscript Report of Fisheries andAquatic Sciences 2694, Burlington, Ontario, pp. 49.
Minns, C.K., Munawar, M., Koops, M.A., Millard, E.S., 2011. Long-term ecosystem studiesin the Bay of Quinte, Lake Ontario, 1972–2008: a prospectus. Aquat. Ecosyst. HealthManag. 14, 3–8. http://dx.doi.org/10.1080/14634988.2011.551750.
Múgica, M., De Lucio, J.V., 1996. The role of on-site experience on landscape preferences.A case study at Doñana National Park (Spain). J. Environ. Manag. 47, 229–239.http://dx.doi.org/10.1006/jema.1996.0049.
Munawar, M., Fitzpatrick, M., Niblock, H., Lorimer, J., 2011. The relative importance ofautotrophic and heterotrophic microbial communities in the planktonic food web ofthe Bay of Quinte, Lake Ontario 2000–2007. Aquat. Ecosyst. Health Manag. 14,21–32. http://dx.doi.org/10.1080/14634988.2011.551102.
Nelson, E., Mendoza, G., Regetz, J., Polasky, S., Tallis, H., Cameron, D., Chan, K., Daily,G.C., Goldstein, J., Kareiva, P.M., Lonsdorf, E., 2009. Modeling multiple ecosystemservices, biodiversity conservation, commodity production, and tradeoffs at land-scape scales. Front. Ecol. Environ. 7, 4–11. http://dx.doi.org/10.1890/080023.
Osbaldiston, R., Schott, J.P., 2012. Environmental sustainability and behavioral science:meta-analysis of proenvironmental behavior experiments. Environ. Behav. 44,257–299. http://dx.doi.org/10.1177/0013916511402673.
Pereira, R., Soares, A.M.V.M., Ribeiro, R., Gonçalves, F., 2005. Public attitudes towardsthe restoration and management of Lake Vela (Central Portugal). Fresenius Environ.Bull. 14, 273–281.
Perkins, P.E.E., 2011. Public participation in watershed management: internationalpractices for inclusiveness. Phys. Chem. Earth 36, 204–212. http://dx.doi.org/10.1016/j.pce.2010.02.004.
Pilisuk, M., Parks, S.H., Hawkes, G., 1987. Public perception of technological risk. Soc.Sci. J. 24, 403–413. http://dx.doi.org/10.1016/0362-3319(87)90056-5.
Pinkerton, E.W., 1994. Local fisheries co-management: a review of international experi-ences and their implications for salmon management in British Columbia. Can. J.Fish. Aquat. Sci. 51, 2363–2378. http://dx.doi.org/10.1139/f94-238.
Repavich, W.M., Sonzogni, W.C., Standridge, J.H., Wedepohl, R.E., Meisner, L.F., 1990.Cyanobacteria (blue-green algae) in Wisconsin waters: acute and chronic toxicity.Water Res. 24, 225–231. http://dx.doi.org/10.1016/0043-1354(90)90107-H.
Saarinen, T.F., 1982. Cultivating and Using Hazard Awareness. Institute of BehavioralScience, University of Colorado.
Schusler, T.M., Decker, D.J., Pfeffer, M.J., 2003. Social learning for collaborative naturalresource management. Soc. Nat. Resour. 16, 309–326. http://dx.doi.org/10.1080/08941920390178874.
Scott, D., Willits, F.K., 1994. Environmental attitudes and behavior. Environ. Behav. 26,239–261.
Shimoda, Y., Rao, Y.R., Watson, S., Arhonditsis, G.B., 2016. Optimizing the complexity ofphytoplankton functional group modelling: an allometric approach. Ecol. Inform. 31,1–17. http://dx.doi.org/10.1016/j.ecoinf.2015.11.001.
Sorensen, J.H., 1983. Knowing how to behave under the threat of disaster can it be ex-plained? Environ. Behav. 15, 438–457.
Sproule-Jones, M., 1999. Restoring the Great Lakes: institutional analysis and design.Coast. Manag. 27, 291–316.
Steele, B.S., Soden, D.L., Warner, R.L., 1990. The impact of knowledge and values onperceptions of environmental risk to the Great Lakes. Soc. Nat. Resour. 3, 331–348.
Thøgersen, J., 2004. A cognitive dissonance interpretation of consistencies and incon-sistencies in environmentally responsible behavior. J. Environ. Psychol. 249, 3–103.http://dx.doi.org/10.1016/S0272-4944(03)00039-2.
Trushinski, B.J., 1986. An Economic Impact Assessment of Angler Rental Accommodationin the Bay of Quinte Region. University of Waterloo, School of Urban and RegionalPlanning, Waterloo, Ontario, Canada.
Van Liere, K.D., Dunlap, R.E., 1980. The social bases of environmental concern: a reviewof hypotheses, explanations and empirical evidence. Public Opin. Q. 44, 181–197.
Visha, A., Gandhi, N., Bhavsar, S.P., Arhonditsis, G.B., 2016. Guiding fish consumptionadvisories for Lake Ontario: a Bayesian hierarchical approach. J. Great Lakes Res. 42,70–82. http://dx.doi.org/10.1016/j.jglr.2015.11.005.
Warriner, G.K., Madden, J.J., Lukasik, L., McSpurren, K., 1996. Public participation inwatershed management: a comparative analysis. Can. Water Res. J. 21, 253–272.
Watson, S.B., Ridal, J., Boyer, G.L., 2008. Taste and odour and cyanobacterial toxins:impairment, prediction, and management in the Great Lakes. Can. J. Fish. Aquat. Sci.65, 1779–1796. http://dx.doi.org/10.1139/F08-084.
Webler, T., Kastenholz, H., Renn, O., 1995. Public participation in impact assessment: asocial learning perspective. Environ. Impact Assess. Rev. 15, 443–463. http://dx.doi.org/10.1016/0195-9255(95)00043-E.
Wegner, G., Pascual, U., 2011. Cost–benefit analysis in the context of ecosystem servicesfor human well-being: a multidisciplinary critique. Glob. Environ. Chang. 21,492–504. http://dx.doi.org/10.1016/j.gloenvcha.2010.12.008.
Williams, R., 2016a. “More Events, More Sports.” The Belleville Intelligencer. Accessed30 July 2016. http://www.intelligencer.ca/2013/02/01/more-events-more-sports.
Williams, R., 2016b. “Partnerships Are Only Way to Growth.” The Belleville Intelligencer.Accessed 30 July 2016. http://www.intelligencer.ca/2014/07/11/partnerships-are-only-way-to-growth.
Zhang, W., Arhonditsis, G.B., 2008. Predicting the frequency of water-quality standardviolations using Bayesian calibration of eutrophication models. J. Great Lakes Res.34, 698–720.
Zhang, W., Kim, D.K., Rao, Y.R., Watson, S., Mugalingam, S., Labencki, T., Dittrich, M.,Morley, A., Arhonditsis, G.B., 2013. Can simple phosphorus mass balance modelsguide management decisions? A case study in the Bay of Quinte, Ontario, Canada.Ecol. Model. 257, 66–79. http://dx.doi.org/10.1016/j.ecolmodel.2013.02.023.
Zhang, W., Wilson, R.S., Burnett, E., Irwin, E.G., Martin, J.F., 2016. What motivatesfarmers to apply phosphorus at the “right” time? Survey evidence from the WesternLake Erie Basin. J. Great Lakes Res. 42, 1343–1356. http://dx.doi.org/10.1016/j.jglr.2016.08.007.
M. Ramin et al. Ecological Economics 147 (2018) 298–311
311

AN INTEGRATIVE METHODOLOGICAL FRAMEWORK FOR SETTING
ENVIRONMENTAL CRITERIA: EVALUATION OF PUBLIC PREFERENCES
[SUPPORTING INFORMATION]
Maryam Ramin1, Vincent Y.S. Cheng
1, Dong-Kyun Kim
1, Felicity Ni
1, Aisha Javed
1,
Noreen Kelly1, Cindy Yang
1, Sarah Midlane-Jones
2, Shan Mugalingam
2, George B. Arhonditsis
1*
1Ecological Modelling Laboratory,
Department of Physical & Environmental Sciences, University of Toronto,
Toronto, Ontario, Canada, M1C1A4
2Lower Trent Conservation,
Trenton, Ontario, Canada, K8V 5P4
* Corresponding author
E-mail: [email protected], Tel.: +1 416 208 4858; Fax: +1 416 287 7279.

Section A – Figures and Tables
Figure SI-1: Spatial variability of the various external and internal Total Phosphorus (TP) flux rates in the Bay
of Quinte. Arrow directions indicate the net contributions (sources or sinks) of the various compartments
(Water column, Sediment, Macrophytes, Dreissenid mussels). Darker grey arrows show the TP inflows in a
spatial segment, while the lighter grey ones depict the corresponding outflows.

Figure SI-2: Frequency of Bay usage, as reported at the time of survey (summers of 2013-2014).
Figure SI-3: Levels of public satisfaction with the Bay across different age groups, as reported at the time of
survey (summers of 2013-2014).
0
50
100
150
200
250
300
350
Couple of times a
week
Once a week Twice a month Once a month Occasionally First time
Nu
mb
er o
f R
esp
on
ses
Frequency of Usage
How often do you use the Bay?
0
100
200
1=Completely
agree
(Completely
satisfied)
2=Agree
(Satisfied)
3=Neutral 4=Disagree
(Dissatisfied)
5=Strongly
disagree
(Strongly
dissatisfied)
Nu
mb
er o
f R
esp
on
ses
"The conditions of the Bay are perfect for my uses today"
Age vs. Level of Public Satisfaction
< 18
18-25
26-35
36-49
50-65
> 65
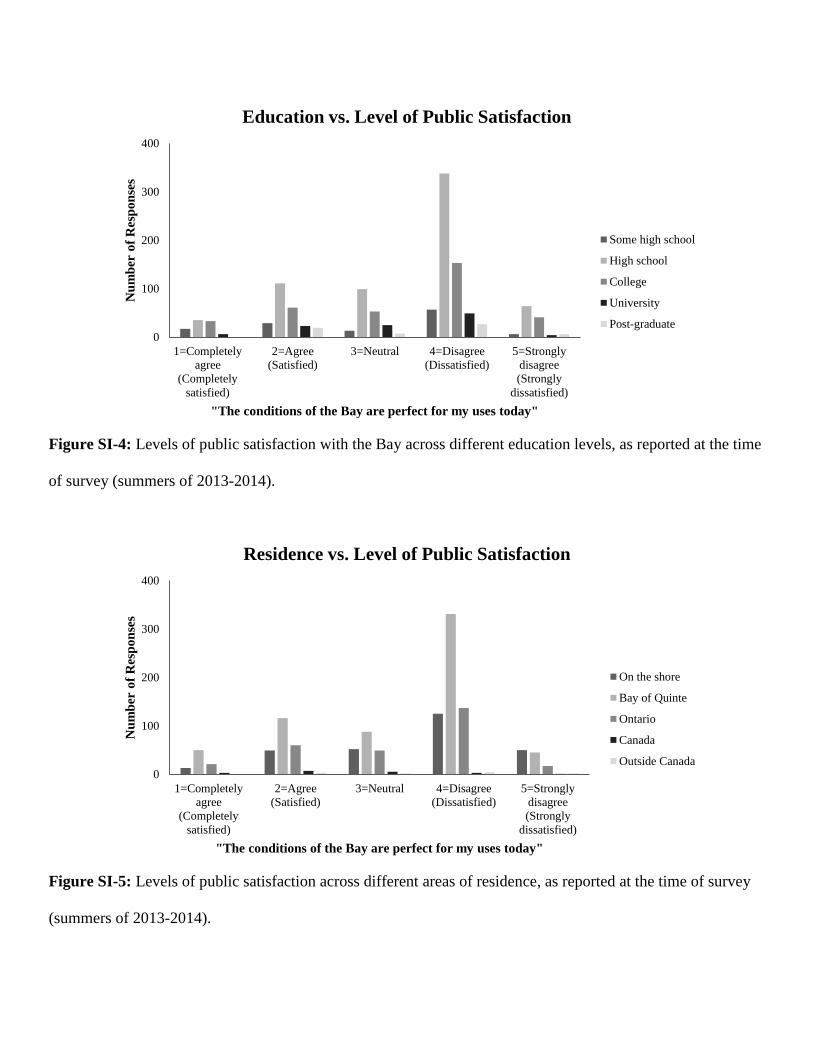
Figure SI-4: Levels of public satisfaction with the Bay across different education levels, as reported at the time
of survey (summers of 2013-2014).
Figure SI-5: Levels of public satisfaction across different areas of residence, as reported at the time of survey
(summers of 2013-2014).
0
100
200
300
400
1=Completely
agree
(Completely
satisfied)
2=Agree
(Satisfied)
3=Neutral 4=Disagree
(Dissatisfied)
5=Strongly
disagree
(Strongly
dissatisfied)
Nu
mb
er o
f R
esp
on
ses
"The conditions of the Bay are perfect for my uses today"
Education vs. Level of Public Satisfaction
Some high school
High school
College
University
Post-graduate
0
100
200
300
400
1=Completely
agree
(Completely
satisfied)
2=Agree
(Satisfied)
3=Neutral 4=Disagree
(Dissatisfied)
5=Strongly
disagree
(Strongly
dissatisfied)
Nu
mb
er o
f R
esp
on
ses
"The conditions of the Bay are perfect for my uses today"
Residence vs. Level of Public Satisfaction
On the shore
Bay of Quinte
Ontario
Canada
Outside Canada

Figure SI-6: Public perception of water quality as a function of Total Phosphorus (TP) concentrations in the
Bay of Quinte. The first three panels depict the likelihood of the public to be Satisfied (Public Perception=1,2),
Neutral (Public Perception=3), and Dissatisfied (Public Perception=4,5), while the fourth one indicates the
change in the sentiment (1=Completely satisfied, 2=Satisfied, 3=Neutral, 4=Dissatisfied, and 5=Strongly
dissatisfied) as a function of the corresponding TP concentrations.
0%
20%
40%
60%
80%
100%
0 10 20 30 40 50 60
Pu
bli
c P
erce
pti
on
(%
)
TP (μg/L)
Public Perception = 1,2 (Satisfied)
0%
20%
40%
60%
80%
100%
0 10 20 30 40 50 60
Pu
bli
c P
erce
pti
on
(%
)
TP (μg/L)
Public Perception = 4,5
(Dissatisfied)
0
1
2
3
4
5
0 10 20 30 40 50 60
Pu
bli
c R
esp
on
se
TP (μg/L)
Public Perception = Total
(Weighted Average)
0%
5%
10%
15%
20%
0 10 20 30 40 50 60
Pu
bli
c P
erce
pti
on
(%
)
TP (μg/L)
Public Perception = 3 (Neutral)
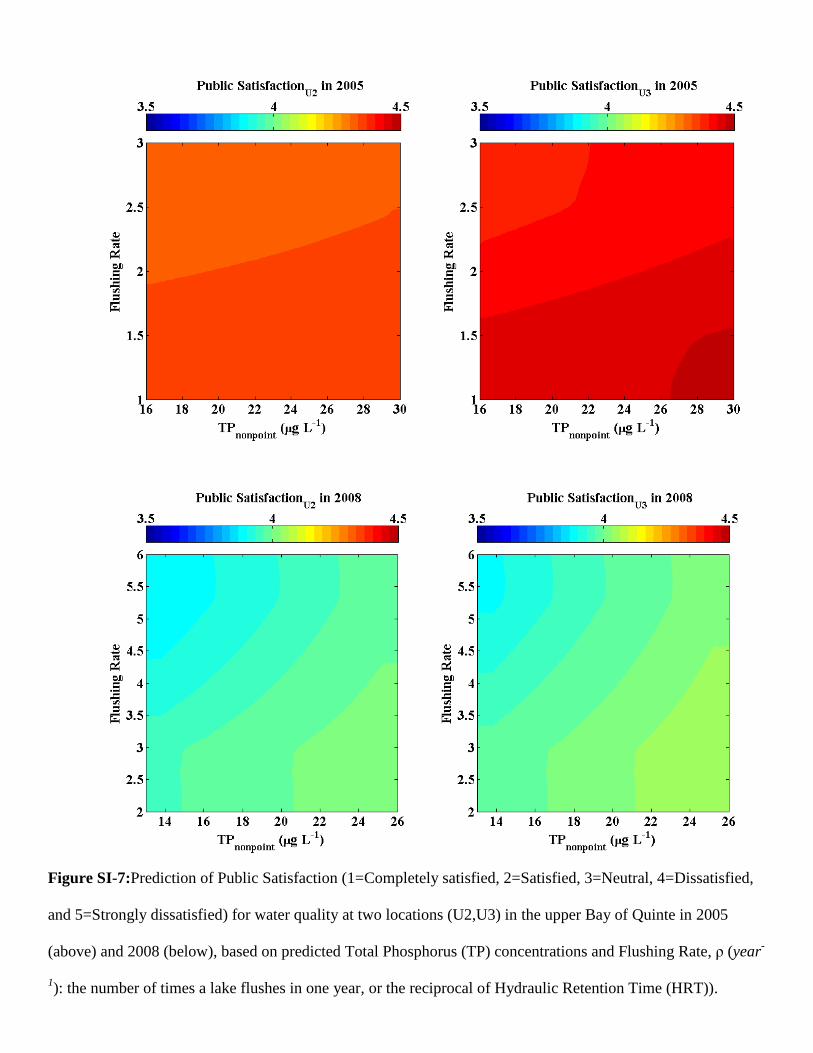
Figure SI-7:Prediction of Public Satisfaction (1=Completely satisfied, 2=Satisfied, 3=Neutral, 4=Dissatisfied,
and 5=Strongly dissatisfied) for water quality at two locations (U2,U3) in the upper Bay of Quinte in 2005
(above) and 2008 (below), based on predicted Total Phosphorus (TP) concentrations and Flushing Rate, ρ (year-
1): the number of times a lake flushes in one year, or the reciprocal of Hydraulic Retention Time (HRT)).
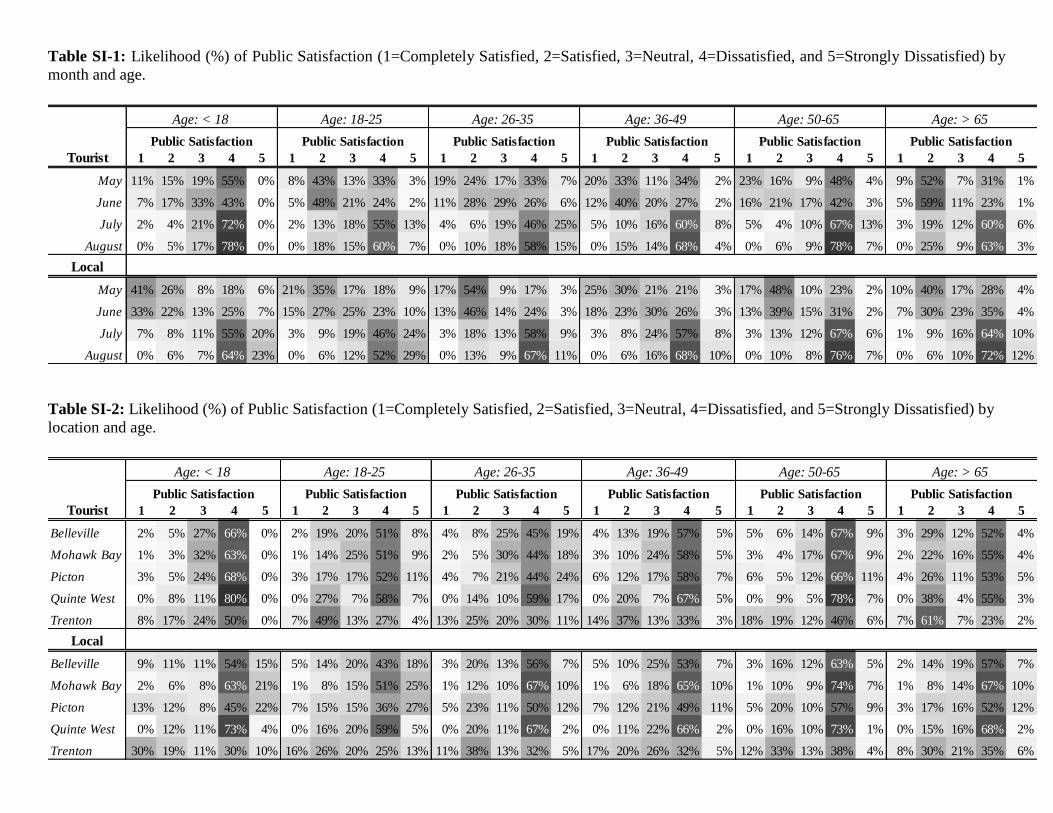
Table SI-1: Likelihood (%) of Public Satisfaction (1=Completely Satisfied, 2=Satisfied, 3=Neutral, 4=Dissatisfied, and 5=Strongly Dissatisfied) by
month and age.
Table SI-2: Likelihood (%) of Public Satisfaction (1=Completely Satisfied, 2=Satisfied, 3=Neutral, 4=Dissatisfied, and 5=Strongly Dissatisfied) by
location and age.
Tourist 1 2 3 4 5 1 2 3 4 5 1 2 3 4 5 1 2 3 4 5 1 2 3 4 5 1 2 3 4 5
May 11% 15% 19% 55% 0% 8% 43% 13% 33% 3% 19% 24% 17% 33% 7% 20% 33% 11% 34% 2% 23% 16% 9% 48% 4% 9% 52% 7% 31% 1%
June 7% 17% 33% 43% 0% 5% 48% 21% 24% 2% 11% 28% 29% 26% 6% 12% 40% 20% 27% 2% 16% 21% 17% 42% 3% 5% 59% 11% 23% 1%
July 2% 4% 21% 72% 0% 2% 13% 18% 55% 13% 4% 6% 19% 46% 25% 5% 10% 16% 60% 8% 5% 4% 10% 67% 13% 3% 19% 12% 60% 6%
August 0% 5% 17% 78% 0% 0% 18% 15% 60% 7% 0% 10% 18% 58% 15% 0% 15% 14% 68% 4% 0% 6% 9% 78% 7% 0% 25% 9% 63% 3%
Local
May 41% 26% 8% 18% 6% 21% 35% 17% 18% 9% 17% 54% 9% 17% 3% 25% 30% 21% 21% 3% 17% 48% 10% 23% 2% 10% 40% 17% 28% 4%
June 33% 22% 13% 25% 7% 15% 27% 25% 23% 10% 13% 46% 14% 24% 3% 18% 23% 30% 26% 3% 13% 39% 15% 31% 2% 7% 30% 23% 35% 4%
July 7% 8% 11% 55% 20% 3% 9% 19% 46% 24% 3% 18% 13% 58% 9% 3% 8% 24% 57% 8% 3% 13% 12% 67% 6% 1% 9% 16% 64% 10%
August 0% 6% 7% 64% 23% 0% 6% 12% 52% 29% 0% 13% 9% 67% 11% 0% 6% 16% 68% 10% 0% 10% 8% 76% 7% 0% 6% 10% 72% 12%
Public Satisfaction
Age: < 18 Age: 18-25 Age: 26-35 Age: 36-49 Age: 50-65 Age: > 65
Public Satisfaction Public Satisfaction Public Satisfaction Public Satisfaction Public Satisfaction
Tourist 1 2 3 4 5 1 2 3 4 5 1 2 3 4 5 1 2 3 4 5 1 2 3 4 5 1 2 3 4 5
Belleville 2% 5% 27% 66% 0% 2% 19% 20% 51% 8% 4% 8% 25% 45% 19% 4% 13% 19% 57% 5% 5% 6% 14% 67% 9% 3% 29% 12% 52% 4%
Mohawk Bay 1% 3% 32% 63% 0% 1% 14% 25% 51% 9% 2% 5% 30% 44% 18% 3% 10% 24% 58% 5% 3% 4% 17% 67% 9% 2% 22% 16% 55% 4%
Picton 3% 5% 24% 68% 0% 3% 17% 17% 52% 11% 4% 7% 21% 44% 24% 6% 12% 17% 58% 7% 6% 5% 12% 66% 11% 4% 26% 11% 53% 5%
Quinte West 0% 8% 11% 80% 0% 0% 27% 7% 58% 7% 0% 14% 10% 59% 17% 0% 20% 7% 67% 5% 0% 9% 5% 78% 7% 0% 38% 4% 55% 3%
Trenton 8% 17% 24% 50% 0% 7% 49% 13% 27% 4% 13% 25% 20% 30% 11% 14% 37% 13% 33% 3% 18% 19% 12% 46% 6% 7% 61% 7% 23% 2%
Local
Belleville 9% 11% 11% 54% 15% 5% 14% 20% 43% 18% 3% 20% 13% 56% 7% 5% 10% 25% 53% 7% 3% 16% 12% 63% 5% 2% 14% 19% 57% 7%
Mohawk Bay 2% 6% 8% 63% 21% 1% 8% 15% 51% 25% 1% 12% 10% 67% 10% 1% 6% 18% 65% 10% 1% 10% 9% 74% 7% 1% 8% 14% 67% 10%
Picton 13% 12% 8% 45% 22% 7% 15% 15% 36% 27% 5% 23% 11% 50% 12% 7% 12% 21% 49% 11% 5% 20% 10% 57% 9% 3% 17% 16% 52% 12%
Quinte West 0% 12% 11% 73% 4% 0% 16% 20% 59% 5% 0% 20% 11% 67% 2% 0% 11% 22% 66% 2% 0% 16% 10% 73% 1% 0% 15% 16% 68% 2%
Trenton 30% 19% 11% 30% 10% 16% 26% 20% 25% 13% 11% 38% 13% 32% 5% 17% 20% 26% 32% 5% 12% 33% 13% 38% 4% 8% 30% 21% 35% 6%
Public Satisfaction
Age: < 18 Age: 18-25 Age: 26-35 Age: 36-49 Age: 50-65 Age: > 65
Public Satisfaction Public Satisfaction Public Satisfaction Public Satisfaction Public Satisfaction
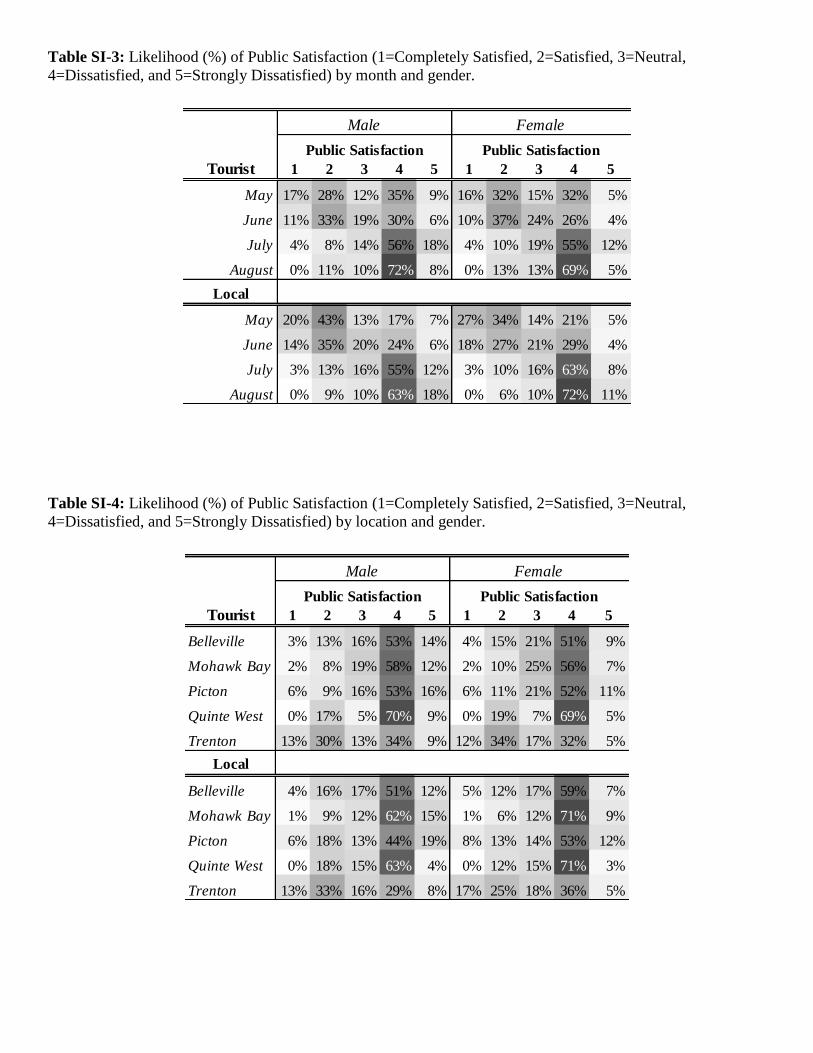
Table SI-3: Likelihood (%) of Public Satisfaction (1=Completely Satisfied, 2=Satisfied, 3=Neutral,
4=Dissatisfied, and 5=Strongly Dissatisfied) by month and gender.
Table SI-4: Likelihood (%) of Public Satisfaction (1=Completely Satisfied, 2=Satisfied, 3=Neutral,
4=Dissatisfied, and 5=Strongly Dissatisfied) by location and gender.
Tourist 1 2 3 4 5 1 2 3 4 5
May 17% 28% 12% 35% 9% 16% 32% 15% 32% 5%
June 11% 33% 19% 30% 6% 10% 37% 24% 26% 4%
July 4% 8% 14% 56% 18% 4% 10% 19% 55% 12%
August 0% 11% 10% 72% 8% 0% 13% 13% 69% 5%
Local
May 20% 43% 13% 17% 7% 27% 34% 14% 21% 5%
June 14% 35% 20% 24% 6% 18% 27% 21% 29% 4%
July 3% 13% 16% 55% 12% 3% 10% 16% 63% 8%
August 0% 9% 10% 63% 18% 0% 6% 10% 72% 11%
Male Female
Public Satisfaction Public Satisfaction
Tourist 1 2 3 4 5 1 2 3 4 5
Belleville 3% 13% 16% 53% 14% 4% 15% 21% 51% 9%
Mohawk Bay 2% 8% 19% 58% 12% 2% 10% 25% 56% 7%
Picton 6% 9% 16% 53% 16% 6% 11% 21% 52% 11%
Quinte West 0% 17% 5% 70% 9% 0% 19% 7% 69% 5%
Trenton 13% 30% 13% 34% 9% 12% 34% 17% 32% 5%
Local
Belleville 4% 16% 17% 51% 12% 5% 12% 17% 59% 7%
Mohawk Bay 1% 9% 12% 62% 15% 1% 6% 12% 71% 9%
Picton 6% 18% 13% 44% 19% 8% 13% 14% 53% 12%
Quinte West 0% 18% 15% 63% 4% 0% 12% 15% 71% 3%
Trenton 13% 33% 16% 29% 8% 17% 25% 18% 36% 5%
Male Female
Public Satisfaction Public Satisfaction

Table SI-5: Likelihood (%) of Public Satisfaction (1=Completely Satisfied, 2=Satisfied, 3=Neutral, 4=Dissatisfied, and 5=Strongly Dissatisfied) by
month and education.
Table SI-6: Likelihood (%) of Public Satisfaction (1=Completely Satisfied, 2=Satisfied, 3=Neutral, 4=Dissatisfied, and 5=Strongly Dissatisfied) by
location and education.
Tourist 1 2 3 4 5 1 2 3 4 5 1 2 3 4 5 1 2 3 4 5 1 2 3 4 5
May 23% 31% 11% 25% 10% 16% 29% 17% 31% 6% 27% 25% 9% 31% 7% 12% 42% 15% 29% 1% 0% 48% 13% 32% 7%
June 14% 38% 19% 22% 8% 9% 34% 27% 26% 5% 16% 33% 17% 28% 6% 6% 47% 23% 23% 1% 0% 52% 19% 24% 4%
July 6% 9% 14% 49% 23% 3% 7% 18% 58% 13% 6% 7% 11% 60% 16% 3% 13% 20% 63% 2% 0% 13% 15% 59% 14%
August 0% 13% 11% 64% 12% 0% 10% 13% 71% 6% 0% 9% 8% 75% 8% 0% 16% 13% 70% 1% 0% 16% 10% 67% 6%
Local
May 29% 37% 7% 25% 2% 24% 44% 11% 18% 3% 21% 34% 15% 24% 6% 17% 30% 24% 25% 4% 0% 68% 6% 21% 5%
June 21% 33% 12% 32% 2% 17% 38% 19% 22% 3% 14% 28% 24% 28% 6% 10% 23% 36% 27% 3% 0% 60% 9% 26% 5%
July 4% 10% 9% 71% 5% 4% 13% 17% 58% 9% 2% 8% 16% 59% 15% 2% 7% 26% 57% 8% 0% 20% 7% 59% 13%
August 0% 6% 6% 79% 8% 0% 8% 11% 65% 15% 0% 5% 10% 62% 24% 0% 4% 17% 64% 14% 0% 12% 5% 62% 21%
Public Satisfaction Public Satisfaction Public Satisfaction Public Satisfaction Public Satisfaction
Some High School High School College University Post-graduate
Tourist 1 2 3 4 5 1 2 3 4 5 1 2 3 4 5 1 2 3 4 5 1 2 3 4 5
Belleville 7% 20% 18% 41% 13% 3% 11% 21% 55% 10% 6% 12% 15% 54% 13% 2% 15% 23% 59% 2% 0% 17% 17% 54% 11%
Mohawk Bay 5% 15% 22% 44% 13% 2% 8% 24% 57% 9% 4% 10% 18% 56% 12% 1% 11% 26% 59% 2% 0% 13% 20% 56% 11%
Picton 11% 19% 14% 42% 14% 4% 11% 17% 58% 10% 9% 12% 12% 54% 13% 3% 15% 18% 62% 2% 0% 17% 14% 57% 12%
Quinte West 0% 23% 7% 59% 10% 0% 13% 7% 74% 6% 0% 14% 5% 72% 8% 0% 16% 7% 75% 1% 0% 18% 6% 69% 7%
Trenton 21% 39% 13% 20% 7% 11% 30% 18% 34% 7% 21% 30% 12% 30% 8% 7% 38% 19% 35% 1% 0% 44% 15% 33% 8%
Local
Belleville 9% 18% 11% 58% 4% 4% 15% 17% 54% 10% 4% 11% 19% 53% 13% 3% 9% 30% 51% 7% 0% 24% 8% 56% 12%
Mohawk Bay 2% 11% 8% 73% 6% 1% 8% 12% 65% 13% 1% 6% 13% 63% 18% 1% 5% 22% 62% 10% 0% 13% 6% 65% 16%
Picton 14% 21% 8% 50% 6% 7% 17% 13% 48% 15% 6% 13% 14% 47% 20% 5% 12% 24% 48% 11% 0% 27% 6% 49% 18%
Quinte West 0% 18% 10% 71% 1% 0% 15% 14% 67% 3% 0% 11% 16% 68% 4% 0% 9% 25% 63% 2% 0% 23% 7% 66% 4%
Trenton 25% 34% 9% 29% 2% 14% 33% 16% 32% 6% 14% 26% 19% 33% 8% 11% 22% 30% 33% 4% 0% 52% 8% 33% 7%
Public Satisfaction Public Satisfaction Public Satisfaction Public Satisfaction Public Satisfaction
Some High School High School College University Post-graduate

Table SI-7: Willingness to donate among groups (local/tourist) by gender.
Table SI-8: Willingness to donate among groups (local/tourist) by education.
Table SI-9: Willingness to donate among groups (local/tourist) by month.
Table SI-10: Willingness to donate by group (local/tourist).
Gender < 5 5-50 50-100 >100 < 5 5-50 50-100 >100
Male 52% 31% 7% 10% 60% 30% 8% 2%
Female 40% 41% 12% 7% 43% 39% 10% 8%
Donation (Local) ($) Donation (Tourist) ($)
Education < 5 5-50 50-100 >100 < 5 5-50 50-100 >100
Some High School 73% 13% 11% 2% 57% 29% 14% 0%
High School 45% 36% 9% 9% 56% 25% 11% 8%
College 38% 45% 6% 10% 47% 42% 6% 5%
University 39% 42% 5% 15% 54% 36% 7% 3%
Post-graduate 67% 24% 5% 5% 30% 55% 15% 0%
Donation (Local) ($) Donation (Tourist) ($)
Month < 5 5-50 50-100 >100 < 5 5-50 50-100 >100
May 45% 36% 8% 11% 57% 33% 9% 0%
June 46% 31% 11% 12% 52% 38% 6% 3%
July 47% 39% 8% 6% 49% 33% 13% 5%
August 47% 37% 8% 8% 47% 33% 4% 15%
Donation (Local) ($) Donation (Tourist) ($)
Group < 5 5-50 50-100 >100
Local 47% 36% 9% 9%
Tourist 51% 35% 9% 5%
Donation (Total) ($)

Table SI-11: Willingness to donate among groups (local/tourist) by level of Public Satisfaction (1,2=Satisfied,
3=Neutral, 4,5=Dissatisfied).
Public Satisfaction < 5 5-50 50-100 >100 < 5 5-50 50-100 >100
1,2=Satisfied 44% 34% 11% 10% 43% 52% 4% 1%
3=Neutral 44% 39% 10% 7% 53% 30% 13% 4%
4,5=Dissatisfied 48% 36% 8% 8% 54% 27% 10% 8%
Donation (Local) ($) Donation (Tourist) ($)

Table SI-12: Willingness to donate by month and level of Public Satisfaction (1=Completely satisfied, 2=Satisfied, 3=Neutral, 4=Dissatisfied, and
5=Strongly dissatisfied).
Table SI-13: Willingness to donate by location and level of Public Satisfaction (1=Completely satisfied, 2=Satisfied, 3=Neutral, 4=Dissatisfied, and
5=Strongly dissatisfied).
Tourist < 5 5-50 50-100 >100 < 5 5-50 50-100 >100 < 5 5-50 50-100 >100 < 5 5-50 50-100 >100 < 5 5-50 50-100 >100
May 57% 35% 4% 3% 48% 44% 7% 1% 53% 25% 20% 2% 59% 21% 17% 3% 55% 31% 13% 2%
June 53% 37% 3% 7% 46% 47% 5% 2% 54% 28% 14% 4% 58% 24% 11% 7% 54% 34% 9% 4%
July 41% 43% 4% 13% 35% 55% 7% 4% 41% 33% 19% 7% 45% 28% 16% 12% 42% 40% 12% 6%
August 39% 42% 1% 18% 36% 57% 1% 7% 46% 38% 3% 13% 48% 30% 2% 19% 45% 43% 2% 10%
Local
May 54% 29% 7% 10% 40% 39% 10% 11% 43% 40% 9% 9% 50% 35% 7% 9% 34% 35% 8% 23%
June 55% 24% 10% 12% 41% 34% 13% 13% 45% 34% 11% 10% 51% 30% 9% 10% 35% 29% 10% 26%
July 55% 31% 8% 6% 41% 42% 11% 7% 44% 42% 9% 5% 51% 37% 7% 5% 37% 39% 9% 15%
August 55% 29% 9% 7% 41% 40% 12% 7% 45% 40% 10% 5% 52% 36% 7% 5% 38% 38% 9% 15%
Public Donation ($) Public Donation ($) Public Donation ($) Public Donation ($) Public Donation ($)
1= Completely satisfied 2= Satisfied 3= Neutral 4= Dissatisfied 5= Strongly dissatisfied
Tourist < 5 5-50 50-100 >100 < 5 5-50 50-100 >100 < 5 5-50 50-100 >100 < 5 5-50 50-100 >100 < 5 5-50 50-100 >100
Belleville 59% 36% 3% 2% 48% 46% 5% 1% 54% 30% 14% 2% 57% 28% 12% 2% 51% 38% 10% 1%
Mohawk Bay 50% 34% 6% 10% 42% 45% 10% 3% 42% 27% 24% 8% 43% 24% 21% 13% 41% 34% 17% 7%
Picton 51% 32% 3% 14% 45% 45% 6% 5% 46% 27% 15% 12% 46% 24% 12% 18% 45% 35% 11% 10%
Quinte West 42% 25% 0% 33% 45% 40% 0% 15% 42% 24% 1% 34% 37% 18% 0% 45% 42% 30% 0% 28%
Trenton 51% 39% 3% 7% 41% 51% 6% 2% 46% 33% 15% 6% 48% 30% 13% 9% 44% 41% 10% 5%
Local
Belleville 53% 26% 11% 10% 39% 37% 14% 9% 43% 39% 11% 7% 50% 37% 8% 6% 36% 38% 9% 17%
Mohawk Bay 55% 22% 12% 11% 42% 32% 16% 10% 46% 34% 13% 7% 53% 32% 9% 6% 38% 33% 11% 18%
Picton 54% 27% 11% 9% 40% 38% 13% 8% 44% 40% 11% 6% 50% 37% 7% 5% 37% 39% 9% 15%
Quinte West 47% 24% 15% 14% 35% 33% 18% 14% 39% 36% 15% 10% 46% 34% 11% 9% 31% 33% 13% 23%
Trenton 55% 26% 7% 11% 42% 38% 9% 11% 45% 40% 7% 8% 52% 37% 5% 7% 37% 38% 6% 19%
Public Donation ($) Public Donation ($) Public Donation ($) Public Donation ($) Public Donation ($)
1= Completely satisfied 2= Satisfied 3= Neutral 4= Dissatisfied 5= Strongly dissatisfied

Section B - Questionnaire of the Public Survey
Please respond to the following questions for the conditions and your uses today. Date:________________
1. What are you using the Bay of Quinte (BofQ) usually for (check all that apply)?
____Swimming
____Fishing
____Bay Beauty/Tanning
____Picnicking
____Jet skiing
____Canoeing/Kayaking
____Motorized boating
____Tubing/Water skiing
____Other (specify)____________________________
2. How often do you use the Bay?
____Couple times a week
____Once a week
____Twice a month
____Once a month
____Occasionally
____First time
3. What qualities of the water do you believe are important to be able to use the Bay (check all that apply)?
____Water temperature
____Little water odour
____Little water colour
____No algal scums
____Sport fish populations
____Little dirt in the water
____Other (specify)_____________________________
4. The water of the Bay is clear today.
____Completely agree
____Agree
____Neutral
____Disagree
____Strongly disagree

5. What is the colour of the water?
____Blue
____Green
____Brown
____Brownish / Green
____Other (specify)_____________________________
6. The conditions of the Bay is satisfactory for my use(s) today.
____Completely agree
____Agree
____Neutral
____Disagree
____Strongly disagree
7. Do you find the aquatic plants to be a major disturbance of the quality of water?
____Yes
____No
____Somewhat
8. Do you still feel the same way, if we tell you that those aquatic plants are favourable habitats for fish?
____Yes
____No
____Somewhat
9. If you went fishing, how many fish have you caught today?
____0
____1
____2
____3‐4
____5‐6
____more than 6
____N/A

10. If you went fishing, what type and how many of each fish have you caught today (if applicable)?
____Walleye
____Large mouth
____Smallmouth
____Pike
____Panfish
____N/A
____Other (specify)___________
11. Is this your first visit?
____Yes
____No
11a. If No, how often have you visited this place?
____Within last year
____Within last 5 years
____More than 5 years
11b. What changes have you noticed?
____Clarity better
____Clarity worst
____Smell better
____Smell worst
____More fish catch
____Less fish catch
____More weeds
____Less weeds
____More algae
____Less algae
____Other (Specify) ___________
12. Do you know that the BofQ is categorized as an Area of Concern (AOC) (i.e. a system with serious
environmental problems)?
____Yes
____No
13. Do you think that the BofQ is close to being delisted as an Area of Concern?
____Yes
____No

14. Will you come back to this place?
____Yes
____No
Optional Demographic Information
A. What is your age?
____Under 18
____18‐25
____26‐35
____36‐49
____50‐65
____65 or older
B. What is your gender?
____Male
____Female
C. What is your race or ethnicity?
____Caucasian/White
____Asian
____African
____Indian (First Nation)
____Other (specify)_______________________
D. What is the highest level of education you have completed?
____Some High School
____High School degree
____College degree
____University degree
____Post-graduate university degree
E. Where do you live?
____On the shore
____Bay of Quinte region
____Ontario
____Canada
____Outside Canada

F. How much is your total annual household income?
____Less than $30,000
____$30,000$ to $65,000
____$65,000-$90,000
____>$90,000
G. How would you characterize your political point of view?
____Liberal
____Conservative
____Other (specify)_______________________
H. If the local communities or NGO's ask for some help to protect the Bay, to what extend are you willing to
participate?
I am a tourist I am local
I am willing to contribute lower than $5 I am willing to contribute lower than $5
I am willing to contribute $5 to $50 I am willing to contribute $5 to $50
I am willing to contribute $50 to $100 I am willing to contribute $50 to $100
I am willing to contribute more than $100 I am willing to contribute more than $100