Ecological assessment of a shifting conservation - Deep Blue
69
Ecological assessment of a shifting conservation landscape in Kenya Insights from a long-term assessment of mammalian community change in an African National Park Aimee Leigh Massey A Thesis submitted In partial fulfillment of the requirements For the degree of Master of Science Natural Resources and Environment University of Michigan August 2013 Thesis Committee: Associate Professor Johannes Foufopoulos, Chair Associate Professor Rebecca Hardin
Transcript of Ecological assessment of a shifting conservation - Deep Blue

Ecological assessment of a shifting conservation landscape in Kenya
Insights from a long-term assessment of mammalian community change in an African National
Park
Aimee Leigh Massey
A Thesis submitted
In partial fulfillment of the requirements
For the degree of
Master of Science
Natural Resources and Environment
University of Michigan
August 2013
Thesis Committee:
Associate Professor Johannes Foufopoulos, Chair
Associate Professor Rebecca Hardin


ii
Abstract
The Aberdare Conservation Area (ACA), located in the central Kenyan highlands, is one
of Africa’s flagship National Parks. The area harbors large amounts of African wildlife including
several species of afromontane endemics that are of conservation concern. Since its inception,
the ACA has experienced explosive human population growth at its margins, with associated
domestication of the surrounding landscapes. Both processes have led to a de facto isolation of
the ACA from other natural areas. Even before the establishment of the national park, local
authorities started collecting systematic wildlife records. These nightly surveys, conducted by
trained professionals using standardized protocols over a period of approx. 50 years, provide a
unique opportunity to evaluate the effects of various conservation measures including the
construction of a perimeter fence.
Here I analyze two exceptionally long-term nightly datasets on the diverse mammal
community (46 spp.) collected in two different locations, one close to the edge of the protected
area (Treetops Lodge) and one closer to the core of the park (The Ark Lodge). I found not only
clear difference in the two species communities, but also differentiation in the temporal changes
of wildlife populations between the two sites. Five taxa (bushy-tailed mongoose, coypu,
reedbuck, impala, and eland) appeared in the resident mammal community during this study,
while eight species (aardvark, bushpig, bongo, civet, Harvey’s duiker, jackal, lion, and zorilla)
disappeared. The species that have disappeared from the ACA are either intrinsically rare taxa or
savanna species that have had a marginal existence within the limits of the ACA. I find strong
evidence for edge effects with the site closest to the border of the ACA (Treetops); this site
registered the strongest losses in total wildlife population numbers, aggregate wildlife biomass,
species richness, and compound indices of species diversity. Establishment of a fence around the
iii
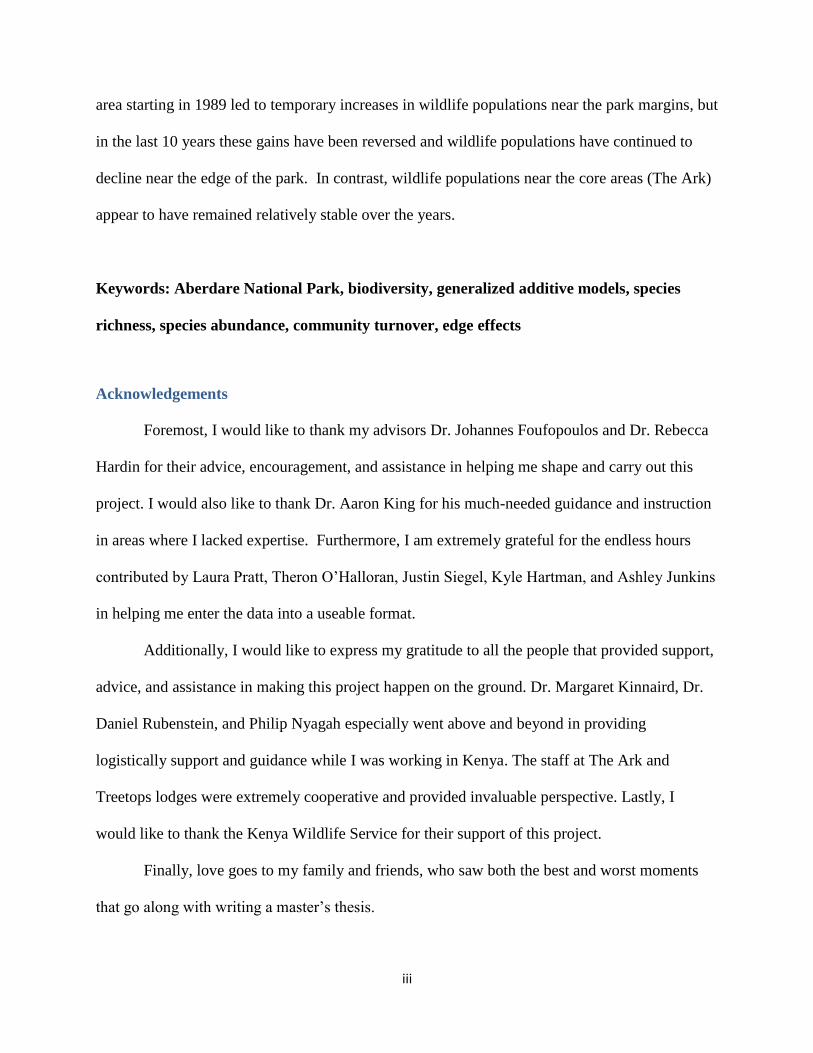
area starting in 1989 led to temporary increases in wildlife populations near the park margins, but
in the last 10 years these gains have been reversed and wildlife populations have continued to
decline near the edge of the park. In contrast, wildlife populations near the core areas (The Ark)
appear to have remained relatively stable over the years.
Keywords: Aberdare National Park, biodiversity, generalized additive models, species
richness, species abundance, community turnover, edge effects
Acknowledgements
Foremost, I would like to thank my advisors Dr. Johannes Foufopoulos and Dr. Rebecca
Hardin for their advice, encouragement, and assistance in helping me shape and carry out this
project. I would also like to thank Dr. Aaron King for his much-needed guidance and instruction
in areas where I lacked expertise. Furthermore, I am extremely grateful for the endless hours
contributed by Laura Pratt, Theron O’Halloran, Justin Siegel, Kyle Hartman, and Ashley Junkins
in helping me enter the data into a useable format.
Additionally, I would like to express my gratitude to all the people that provided support,
advice, and assistance in making this project happen on the ground. Dr. Margaret Kinnaird, Dr.
Daniel Rubenstein, and Philip Nyagah especially went above and beyond in providing
logistically support and guidance while I was working in Kenya. The staff at The Ark and
Treetops lodges were extremely cooperative and provided invaluable perspective. Lastly, I
would like to thank the Kenya Wildlife Service for their support of this project.
Finally, love goes to my family and friends, who saw both the best and worst moments
that go along with writing a master’s thesis.

iv
Table of Contents
Introduction 1
Methods 7
Results 16
Discussion 19
Conservation Implications 23
Figures 28
Appendix 40
Works Cited 61
1
Introduction
The Aberdare mountain range is one of Africa’s flagship conservation areas; its natural
value lies in its plentiful water resources, abundant forests, and endemic biodiversity. Aberdare
National Park is world renowned for its high concentration of megafauna, which in turn has
made it a prime target for conservation and ecotourism activities. These conservation efforts,
culminating most recently in the fencing of the perimeter of the Aberdare mountain range, have
had important implications for the management of the protected area. Many have hailed these
changes as a win-win for the wildlife inside the protected area and the human communities that
have become established at the margins of the ecosystem. Although the value of Aberdare
bioregion has been recognized, surprisingly little has been done in quantifying the biodiversity of
the protected area. In particular, little work has been done to document long-term changes in
wildlife populations or investigate the general effects of conservation management on the
biodiversity of the region.
Here I analyze two previously unpublished long-term datasets that document wildlife
populations in this biodiversity hotspot. The purpose of this study is to explore spatial and
temporal patterns in the mammalian communities at two study sites located within Aberdare
National Park (Figure 1) across the duration of the datasets. The wildlife observation records
from Treetops and The Ark lodges within Aberdare National Park provide 80 cumulative years
of sighting data (data records span from 1963-2011 and include 48 years of data from Treetops
and 32 years of data from The Ark). I explored the time series data using population and
diversity measures to identify long-term trends in the resident mammal communities. In addition
the analysis provides the rare chance to evaluate the effectiveness of an electric fence that was
built around the perimeter of the ACA on wildlife using long-term historical data. Given the
2
increased use of such fences around protected areas, this study can provide important before and
after data that can inform further conservation planning.
Population monitoring across a mammalian community
Standardized long-term survey data are used regularly to monitor changes in species
populations, especially for taxa of conservation interest (Fedy & Aldridge, 2011; Rendon, Green,
Aguilera, & Almaraz, 2007). However, such data have been used less often to investigate
population dynamics across multiple taxa, let alone entire species communities1 (for exceptions
see Waite et al., 2007 and Kirkland, 1990 (a metanalysis)). This dearth of long-term whole-
community datasets is understandable given the immense methodological, logistical and fiscal
challenges that such investigations pose. The wildlife surveys of Treetops and The Ark, obtained
on a daily basis, provide an unusual opportunity to delve into questions concerning the stability
and changes in a mammalian community over a long-term time period. I employed methods
similar to previous studies that utilized long-term population data in order to provide a historical
timeline of species abundance and diversity in this system.
Diversity: a measure of an ecosystem
Growing concerns over the state of ecosystems have rekindled interest in integrative
measures of biological diversity that can be used to evaluate potential disturbances and change
on these systems (Mugarran & Henderson, 2010). Measures of biodiversity have been used to
evaluate such factors as ecosystem productivity and stability (Tilman, 1996; McNaughton,
1977), as well as overall ecosystem health (defined here as the actual state of an ecosystem
1 This statement is based upon a literature review that included a key word search (mammal community data
conservation) and an extensive reference search of key articles.
3
relative to the state desired by management). Here I use indicators of diversity to investigate the
following general questions:
(1) Do diversity measures of the mammalian communities vary spatially?
(2) Do diversity measures of the mammalian communities vary temporally?
(3) Relatedly, do changes in diversity correspond to the construction of the electric fence
that encloses the Aberdare ecosystem?
The wildlife datasets allow us to calculate such diversity values across the two study sites as well
as across the timeline of observations. I accomplish this investigation of diversity change by
utilizing measures of species richness and species abundance. Species richness and abundance
(or evenness) are two broad measures that have traditionally been used to assess the biodiversity
of an ecosystem. There are also a variety of indices used to measure species diversity which are
useful when one wants to describe both the evenness and richness of a species community with
one value (Magurran, 2004). I employed the Shannon-Wiener diversity index, defined as H’, to
compare diversity between the two study habitats across the time series data.
Brief overview of Aberdare National Park
Aberdare National Park is a 776 km² protected area located within the larger Aberdare
Conservation Area (ACA; 2185 km²). Even before its establishment as a national park in 1970,
the Aberdare range was recognized as a priority region critical for the protection of forest,
wildlife (particularly charismatic megafauna) and water resources. Recent estimates suggest that
the Aberdare range harbors 50+ mammal species, 270 species of birds, and over 770 species of
vascular plants (Butynski, 1999). Aside its global importance as a cradle of biodiversity (the
Aberdare Range belongs to the ‘Eastern Arc and Coastal Forests of Tanzania and Kenya’
4
biodiversity hotspot (Myers et al., 2000)), the Aberdares mountain range provides valuable
ecosystem services to local communities through its provisioning of an abundant and stable
water supply. The Aberdare mountain range is considered one of the five major water towers of
Kenya with five of country’s seven major rivers originating in this range. The area serves as a
catchment for the Sasumua and Ndakaini dams and provides most of the water and energy
resources for Kenya’s capital, Nairobi (Lambrechts, Woodley, Church, & Gachanja, 2003).
The lush tropical forests and abundance of wildlife make the Aberdare Range and the Mt.
Kenya region a popular tourism destination in Kenya. Tourism is traditionally ranked as the
second most important industry (behind agriculture) with 1 million tourists in 2010 and foreign
exchange revenue of over 800 million U.S. dollars (Ministry of Tourism, Nairobi, Kenya). While
much of the tourism and its associated benefits are based on intact natural ecosystems and
wildlife viewing, intense agriculture and high population density in areas adjacent to the ACA, as
well as illegal exploitation of forests and wildlife inside the conservation area, threaten the
protection of these resources (Rhino Ark, 2011; Lambrechts, Woodley, Church, & Gachanja,
2003).
The management in the Aberdare Conservation Area
The vulnerability of the Aberdares landscape coupled with the high value of its natural
resources have resulted in a complex history of wildlife and habitat management. Like many
Eastern African landscapes, the Aberdares has faced many threats that have impacted its wildlife.
This includes heavy poaching of rhinos for their horns causing a population crash in the 1970’s
(Western, 1982; Walpole, Morgan-Davies, Milledge, Bett, & Leader-Williams, 2001). In
addition, there has been illegal exploitation of the forests inside the protected area including such
activities as logging, livestock grazing, marijuana cultivation, and charcoal kilns (Rhino Ark,

5
2011), and increased agricultural intensity and urbanization in areas adjacent to the Aberdares.
These events have triggered aggressive single-species management initiatives, as well as a major
fencing initiative (discussed in detail in the next section).
Much of past conservation management has focused on two rare and charismatic taxa: the
mountain bongo (Tragelaphus euryceros) and the black rhino (Diceros bicornis). The mountain
(or eastern) bongo, endemic to the Aberdare and Mt. Kenya mountain ranges, is considered the
Aberdares “flagship” species. It’s estimated that globally less than 100 individuals remain in the
wild due to poaching and human encroachment (Estes, Okin, Mwangi, Shugart, 2008). Lion
control efforts were used in the 1990s to reduce predation on the bongo population (Charles
Mathenge, pers. comm.). Other efforts include the translocation of a number of individuals from
Florida zoos to revitalize wild populations and the monitoring of collared individuals for
ecological studies (i.e. Estes, Okin, Mwangi, & Shugart, 2008; Faria, et al., 2011).
Other conservation efforts have also targeted the black rhino populations in the Aberdare
range. These efforts have primarily been led by the Rhino Ark, a NGO established in 1988. Both
in the ACA specifically, as well as in Kenya in general, black and white rhino populations have
experienced a dramatic decline (Western, 1982). As a result, a rhino fence was commissioned by
Rhino Ark to help protect black rhinos in the Aberdares. The original proposal would have
isolated black rhinos inside the ACA but would have allowed for movement of other wildlife
species across the ACA boundaries (Rhino Ark, 2011). However, the scope of the fence project
was soon expanded to an electric fence with the increasing concern about conflict among farmers
and wildlife, as well as the increasing exploitation of the protected forests (Lambrechts,
Woodley, Church, & Gachanja, 2003).
The Aberdare fence

6
In a report chronicling the destruction of the Aberdare range, Dr. Newton Kulundu for
Kenya’s Ministry of Environment, Natural Resources, and Wildlife describes the Aberdares as
an invaluable ecosystem facing a range of threats: increasing agricultural intensification at the
edges of the protected area, increasing urbanization of the neighboring city of Nyeri, and illegal
exploitation of wildlife and forests inside the protected area (Lambrechts, Woodley, Church, &
Gachanja, 2003). In an effort to protect the Aberdare ecosystem, a non-governmental
organization called Rhino Ark was established in 1988 to oversee and coordinate wildlife
conservation efforts. These included plans to stop illegal exploitation of wildlife inside the park
(in particular the poaching of black rhino) as well as reduce human-wildlife conflicts at the edges
of the protected area. Reports (Butynski, 1999; FAO, 1998) have concluded that the best way to
reduce these conflicts would be to physically separate wildlife from the agricultural and urban
areas that surround the Aberdare range. In the 1970’s, a game ditch (Prickett, 1974) had been
used to discourage wildlife from leaving the park in the direction of the surrounding agricultural
fields and the nearby town of Nyeri (see reference Figure 1). However, these ditches proved
ineffective: elephants destroyed the walls of the moats and most other animals could jump across
the ditch (Thouless & Sakwa, 1995). The need for a more effective and manageable solution,
particularly near the two wildlife lodges where megafauna populations were most heavily
concentrated, gave justification for the construction of an electric fence.
This major conservation initiative was carried out by the Rhino Ark and other partners,
including the Kenya Wildlife Service, from 1989-2009 and helped to establish the Aberdares as a
successful conservation example in Eastern Africa. The fence was completed in eight phases,
and at 400 km it functionally isolates the ACA from the surrounding landscape. The first phase
of the Aberdare fence was built around the perimeter of The Salient, a 70 km² area where our
7
two study sites are located (Figure 1). This area was an obvious choice for the first portion of the
fence; it has the highest concentration of megafauna in the Aberdare ecosystem, lies in the
immediate vicinity of Nyeri, and is the focus of most of the tourist activities in the area.
Physically separating protected areas from the surrounding environment is not a novel
approach and fencing has been shown to be one of the most effective short-term solutions for
reducing human-wildlife conflict (Parker et al., 2013, Thouless & Sakwa, 1995; Kenya Wildlife
Service, 1990; Taylor and Martin, 1987; O’Connell-Rodwell, Rodwell, Rice & Hart, 2000).
However, largely due to lack of data, there has been little opportunity to investigate in a
quantitatively rigorous manner the effects of fence establishment on the numbers and
composition of the local wildlife populations. Given the high costs of fencing, there is usually
little money remaining to evaluate the effects of the fence and instead management plans are
often carried out on a trial-and-error basis (Thouless & Sakwa, 1995). The wildlife datasets
available at Treetops and The Ark provide us with this rare opportunity to investigate the
potential long-term effects of an electric fence. Because the portion of fence around our study
region was completed in 1991, a sufficiently long period of time has elapsed to evaluate the
potential long-term effects of the fence on the local wildlife populations.
Methods
1. Study Area
Aberdare National Park (ANP; 776 km²) is located in the Aberdare mountain range in the
Central Province of Kenya. The Aberdare range lies southwest of Mt. Kenya and runs roughly in
a north to south direction, thus forming the eastern rim of the Great Rift Valley. Together with
the Aberdare Forest Reserves (1411 km²), ANP comprises the larger protected area known as the
8
Aberdare Conservation Area (ACA) (2,185 km²). The Aberdare ecoregion has two rainy seasons;
the long rains occur during April-June, whereas the short rains occur during the November-
December season. Annual precipitation totals average 956 mm (SE= 80.9; n= 12) near The Ark
wildlife lodge (The Ark Lodge, unpubl. data). Mean daytime temperatures range from 16°C
(July) to 21.8°C (February) (The Ark Lodge, unpubl. data).
Ten distinct vegetation zones exist along the elevation gradient of the Aberdare Range
(1,850-4,000 m); they can be grouped into three broader categories (Rhino Ark, 2011). The
montane forests occur at the lowest elevations (1,900-2,400 m) and include the highest diversity
of flora and fauna in the Aberdare Range. This is followed by the bamboo zone (2,400-3,000 m),
and then the high elevation moorlands (dominated by Hagenia, Hypericum, and various
ericaceous species) at the highest reaches of the range.
This study focuses on a section of the Aberdare NP known as the Salient. The Salient is a
70 km² spur of the mountain range that extends towards the east (Figure 1). The area is
dominated by montane forest at higher elevations and transitions into one of the few savanna
areas of the region towards the far eastern edge of the NP (Sillero-Zubiri & Gottelli, 1991). The
Salient is known for its exceptionally high concentration of megafauna and has been the focus of
most tourism and conservation activities in the area. Two wildlife lodges, The Ark and Treetops,
are located in this area and they are the two sites where standardized records of wildlife sightings
have been collected on a daily basis since the mid-1960s.
Treetops
Treetops lodge sits at the edge of The Salient and Aberdare National Park and is located
less than 1 km from the edge of the park (Figure 1). Treetops lodge has a history that begins well
before the establishment of Aberdares national park in 1949 (Pullan, 1988). It began as a simple

9
tree stand in 1932 and expanded to its current 50 room capacity in the 1950’s. The lodge’s
viewing decks provide a 360° view of the surrounding environment and the watering hole that
lies adjacent to the lodge. Treetops lodge lies along a now defunct wildlife migratory route
connecting the Aberdares with Mt. Kenya (Prickett, 1974).
Located at a relatively low elevation (1,996 m asl) Treetops lies below the zone of
montane forest. Consequently, and also because of a history of deforestation, the lodge is
surrounded by one of the few areas of grassland in the ACA (Prickett, 1974) which in turn
attracts a number of savanna species otherwise rare in the area. On the other hand, the proximity
to the park edge and the lack of montane forest habitat discourage the presence of some of the
park’s more elusive, high elevation species such as the mountain bongo (Tragelaphus eurycerus
isaaci). Being located so close to the boundary of the ACA also means that the site is fully
exposed to possible edge effects.
The Ark
The Ark lodge, opened in 1970, overlooks a salt lick and a watering hole deep in the
Aberdare forests. Located 7.25 km from the entrance of the park, the site was chosen because of
its seclusion from human activities. At 2,316 m above sea level, the lodge lies within the
montane forest zone and is visited by a variety of high elevation forest taxa such as the mountain
bongo (Tragelaphus eurycerus isaaci) and the giant forest hog (gfh) (Hylochoerus
meinertzhageni).
2. Data collection
Nightly observation data have been collected by trained employees termed ‘hunters’ for
all wildlife visiting the watering holes and salt licks at each site. Aside from an approx. 10-year
gap in the Ark data (1985-1996) and a few other small gaps in the records (see Fig. 3) the data

10
records have been continuously collected since 1963 at Treetops and 1970 at The Ark. Despite
the exceptional length of the data series, a full analysis of these records has never been
undertaken. Aside from Sillero-Zubiri and Gottelli’s extensive work on the population trends and
behavior of black rhinos (Diceros bicornis) and spotted hyenas (Crocuta crocuta) (Sillero-Zubiri
& Gottelli, 1991; Sillero-Zubiri & D., 1992; Sillero-Zubiri & Gottelli, 1987; Sillero-Zubiri &
Gottelli, 1992), there has been little published on the long-term changes in the whole species
community documented at the two lodges.
The wildlife sightings are tallied everyday into the official log book at each lodge. The
‘hunter’ on duty records animals frequenting the watering hole from approximately 3pm-8am
everyday (to coincide with the arrival, overnight stay, and departure of tourists). All visible
animals that approach the waterhole and saltlick are counted. At night, visibility is restricted by
the limit of the floodlights that are turned on after darkness falls, and during the day by the line
of trees that delimit the edge of the clearings where the two lodges are situated. Special effort is
being made to avoid double counting of animals; this is achieved by using sex, group size and
morphology to identify recurrent groups and individuals. Because of the excellent visibility and
the close range of observation, it is generally easy to unambiguously assign species identity. The
one exception is marsh mongoose (Atilax paludinosus) that can be confused with melanistic
individuals of the white-tailed mongoose (Ichneumia albicauda); in this case, species identity
was determined by the time of day an individual was observed (white-tailed mongoose tend to be
nocturnal) and by its behavior (marsh mongoose tend to feed in the water). Also, I combined all
three resident hare species (Lepus capensis, L. microtis and L. saxatilis) into one general Lepus
spp. category because it was not clear that observers were always able to distinguish these taxa in
the field.
11
The methodologies for recording and organizing the wildlife sightings are nearly
identical between the two lodges. Richard Prickett, a famed hunter and naturalist, was first an
employee of Treetops and then joined The Ark when it opened in 1970, thus ensuring that
comparable methods were used (see Figure 1 of the Appendix). I took digital photographs of
each page of the logbooks (26,116 images in total) during the duration of the month of July
2011. These files were stored in external hard-discs and transported to the University of
Michigan, where over 250,000 data points were gradually entered into spreadsheet format by me
and five undergraduate students. To ensure that data were transferred correctly, every data
enterer checked the entered species counts against the species counts shown in the original
photographs for each daily entry. Additional random checks were performed both by double
checking entered data and by visual inspecting long series of all data entered for spurious values.
As with most long-term datasets, there were missing data points. The most significant
gap is from 1985-1996 at The Ark. Lodge managers theorized that the books were lost or thrown
away due to water damage (Philip Nyagah, manager at The Ark, pers. comm.). There are further
small gaps in the dataset (partial years) most likely due to lodge closures for renovations and/or
repairs.
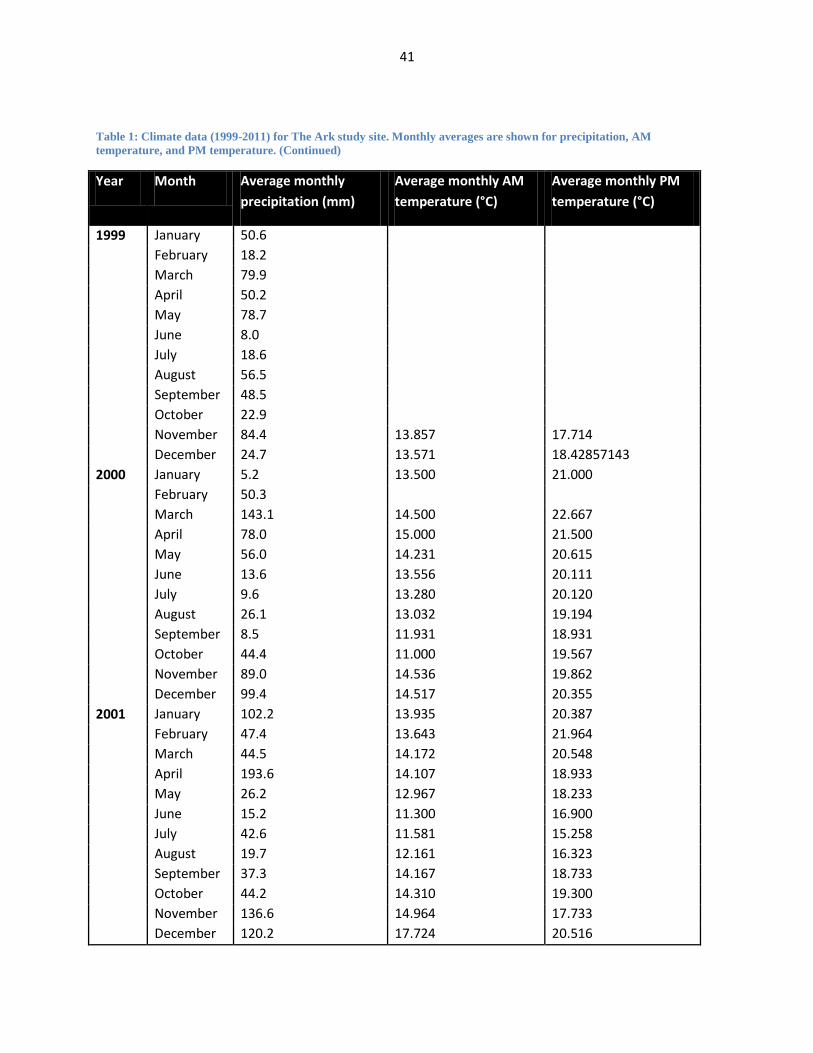
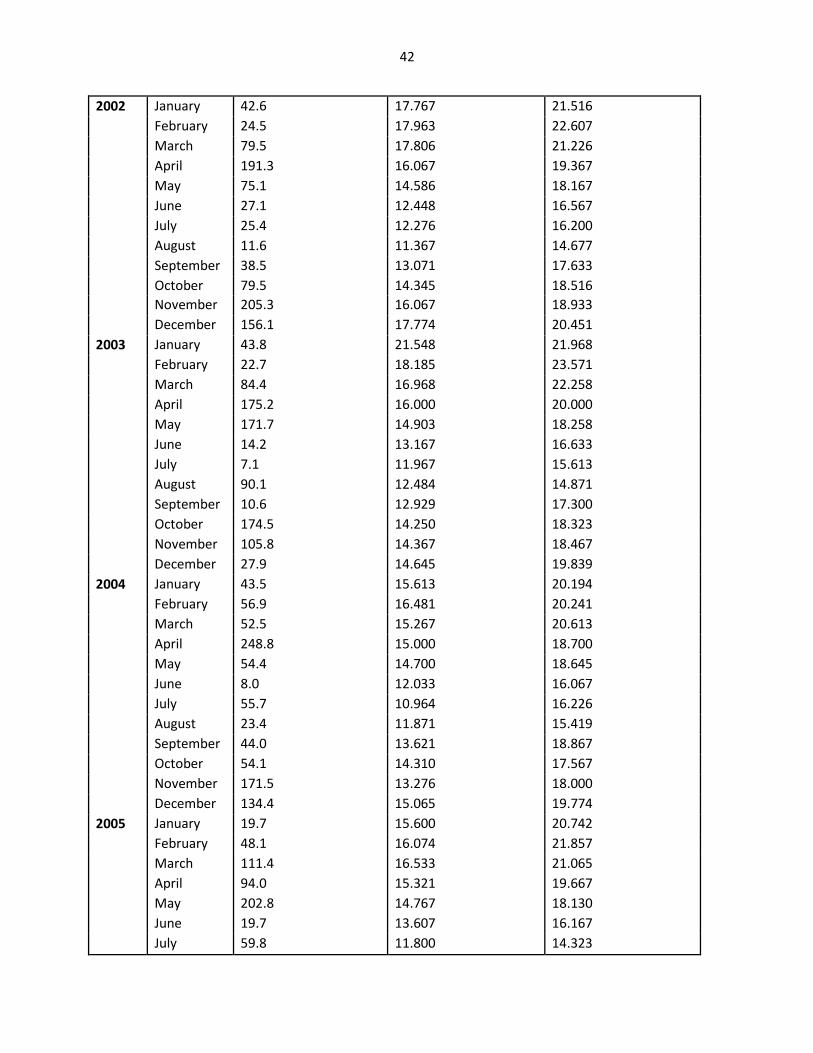
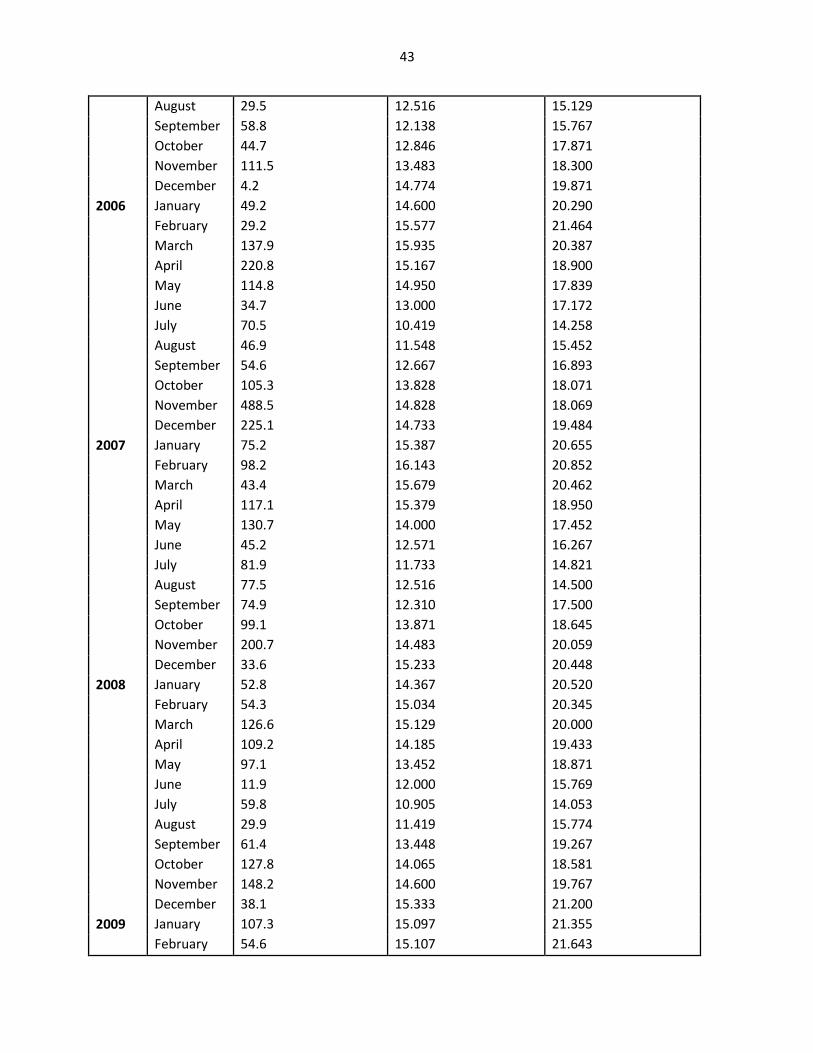
Since 1999, The Ark management has also been recording daily weather information at
the lodge. AM temperature, PM temperature, and cumulative rainfall data have been recorded on
a consistent basis. I collated these data to explore local patterns in climate seasonality (see Table
1 in Appendix for monthly temperature and rainfall averages).
3. Data analyses
Generalize Additive Models
12
In order to plot population and diversity trends in a usable way, I utilized Generalized
Additive Models (GAMs) to smooth the daily time series data. GAMs are defined as flexible
extensions of generalized linear models (GLMs); the linear predictor of GLMs is replaced by an
additive predictor thus allowing for a more flexible trend since the change in mean abundance is
not constricted to a linear curve (Fewster, Buckland, Siriwardena, Baillie, & Wilson, 2000).
Because of this flexibility, a GAM is considered a better representative of underlying data
when compared with classical Gaussian distributions (Guisan, Edwards, & Hastie, 2002) and it is
accepted as a method for detecting abundance change for data characterized as long-term and
nonlinear (Fewster, Buckland, Siriwardena, Baillie, & Wilson, 2000). It allows the analyst to
choose the level of smoothing and thus display trends that show either greater linearity or more
fine fluctuations of the data. More recent literature has also shown that GAMs can effectively
describe trends with up 50% of the data missing (Atkinson et al., 2006) making it an especially
effective analytic method for observer-based survey data.
For these reasons, GAMs have become a widely used method in analyses of long-term
population trends (Wood, 2006). Examples of GAMs used for the analysis of long-term survey
data include the Breeding Bird Survey (Fewster, Buckland, Siriwardena, Baillie, & Wilson,
2000), long-term greater sage-grouse data in Wyoming (Fedy & Aldridge, 2011), and the British
Butterfly Monitoring Scheme in the United Kingdom (Rothery & Roy, 2001). Using analyses
similar to these studies of long-term trends in wildlife populations, I applied a GAM to smooth
the raw daily observation data and diversity data. R statistical software (v. 2.15.2) was used to
configure the GAMs.
Summary measures of the mammalian community
13
Beyond the population trends of individual species, I tried to obtain an overall
understanding of changes in wildlife populations at each site as a whole by employing a variety
of summary metrics: total population size, heat maps, rank-abundance graphs, species richness,
species diversity and aggregate biomass.
Total population size. First, I calculated a summary population metric of all species by
tallying the total of the number of individuals seen at each site on a given day. A GAM smoothed
the aggregated raw data, thus allowing a better visual representation of the total wildlife
population trends at both sites.
Heat maps. To further visualize species presence and abundance in a summary way, I
constructed heat maps of the two mammalian communities ordered by species commonness.
These heat maps display the log(Abundance) (i.e. log(1+smoothed counts)) of all mammalian
species across time at each site, ranked from the globally most common (at the bottom of the
graph) to the least common (at the top).
Species richness. The total number of species seen was calculated on a daily basis for
each site. These raw data were smoothed using a GAM which I then used to determine any
significant temporal changes at each site.
Rank-Abundance Curves. I used measures of species abundance to compare the evenness
(or equitability)(E) of each species community. One of the simplest ways to compare the
evenness of communities is to construct rank-abundance curves (Heip, Herman, & Soetaert,
1998), which ranks species based on their abundance relative to all the other species in the
community. Rank abundance curves can be used to compare species communities spatially or
temporally. To compare communities across time, I constructed “snapshot” abundance curves
based on annual species data for a periodic time intervals across our study period.
14
Shannon-Wiener Diversity Index (SWDI) (H’). To quantify the level of diversity in this
mammal community, I calculated Shannon-Wiener Diversity Index (for a more complete
discussion on methodologies for evaluating diversity, see Magurran, 2004 or Kindt & Coe,
2005). The Shannon index accounts for both species richness and evenness and measures the
likelihood that a randomly sampled individual belongs to a given species within a set
community. The Shannon index (H’) is calculated by the equation:
H’ = - Eqn. 1
where i is the proportion of individuals in the ith species (Magurran, 2004). As evident by Eqn. 1,
if there is only one species in a given community, then H=0. A nonzero value indicates that the
community consists of more than one species because the probability that an individual animal
belongs to a certain species is less than 1. For biological communities, the diversity index often
varies between 1.5-3.5 (Margalef, 1972); values further from zero indicate a more diverse
community. H-values were calculated daily based both on the daily species richness and on the
total daily sighting counts for each species.
Biomass. Lastly, I evaluated the performance of the whole community by calculating
aggregate biomass for all species take together. Total biomass of the community at a given time
was calculated my summing the products of population size and average body mass for each
species.
Changes in a mammalian community
To obtain a comprehensive view of the patterns of change in the overall mammal species
in the greater Salient region (and possibly the whole ACA) I also analyzed species
presence/absence in the combined Ark and Treetops datasets. Over the period of the study, 40
15
species were recorded at Treetops and 40 species at the Ark for a grand total of 46 mammal taxa
for the whole ACA.
A species was considered to be extant in the ACA on a given year if it was seen at least
once in one of the two lodges in that year. Some taxa, however, were so rare, or present only in
particular habitats, that they were not recorded every year despite their continuous presence.
Such species were still recorded as present in the ACA in years they were not seen, as long as
they were recorded at least once in a subsequent year. While it is conceivable that ‘filling in’
such gaps may have erroneously mask repeated extinction-colonization cycles as continued
existence, this is unlikely. Because of the isolated nature of the ACA (even before the
establishment of the fence, the surrounding landscape was used intensely for agriculture and
urban settlements making it inhospitable for wild animals) it highly improbable that there has
been recent natural colonization by wildlife originating from external populations. However, 8
species (African golden cat, bat-eared-fox, blue duiker, cheetah, gray duiker, honey badger, wild
dog, and zebra mouse) were observed so rarely (less than 6 times over the 48 years of the study)
that they were excluded as it was deemed that there were not enough data to justify further
analyses.
I classified a taxon as having gone extinct if the species was missing from recent records
for at least a period longer than any previous absence (i.e. gap in the record) and it was no longer
seen in the record up to the last day of available records. For example, if species A was absent
for the last 8 years it was recorded as having gone extinct if the previous absence was less than 8
years long. I classified a colonization event when a species that was absent from earlier records
began being observed consistently at least one of the two lodges. Finally, core species are
defined as species regularly seen throughout the period of study.
16
Results
1. Changes in total wildlife population sizes
My analysis reveals clear fluctuations, both across space and time, in the aggregate
resident mammalian populations. Despite their relatively short distance between the two lodges
(approx. 6km), there are striking differences between them, both in individual species
populations and in the aggregate population sizes.
Overall population numbers have been relatively stable at the Ark over the study period
while they have fluctuated strongly at Treetops. Until the mid-1970s, there was a rapid increase
in wildlife populations at Treetops (as well as to a lesser extent at the Ark) most likely following
the eradication of rinderpest in the area (Figure 3). During the first 40 years of the study, but
especially early on, Treetops harbored much larger wildlife populations than The Ark. Using the
sum of the raw individual species population data to compare the two sites at specific time
points, I found that the average annual population at Treetops ( ̅ = 126,592.5) is significantly
greater than the average annual population at The Ark ( ̅ = 39,780.8) for the baseline years of
1970-1975 (two-sampled t-test, t=10.03, df=10, p<0.001). Comparatively, looking at the most
recent five-year span (2006-2011), I find that there is no significant difference (two-sample t-
test, t=1.59, df=10, p>0.05) between the average annual population at Treetops ( ̅ = 34,096.5)
and the average annual population of The Ark ( ̅ = 46,046.5). The total wildlife population at
Treetops has decreased dramatically (by approx. 73% from the highest count in 1973) and it has
now fallen below the mean population size at The Ark, which has remained relatively steady
over the years. Nevertheless, comparisons of total wildlife population sizes between the two sites
at a given moment in time should be interpreted with caution since the geography of each site
(Treetops is more open) results in different detectability of species at each site.
17
Heat maps (Figure 4) provide a more detailed account of the individual time series data
and give a clearer picture of how the makeup of the two communities has fluctuated across time,
including the appearance or disappearance of species in each community. This species turnover
is especially evident in the second half of the Treetops dataset, where there is evidence of a
drastic population decline. From 1991-2011, there are seven species that show significant
decreases in abundance (giant forest hog, hyena, black rhino, genet, Sykes monkey, bushbaby
and colobus monkey) while during the same time period there are six species that have
significant but ultimately only transient increases in abundance (baboons, eland, impala
reedbuck, slender mongoose).
2. Patterns in biodiversity
Biodiversity
Species richness varied greatly between the two sites, as well as over the time period
investigated. In general, the spatiotemporal patterns in species richness mirror closely the
patterns observed in aggregate wildlife population numbers, with species richness at The Ark
being much more stable over time relative to Treetops. The number of species seen on a given
day range from S = 3 to S = 16 at The Ark and S = 1 to S = 17 at Treetops with ̅ = 10.31 at The
Ark and ̅ = 10.28 at Treetops. A GAM (Figure 5) showcases the trends of daily species richness
at Treetops and The Ark. For Treetops, following an initial rise through the mid-1970s, most
likely caused by the eradication of the rinderpest from the region, species richness starts a long
decline which appears to have accelerated in the last 10 years. Overall, species richness appears
to have been much more stable at the Ark relative to Treetops.
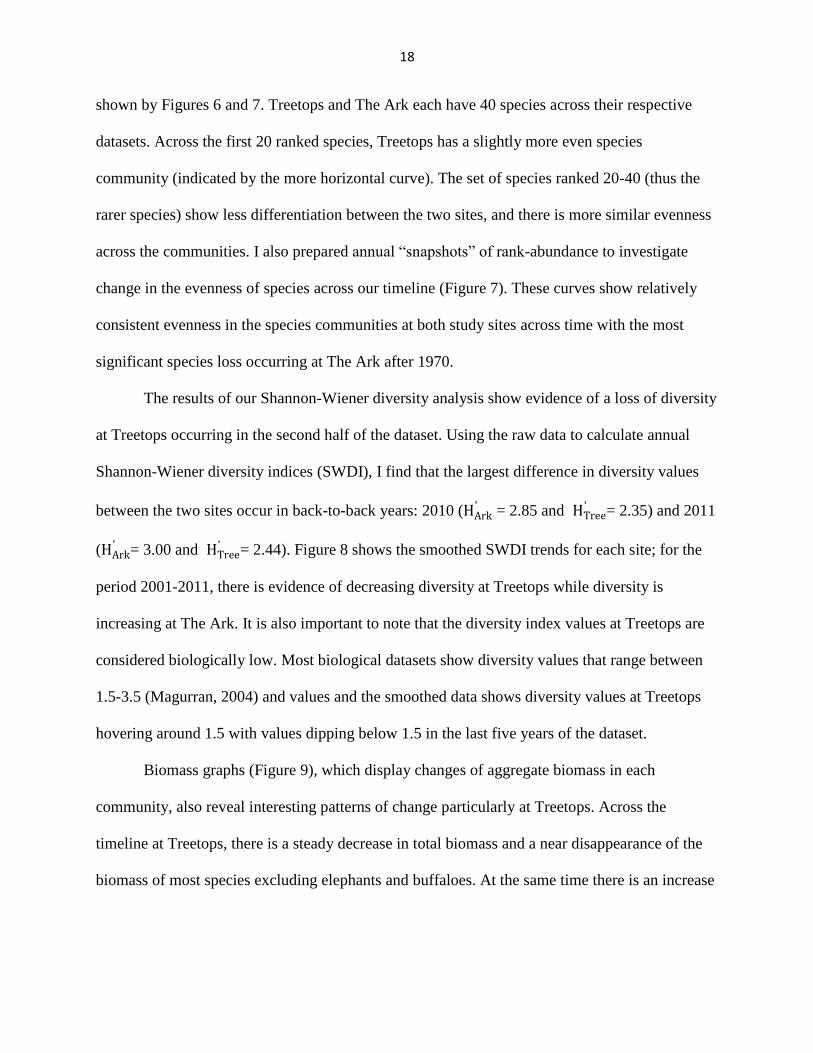
To understand dynamics within the community, I also used rank-abundance measures. A
rank-abundance curve can provide information regarding the evenness of each community as
18
shown by Figures 6 and 7. Treetops and The Ark each have 40 species across their respective
datasets. Across the first 20 ranked species, Treetops has a slightly more even species
community (indicated by the more horizontal curve). The set of species ranked 20-40 (thus the
rarer species) show less differentiation between the two sites, and there is more similar evenness
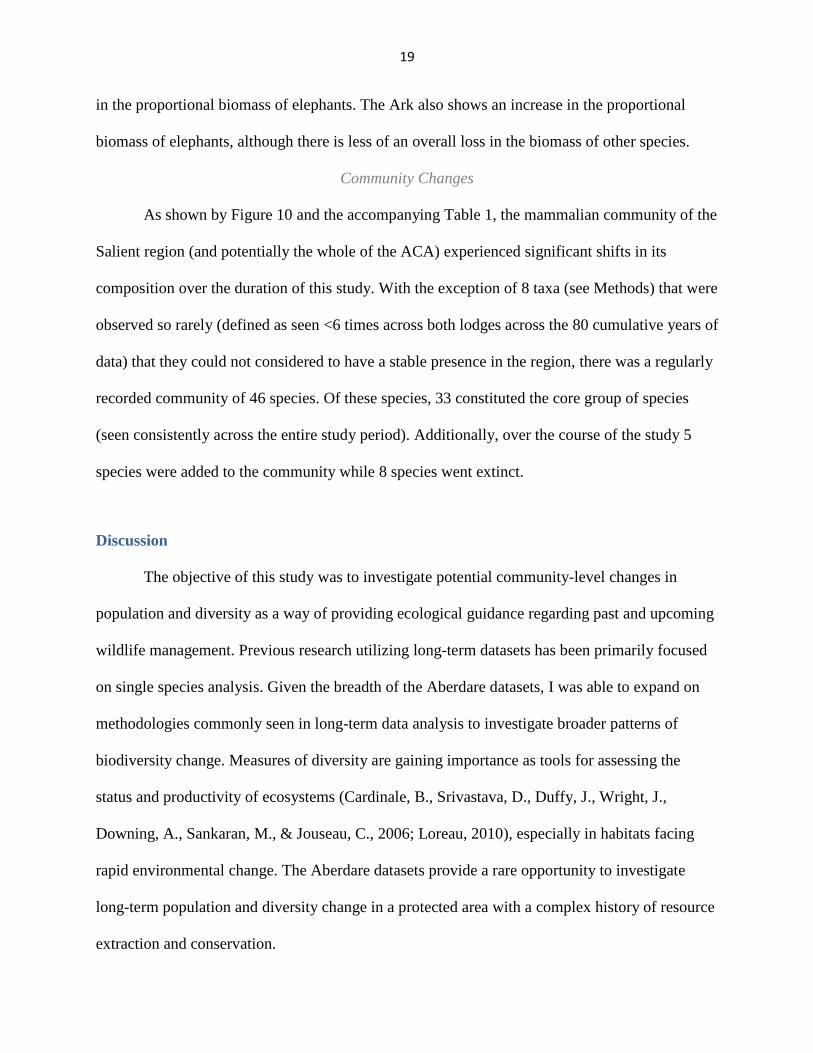
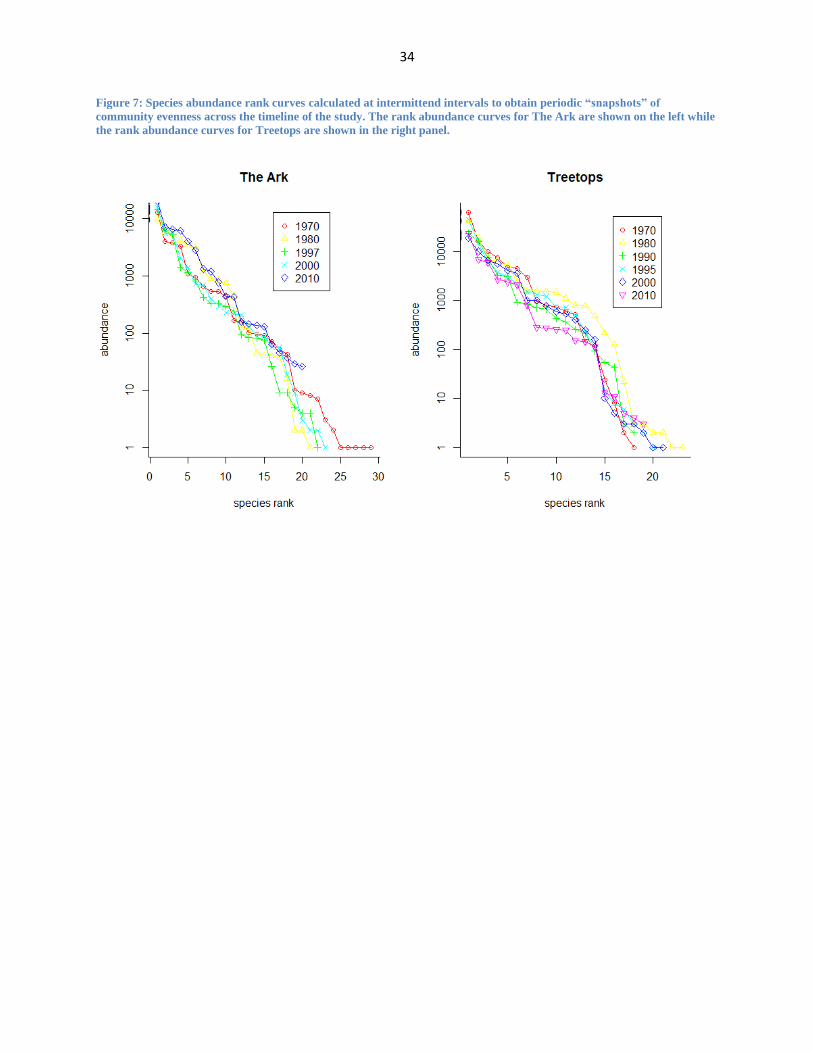
across the communities. I also prepared annual “snapshots” of rank-abundance to investigate
change in the evenness of species across our timeline (Figure 7). These curves show relatively
consistent evenness in the species communities at both study sites across time with the most
significant species loss occurring at The Ark after 1970.
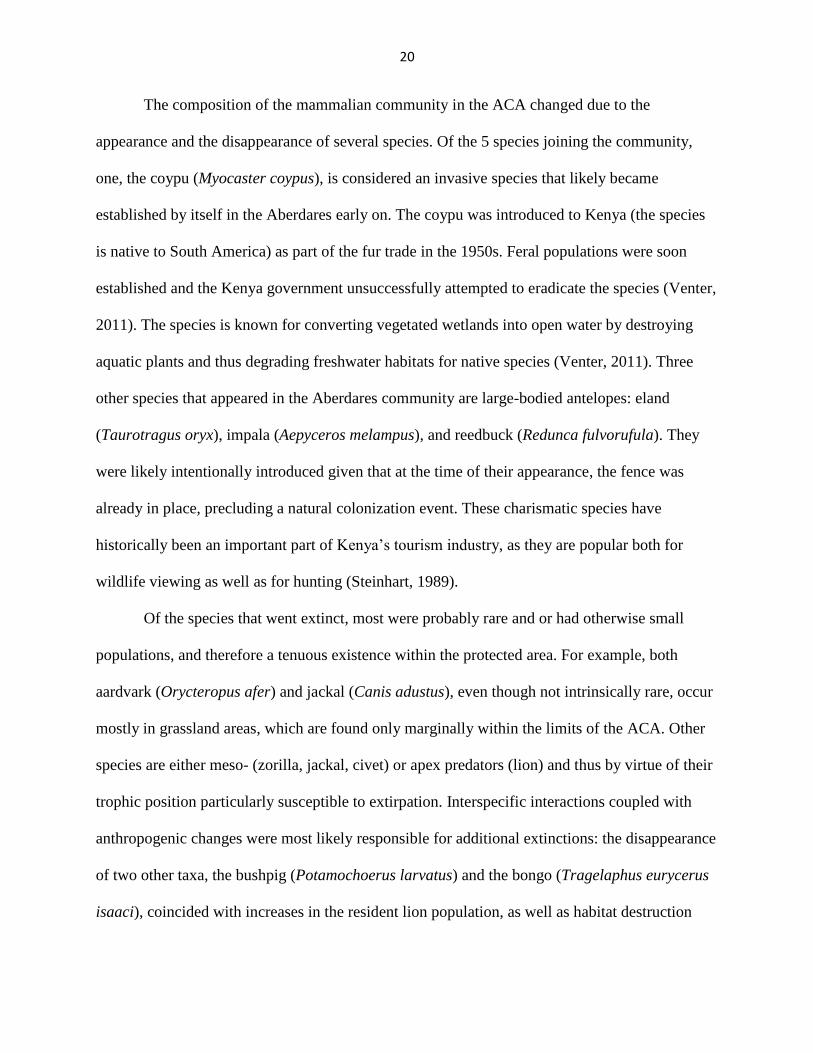
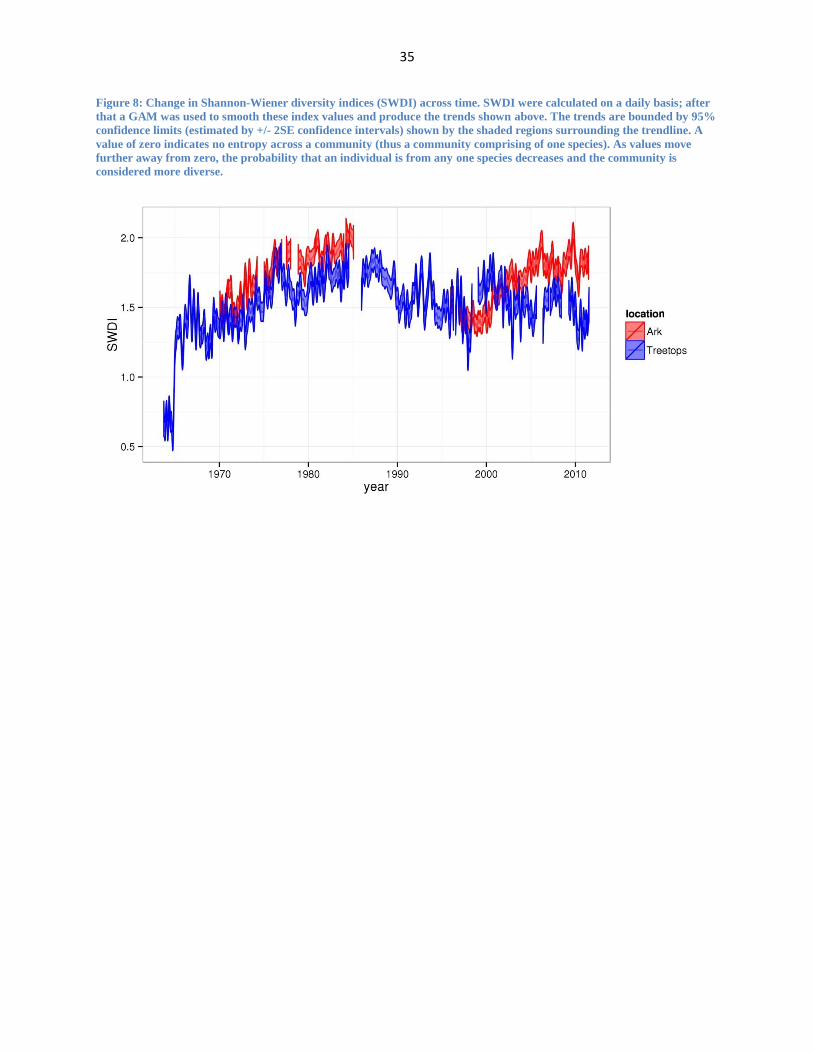
The results of our Shannon-Wiener diversity analysis show evidence of a loss of diversity
at Treetops occurring in the second half of the dataset. Using the raw data to calculate annual
Shannon-Wiener diversity indices (SWDI), I find that the largest difference in diversity values
between the two sites occur in back-to-back years: 2010 ( = 2.85 and
= 2.35) and 2011
( = 3.00 and
= 2.44). Figure 8 shows the smoothed SWDI trends for each site; for the
period 2001-2011, there is evidence of decreasing diversity at Treetops while diversity is
increasing at The Ark. It is also important to note that the diversity index values at Treetops are
considered biologically low. Most biological datasets show diversity values that range between
1.5-3.5 (Magurran, 2004) and values and the smoothed data shows diversity values at Treetops
hovering around 1.5 with values dipping below 1.5 in the last five years of the dataset.
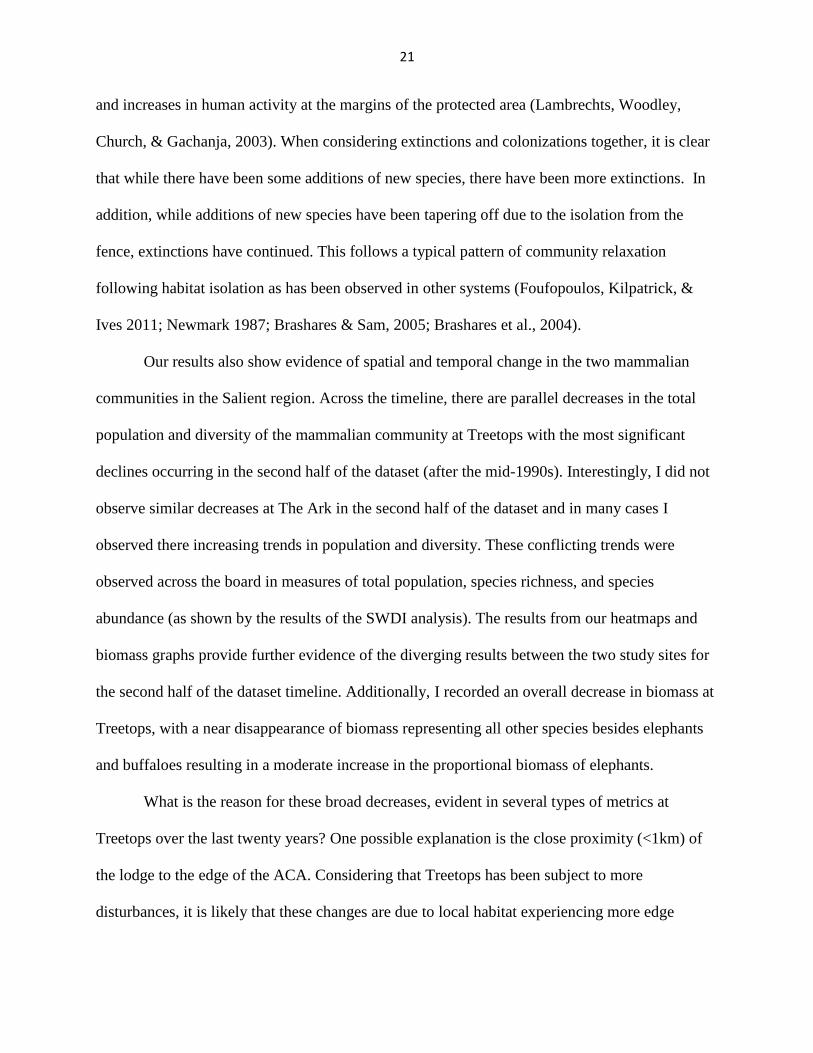
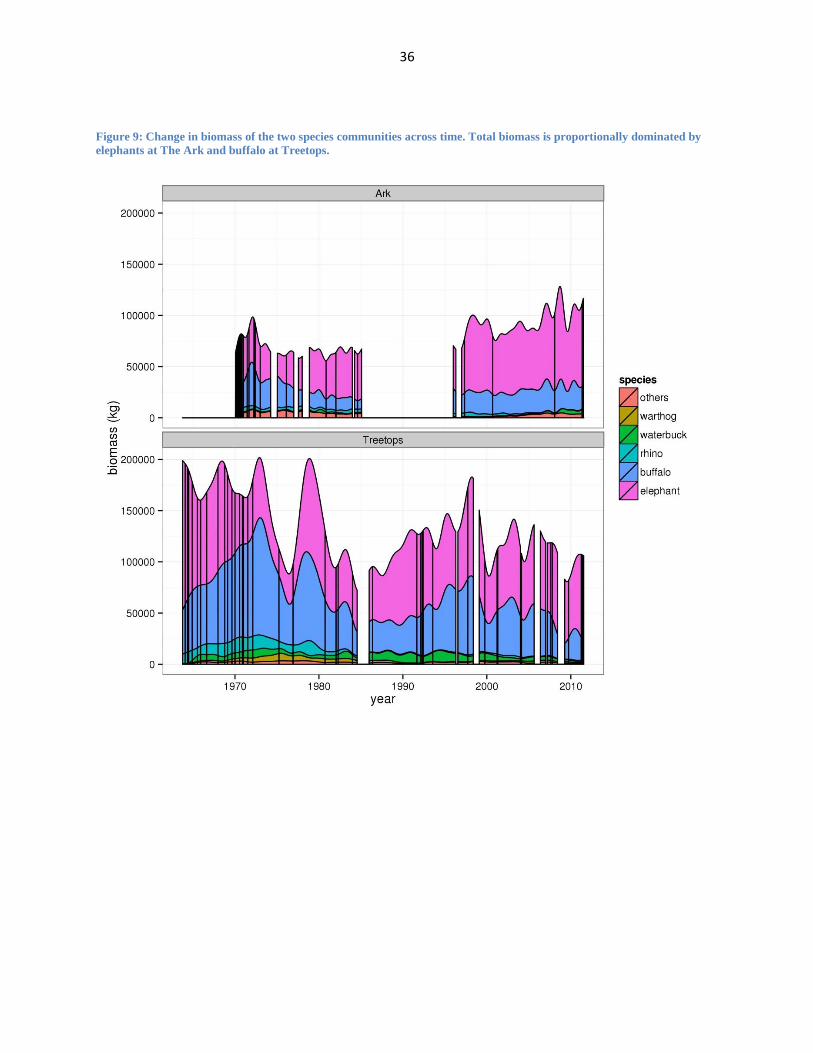
Biomass graphs (Figure 9), which display changes of aggregate biomass in each
community, also reveal interesting patterns of change particularly at Treetops. Across the
timeline at Treetops, there is a steady decrease in total biomass and a near disappearance of the
biomass of most species excluding elephants and buffaloes. At the same time there is an increase
19
in the proportional biomass of elephants. The Ark also shows an increase in the proportional
biomass of elephants, although there is less of an overall loss in the biomass of other species.
Community Changes
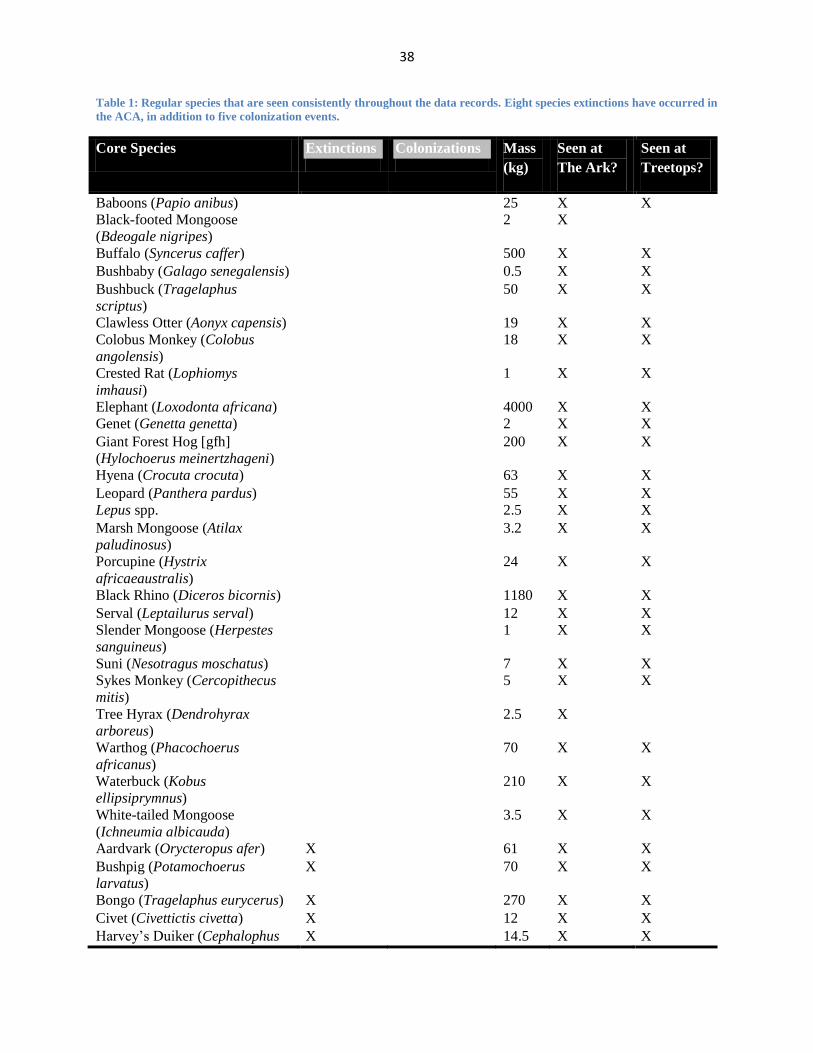
As shown by Figure 10 and the accompanying Table 1, the mammalian community of the
Salient region (and potentially the whole of the ACA) experienced significant shifts in its
composition over the duration of this study. With the exception of 8 taxa (see Methods) that were
observed so rarely (defined as seen <6 times across both lodges across the 80 cumulative years of
data) that they could not considered to have a stable presence in the region, there was a regularly
recorded community of 46 species. Of these species, 33 constituted the core group of species
(seen consistently across the entire study period). Additionally, over the course of the study 5
species were added to the community while 8 species went extinct.
Discussion
The objective of this study was to investigate potential community-level changes in
population and diversity as a way of providing ecological guidance regarding past and upcoming
wildlife management. Previous research utilizing long-term datasets has been primarily focused
on single species analysis. Given the breadth of the Aberdare datasets, I was able to expand on
methodologies commonly seen in long-term data analysis to investigate broader patterns of
biodiversity change. Measures of diversity are gaining importance as tools for assessing the
status and productivity of ecosystems (Cardinale, B., Srivastava, D., Duffy, J., Wright, J.,
Downing, A., Sankaran, M., & Jouseau, C., 2006; Loreau, 2010), especially in habitats facing
rapid environmental change. The Aberdare datasets provide a rare opportunity to investigate
long-term population and diversity change in a protected area with a complex history of resource
extraction and conservation.
20
The composition of the mammalian community in the ACA changed due to the
appearance and the disappearance of several species. Of the 5 species joining the community,
one, the coypu (Myocaster coypus), is considered an invasive species that likely became
established by itself in the Aberdares early on. The coypu was introduced to Kenya (the species
is native to South America) as part of the fur trade in the 1950s. Feral populations were soon
established and the Kenya government unsuccessfully attempted to eradicate the species (Venter,
2011). The species is known for converting vegetated wetlands into open water by destroying
aquatic plants and thus degrading freshwater habitats for native species (Venter, 2011). Three
other species that appeared in the Aberdares community are large-bodied antelopes: eland
(Taurotragus oryx), impala (Aepyceros melampus), and reedbuck (Redunca fulvorufula). They
were likely intentionally introduced given that at the time of their appearance, the fence was
already in place, precluding a natural colonization event. These charismatic species have
historically been an important part of Kenya’s tourism industry, as they are popular both for
wildlife viewing as well as for hunting (Steinhart, 1989).
Of the species that went extinct, most were probably rare and or had otherwise small
populations, and therefore a tenuous existence within the protected area. For example, both
aardvark (Orycteropus afer) and jackal (Canis adustus), even though not intrinsically rare, occur
mostly in grassland areas, which are found only marginally within the limits of the ACA. Other
species are either meso- (zorilla, jackal, civet) or apex predators (lion) and thus by virtue of their
trophic position particularly susceptible to extirpation. Interspecific interactions coupled with
anthropogenic changes were most likely responsible for additional extinctions: the disappearance
of two other taxa, the bushpig (Potamochoerus larvatus) and the bongo (Tragelaphus eurycerus
isaaci), coincided with increases in the resident lion population, as well as habitat destruction
21
and increases in human activity at the margins of the protected area (Lambrechts, Woodley,
Church, & Gachanja, 2003). When considering extinctions and colonizations together, it is clear
that while there have been some additions of new species, there have been more extinctions. In
addition, while additions of new species have been tapering off due to the isolation from the
fence, extinctions have continued. This follows a typical pattern of community relaxation
following habitat isolation as has been observed in other systems (Foufopoulos, Kilpatrick, &
Ives 2011; Newmark 1987; Brashares & Sam, 2005; Brashares et al., 2004).
Our results also show evidence of spatial and temporal change in the two mammalian
communities in the Salient region. Across the timeline, there are parallel decreases in the total
population and diversity of the mammalian community at Treetops with the most significant
declines occurring in the second half of the dataset (after the mid-1990s). Interestingly, I did not
observe similar decreases at The Ark in the second half of the dataset and in many cases I
observed there increasing trends in population and diversity. These conflicting trends were
observed across the board in measures of total population, species richness, and species
abundance (as shown by the results of the SWDI analysis). The results from our heatmaps and
biomass graphs provide further evidence of the diverging results between the two study sites for
the second half of the dataset timeline. Additionally, I recorded an overall decrease in biomass at
Treetops, with a near disappearance of biomass representing all other species besides elephants
and buffaloes resulting in a moderate increase in the proportional biomass of elephants.
What is the reason for these broad decreases, evident in several types of metrics at
Treetops over the last twenty years? One possible explanation is the close proximity (<1km) of
the lodge to the edge of the ACA. Considering that Treetops has been subject to more
disturbances, it is likely that these changes are due to local habitat experiencing more edge

22
effects. A recent aerial report by Lambrechts, Woodley, Church, & Gachanja details the causes
and extent of anthropogenic destruction mostly at the edges of the ACA. At the time of the
report, habitat destruction due to illegal activities, particularly charcoal production and illegal
logging, was continuing unabated. With increasing human population and intensifying land use
at the edges of the park, there is more incentive to exploit the relatively untouched forests and
vegetation inside the park (Lambrechts, Woodley, Church, & Gachanja, 2003). Additionally,
poaching, particularly for rhino horns, remains a constant threat. Consequently, we might be
seeing the increases in population and diversity at The Ark because it is acting as a “biodiversity
beneficiary” as individuals move away from the edge (Treetops).
Beyond vegetation destruction due to human activities, there is some evidence to suggest
that changes in elephant populations may play a role in transforming the vegetation in
environments similar to the ACA. Large herbivores such as the elephant have the potential to
transform the vegetation of an ecosystem and the Aberdare forests are a prime example of a high
density population of elephants that have transformed much of the climax forests into secondary
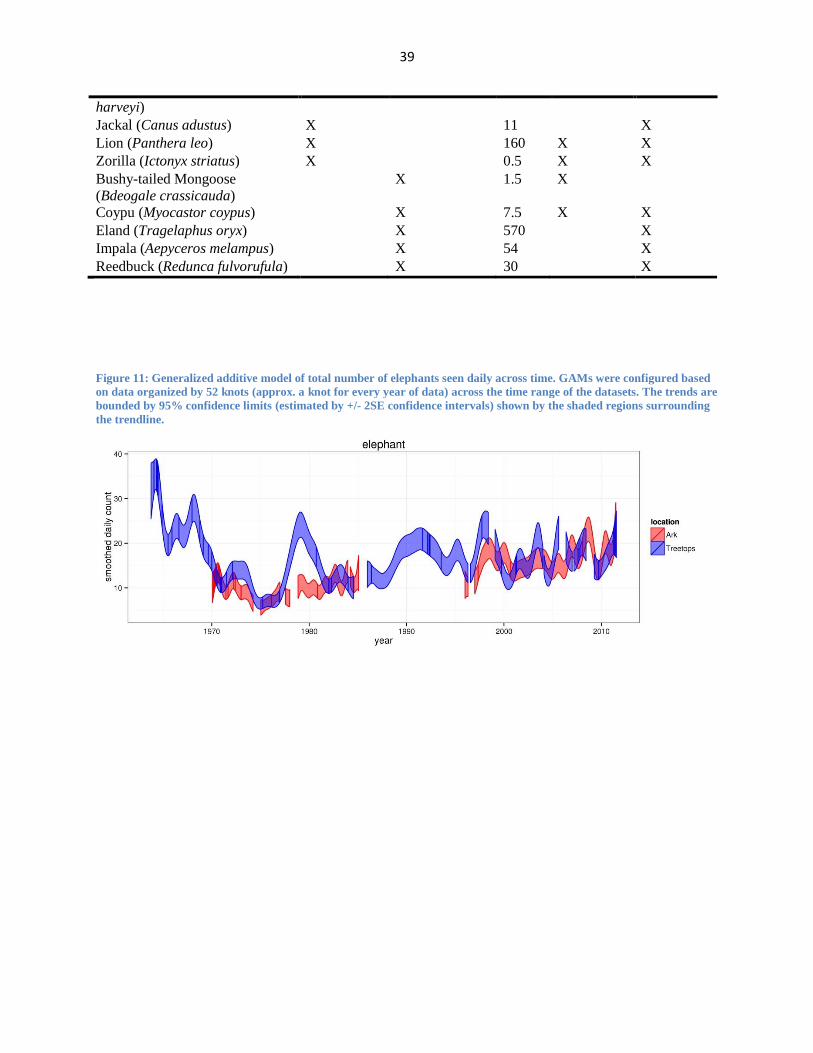
forests (Laws, 1970) (see Figure 11). Laws’s seminal paper on elephant behavior in increasingly
human-mediated environments showed the potential destruction resulting from elephant feeding
behavior as shrinking habitat space results in increased mean group size. The unspecialized
nature of the bush elephant can have devastating effects on the habitat for specialized species; as
there are less ideal habitats to support such large mammals as the elephant, the largely forested
habitats can become transformed and thus have ripple effects on other forest-dependent taxa
(Laws, 1970).
Many of the changes evident in the data series are the result of individual species
management plans. Some of these efforts have been concentrated on the protection of the
23
critically endangered mountain bongo, the flagship species of the Aberdare range and a
bioindicator of healthy mountain forests (Mwangi, 2010). The Rare Species Conservatory
Foundation introduced 18 mountain bongos from captive facilities in the U.S. to the Mt. Kenya
forest ranges as a way to revitalize the critically endangered wild populations (Rare Species
Conservatory Foundation, 2002). In addition, lions were eradicated from the Aberdares in the
late 1990’s and early 2000’s in an effort to protect bongos from predation, as bongo populations
plunged when lion populations increased earlier (Charles Mathenge, pers. comm.). This course
of action was not publicized but was common knowledge among managers and hunters at the
two wildlife lodges and is reflected in the sighting datasets (see Appendix). Even with these
measures, bongos have not reappeared in our sighting datasets since the mid 1980s and it is not
clear whether the species still exists as a viable population in the ACA.
Aside from the struggle to revitalize and protect future bongo populations, the actions
taken to reduce predation on these valuable species may have unforeseen effects on the species
communities. Along with hyenas, lions were considered a primary predator of the Aberdare
range (Sillero-Zubiri & Gottelli, 1987) and the loss of a keystone predator can have ripple effects
across an entire ecosystem. It can cause trophic cascades and result in surges in the populations
of grazing species which in turn can alter the vegetative landscape, as shown by the classic wolf-
elk-aspen studies in Yellowstone National Park (see Fortin, D., Beyer, H., Boyce, M., Smith, D.,
Duchesne, T., & Mao, J, 2005 or Ripple, Larsen, Renkin, & Smith, 2001). The loss of lions from
the Aberdare range coupled with the isolation of wildlife due to the fence may have drastic
effects on the populations and behavior of other species in the short- and long-term, particularly
with concerns related to the density of grazing and browsing species that already make up the
highest proportion of the mammalian biomass in this ecosystem (Figure 9).
24
While further investigations are clearly needed, our results implicate the existence of
edge effects in the differences between Treetops and The Ark across the study period. There is
evidence of population decline and community turnover, particularly at the edges of the
protected area (Treetops) as well as evidence of extinction and colonization events. Continued
wildlife monitoring and population analyses can aid in providing evidence and justification for
ongoing management. And as previously stated, the fence has major, positive implications for
more than just wildlife.
Conservation Implications
Fencing: a solution for wildlife conservation?
There is broad consensus that the remaining forested areas of the Eastern Arc and Coastal
Forests of Tanzania and Kenya, including the Aberdare Range ecosystem, are critically
endangered and constitute a global conservation priority (Myers, Mittermeier, Fonseca, & Kent,
2000). Most of these areas are now protected, and while this protection is a great achievement for
conservation, it is unclear how to best manage these ecosystems for long-term habitat and
wildlife conservation. In particular, fencing protected lands is becoming one of the most popular
methods for long-term management of human-wildlife conflict and habitat protection especially
in Africa. In a meta-analysis looking at the fate of lion populations in fenced and unfenced lands,
authors concluded that fencing was critical to help conserve lion populations and that half the
lion populations in unfenced lands face extinction in the next 20-40 years (Parker et al., 2013).
Similarly, experts concluded the most effective way to protect the Aberdare ecosystem and its
wildlife was a physical barrier isolating the wildlife and forests from the dangers of the
surrounding habitat matrix (Butynski, 1999; FAO, 1998).
25
Perhaps the simplest way to evaluate the role of the Aberdare fence in protecting wildlife
is to briefly discuss the case of the black rhino. Protecting black rhinos and rebuilding their
population in the Aberdares was arguably the most important mission of the fence. Rhinos have
long been the focus of conservation efforts to protect wildlife from poaching. Their well-
documented population crash in the 1970’s (visible in the black rhino population graph in the
Appendix) is largely attributed to poaching and there is now a concern that the remaining
populations are not genetically viable (Sillero-Zubiri & Gottelli, 1991). In the twenty years since
the first phase of the fence was completed around the Salient, the black rhino population has not
rebounded but has remained low and stable with animals in the single digits recorded at both
sites (see Appendix for the black rhino population graph). While the lack of population increases
for black rhinos seems dispiriting, it points to the importance of continued conservation efforts
beyond the construction of the fence. The fence is a major step in protecting wildlife and
reducing human-wildlife conflict, but the complex constellation of issues surrounding the
conservation of this ecosystem is not solved by the construction of a fence alone.
Considering issues such as poaching and illegal forest exploitation that have consistently
plagued this environment (see Figure 2), there is clear that there is a need for better enforcement
and management beyond the fence. It is clear from our results that the establishment of the fence
in the early 1990s halted the previous declines in wildlife numbers and even led to a temporary
increase in wildlife populations. However starting in the late 1990s, wildlife declines have
resumed and wildlife population numbers, species richness, and other metrics of diversity at
Treetops (but not at The Ark) are at their lowest value since measurements started. These data
suggest that wildlife poaching and/or vegetation degradation continue along the edge of the
26
Salient. Unless these issues are managed, wildlife numbers at Treetops will continue to decline to
the point where the lodge will lose its attractiveness to tourists and its ability to generate revenue.
While the fence has been critical in protecting wildlife populations along the edge, by
itself it is currently an insufficient conservation tool and stricter management is needed to
prevent further declines. Such management needs include not only stricter enforcement but also
more outreach and education for communities living outside the ACA. In addition, by providing
shared revenue of tourism dollars to the communities residing at the margins of the ACA, it
could be possible create financial incentives to protect the habitats at the edges of the protected
area.
While many of the habitat management initiatives have been molded around goals to
protect rare and valued wildlife, this ecosystem provides vital ecosystems services that benefit
from ambitious habitat protection. The scope of this paper made it inappropriate to give a
detailed discussion of the value of the forest and water resources of the Aberdare mountain
range, however, given our conclusions about the potential impacts of the electric fence, it is
important to reiterate that the value of the fence extends beyond just wildlife conservation. In
line with its objectives, the fence has helped protect indigenous vegetation through reduced
forest exploitation (including logging, charcoal kilns, livestock grazing, etc.) (Lambrechts,
Woodley, Church, & Gachanja, 2003), as well as vegetation recovery at the edges of the
protected area, as shown by secondary vegetation growth at Treetops (Rhino Ark, 2011).
The Aberdares has a history of aggressive wildlife conservation and protection efforts
and the fence is perhaps the greatest example of these efforts. Combined with further scientific
assessment and continued wildlife management, the analyses carried out on the Aberdares
datasets can be used as a model for other protected areas. It is also an example of the importance

27
of taking a broad approach to managing a conservation area. The fence, while immensely
important for the protection of the area, is not sufficient to protect the ACA. It should not be
considered the final solution but rather part of a broader approach that needs to include increased
enforcement, expanded community outreach, and continued monitoring.
28
Figures
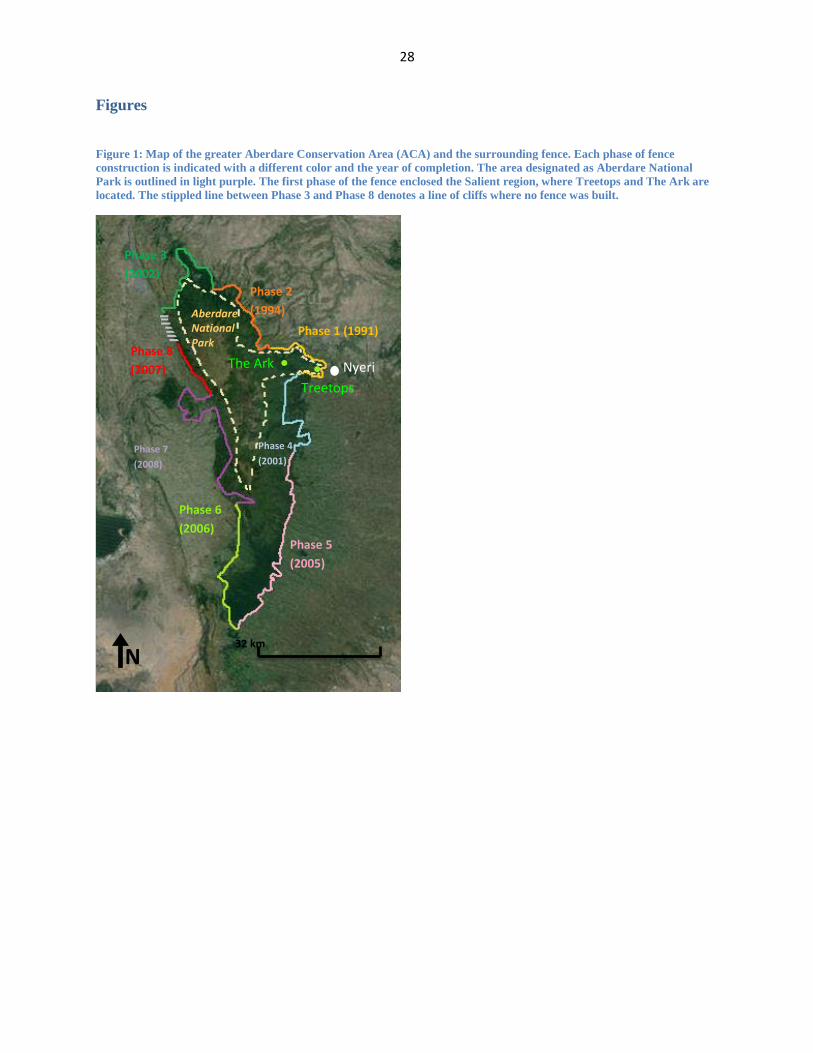
Figure 1: Map of the greater Aberdare Conservation Area (ACA) and the surrounding fence. Each phase of fence
construction is indicated with a different color and the year of completion. The area designated as Aberdare National
Park is outlined in light purple. The first phase of the fence enclosed the Salient region, where Treetops and The Ark are
located. The stippled line between Phase 3 and Phase 8 denotes a line of cliffs where no fence was built.
Aberdare National Park
The Ark
Treetops
Phase 1 (1991)
Phase 4
(2001)
Phase 5
(2005)
Phase 6
(2006)
Phase 7
(2008)
Phase 8
(2007)
Phase 3
(2002)
Phase 2
(1994)
Nyeri
32 km
N

29
Figure 2: Aerial image of the edge of the ACA (here the far east end of the Salient). The electric fence in the middle
separates the protected area (L) from the agricultural matrix (R). Note the absence of mature trees within the protected
area caused by illegal logging near the border of the ACA. Treetops lodge is located at a comparable distance from the
edge of the park less than 3km to the North of this image (Left).
30
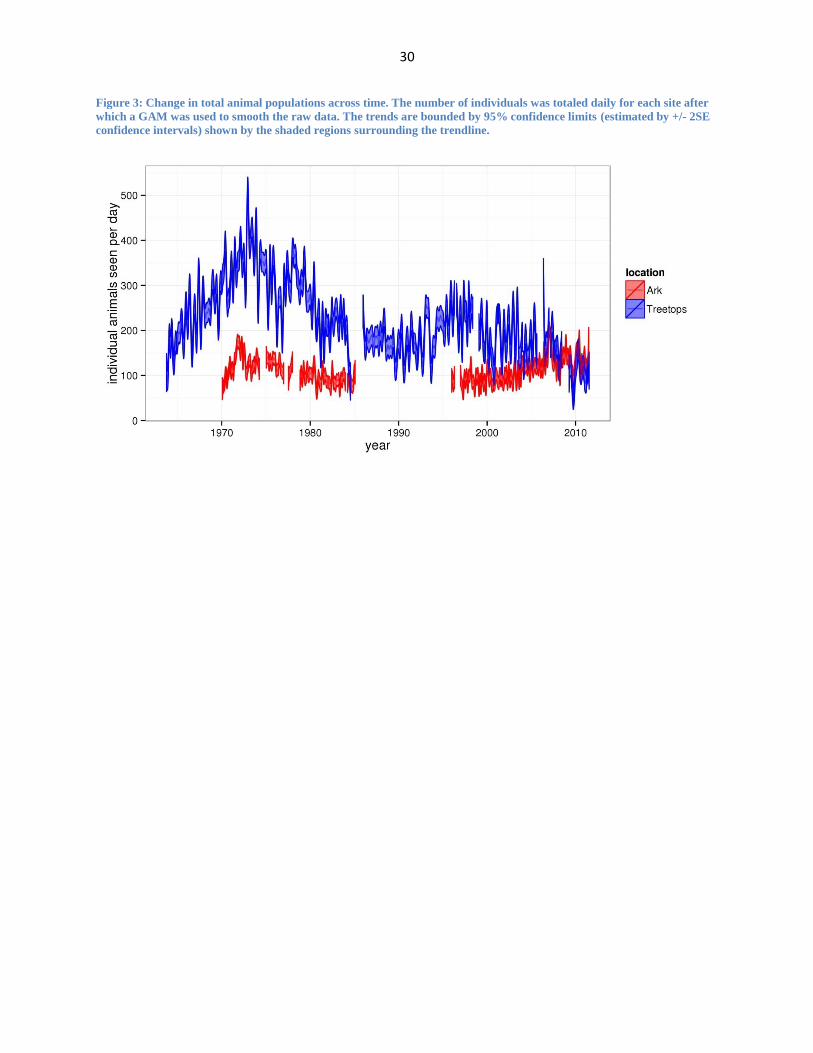
Figure 3: Change in total animal populations across time. The number of individuals was totaled daily for each site after
which a GAM was used to smooth the raw data. The trends are bounded by 95% confidence limits (estimated by +/- 2SE
confidence intervals) shown by the shaded regions surrounding the trendline.
31
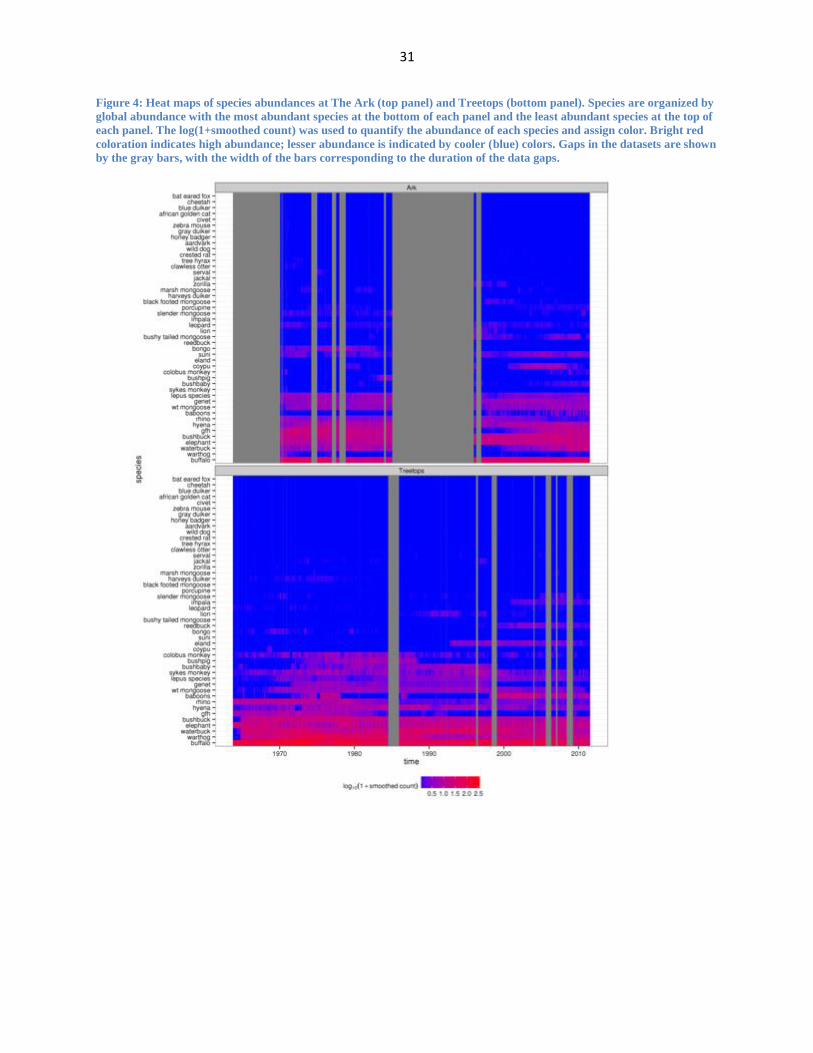
Figure 4: Heat maps of species abundances at The Ark (top panel) and Treetops (bottom panel). Species are organized by
global abundance with the most abundant species at the bottom of each panel and the least abundant species at the top of
each panel. The log(1+smoothed count) was used to quantify the abundance of each species and assign color. Bright red
coloration indicates high abundance; lesser abundance is indicated by cooler (blue) colors. Gaps in the datasets are shown
by the gray bars, with the width of the bars corresponding to the duration of the data gaps.
32
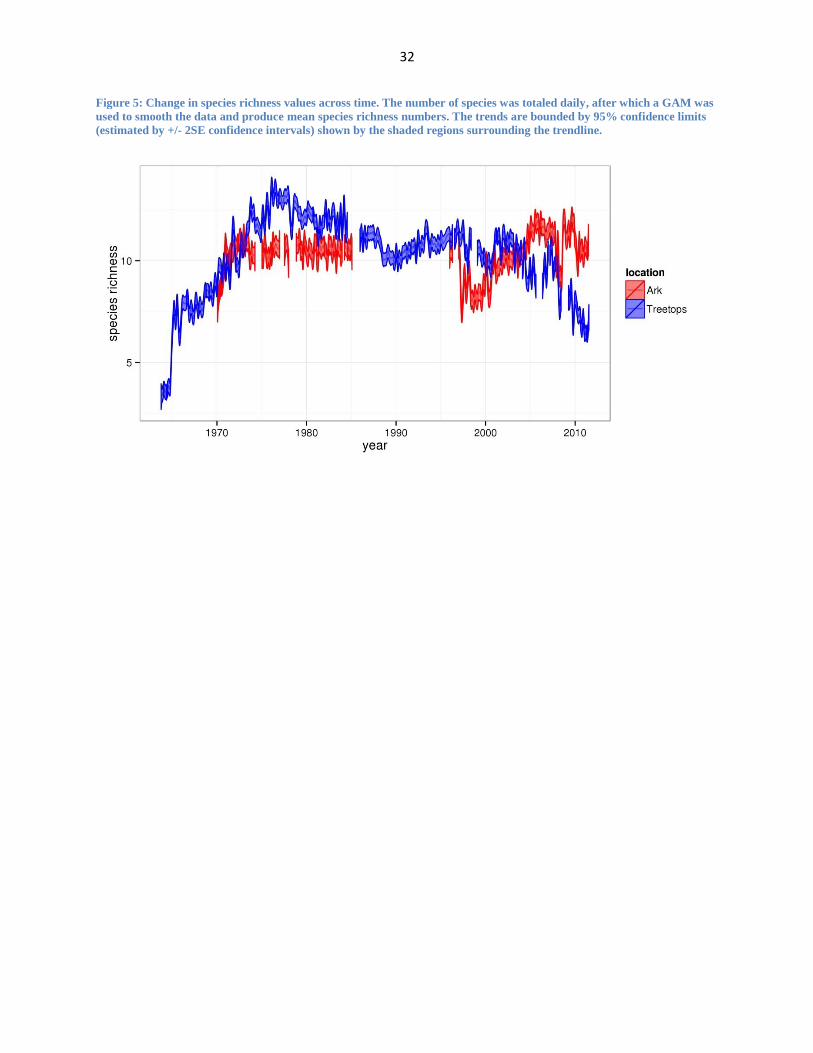
Figure 5: Change in species richness values across time. The number of species was totaled daily, after which a GAM was
used to smooth the data and produce mean species richness numbers. The trends are bounded by 95% confidence limits
(estimated by +/- 2SE confidence intervals) shown by the shaded regions surrounding the trendline.

33
Figure 6: Species abundance curves for the mammalian communities at The Ark (red line) and Treetops (blue line) for
the total individuals seen across the entire study period. Each point (indicated by circles for The Ark and triangles for
Treetops) represents a species. Species richness is the same for both sites (S = 40). Both curves show similar steepness
suggesting that the two sites have similar equitability of individuals among species.
34
Figure 7: Species abundance rank curves calculated at intermittend intervals to obtain periodic “snapshots” of
community evenness across the timeline of the study. The rank abundance curves for The Ark are shown on the left while
the rank abundance curves for Treetops are shown in the right panel.
35
Figure 8: Change in Shannon-Wiener diversity indices (SWDI) across time. SWDI were calculated on a daily basis; after
that a GAM was used to smooth these index values and produce the trends shown above. The trends are bounded by 95%
confidence limits (estimated by +/- 2SE confidence intervals) shown by the shaded regions surrounding the trendline. A
value of zero indicates no entropy across a community (thus a community comprising of one species). As values move
further away from zero, the probability that an individual is from any one species decreases and the community is
considered more diverse.
36
Figure 9: Change in biomass of the two species communities across time. Total biomass is proportionally dominated by
elephants at The Ark and buffalo at Treetops.

37
Figure 10: Summary of changes in community composition at the ACA across the study period. Core species are defined
as a taxa whose presence is based upon reliable data and which have been recorded consistently over the duration of this
study. Species have been classified as extinct if they were once consistently recorded and are now no longer observed in
the data record. The timing of the extinction event is set arbitrarily as one year after last definitive record of a species. A
colonization is defined as a species that started being recorded at some point after the beginning of this study. Excluded
from this graph are 8 transient species that do not have a permanent presence in this ecosystem. See also Table 1 in the
Appendix for the complete species list.
Lion
Coypu
Eland
Reedbuck
Impala
Bushpig
Bongo
Bushy-tailed mongoose
Aardvark
Civet
Harvey’s duiker
Jackal
Zorilla
38
Table 1: Regular species that are seen consistently throughout the data records. Eight species extinctions have occurred in
the ACA, in addition to five colonization events.
Core Species Extinctions Colonizations Mass
(kg)
Seen at
The Ark?
Seen at
Treetops?
Baboons (Papio anibus) 25 X X
Black-footed Mongoose
(Bdeogale nigripes)
2 X
Buffalo (Syncerus caffer) 500 X X
Bushbaby (Galago senegalensis) 0.5 X X
Bushbuck (Tragelaphus
scriptus)
50 X X
Clawless Otter (Aonyx capensis) 19 X X
Colobus Monkey (Colobus
angolensis)
18 X X
Crested Rat (Lophiomys
imhausi)
1 X X
Elephant (Loxodonta africana) 4000 X X
Genet (Genetta genetta) 2 X X
Giant Forest Hog [gfh]
(Hylochoerus meinertzhageni)
200 X X
Hyena (Crocuta crocuta) 63 X X
Leopard (Panthera pardus) 55 X X
Lepus spp. 2.5 X X
Marsh Mongoose (Atilax
paludinosus)
3.2 X X
Porcupine (Hystrix
africaeaustralis)
24 X X
Black Rhino (Diceros bicornis) 1180 X X
Serval (Leptailurus serval) 12 X X
Slender Mongoose (Herpestes
sanguineus)
1 X X
Suni (Nesotragus moschatus) 7 X X
Sykes Monkey (Cercopithecus
mitis)
5 X X
Tree Hyrax (Dendrohyrax
arboreus)
2.5 X
Warthog (Phacochoerus
africanus)
70 X X
Waterbuck (Kobus
ellipsiprymnus)
210 X X
White-tailed Mongoose
(Ichneumia albicauda)
3.5 X X
Aardvark (Orycteropus afer) X 61 X X
Bushpig (Potamochoerus
larvatus)
X 70 X X
Bongo (Tragelaphus eurycerus) X 270 X X
Civet (Civettictis civetta) X 12 X X
Harvey’s Duiker (Cephalophus X 14.5 X X
39
harveyi)
Jackal (Canus adustus) X 11 X
Lion (Panthera leo) X 160 X X
Zorilla (Ictonyx striatus) X 0.5 X X
Bushy-tailed Mongoose
(Bdeogale crassicauda)
X 1.5 X
Coypu (Myocastor coypus) X 7.5 X X
Eland (Tragelaphus oryx) X 570 X
Impala (Aepyceros melampus) X 54 X
Reedbuck (Redunca fulvorufula) X 30 X
Figure 11: Generalized additive model of total number of elephants seen daily across time. GAMs were configured based
on data organized by 52 knots (approx. a knot for every year of data) across the time range of the datasets. The trends are
bounded by 95% confidence limits (estimated by +/- 2SE confidence intervals) shown by the shaded regions surrounding
the trendline.

40
APPENDIX
Figures
Figure 1: Example of a typical daily entry of wildlife sightings at Treetops (L.) and The Ark (R.) wildlife lodges. Each set
of logbooks is organized in the same fashion: a species name is listed in the left most column followed by counts that are
totaled at the end of the night in the right most column. Each daily entry is signed by the hunter on duty.
41
Table 1: Climate data (1999-2011) for The Ark study site. Monthly averages are shown for precipitation, AM
temperature, and PM temperature. (Continued)
Year Month Average monthly
precipitation (mm)
Average monthly AM
temperature (°C)
Average monthly PM
temperature (°C)
1999 January 50.6
February 18.2
March 79.9
April 50.2
May 78.7
June 8.0
July 18.6
August 56.5
September 48.5
October 22.9
November 84.4 13.857 17.714
December 24.7 13.571 18.42857143
2000 January 5.2 13.500 21.000
February 50.3
March 143.1 14.500 22.667
April 78.0 15.000 21.500
May 56.0 14.231 20.615
June 13.6 13.556 20.111
July 9.6 13.280 20.120
August 26.1 13.032 19.194
September 8.5 11.931 18.931
October 44.4 11.000 19.567
November 89.0 14.536 19.862
December 99.4 14.517 20.355
2001 January 102.2 13.935 20.387
February 47.4 13.643 21.964
March 44.5 14.172 20.548
April 193.6 14.107 18.933
May 26.2 12.967 18.233
June 15.2 11.300 16.900
July 42.6 11.581 15.258
August 19.7 12.161 16.323
September 37.3 14.167 18.733
October 44.2 14.310 19.300
November 136.6 14.964 17.733
December 120.2 17.724 20.516
42
2002 January 42.6 17.767 21.516
February 24.5 17.963 22.607
March 79.5 17.806 21.226
April 191.3 16.067 19.367
May 75.1 14.586 18.167
June 27.1 12.448 16.567
July 25.4 12.276 16.200
August 11.6 11.367 14.677
September 38.5 13.071 17.633
October 79.5 14.345 18.516
November 205.3 16.067 18.933
December 156.1 17.774 20.451
2003 January 43.8 21.548 21.968
February 22.7 18.185 23.571
March 84.4 16.968 22.258
April 175.2 16.000 20.000
May 171.7 14.903 18.258
June 14.2 13.167 16.633
July 7.1 11.967 15.613
August 90.1 12.484 14.871
September 10.6 12.929 17.300
October 174.5 14.250 18.323
November 105.8 14.367 18.467
December 27.9 14.645 19.839
2004 January 43.5 15.613 20.194
February 56.9 16.481 20.241
March 52.5 15.267 20.613
April 248.8 15.000 18.700
May 54.4 14.700 18.645
June 8.0 12.033 16.067
July 55.7 10.964 16.226
August 23.4 11.871 15.419
September 44.0 13.621 18.867
October 54.1 14.310 17.567
November 171.5 13.276 18.000
December 134.4 15.065 19.774
2005 January 19.7 15.600 20.742
February 48.1 16.074 21.857
March 111.4 16.533 21.065
April 94.0 15.321 19.667
May 202.8 14.767 18.130
June 19.7 13.607 16.167
July 59.8 11.800 14.323
43
August 29.5 12.516 15.129
September 58.8 12.138 15.767
October 44.7 12.846 17.871
November 111.5 13.483 18.300
December 4.2 14.774 19.871
2006 January 49.2 14.600 20.290
February 29.2 15.577 21.464
March 137.9 15.935 20.387
April 220.8 15.167 18.900
May 114.8 14.950 17.839
June 34.7 13.000 17.172
July 70.5 10.419 14.258
August 46.9 11.548 15.452
September 54.6 12.667 16.893
October 105.3 13.828 18.071
November 488.5 14.828 18.069
December 225.1 14.733 19.484
2007 January 75.2 15.387 20.655
February 98.2 16.143 20.852
March 43.4 15.679 20.462
April 117.1 15.379 18.950
May 130.7 14.000 17.452
June 45.2 12.571 16.267
July 81.9 11.733 14.821
August 77.5 12.516 14.500
September 74.9 12.310 17.500
October 99.1 13.871 18.645
November 200.7 14.483 20.059
December 33.6 15.233 20.448
2008 January 52.8 14.367 20.520
February 54.3 15.034 20.345
March 126.6 15.129 20.000
April 109.2 14.185 19.433
May 97.1 13.452 18.871
June 11.9 12.000 15.769
July 59.8 10.905 14.053
August 29.9 11.419 15.774
September 61.4 13.448 19.267
October 127.8 14.065 18.581
November 148.2 14.600 19.767
December 38.1 15.333 21.200
2009 January 107.3 15.097 21.355
February 54.6 15.107 21.643

44
March 41.0 15.500 21.806
April 42.8 15.133 20.433
May 78.7 14.931 19.742
June 22.4 13.310 18.655
July 14.3 11.226 17.129
August 13.5 11.667 16.387
September 16.9 13.333 18.933
October 208.9 13.933 18.065
November 114.3 14.667 19.667
December 144.2 15.677 19.452
2010 January 86.0 15.290 20.968
February 160.6 16.250 21.429
March 193.4 15.645 20.355
April 199.0 15.233 19.633
May 240.9 14.548 18.742
June 34.7 13.897 16.333
July 42.2 11.935 14.774
August 50.8 11.806 15.000
September 53.1 12.867 17.267
October 135.6 14.613 18.742
November 191.6 14.733 18.267
December 24.6 14.871 19.733
2011 January 45.9 15.125 20.875
February 41.7 15.148 21.893
March 106.5 15.742 21.258
April 58.4 15.467 20.000
May 112.6 14.367 17.800
June 74.4 13.750 17.857
45
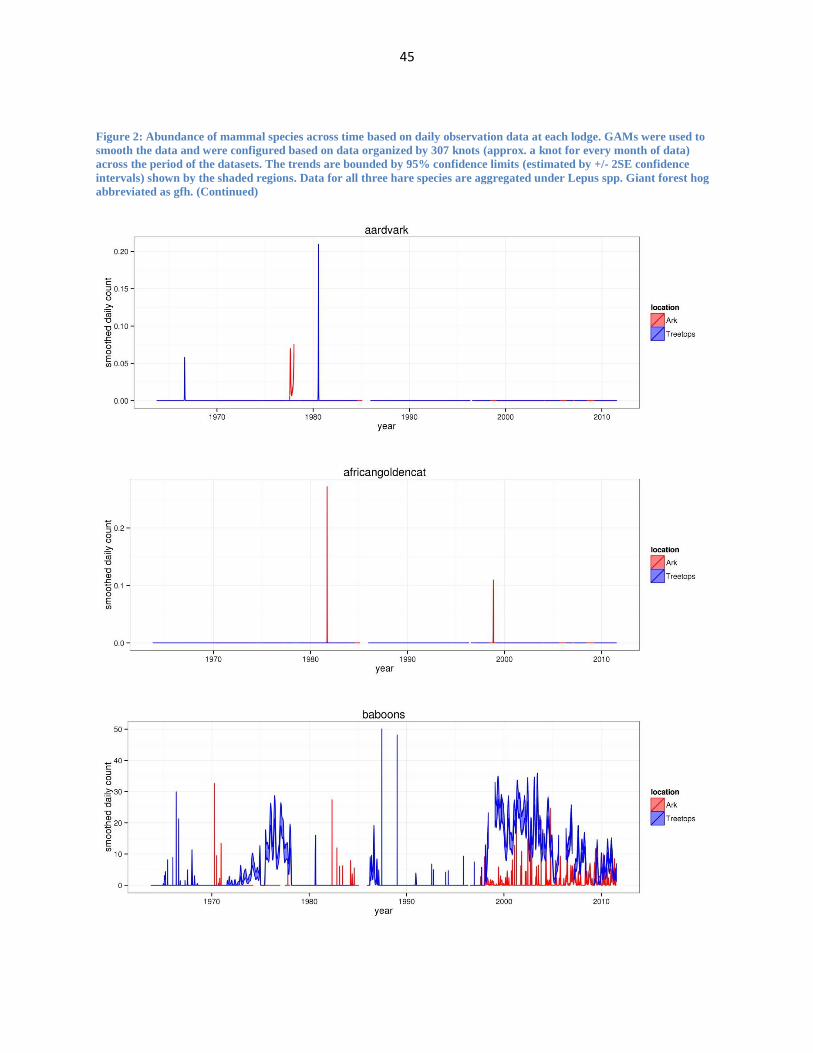
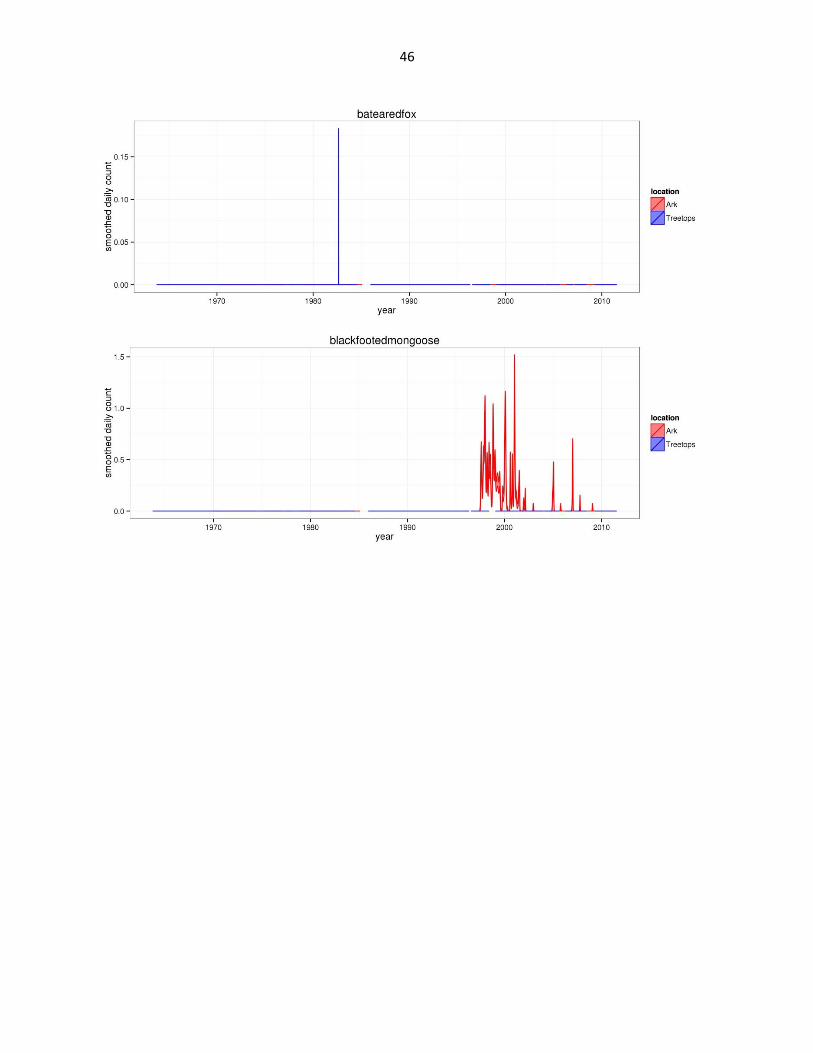
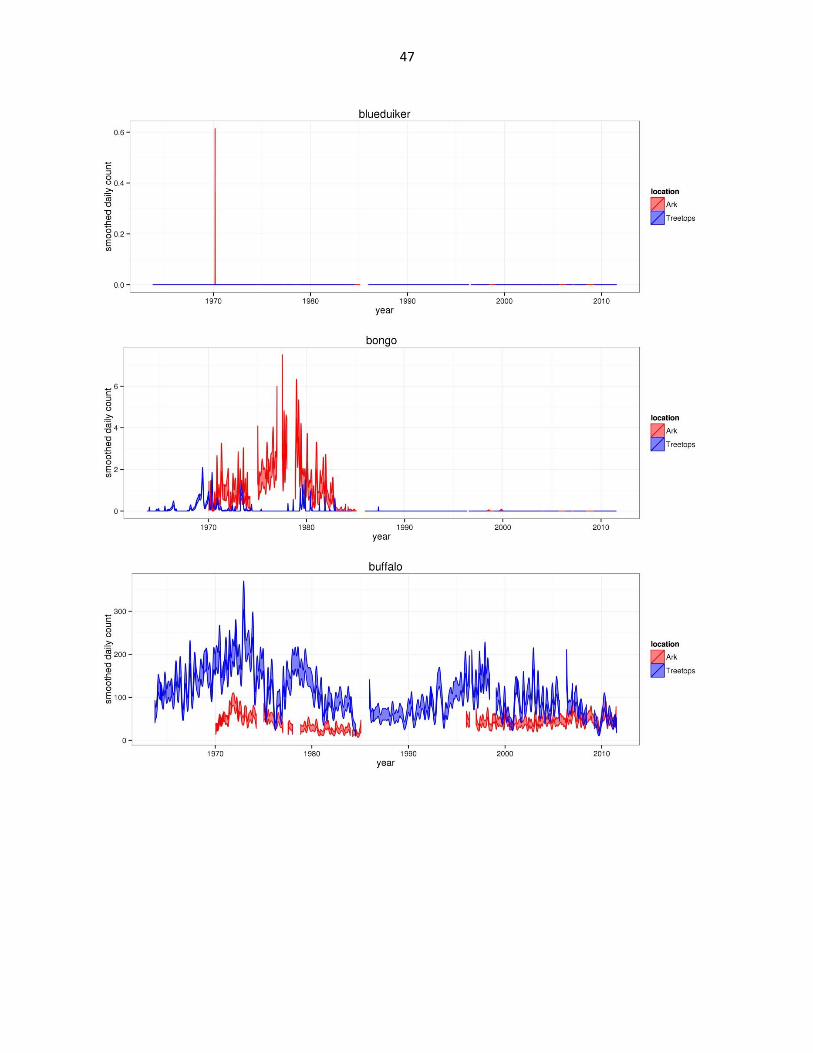
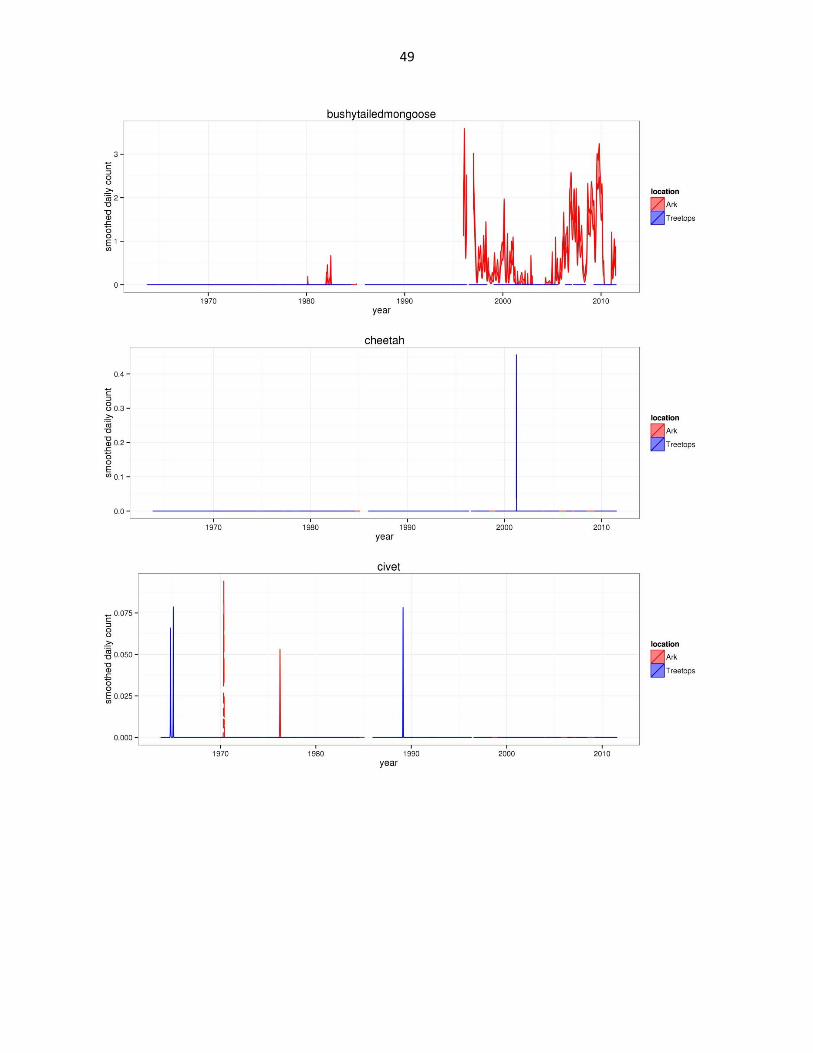
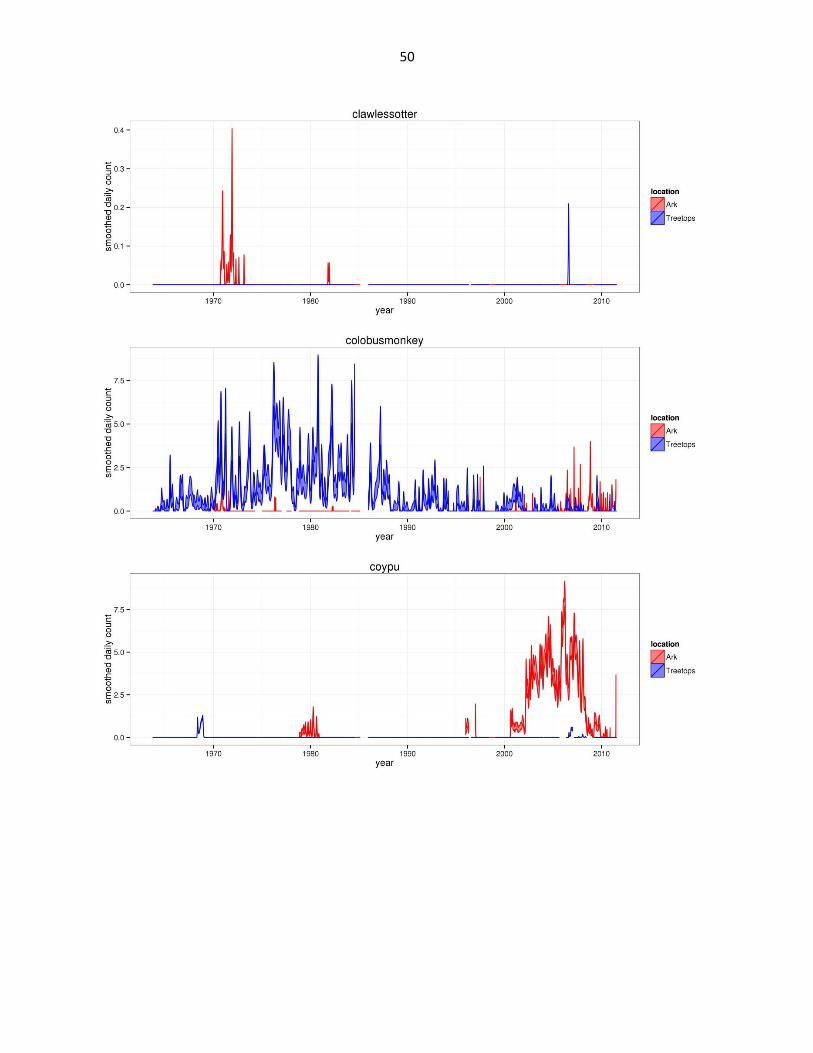
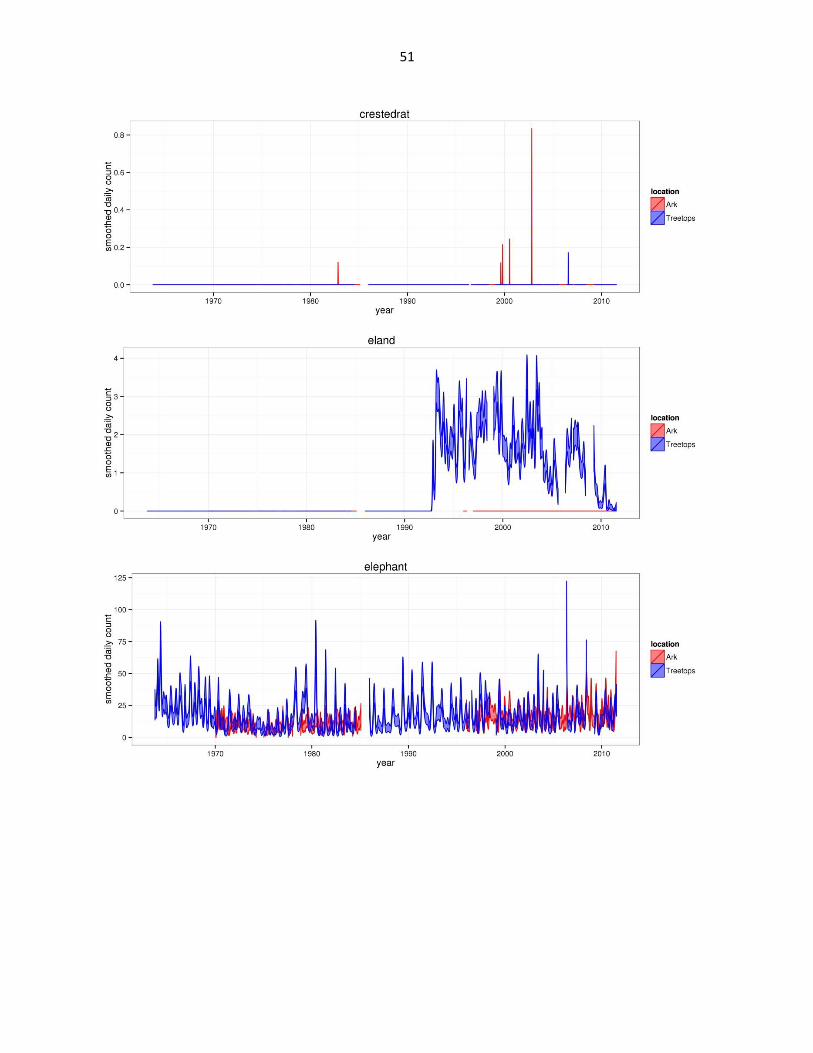
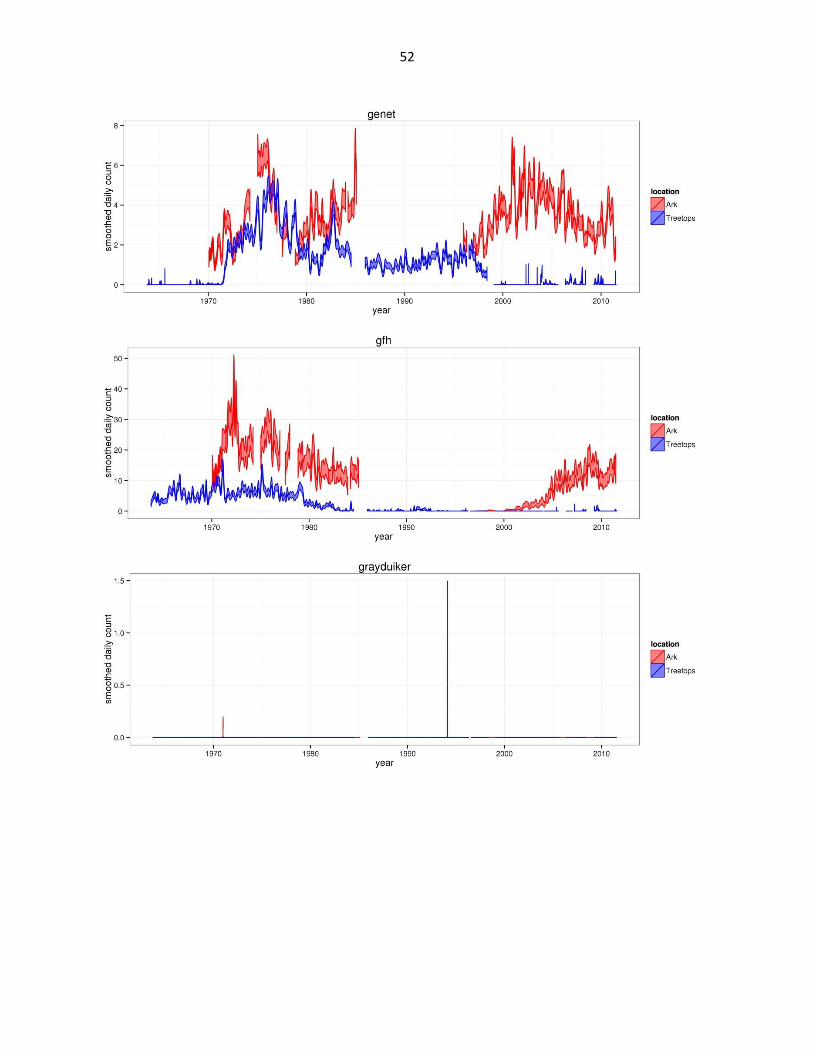
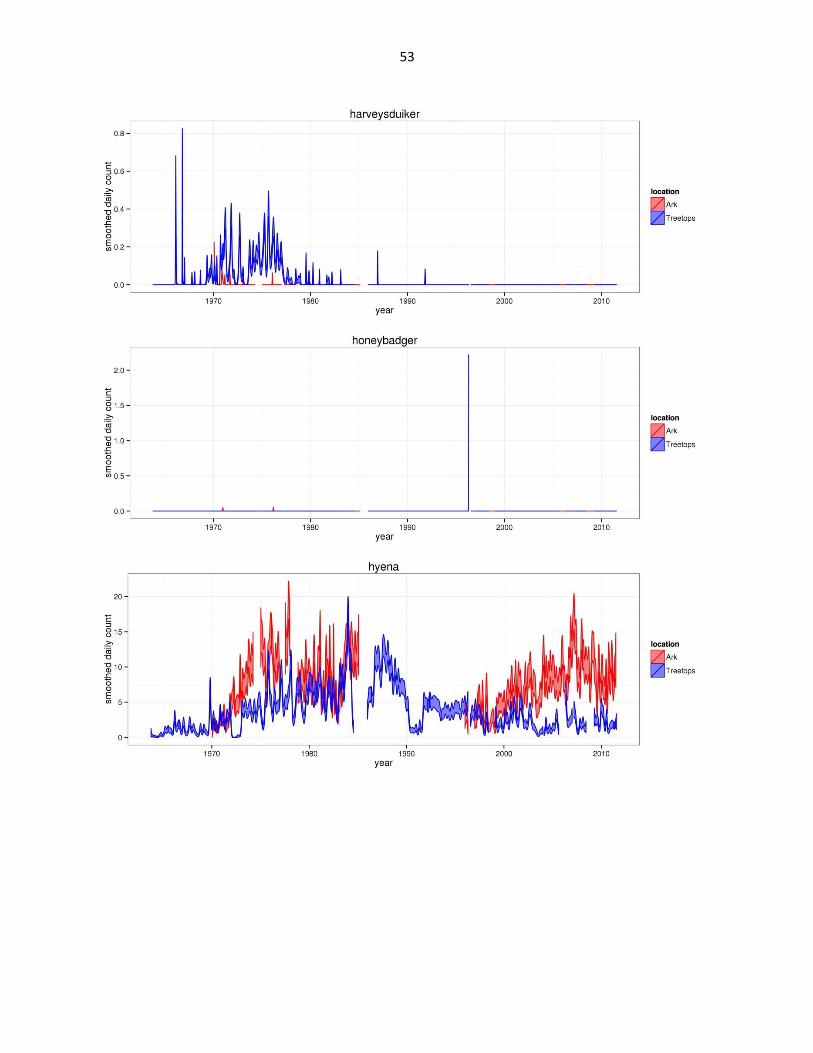
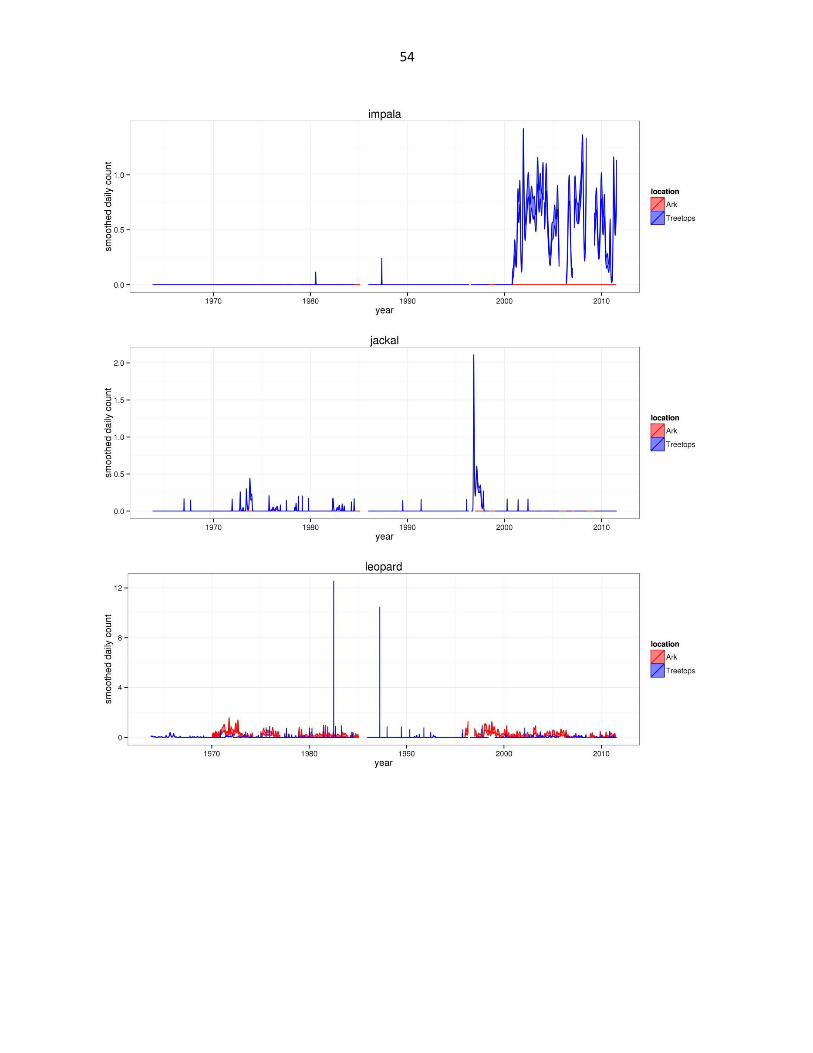
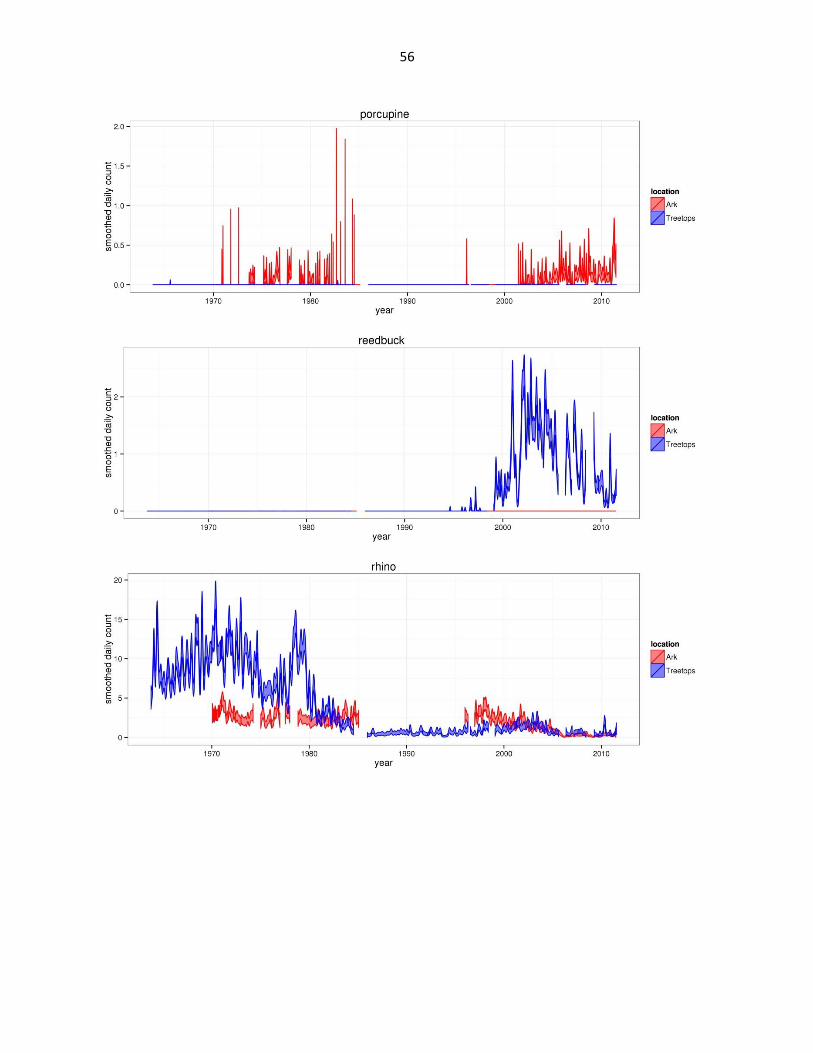
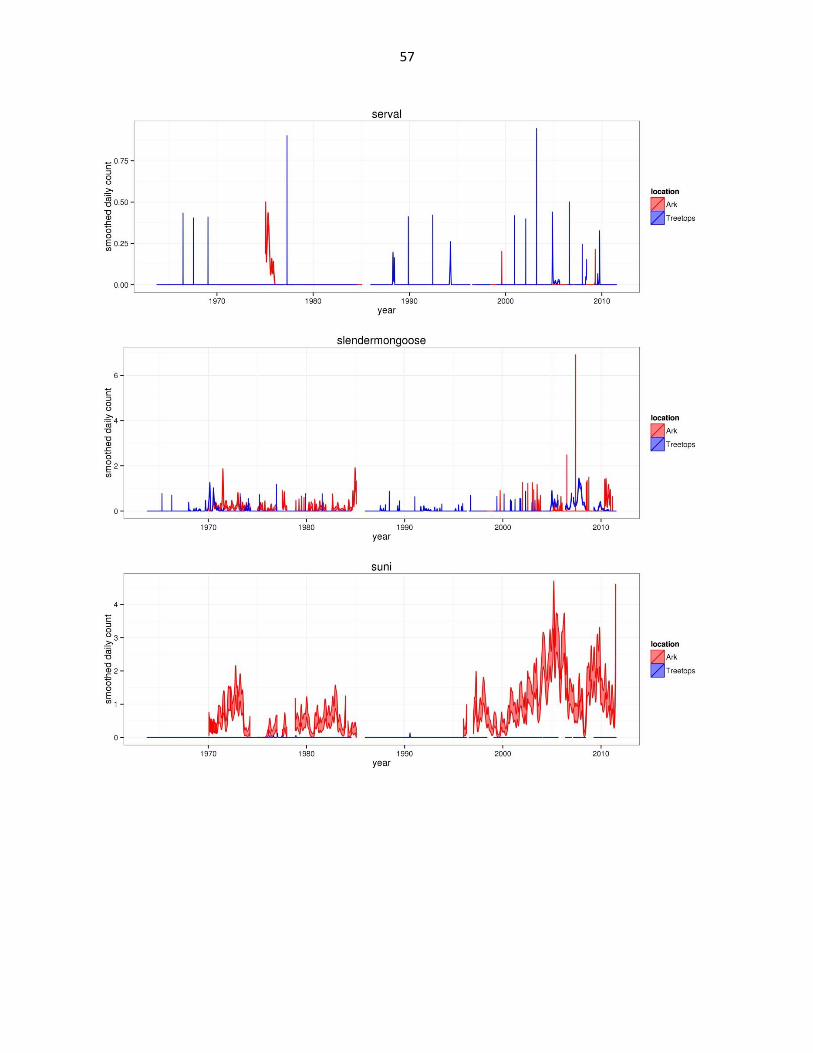
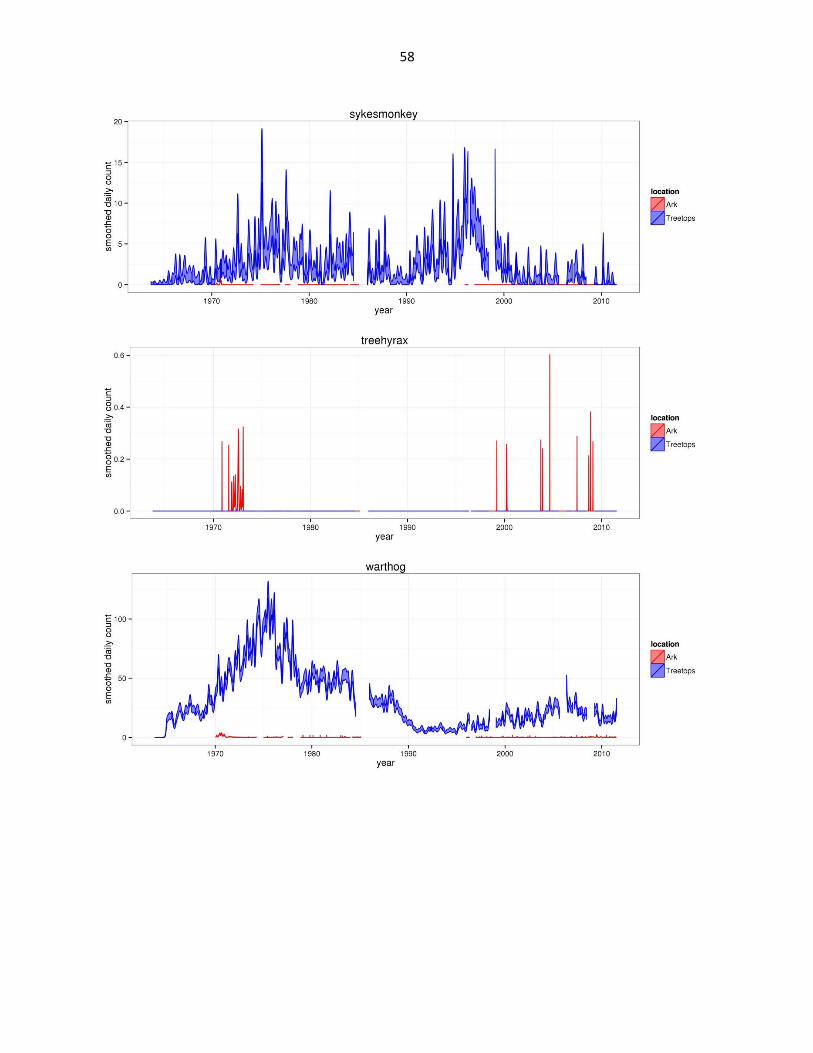
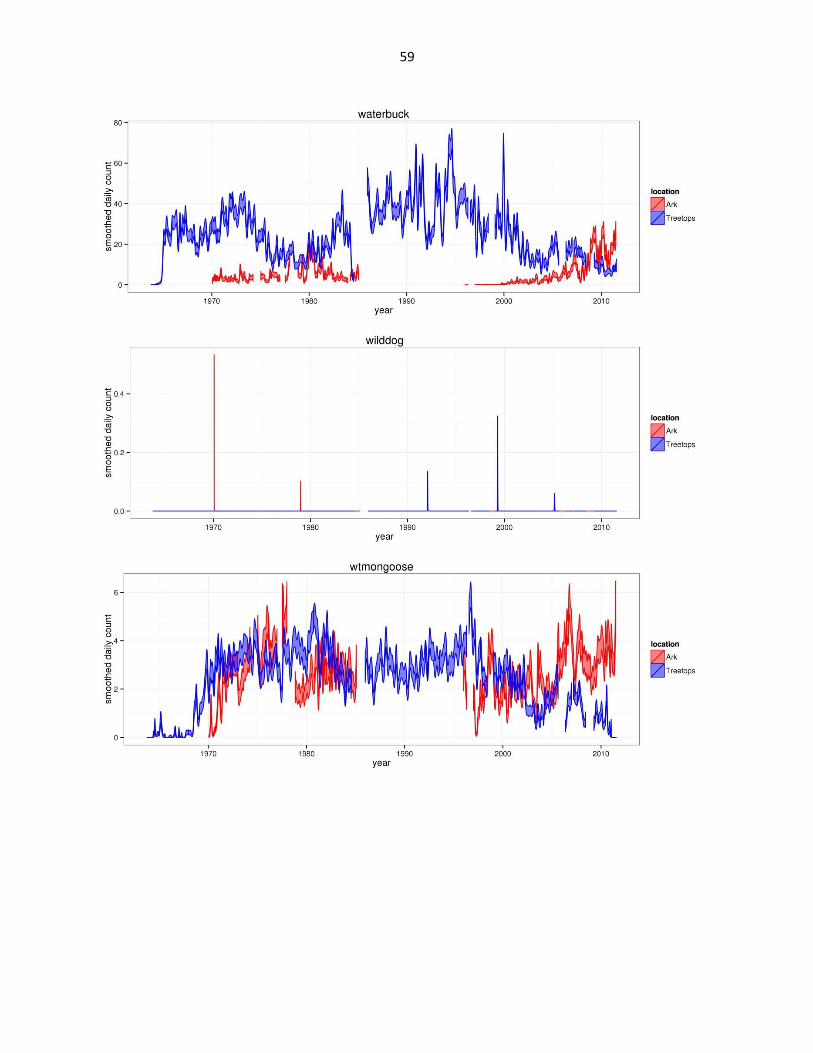
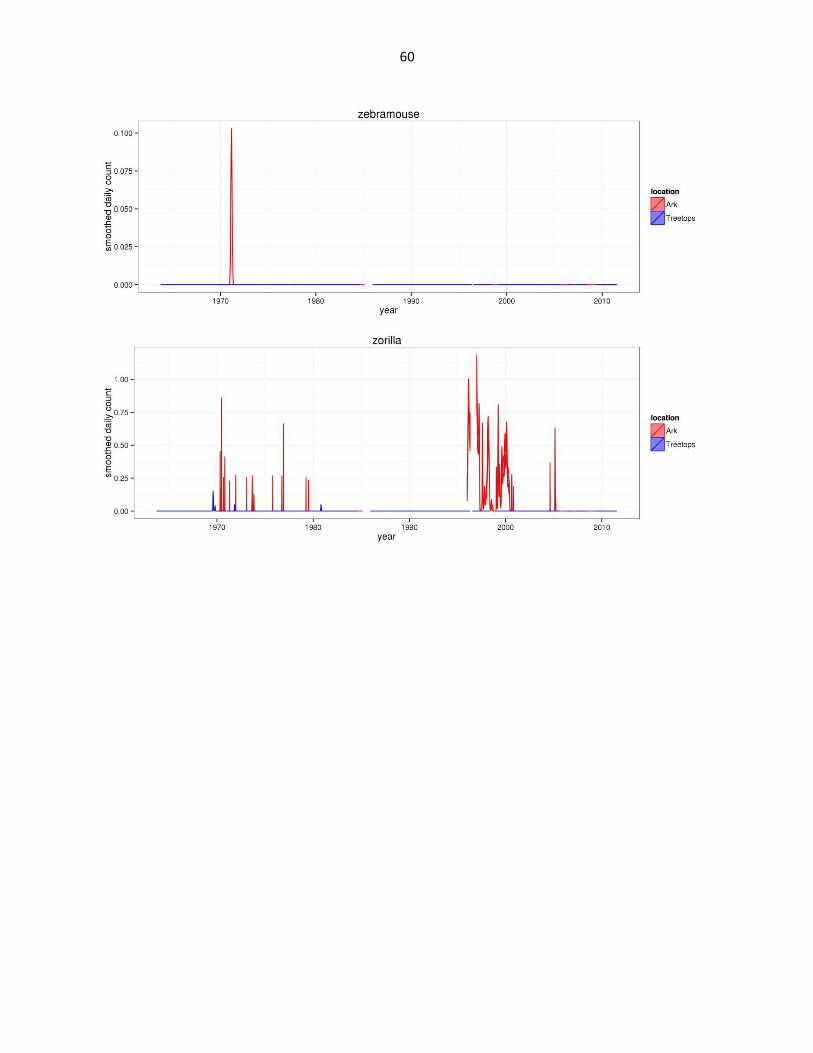
Figure 2: Abundance of mammal species across time based on daily observation data at each lodge. GAMs were used to
smooth the data and were configured based on data organized by 307 knots (approx. a knot for every month of data)
across the period of the datasets. The trends are bounded by 95% confidence limits (estimated by +/- 2SE confidence
intervals) shown by the shaded regions. Data for all three hare species are aggregated under Lepus spp. Giant forest hog
abbreviated as gfh. (Continued)
46
47

48
49
50
51
52
53
54

55
56
57
58
59
60
61
Works Cited
Philip Nyagah, personal comment. (2011).
Charles Mathenge, personal comment. (2011).
Atkinson, P., et al. (2006). Identifying declines in waterbirds: the effects of missing data,
population variability and count period on the interpretation of long-term survey data.
Biological Conservation, 549-559.
Brashares, J., et al. (2004). Bushmeat hunting, wildlife declines, and fish supply in West Africa.
Science 306: 1180-1183.
Brashares, J. & Sam, M. (2005). How much is enough? Estimating the minimum sampling
required for effective monitoring of African reserves. Biodiversity and Conservation 14:
2709-2722.
Butynski, T. (1999). Aberdares National Park and Aberdares Forest Reserves wildlife fence
placement and recommendations. Unpublished report for Kenya Wildlife Service and
Kenya Forest Department.
Cardinale, B., Srivastava, D., Duffy, J., Wright, J., Downing, A., Sankaran, M., & Jouseau, C.
(2006). Effects of biodiversity on the functioning of trophic groups and ecosystems.
Nature, 989-992.
Estes, L., Okin, G., Mwangi, A., & Shugart, H. (2008). Habitat selection by a rare forest
antelope: A multi-scale approach combining field data and imagery from three sensors.
Remote Sensing of Environment, 2033-2050.
FAO. (1998). Aberdares Natural Resources Development Project: Environmental Impact
Assessment Report. Food and Agricultural Organization of the United Nations, 1-141.
Fedy, B., & Aldridge, C. (2011). The importance of within-year repeated counts and the
Influence of scale on long-term monitoring of Sage-Grouse. Journal of Wildlife
Management, 1022-1033.
Fewster, R., Buckland, S., Siriwardena, G., Baillie, S., & Wilson, J. (2000). Analysis of
population trends for farmland birds using generalized additive models. Ecology, 1970-
1984.
Fortin, D., Beyer, H., Boyce, M., Smith, D., Duchesne, T., & Mao, J. (2005). Wolves influence
elk movements: behavior shapes a trophic cascade in Yellowstone National Park.
Ecology, 86(5), 1320-1330.
62
Foufopoulos, J., Kilpatrick, A., & Ives, A. (2011). Climate change and elevated extinction rates
of reptiles from Mediterrenean islands. The American Naturalist, 177 (1), 119.
Guisan, A., Edwards, T. J., & Hastie, T. (2002). Generalized linear and generalized additive
models in studies of species distributions: setting the scene. Ecological Modelling, 89-
100.
Heip, C., Herman, P., & Soetaert, K. (1998). Indices of diversity and evenness. Oceanis, 61-87.
Hutcheson, K. (1970). A test for comparing diversities based on the Shannon formula. Journal of
Theoretical Biology, 151-154.
Kenya Wildlife Service. (1990). A policy framework and development programme.
Kirkland, G. (1990). Patterns of initial small mammal community change after clearcutting of
temperate North American Forests. Oikos, 313-320.
Lambrechts, C., Woodley, B., Church, C., & Gachanja, M. (2003). Aerial survey of the
destruction of the Aberdare Range forests. Nairobi: UNEP.
Laws, R. (1970). Elephants as agents of habitat and landscape change in East Africa. Oikos, 1-
15.
Loreau, M. (2010). Linking biodiversity and ecosystems: towards a unifying ecological theory.
Phil. Trans. R. Soc. B, 49-60.
Magurran, A. (2004). Measuring Biological Diversity. Blackwell Publishing.
Magurran, A. & Henderson, P. (2010). Temporal turnover and the maintenance of diversity in
ecological assemblages. Philos Trans R Soc Lond B Biol Sci, 3611-3620.
Margalef, R. (1972). Homage to Evelyn Hutchinson, or why is there an upper limit to diversity?
Transactions of the Connecticut Academy of Arts and Sciences, 211-235.
McNaughton, S. (1977). Diversity and stability of ecological communities: a comment on the
role of empiricism in ecology. American Naturalist, 515-525.
Mugarran, A., & Henderson, P. (2010). Temporal turnover and the maintenance of diversity in
ecological assemblages. Philos Trans R Soc Lond B Biol Sci, 3611-3620.
Mwangi, A. (2010). Progress Report. Bongo Surveillance Program. Kenya.
Myers, N., Mittermeier, R., Mittermeier, C., Fonseca, G., & Kent, J. (2000). Biodiversity
hotspots for conservation priorities. Nature, 853-858.
63
Newmark, W. D. (1987). A land-bridge island perspective on mammalian extinctions in western
North American parks. Nature 325: 430–432.
O’Connell-Rodwell, C., Rodwell, T., Rice, M., Hart, L. 2000. Living with the modern
conservation paradigm: can agricultural communities co-exist with elephants? A five year
case study in East Caprivi, Namibia. Biological Conservation, 381-391.
Parker, C., et al. (2013). Conserving large carnivores: dollars and fence. Ecology Letters.
Prickett, R. (1974). The African Ark. New York: Drake Publishers Inc.
Pringle, R. (2008). Elephants as agents of habitat creation for small vertebrates at the patch scale.
Ecology, 26-33.
Pullan, R. (1988). Conservation and the development of national parks in the humid tropics of
Africa. Journal of Biogeography, 171-183.
Rare Species Conservatory Foundation. (2002). Repatriation of the Mountain Bongo Antelope to
Mt. Kenya World Heritage Site.
Rendon, M., Green, A., Aguilera, E., & Almaraz, P. (2007). Status, distribution and long-term
changes in the waterbird community wintering in Donana, south-west Spain. Biological
Conservation, 1371-1388.
Rhino Ark. (2011). Environmental, Social and Economic Assessment of the fencing of the
Aberdare Conservation Area. Nairobi.
Ripple, W., Larsen, E., Renkin, R., & Smith, D. (2001). Trophic cascades among wolves, elk and
aspen on Yellowstone National Park's northern range. Biological Conservation, 227-234.
Rothery, P., & Roy, D. (2001). Application of generalized additive models to butterfly transect
count data. Journal of Applied Statistics, 897-909.
Sillero-Zubiri, C., & Gottelli, D. (1992). Population ecology of the spotted hyaena in an
equatorial mountain forest. African Journal of Ecology, 292-300.
Sillero-Zubiri, C., & Gottelli, D. (1991). Threat to Aberdare rhinos: predation versus poaching.
Pachyderm, 37-38.
Sillero-Zubiri, C., & Gottelli, D. (1992). Feeding ecology of the spotted hyaena (Mammalia:
Crocuta crocuta) in a mountain forest habitat. Journal of African Zoology, 169-176.
Sillero-Zubiri, C., & Gottellli, D. (1987). The ecology of the spotted hyaena in the Salient,
Aberdare National Park, and recommendations for wildlife management. Wildlife
Conservation and Management Department of Kenya.
64
Steinhart, E.I. 1989. Hunters, poachers and gamekeepers: towards a social history of hunting in
colonial Kenya. Journal of African History, 247-264.
Taylor, R., & Martin, R. 1987. Effects of veterinary fences on wildlife conservation in
Zimbabwe. Environmental Management, 327-334.
Thouless, C., & Sakwa, J. (1995). Shocking elephants: fences and crop raiders in Laikipia
district, Kenya. Biological Conservation, 99-107.
Tilman, D. (1996). Biodiversity: population versus ecosystem stability. Ecology, 350-363.
Venter, A. (2011). Foreign Body. Africa Geographic, October 2011.
Walpole, M., Morgan-Davies, M., Milledge, S., Bett, P., & Leader-Williams, N. (2001).
Population dynamics and future conservation of a free-ranging black rhinoceros (Diceros
bicornis) population in Kenya. Biological Conservation, 237-243.
Western, D. (1982). Patterns of depletion in a Kenya rhino population and the conservation
implications. Biological Conservation, 147-156.
Western, D. (1989). The ecological role of elephants in Africa. Pachyderm, 44-49.
Wood, S. (2006). Generalized additive models: an introduction with R. New York City:
Chapman and Hall.