ECOBUILD: PLASTIC BRICKS FOR SUSTAINABLE HOUSING
60
ECOBUILD: PLASTIC BRICKS FOR SUSTAINABLE HOUSING AUTHORS: Lisa Bernardi, Pedro Gaspar, Javier Ozcoidi, Manon Randé ACADEMIC YEAR: 2016-17 SUPERVISOR: David Cosculluela KEYWORDS: sustainable housing, construction, recycling, plastic waste, South Africa DATE: June 12, 2017
Transcript of ECOBUILD: PLASTIC BRICKS FOR SUSTAINABLE HOUSING
ECOBUILD: PLASTIC BRICKS FOR SUSTAINABLE HOUSING
AUTHORS: Lisa Bernardi, Pedro Gaspar, Javier Ozcoidi, Manon Randé ACADEMIC YEAR: 2016-17 SUPERVISOR: David Cosculluela KEYWORDS: sustainable housing, construction, recycling, plastic waste, South Africa DATE: June 12, 2017
| i
Abstract
Ecobuild: Plastic Bricks for Sustainable Housing is centered around a proposed new company, Ecobuild, which recycles plastic waste and processes it into bricks that can be used to build sustainable houses. This project takes an existing technology, which has already been proven successful as a business venture in other parts of the world, and adapts it for launch in South Africa, followed by an international expansion to Ghana and Mozambique. It presents itself on three fronts: first, as a new, low-cost, and ecologically friendly way of building houses and closing the housing gap; second, as a solution to the mounting waste management crisis in South Africa and across the entire African continent, a pressing issue with dire health and safety consequences for the general public; and third, as a solution to the housing crisis that has resulted from rapid urbanization. The ultimate goal of this project is to create a positive social, economic, and environmental impact in our locations, while also remaining profitable and viable as a business.
| ii
Abbreviations
BPA: Bisphenol A CAGR: Compound annual growth rate CAHF: Centre for Affordable Housing Finance in Africa CIPC: Companies and Intellectual Properties Commission CSR: Corporate social responsibility DEHA: Diethylhydroxylamine DFI: Direct foreign investor DHS: Department of Human Settlements ECOWAS: Economic Community of West African States FRELIMO: Mozambique Liberation Front FTA: Free trade area GHS: Ghanaian cedi GNI: Gross national income HDPE: High density polyethylene ICT: Information and communication technologies IMF: International Monetary Fund IWMSA: Institute of Waste Management of South Africa LDPE: Low density polyethylene MZN: Mozambican metical OECD: Organisation for Economic Co-operation and Development PAYE: Pay As You Earn PP: Polypropylene PTY LTD: Proprietary Limited PwC: PricewaterhouseCoopers RENAMO: Mozambican National Resistance SADC: South African Development Community SDL: Skills Development Levy S&P: Standard and Poor’s UIF: Unemployment Insurance Fund UN: United Nations WGI: Worldwide Governance Indicators ZAR: South African rand
| iii
Table of Contents 1. Executive Summary 1
1.1. Business Description 1
1.2. Value Proposition 2
2. External Analysis 3
2.1. PEST: South Africa 3
2.1.1. Political Analysis 3
2.1.2. Economic Analysis 3
2.1.3. Social Analysis 4
2.1.4. Technological Analysis 5
2.2. PEST: Mozambique 5
2.3. PEST: Ghana 5
2.4. Market Research 6
2.4.1. Construction Market, South Africa 6
2.4.2. Affordable Housing Segment, Africa 7
2.4.3. Public Housing Segment, South Africa 7
3. Internal Analysis 8 3.1. SWOT 8
3.2. Stakeholder Analysis 9
3.3. Entry Plan 9
3.4. Internationalization Plan 10
3.5. Exit Plan 10
4. Marketing 12 4.1. Market Definition & Quantification 12
4.2. Clients vs. Consumers 12
4.3. Segmentation 12
4.4. Competition 12
4.5. Marketing Mix 13
4.5.1. Product 13
4.5.1.1. Production Process 13
4.5.1.2. Product Development 13
4.5.2. Price 14
4.5.3. Placement 14
4.5.4. Promotion 14
4.6. Budget 15
5. Logistics 16
5.1. Supply Chain Structure 16
| iv
5.2. Location Theory & Network Design 16
5.3. Aggregate Planning 17
5.4. Transportation 17
5.5. Franchising Logistics 17
6. Human Resources 18 6.1. Organization 18
6.2. Compensation & Benefits 18
7. Financial Analysis 20 7.1. Funding 20
7.2. Sales Forecast 20
7.3. Costs Forecast 20
7.4. Income Statement 21
7.5. Cash Flow Statement 21
7.6. Currency Risk Analysis and Hedging 21
8. Viability Analysis & Conclusion 23 Appendix 24
Figure 1. SADC members 24
Figure 2. Timeline of the SADC integration process 25
Figure 3. Ease of doing business by distance to frontier, SADC 26
Figure 4. Doing Business scores by topic, South Africa 27
Figure 5. SADC member state GDPs ($) 27
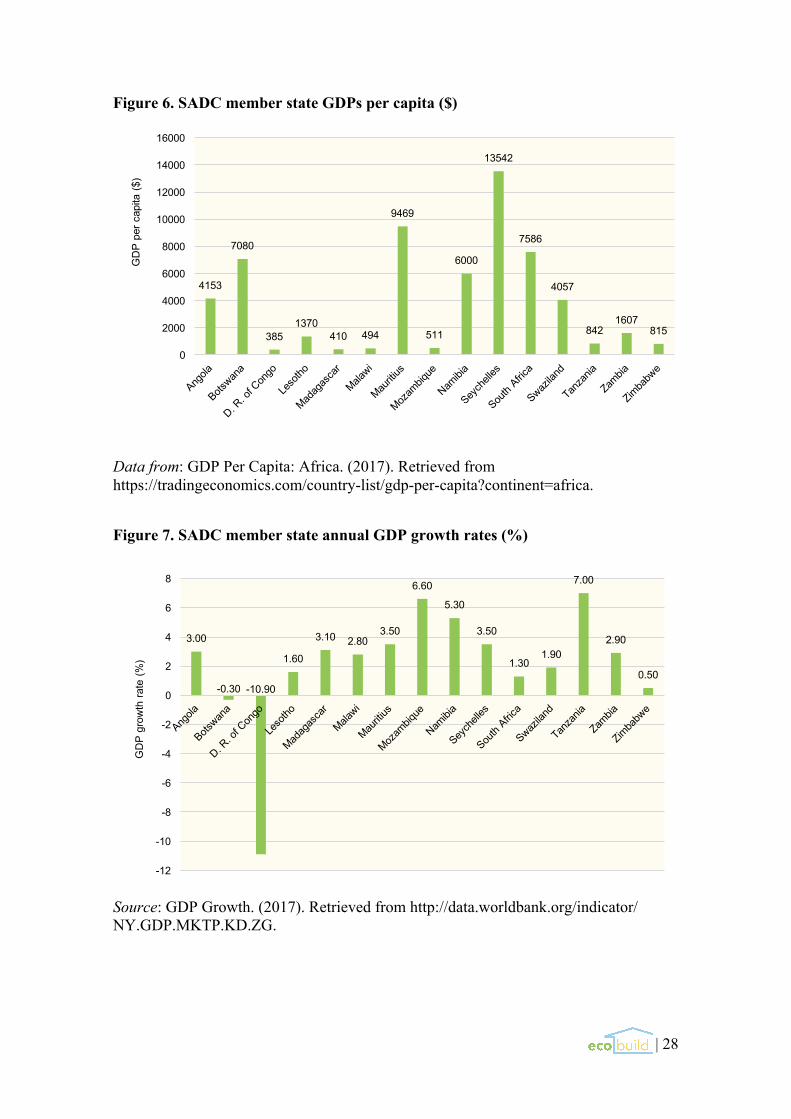
Figure 6. SADC member state GDPs per capita ($) 28
Figure 7. SADC member state annual GDP growth rates (%) 28
Figure 8. Selected economic indicators, South Africa, 2011-2020 29
Figure 9. Exchange rate, South African rand/US dollar, 2007-2017 29
Figure 10. Population growth, South Africa 30
Figure 11. Mozambique PEST 31
Figure 12. Ghana PEST 32
Figure 13. African construction sector, number of projects and continental share 33
Figure 14. Sources of construction project funding, Africa 34
Figure 16. Stakeholder map 35
Figure 17. Legal procedures to start a business, South Africa 36
Figure 18. Standard brick 36
Figure 19. Corner brick 37
Figure 20. Types of recyclable plastic 37
Figure 21. Plastic extrusion process 38
Figure 22. Housing affordability, South Africa 38
| v
Figure 23. Housing affordability, Mozambique 39
Figure 24. Housing affordability, Ghana 39
Figure 25. Supply chain structure 40
Figure 26. Center of gravity model 40
Figure 27. Major cities, roads, and ports, South Africa 41
Figure 28. Labor and time requirement to build one unit 41
Figure 29. Employee structure 42
Figure 30. Sales forecast 43
Figure 31. Materials costs forecast 44
Figure 32. Salaries forecast 45
Figure 33. Other costs forecast 46
Figure 34. Income statement 47
Figure 35. Cash flow statement 48
Figure 36. Franchising financial analysis, Mozambique 49
Figure 37. Franchising financial analysis, Ghana 50
Sources 51
| 1
1. Executive Summary 1.1. Business Description Ecobuild is a proposed new company which recycles plastic waste and processes it into bricks that can be used to build sustainable houses. The company will be headquartered in Johannesburg, South Africa and subsequently expand its operations to Mozambique and Ghana through industrial franchising. The idea for this project was born when we first learned of similar companies operating successfully in South America and the Asia-Pacific region and wondered about the model’s applicability on the African continent. Through our research we discovered a growing potential market for this type of product, particularly within sub-Saharan Africa, a region which is struggling to keep up with its own urbanization.
Rapid urban migration has led to increasingly unmanageable waste levels in most southern African countries. The South African Development Community (SADC) describes waste management as a pressing issue for public health and safety, and currently faces three main challenges: “high volumes of waste, low capacity to management and high costs involved in management” (“Waste Management,” 2012). As a result of local governments’ inability to effectively tackle these issues, much of the waste management across the region has been privatized, which has led to limited success in some areas and worsening conditions in others.
Fast urbanization is also increasing the portion of the population affected by gap housing, a “term that describes the shortfall or gap in the market between residential units supplied by the State and houses delivered by the private sector households that cannot afford basic formal housing and end up settling up in slums and surrounding townships” (Tibane, 2016, p. 120). These groups are essentially too poor to afford a house, but too wealthy to be provided one by the government.
Ecobuild plans to provide a solution to these issues 1) by incentivizing the proper collection and disposal of certain types of plastic waste and 2) by offering an affordable product to the underserved gap housing market. The ultimate goal is to position the company as a socially and environmentally friendly organization while still remaining profitable as a business.
| 2
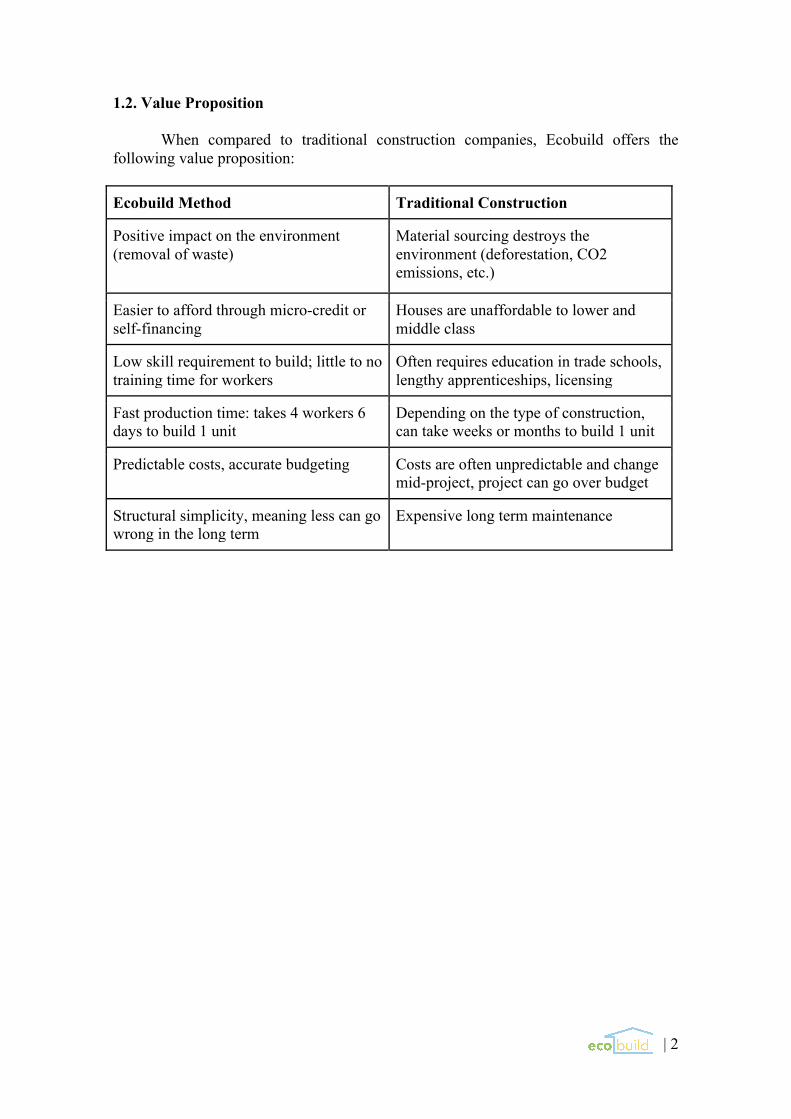
1.2. Value Proposition When compared to traditional construction companies, Ecobuild offers the following value proposition:
Ecobuild Method Traditional Construction
Positive impact on the environment (removal of waste)
Material sourcing destroys the environment (deforestation, CO2 emissions, etc.)
Easier to afford through micro-credit or self-financing
Houses are unaffordable to lower and middle class
Low skill requirement to build; little to no training time for workers
Often requires education in trade schools, lengthy apprenticeships, licensing
Fast production time: takes 4 workers 6 days to build 1 unit
Depending on the type of construction, can take weeks or months to build 1 unit
Predictable costs, accurate budgeting Costs are often unpredictable and change mid-project, project can go over budget
Structural simplicity, meaning less can go wrong in the long term
Expensive long term maintenance
| 3
2. External Analysis 2.1. PEST: South Africa Our core reasons for choosing South Africa as Ecobuild’s operational center are its physical location, political and economic stability, and well-developed infrastructure. However, based on the following analysis, there are many factors that should be taken into consideration while starting and operating the business. 2.1.1. Political Analysis
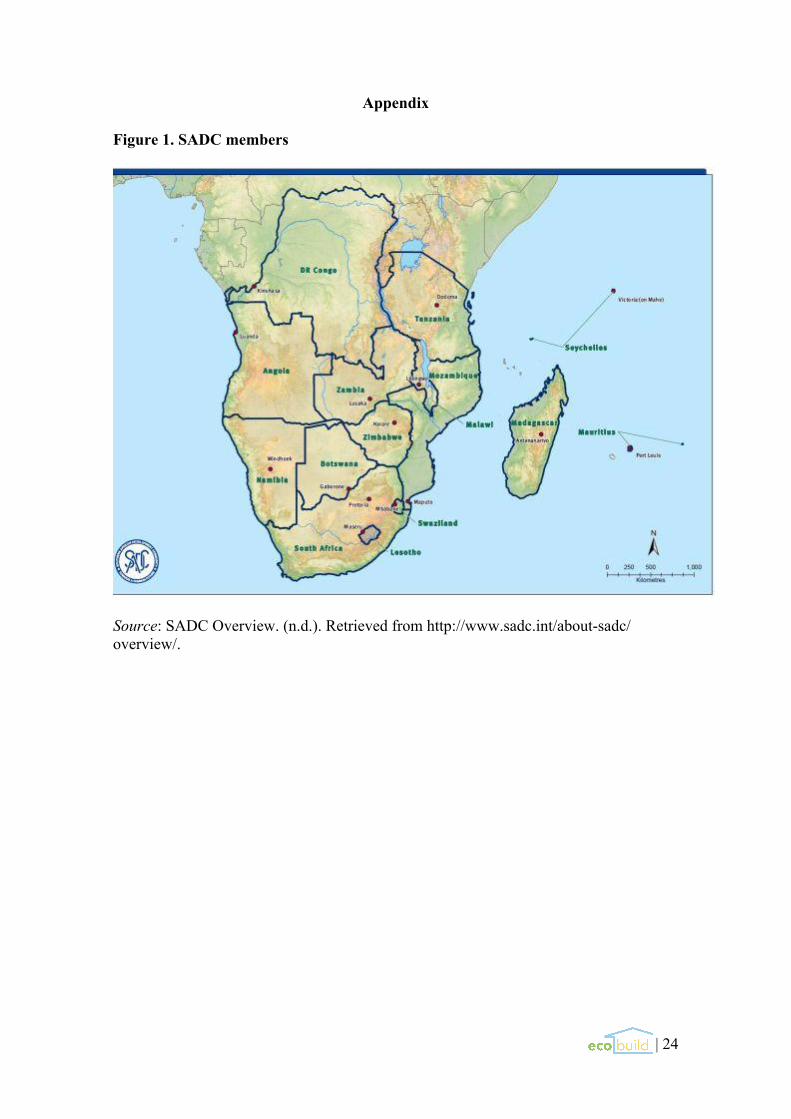
South Africa is a member of the SADC, which was established in 1992 among a series of liberation movements which intended to bring an end to the colonial and mostly white-minority rule in southern Africa (refer to Figure 1 and Figure 2 for a map and full integration process details). The SADC’s core goals are to boost regional integration, eradicate poverty, and ensure peace and security within the region. South Africa’s multi-ethnic society makes its political environment somewhat complex and challenging. The country’s political scene is still highly influenced by its colonial past, the rule of Dutch and British, and apartheid, which led the country into several political crises and was still legal until the early 1990s; its effects are still present today. According to the World Bank, South Africa has shown an improvement in political stability, corruption control, rule of law, and quality of regulations for the past 15 years (“Worldwide Governance Indicators”, 2017). However, it is currently experiencing a troubled political environment due to recent public corruption scandals under President Zuma (Chutel, 2016). Urgent reforms are needed in the labor market, specifically the mining sector, to avoid strikes (Anand, Kothari, and Kumar, 2016).
Despite some political uncertainty, we believe these short-term factors will minimally affect Ecobuild’s main operations, if at all. Moreover, South Africa is still considered to have high mid- to long-term growth potential, remarkably transparent political institutions and markets, and a strong political commitment to maintaining macroeconomic stability. 2.1.2. Economic Analysis
South Africa’s currency is the rand (ZAR), which is notated with the symbol R. In this report, we will use the following exchange rate:
R1.00=$0.0753384
South Africa has benefitted from the SADC’s economic policies, particularly its Free Trade Area (FTA) which to date has been adopted by 12 of the 15 SADC member states (Angola, the Democratic Republic of the Congo, and Seychelles have not yet joined). The establishment of this FTA helped to increase intra-SADC trade from $13.2 billion in 2000 to $34 billion in 2009 (“Free Trade Area”, 2012).
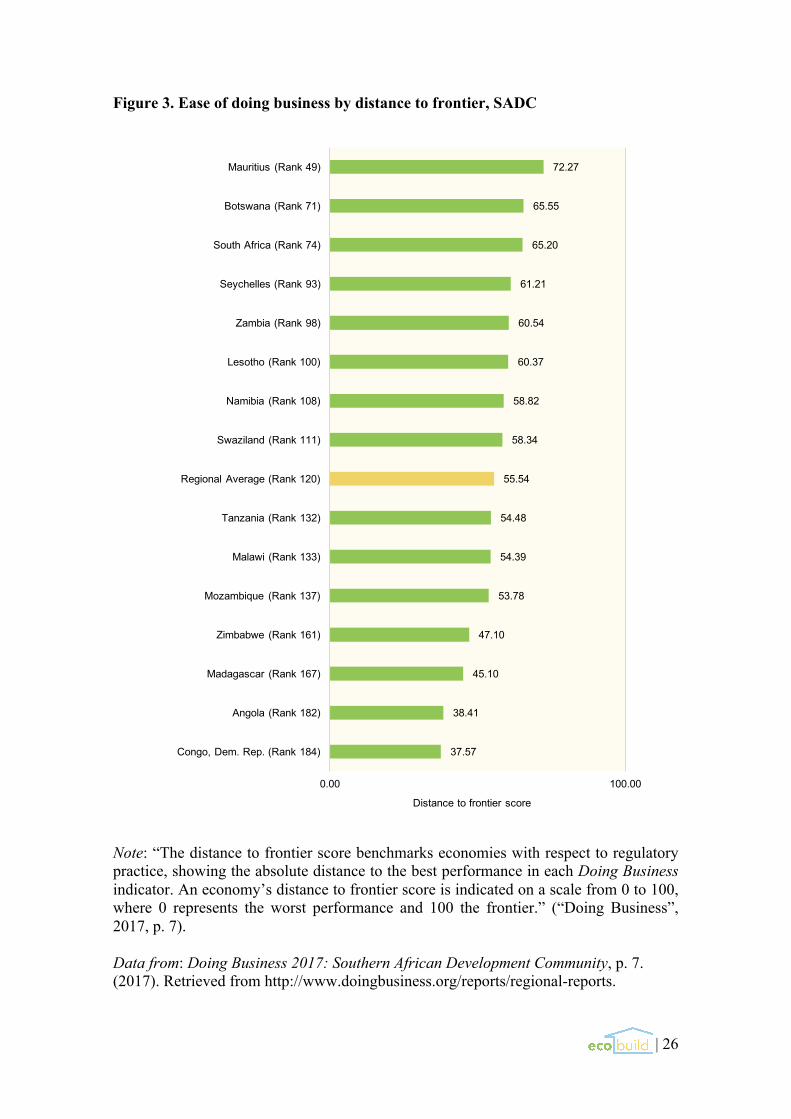
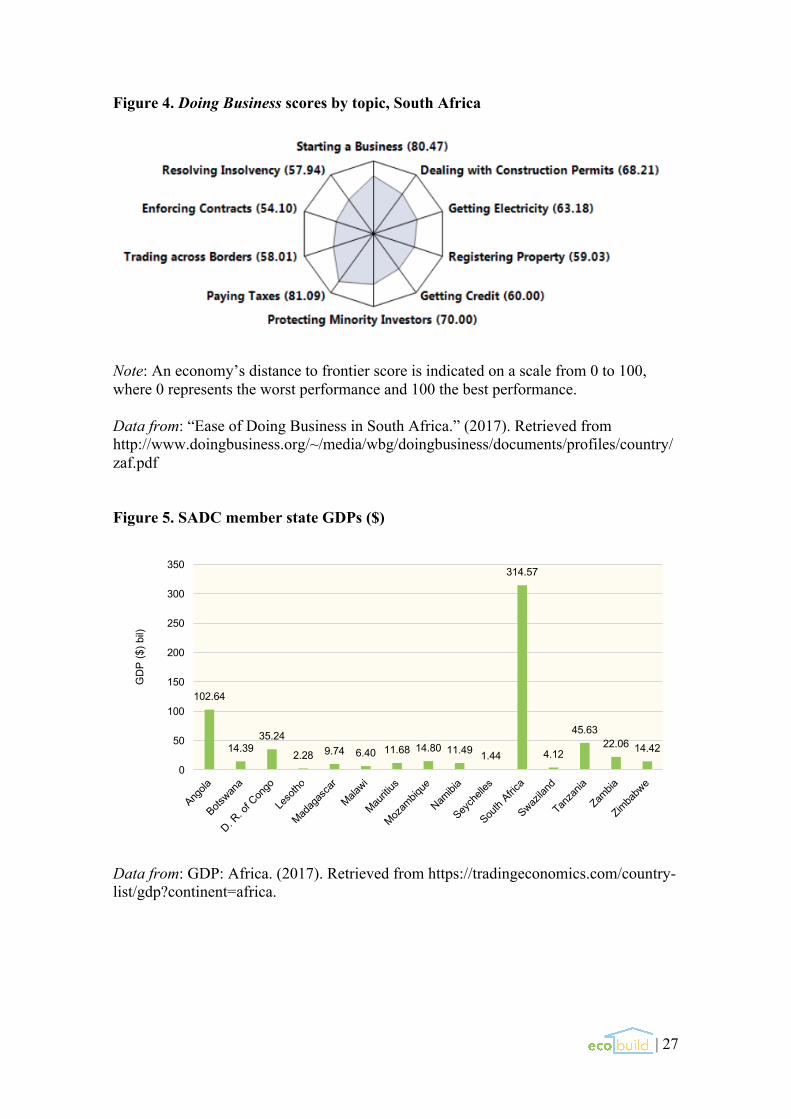
While SADC members’ ease of doing business scores vary widely, South Africa’s is relatively high for the region with a score of 65.2 out of 100 (Figure 3). Breaking down these scores into individual topics, it is clear that some aspects are much easier than others (Figure 4). Starting a business, paying taxes, and dealing with construction permits are the easiest parts of doing business, while enforcing contracts, getting credit, and resolving insolvency are the most difficult (“Ease of Doing Business in South Africa”, 2017). Taking this analysis into consideration, for example, Ecobuild
| 4
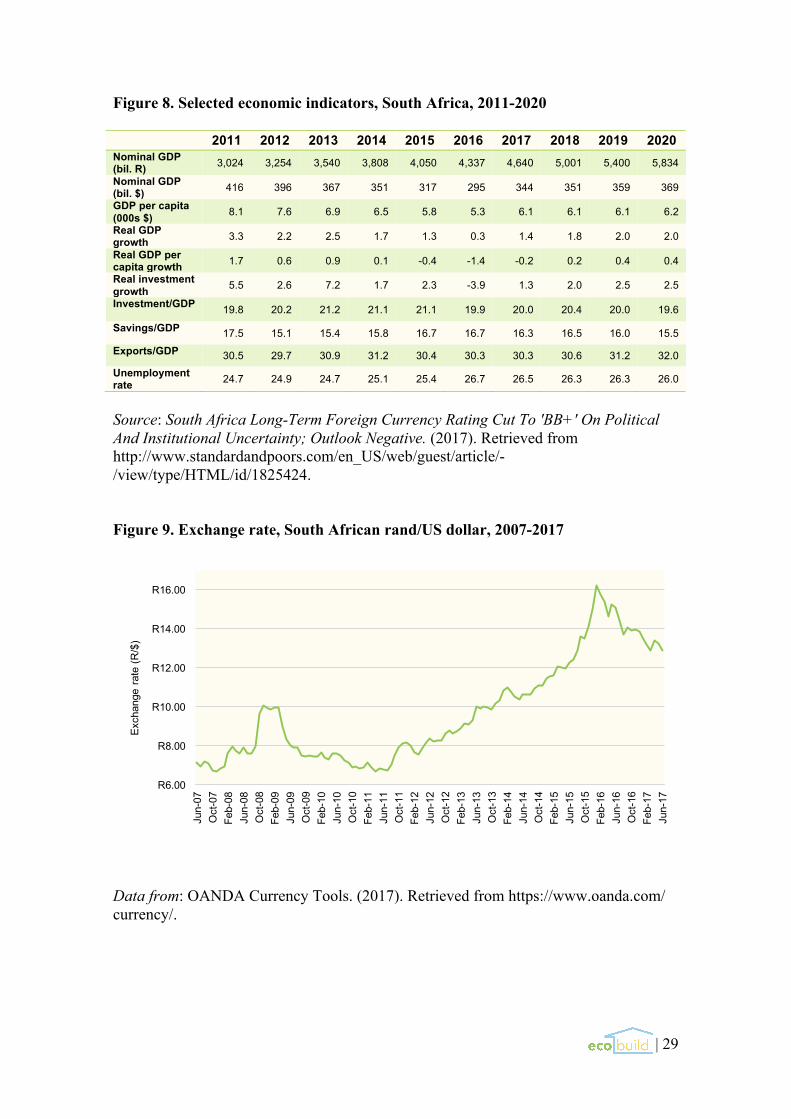
will likely have an easier time securing the necessary permits for its many projects than collecting upon and enforcing contracts with clients. The company may also need to consider getting credit from other foreign sources due to complexities in its home country. South Africa is the economic cornerstone of the region, with a GDP greater than those of the remaining 14 SADC member states combined (Figure 5). South Africa ranks third out of this group in terms of GDP per capita (Figure 6). However, the country is currently experiencing a very low annual real GDP growth of 1.4% (Figure 7). This is mainly attributed to volatile commodity prices and weakening demand from China. An S&P report lists pessimistic growth forecasts for the upcoming years, with 1.8% and 2.0% growth predicted for 2018 and 2019, respectively (“South Africa Long-Term Foreign Currency Rating”, 2017). According to the same report, this low growth is correlated with the political instability mentioned in section 2.1.1. Government and party divisions have caused delays in the implementation of key policies and reforms, harming relationships with investors, business leaders, and labor representatives. Weak economic growth is also linked to longstanding skill shortages in the labor market, compounded by a current unemployment rate of 26.5%, which is predicted to remain unchanged at least until 2020 (“South Africa Long-Term Foreign Currency Rating”, 2017).
Inflation rates, while historically volatile in Africa, have remained relatively stable in South Africa at a rate of 4-6%, and are expected to remain constant in the coming years (Figure 8). Exchange rate fluctuation, however, has historically shown some volatility (Figure 9). This is mainly due to the country's dependence on commodities exports, “investor risk-on/risk-off sentiments”, and political uncertainty (Navée, Perrelli, & Schimmelpfennig, 2016, p. 11).
South Africa is ultimately rated BB+ with a negative outlook by S&P due to its low GDP growth and deteriorating political environment. However, it is still considered one of the more economically stable countries in the region, and we expect progressive economic recovery and political environment normalization in the coming years. Furthermore, we anticipate that any current issues will have a minimal impact on Ecobuild’s operations. 2.1.3. Social Analysis
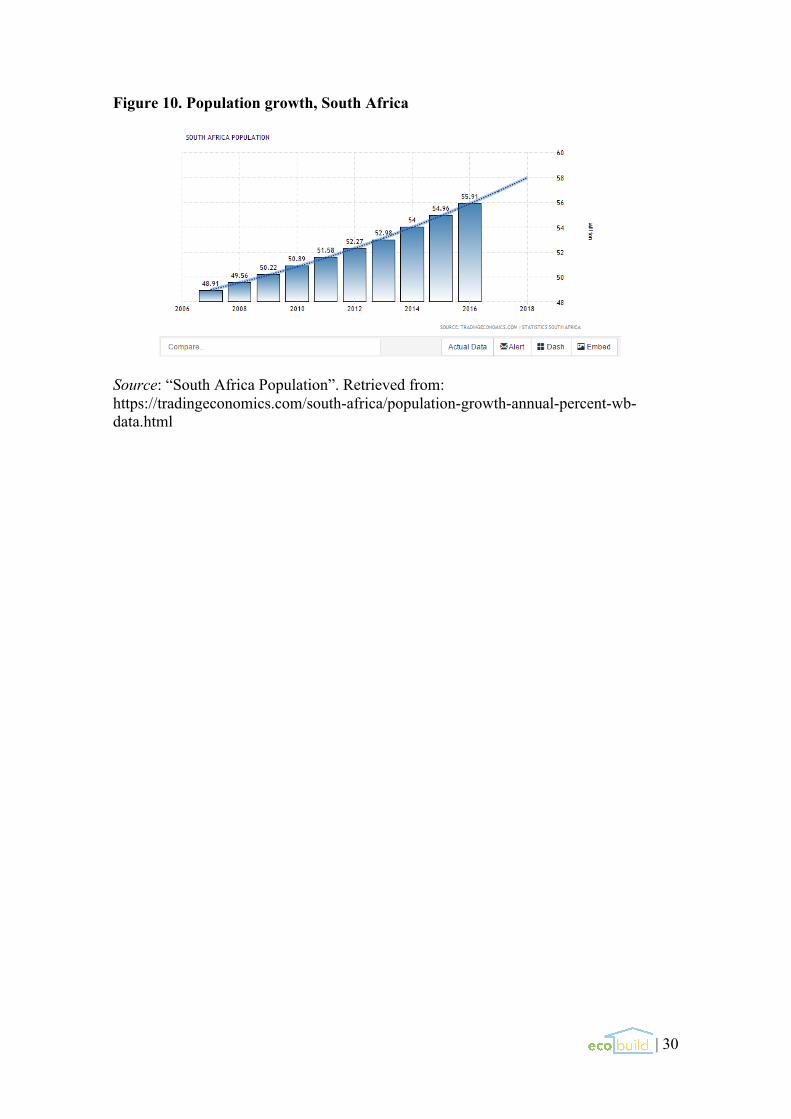
South Africa is the 26th largest country in the world, comprising 0.73% of the
worldwide population. The population was 56 million in 2016 and was forecasted to reach 59 million in 2020 (Figure 10). According to the World Bank, 64% of the South African population lives in urban areas; of this urban population, 23% live in slums, representing a total of more than 8 million people (“World Development Indicators”, 2017).
Eleven languages are present in South Africa, the most spoken languages being IsiZulu (22.7%), Afrikaans (13.5%), IsiXhosa (16%), and English (9.6%) (“The World Factbook: South Africa”, n.d.). The ethnic structure is composed by 5 main groups; black Africans represent the majority of the population (80.2%), followed by white (8.4%), colored (8.8%), and Indian/Asian (2.5%) (“The World Factbook: South Africa”, n.d.). The abolishment of apartheid led to many cultural shifts, including a more restrictive immigration policy due to an influx of illegal immigrants (Tessier, 1995).
| 5
2.1.4. Technological Analysis
Fifteen percent of the South African population has no access to electricity, representing more than 7 million people (The World Factbook: South Africa”, n.d.). Infrastructure is good for the region and still improving, but still lagging; as of 2014, only 158,952 of South Africa’s 747,014 km of roads were paved (“The World Factbook: South Africa”, n.d.). In 2013, the country had 566 airports, although only 144 had paved runways. Major ports are located in Cape Town, Durban, Port Elizabeth, Richards Bay, and Saldanha Bay.
According to the World Bank, R&D investment grew to R22.2 billion ($1.7 billion) in 2012, maintaining South Africa’s R&D spending at 0.7% of total GDP (“Gross Spending on R&D”, 2017). The South African government’s National Development Plan (NDP) promises an increased R&D spending of 1.5% of GDP by 2019 (Manuel, T., et al., 2011).
The South African information and communication technologies (ICT) sector is well-established, particularly in mobile software and electronic banking services (“ICT and Electronics”, 2013). South African companies are world leaders in prepayment, revenue management, and fraud prevention systems. The country also has the most developed telecommunications network in Africa, including advanced digital wireless and satellite communications.
South Africa has experienced an influx of entrepreneurship in the past ten years, leading to a wave of startups. However, this movement has been limited by the fact that buying power is still too low to support such a wide range of new businesses (“GEM 2015/2016 Global Report”, 2016). 2.2. PEST: Mozambique
Mozambique is one of two countries that we have identified as an ideal market
to expand Ecobuild internationally. Mozambique is in an ideal geographic location and is also a member of the SADC, reducing both physical and intangible barriers to international business. Its economy is growing quickly, with an annual GDP growth rate of 6.6% in 2015 (Figure 7). There is also a rapid urbanization rate; 80.3% of the population currently lives in slums, accounting for over 20 million people, which makes affordable housing a main priority for the government.
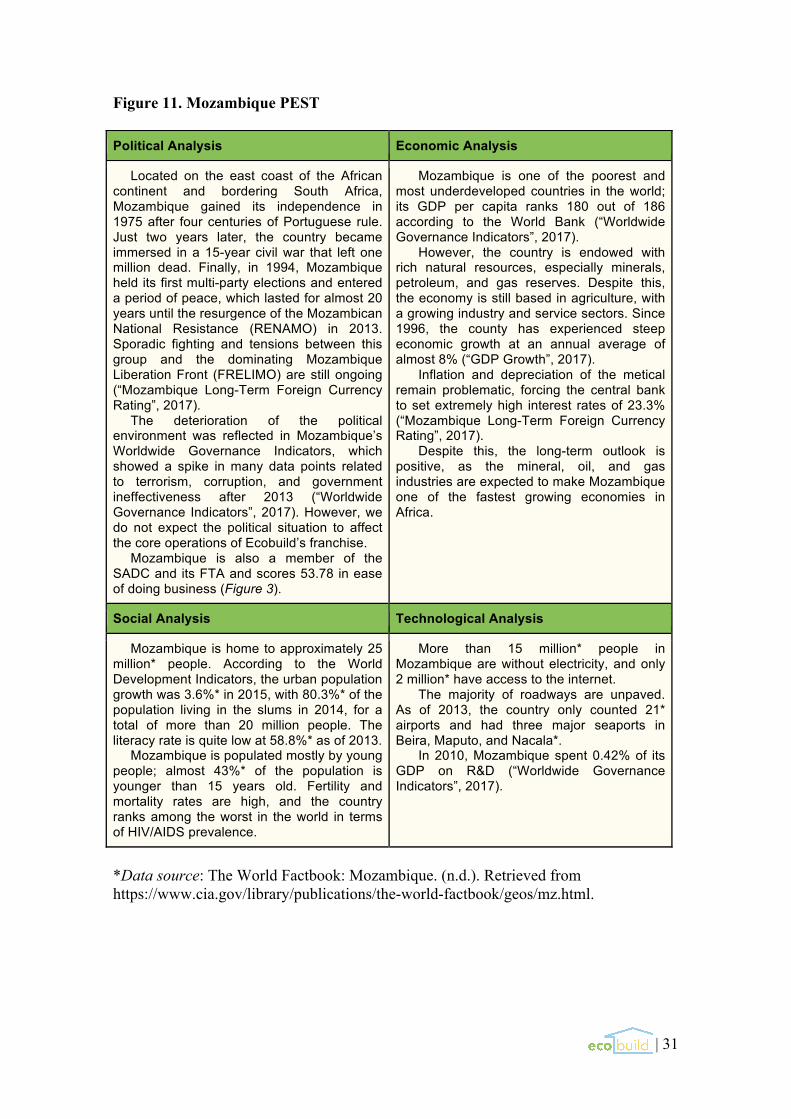
For a complete PEST analysis of Mozambique, please see Figure 11.
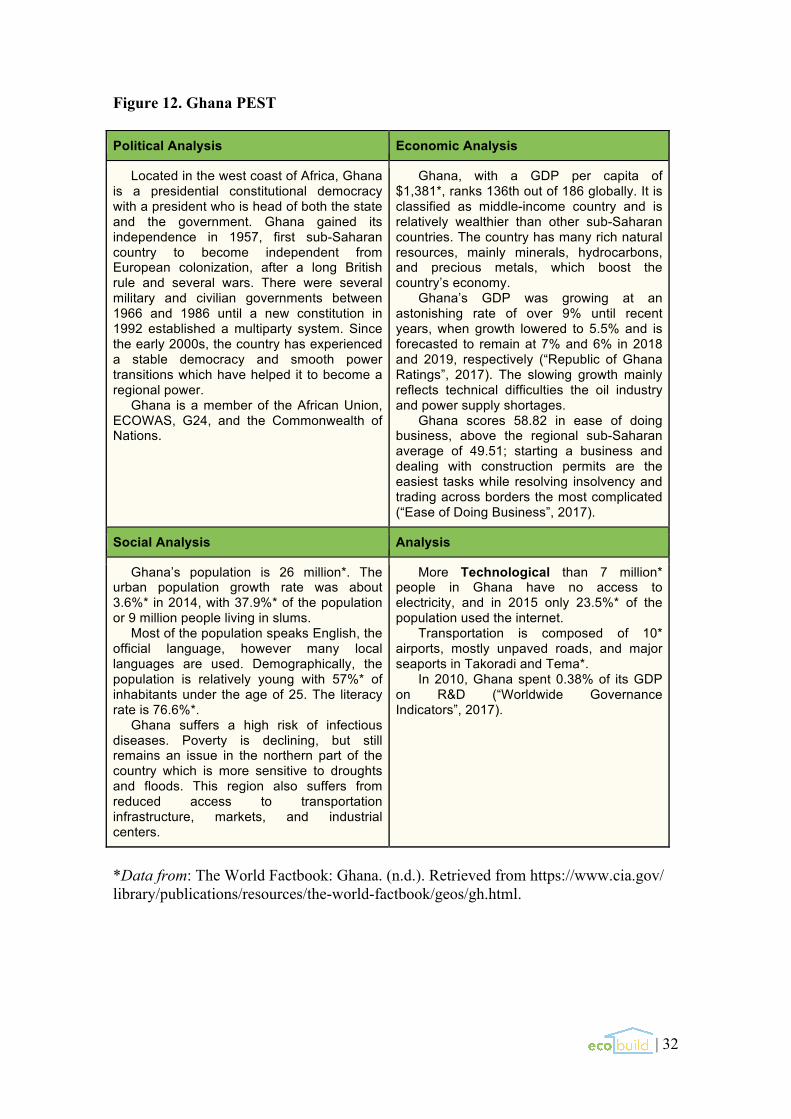
2.3. PEST: Ghana Ghana is the second country that we have chosen to target for international expansion. Although not a member of the SADC, which will increase some barriers to international business, Ghana is experiencing an elongated period of political stability that has helped it become a regional power in western Africa. Economically, the country is wealthier than its sub-Saharan neighbors; its GDP was $37.54 billion in 2015 with a GDP per capita of $1,696.64 (“Ghana GDP”, 2017), and its economy grew at a healthy level of 3.9% (“GDP Growth”, 2017). In terms of market size, there are more than 9 million people living in slums, representing 37.9% of the total population of the country (“Worldwide Governance Indicators”, 2017). There is also a major materials sourcing opportunity in Ghana, as only 11% of the population currently has their garbage collected, causing widespread waste dumping and pollution (Achankeng, 2003).
| 6
For a complete PEST analysis of Ghana, please see Figure 12. 2.4. Market Research Ecobuild’s initial target market will be the affordable housing sector in South Africa. Since minimal data exists on this specific segment, the market research portion of this report will be divided into three parts: first, the general construction market in South Africa; second, the affordable housing segment in Africa as a whole; and finally, public housing within South Africa. Ecobuild’s market lies at the intersection of these three segments. 2.4.1. Construction Market, South Africa
The construction sector is a key contributor to economic growth across Africa. However, all areas of the continent except northern and western Africa have experienced slowing growth in this sector since 2015. Despite this, southern Africa still holds a third of all projects on the continent with an estimated annual value of $93.4 billion (Figure 13). The construction sector is a significant contributor to employment and economic growth in South Africa, composing about 3.9% of the national GDP (“Key Trends”, 2017). However, the sector has slumped following the completion of the 2010 World Cup projects, which were accompanied by strikes and labor union protests and caused delays on a significant number of unrelated projects across the country. The South African government, through its NDP, has made an official commitment to a public infrastructure investment of R810 billion ($61 billion) over the next few years, which remains a positive forecast for the sector (Manuel et al., 2011). A report by Timetric reveals that the construction industry in South Africa is projected to expand at a compound annual growth rate (CAGR) of 2.62% from 2016 to 2020, which is a slight improvement over the CAGR of 2.33% recorded between 2011 and 2015 (“Construction in South Africa”, 2016). The report also mentions that the government’s investment in other sectors, such as housing and energy, and the modernization of infrastructure will have a positive impact on the construction industry. More interesting for our business is that major public investments in educational infrastructure and affordable housing have been announced, with the government promising to allocate R8.3 billion ($767.8 million) to the construction of educational buildings by 2023 (“Growth in South Africa’s Construction Industry”, 2016). The government also aims to construct 1.5 million houses by 2019 to address the country’s housing deficit (Khumalo, 2016). Private domestic investment and international DFIs should also be taken into consideration, as they supply approximately 28% of total construction funding on the African continent (Figure 14), with projects funded by foreign countries such as China, the UK, and France having the most significance (Labuschagne, J. P., et al., 2016).
In general, expectations are for South Africa’s construction industry to expand over the forecast period (2016–2020), supported by major investments in infrastructure, affordable housing, and energy projects. Of course, there are still certain risks associated with doing business South Africa’s construction industry, most notably labor union strikes, power crises, high unemployment, and a weak currency.
| 7
2.4.2. Affordable Housing Segment, Africa
Demand for low-income houses is increasing across Africa due to rapid urbanization. The total number urban residents on the continent is predicted to reach 1.2 billion by 2050, with an average of 4.5 million people expected to relocate to informal settlements each year (Parby et al., 2015). The UN estimates that 200 million people in Africa will live in slums by 2020 (“World Urbanization Prospects”, 2014).
According to Parby et al., many families in Africa cannot afford basic formal housing and have no access to mortgage loans; when they do, mortgages take approximately 50 years to pay off (2015). The reason for this is that “incomes in sub-Saharan Africa have not kept pace with urbanization” (p. 1). In fact, in the majority of these countries, the price of the cheapest home greatly exceeds the GNI per capita (Figure 15). The report by Parby et al. also refers to the cost of building materials as a contributor to the affordability gap, stating that “the cost and availability of quality construction materials are a major impediment to reducing the cost of all types of housing” (p. 11). This creates an opportunity for Ecobuild, as the recycled plastic used to make the company’s houses are much cheaper and more abundant than the building materials that are currently available.
2.4.3. Public Housing Segment, South Africa
The South African government, supported by the Department of Human Settlements (DHS), is committed to the NDP’s mission of “transforming human settlements and the spatial economy to create more functionally integrated, balanced and vibrant urban settlements” (Tibane, 2016, p. 120). As mentioned in section 2.4.1., the DHS’s goal is to build 1.5 million public housing units by 2019. Some of these units have been specifically earmarked for those affected by “gap housing”, the term introduced in section 1.1. of this report. In South Africa, the gap housing population is defined as urban households that earn between R3,500 ($263.68) and R15,000 ($1,130.08) per month; the DHS initiative is expected to provide this group with 17,333 gap housing units in 2018 and an additional 27,000 units by 2019 (“Housing”, 2017). Ecobuild plans to take advantage of these initiatives by aggressively pursuing gap housing contracts. In fact, we anticipate the South African government to be Ecobuild’s main client.
There are a few existing social housing projects that exemplify the type of gap housing contracts Ecobuild intends to pursue. To name one, the Marikana Housing Project is a R700 million ($52.7 million) project located in Rustenburg, South Africa. The site opened in January 2016 as part of government’s plan to relieve worsening conditions in poor mining communities. At its opening date, the project contained 544 units with an additional 2,000 units scheduled for future completion (“Housing”, 2017).
| 8
3. Internal Analysis 3.1. SWOT Strengths Weaknesses
- Unique and differentiated product - Economically, environmentally, and
socially responsible (strong CSR values)
- Innovative process & market pioneer - Easy production and assembly process - Low resources needed and abundance
of raw material - Simplified supply chain - Positive impact on local communities
- Large initial investment required (machinery)
- Relatively easy to replicate - Complexity of the distribution network:
suppliers, clients, public institutions, end consumers
- Supply and demand variability - New company; no brand awareness - Reliance upon market acceptance of a
new concept
Opportunities Threats
- Cheaper and more abundant than existing products in the market
- Quick growth via industrial franchising model
- Translatable to new markets - New trend; new way of doing things - Plenty of room for product development - Collaboration with NGOs and other
organizations - Possible vertical integration (short
term) and/or horizontal integration (long term)
- Potential supply shortage due to sourcing difficulty
- Ease of acquiring funding subject to economic situation
- Direct and indirect competition - Franchises could evolve into future
direct competition - Local community response is uncertain - Government could fall behind on public
housing build schedule - Legal framework and regulation
changes
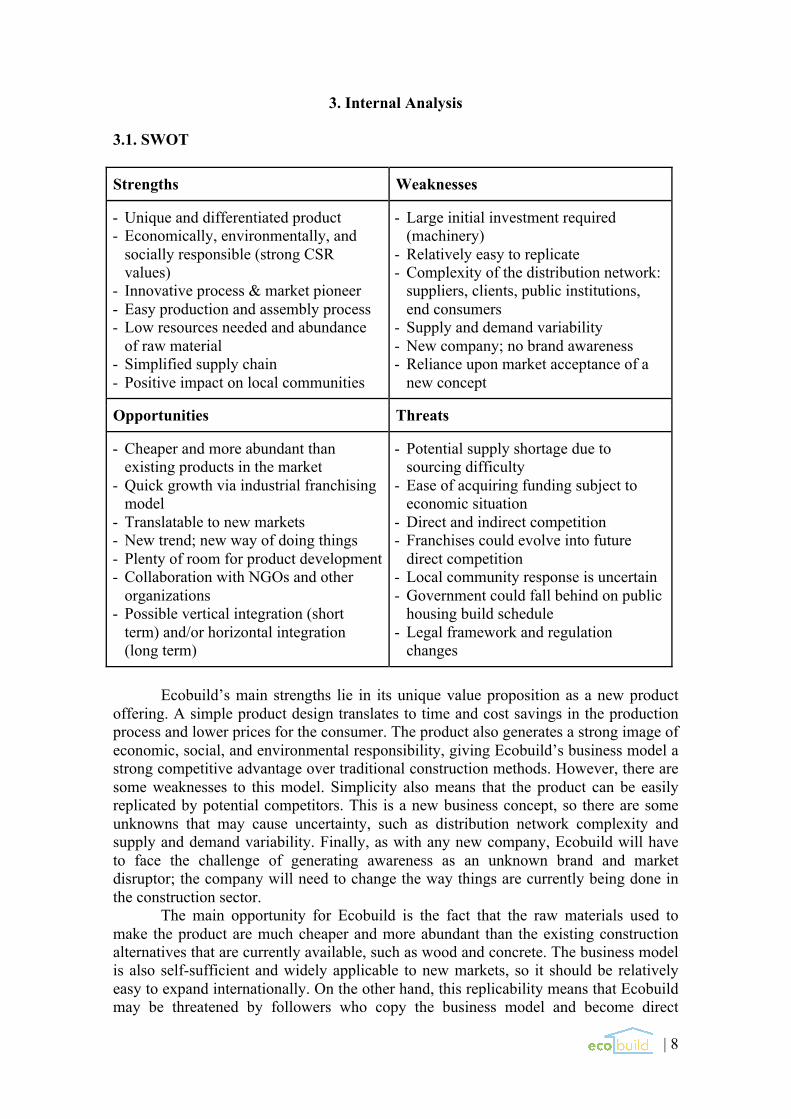
Ecobuild’s main strengths lie in its unique value proposition as a new product
offering. A simple product design translates to time and cost savings in the production process and lower prices for the consumer. The product also generates a strong image of economic, social, and environmental responsibility, giving Ecobuild’s business model a strong competitive advantage over traditional construction methods. However, there are some weaknesses to this model. Simplicity also means that the product can be easily replicated by potential competitors. This is a new business concept, so there are some unknowns that may cause uncertainty, such as distribution network complexity and supply and demand variability. Finally, as with any new company, Ecobuild will have to face the challenge of generating awareness as an unknown brand and market disruptor; the company will need to change the way things are currently being done in the construction sector.
The main opportunity for Ecobuild is the fact that the raw materials used to make the product are much cheaper and more abundant than the existing construction alternatives that are currently available, such as wood and concrete. The business model is also self-sufficient and widely applicable to new markets, so it should be relatively easy to expand internationally. On the other hand, this replicability means that Ecobuild may be threatened by followers who copy the business model and become direct
| 9
competitor. The company could also face major challenges due to unforeseeable external forces such as economic or political changes. 3.2. Stakeholder Analysis
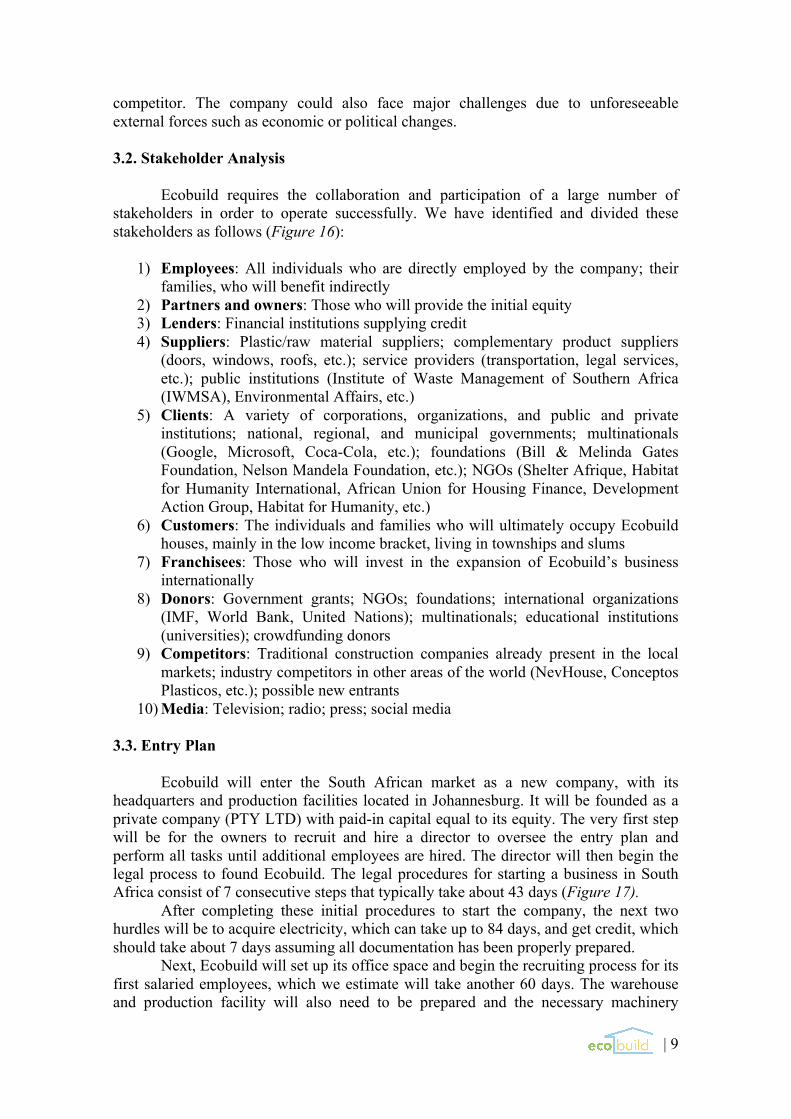
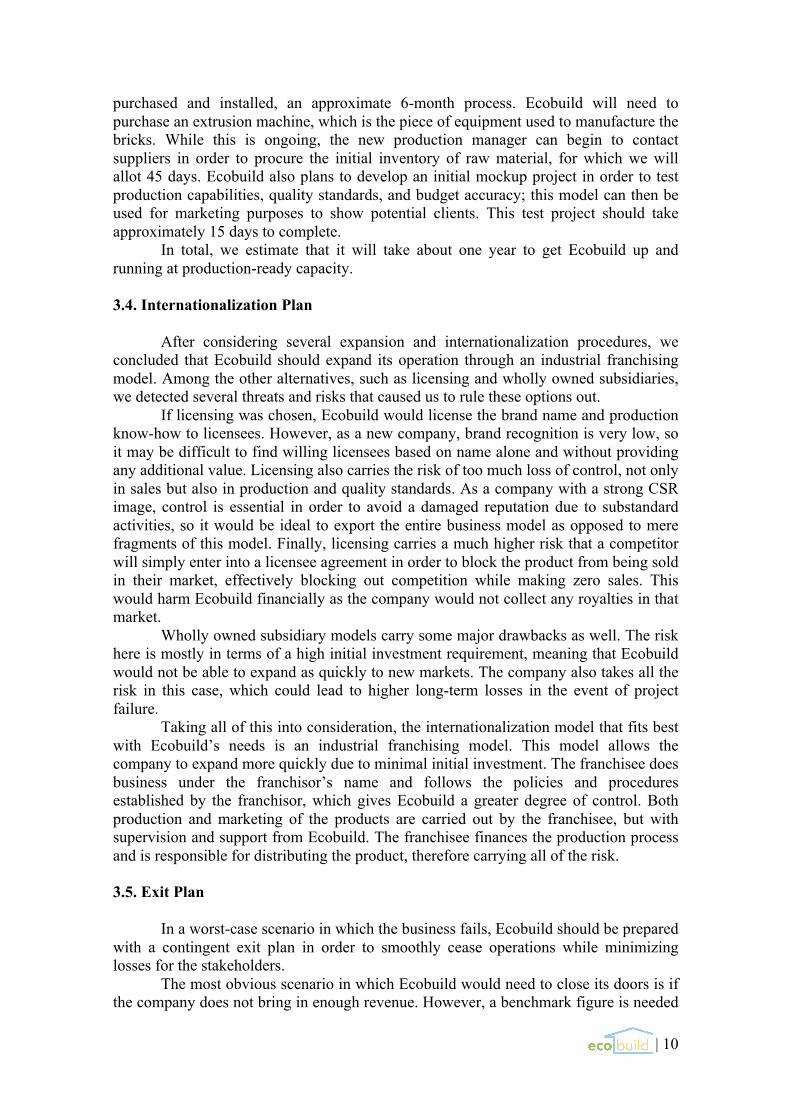
Ecobuild requires the collaboration and participation of a large number of stakeholders in order to operate successfully. We have identified and divided these stakeholders as follows (Figure 16):
1) Employees: All individuals who are directly employed by the company; their
families, who will benefit indirectly 2) Partners and owners: Those who will provide the initial equity 3) Lenders: Financial institutions supplying credit 4) Suppliers: Plastic/raw material suppliers; complementary product suppliers
(doors, windows, roofs, etc.); service providers (transportation, legal services, etc.); public institutions (Institute of Waste Management of Southern Africa (IWMSA), Environmental Affairs, etc.)
5) Clients: A variety of corporations, organizations, and public and private institutions; national, regional, and municipal governments; multinationals (Google, Microsoft, Coca-Cola, etc.); foundations (Bill & Melinda Gates Foundation, Nelson Mandela Foundation, etc.); NGOs (Shelter Afrique, Habitat for Humanity International, African Union for Housing Finance, Development Action Group, Habitat for Humanity, etc.)
6) Customers: The individuals and families who will ultimately occupy Ecobuild houses, mainly in the low income bracket, living in townships and slums
7) Franchisees: Those who will invest in the expansion of Ecobuild’s business internationally
8) Donors: Government grants; NGOs; foundations; international organizations (IMF, World Bank, United Nations); multinationals; educational institutions (universities); crowdfunding donors
9) Competitors: Traditional construction companies already present in the local markets; industry competitors in other areas of the world (NevHouse, Conceptos Plasticos, etc.); possible new entrants
10) Media: Television; radio; press; social media 3.3. Entry Plan Ecobuild will enter the South African market as a new company, with its headquarters and production facilities located in Johannesburg. It will be founded as a private company (PTY LTD) with paid-in capital equal to its equity. The very first step will be for the owners to recruit and hire a director to oversee the entry plan and perform all tasks until additional employees are hired. The director will then begin the legal process to found Ecobuild. The legal procedures for starting a business in South Africa consist of 7 consecutive steps that typically take about 43 days (Figure 17). After completing these initial procedures to start the company, the next two hurdles will be to acquire electricity, which can take up to 84 days, and get credit, which should take about 7 days assuming all documentation has been properly prepared. Next, Ecobuild will set up its office space and begin the recruiting process for its first salaried employees, which we estimate will take another 60 days. The warehouse and production facility will also need to be prepared and the necessary machinery
| 10
purchased and installed, an approximate 6-month process. Ecobuild will need to purchase an extrusion machine, which is the piece of equipment used to manufacture the bricks. While this is ongoing, the new production manager can begin to contact suppliers in order to procure the initial inventory of raw material, for which we will allot 45 days. Ecobuild also plans to develop an initial mockup project in order to test production capabilities, quality standards, and budget accuracy; this model can then be used for marketing purposes to show potential clients. This test project should take approximately 15 days to complete. In total, we estimate that it will take about one year to get Ecobuild up and running at production-ready capacity. 3.4. Internationalization Plan
After considering several expansion and internationalization procedures, we concluded that Ecobuild should expand its operation through an industrial franchising model. Among the other alternatives, such as licensing and wholly owned subsidiaries, we detected several threats and risks that caused us to rule these options out.
If licensing was chosen, Ecobuild would license the brand name and production know-how to licensees. However, as a new company, brand recognition is very low, so it may be difficult to find willing licensees based on name alone and without providing any additional value. Licensing also carries the risk of too much loss of control, not only in sales but also in production and quality standards. As a company with a strong CSR image, control is essential in order to avoid a damaged reputation due to substandard activities, so it would be ideal to export the entire business model as opposed to mere fragments of this model. Finally, licensing carries a much higher risk that a competitor will simply enter into a licensee agreement in order to block the product from being sold in their market, effectively blocking out competition while making zero sales. This would harm Ecobuild financially as the company would not collect any royalties in that market.
Wholly owned subsidiary models carry some major drawbacks as well. The risk here is mostly in terms of a high initial investment requirement, meaning that Ecobuild would not be able to expand as quickly to new markets. The company also takes all the risk in this case, which could lead to higher long-term losses in the event of project failure.
Taking all of this into consideration, the internationalization model that fits best with Ecobuild’s needs is an industrial franchising model. This model allows the company to expand more quickly due to minimal initial investment. The franchisee does business under the franchisor’s name and follows the policies and procedures established by the franchisor, which gives Ecobuild a greater degree of control. Both production and marketing of the products are carried out by the franchisee, but with supervision and support from Ecobuild. The franchisee finances the production process and is responsible for distributing the product, therefore carrying all of the risk. 3.5. Exit Plan
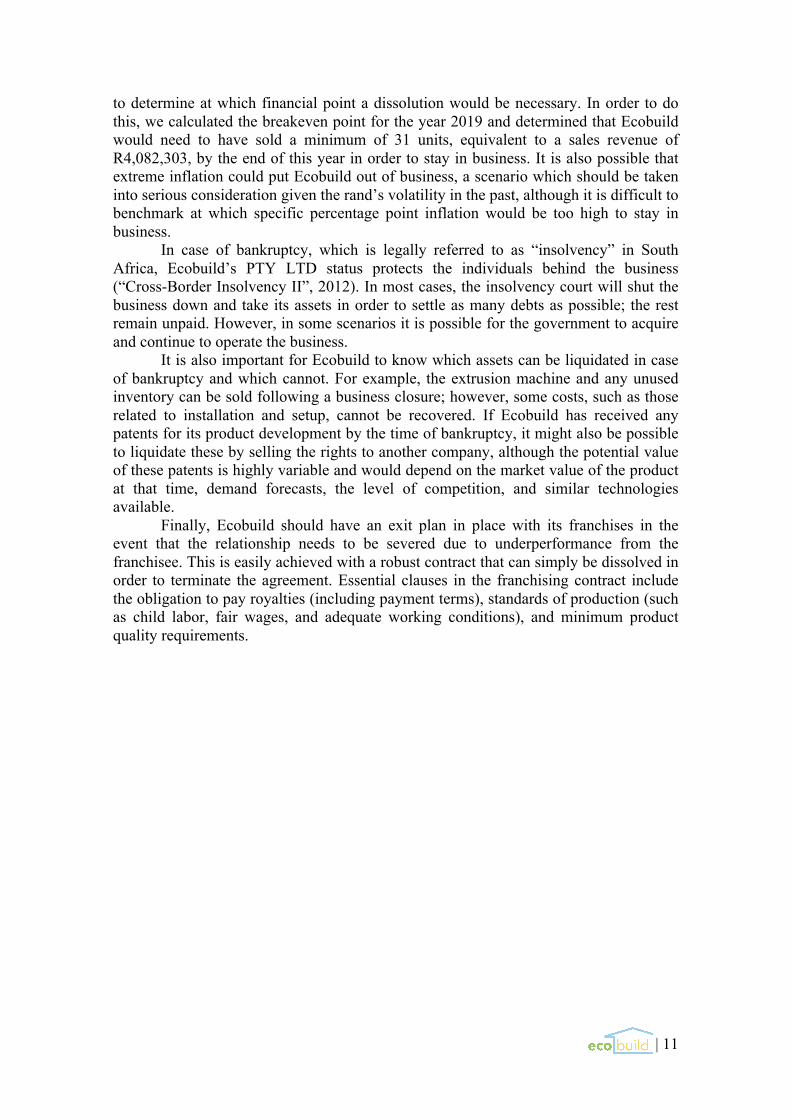
In a worst-case scenario in which the business fails, Ecobuild should be prepared with a contingent exit plan in order to smoothly cease operations while minimizing losses for the stakeholders.
The most obvious scenario in which Ecobuild would need to close its doors is if the company does not bring in enough revenue. However, a benchmark figure is needed
| 11
to determine at which financial point a dissolution would be necessary. In order to do this, we calculated the breakeven point for the year 2019 and determined that Ecobuild would need to have sold a minimum of 31 units, equivalent to a sales revenue of R4,082,303, by the end of this year in order to stay in business. It is also possible that extreme inflation could put Ecobuild out of business, a scenario which should be taken into serious consideration given the rand’s volatility in the past, although it is difficult to benchmark at which specific percentage point inflation would be too high to stay in business. In case of bankruptcy, which is legally referred to as “insolvency” in South Africa, Ecobuild’s PTY LTD status protects the individuals behind the business (“Cross-Border Insolvency II”, 2012). In most cases, the insolvency court will shut the business down and take its assets in order to settle as many debts as possible; the rest remain unpaid. However, in some scenarios it is possible for the government to acquire and continue to operate the business. It is also important for Ecobuild to know which assets can be liquidated in case of bankruptcy and which cannot. For example, the extrusion machine and any unused inventory can be sold following a business closure; however, some costs, such as those related to installation and setup, cannot be recovered. If Ecobuild has received any patents for its product development by the time of bankruptcy, it might also be possible to liquidate these by selling the rights to another company, although the potential value of these patents is highly variable and would depend on the market value of the product at that time, demand forecasts, the level of competition, and similar technologies available. Finally, Ecobuild should have an exit plan in place with its franchises in the event that the relationship needs to be severed due to underperformance from the franchisee. This is easily achieved with a robust contract that can simply be dissolved in order to terminate the agreement. Essential clauses in the franchising contract include the obligation to pay royalties (including payment terms), standards of production (such as child labor, fair wages, and adequate working conditions), and minimum product quality requirements.
| 12
4. Marketing 4.1. Market Definition & Quantification
As previously outlined, Ecobuild’s target market is the gap housing population
in South Africa; in section 2.4.3., we quantified this population as urban households making between R3,500 ($263.68) and R15,000 ($1,130.08) per month. According to a study by the CAHF, there are approximately 4,950,000 urban households in South Africa that fall into this bracket, accounting for 47.6% of the total urban population (Ramparsad, 2016).
4.2. Clients vs. Consumers
Ecobuild is a B2B marketing project at its core. However, in nearly every case, the organizations which contract Ecobuild will never directly use the product; for example, housing projects commissioned by the government will eventually be occupied by third party individuals and families. Ecobuild’s direct clients will be both public and private institutions, such as local governments and departments, NGOs, multinationals, and private foundations. The indirect consumers, who are also the end users, will be those who reside in the housing units. It is essential to keep the difference between these two groups in mind when evaluating Ecobuild’s marketing plan. 4.3. Segmentation
At the highest level, Ecobuild’s clients will be divided into the public sector and private sector. In the public sector will be public housing projects, where Ecobuild believes it will find the majority of its business. The private sector is categorized into for-profit and nonprofit institutions, which has already been further expanded upon in section 3.2. Finally, as discussed in section 4.2., these segments all converge at the end with the end consumer who occupies the completed Ecobuild house. 4.4. Competition
Although similar companies exist elsewhere in the world, there are not currently any competitors that both 1) are located in the markets we intend to enter and 2) create houses from bricks made out of recycled plastic. Despite this, Ecobuild will face direct and indirect competition from a variety of sources.
Direct competition will come from traditional construction companies located in our geographical area. These companies will have significant advantages over Ecobuild in terms of historical market dominance and brand recognition. The main challenge with this type of competition will be to convince consumers to switch from traditional methods to new construction methods.
Indirect competition, on the other hand, will come from companies that use the same technology in other markets. Two of these competitors are Conceptos Plasticos, located in Colombia, and NevHouse, which is based in Australia. Conceptos Plasticos was founded in 2010 and has not yet operated outside of Colombia. However, the company is growing and plans to enter the Asian market in the next few years. NevHouse has already completed some internationalization and currently operates in Vanuatu, Indonesia, Papua New Guinea, and the Philippines. Ecobuild should keep in mind that these companies could choose to enter the southern African market at any
| 13
time and become direct competition. In addition to these existing competitors, there is also the possible threat of new entrants to the market. Ecobuild’s business model is relatively simple to replicate, creating potential opportunities for followers. There is also the possibility that Ecobuild’s own franchisees could become competitors. The best way to offset these potential risks will be through constant product development and improvements to the existing product offering. 4.5. Marketing Mix 4.5.1. Product Ecobuild uses an existing manufacturing process to turn recycled plastic waste into bricks. This is the only product that Ecobuild will produce directly; a small number of materials (such as base concrete, roofing, and doors and windows) will be purchased from suppliers. The result is an extremely simplified, non-customizable product line which is easy to manage and inexpensive to produce. The finished housing brick is shaped similarly to a toy LEGO; bricks are stacked on top of each other and fitted together without the need for any type of glue or special tools (Figure 18). Special corner bricks help create the frame for the structure and fit perpendicular walls together (Figure 19). 4.5.1.1. Production Process
To produce its bricks, Ecobuild will use only safe and non-hazardous plastic types: type 2 HDPE (High Density Polyethylene), type 4 LDPE (Low Density Polyethylene), and type 5 PP (Polypropylene). Ecobuild will not under any circumstances use plastic types 1, 3, 6, or 7, which can contain phthalates, DEHA, and BPA, all hazardous chemicals that are not suitable for long-term exposure (Figure 20). Our suppliers will need to verify the type and quality of raw material for every batch delivered.
Suppliers will deliver the raw material to Ecobuild in the form of pellets which has been already been cut, washed, dried, densified, extruded, and finally pelletized and bagged (Haig, Morrish, Morton, and Wilkinson, 2012). These pellets are added to the extrusion machine, heated, and molded into Ecobuild’s standard brick size (Figure 21). 4.5.1.2. Product Development
Ecobuild plans to produce non-customizable, standardized brick sizes in order to reach economies of scale and offer an even more affordable product. However, the company is also committed to increasing quality and creating value-added products. To this effect, we plan to invest around 6% per year in R&D.
The first development that Ecobuild plans to implement is the use of fire retardants in the production mix. The goal would be to create a plastic brick with an extremely low combustion rate or auto-extinguisher. Fire retardants can also be used to reduce smoke and prevent the emission of hazardous substances in case of a fire. We expect this to be a major selling point for the product due to the prevalence of house fires in low-income housing. In South Africa alone, there are an average of ten “shack fires” per day, resulting in approximately one death every two days (Birkinshaw, 2008).
For further R&D projects, Ecobuild also plans to develop specialized brick
| 14
modules with built-in features such as electrical installations and sewage collection through collaboration with third party companies. We believe that these types of add-ons will increase value perception of the brand.
The other reason for this emphasis on product development is patentability. Since Ecobuild’s technology is already patented elsewhere in the world, while we are able to use this technology in Africa without fear of repercussions, we may have difficulty patenting the technology ourselves and therefore protecting Ecobuild’s status as the sole provider of this product in our target markets. However, should Ecobuild develop proprietary improvements to the existing product, these new technologies would be patentable. This will be the best way to solidify our position in the market and protect ourselves from future competition. 4.5.2. Price In order to determine the price of an Ecobuild house, we had to take several variable and fixed costs into consideration. To build one unit, we must spend R53,968.08 ($4,065.87) on materials and R40,620.95 ($3,060.32) on labor. Additional fixed costs include salaries, marketing, sales, transportation, and rent. When all is said and done, we have decided to price each standard Ecobuild unit at R132,734.44 ($10,000.00). Obviously, this does not include the cost of the land, or any appliances or furnishings. We should also note that these are the costs and prices for 2019, and will increase each year due to inflation.
In comparison, according to the CAHF, the cost of the least expensive new house in South Africa in 2016 was R268,428 ($23,962) (Figure 22). Only 35.8% of the urban population was able to afford this house (Ramparsad, 2016). Using this same research, we estimate that just under 65% of the urban population will be able to self-finance an Ecobuild house, without even taking into consideration additional funding sources such as donations, grants, and government assistance programs.
For our internationalization plan, we should note that the CAHF study shows huge opportunities in these target markets as well. In Mozambique, the lowest price for a new housing unit is $63,000, which is affordable to just 0.2% of the population (Figure 23). In Ghana, the price is $20,223, affordable to only 4.3% of the population (Figure 24).
Ecobuild will also consider projects that do not fall under the scope of standard houses (such as small commercial buildings and schools), and the prices of these projects will need to be determined on a case-by-case basis depending on square footage, location, and complexity. 4.5.3. Placement Ecobuild will hire a salaried marketing and sales manager to sell its product domestically directly to the clients outlined in sections 3.2. and 4.2. When expanding internationally, Ecobuild’s franchisees will be responsible for the direct sale of their own products to the clients in those markets. 4.5.4. Promotion Ecobuild believes that content marketing will be its strongest promotional outlet and intends to allocate the bulk of its marketing efforts to this channel. Ecobuild’s indirect competitor, Conceptos Plasticos, has been quite successful using content
| 15
marketing to build global awareness and attract attention to the company’s innovations. This includes articles in magazines and newspapers and video content for TV stations and online video channels. These articles will help give Ecobuild credibility and differentiate the company from its direct competitors in the South African traditional construction market. Personal selling and direct marketing will be the methods used to reach Ecobuild’s direct clients, the public and private organizations with which Ecobuild will need to secure contracts. It will be more difficult and highly ineffective to identify and reach these organizations through mass marketing methods, so Ecobuild will need to make contact directly through emails, phone calls, and personal introductions at trade shows and conventions. The goal of these interactions will be to prove why doing business with Ecobuild is preferential to contracting traditional construction companies, for the reasons outlined in section 1.2. Ecobuild will also allocate small amounts of the budget to public relations, advertising, and social media. These methods will be slightly less effective for the company’s business model of low volume, high value accounts, however Ecobuild does not wish to ignore them entirely and will focus especially on building a positive social media presence. 4.6. Budget
Ecobuild will allocate around 15% of its total annual revenue to marketing, with each channel analyzed by its frequency and priority. This 15% will be subdivided as follows:
Channel Frequency Priority (term) % of budget
Social media Daily Short 10%
Direct marketing Daily Short 20%
Personal selling Daily Short & medium 15%
Public relations Monthly Medium & long 5%
Content marketing Occasional Medium & long 40%
Advertising Occasional Long 10%
| 16
5. Logistics 5.1. Supply Chain Structure
Ecobuild’s supply chain is composed of four steps (Figure 25). First, raw material is sourced from waste collection agencies. Second, the unprocessed material is stored in Ecobuild’s warehouse. Third, the production process occurs, and the raw material is manufactured into bricks in-house on Ecobuild’s own extrusion machine. Fourth, the completed bricks are transported to the final project site for assembly and project completion.
The supply chain will operate under a push-pull strategy. The push will occur from sourcing to storage, as we anticipate some difficulty sourcing raw materials adequately and efficiently, especially during the first years. The pull will come from assembly backwards to production, drawing from the raw material inventory in storage. This strategy allows the manufacturing process to occur on an as-needed, per-project basis, while keeping the required completion time for each project controllable and at a minimum. Since completed bricks will be transported directly to project sites, Ecobuild will not need to maintain the resources required to store this type of inventory.
This strategy provides many advantages. First, Ecobuild maintains full control over the production process, ensuring consistent quality. Second, the production process is flexible enough to respond to demand variability without unreasonable project lead times. Finally, costs associated with storing inventory are kept to a minimum. 5.2. Location Theory & Network Design
As a company that claims social and environmental responsibility, it is essential for Ecobuild to minimize the environmental impact of its operations. Therefore, the location of the company’s production facilities and the selection of transportation modes are crucial. In order to determine the most effective strategy to minimize both costs and environmental impact, we have developed a center of gravity model that analyzes population density and geographic location to identify the ideal location of our production center (Figure 26). By using urban centers as benchmarks, we are also able to ensure proximity to sources of raw material; according to a study by the University of Adelaide, South Africa shows “a positive correlation between city population size and both the percentage of waste moved and rate of households enjoying regular waste collection” (Achankeng, 2003).
The outcome of our gravity model analysis ruled out Cape Town and Durban as candidates; Johannesburg, Rustenburg, and Pretoria scored nearly identically, likely due to their close geographical proximities to one another. Of these three, we chose Johannesburg as the final location for several reasons. First, it has the largest population, which Achankeng’s claim allows us to assume also means that it has a more abundant supply of plastic waste. The city center is surrounded by several industrial townships, which creates opportunities to acquire warehouse space, transportation, and machinery (“Top Industrial Locations”, 2014). Many of Ecobuild’s potential suppliers and clients are located in the Johannesburg area, which will reduce costs and environmental impact, and neighboring Pretoria is an administrative hub. Finally, Johannesburg is a major junction for road transportation, with easy access to the major highways that lead to other metropolitan areas and ports (Figure 27).
| 17
5.3. Aggregate Planning For its aggregate planning strategy, Ecobuild will use a chase strategy, meaning that output is constantly adjusted to match demand. In section 5.1., we explained how our push-pull supply chain structure supports this strategy; here, we will outline the complementary variable labor plan. It takes one foreman and four workers six days to build one Ecobuild housing unit (Figure 28). Due to the short-term nature of the construction labor market and the low skill level required to build an Ecobuild house, foremen can be hired per project and workers can be hired per day, with a salaried Project Manager in charge of oversight, coordination, and any necessary (albeit minimal) onsite training. Using this model, we can match the variable labor requirement on a per-project basis with no added time or cost requirement. When no projects are scheduled, Ecobuild simply does not hire any workers for that day. 5.4. Transportation
As explained in section 5.2., Ecobuild plans to minimize its carbon footprint by optimizing its logistics network and reducing road transportation to essential activities. This includes 1) the transportation of raw material from suppliers to our warehouse and 2) the transportation of produced bricks from our production facility to the project site.
The delivery of raw materials will be negotiated with our suppliers, where ideally the supplier is responsible for transporting the materials to our production facilities. However, when transporting manufactured bricks to project locations, Ecobuild will hire an independent certified driver with a truck to pick the bricks up from the production facility and deliver them onsite. This will be the most cost effective method until Ecobuild can achieve economies of scale, at which point the company might consider purchasing a truck and hiring a full-time driver.
5.5. Franchising Logistics According to Ecobuild’s franchising model, franchisees will be responsible for designing, planning, and executing their own logistics plan according to the conditions of that market. However, it is assumed that as agents of the Ecobuild brands, franchisees will incorporate the same core values into their logistics models. Namely, franchisees will be expected to choose environmentally and socially responsible production methods and transportation modes in order to reduce the overall carbon footprint of the company and to engage in fair labor practices. This will be enforced through the franchising contract, and failure to meet standards will result in contract termination.
| 18
6. Human Resources 6.1. Organization Ecobuild’s employees are divided into two types: corporate employees and project workers. The corporate structure is further categorized as follows (Figure 29):
1) Director: Oversees high-level activities; ensures conformity with core mission and goals; coordinates all subsequent departments; recruits and manages relationships with franchisees; fulfills core HR duties such as recruiting, payroll, and evaluations
2) Marketing & sales: Plans and executes marketing strategy; sells the product; analyzes trends; forecasts demand
3) Project management: Schedules projects; coordinates project logistics (transportation, labor, etc.); hires and oversees project workers; provides onsite training as needed; ensures adherence to safety standards
4) Manufacturing: Works with project management to produce bricks according to project schedule; runs extrusion machine; ensures proper function and maintenance of machine; places orders to suppliers according to demand forecast
5) Administrative assistant: Performs daily office tasks (mail, phone calls, ordering supplies, etc.); supports the director On the other hand, project workers are subdivided into two categories:
1) Foreman: Oversees each project site; directs workers; ensures safety compliance; hired on a per-day basis
2) Worker: Performs the physical labor required to complete each project; hired per-day basis
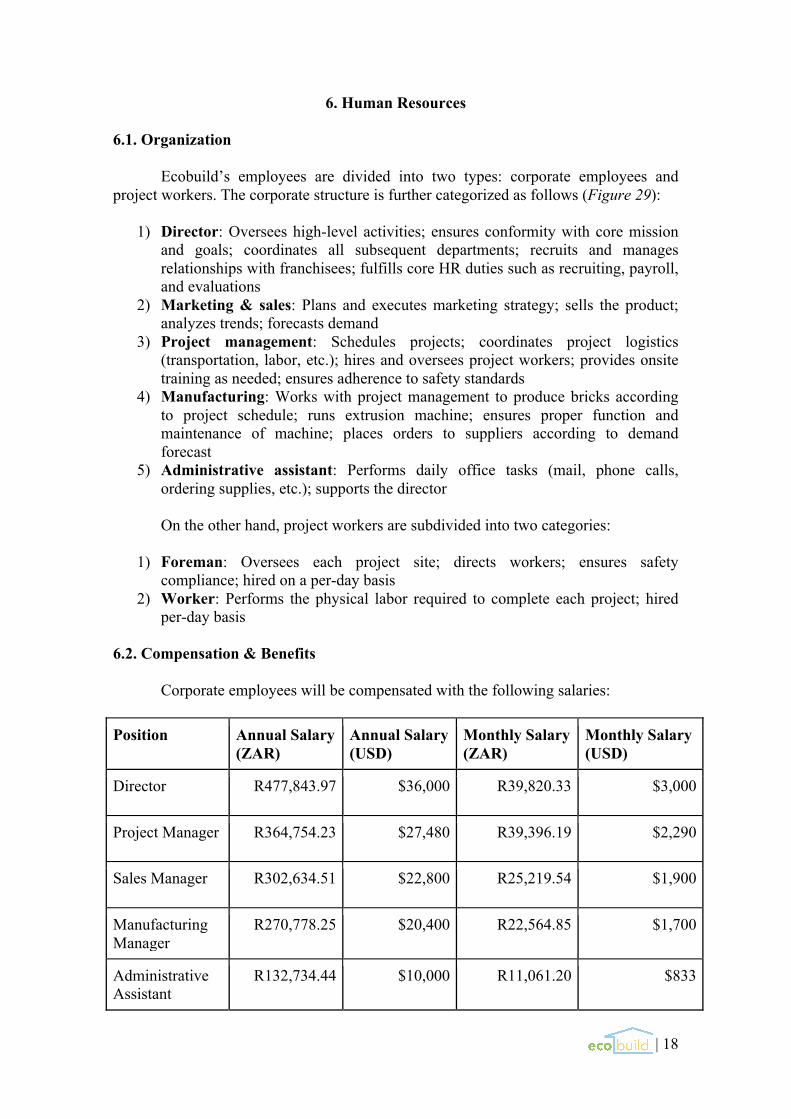
6.2. Compensation & Benefits
Corporate employees will be compensated with the following salaries:
Position Annual Salary (ZAR)
Annual Salary (USD)
Monthly Salary (ZAR)
Monthly Salary (USD)
Director R477,843.97 $36,000 R39,820.33 $3,000
Project Manager R364,754.23 $27,480 R39,396.19 $2,290
Sales Manager R302,634.51 $22,800 R25,219.54 $1,900
Manufacturing Manager
R270,778.25 $20,400 R22,564.85 $1,700
Administrative Assistant
R132,734.44 $10,000 R11,061.20 $833
| 19
These salaries are based on average salary distribution in South Africa for the
construction sector (“South African Salaries”, 2015). Benefits will include health care and 21 consecutive days of paid vacation per year in accordance with national laws (“Annual Leave and Holidays”, 2017).
On the other hand, workers and foremen will be paid on an hourly basis. Workers will be compensated R212.38 ($16) per day, which comes out to R26.55 ($2) per hour; foremen will receive R849.50 ($64) per day, or R106.19 ($8) per hour. Both will receive safety insurance, including worker’s compensation. A compa-ratio analysis demonstrates that these salaries are more than fair, considering that the average hourly salary for construction workers in South Africa is R15.93 ($1.20) per hour:
CR (compa-ratio) = AS (actual salary) / MP (midpoint of pay range) * 100 CR = $2 / $1.20 * 100
CR = 66.7% This shows that Ecobuild will pay 66.7% more than the average construction salary, a data point that we believe will attract a larger and better quality talent pool. 6.3. Safety While Ecobuild’s construction method is much safer than traditional building practices due to structural simplicity and the absence of heavy machinery, the company should still have a safety policy in place in order to prevent and minimize the effects of potential safety incidents. First, each worker must dress appropriately with the proper clothing and work boots. Second, the company will need to ensure that each project site has access to sanitary facilities, drinking water, a weather appropriate rest area, and PPE (personal protective equipment). Finally, the foreman will be responsible for maintaining safety standards at the project site, ensuring appropriate use of tools and equipment, and reporting any injuries or accidents that occur on the job. In the event of a workplace injury that leads to 3 or more days out of work, employees can claim from South Africa’s public worker’s compensation fund (“Compensation for Occupational Injuries and Diseases Act”, 1993). The project manager should perform periodic audits via random inspections to ensure adherence to these rules.
| 20
7. Financial Analysis 7.1. Funding
Ecobuild will need a total of R6,636,722 ($500,000) in initial funding to begin its operations. These funds will be collected from three main sources during the first year:
1) Paid-in capital: The owners and partners will contribute R3,318,361 ($250,000)
2) Long-term bank loan: The company will request R2,654,689 ($200,000) to be repaid in six years at an interest rate of 8%
3) External funding: Grants, donations, and crowdfunding totaling R663,672 ($50,000).
7.2. Sales Forecast
The sales forecast, including total revenue, has been calculated for 2018 through 2024 (Figure 30) and is computed based on the estimated number of projects multiplied by the value of each project for that year; we assume that no projects will be executed in the first year. The estimated number of projects has been forecasted based on our market research outlined in sections 2.4.3. and 4.1. Ecobuild targets to deliver a total of 490 houses by 2024, which represents just 1.1% of the 44,333 housing units scheduled for delivery by the DHS. We believe that this is a very conservative and achievable number of projects.
The annual revenue, with an average growth of 25%, will reach its highest point at R20,270,699 ($1,527,162) in 2024. Although this might seem like an impressive growth rate at first glance, approximately one fifth of its value can be accounted for by inflation. We also strongly believe that Ecobuild’s growth will be strictly limited by the supply of plastic as we optimize our supply chain and build relationships with suppliers. Therefore, we are staying extremely conservative in our early years, as we estimate that our productivity will be extremely low at first and will take some time to build up. 7.3. Costs Forecast The costs forecast is divided into three main parts: 1) materials costs forecast (Figure 31), 2) salaries forecast (Figure 32), and 3) other costs forecast (Figure 33).
The materials costs forecast includes all of the materials necessary to build one unit: raw plastic material, roofing, doors, windows, and concrete. The estimated cost per brick, R37.17 ($2.80), was benchmarked on real costs reported from similar companies in other parts of the world (Conceptos Plasticos and NevHouse). It should be noted that one Ecobuild brick is the size of four standard bricks, so fewer pieces are needed to build one unit.
The salaries forecast is broken down into variable and fixed salary costs. Workers and foremen are considered variable costs and calculated by project need, as we know that it takes one foreman and four workers six days to build one unit (Figure 24). Fixed salaries are outlined in section 6.2. of this report; these will be paid independently of the projects completed per year. Due to the planned international expansion in year three, the company will hire an additional project manager, sales & marketing manager, and an administrative assistant, which will increase the total fixed salaries to be paid substantially during this year.
| 21
Finally, other costs forecast includes all additional costs that the company needs in order to operate: rent of both the storage and production facility and a furnished office space, electricity, maintenance services, transportation, and all other expenditures needed that will increase progressively with the number of annual projects. 7.4. Income Statement The income statement (Figure 34) reflects all income from the sale of our units plus the royalties to be received from franchisees beginning in year three. Ecobuild has a healthy gross profit of between 50 and 60% thanks to the low cost of materials and an extremely efficient variable logistics network. Although the company does not become profitable until year four due to a high initial investment and no sales during the first year, profits begin at 1.3% of sales in 2021 and eventually increase to 7.6% by 2024. Salaries represent the biggest expense, with an all-time high of 29% in 2020. Some expenses increase with time, which we believe to be in line with Ecobuild’s growth plan. Others are maintained fairly consistently, for example, marketing & sales (15-16%) and R&D (5-6%). 7.5. Cash Flow Statement
The cash flow statement (Figure 35) allows us to measure Ecobuild’s cash requirement each year. We do not expect to generate a positive cash flow from operations until 2022 due to negative earnings for the first several years as well as a high working capital, which we expect to slowly reduce as the supply chain becomes more efficient and Ecobuild can work within a shorter cash cycle.
Ecobuild has a positive working capital as suppliers must be paid in 60 days, but accounts receivable will not be collected for 80 days. We have taken this cash cycle into consideration in building the cash flow statement and determining funding requirements and we are confident that Ecobuild will not have any liquidity issues.
In the first year, Ecobuild will invest in the extrusion machine needed for production at a cost of R865,429 ($65,200) which will be depreciated over six years. To finance this and acquire the necessary initial cash, we will also secure funding during the first year as outlined in section 7.1. This will allow the company to have a comfortable level of cash from year one. We anticipate a negative cash flow at first due to the repayment of long term debt and low initial net earnings; however, in 2023 cash levels will begin to increase again. 7.6. Currency Risk Analysis and Hedging Ecobuild will expand in its third year through an industrial franchising model, and we plan to have at least two franchisees: one in Mozambique and another in Ghana. Since we will be collecting royalties from these franchisees, we must evaluate the currency risk and consider hedging options in order to reduce this risk.
Ecobuild will receive a one-time initial payment from each franchisee of R199,102 ($15,000) which will cover training and other setup costs. In the following years, Ecobuild will receive royalties corresponding to 6% of the franchisee’s total annual sales. We have decided to use a money market hedge strategy in order to limit the potential exchange rate risk between the South African rand and the currencies of each franchisee, the Mozambique metical (MZN) (Figure 36) and the Ghanaian cedi (GHS) (Figure 37). Since there are no reliable interest rate forecasts for these
| 22
currencies, we have used current interest rate values to illustrate the money market hedge strategy.
In Mozambique (Figure 36), the borrowing rate on April 17th, 2017 was 21.75%. Ecobuild will invest in South Africa at 7%. The exchange rate of the Mozambican metical (MZN) against the South African rand (ZAR) is:
MT1 =R0.22 In order to know the amount of money to borrow, we need to calculate the present value. For example, in 2020:
PV = MT2,003,701 / (1 + 0.2175) = MT1,645,750
Then, we invest it in South Africa: MT1,645,750 * 0.22 = R362,065
And finally, we collect the money in South Africa: R362,065 * (1 + 0.07) = R387,410
In Ghana (Figure 37), the borrowing rate is 23.50% The exchange rate of Ghanaian Cedi (GHS) against the South African rand (ZAR) is:
GH¢1 = R3.18 We calculate the present value in 2020 as follows:
PV = GH¢143,320 / (1 + 0.2350) = GH¢116,048 Then, we invest it in South Africa
GH¢116,048 * 3.18 = R369,034 And finally, we collect:
R369,034 * (1 + 0.07) = R394,866
Another possible threat that Ecobuild could face is the volatility of its own currency (ZAR) due to external factors brought up in section 2.1.2. of this report. The solution in this extreme case could be to ask for royalty payments directly from franchisees in US dollars (USD).
| 23
8. Viability Analysis & Conclusion Ecobuild brings a disruptive innovation to the market and provides a solution to two major problems in sub-Saharan Africa: 1) the housing deficit and 2) the lack of an efficient waste management system. Based on the analysis provided in this report, we have concluded that the Ecobuild business plan is viable not only within South Africa, but through its expansion to markets across the entire region.
The three countries analyzed in this report, despite possessing certain sets of risks, show promising market opportunities and ideal economic situations for our business model, including rapid urbanization, growing populations within our target household income range, and strong commitments from national and regional governments to provide gap housing solutions in the coming years. Ecobuild plans to enter these markets with a product that is less expensive and easier to source than the options that are currently being provided by the market.
We have also identified the opportunity to improve the existing recycled brick technology through value-added product features such as fire retardants and the introduction of built-in electric and sewage modules. This ongoing product development, we believe, is the best way to protect Ecobuild from potential followers and competitors and to become a world leader in this specific technological sector.
From a financial standpoint, our analysis has demonstrated that Ecobuild will become profitable in its third year of business and generate healthy amounts of cash each year. Furthermore, we have shown that the company can be easily expanded through an industrial franchising model with very little investment required from Ecobuild. Although we have only analyzed the feasibility of expanding to two international markets in the context of this report, we believe the applicability of this model to be virtually limitless.
| 24
Appendix
Figure 1. SADC members
Source: SADC Overview. (n.d.). Retrieved from http://www.sadc.int/about-sadc/ overview/.
| 25
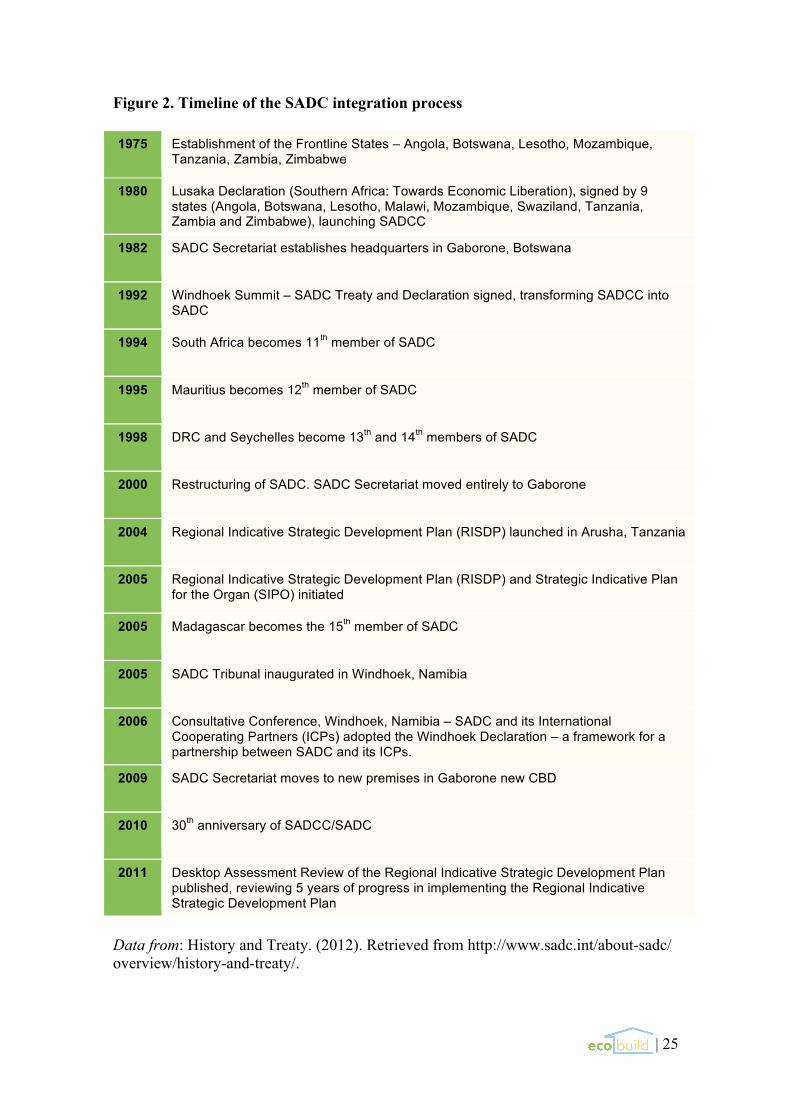
Figure 2. Timeline of the SADC integration process 1975 Establishment of the Frontline States – Angola, Botswana, Lesotho, Mozambique,
Tanzania, Zambia, Zimbabwe
1980 Lusaka Declaration (Southern Africa: Towards Economic Liberation), signed by 9 states (Angola, Botswana, Lesotho, Malawi, Mozambique, Swaziland, Tanzania, Zambia and Zimbabwe), launching SADCC
1982 SADC Secretariat establishes headquarters in Gaborone, Botswana
1992 Windhoek Summit – SADC Treaty and Declaration signed, transforming SADCC into SADC
1994 South Africa becomes 11th member of SADC
1995 Mauritius becomes 12th member of SADC
1998 DRC and Seychelles become 13th and 14th members of SADC
2000 Restructuring of SADC. SADC Secretariat moved entirely to Gaborone
2004 Regional Indicative Strategic Development Plan (RISDP) launched in Arusha, Tanzania
2005 Regional Indicative Strategic Development Plan (RISDP) and Strategic Indicative Plan for the Organ (SIPO) initiated
2005 Madagascar becomes the 15th member of SADC
2005 SADC Tribunal inaugurated in Windhoek, Namibia
2006 Consultative Conference, Windhoek, Namibia – SADC and its International Cooperating Partners (ICPs) adopted the Windhoek Declaration – a framework for a partnership between SADC and its ICPs.
2009 SADC Secretariat moves to new premises in Gaborone new CBD
2010 30th anniversary of SADCC/SADC
2011 Desktop Assessment Review of the Regional Indicative Strategic Development Plan published, reviewing 5 years of progress in implementing the Regional Indicative Strategic Development Plan
Data from: History and Treaty. (2012). Retrieved from http://www.sadc.int/about-sadc/ overview/history-and-treaty/.
| 26
Figure 3. Ease of doing business by distance to frontier, SADC
Note: “The distance to frontier score benchmarks economies with respect to regulatory practice, showing the absolute distance to the best performance in each Doing Business indicator. An economy’s distance to frontier score is indicated on a scale from 0 to 100, where 0 represents the worst performance and 100 the frontier.” (“Doing Business”, 2017, p. 7). Data from: Doing Business 2017: Southern African Development Community, p. 7. (2017). Retrieved from http://www.doingbusiness.org/reports/regional-reports.
37.57
38.41
45.10
47.10
53.78
54.39
54.48
55.54
58.34
58.82
60.37
60.54
61.21
65.20
65.55
72.27
0.00 100.00
Congo, Dem. Rep. (Rank 184)
Angola (Rank 182)
Madagascar (Rank 167)
Zimbabwe (Rank 161)
Mozambique (Rank 137)
Malawi (Rank 133)
Tanzania (Rank 132)
Regional Average (Rank 120)
Swaziland (Rank 111)
Namibia (Rank 108)
Lesotho (Rank 100)
Zambia (Rank 98)
Seychelles (Rank 93)
South Africa (Rank 74)
Botswana (Rank 71)
Mauritius (Rank 49)
Distance to frontier score
| 27
Figure 4. Doing Business scores by topic, South Africa
Note: An economy’s distance to frontier score is indicated on a scale from 0 to 100, where 0 represents the worst performance and 100 the best performance. Data from: “Ease of Doing Business in South Africa.” (2017). Retrieved from http://www.doingbusiness.org/~/media/wbg/doingbusiness/documents/profiles/country/zaf.pdf Figure 5. SADC member state GDPs ($)
Data from: GDP: Africa. (2017). Retrieved from https://tradingeconomics.com/country- list/gdp?continent=africa.
102.64
14.3935.24
2.28 9.74 6.40 11.68 14.80 11.49 1.44
314.57
4.12
45.6322.06 14.42
0
50
100
150
200
250
300
350
GD
P ($
) bil)
| 28
Figure 6. SADC member state GDPs per capita ($)
Data from: GDP Per Capita: Africa. (2017). Retrieved from https://tradingeconomics.com/country-list/gdp-per-capita?continent=africa.
Figure 7. SADC member state annual GDP growth rates (%)
Source: GDP Growth. (2017). Retrieved from http://data.worldbank.org/indicator/ NY.GDP.MKTP.KD.ZG.
4153
7080
3851370
410 494
9469
511
6000
13542
7586
4057
8421607
815
0
2000
4000
6000
8000
10000
12000
14000
16000G
DP
per c
apita
($)
3.00
-0.30 -10.90
1.60
3.10 2.803.50
6.60
5.30
3.50
1.301.90
7.00
2.90
0.50
-12
-10
-8
-6
-4
-2
0
2
4
6
8
GD
P gr
owth
rate
(%)
| 29
Figure 8. Selected economic indicators, South Africa, 2011-2020 2011 2012 2013 2014 2015 2016 2017 2018 2019 2020 Nominal GDP (bil. R) 3,024 3,254 3,540 3,808 4,050 4,337 4,640 5,001 5,400 5,834
Nominal GDP (bil. $) 416 396 367 351 317 295 344 351 359 369
GDP per capita (000s $) 8.1 7.6 6.9 6.5 5.8 5.3 6.1 6.1 6.1 6.2
Real GDP growth 3.3 2.2 2.5 1.7 1.3 0.3 1.4 1.8 2.0 2.0
Real GDP per capita growth 1.7 0.6 0.9 0.1 -0.4 -1.4 -0.2 0.2 0.4 0.4
Real investment growth 5.5 2.6 7.2 1.7 2.3 -3.9 1.3 2.0 2.5 2.5
Investment/GDP 19.8 20.2 21.2 21.1 21.1 19.9 20.0 20.4 20.0 19.6
Savings/GDP 17.5 15.1 15.4 15.8 16.7 16.7 16.3 16.5 16.0 15.5 Exports/GDP 30.5 29.7 30.9 31.2 30.4 30.3 30.3 30.6 31.2 32.0 Unemployment rate 24.7 24.9 24.7 25.1 25.4 26.7 26.5 26.3 26.3 26.0
Source: South Africa Long-Term Foreign Currency Rating Cut To 'BB+' On Political And Institutional Uncertainty; Outlook Negative. (2017). Retrieved from http://www.standardandpoors.com/en_US/web/guest/article/-/view/type/HTML/id/1825424. Figure 9. Exchange rate, South African rand/US dollar, 2007-2017
Data from: OANDA Currency Tools. (2017). Retrieved from https://www.oanda.com/ currency/.
R6.00
R8.00
R10.00
R12.00
R14.00
R16.00
Jun-
07O
ct-0
7Fe
b-08
Jun-
08O
ct-0
8Fe
b-09
Jun-
09O
ct-0
9Fe
b-10
Jun-
10O
ct-1
0Fe
b-11
Jun-
11O
ct-1
1Fe
b-12
Jun-
12O
ct-1
2Fe
b-13
Jun-
13O
ct-1
3Fe
b-14
Jun-
14O
ct-1
4Fe
b-15
Jun-
15O
ct-1
5Fe
b-16
Jun-
16O
ct-1
6Fe
b-17
Jun-
17
Exch
ange
rat
e (R
/$)
| 30
Figure 10. Population growth, South Africa
Source: “South Africa Population”. Retrieved from: https://tradingeconomics.com/south-africa/population-growth-annual-percent-wb-data.html
| 31
Figure 11. Mozambique PEST Political Analysis Economic Analysis
Located on the east coast of the African continent and bordering South Africa, Mozambique gained its independence in 1975 after four centuries of Portuguese rule. Just two years later, the country became immersed in a 15-year civil war that left one million dead. Finally, in 1994, Mozambique held its first multi-party elections and entered a period of peace, which lasted for almost 20 years until the resurgence of the Mozambican National Resistance (RENAMO) in 2013. Sporadic fighting and tensions between this group and the dominating Mozambique Liberation Front (FRELIMO) are still ongoing (“Mozambique Long-Term Foreign Currency Rating”, 2017).
The deterioration of the political environment was reflected in Mozambique’s Worldwide Governance Indicators, which showed a spike in many data points related to terrorism, corruption, and government ineffectiveness after 2013 (“Worldwide Governance Indicators”, 2017). However, we do not expect the political situation to affect the core operations of Ecobuild’s franchise.
Mozambique is also a member of the SADC and its FTA and scores 53.78 in ease of doing business (Figure 3).
Mozambique is one of the poorest and most underdeveloped countries in the world; its GDP per capita ranks 180 out of 186 according to the World Bank (“Worldwide Governance Indicators”, 2017).
However, the country is endowed with rich natural resources, especially minerals, petroleum, and gas reserves. Despite this, the economy is still based in agriculture, with a growing industry and service sectors. Since 1996, the county has experienced steep economic growth at an annual average of almost 8% (“GDP Growth”, 2017).
Inflation and depreciation of the metical remain problematic, forcing the central bank to set extremely high interest rates of 23.3% (“Mozambique Long-Term Foreign Currency Rating”, 2017).
Despite this, the long-term outlook is positive, as the mineral, oil, and gas industries are expected to make Mozambique one of the fastest growing economies in Africa.
Social Analysis Technological Analysis
Mozambique is home to approximately 25 million* people. According to the World Development Indicators, the urban population growth was 3.6%* in 2015, with 80.3%* of the population living in the slums in 2014, for a total of more than 20 million people. The literacy rate is quite low at 58.8%* as of 2013.
Mozambique is populated mostly by young people; almost 43%* of the population is younger than 15 years old. Fertility and mortality rates are high, and the country ranks among the worst in the world in terms of HIV/AIDS prevalence.
More than 15 million* people in Mozambique are without electricity, and only 2 million* have access to the internet.
The majority of roadways are unpaved. As of 2013, the country only counted 21* airports and had three major seaports in Beira, Maputo, and Nacala*.
In 2010, Mozambique spent 0.42% of its GDP on R&D (“Worldwide Governance Indicators”, 2017).
*Data source: The World Factbook: Mozambique. (n.d.). Retrieved from https://www.cia.gov/library/publications/the-world-factbook/geos/mz.html.
| 32
Figure 12. Ghana PEST Political Analysis Economic Analysis
Located in the west coast of Africa, Ghana is a presidential constitutional democracy with a president who is head of both the state and the government. Ghana gained its independence in 1957, first sub-Saharan country to become independent from European colonization, after a long British rule and several wars. There were several military and civilian governments between 1966 and 1986 until a new constitution in 1992 established a multiparty system. Since the early 2000s, the country has experienced a stable democracy and smooth power transitions which have helped it to become a regional power.
Ghana is a member of the African Union, ECOWAS, G24, and the Commonwealth of Nations.
Ghana, with a GDP per capita of $1,381*, ranks 136th out of 186 globally. It is classified as middle-income country and is relatively wealthier than other sub-Saharan countries. The country has many rich natural resources, mainly minerals, hydrocarbons, and precious metals, which boost the country’s economy.
Ghana’s GDP was growing at an astonishing rate of over 9% until recent years, when growth lowered to 5.5% and is forecasted to remain at 7% and 6% in 2018 and 2019, respectively (“Republic of Ghana Ratings”, 2017). The slowing growth mainly reflects technical difficulties the oil industry and power supply shortages.
Ghana scores 58.82 in ease of doing business, above the regional sub-Saharan average of 49.51; starting a business and dealing with construction permits are the easiest tasks while resolving insolvency and trading across borders the most complicated (“Ease of Doing Business”, 2017).
Social Analysis Analysis
Ghana’s population is 26 million*. The urban population growth rate was about 3.6%* in 2014, with 37.9%* of the population or 9 million people living in slums.
Most of the population speaks English, the official language, however many local languages are used. Demographically, the population is relatively young with 57%* of inhabitants under the age of 25. The literacy rate is 76.6%*.
Ghana suffers a high risk of infectious diseases. Poverty is declining, but still remains an issue in the northern part of the country which is more sensitive to droughts and floods. This region also suffers from reduced access to transportation infrastructure, markets, and industrial centers.
More Technological than 7 million* people in Ghana have no access to electricity, and in 2015 only 23.5%* of the population used the internet.
Transportation is composed of 10* airports, mostly unpaved roads, and major seaports in Takoradi and Tema*.
In 2010, Ghana spent 0.38% of its GDP on R&D (“Worldwide Governance Indicators”, 2017).
*Data from: The World Factbook: Ghana. (n.d.). Retrieved from https://www.cia.gov/ library/publications/resources/the-world-factbook/geos/gh.html.
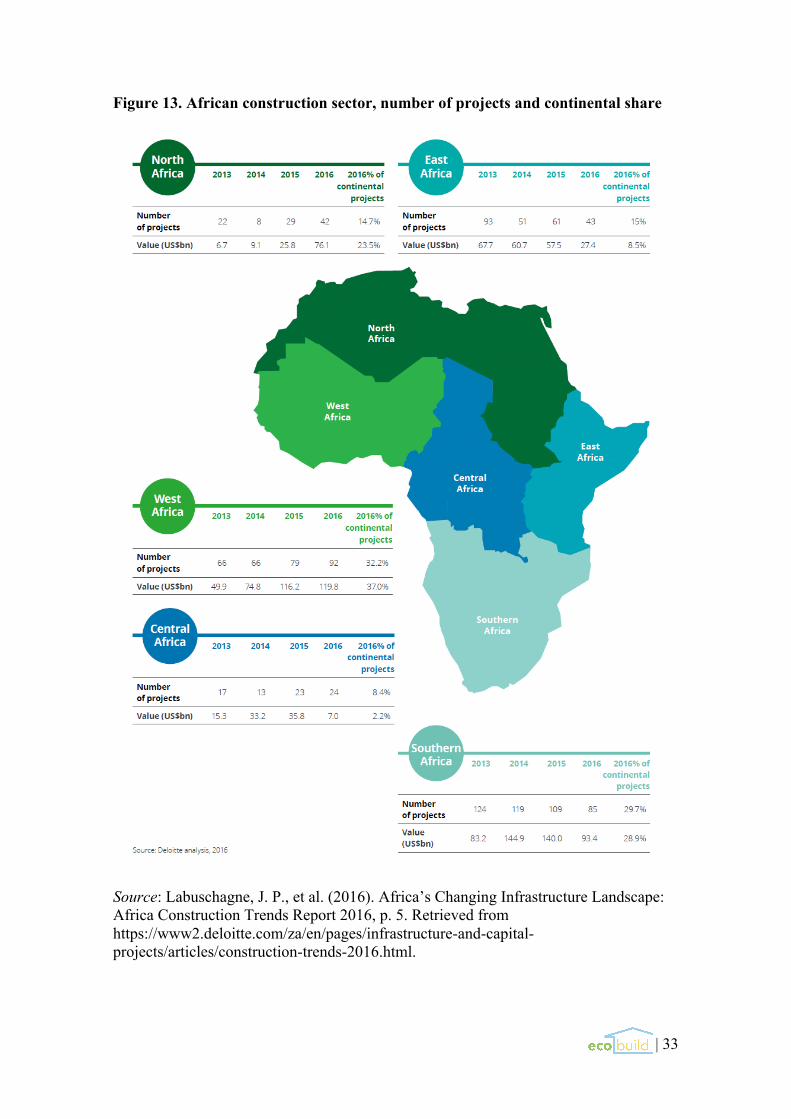
| 33
Figure 13. African construction sector, number of projects and continental share
Source: Labuschagne, J. P., et al. (2016). Africa’s Changing Infrastructure Landscape: Africa Construction Trends Report 2016, p. 5. Retrieved from https://www2.deloitte.com/za/en/pages/infrastructure-and-capital-projects/articles/construction-trends-2016.html.
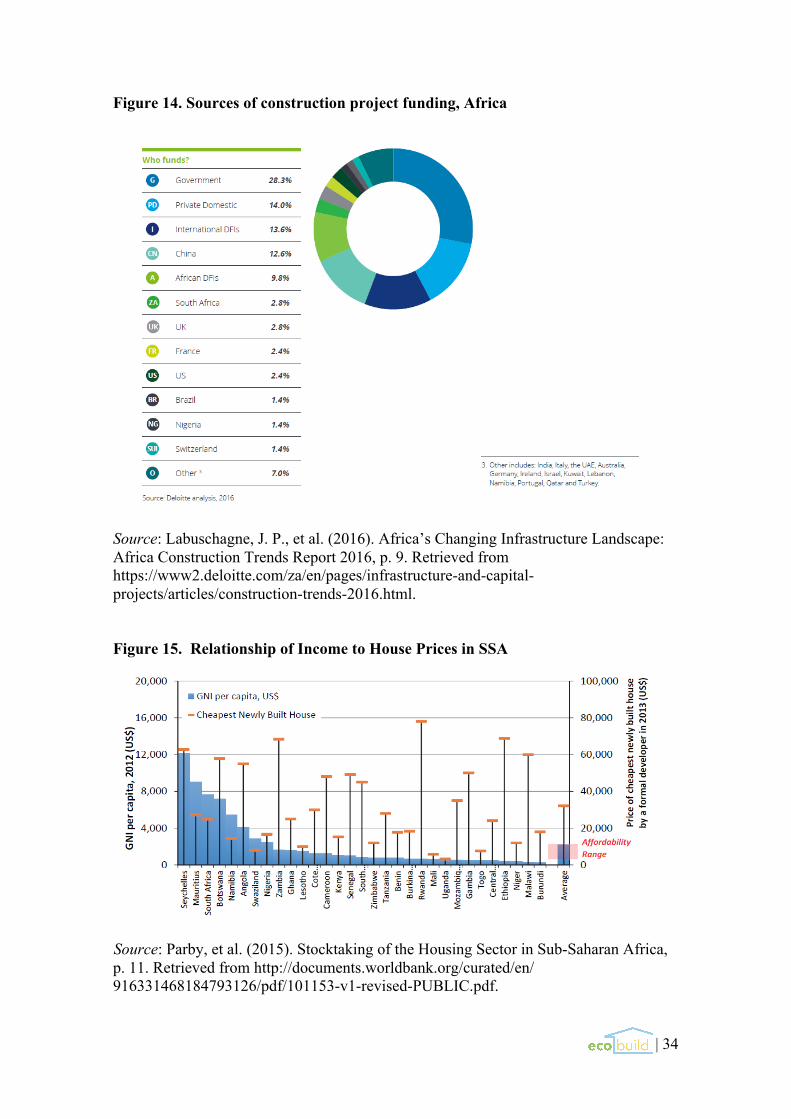
| 34
Figure 14. Sources of construction project funding, Africa
Source: Labuschagne, J. P., et al. (2016). Africa’s Changing Infrastructure Landscape: Africa Construction Trends Report 2016, p. 9. Retrieved from https://www2.deloitte.com/za/en/pages/infrastructure-and-capital-projects/articles/construction-trends-2016.html. Figure 15. Relationship of Income to House Prices in SSA
Source: Parby, et al. (2015). Stocktaking of the Housing Sector in Sub-Saharan Africa, p. 11. Retrieved from http://documents.worldbank.org/curated/en/ 916331468184793126/pdf/101153-v1-revised-PUBLIC.pdf.
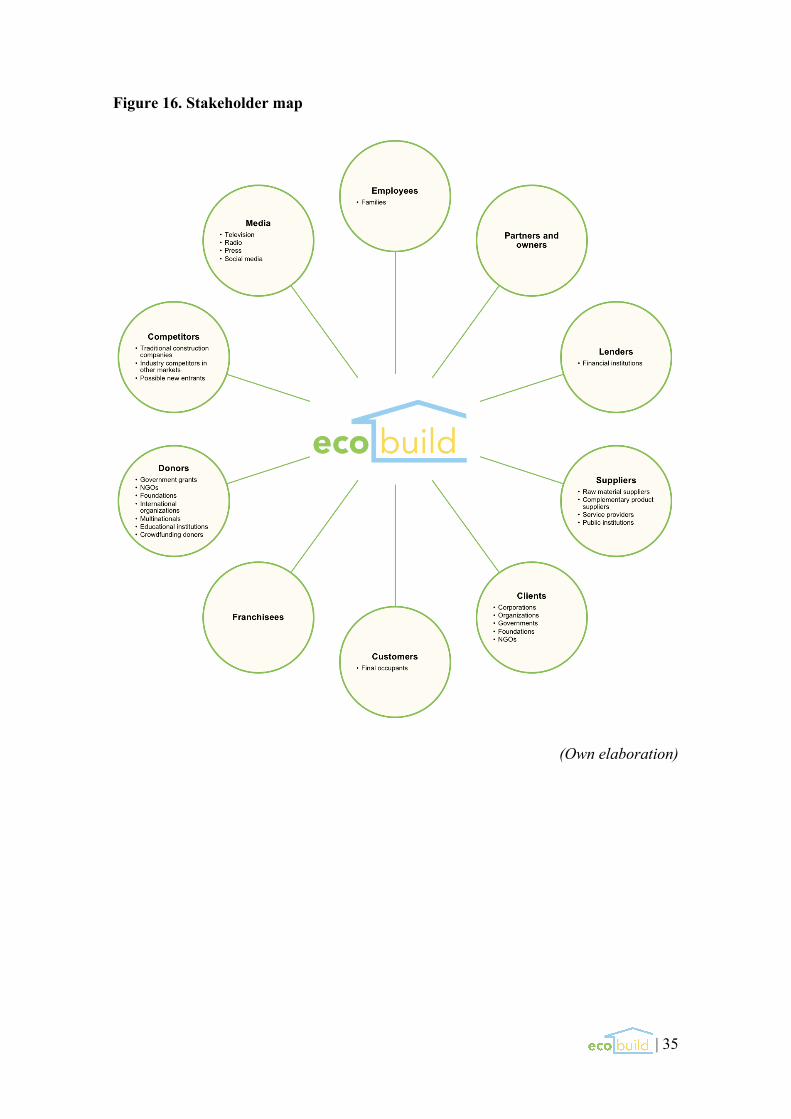
| 35
Figure 16. Stakeholder map
(Own elaboration)
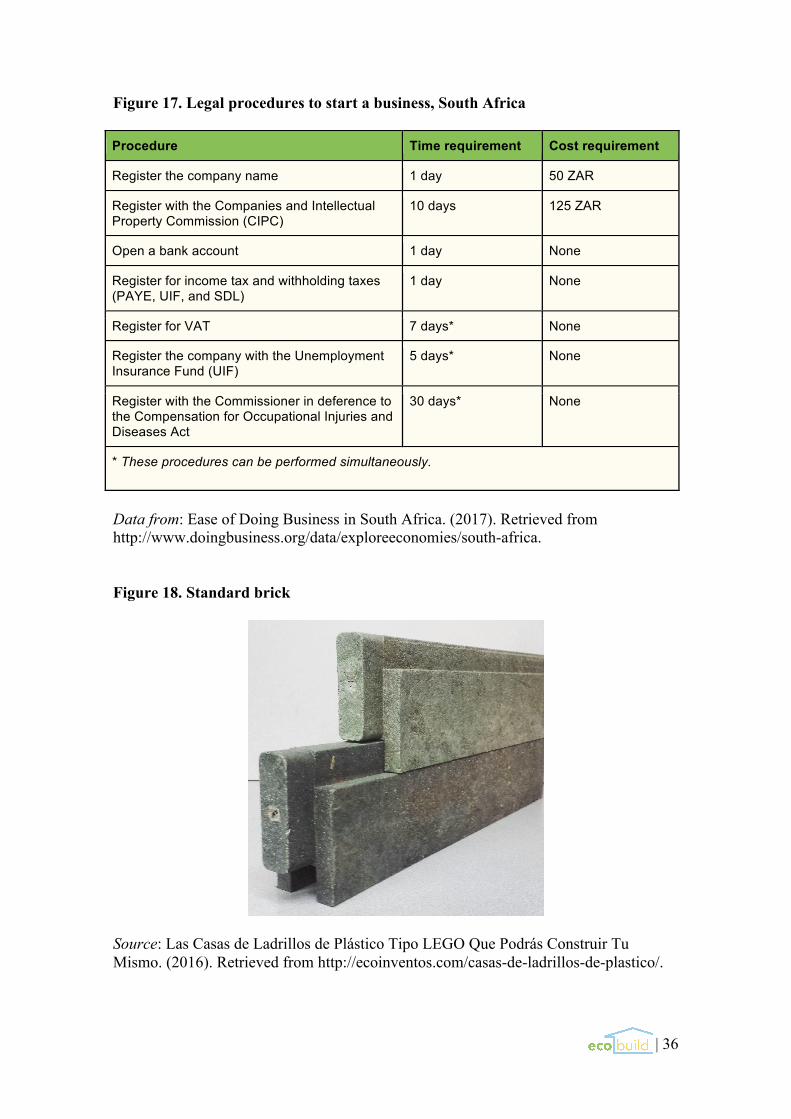
| 36
Figure 17. Legal procedures to start a business, South Africa Procedure Time requirement Cost requirement
Register the company name 1 day 50 ZAR
Register with the Companies and Intellectual Property Commission (CIPC)
10 days 125 ZAR
Open a bank account 1 day None
Register for income tax and withholding taxes (PAYE, UIF, and SDL)
1 day None
Register for VAT 7 days* None
Register the company with the Unemployment Insurance Fund (UIF)
5 days* None
Register with the Commissioner in deference to the Compensation for Occupational Injuries and Diseases Act
30 days* None
* These procedures can be performed simultaneously.
Data from: Ease of Doing Business in South Africa. (2017). Retrieved from http://www.doingbusiness.org/data/exploreeconomies/south-africa. Figure 18. Standard brick
Source: Las Casas de Ladrillos de Plástico Tipo LEGO Que Podrás Construir Tu Mismo. (2016). Retrieved from http://ecoinventos.com/casas-de-ladrillos-de-plastico/.
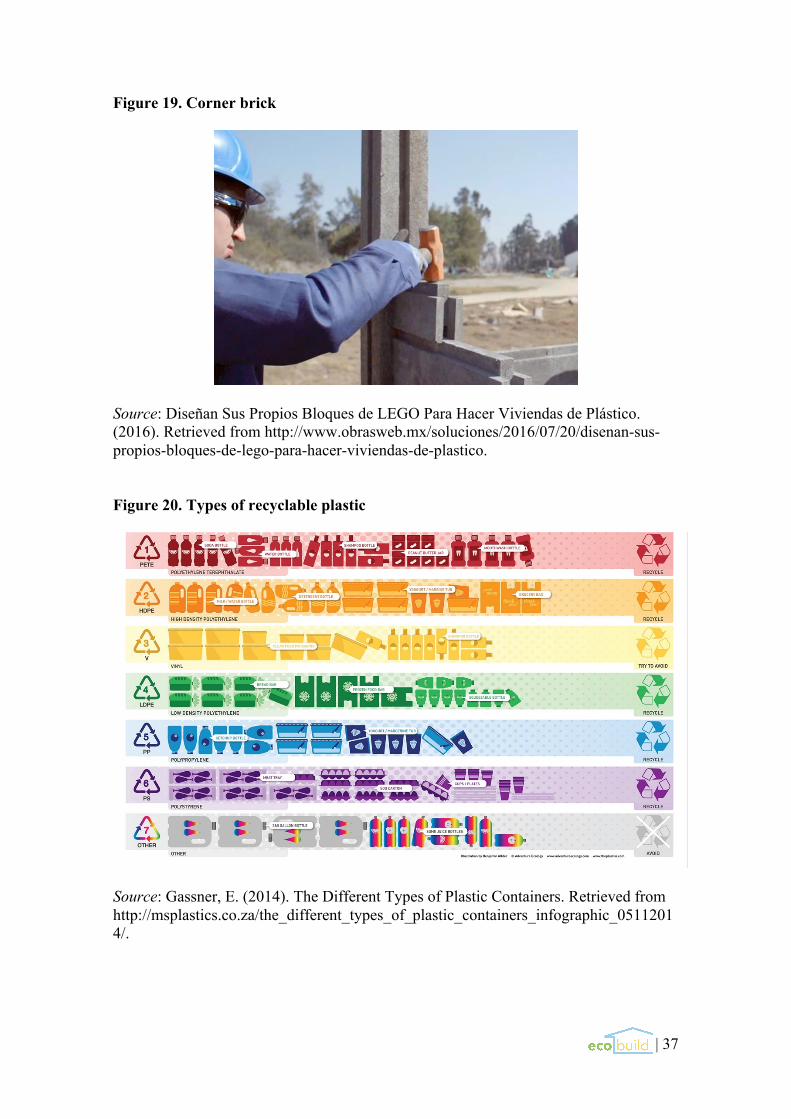
| 37
Figure 19. Corner brick
Source: Diseñan Sus Propios Bloques de LEGO Para Hacer Viviendas de Plástico. (2016). Retrieved from http://www.obrasweb.mx/soluciones/2016/07/20/disenan-sus- propios-bloques-de-lego-para-hacer-viviendas-de-plastico. Figure 20. Types of recyclable plastic
Source: Gassner, E. (2014). The Different Types of Plastic Containers. Retrieved from http://msplastics.co.za/the_different_types_of_plastic_containers_infographic_05112014/.
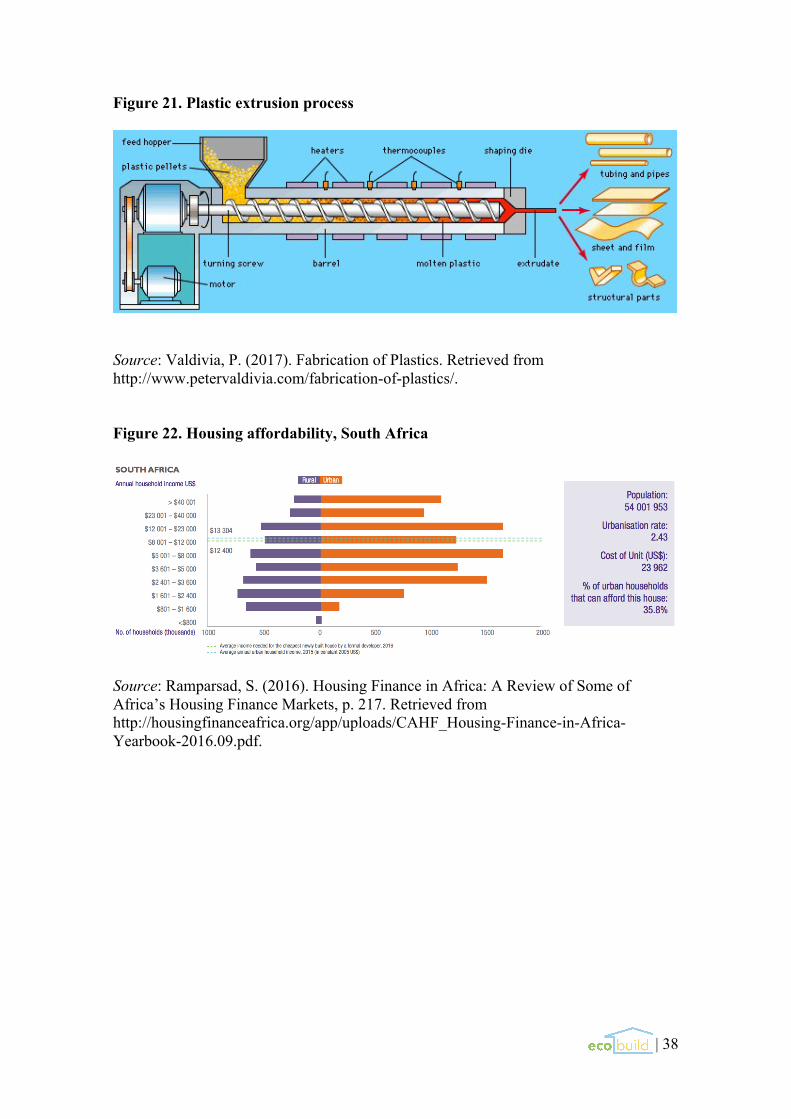
| 38
Figure 21. Plastic extrusion process
Source: Valdivia, P. (2017). Fabrication of Plastics. Retrieved from http://www.petervaldivia.com/fabrication-of-plastics/. Figure 22. Housing affordability, South Africa
Source: Ramparsad, S. (2016). Housing Finance in Africa: A Review of Some of Africa’s Housing Finance Markets, p. 217. Retrieved from http://housingfinanceafrica.org/app/uploads/CAHF_Housing-Finance-in-Africa-Yearbook-2016.09.pdf.
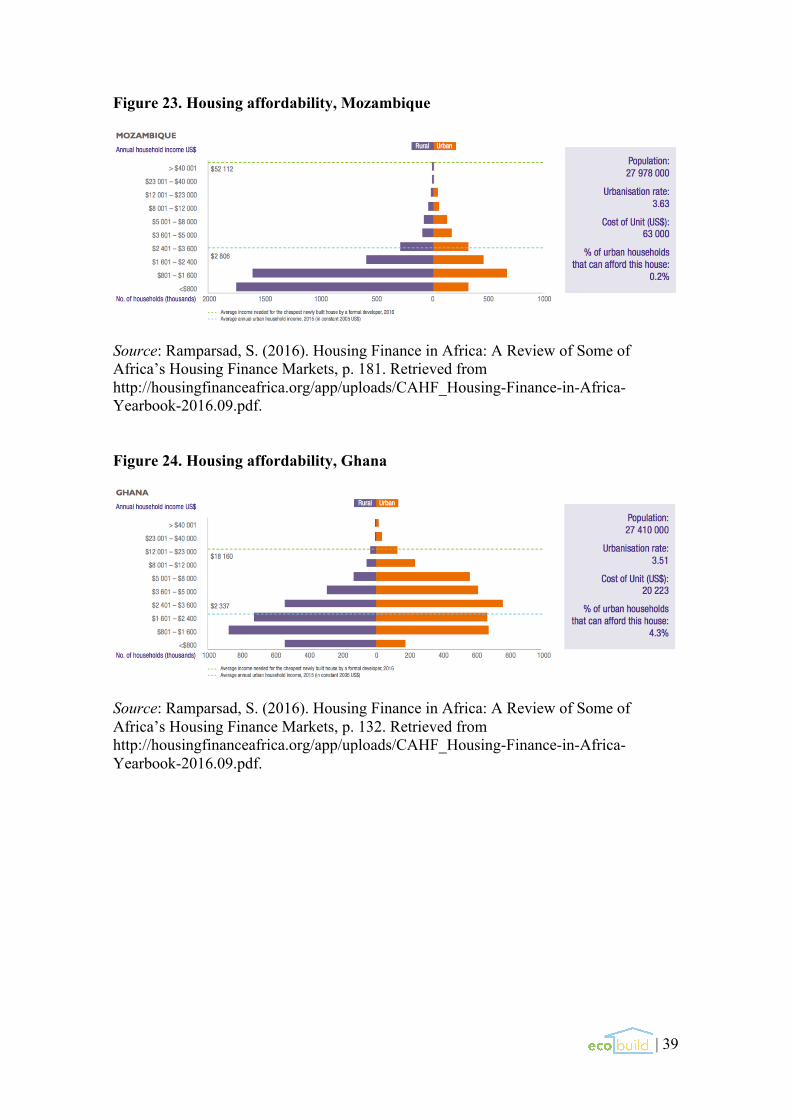
| 39
Figure 23. Housing affordability, Mozambique
Source: Ramparsad, S. (2016). Housing Finance in Africa: A Review of Some of Africa’s Housing Finance Markets, p. 181. Retrieved from http://housingfinanceafrica.org/app/uploads/CAHF_Housing-Finance-in-Africa-Yearbook-2016.09.pdf. Figure 24. Housing affordability, Ghana
Source: Ramparsad, S. (2016). Housing Finance in Africa: A Review of Some of Africa’s Housing Finance Markets, p. 132. Retrieved from http://housingfinanceafrica.org/app/uploads/CAHF_Housing-Finance-in-Africa-Yearbook-2016.09.pdf.
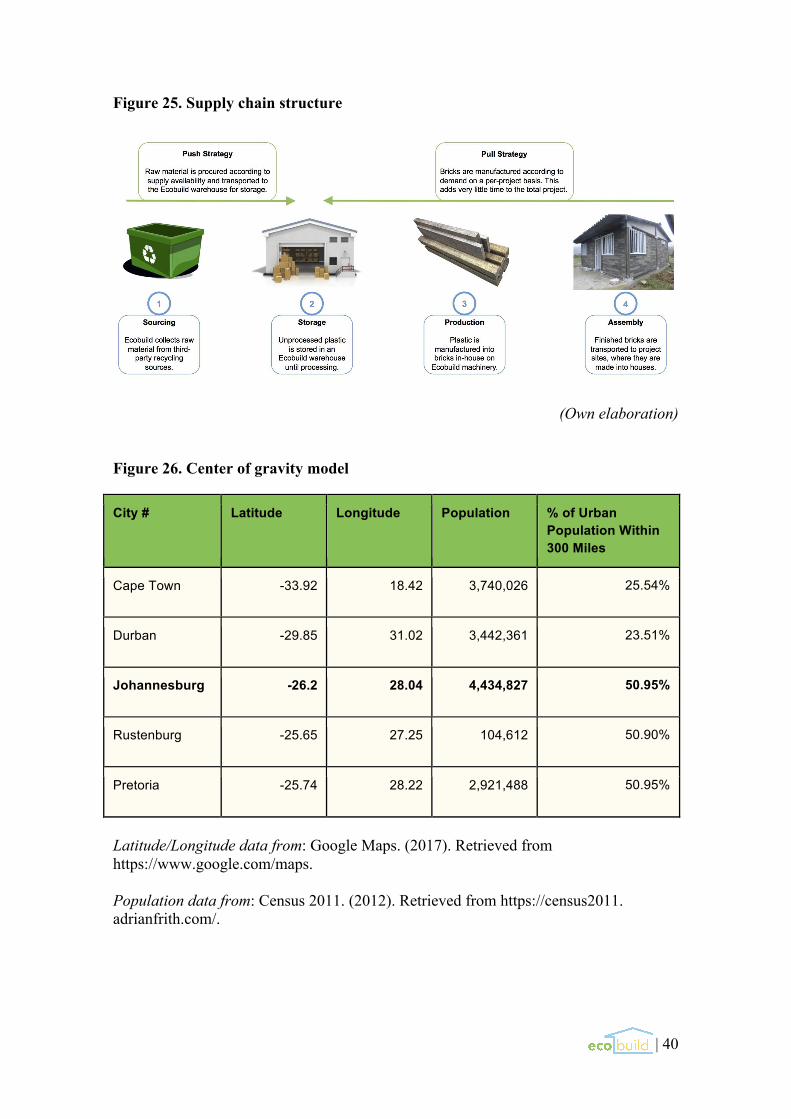
| 40
Figure 25. Supply chain structure
(Own elaboration) Figure 26. Center of gravity model
City # Latitude Longitude Population % of Urban Population Within 300 Miles
Cape Town -33.92 18.42 3,740,026 25.54%
Durban -29.85 31.02 3,442,361 23.51%
Johannesburg -26.2 28.04 4,434,827 50.95%
Rustenburg -25.65 27.25 104,612 50.90%
Pretoria -25.74 28.22 2,921,488 50.95%
Latitude/Longitude data from: Google Maps. (2017). Retrieved from https://www.google.com/maps. Population data from: Census 2011. (2012). Retrieved from https://census2011. adrianfrith.com/.
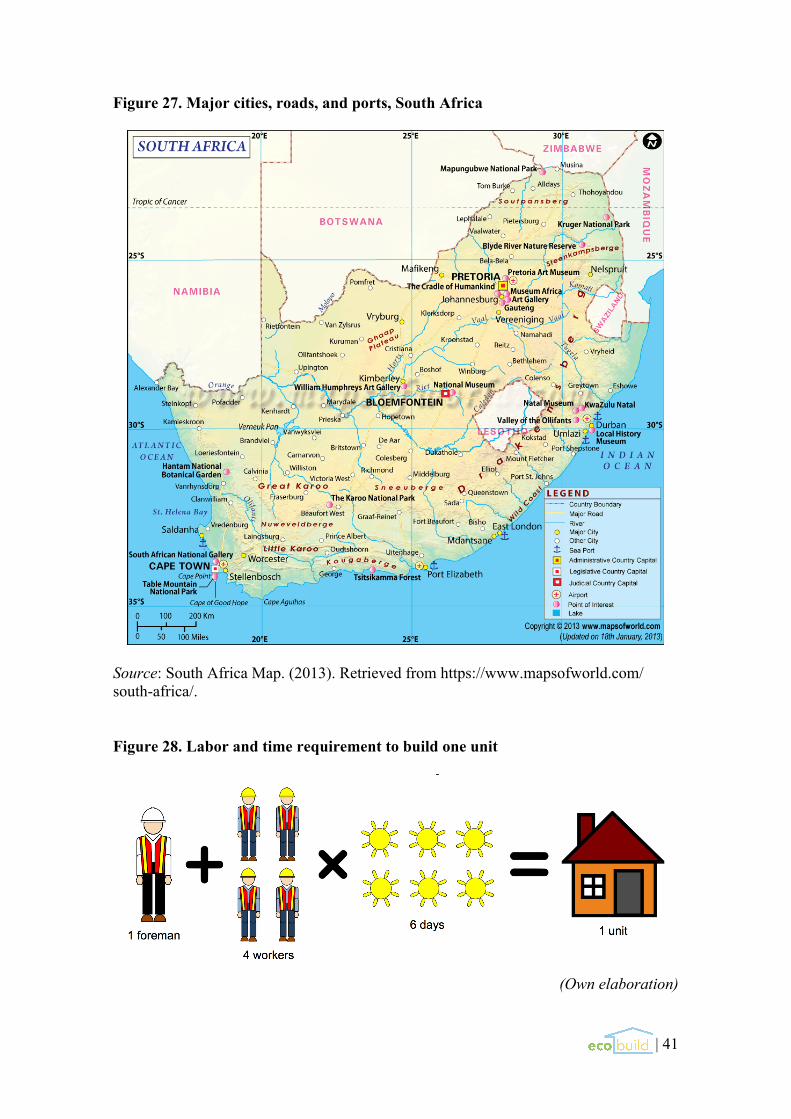
| 41
Figure 27. Major cities, roads, and ports, South Africa
Source: South Africa Map. (2013). Retrieved from https://www.mapsofworld.com/ south-africa/. Figure 28. Labor and time requirement to build one unit
(Own elaboration)
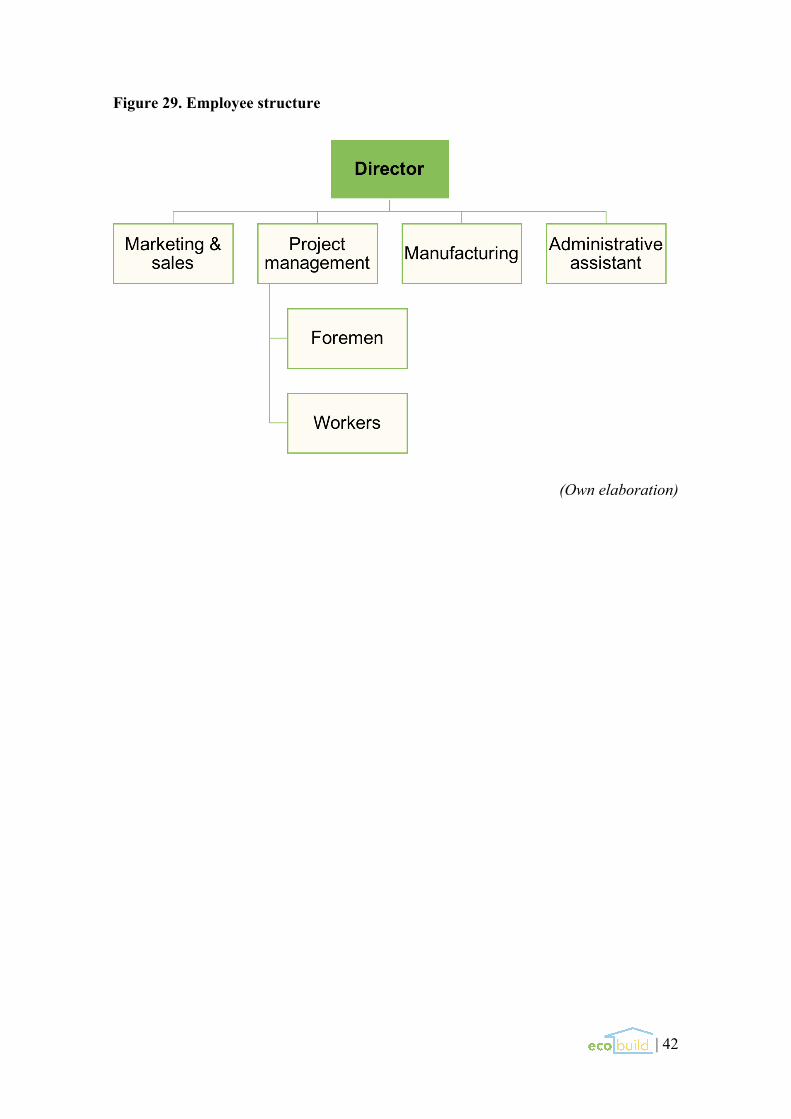
| 42
Figure 29. Employee structure
(Own elaboration)
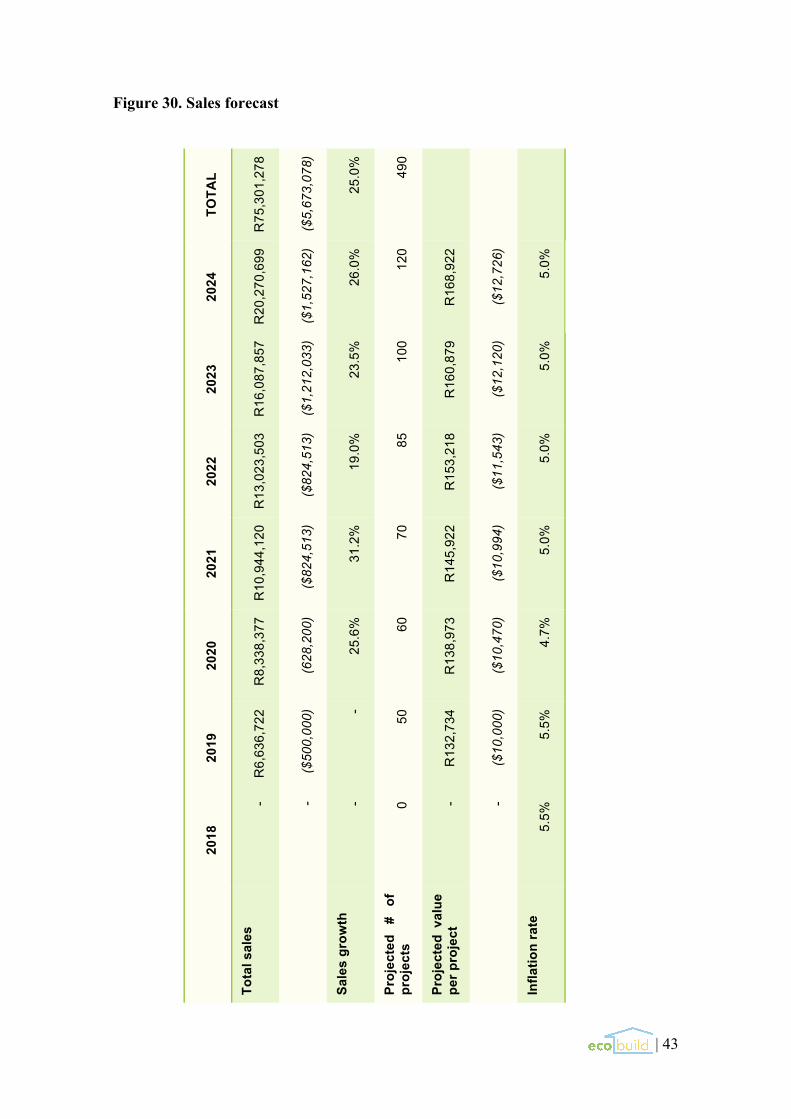
| 43
Figure 30. Sales forecast
TOTA
L
R75
,301
,278
($5,
673,
078)
25.0
%
490
2024
R20
,270
,699
($1,
527,
162)
26.0
%
120
R16
8,92
2
($12
,726
)
5.0%
2023
R16
,087
,857
($1,
212,
033)
23.5
%
100
R16
0,87
9
($12
,120
)
5.0%
2022
R13
,023
,503
($82
4,51
3)
19.0
%
85
R15
3,21
8
($11
,543
)
5.0%
2021
R10
,944
,120
($82
4,51
3)
31.2
%
70
R14
5,92
2
($10
,994
)
5.0%
2020
R8,
338,
377
(628
,200
)
25.6
%
60
R13
8,97
3
($10
,470
)
4.7%
2019
R6,
636,
722
($50
0,00
0) -
50
R13
2,73
4
($10
,000
)
5.5%
2018
- - - 0 - -
5.5%
Tota
l sal
es
Sale
s gr
owth
Proj
ecte
d #
of
proj
ects
Proj
ecte
d va
lue
per p
roje
ct
Infla
tion
rate
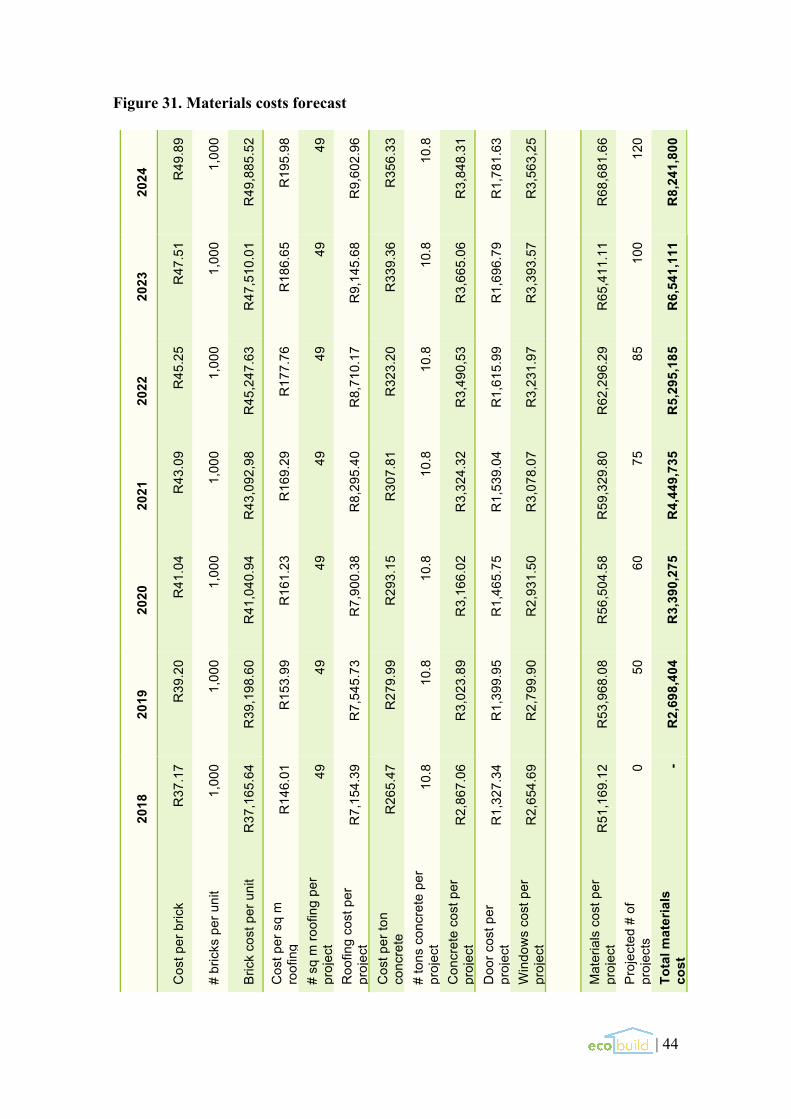
| 44
Figure 31. Materials costs forecast
2024
R49
.89
1,00
0
R49
,885
.52
R19
5.98
49
R9,
602.
96
R35
6.33
10.8
R3,
848.
31
R1,
781.
63
R3,
563,
25
R68
,681
.66
120
R8,
241,
800
2023
R47
.51
1,00
0
R47
,510
.01
R18
6.65
49
R9,
145.
68
R33
9.36
10.8
R3,
665.
06
R1,
696.
79
R3,
393.
57
R65
,411
.11
100
R6,
541,
111
2022
R45
.25
1,00
0
R45
,247
.63
R17
7.76
49
R8,
710.
17
R32
3.20
10.8
R3,
490,
53
R1,
615.
99
R3,
231.
97
R62
,296
.29 85
R5,
295,
185
2021
R43
.09
1,00
0
R43
,092
,98
R16
9.29
49
R8,
295.
40
R30
7.81
10.8
R3,
324.
32
R1,
539.
04
R3,
078.
07
R59
,329
.80 75
R4,
449,
735
2020
R41
.04
1,00
0
R41
,040
.94
R16
1.23
49
R7,
900.
38
R29
3.15
10.8
R3,
166.
02
R1,
465.
75
R2,
931.
50
R56
,504
.58 60
R3,
390,
275
2019
R39
.20
1,00
0
R39
,198
.60
R15
3.99
49
R7,
545.
73
R27
9.99
10.8
R3,
023.
89
R1,
399.
95
R2,
799.
90
R53
,968
.08 50
R2,
698,
404
2018
R37
.17
1,00
0
R37
,165
.64
R14
6.01
49
R7,
154.
39
R26
5.47
10.8
R2,
867.
06
R1,
327.
34
R2,
654.
69
R51
,169
.12 0 -
Cos
t per
bric
k
# br
icks
per
uni
t
Bric
k co
st p
er u
nit
Cos
t per
sq
m
roof
ing
# sq
m ro
ofin
g pe
r pr
ojec
t R
oofin
g co
st p
er
proj
ect
Cos
t per
ton
conc
rete
#
tons
con
cret
e pe
r pr
ojec
t C
oncr
ete
cost
per
pr
ojec
t D
oor c
ost p
er
proj
ect
Win
dow
s co
st p
er
proj
ect
Mat
eria
ls c
ost p
er
proj
ect
Proj
ecte
d #
of
proj
ects
To
tal m
ater
ials
co
st
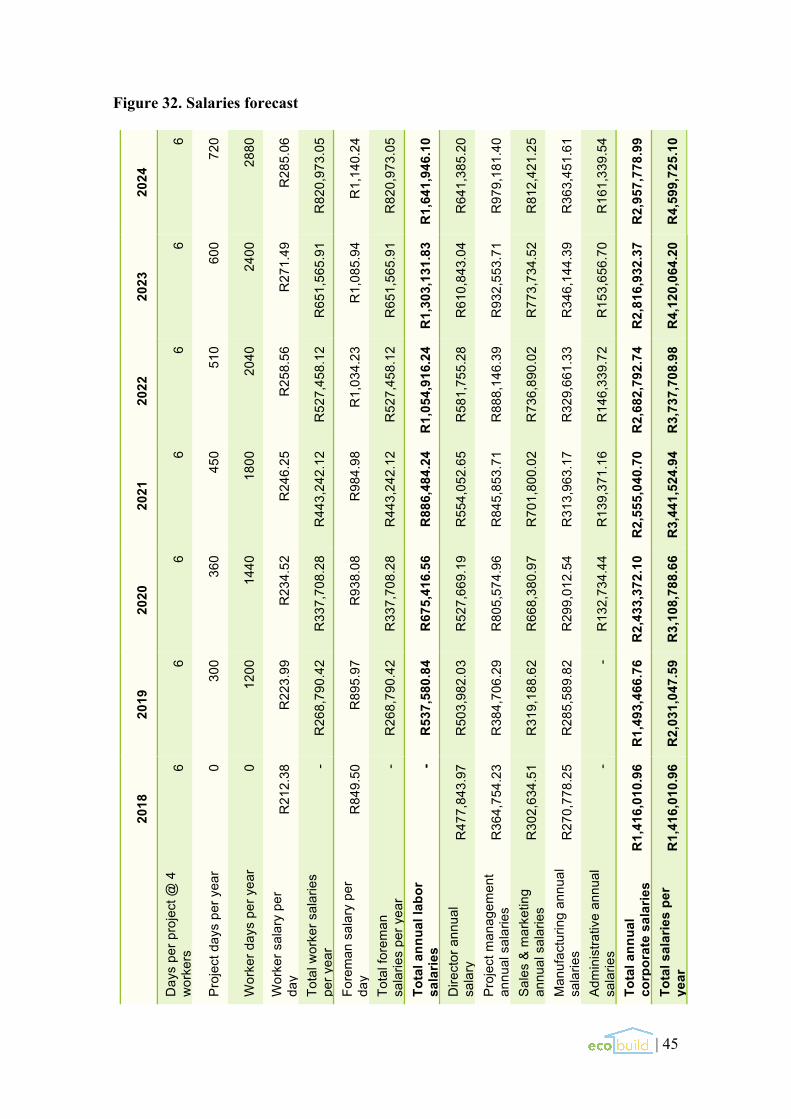
| 45
Figure 32. Salaries forecast
2024
6
720
2880
R28
5.06
R82
0,97
3.05
R1,
140.
24
R82
0,97
3.05
R1,
641,
946.
10
R64
1,38
5.20
R97
9,18
1.40
R81
2,42
1.25
R36
3,45
1.61
R16
1,33
9.54
R2,
957,
778.
99
R4,
599,
725.
10
2023
6
600
2400
R27
1.49
R65
1,56
5.91
R1,
085.
94
R65
1,56
5.91
R1,
303,
131.
83
R61
0,84
3.04
R93
2,55
3.71
R77
3,73
4.52
R34
6,14
4.39
R15
3,65
6.70
R2,
816,
932.
37
R4,
120,
064.
20
2022
6
510
2040
R25
8.56
R52
7,45
8.12
R1,
034.
23
R52
7,45
8.12
R1,
054,
916.
24
R58
1,75
5.28
R88
8,14
6.39
R73
6,89
0.02
R32
9,66
1.33
R14
6,33
9.72
R2,
682,
792.
74
R3,
737,
708.
98
2021
6
450
1800
R24
6.25
R44
3,24
2.12
R98
4.98
R44
3,24
2.12
R88
6,48
4.24
R55
4,05
2.65
R84
5,85
3.71
R70
1,80
0.02
R31
3,96
3.17
R13
9,37
1.16
R2,
555,
040.
70
R3,
441,
524.
94
2020
6
360
1440
R23
4.52
R33
7,70
8.28
R93
8.08
R33
7,70
8.28
R67
5,41
6.56
R52
7,66
9.19
R80
5,57
4.96
R66
8,38
0.97
R29
9,01
2.54
R13
2,73
4.44
R2,
433,
372.
10
R3,
108,
788.
66
2019
6
300
1200
R22
3.99
R26
8,79
0.42
R89
5.97
R26
8,79
0.42
R53
7,58
0.84
R50
3,98
2.03
R38
4,70
6.29
R31
9,18
8.62
R28
5,58
9.82
-
R1,
493,
466.
76
R2,
031,
047.
59
2018
6 0 0
R21
2.38
-
R84
9.50
- -
R47
7,84
3.97
R36
4,75
4.23
R30
2,63
4.51
R27
0,77
8.25
-
R1,
416,
010.
96
R1,
416,
010.
96
Day
s pe
r pro
ject
@ 4
w
orke
rs
Proj
ect d
ays
per y
ear
Wor
ker d
ays
per y
ear
Wor
ker s
alar
y pe
r da
y To
tal w
orke
r sal
arie
s pe
r yea
r Fo
rem
an s
alar
y pe
r da
y To
tal f
orem
an
sala
ries
per y
ear
Tota
l ann
ual l
abor
sa
larie
s D
irect
or a
nnua
l sa
lary
Pr
ojec
t man
agem
ent
annu
al s
alar
ies
Sale
s &
mar
ketin
g an
nual
sal
arie
s M
anuf
actu
ring
annu
al
sala
ries
Adm
inis
trativ
e an
nual
sa
larie
s To
tal a
nnua
l co
rpor
ate
sala
ries
Tota
l sal
arie
s pe
r ye
ar
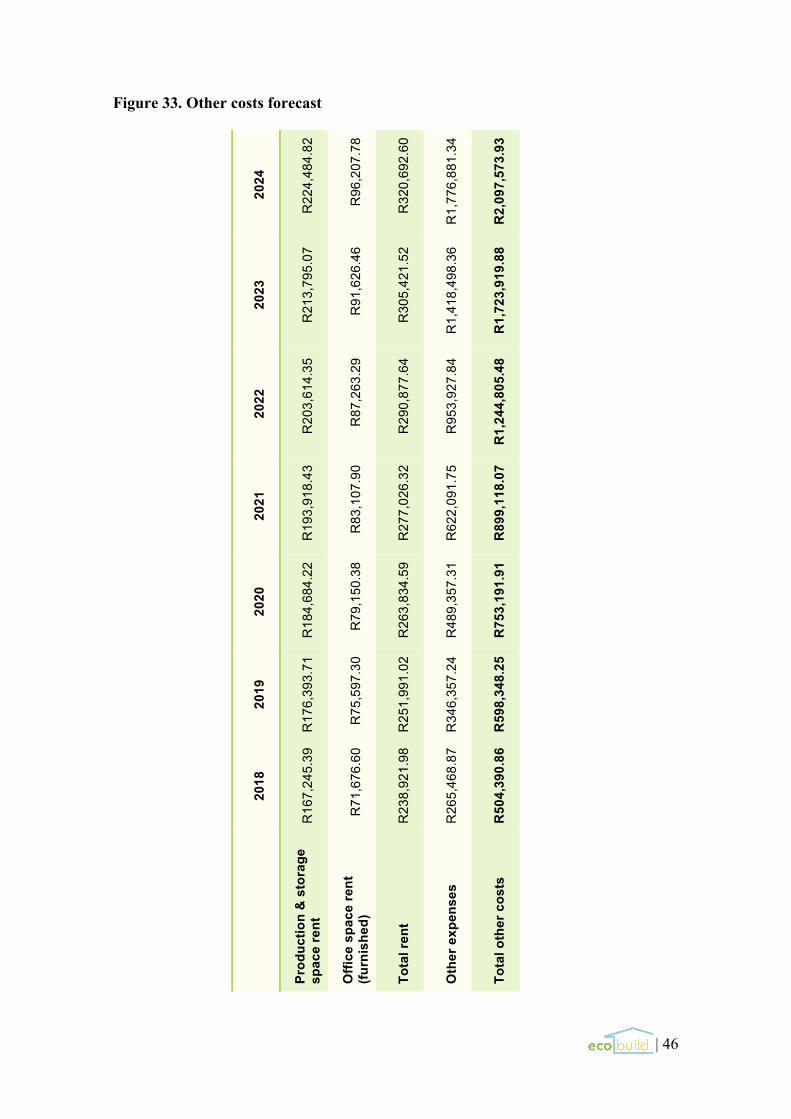
| 46
Figure 33. Other costs forecast
2024
R22
4,48
4.82
R96
,207
.78
R32
0,69
2.60
R1,
776,
881.
34
R2,
097,
573.
93
2023
R21
3,79
5.07
R91
,626
.46
R30
5,42
1.52
R1,
418,
498.
36
R1,
723,
919.
88
2022
R20
3,61
4.35
R87
,263
.29
R29
0,87
7.64
R95
3,92
7.84
R1,
244,
805.
48
2021
R19
3,91
8.43
R83
,107
.90
R27
7,02
6.32
R62
2,09
1.75
R89
9,11
8.07
2020
R18
4,68
4.22
R79
,150
.38
R26
3,83
4.59
R48
9,35
7.31
R75
3,19
1.91
2019
R17
6,39
3.71
R75
,597
.30
R25
1,99
1.02
R34
6,35
7.24
R59
8,34
8.25
2018
R16
7,24
5.39
R71
,676
.60
R23
8,92
1.98
R26
5,46
8.87
R50
4,39
0.86
Prod
uctio
n &
sto
rage
sp
ace
rent
Offi
ce s
pace
rent
(fu
rnis
hed)
Tota
l ren
t
Oth
er e
xpen
ses
Tota
l oth
er c
osts
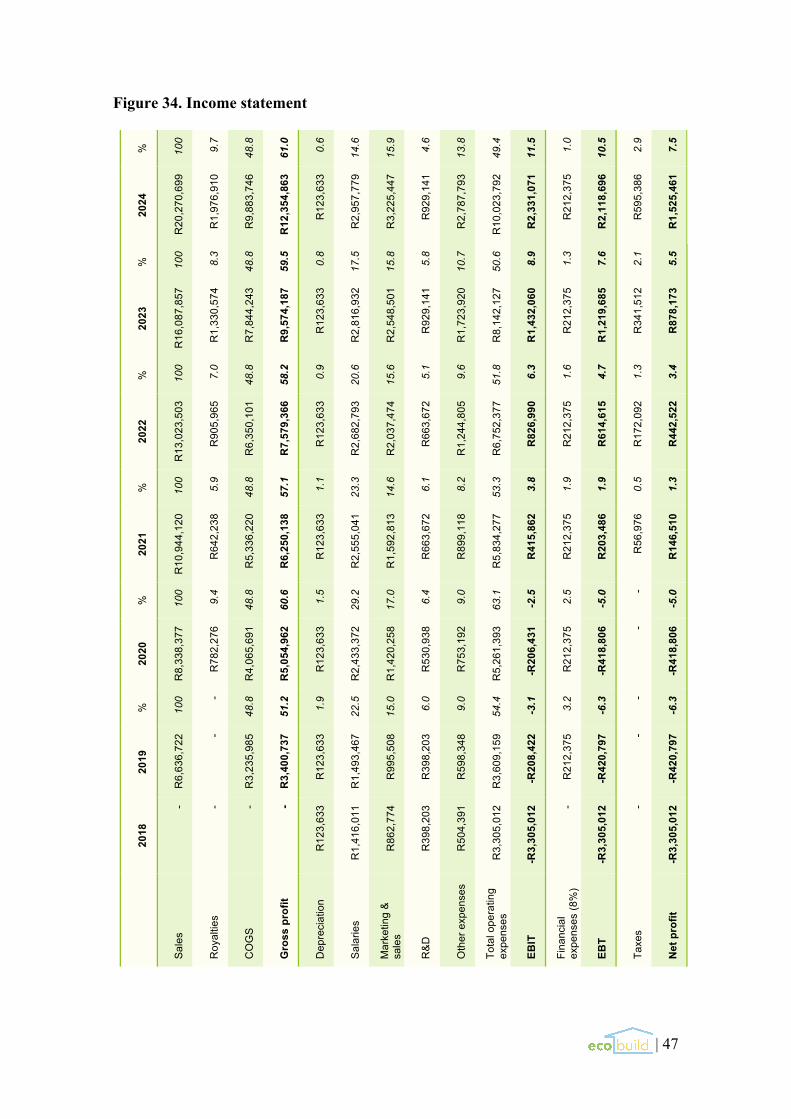
| 47
Figure 34. Income statement
%
100
9.7
48.8
61.0
0.6
14.6
15.9
4.6
13.8
49.4
11.5
1.0
10.5
2.9
7.5
2024
R20
,270
,699
R1,
976,
910
R9,
883,
746
R12
,354
,863
R12
3,63
3
R2,
957,
779
R3,
225,
447
R92
9,14
1
R2,
787,
793
R10
,023
,792
R2,
331,
071
R21
2,37
5
R2,
118,
696
R59
5,38
6
R1,
525,
461
%
100
8.3
48.8
59.5
0.8
17.5
15.8
5.8
10.7
50.6
8.9
1.3
7.6
2.1
5.5
2023
R16
,087
,857
R1,
330,
574
R7,
844,
243
R9,
574,
187
R12
3,63
3
R2,
816,
932
R2,
548,
501
R92
9,14
1
R1,
723,
920
R8,
142,
127
R1,
432,
060
R21
2,37
5
R1,
219,
685
R34
1,51
2
R87
8,17
3
%
100
7.0
48.8
58.2
0.9
20.6
15.6
5.1
9.6
51.8
6.3
1.6
4.7
1.3
3.4
2022
R13
,023
,503
R90
5,96
5
R6,
350,
101
R7,
579,
366
R12
3,63
3
R2,
682,
793
R2,
037,
474
R66
3,67
2
R1,
244,
805
R6,
752,
377
R82
6,99
0
R21
2,37
5
R61
4,61
5
R17
2,09
2
R44
2,52
2
%
100
5.9
48.8
57.1
1.1
23.3
14.6
6.1
8.2
53.3
3.8
1.9
1.9
0.5
1.3
2021
R10
,944
,120
R64
2,23
8
R5,
336,
220
R6,
250,
138
R12
3,63
3
R2,
555,
041
R1,
592,
813
R66
3,67
2
R89
9,11
8
R5,
834,
277
R41
5,86
2
R21
2,37
5
R20
3,48
6
R56
,976
R14
6,51
0
%
100
9.4
48.8
60.6
1.5
29.2
17.0
6.4
9.0
63.1
-2.5
2.5
-5.0
-
-5.0
2020
R8,
338,
377
R78
2,27
6
R4,
065,
691
R5,
054,
962
R12
3,63
3
R2,
433,
372
R1,
420,
258
R53
0,93
8
R75
3,19
2
R5,
261,
393
-R20
6,43
1
R21
2,37
5
-R41
8,80
6 -
-R41
8,80
6
%
100 -
48.8
51.2
1.9
22.5
15.0
6.0
9.0
54.4
-3.1
3.2
-6.3
-
-6.3
2019
R6,
636,
722 -
R3,
235,
985
R3,
400,
737
R12
3,63
3
R1,
493,
467
R99
5,50
8
R39
8,20
3
R59
8,34
8
R3,
609,
159
-R20
8,42
2
R21
2,37
5
-R42
0,79
7 -
-R42
0,79
7
2018
- - - -
R12
3,63
3
R1,
416,
011
R86
2,77
4
R39
8,20
3
R50
4,39
1
R3,
305,
012
-R3,
305,
012 -
-R3,
305,
012 -
-R3,
305,
012
Sale
s
Roy
altie
s
CO
GS
Gro
ss p
rofit
Dep
reci
atio
n
Sala
ries
Mar
ketin
g &
sale
s
R&D
Oth
er e
xpen
ses
Tota
l ope
ratin
g ex
pens
es
EBIT
Fina
ncia
l ex
pens
es (8
%)
EBT
Taxe
s
Net
pro
fit
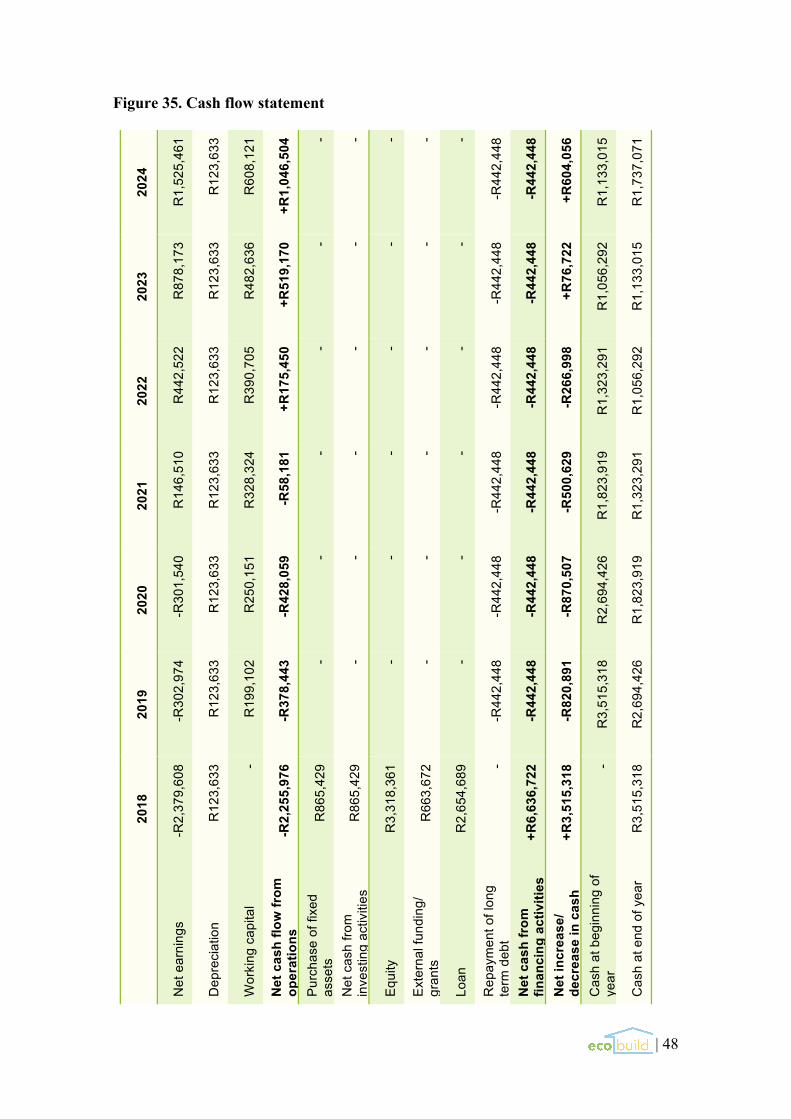
| 48
Figure 35. Cash flow statement
2024
R1,
525,
461
R12
3,63
3
R60
8,12
1
+R1,
046,
504 - - - - -
-R44
2,44
8
-R44
2,44
8
+R60
4,05
6
R1,
133,
015
R1,
737,
071
2023
R87
8,17
3
R12
3,63
3
R48
2,63
6
+R51
9,17
0 - - - - -
-R44
2,44
8
-R44
2,44
8
+R76
,722
R1,
056,
292
R1,
133,
015
2022
R44
2,52
2
R12
3,63
3
R39
0,70
5
+R17
5,45
0 - - - - -
-R44
2,44
8
-R44
2,44
8
-R26
6,99
8
R1,
323,
291
R1,
056,
292
2021
R14
6,51
0
R12
3,63
3
R32
8,32
4
-R58
,181
- - - - -
-R44
2,44
8
-R44
2,44
8
-R50
0,62
9
R1,
823,
919
R1,
323,
291
2020
-R30
1,54
0
R12
3,63
3
R25
0,15
1
-R42
8,05
9 - - - - -
-R44
2,44
8
-R44
2,44
8
-R87
0,50
7
R2,
694,
426
R1,
823,
919
2019
-R30
2,97
4
R12
3,63
3
R19
9,10
2
-R37
8,44
3 - - - - -
-R44
2,44
8
-R44
2,44
8
-R82
0,89
1
R3,
515,
318
R2,
694,
426
2018
-R2,
379,
608
R12
3,63
3 -
-R2,
255,
976
R86
5,42
9
R86
5,42
9
R3,
318,
361
R66
3,67
2
R2,
654,
689 -
+R6,
636,
722
+R3,
515,
318 -
R3,
515,
318
Net
ear
ning
s
Dep
reci
atio
n
Wor
king
cap
ital
Net
cas
h flo
w fr
om
oper
atio
ns
Purc
hase
of f
ixed
as
sets
N
et c
ash
from
in
vest
ing
activ
ities
Equi
ty
Exte
rnal
fund
ing/
gr
ants
Loan
Rep
aym
ent o
f lon
g te
rm d
ebt
Net
cas
h fr
om
finan
cing
act
iviti
es
Net
incr
ease
/ de
crea
se in
cas
h C
ash
at b
egin
ning
of
year
Cas
h at
end
of y
ear
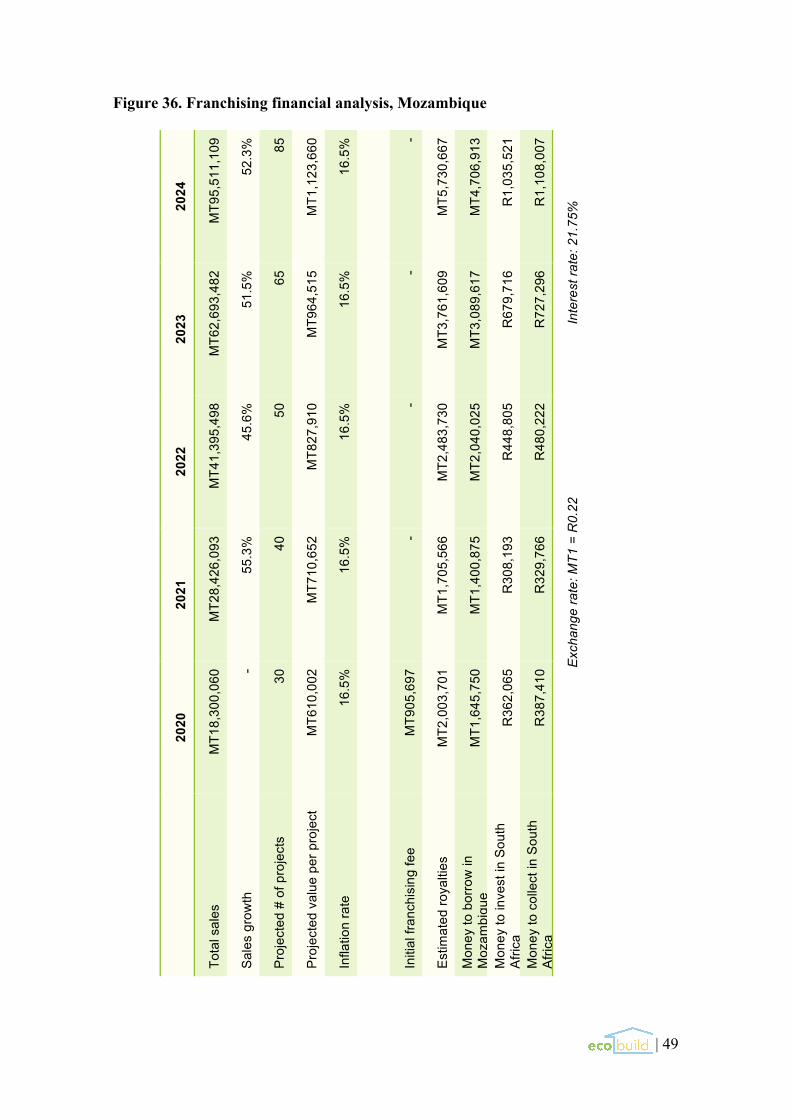
| 49
Figure 36. Franchising financial analysis, Mozambique
2024
MT9
5,51
1,10
9
52.3
%
85
MT1
,123
,660
16.5
% -
MT5
,730
,667
MT4
,706
,913
R1,
035,
521
R1,
108,
007
Inte
rest
rate
: 21.
75%
2023
MT6
2,69
3,48
2
51.5
%
65
MT9
64,5
15
16.5
% -
MT3
,761
,609
MT3
,089
,617
R67
9,71
6
R72
7,29
6
2022
MT4
1,39
5,49
8
45.6
%
50
MT8
27,9
10
16.5
% -
MT2
,483
,730
MT2
,040
,025
R44
8,80
5
R48
0,22
2
Exc
hang
e ra
te: M
T1 =
R0.
22
2021
MT2
8,42
6,09
3
55.3
%
40
MT7
10,6
52
16.5
% -
MT1
,705
,566
MT1
,400
,875
R30
8,19
3
R32
9,76
6
2020
MT1
8,30
0,06
0 -
30
MT6
10,0
02
16.5
%
MT9
05,6
97
MT2
,003
,701
MT1
,645
,750
R36
2,06
5
R38
7,41
0
Tota
l sal
es
Sale
s gr
owth
Proj
ecte
d #
of p
roje
cts
Proj
ecte
d va
lue
per p
roje
ct
Infla
tion
rate
Initi
al fr
anch
isin
g fe
e
Estim
ated
roya
lties
Mon
ey to
bor
row
in
Moz
ambi
que
Mon
ey to
inve
st in
Sou
th
Afric
a M
oney
to c
olle
ct in
Sou
th
Afric
a
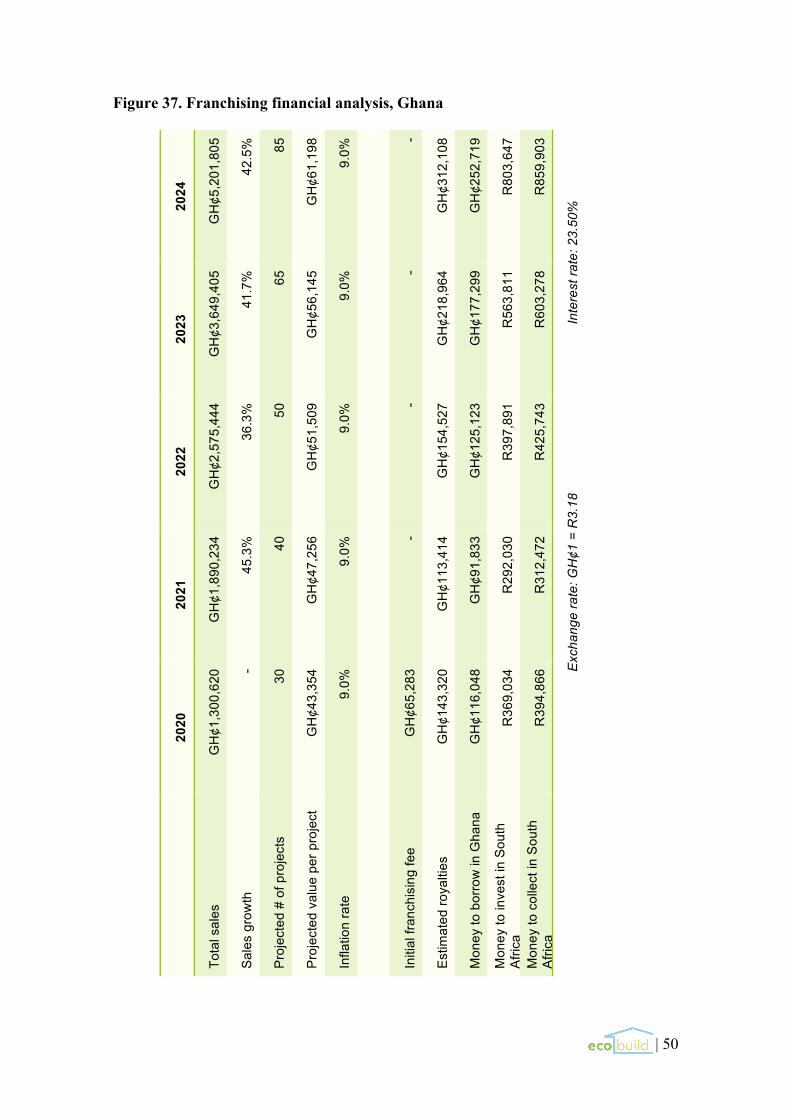
| 50
Figure 37. Franchising financial analysis, Ghana
2024
GH
¢5,2
01,8
05
42.5
%
85
GH
¢61,
198
9.0%
-
GH
¢312
,108
GH
¢252
,719
R80
3,64
7
R85
9,90
3
Inte
rest
rate
: 23.
50%
2023
GH
¢3,6
49,4
05
41.7
%
65
GH
¢56,
145
9.0%
-
GH
¢218
,964
GH
¢177
,299
R56
3,81
1
R60
3,27
8
2022
GH
¢2,5
75,4
44
36.3
%
50
GH
¢51,
509
9.0%
-
GH
¢154
,527
GH
¢125
,123
R39
7,89
1
R42
5,74
3
Exc
hang
e ra
te: G
H¢1
= R
3.18
2021
GH
¢1,8
90,2
34
45.3
%
40
GH
¢47,
256
9.0%
-
GH
¢113
,414
GH
¢91,
833
R29
2,03
0
R31
2,47
2
2020
GH
¢1,3
00,6
20 -
30
GH
¢43,
354
9.0%
GH
¢65,
283
GH
¢143
,320
GH
¢116
,048
R36
9,03
4
R39
4,86
6
Tota
l sal
es
Sale
s gr
owth
Proj
ecte
d #
of p
roje
cts
Proj
ecte
d va
lue
per p
roje
ct
Infla
tion
rate
Initi
al fr
anch
isin
g fe
e
Estim
ated
roya
lties
Mon
ey to
bor
row
in G
hana
Mon
ey to
inve
st in
Sou
th
Afric
a M
oney
to c
olle
ct in
Sou
th
Afric
a
| 51
Sources Achankeng, E. (2003). Globalization, Urbanization and Municipal Solid Waste
Management in Africa. Retrieved from http://www.nswaienvis.nic.in/Waste_ Portal/Case_Studies/CS_01.04.15/Globalization_Urbanization_and_Municipal_Solid_Waste_Management_in.pdf.
Anand, R., Kothari, S., and Kumar, N. (2016). South Africa: Labor Market Dynamics
and Inequality. Retrieved from https://www.imf.org/external/pubs/ft/wp/2016/ wp16137.pdf.
Annual Leave and Holidays. (2017). Retrieved from http://www.mywage.co.za/main/
decent-work/leave-and-holiday. Birkinshaw, M. (2008). A Big Devil in the Shacks. Retrieved from:
https://www.pambazuka.org/governance/big-devil-shacks. Census 2011. (2012). Retrieved from https://census2011.adrianfrith.com/. Chutel, L. (2016). South Africa’s Jacob Zuma May Finally Have to Step Down After a
Report Confirms Corruption Allegations. Retrieved from https://qz.com/825813/ South-africas-jacob-zuma-is-exposed-by-a-corruption-report-into-the-guptas-influence.
Compensation for Occupational Injuries and Diseases Act. (1993). Retrieved from
http://www.labour.gov.za/DOL/legislation/acts/compensation-for-occupational-injuries-and-diseases/compensation-for-occupational-injuries-and-diseases-act.
Construction in South Africa: Key Trends and Opportunities to 2020. Retrieved from
https://www.timetricreports.com/report/cn0270mr--construction-in-south-africa-key-trends-and-opportunities-to-2020/.
Cross-Border Insolvency II: A Guide to Recognition and Enforcement. (2012).
Retrieved from http://www.insol.org/pdf/cross_pdfs/South%20Africa.pdf. Diseñan Sus Propios Bloques de LEGO Para Hacer Viviendas de Plástico. (2016).
Retrieved from http://www.obrasweb.mx/soluciones/2016/07/20/disenan-sus- propios-bloques-de-lego-para-hacer-viviendas-de-plastico.
Doing Business 2017: Ghana. (2017). doi:10.1596/978-1-4648-0948-4. Doing Business 2017: Southern African Development Community. (2017).
doi:10.1596/ 978-1-4648-0948-4.
Ease of Doing Business in South Africa. (2017). Retrieved from
http://www.doingbusiness.org/data/exploreeconomies/south-africa. Economic Development. (2012). Retrieved from http://www.sadc.int/themes/economic-
development/.
| 52
Free Trade Area. (2012). Retrieved from http://www.sadc.int/about-sadc/integration-
milestones/free-trade-area/. Gassner, E. (2014). The Different Types of Plastic Containers. Retrieved from
http://msplastics.co.za/the_different_types_of_plastic_containers_infographic_05112014/.
GDP: Africa. (2017). Retrieved from https://tradingeconomics.com/country-list/gdp?
continent=africa. GDP Growth. (2017). Retrieved from http://data.worldbank.org/indicator/
NY.GDP.MKTP.KD.ZG. GDP Per Capita: Africa. (2017). Retrieved from https://tradingeconomics.com/country-
list/gdp-per-capita?continent=africa. GEM 2015/16 Global Report. (2016). Retrieved from http://www.gemconsortium.org/
report/49480. Ghana GDP. (2017). Retrieved from https://tradingeconomics.com/ghana/gdp. Green Planet Recycling. (2017). Retrieved from http://www.gprecycling.co.za/. Gross Spending on R&D. (2017). Retrieved from https://data.oecd.org/rd/gross-
domestic-spending-on-r-d.htm. Growth in South Africa’s Construction Industry to be Driven by Infrastructure
Development. (2016). Retrieved from http://www.airport-technology.com/news/ newsreport-growth-in-south-africas-construction-industry-to-be-driven-by-infrastructure-development-4911010.
Haig, S., Morrish, L., Morton, R., and Wilkinson, S. (2012). Film Reprocessing
Techniques and Collection Schemes. Retrieved from http://www.wrap.org.uk /sites/files/wrap/Film%20reprocessing%20technologies%20and%20collection%20schemes.pdf.
History and Treaty. (2012). Retrieved from http://www.sadc.int/about-sadc/overview/
history-and-treaty/. Housing. (2017). Retrieved from http://www.gov.za/about-sa/housing%20. ICT and Electronics in South Africa. (2013). Retrieved from
https://www.brandsouthafrica.com/investments-immigration/business/economy/ sectors/icte-overview#.WD1aubLhDIU#ixzz4ROTTuJTM.
Khumalo, K. (2016). New Housing Finance Bank Set to Open Doors in a Year.
Retrieved from https://www.pressreader.com/south-africa/cape-times/20161118/ 281938837503179.
| 53
Key Trends in the South African Economy. (2017). Retrieved from https://www.idc.co.za/images/2017/IDC_RI_publication_Key-trends-in-SA-economy_31-March-2017.pdf.
Las Casas de Ladrillos de Plástico Tipo LEGO Que Podrás Construir Tu Mismo.
(2016). Retrieved from http://ecoinventos.com/casas-de-ladrillos-de-plastico/. Labuschagne, J. P., et al. (2016). Africa’s Changing Infrastructure Landscape: Africa
Construction Trends Report 2016. Retrieved from https://www2.deloitte.com/za/ en/pages/infrastructure-and-capital-projects/articles/construction-trends-2016.html.
Manuel, T., et al. (2011). National Development Plan: Vision for 2030. Retrieved from
http://www.gov.za/documents/national-development-plan-vision-2030. Mavée, N., Perrelli, R., & Schimmelpfennig, A. (2016). Surprise, Surprise: What Drives
the Rand / U.S. Dollar Exchange Rate Volatility? Retrieved from http://www.imf.org/external/pubs/ft/wp/2016/wp16205.pdf.
Mozambique Foreign Currency Ratings Affirmed At 'SD/D'; Local Currency Ratings
Affirmed At 'B-/B' With Stable Outlook. (2017). Retrieved from https://www.standardandpoors.com/en_US/web/guest/article/%C2%AD/view/type/HTML/id/1795362.
Naidoo, D., et al. (2016). SA Construction, 4th Edition. Retrieved from
https://www.pwc.co.za/en/assets/pdf/sa-construction-2016.pdf. A National Minimum Wage for South Africa. (2016). Retrieved from
http://www.treasury.gov.za/publications/other/NMW%20Report%20Draft%20CoP%20FINAL.PDF.
OANDA Currency Tools. (2017). Retrieved from https://www.oanda.com/currency/. OECD Data: South Africa. (2016). Retrieved from https://data.oecd.org/south-
Africa.htm. Parby, J. I., et al. (2015). Stocktaking of the Housing Sector in Sub-Saharan Africa.
Retrieved from http://documents.worldbank.org/curated/en/ 916331468184793126/pdf/101153-v1-revised-PUBLIC.pdf.
Ramparsad, S. (2016). Housing Finance in Africa: A Review of Some of Africa’s
Housing Finance Markets. Retrieved from http://housingfinanceafrica.org/app/ uploads/CAHF_Housing-Finance-in-Africa-Yearbook-2016.09.pdf.
Republic of Ghana Ratings Affirmed At 'B-/B'; Outlook Stable. (2017). Retrieved from
https://www.standardandpoors.com/en_US/web/guest/article/%C2%AD/view/type/HTML/id/1828680.
SADC Overview. (2012). Retrieved from http://www.sadc.int/about-sadc/overview/.
| 54
South Africa Long-Term Foreign Currency Rating Cut To 'BB+' On Political And Institutional Uncertainty; Outlook Negative. (2017). Retrieved from http://www.standardandpoors.com/en_US/web/guest/article/-/view/type/HTML/id/1825424.
South Africa Map. (2013). Retrieved from https://www.mapsofworld.com/south-africa/. South Africa Population. (2017). Retrieved from https://tradingeconomics.com/south-
africa/population. South Africa Turning the Corner on R&D Spending. (2014). Retrieved from
https://www.brandsouthafrica.com/investments-immigration/science-technology/research-110414#.WD3a3LLhDIU#ixzz4RQgmna.
South African Salaries in 2015: What People Earn. (2015). Retrieved from
https://businesstech.co.za/news/general/84863/south-african-salaries-in-2015-what-people-earn/.
Tessier, K. (1995). The Challenge of Immigration Policy in the New South Africa.
Retrieved from http://www.repository.law.indiana.edu/cgi/viewcontent.cgi? article=1067&context=ijgls.
Tibane, E. (2016). Pocket Guide to South Africa 2015/2016. Retrieved from
http://www.gcis.gov.za/sites/www.gcis.gov.za/files/docs/resourcecentre/pocketguide/PocketGuide15-16new.pdf.
Top Industrial Locations in Gauteng. (2014). Retrieved from
https://www.property24.com/articles/top-industrial-locations-in-gauteng/19388. Valdivia, P. (2017). Fabrication of Plastics. Retrieved from
http://www.petervaldivia.com/fabrication-of-plastics/. Waste Management. (2012). Retrieved from http://www.sadc.int/issues/environment-
sustainable-development/waste-management/. The World Factbook: Ghana. (n.d.). Retrieved from https://www.cia.gov/library/
publications/resources/the-world-factbook/geos/gh.html. The World Factbook: Mozambique. (n.d.). Retrieved from https://www.cia.gov/library/
publications/the-world-factbook/geos/mz.html. The World Factbook: South Africa. (n.d.). Retrieved from https://www.cia.gov/library/
publications/resources/the-world-factbook/geos/sf.html. World Urbanization Prospects. (2014). Retrieved from https://esa.un.org/unpd/wup/
publications/files/wup2014-highlights.Pdf. Worldwide Governance Indicators. (2017). Retrieved from http://info.worldbank.org/
governance/WGI/#reports.