ECO2L Leitfaden.Handbook-complete 1-2013 GB the world’s first calculation and auditing model for...
34
Handbook with basic information for the Calculation of a Corporate Carbon Footprint (CCF) for a leather factory with evaluation of internal energy consumption in comparison to the BEET energy benchmark (Best Energy Efficiency for Tanning) Jan. 2013
-
Upload
phungduong -
Category
Documents
-
view
213 -
download
0
Transcript of ECO2L Leitfaden.Handbook-complete 1-2013 GB the world’s first calculation and auditing model for...

Handbook with basic information for the
Calculation of a Corporate Carbon Footprint (CCF) for a leather factory with evaluation of internal energy consumption in comparison to the BEET energy benchmark (Best Energy Efficiency for Tanning)
Jan. 2013

2
Table of Contents
Introduction
1. Objectives 6
1.1 Definition of BEET (Best Energy Efficiency for Tanning) 6
1.1.1 Comparability 6
1.1.2 Product-Specific Correction Factors for BEET 6
1.2 Corporate Carbon Footprint 11
2. Leather Production Parameters 11
3. System Boundaries 12
3.1 Production 13
3.1.1 Recording Raw Material and End Products 13
3.1.2 Energy Consumption in Production 15
3.1.2.1 Chrome Recycling and Hydrolysis of Shavings 16
3.1.2.2 Recording the Energy Sources and Energy Consumption 16
3.1.3 Employees: Travel to and from Work 17
3.2 Upstream Processes 18
3.2.1 Cattle Farming / Fattening and Production of Split, Wet-Blue, Crust 18
3.2.2 Rawhide production and -preservation 18
3.2.3 Transportation of Rawhide from assembly center to Leather Factory 18
3.2.4 Transportation of Preliminary Products (Split, Wet-Blue, Wet-White, Crust) 19
3.2.5 Production of Chemicals 19
3.2.6 Transportation of Chemicals from Production Site to Central Chemicals Distribution Warehouse 19
3.2.7 Transportation of Chemicals from Central Warehouse to Leather Factory 19
3.2.8 Emissions from External Energy Generation 20
3.3 Downstream Processes 21
3.3.1 Transportation of Leather /Semi-Finished Goods to the Customer 21
3.3.2 Usage Phase of Leather 21
3.3.3 Disposal of Leather after the Usage Phase 21
3.3.3.1 Disposal of Automotive Leather 21
3.3.3.2 Disposal of Furniture and Shoe Leather 22
3.3.4 Transportation of Ancillary and By-Products (Split, Trimmings) 22
3.3.5 Transportation of Waste to Disposal Company 22
3.3.6 Recycling of Wastes 22
3.3.6.1 Material Use of Wastes 23

3
3.3.6.2 Use of Wastes for Biogas or Oil Production with External Energy Utilisation 23
3.3.6.3 Use of Wastes for Biogas or Oil Production with Internal Energy Utilisation 24
3.3.6.4 Use of Leather Waste, Shavings, Leather Dust with External Energy Utilisation 24
3.3.6.5 Use of Effluent Sludge through Gasification with External Energy Utilisation 24
3.3.7 Waste Disposal 25
3.3.8 Waste Water Transportation and Treatment 25
3.3.8.1 Direct Discharge into Receiving Waters 25
3.3.8.2 Indirect Discharge into Municipal / Industrial Waste Water Treatment Plant 25
3.4 Summary of the Defined System Limits for the Model 26
4.0 CO2 Balance and Calculation 28
4.1. Percentage Distribution of Energy Demand / CO2 Emissions for CCF Model, Leather Factory Example 29
Appendix:
General Conversion Factors 32 Bibliography 33
Publisher:
Verband der Deutschen Lederindustrie e.V. (VDL) Fuchstanzstraße 61 60489 Frankfurt am Main Phone: +49 (0) 69/ 97 84 31 41 Fax: +49 (0) 69 / 78 80 00 09 E-mail: [email protected] Internet: www.vdl-web.de
All rights reserved by the publisher

4
Introduction
As an active contribution to climate protection, the ECO2L (energy-controlled leather) label encompasses the world’s first calculation and auditing model for determining the energy efficiency and CO2 emissions of leather production on site. For the audited tannery, it confirms the energy-efficient production of leather and the systematic determination of the corporate carbon footprint by means of a defined calculation model within specified system boundaries.
The ECO2L certificate is issued by the independent Forschungsinstitut für Leder- und Kunststoffbahnen gGmbH (FILK) (Research Institute of Leather and plastic sheeting) following a successful audit by technically adept, officially approved and appointed auditors.
The prerequisites for the presentation of the ECO2L label to a tannery by the FILK are as follows:
- Calculation of the production-specific, international standard “Best Energy Efficiency for Tanning” (BEET) for the production method, localisation and volume
- Calculation of the actual specific energy consumption in production
- Calculation of the percentage deviation of the actual energy consumption from the BEET
- Actual energy consumption is not exceeding the BEET
- Calculation of the corporate carbon footprint (CCF) according to the ECO2L standard
The calculations are completed by the appointed auditor using the standardised calculation programme.
Certification allows the audited location to use the ECO2L label for promotional purposes over a period of three years.
ECO2L was developed for the production of upholstery leather from cowhide, but can also be used for the production of shoe upper leather with no restrictions.
Based on the “Best Available Techniques for the Tanning of Hides and Skins” specified by the EU (2), the BEET benchmark establishes a strict standard reference value for the energy consumption of all production processes on site within defined system boundaries. With the help of BEET, a leather factory can therefore compare its own energy consumption data to this benchmark and evaluate the energy efficiency of the production processes by means of the resulting deviation.
A direct comparison with other tanneries (certified according to the ECO2L label) is possible at any time for the production process of all tanneries by means of the percentage deviation of the BEET values. In principle however, only the percentage difference (% of BEET) for all leather factories is comparable, while the specific energy consumption value (MJ/m² of product and / or product mix) is only comparable for precisely defined, identical production chains.
On the one hand, the energy efficiency of a tannery depends on factors that can be influenced by the tanner. These mainly include the choice of machines, building insulation, control systems etc. The production process itself can at least be largely influenced by adapting formulations; due to the required quality standards, the most efficient processes are not always used and deviating area yields are achieved. This is why correction factors are included for deviations in the production process, to the extent these are known.
Other location factors such as climatic conditions, fresh water quality and temperature are fixed constraints that impose a “natural limit” on energy efficiency, because the tanner cannot optimise them.

5
The corporate carbon footprint describes the emission of CO2 equivalents from production as well as the upstream and downstream processes for the location within defined system limits. It is expressed in “kg CO2/m² of product and / or product mix”.
The CCF can only be compared between different production facilities if comparable raw material is used and comparable end products are manufactured (comparable production chains). This would, for example, be possible for upholstery leather tanneries engaged exclusively in complete production from the raw material to finished leather or from the raw material to wet-blue. However, tanneries that meet the standardised system specifications for the determination of BEET and CCF and whose energy consumption, determined by the auditor, will not exceed the standard reference value can receive the ECO2L certificate and use it for promotional purposes.
Thanks to the continuous development of the database for the determination of the BEET and CCF, the current ECO2L terms and conditions are being updated regularly.

6
1. Objectives
The objective is to determine the corporate carbon footprint (CCF) by means of a standardised calculation programme within defined system limits. This results in the comparable determination of the CO2 emissions and / or CO2 emission equivalents in the form of the CCF for the production of upholstery and shoe upper leather for each leather factory for the first time. The actual specific energy consumption of the company at the location is calculated within defined system limits for this purpose, and compared to an international energy benchmark “BEET” (Best Energy Efficiency for Tanning). When the tannery will not exceeds the BEET, it can obtain the ECO2L certificate and thereby document its energy efficient production.
1.1 Definition of BEET (Best Energy Efficiency for Tanning)
The BEET was established based on the EU specification “Best Available Techniques for the Tanning of Hides and Skins” (2). It is defined as a location and production-specific, internationally applicable, standard energy efficiency reference value. In order to compare the company’s actual specific energy consumption at the location to the BEET, the total energy consumption of the production process must be captured regardless of the source. Among other things, the comparison to the BEET allows the energy efficiency of the tannery's production processes and mechanised or electrical equipment to be evaluated.
1.1.1 Comparability
The BEET benchmark can only be used to compare the actual specific energy consumption of several tanneries directly in MJ/m² in case of comparable production (e.g. exclusively from rawhide to finished leather or only from wet-blue to crust). However, most tanneries process various feedstock such as rawhide, wet-blue or crust and produce different semi-finished and finished goods such as wet-blue, crust or finished leather. This means the company’s actual specific energy consumption can no longer be compared against other tanneries as an absolute number. In this situation, the BEET benchmark helps to identify the percentage deviations in the actual energy demand for production.
1.1.2 Product-Specific Correction Factors for BEET
Correction factors are used in order to take into account deviations from a common production method, which are often necessary due to quality requirements.
With the correction factors, the BEET benchmark is adapted to the conditions in the respective company being audited, since distortions in the comparison of the company’s actual specific energy consumption to the standard BEET benchmark and corresponding incorrect assessments to obtain the ECO2L label are otherwise possible.
In principle, the BEET benchmark was established for the following base products and production:
Rawhide (bovin)-salted
pelt
leather split/flesh split
Wet- BlueWet- White
Crust
Upholstery leather/shoe upper leather1,1- 1,4 mm
7
Tabular summary of the possible product-specific deviations and correction factors for
energy consumption compared to the BEET standard:
Production Rawhide-Finished Leather
Rawhide-WB Rawhide-Crust
WB-Crust WB-Finished Leather
Leather out of hides from:
� Cattle � � �
� Other animals (sheep, pig, small animals etc.) Not applicable Not applicable Not applicable
Operation of own cold storage house
(Size for approx. 50 t rawhide)
+ 0.2 % + 0.4 % -
Use of the leather for:
� Upholstery (automotive, furniture), shoe upper leather
� � �
� Clothing, bags, other Not applicable Not applicable Not applicable
Preparation of the rawhide as
� Salted goods � � -
� Fresh goods +1% +2,6% -
Rawhide with dung / hypodermis tissue
� Average � � -
� Very high proportion +0.4% +0.9% -
Further processing of drop split
� Internal processing as wet-blue, crust, finished leather
� � -
� External processing +1.65% +4,2% -
� External split procurement (100% of rawhide weight)
-3,4% -8,8% -
Splits
� Splitting before tanning � � -
� No splitting, sale of unsplit WB + 25% +58% -
� Splitting after tanning +2% +5.2% -
Crust (in ross) production
� Crust (in ross) processing (2x dying / 2x drying)
2.4% 0 5.6 %
Thickness of finished leather 1.1 – 1.4 mm � � �
� >1.4 mm +5.6% per 0.1 mm
+5.6% per 0.1 mm
+5.6% per 0.1 mm
� <1.1 mm -5.6% per 0.1 mm
-5.6% per 0.1 mm
-5.6% per 0.1 mm
(+)= increased energy consumption / (-)= reduced energy consumption compared to standard BEET calculation

8
Description of the possible BEET deviations and correction factors
� Leather from cowhide
When other types of raw material are used, very high deviations in energy consumption and the associated CO2 emissions are expected. As a result, BEET is currently only applicable to the processing of cowhide.
� Upholstery and shoe upper leather
Energy consumption for the production of shoe upper leather is similar to that of upholstery leather; deviations are expected for other types of leather. Therefore, BEET is currently only applicable to the production of upholstery and shoe upper leather.
� Preparation of the rawhide as salted goods
The specific weight (kg/m²) of fresh goods is approximately 7-20% higher compared to salted goods. This weight difference is only equalised with the pelt, i.e. after soaking / liming. Since salted goods are usually prepared, this was defined as the BEET reference point.
In the preparation of fresh goods instead of salted goods, the barrel is loaded with 7-20% less area at the same load weight. If the proportion of energy consumption for the soaking / liming process step is approximately 5% of the total production energy, this means the consumption of energy is up to 1% higher when using the same fresh goods mass compared to salted goods in reference to production up to the finished leather stage.
For the production of wet-blue, the proportion of energy consumption for soaking / liming is approximately 13% of the total production energy. Accordingly the consumption of energy for fresh goods preparation compared to salted goods is up to 2,6% higher in this case.
� Contamination with dung / hypodermis connective tissue
Comparable hides may exhibit a weight difference of up to approximately 13% due to varying levels of contamination with dung and hypodermis connective tissue. Hides with a lot of dung / hypodermis connective tissue are heavier for the same area, or conversely, smaller for the same mass. The mass-area ratio is only equalised after soaking. If the proportion of energy consumption for the soaking process step is approximately 3% of the total production energy, this means the consumption of energy is up to 0.4% higher when using fresh goods compared to salted goods in reference to production up to the finished leather stage.
For the production of wet-blue, the proportion of energy consumption for soaking compared to overall production is significantly higher at approximately 7%. Here the preparation of fresh goods instead of salted goods with additional energy consumption of up to 0.9% is assumed for high levels of dung and hypodermis connective tissue.
� Further processing of flesh split
The standard assumption for the BEET calculation is that further processing of the flesh split is entirely internal. This means the area reported as finished leather and / or wet-blue encompasses the production of the top grain and drop split.
If the drop split is not processed internally, this sold area is not taken into account in the calculation of actual specific energy consumption even though energy was consumed in soaking, liming, fleshing and splitting in order to produce it. This is because the drop split is sold as a by-product and not as semi-finished goods.
If no internal data for the produced volumes of drop split are available, approximately 30% for salted goods and approximately 26% for fresh goods can be assessed for the drop split volume based on the rawhide weight.
Approximately 5.5% of the total energy (in case of production from rawhide to finished leather) has therefore been consumed for the sold flesh split during soaking, liming, fleshing and

9
splitting. With the production from rawhide to wet-blue, the energy consumed for the flesh split is approximately 14% of the total energy.
This means that when the entire flesh split is sold, additional energy consumption compared to the BEET of approximately 1.65% (in case of production from rawhide to finished leather) or approximately 4.2% (in case of production from rawhide to wet-blue) can be assessed.
� Bought-in flesh split (not tanned)
If, in addition to production from rawhide, limed or pickled drop split is bought in and prepared, energy is not consumed for the production steps of soaking, liming, fleshing and splitting. However, the produced wet-blue, crust or finished leather area is included in the calculation.
This reduces the company’s actual specific energy consumption compared to the BEET.
At a BEET energy demand of approximately 2.8 MJ/m² (soaking / splitting), approximately 380 MJ of energy would be saved for the preparation of 1 ton of flesh split compared to the preparation of rawhide.
100 kg of raw material yields approximately 45 kg of top grain and 30 kg of drop split.
When the bought-in volume of drop split is approximately equal to the volume of rawhide, this reduces the actual specific energy consumption compared to the BEET by approximately 3.4% for production from rawhide to finished leather. Energy consumption is reduced by 8.8% for production from rawhide to wet-blue.
���� Sale of unsplit wet-blue and / or splitting after tanning
The BEET standard assumes splitting before tanning and the separate tanning of the top grain and drop split.
When splitting only takes place after tanning, the consumption of energy for tanning the unsplit pelt is similar to the separate tanning of the top grain and drop split.
When wet-blue is sold unsplit, approximately 40% less area is sold compared to separate processing and the corresponding sale of top grain and drop split. In the BEET standard, approximately 38% of the energy required for the production of finished leather is consumed for the production of wet-blue. The lower production volume due to the sale of unsplit wet-blue therefore results in an increase of actual specific energy consumption of approximately 25% compared to the production of finished leather from the raw material.
For production from rawhide to wet-blue only, the proportion of energy consumption from liming to tanning is approximately 87%, so that specific energy consumption is approximately 58% higher compared to the separate production of top grain and split leather.
When splitting does not follow liming but rather tanning in the wet-blue or wet-white stage, the area yield can drop by up to 6% depending on the technology that is used. This 6% reduction in area compared to splitting at the pelt stage results in an increase of specific energy consumption of approximately 2% compared to the BEET standard benchmark in reference to the production of finished leather from the raw material.
In the production from rawhide to wet-blue, 6% less wet-blue area results in an increase in specific energy consumption of 5.2% compared to the BEET.

10
� Crust (in ross) production
Leather for use in furniture in particular is often produced as crust (in ross), i.e. the production steps of dyeing and drying are done twice. During dyeing, energy is mainly consumed to drive the barrels and generate hot water while energy consumption for drying is mainly due to generating hot air.
Measurements have indicated increased energy consumption of 1% for dyeing and around 1.4% for drying in reference to the production of finished leather from the raw material. In the production from rawhide to wet-blue, the calculated additional energy consumption is therefore 2.3% for dyeing and 3.3% for drying.
���� Leather thickness greater than / less than 1.1-1.4 mm
The impact of leather thickness on energy demand for production is significant. The desired thickness of the finished leather is already taken into account during splitting, and reduced to the nominal thickness by shaving. This means the leather thickness impacts approximately 95% of the total energy consumption (all processes after splitting). The process steps that require the most energy (tanning, wet trimming, drying) exhibit an almost linear dependency on the thickness of the leather because the barrels are loaded by weight and energy consumption for drying depends on the water volume being evaporated.
• This means that leather with a thickness of >1.4 mm has an energy disadvantage compared to the standard BEET benchmark.
• Leather with a thickness of <1.1 mm exhibits an energy advantage.
Energy demand for starting up machines, heating the dryers, heating, ventilation, lighting, individual process steps, machine idling time etc., which does not depend on leather thickness, is estimated at approximately 30%. The variable energy demand component (70% of total energy) is consumed at an average leather thickness of 1.25 mm. As a result, the BEET standard is corrected by 5.6% per 0.1 mm of leather thickness.
Energydemand (%) depending on the thickness of the leather(1,1-1,4 mm means a basic thickness)
Thickness (mm)

11
1.2 Corporate Carbon Footprint
The corporate carbon footprint encompasses all emissions of greenhouse gases, expressed as CO2 equivalents, within the defined limits of the leather value creation chain.
Participation in external CO2 reduction projects such as environmental programmes monitored by independent organisations (e.g. reforestation according to the carbon fix standard) is taken into account through credits upon providing corresponding proof.
The lifecycle inventory analysis and the interpretation in order to identify priorities for action is conducted with the help of determining
• the company’s actual specific energy consumption on site and its comparison to the BEET benchmark
and
• the emission of CO2 and / or CO2 equivalents within the defined system limits
for a specific leather production operation.
The base data to establish the BEET benchmark as a comparative value for the “Best Energy Efficiency for Tanning” was mainly determined from:
� IPPC/BVT data (2)
� UBA reports
� unpublished data from I-T-G GmbH (3)
� LWG-Tannery Environmental Auditing Protocol 5.2.1(4)
���� Other literature data (R&D)
This results in the following advantages: � Identification and utilisation of potential energy savings and reductions in greenhouse gas
emissions. This can lead to more sustainable, ecological and economical production.
� Marketing tool thanks to positive international comparative figures.
� The impact of variations in potential actions (production, transportation, waste disposal etc.) on specific energy consumption and greenhouse gas emissions is easy to verify.
2. Leather Production Parameters
Indicators per 1 t of rawhide (salted goods / cowhide) from IPPC - BAT Notes/Fig. 3.1: (2)
Trimming waste, not tanned 120 kg/t
Machine glue stock 70-350 kg/t
Tanned shavings, trimming waste 225 kg/t
Dust 2 kg/t
Dressed / dyed trimming waste 30 kg/t
Chemicals volume 500 kg/t

12
3. System boundaries
An important factor in determining the corporate carbon footprint is establishing the system limits, i.e. what processes within the production chain will be examined and which emissions will be taken into account. In keeping with existing standards and norms, the production process itself as well as upstream and downstream processes were included here.
The diagram below provides an overview of the system boundaries for leather production defined here:
� The area with a dark or grey background is not included in this model calculation of the CCF.
� The light, green-blue are corresponds to the emission of CO2 and / or CO2 equivalents taken into account here for the calculation of the CCF.
� The production area with the red frame within the green-blue field represents the system limits of the BEET benchmark.
� The numbers in front of the emission sources correspond to the sections in which the respective areas are discussed.
� In this CCF model, the production process is examined first as a central element followed by the upstream and downstream processes.
Figure 1: System limits for the CCF and BEET model calculation (1)

13
3.1 Production
3.1.1 Recording Raw Material and End Products
In principle, calculating the company's actual specific energy consumption and comparing it to the BEET benchmark is done on the basis of “m² of end product”, where the end product may be wet-blue or wet-white, crust, finished leather or a mix of these different products. When rawhide is the raw material, the known quantity and / or volume by weight is converted at the area yields specific to the company. The internal company averages for “m²/hide” or the yield for “m²/t” must be known for this purpose. Since the yield is highly dependent on the raw material, weight classes and country of origin as well as the types of leather being produced, specifying a generally applicable conversion factor is not possible.
When a leather factory runs production from rawhide to finished leather without buying or selling intermediate products, to total production volume as “rawhide to finished leather” is included in the model calculation in “m² finished leather”. The calculation is just as simple for the production of just one end product from only one type of “semi-finished goods”, e.g. exclusively “from wet blue to crust” or “from wet-blue to finished leather” or “from crust to finished leather”.
But if a production facility manufactures various semi-finished and finished goods (e.g. wet-blue, crust or finished leather), or if various types of raw material are bought (e.g. both rawhide and wet-blue or crust), the respective volumes of the prepared raw material and the various types of finished goods must be recorded separately and assigned to the respective manufacturing process in order to calculate the company-specific actual energy consumption comparable for BEET purposes. This is why the specific production volumes for the individual production steps in the model calculation programme are allocated to the respective, existing BEET benchmark for each production process on a percentage basis. The acquisition period is usually one calendar year. The acquisition period for the corresponding consumption of chemicals and energy must be identical.
Insofar as the products are bought in or taken out of production, the following preparation and end product volumes must be recorded separately by volume (units, kg of rawhide or m2 of leather).
� Rawhide to wet-blue: rawhide volume and quantity; wet-blue and / or wet-white area; sold and / or bought-in volume of drop split; produced split leather area
� Rawhide to crust: rawhide volume and quantity; produced crust area; sold and / or bought-in wet-blue and / or wet-white area; sold and / or bought-in volume of drop split; sold and / or bought-in split leather area
� Rawhide to finished leather: rawhide volume and quantity; produced finished leather area; sold and / or bought-in crust area; sold and / or bought-in wet-blue and / or wet-white area; sold and / or bought-in volume of drop split; sold and / or bought-in split leather area
� Wet-blue to finished leather: wet-blue and / or wet-white area; sold and / or bought-in crust area; produced finished leather area
� Crust to finished leather: crust area; produced finished leather area
� Wet-blue to crust: wet-blue and / or wet-white area; crust area
Since the area processed within the production steps with the simultaneous preparation of various products (rawhide, wet-blue, crust) and the production of various products (wet-blue, crust, finished leather) is often difficult to capture, the known product volumes (preparation / production) for the determination of the company’s actual specific energy consumption and its comparison to the adapted BEET benchmark can be entered into a product schema in order to determine the corresponding production steps. Here product schema 1 is used for production starting with rawhide and product schema 2 for production starting with wet-blue / wet-white. The product schema data are part of a calculation tool which is available to the appointed auditors. In order to illustrate the possible product flows, excerpts of the input screens are reproduced below.

14
Product schema 1 (for production starting with rawhide)

15
2.2.2 Production data input for processing different products from wet-blue
Fill out the yellow cells ONLY! Subsequently, enter the calculated red results from Table 1
in the BEET and CO2 calculation under 2.2.3.
Table 1: Calculation for Input in 2.2.3 Input for information (no impact on calculation)
from to kg/hide
WB/WW Crust 0 m² kg/hide
WB/WW Finished leather 0 m² m²/hide
Crust Finished leather 0 m²
TOTAL 0 m²
WB/WW 0 m² Spl i t in WB poss ible
WB/WW to crust
0 m² crust
production Crust 0 m²
Crust 0 m²
Crust to finished leather
Finished leather 0 m²
Table overview of the production data entered in the diagram:
WB/WW 0 m² Crust 0 m² Crust 0 m²
Crust 0 m² Finished leather 0 m²
Preparation 0 m² Sales / inventory 0 m²
Flow of goods for end production step (sale / warehouse)
Internal intermediate production =
total produced volume (not sales /
inventory)
Annual preparation (procurement) directly to production:
(Excluding procurement for inventory)
Annual production volume that leaves
production (direct sales or to inventory)
Hide weight WB/WW
Hide weight crust
Area/hide
PREPARATION PRODUCTION SALES / INVENTORY
Product schema 2 (for production starting with wet-blue / wet-white)
3.1.2 Energy Consumption in Production
The total energy consumption for all external and internal energy sources is recorded as an annual consumption volume, and is converted and evaluated in MJ/m² for comparison to the BEET benchmark.
The CO2 emissions and / or emission equivalents resulting from the production and / or combustion of fossil fuels (e.g. oil, natural gas, coal) are calculated and evaluated.
Emissions from the combustion of renewable resources (biogas, wood, oil from animal fats etc.) or the generation of renewable energy such as solar, wind, geothermal etc. are evaluated as CO2-neutral. Electrical energy from nuclear generation is initially evaluated as CO2-neutral as well, even though the potential environmental impact of this energy source is known.
If, for example, biological diesel fuel replacement (oil) from machine glue stock is produced on the premises and used directly as an energy source within the company, the energy needed for the preparation process (electricity / steam) is included, but no emission data are calculated for the combustion of this diesel replacement fuel (CO2-neutral). Producing and directly consuming this replacement fuel means the operation purchases less fossil diesel and / or gas, therefore improving the emission balance.

16
3.1.2.1 Chrome Recycling and Hydrolysis of Shavings
In-house chrome recycling and the hydrolysis of shavings are generally intended to produce chemicals (chrome and / or proteins or fillers for retanning). This is why energy consumption for preparation is not included, since the current system also does not include energy consumption and / or CO2 emissions for the production of chemicals.
When energy consumption for chrome recycling is not captured separately, it can be estimated and deducted from total energy consumption for production. Energy consumption of approximately 0.8 kWh/m³ of recycling liquor can be assessed for chrome recycling. A tanning liquor float length of approximately 50% results in energy consumption for chrome recycling of approximately 0.002 kWh/m2 of leather or 0.006 kg CO2/m2 of leather (1).
But when a leather factory, deviating from the existing ECO2L and BEET standard, wants to include the energy demand for the production of input chemicals in its internal corporate carbon footprint, the expenditure for the chemicals used for in-house production also has to be included in the calculation.
3.1.2.2 Recording the Energy Sources and Energy Consumption
The required energy for comparison to the BEET is captured for the following areas:
� For the production process including administration and ancillary processes, but
� excluding chrome recycling
� excluding the hydrolysis of shavings
� excluding oil / protein extraction from glue stock, when the oil / protein is sold externally
� including oil extraction from glue stock, when the oil is used thermally as diesel replacement fuel for in-house production
� excluding in-house biogas production, when the biogas is sold externally and / or the heat and electricity generated with it is sold externally
� including in-house biogas production, when the biogas is used thermally in-house as a replacement fuel
� excluding social institutions (cafeteria, employee housing etc.)
� excluding cold storage house
� including well water / river water procurement
� For waste water treatment including mechanical sludge dewatering, but without sludge drying
If the heat from the operation of a biogas plant is used internally and the electricity sold externally, the energy required for operation is also included on a pro-rata basis.
The CO2 emission data for the various types of fuel were taken from the UBA (5), Öko-Institut (6), PROBAS (7) and GEMIS (8) databases.

17
The respective energy consumption for the individual production steps is calculated based on the production data and energy consumption in production, compared to the corresponding BEET data, and the percentage deviations are determined:

18
3.1.3 Employees: Travel to and from Work
CO2 emissions generated by employees through the use of private and public means of transport to and from work are not included.
However, insofar as a leather factory wants to deviate from the existing ECO2L standard and include these emissions in its own, internal carbon footprint, the following average values can be used as approximations for allocation or a precise, detailed data capture can be conducted:
Average distance to / from place of work: 2 x 10 km
CO2 emissions for a midsize car: 150 g CO2/passenger vehicle x km
Working days/year: 230 days/year
Average CO2 emissions/employee for travel to/from work: 690 kg CO2/year
Division by the annual in-house rawhide processing and / or finished leather production volume and multiplication by the number of employees results in the specific CO2 emissions per employee and m2 of leather and / or semi-finished goods.
3.2 Upstream Processes
Processes that precede leather production at the location but belong to the production chain as a whole can be viewed and defined as upstream processes. For the product “upholstery leather from cowhide”, these can generally include hide harvesting and handling, subsequent transportation of the hide and the production and transportation of semi-finished goods to the leather factory. The production and

19
transportation of the required chemicals, the transportation of other goods (machines, replacement parts, office supplies etc.) as well as energy generation can also be included in this upstream chain. If the production process as well as all upstream and downstream processes “from the cradle to the grave" were taken into account, the product carbon footprint (PCF) would be calculated.
The processes actually included in the existing calculation mode for the corporate carbon footprint are defined below.
3.2.1 Cattle farming / Fattening and Production of Split, Wet-Blue or Crust as Raw Material
The CO2 emissions from cattle farming / fattening were not included in the calculation for the following reasons: cattle are produced primarily for milk or meat production but not specifically for leather production. The hide is a by-product which is utilised for the production of leather. Insofar as semi-finished goods such as split, wet-white, wet-blue or crust are bought in as raw material, the energy required for the production of these preliminary products is not included in the calculation. Plans are in place to develop the ECO2L label into a product-specific approach. This product carbon footprint will also include the emissions for preliminary products.
3.2.2 Raw hide winning and Preservation
Hide harvesting and preservation for trading in hides are not included in the ECO2L model.
3.2.3 Transportation of Rawhide from assembly center to Leather Factory
The transportation of rawhide from the assembly center of a hide dealer or from the slaughterhouse to the leather factory is included in the corporate carbon footprint, since the company being evaluated can usually influence it (e.g. regional procurement of raw material, means of transport optimisation and selection).
Insofar as detailed, exact distance information is available, it can be used for the calculation of transportation emissions. However, the average distances below can also be used in order to simplify the calculation. Niederdorla, Thuringia as the geographical centre of Germany is used as a reference point for this purpose. This results in the following distances for German tanneries:
� Slaughterhouse in Germany: 450 km
� Slaughterhouse in Europe, outside of Germany: 2,000 km
� Slaughterhouse outside Europe (exception Australia): 10,000 km
� Slaughterhouse in Australia: 15,000 km
For the definition of the point of origin, the location of the cattle slaughterhouse and / or the distribution warehouse of the hide dealer is applicable, not the registered office of the hide dealer.
Transportation km have to be determined separately for tanneries located outside of Germany.
Means of transport are differentiated as follows: truck (within Germany / EU), sea going ship, rail and aircraft. The respective average CO2 value for fully loaded transports is assumed in each case (9).
� Aircraft 0.632 kg CO2/t x km
� Ship (sea-going) / rail 0.015 kg CO2/t x km
� Truck 0.075 kg CO2/t x km

20
3.2.4 Transportation of Preliminary Products as Raw Material (Split, Wet-Blue, Wet-White,
Crust) to the Leather Factory
The transportation of all preliminary products from the supplier’s distribution warehouse to the tannery is included in the model calculation for the corporate carbon footprint. The same base data as described in Section 3.2.3 apply.
In the current version, the transportation of economic goods such as machines, replacement parts and office supplies is not included.
3.2.5 Production of Chemicals
CO2 emissions from the production of chemicals are not included in the current ECO2L calculation. Insofar as a leather factory wants to report product-specific CO2 emissions for its leather, the data from the CTC study (10) for energy consumption in the production of chemicals for chrome-tanned leather can be used for allocation. The energy consumption calculated there is 21 kWh/m² of leather and, when the European CO2 emission factor of 0.310 kg CO2/kWh is taken into account, corresponds to CO2
emissions of 6.51 kg CO2/m².
3.2.6 Transportation of Chemicals from Production Site to Central Chemicals Distribution
Warehouse
The CO2 emissions for the transportation of chemicals from the production site to the distribution warehouse are not included in the calculation of the CO2 footprint.
3.2.7 Transportation of Chemicals from Central Warehouse to Leather Factory
The transportation of chemicals from the central warehouse (e.g. BASF Ludwigshafen, Clariant Stuttgart, TFL Basel etc.) to the leather factory is included.
Here the same conditions as described in Section 3.2.3 apply.

21
3.2.8 Emissions from External Energy Generation
The CO2 emissions for the generation of externally procured electrical energy are included in the calculation. For the CO2 emissions from the generation of electricity, the energy mix of the energy sources that are used is crucial. This means there are significant differences between the specific emission factors of various countries / providers.
Insofar as the audited leather factory is unable to provide documented proof of the CO2 emissions from the generation of externally procured electrical energy for the period under review, the 2009
European emission factor is used for the ECO2L standard determined here:
0.289 kg CO2/kWh
The worldwide or country-specific emission factors for electrical energy were taken from the database of the International Energy Agency (11).
Examples of additional emission factors listed there for 2009:
North America: 0.466 kg CO2/kWh
Latin America: 0,175 kg CO2/kWh
Asia: 0.745 kg CO2/kWh
Australia: 0.853 kg CO2/kWh
Africa: 0,643 kg CO2/kWh

22
For externally procured energy and in-house energy generation from fossil energy sources such as heating oil EL, diesel, heavy fuel oil, natural gas H, LPG and coal, the CO2 emission factors according to Table 2.1 in Section 3.1.2.2 of this manual are used for the ECO2L standard in each case.
The volume of external procurement and in-house generation of energy from renewable raw materials, e.g. biogas, bio-oil, wood or pellets, and from renewable sources (e.g. wind, solar, water) is captured in the existing ECO2L standard but evaluated as CO2-neutral. This means that the entire energy consumption in comparison to the BEET benchmark is captured and included, but only fossil energy sources generate CO2 emissions in the CCF calculation. Nuclear waste from atomic energy generation, as well as the production of fuel rods etc., is not included here (in contrast to an environmental performance assessment).
3.3 Downstream Processes
Processes that follow production and consume energy or generate CO2 emissions generally include the transportation of the manufactured products, the usage phase and the disposal of the products. The treatment / discharge of waste water from production, wastes, by-products and ancillary products also belongs in this category. Which of these processes are included in this corporate carbon footprint calculation model is defined below.
3.3.1 Transportation of Leather / Semi-Finished Goods to the Customer
The subsequent transportation to the customer of semi-finished goods produced in the leather factory, e.g. split, wet-blue or crust as well as finished leather, is not included in the corporate carbon footprint calculation. According to the definition of the ECO2L label, this transportation would be included in the corporate carbon footprint of the customer.
3.3.2 Usage Phase of Leather
CO2 emissions in the usage phase are not included in the ECO2L model.
A possible product-specific approach would at least have to differentiate between uses for various types of leather. While upholstery leather, for example, does not generate direct CO2 emissions during its usage phase in furniture, the weight contributed by automobile upholstery leather to the weight of the car during the usage phase must be considered and a percentage of the CO2 emissions generated by the vehicle has to be allocated.
An internal company study (1) for a midsize car with leather interior (8m²/passenger vehicle) established that the leather accounted for approximately 0.5% of the total weight. At a vehicle lifecycle of 250,000 km, the CO2 emissions would be 65 kg of CO2 for the entire leather weight in the vehicle or 8.1 kg CO2/m² of leather.
3.3.3 Disposal of Leather after the Usage Phase
The disposal of leather and therefore the possible CO2 emissions of leather after the end of the usage phase varies widely, depending on the disposal method. This is not included in the ECO2L label.
However, possible emissions for determining a product carbon footprint are nevertheless described briefly below.
3.3.3.1 Disposal of Automotive Leather
In Germany and the EU, the disposal of automotive leather is traceable thanks to the existing laws. Automotive leather as the “shredder lightweight fraction” is generally treated thermally and used for energy generation. A heating value of at least 11,000 kJ/kg must be assured for the thermal utilisation
23
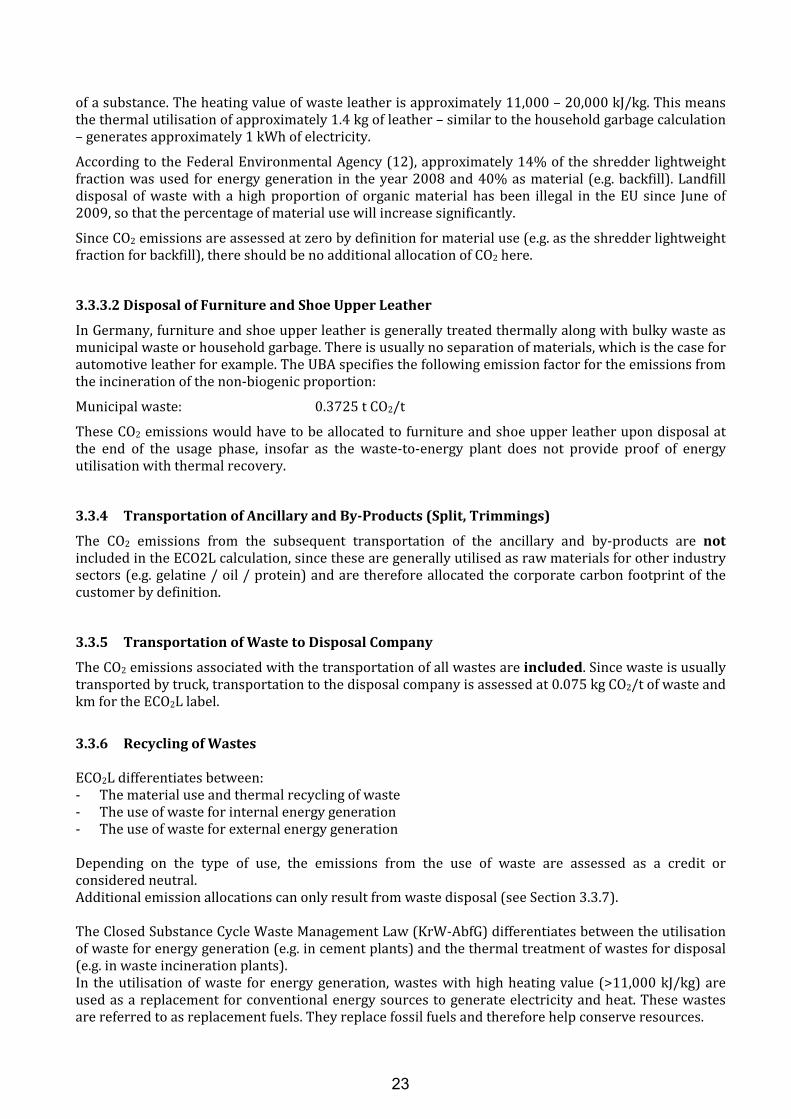
of a substance. The heating value of waste leather is approximately 11,000 – 20,000 kJ/kg. This means the thermal utilisation of approximately 1.4 kg of leather – similar to the household garbage calculation – generates approximately 1 kWh of electricity.
According to the Federal Environmental Agency (12), approximately 14% of the shredder lightweight fraction was used for energy generation in the year 2008 and 40% as material (e.g. backfill). Landfill disposal of waste with a high proportion of organic material has been illegal in the EU since June of 2009, so that the percentage of material use will increase significantly.
Since CO2 emissions are assessed at zero by definition for material use (e.g. as the shredder lightweight fraction for backfill), there should be no additional allocation of CO2 here.
3.3.3.2 Disposal of Furniture and Shoe Upper Leather
In Germany, furniture and shoe upper leather is generally treated thermally along with bulky waste as municipal waste or household garbage. There is usually no separation of materials, which is the case for automotive leather for example. The UBA specifies the following emission factor for the emissions from the incineration of the non-biogenic proportion:
Municipal waste: 0.3725 t CO2/t
These CO2 emissions would have to be allocated to furniture and shoe upper leather upon disposal at the end of the usage phase, insofar as the waste-to-energy plant does not provide proof of energy utilisation with thermal recovery.
3.3.4 Transportation of Ancillary and By-Products (Split, Trimmings)
The CO2 emissions from the subsequent transportation of the ancillary and by-products are not included in the ECO2L calculation, since these are generally utilised as raw materials for other industry sectors (e.g. gelatine / oil / protein) and are therefore allocated the corporate carbon footprint of the customer by definition.
3.3.5 Transportation of Waste to Disposal Company
The CO2 emissions associated with the transportation of all wastes are included. Since waste is usually transported by truck, transportation to the disposal company is assessed at 0.075 kg CO2/t of waste and km for the ECO2L label.
3.3.6 Recycling of Wastes
ECO2L differentiates between: - The material use and thermal recycling of waste - The use of waste for internal energy generation - The use of waste for external energy generation Depending on the type of use, the emissions from the use of waste are assessed as a credit or considered neutral. Additional emission allocations can only result from waste disposal (see Section 3.3.7). The Closed Substance Cycle Waste Management Law (KrW-AbfG) differentiates between the utilisation of waste for energy generation (e.g. in cement plants) and the thermal treatment of wastes for disposal (e.g. in waste incineration plants). In the utilisation of waste for energy generation, wastes with high heating value (>11,000 kJ/kg) are used as a replacement for conventional energy sources to generate electricity and heat. These wastes are referred to as replacement fuels. They replace fossil fuels and therefore help conserve resources.

24
The following principles apply for the CO2 emissions from waste recycling under the ECO2L approach. Evaluated as neutral in terms of CO2 emissions:
� Proven material use (recycling) � Utilisation for internal energy generation
A CO2 emission credit applies for:
� Proven thermal utilisation with external use of energy � Reduction of CO2 emission by material re-use instead of using new raw materials
3.3.6.1 Material Use of Wastes
CO2 emissions are not assessed when material utilisation is proven. When wastes are used as material, the substance properties are exploited and the wastes are returned to an economic cycle. A positive account will be given, if there is an energy advantage by using recycling material instead of new raw materials. As a rule they replace other raw materials in this case. Material utilisation includes, for example:
� Use as a construction material (e.g. replacement landfill construction material, cement production)
� Use as a raw material � Biological use (composting, fermenting, agriculture & forestry) � Use in mining (backfill in mines)
3.3.6.2 Use of Wastes for Biogas or Oil Production with External Energy Utilisation
When hide waste (e.g. machine glue stock) is used as feedstock for an external biogas plant and the resulting biogas is used for external energy generation, fossil fuels are replaced. A CO2 emission credit is therefore issued.
I-T-G currently has the following data available from internal customer measurements for the extraction of replacement fuel from machine glue stock (MGS) (16):
Dry matter content of MGS: approx. 20–40%; Organic proportion of MGS dry matter, green: approx. 98% Organic proportion of MGS dry matter, limed: approx. 65-85% An average dry matter content of approximately 30% and an organic proportion of approximately 75% results in an organic dry matter content (oDM) in machine glue stock of approximately 22%.
Gas production: approx. 0.3 – 0.7 m³ biogas/kg oDM MGS
approx. 0.07-0.15 m³ biogas/ kg MGS (22% oDM)
Heating value: approx. 21.6 MJ/m³ biogas approx. 15 MJ/kg oDM MGS
Energy yield MGS (22% oDM): approx. 3.3 MJ/kg MGS. Heating oil equivalent of biogas: 0.6 -0.65 l oil/m³ biogas CO2 emissions, heating oil: 2.62 kg CO2/l Approximately 0.15 m³ of biogas can be extracted from 1 kg of MGS, which corresponds to a heating oil equivalent of 0.09 l heating oil or a reduction in CO2 emissions of

25
� 0.235 kg CO2/kg MGS
When machine glue stock is treated on site using the so-called “flesh-to-fuel” process, which means oil is recovered and proof of external use is provided, for example as diesel replacement fuel, credits are also issued.
According to internal ITG evaluations, the heating value of the oil is approximately 96% compared to diesel fuel. Accordingly the external utilisation of 1 l of oil as a replacement fuel can be credited with the emission value of diesel fuel:
� 2.64 kg CO2/litre of oil
3.3.6.3 Use of Wastes for Biogas or Oil Production with Internal Energy Utilisation
There is no CO2 credit for the internal, own use of the resulting biogas in the operation, since the volume of fossil energy sources purchased and burned is reduced by the use of biogas. When machine glue stock is treated on site using the so-called “flesh-to-fuel” process (recovery of oil for use as diesel replacement fuel), additional emissions are generated due to the electricity and heat demand of the process. This additional consumption of energy is included in production.
The thermal / energy use of renewable resources from animal sources is CO2-neutral (20).
With the simultaneous use of the extracted oil as diesel replacement fuel, correspondingly less diesel is also purchased and CO2 emissions from fossil sources are therefore reduced.
3.3.6.4 Use of Leather Waste, Shavings, Leather Dust with External Energy Utilisation
When proof of external thermal treatment and energy generation is provided, the generated and recycled energy is allocated and a credit is issued for the resulting reduction in CO2 emissions. The heating value of leather waste, shavings, leather dust etc. is approximately 11,000 – 20,000 kJ/kg. Operations that use these materials thermally (incineration plants) must provide heating value analyses and corresponding confirmation that the supplied waste is used to generate energy.
Co-incineration in cement plants with proof of utilisation for energy generation produces approximately 1 kWh of electricity from approximately 1.4 kg of leather (14).
Based on the European emission factor for electrical energy of 0.310 kg CO2/kWh, a credit can therefore be issued for the use of leather for energy generation at the rate of 0.310 kg co2 per 1.4 kg of leather or
� 0.221 kg CO2/kg of leather, shavings or leather dust
3.3.6.5 Use of Effluent Sludge through Gasification with External Energy Utilisation
A CO2 credit is issued for the external gasification of effluent sludge and the use of the gas for energy generation. The gasification of effluent sludge is considered a consistent implementation of the closed substance cycle law. Furthermore, recycling effluent sludge makes a contribution towards reducing CO2 emissions, provided that the resulting electrical or thermal energy is used (15). This leads to a reduction in CO2 emissions of approximately 1300 kg CO2/t of dry matter or
� 455 kg CO2/t of effluent sludge – 35% dry matter

26
(Note: when effluent sludge has to be dried prior to gasification (which can be assumed as a rule, except for wet oxidation), the energy expended for drying has to be deducted from the CO2 credit. This should be done, or it should be pointed out that this expenditure has already been taken into account.)
3.3.7 Waste Disposal
CO2 emissions resulting from waste disposal (with no energy or material utilisation) must be included
in and added to the CCF calculation.
Since landfill disposal without treatment is no longer possible in the EU as a rule because of the high proportion of organic matter, only thermal disposal is considered here.
The UBA specifies the following emission factors for the emissions from the combustion of the non-biogenic fraction:
� Municipal waste: 0.3725 t CO2/t
� Special waste: 0.6224 t CO2/t
� Effluent sludge dry matter: 0.900 t CO2/t
� Effluent sludge 35% dry matter: 0.315 t CO2/t
According to the UBA, the following emission values apply for the disposal of commercial waste through thermal treatment:
� Commercial wood waste 1.268 kg CO2/kg
� Used oil 2.70 kg CO2/kg
� Paper 1.30 kg CO2/kg
� Plastics 1.85 kg CO2/kg
3.3.8 Waste Water Transportation and Treatment
The CO2 emissions for the transportation and treatment of waste water using an in-house waste water treatment plant and / or a municipal waste water treatment plant are included in the corporate carbon footprint.
Energy (in kWh) used for the operation of an in-house waste water treatment plant must be recorded separately from energy for the production processes.
3.3.8.1 Direct Discharge into Receiving Waters
Insofar as in-house water treatment results in fully purified water for subsequent discharge into a body of water or other receiving waters, energy consumption for waste water treatment is already fully taken into account along with the calculation of CO2 emissions. This value is included directly in the CCF.
3.3.8.2 Indirect Discharge into Municipal / Industrial Waste Water Treatment Plant
When in-house waste water treatment only consists of pre-treatment (indirect discharge) limited to specific parameters, the pre-treated waste water is usually discharged into the external sewer network for further treatment in a municipal waste water treatment plant. In some cases, further treatment also takes place in a central industrial treatment plant.
27
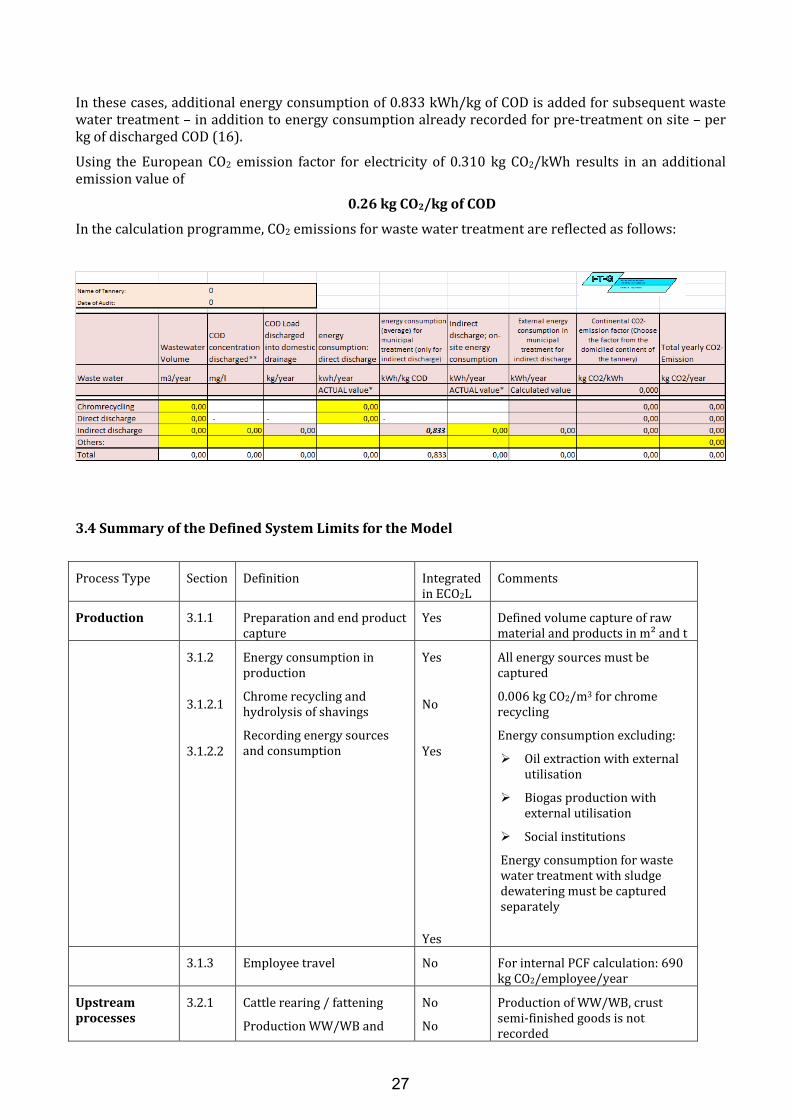
In these cases, additional energy consumption of 0.833 kWh/kg of COD is added for subsequent waste water treatment – in addition to energy consumption already recorded for pre-treatment on site – per kg of discharged COD (16).
Using the European CO2 emission factor for electricity of 0.310 kg CO2/kWh results in an additional emission value of
0.26 kg CO2/kg of COD
In the calculation programme, CO2 emissions for waste water treatment are reflected as follows:
3.4 Summary of the Defined System Limits for the Model
Process Type Section Definition Integrated in ECO2L
Comments
Production 3.1.1 Preparation and end product capture
Yes Defined volume capture of raw material and products in m² and t
3.1.2
3.1.2.1
3.1.2.2
Energy consumption in production
Chrome recycling and hydrolysis of shavings
Recording energy sources and consumption
Yes
No
Yes
Yes
All energy sources must be captured
0.006 kg CO2/m3 for chrome recycling
Energy consumption excluding:
� Oil extraction with external utilisation
� Biogas production with external utilisation
� Social institutions
Energy consumption for waste water treatment with sludge dewatering must be captured separately
3.1.3 Employee travel No For internal PCF calculation: 690 kg CO2/employee/year
Upstream
processes
3.2.1 Cattle rearing / fattening
Production WW/WB and
No
No
Production of WW/WB, crust semi-finished goods is not recorded

28
crust (when bought in as raw material)
3.2.2 Transportation of cattle to the slaughterhouse / slaughtering process
No
3.2.3 Transportation of rawhide from the slaughterhouse to the leather factory
Yes Distance and means of transportation are taken into account
3.2.4 Transportation of all raw material (VW, split, crust etc.) to the tannery
Yes Distance and means of transportation are taken into account
3.2.5 Production of chemicals No Possible inclusion with internal PCF calculation:
6.51 kg CO2/m²
3.2.6 Transportation of chemicals from production location to central warehouse
No
3.2.7 Transportation of chemicals from central warehouse to tannery
Yes Distance and means of transportation are taken into account
3.2.8 Emissions from external energy generation
Yes 2007 European emission factor for electrical energy: 0.310 kg CO2/kWh
Downstream
processes
3.3.1 Transportation of leather and other end products to the customer
No
3.3.2 Usage phase of leather No Internal PCF calculation for automotive leather, if applicable, 8.1 kg CO2/m²
3.3.3
3.3.3.1
3.3.3.2
Disposal of leather after the usage phase
Automotive leather, furniture / shoe upper leather
No The following can be assumed for internal PCF calculations:
Automotive leather: no CO2 emissions from recycling
Furniture leather with incineration as municipal waste: 0.3725 t CO2/t
3.3.4 Transportation of ancillary and by-products
No Products are used as new raw materials
3.3.5 Transportation of waste to disposal company
Yes For transportation by truck: 0.075 kg CO2/t of waste x km
3.3.6 Recycling of wastes Yes
3.3.6.1 Material use of effluent sludge and wastes
Yes No emission allocation for material use
3.3.6.2 Utilisation of MGS for energy generation with external use of biogas or oil
Yes Biogas credit: 0.235 kg CO2/kg MGS
Replacement fuel credit: 2.64 kg CO2/litre of oil
3.3.6.3 Utilisation of MGS for energy generation with internal use of biogas or oil
Yes CO2-neutral utilisation

29
3.3.6.4 Use of leather waste, shavings etc. for energy generation
Yes Credit of 0.221 kg CO2/kg of leather, shavings etc.
3.3.6.5 Gasification of effluent sludge for energy generation
Yes Credit of 455 kg CO2/t effluent sludge - 35% dry matter
3.3.7 Waste disposal Yes Incineration as household garbage / special waste / effluent sludge:
Municipal waste: 0.3725 tCO2/t
Special waste: 0.6224 t CO2/t
Effluent sludge dry matter: 0.900 t CO2/t
Effluent sludge - 35% dry matter: 0.315 t CO2/t
3.3.8 Waste water transportation / treatment
Yes Direct discharge: electricity consumption of in-house waste water treatment plant
Indirect discharge: in-house electricity consumption + 0.26 kg CO2/kg of COD for subsequent external treatment
4. CO2 Balance and Calculation
In the ECO2L calculation model, the energy content of all energy sources for production, depending on the production processes, is calculated as MJ/m² of leather or semi-finished goods. The current consumption value calculated for the period of 1 year is compared to the location-specific BEET (Best Energy Efficiency for Tanning) benchmark that was determined, and the percentage deviation is reported.
In addition to this specific energy consumption, CO2 equivalents are calculated for production as well as the upstream and downstream processes within defined system limits.
Insofar as the actual energy consumption determined by an approved auditor does not exceed the BEET by more than 20% and the CCF has been calculated, the tannery can use the ECO2L label as defined for a period of 3 years.
The leather factory has to provide the data below in the form of annual figures. The same acquisition period applies to all data:
� Volume of chemicals and location of the corresponding central distribution warehouses
� Preparation volumes* and corresponding countries of origin or slaughterhouses
� Production volume**, semi-finished goods and finished leather, leaving production
� Electrical energy consumption in production
� Consumption of all other energy sources (fossil and renewable) for production
� Volume of all wastes and by-products with disposal method and transportation distance
� Waste water volumes and energy consumption for their treatment. For indirect discharge: COD discharge concentration

30
* When production is reported in “number of hides”, conversion is required using the specified internal conversion factors (kg/hide; m2/hide). If no internal conversion data are available, the conversion factors and reference values listed in the appendix may be used.
** The following subsets of the total preparation or end product volume must be known:
� Rawhide to wet-blue
� Rawhide to crust
� Rawhide to finished leather
� Wet-blue to finished leather
� Crust to finished leather
� Wet-blue to crust
� The internal and external processing of drop split after liming can be taken into account through correction factors.
4.1 Percentage Distribution of Energy Demand / CO2 Emissions for CCF Model, Leather
Factory Example
By way of an example, the following energy distribution was determined for a leather factory:
In the percentage distribution of energy consumption under the existing CCF sample model, it becomes apparent that by far the largest share at more than 70% is consumed in the production process itself. This means the tanner also has the most opportunity here to reduce energy consumption, e.g. through the use of energy-efficient technologies, by optimising the formulations or by insulating pipework and buildings.
Another significant factor is the transportation of raw material and supplies at approximately 20% of total energy consumption. Since this is mainly due to fuel consumption, the tanner may have options to procure chemicals and raw materials as close to the production site as possible.
Downstream processes such as waste water and waste disposal and / or the recycling of ancillary and by-products tend to play more of a subordinate role in the chosen example with 10%.

31
74%
18%
3%
5%
Productionprocess : 74%
Upstream transportation
(procurement of rawmaterials):
18 %
Downstream processes
(wastewater): 3%
Downstream Processes (waste
and by products): 5%
Energy distribution (MJ/m³) based on an example of a full working tannery from rawhide to finish
Energy consumption: Example of the percentage distribution of energy consumption for a leather manufacturer (end-to-end tanning operation) under the existing CCF model
When the emissions of CO2 and / or CO2 equivalents within the defined system limits are examined in the chosen example, the production process itself at over 80% is once again discernible as the main emission source. The tannery chosen here as an example does not use any alternative energy sources such as solar, geothermal, wood pellets, biogas or renewable electricity. Recognised reforestation programmes for CO2 reduction are not utilised either. The tannery would therefore have options for the reduction of CO2 emissions.
For the upstream transportation of raw materials and supplies at approximately 20% of the CO2 emissions, the statement made under energy expenditure also applies: emissions could mainly be reduced through possible procurement in the vicinity of the production site.
The downstream process of waste water treatment up to discharge into receiving waters (river, ocean, lake etc.) plays a subordinate role at approximately 4% of total CO2 emissions. But since this usually consists mainly of CO2 emissions from the consumption of electricity, this proportion could be reduced through the consistent use of electricity from renewable sources (e.g. hydro, wind, photovoltaics).
In this example, the tannery receives a CO2 emission credit of 11% for waste recycling and disposal, since e.g. machine glue stock is utilised thermally for energy generation in an external biogas plant. By-products and wastes are used as material or recycled as far as possible, and thereby produce little additional CO2 emissions.

32
87
20
4-11
production process : 87 %
Upstream transportation
(procurement of rawmaterials):
20%
Downstream processes
(wastewater): 4%
Downstream Processes (waste
and by products): - 11%
CO2-Emission distribution (kg CO2/m²) based on an example of a full working tannery
from rawhide to finish
CO2 emissions: Example of the percentage distribution of CO2 equivalent emissions for a leather manufacturer (end-to-end tanning operation) under the existing CCF model

33
Appendix
General Conversion Factors
Insofar as a tannery does not have known internal conversion factors, the following data can be used.
Fresh hide weight, bull: 37-51 kg
Average hide weight, bull (Germany): 45 kg
Average hide weight, cow (Germany): 35 kg
Average large animal hide (Germany): 36-39 kg
Average cattle hide (global): 28 kg
Green weight (17): 100 %
Salted weight: 90 % of green weight
Pelt weight: 70-95% of green weight
Pickled weight: 65 % of green weight
Average size m²/bull hide (Germany): 3.25 – 5 m²
Area and weight yield, rawhide (17)
USA packers (23/27 kg): 0.158 m²/kg
Argentinean cattle (14/16 kg): 0.141 m²/kg
Scandinavian cattle (17/24 kg): 0.185 m²/kg
Cows, Central Europe (30/39.5 kg): 0.154 m²/kg
Bulls, Central Europe (30/39.5 kg): 0.122 m²/kg

34
Bibliography
1) Flachowsky, Holm; unpublished; Lederfabrik Bader, 89335 Ichenhausen 2) Integrierte Vermeidung und Verminderung der Umweltverschmutzung (IVU);
Referenzdokument für die Besten Verfügbaren Techniken für die Lederindustrie; 2003 3) Knödler, Jutta; I-T-G GmbH, Ingenieurgemeinschaft für Umwelttechnologie, 72810 Gomaringen;
unpublished collection of energy data; 2000-2010 4) Leather-Working-Group LWG; www.leatherworkinggroup.com ;
Tannery Environmental Auditing Protocol 5.2.1 – Dec. 2010 5) Federal Environmental Agency, 06844 Dessau; www.uba.de 6) Ökoinstitut Freiburg www.öko.de 7) PROBAS-Prozessorientierte Basisdaten für Umweltmanagement Instrumente
www.probas.umweltbundesamt.de 8) GEMIS databases - Global Emission Model for Integrated Systems
www .oeko.de/service/gemis 9) ECOTransIT - Ecological Transport Information Tool; www.ECOTransIT. org 10) Poncet, Lety; CTC-Centre Technique Cuir, 69367 Lyon: Leather and Lifecycle Assessment 11) International Energy Agency (IEA); www.sunearthtools.com 12) Federal Environmental Agency, 06844 Dessau: www.umweltbundesamt-daten-zur-Umwelt.de 13) Knödler, Jutta; I-T-G GmbH, 72810 Gomaringen: Flesh-to-Fuel; publicly funded by: EDV,
Ministerie van Economische Zaken, State of The Netherlands Project Nb: PSOMO4/RI/19 – 2007; final report (unpublished)
14) Elke Hartleib; www.elke-hartleib.de/thermischeabfallbehandlung.htm 15) Rölle, Dr. Ing. W. Götzelmann Partner, Stuttgart. Stoffliche und energetische Verwertung von
Klärschlamm durch Vergasung 16) Haberkern, Maier, Schneider: research report 205 26 307; UBA-FB 001075 Steigerung der
Energieeffizienz auf kommunalen Kläranlagen: 2008 17) BASF Ludwigshafen; Taschenbuch für den Lederfachmann; 1994 18) Top-Agrar 9-2010: Kühe sind keine Klimakiller 19) Trommer, Kellert; Ökologischer Vergleich verschiedener Gerbarten; Forschungsinstitut für
Leder-und Kunstledertechnologie gGmbH, Freiberg Leder-und Häutemarkt 6-1999
20) Bavarian State Ministry of Land Development and Environmental Matters - Studie über die energetische Nutzung der Biomasseanteile in Abfällen; Tab.4-1/S.20 www.bifa.de/download/textnr5.pdf
21) British Leather Technologycenter BLC, Northampton, UK- Ecobilan Leather LCA Study – a comparison of tanning technologies – 2003
22) Timberland Co, Tratham N.H.; “online.wsj.com/article/SB122304950601802565.html” 23) National Environment Protection Standard of the People’s Republic of China. Cleaner
Production Standard - Tanning Industry – Bovine Leather HJ 448-2008; implemented 2-2009; Ministry of Environmental Protection
24) EPER European Hazardous Substance Emission Registry: Fehler! Hyperlink-Referenz
ungültig. 25) H. Herfeld; Bibliothek des Leders; volume 7; Umschau-Verlag Frankfurt (1981) 26) H.Herfeld/Schmidt/Muser: “Veränderung von Fläche, Dicke, Volumen, Gewicht und
Raumgewicht der Haut in den einzelnen Stadien der Nassarbeiten bei der Rindlederherstellung und ihre Abhängigkeit von den Arbeits-bedingungen” Leder-und Häutemarkt – 9/10-1973
27) Fricke, Bahr, Thiel und Kugelstat: Stoffliche oder Energetische Verwertung; TU Braunschweig 2009