eClerx Services (ECLSER) | 1280content.icicidirect.com/mailimages/IDirect_eClerx_Q1FY… · ·...
12
August 14, 2017 ICICI Securities Ltd | Retail Equity Research Result Update Tones down margin commentary… eClerx Services (eClerx) reported Q1FY18 earnings, where US$ revenue was in line with our expectations while margins missed our estimates US$ revenues grew 1.9% QoQ to $48.8 million in line with our $48.6 million estimate. In constant currency, revenues grew 1.4% QoQ Revenues in rupees grew 0.5% QoQ at | 333.2 crore and were above our 3.2% decline and | 320.9 crore estimates (average rupee realised: 68.3 vs. 65.5 assumed) At 30.1%, EBITDA margins declined 350 bps QoQ and were below our estimate of 31.7% and 200 bps decline. The EBITDA margin decline was led by an increase in employee expenses (8.8% QoQ) and selling & distribution expenses (4.2% QoQ increase) Reported PAT of | 79.4 crore was above our | 74.6 crore estimate led by better-than-expected revenue and higher other income (| 8.2 crore vs. loss of 7.2 crore in Q4FY17) Revenue to decline 2-4% sequentially in Q2FY18 … eClerx’ dollar revenues grew 1.9% QoQ to $48.8 million. In constant currency, revenues grew 1.4% QoQ. Even dollar revenues from Top 10 clients (75% of revenues) grew 3.3% sequentially to $36.6 million after declining for five consecutive quarters. However, eClerx’ $ revenues are expected to decline 2-4% in Q2FY18 on account of ramp down by top 3 clients. Thereafter, the management expects revenues to stabilise in H2FY18 as the company is seeing healthy deal pipeline (half of them in digital space). Overall, we expect eClerx’ revenues to remain flattish at $193 million in FY18E and grow 10.2% YoY to $213 million in FY19E. Lowers EBIT margin guidance to 29% in FY18E… eClerx’ EBIT margin declined 270 bps QoQ at 26.9% mainly on account of wage hike & increase in both, onshore & offshore delivery employees (240 bps) & exchange rate headwinds (150 bps). In Q1FY18, the company also opened onshore delivery centre in North Carolina which is likely to have impact of 50-100 bps in FY18E. This, coupled with currency headwind, eClerx now expects its EBIT margin to come down to ~29% in FY18e vs. 30% guided earlier. Overall, we incorporate EBIT margin of 29%, 29.5% in FY18E, FY19E, respectively. Definitive agreement to purchase TwoFour Holdings LLC assets… eClerx entered into a definitive agreement to purchase TwoFour Holdings LLC assets. The purchase is expected to contribute 1% to revenues in FY18E, which is contingent upon closing in Q2FY18. In terms of emerging accounts, it grew 0.8% sequentially at 12.4% after growing strongly at 9.9% in Q4FY17. Going ahead, the management anticipates emerging accounts to showcase better performance on the back of stronger deal pipeline offsetting impact of ramp down by top clients. Weak growth with margin headwind; maintain SELL… Continued weakness among top 10 clients and decline in EBIT margin on account of ramp up in onshoring capabilities & currency headwinds would weight on eClerx earnings. We expect eClerx’ revenues to grow 3.6% with earnings remaining flattish with 180 bps decline in EBIT margin at 29.5% in FY17-19E. Hence, we maintain our SELL recommendation on the stock with a revised target price of | 1145 based on 13x FY19E EPS. eClerx Services (ECLSER) | 1280 Rating matrix Rating : Sell Target : | 1145 Target Period : 12 months Potential Upside : -11% What’s changed? Target Unchanged EPS FY18E Changed from | 79.5 to | 80.4 EPS FY19E Changed from | 88 to | 88.2 Rating Unchanged Quarterly performance Q1FY18 Q1FY17 YoY (%) Q4FY17 QoQ (%) Revenue 333.2 340.3 (2.1) 331.5 0.5 EBITDA 100.4 126.1 (20.4) 111.6 (10.1) EBITDA (%) 30.1 37.0 -692 bps 33.7 -354 bps PAT 79.3 96.0 (17.4) 75.0 5.8 Key financials | Crore FY16 FY17 FY18E FY19E Net Sales 1,314 1,330 1,286 1,426 EBITDA 481 469 423 476 Net Profit 342 354 322 353 EPS (|) 82.2 86.4 80.4 88.2 Valuation summary FY16 FY17 FY18E FY19E P/E 15.6 14.8 15.9 14.5 Target P/E 13.9 13.3 14.2 13.0 EV / EBITDA 9.8 10.0 10.8 9.6 P/BV 4.9 4.3 3.8 3.4 RoNW (%) 31.3 29.1 23.9 23.7 RoCE (%) 40.0 34.5 28.9 29.4 Stock data Particular Amount Market Capitalization (| Crore) 5,297.5 Total Debt (| Crore) 1.1 Cash and Investments (| Crore) 355.7 EV (| Crore) 4,691.5 52 week H/L 1775 / 1260 Equity capital 39.7 Face value 10.0 Price performance 1M 3M 6M 12M Cyient (4.2) (8.3) 5.8 (0.7) Persistent (6.2) 4.7 (0.6) (9.3) eClerx (4.8) (3.5) (9.6) (15.7) Mastek (10.3) (18.0) 50.6 107.4 Research Analysts Deepak Purswani, CFA [email protected] Deepti Tayal [email protected]
Transcript of eClerx Services (ECLSER) | 1280content.icicidirect.com/mailimages/IDirect_eClerx_Q1FY… · ·...

August 14, 2017
ICICI Securities Ltd | Retail Equity Research
Result Update
Tones down margin commentary…
eClerx Services (eClerx) reported Q1FY18 earnings, where US$
revenue was in line with our expectations while margins missed our
estimates
US$ revenues grew 1.9% QoQ to $48.8 million in line with our $48.6
million estimate. In constant currency, revenues grew 1.4% QoQ
Revenues in rupees grew 0.5% QoQ at | 333.2 crore and were above
our 3.2% decline and | 320.9 crore estimates (average rupee
realised: 68.3 vs. 65.5 assumed)
At 30.1%, EBITDA margins declined 350 bps QoQ and were below
our estimate of 31.7% and 200 bps decline. The EBITDA margin
decline was led by an increase in employee expenses (8.8% QoQ)
and selling & distribution expenses (4.2% QoQ increase)
Reported PAT of | 79.4 crore was above our | 74.6 crore estimate led
by better-than-expected revenue and higher other income (| 8.2
crore vs. loss of 7.2 crore in Q4FY17)
Revenue to decline 2-4% sequentially in Q2FY18 …
eClerx’ dollar revenues grew 1.9% QoQ to $48.8 million. In constant
currency, revenues grew 1.4% QoQ. Even dollar revenues from Top 10
clients (75% of revenues) grew 3.3% sequentially to $36.6 million after
declining for five consecutive quarters. However, eClerx’ $ revenues are
expected to decline 2-4% in Q2FY18 on account of ramp down by top 3
clients. Thereafter, the management expects revenues to stabilise in
H2FY18 as the company is seeing healthy deal pipeline (half of them in
digital space). Overall, we expect eClerx’ revenues to remain flattish at
$193 million in FY18E and grow 10.2% YoY to $213 million in FY19E.
Lowers EBIT margin guidance to 29% in FY18E…
eClerx’ EBIT margin declined 270 bps QoQ at 26.9% mainly on account of
wage hike & increase in both, onshore & offshore delivery employees (240
bps) & exchange rate headwinds (150 bps). In Q1FY18, the company also
opened onshore delivery centre in North Carolina which is likely to have
impact of 50-100 bps in FY18E. This, coupled with currency headwind,
eClerx now expects its EBIT margin to come down to ~29% in FY18e vs.
30% guided earlier. Overall, we incorporate EBIT margin of 29%, 29.5% in
FY18E, FY19E, respectively.
Definitive agreement to purchase TwoFour Holdings LLC assets…
eClerx entered into a definitive agreement to purchase TwoFour Holdings
LLC assets. The purchase is expected to contribute 1% to revenues in
FY18E, which is contingent upon closing in Q2FY18. In terms of emerging
accounts, it grew 0.8% sequentially at 12.4% after growing strongly at
9.9% in Q4FY17. Going ahead, the management anticipates emerging
accounts to showcase better performance on the back of stronger deal
pipeline offsetting impact of ramp down by top clients.
Weak growth with margin headwind; maintain SELL…
Continued weakness among top 10 clients and decline in EBIT margin on
account of ramp up in onshoring capabilities & currency headwinds
would weight on eClerx earnings. We expect eClerx’ revenues to grow
3.6% with earnings remaining flattish with 180 bps decline in EBIT margin
at 29.5% in FY17-19E. Hence, we maintain our SELL recommendation on
the stock with a revised target price of | 1145 based on 13x FY19E EPS.
eClerx Services (ECLSER) | 1280
Rating matrix
Rating : Sell
Target : | 1145
Target Period : 12 months
Potential Upside : -11%
What’s changed?
Target Unchanged
EPS FY18E Changed from | 79.5 to | 80.4
EPS FY19E Changed from | 88 to | 88.2
Rating Unchanged
Quarterly performance
Q1FY18 Q1FY17 YoY (%) Q4FY17 QoQ (%)
Revenue 333.2 340.3 (2.1) 331.5 0.5
EBITDA 100.4 126.1 (20.4) 111.6 (10.1)
EBITDA (%) 30.1 37.0 -692 bps 33.7 -354 bps
PAT 79.3 96.0 (17.4) 75.0 5.8
Key financials
| Crore FY16 FY17 FY18E FY19E
Net Sales 1,314 1,330 1,286 1,426
EBITDA 481 469 423 476
Net Profit 342 354 322 353
EPS (|) 82.2 86.4 80.4 88.2
Valuation summary
FY16 FY17 FY18E FY19E
P/E 15.6 14.8 15.9 14.5
Target P/E 13.9 13.3 14.2 13.0
EV / EBITDA 9.8 10.0 10.8 9.6
P/BV 4.9 4.3 3.8 3.4
RoNW (%) 31.3 29.1 23.9 23.7
RoCE (%) 40.0 34.5 28.9 29.4
Stock data
Particular Amount
Market Capitalization (| Crore) 5,297.5
Total Debt (| Crore) 1.1
Cash and Investments (| Crore) 355.7
EV (| Crore) 4,691.5
52 week H/L 1775 / 1260
Equity capital 39.7
Face value 10.0
Price performance
1M 3M 6M 12M
Cyient (4.2) (8.3) 5.8 (0.7)
Persistent (6.2) 4.7 (0.6) (9.3)
eClerx (4.8) (3.5) (9.6) (15.7)
Mastek (10.3) (18.0) 50.6 107.4
Research Analysts
Deepak Purswani, CFA
Deepti Tayal

ICICI Securities Ltd | Retail Equity Research Page 2
Variance analysis
Q1FY18 Q1FY18E Q1FY17 YoY (%) Q4FY17 QoQ (%) Comments
Revenue 333.2 320.9 340.3 -2.1 331.5 0.5 $ revenues grew 1.5% QoQ and were in line with our expectation
Employee expenses 143.2 134.4 132.5 8.0 131.6 8.8
Gross Margin 190.0 186.4 207.8 -8.6 199.9 -5.0
Gross margin (%) 57.0 58.1 61.1 -403 bps 60.3 -328 bps
SG&A expenses 89.6 84.7 81.7 9.7 88.3 1.5
EBITDA 100.4 101.7 126.1 -20.4 111.6 -10.1
EBITDA Margin (%) 30.1 31.7 37.0 -692 bps 33.7 -354 bps
EBITDA margins declined 350 bps led by hike in wage cost & opening of
onshore delivery center in North Carolina
Depreciation & amortisation 10.9 13.3 12.0 -9.0 13.7 -20.6
EBIT 89.5 88.5 114.1 -21.6 97.9 -8.6
EBIT Margin (%) 26.9 27.6 33.5 -667 bps 29.5 -267 bps
Other income (less interest) 8.2 8.4 10.0 21.8 -7.2 -214.2
PBT 97.7 96.9 124.1 -21.3 90.7 7.7
Tax paid 18.5 22.3 28.1 -34.2 15.9 16.6
PAT 79.3 74.6 96.0 -17.4 75.0 5.8
PAT was higher than our expectation despite subdued EBITDA margin mainly
due to higher other income and lower tax rate
Key Metrics
Closing employees 9,053 8,700 8,827 2.6 8,737 3.6 Sequentially, headcount increased by 316
Attrition (%) 40.8 35.0 30.4 1040 bps 34.3 650 bps Attrition grew QoQ and stands at highly elevated levels
Utilisation (%) 0.0 70.0 68.7 -6870 bps 68.9 -6890 bps
Average $/| 68.3 66.0 67.8 0.7 69.2 -1.3
Source: Company, ICICIdirect.com Research
Change in estimates
FY18E FY19E
(| Crore) Old New % Change Old New % Change
Revenue 1,281 1,275 -0.5 1,406 1,406 0.0
EBITDA 446 444 -0.5 492 492 0.0
EBITDA Margin (%) 34.8 34.8 0 bps 35.0 35.0 0 bps
PAT 319 318 -0.2 353 352 -0.2
EPS (|) 79 79 -0.2 88 88 -0.2 Tweaked our estimates to incorporate management commentory for FY18E
Source: Company, ICICIdirect.com Research
Assumptions
Current Earlier Introduced Earlier
FY15 FY16 FY17 FY18E FY18E FY19E FY19E Comments
Closing employees 8,100 8,862 8,737 8,837 8,837 9,244 9,244
Attrition (%) 28.3 33.1 34.8 35.0 35.0 35.0 35.0
Utilisation (%) 73.0 76.9 78.3 76.5 77.0 79.0 79.0
Average $/| 61.2 66.0 68.5 66.0 65.9 67.0 67.0
Source: Company, ICICIdirect.com Research

ICICI Securities Ltd | Retail Equity Research Page 3
Conference call highlights…
Revenue Outlook – The management expects $ revenues to
decline 2-4% in Q2FY18 due to ramp down by three large clients,
which contributes ~5% to revenues. Post that, the company
expects revenues to stabilise in H2FY18. In terms of demand
environment, the company continues to healthy deal pipeline. The
company is seeing half of new business win in digital space. In
terms of new logo win, it won it from one of Top 3 global auto
players and multibillionaire retailer in the US.
Margins- The management expects its EBIT margin to decline to
29% in FY18% vs. 30% guided earlier mainly on account of
currency headwind as well as new onshore centre opened in
North Carolina, which will have additional impact of 50-100 bps in
FY18E. In our view, with a shift in delivery model towards onshore
model, eClerx margin should remain lower at these levels in
FY19E.
Employee update- Employee headcount was at 9053 (vs. 8737 in
Q4FY17) with net addition of 316 employees. Attrition for the
fiscal was at 40.8%, which surged drastically from 34.8% in FY17
owing to some mismatch of skills among few employees. Staff
utilisation was at 76.8% in Q1FY18 vs. 76.0% in Q4FY17. It should
see improvement in utilisation only from H2FY18 as Q2FY18 is
expected to see ramp down from top three clients in Q2FY18
Cash position- The company has cash & cash equivalent of
| 642.9 crore
Capex- The company incurred capex worth | 8.7 crore in Q1FY18
vs. | 4.3 crore in Q4FY17. Overall, the company expects capex to
remain at similar level of FY17 at | 21.1 crore
DSO Days - DSO days was at 88 days at Q1FY18 (vs. 85 days in
Q4FY17)
Hedge Position- Forward hedge-book stood at US$ 139.7 million
with average strike rate of | 71.0 and expects US$ 83 million to
convert into operating revenues by FY18E at | 71.4.

ICICI Securities Ltd | Retail Equity Research Page 4
Company Analysis
Dollar revenues to grow at 4.7% CAGR during FY17-FY19E
eClerx’ dollar revenues grew 1.9% QoQ to $48.8 million. In constant
currency, revenues grew 1.4% QoQ. Even dollar revenues from Top 10
clients (75% of revenues) grew 3.3% sequentially to $36.6 million.
However, eClerx’ dollar revenues are expected to decline 2-4% in Q2
FY18 on account of a ramp down by top three clients. Thereafter, the
management expects revenues to stabilise in H2FY18 as the company is
seeing healthy deal pipeline (half of them in digital space). Overall, we
anticipate eClerx’ revenues will remain flattish at $193 million in FY18 and
grow 10.2% YoY to $213 million in FY19. This translates into 4.7% CAGR
revenues growth in $ revenues during FY17-19E.
Exhibit 1: $ revenues may grow at 4.7% CAGR during FY17-19E
76
97
122
154
46.4 50.2 51.8 50.8 47.2 47.9 48.6
193
210
138
199
50.2 48.9
19437.3
31.933.2
8.6
29.0
24.7
13.9
11.2
28.1
24.8
29.5
8.2
0
50
100
150
200
250
FY11
FY12
FY13
FY14
FY15
Q1FY16
Q2FY16
Q3FY16
Q4FY16
FY16
Q1FY17
Q2FY17
Q3FY17
Q4FY17
FY17
Q1FY18
FY18E
FY19E
$ m
illion
0
10
20
30
40
50
%
Dollar revenue Growth, YoY
Source: Company, ICICIdirect.com Research
Exhibit 2: eClerx vs. Nasscom guidance
30.0
37.3
29.0
24.7
13.9
11.2
29.5
-0.5
5.5
18.716.5
10.2
13.0 13.0 13.0
7.5
-2.5
9.0
-5
5
15
25
35
45
FY10 FY11 FY12 FY13 FY14 FY15 FY16 FY17 FY18E
%
Growth, YoY NASSCOM guidance
Source: Company, ICICIdirect.com Research
Lowers EBIT margin guidance to 29% in FY18E…
eClerx’ EBIT margin declined 270 bps QoQ at 26.9% mainly on account
wage hike & increase in both onshore & offshore delivery employees (240
bps) & exchange rate headwinds (150 bps). In Q1FY18, the company also
opened onshore delivery centre in North Carolina, which is likely to have
an impact of 50-100 bps in FY18. This coupled with currency headwind
eClerx now expects its EBIT margin to come down to ~29% in FY18 vs.
ICICI Securities Ltd | Retail Equity Research Page 5
30% guided earlier. We incorporate EBIT margin of 29%, 29.5% in FY18,
FY19, respectively.
Exhibit 3: FY18E margin may decline in FY18
39.440.2
38.9
42.0
33.5 33.3
37.236.2
41.0
36.6 37.038.1
32.1
33.7
35.2
31.7
34.8 35.0
25
30
35
40
45
50
FY11
FY12
FY13
FY14
FY15
Q1FY16
Q2FY16
Q3FY16
Q4FY16
FY16
Q1FY17
Q2FY17
Q3FY17
Q4FY17
FY17
Q1FY18
FY18E
FY19E
%
EBITDA margin
Source: Company, ICICIdirect.com Research
Exhibit 4: Attrition at 34.8% in FY17; still at elevated levels
38.7
30.9
27.3
30.1
33.131.1
35.9 36.6
28.6
33.7
30.4
41.3
33.134.3 34.8
1.1
35.0 35.0
0
10
20
30
40
50
FY11
FY12
FY13
FY14
FY15
Q1FY16
Q2FY16
Q3FY16
Q4FY16
FY16
Q1FY17
Q2FY17
Q3FY17
Q4FY17
FY17
Q1FY18
FY18E
FY19E
%
Attrition
Source: Company, ICICIdirect.com Research
Exhibit 5: Utilisation increases 140 bps YoY in FY17, may be under pressure in FY18E
77.0
74.0
73.0
74.3
76.4
79.0
77.876.9
79.179.5
78.5
76.0
78.3
76.5
79.0
65
68
71
74
77
80
83
FY13
FY14
FY15
Q1FY16
Q2FY16
Q3FY16
Q4FY16
FY16
Q1FY17
Q2FY17
Q3FY17
Q4FY17
FY17
Q1FY18
FY18E
FY19E
%
Utilisation
Source: Company, ICICIdirect.com Research

ICICI Securities Ltd | Retail Equity Research Page 6
Clients count contributing $0.5 million+ now stand at 37 …
In the direction of client count in FY17 vs. FY16, client count declined by
two to 38 in $0.5 million+ bucket due to certain projects getting
completed in digital vertical. In Q1FY18, it has further come down to 37.
In terms of $ revenues from Top 10 clients (75% of revenues) grew 3.3%
sequentially to $36.6 million. The growth in top 10 client was witnessed
after five consecutive quarters revenues decline. However, eClerx’ $
revenues are again expected to decline 2-4% in Q2 FY18 on account of
ramp down by top three clients. In terms of emerging accounts, it grew
0.8% sequentially to $12.4% after growing strongly at 9.9% in Q4FY17.
Exhibit 6: In FY17, clients contributing $0.5 million+ in revenues declined by two
1618
21
2628
36
40 40
43 42
39 38 38 37
0
5
10
15
20
25
30
35
40
45
50
FY13
FY14
FY15
Q1FY16
Q2FY16
Q3FY16
Q4FY16
FY16
Q1FY17
Q2FY17
Q3FY17
Q4FY17
FY17
Q1FY18
$0.5 million+ clients
Source: Company, ICICIdirect.com Research
ICICI Securities Ltd | Retail Equity Research Page 7
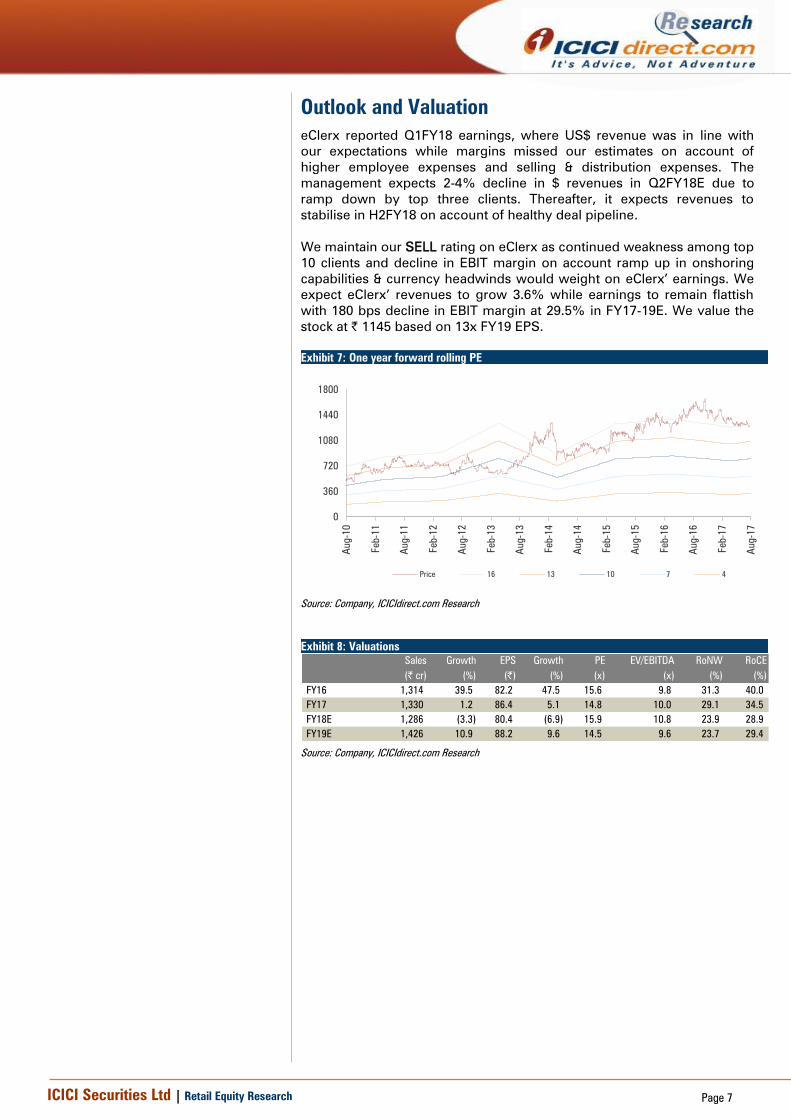
Outlook and Valuation
eClerx reported Q1FY18 earnings, where US$ revenue was in line with
our expectations while margins missed our estimates on account of
higher employee expenses and selling & distribution expenses. The
management expects 2-4% decline in $ revenues in Q2FY18E due to
ramp down by top three clients. Thereafter, it expects revenues to
stabilise in H2FY18 on account of healthy deal pipeline.
We maintain our SELL rating on eClerx as continued weakness among top
10 clients and decline in EBIT margin on account ramp up in onshoring
capabilities & currency headwinds would weight on eClerx’ earnings. We
expect eClerx’ revenues to grow 3.6% while earnings to remain flattish
with 180 bps decline in EBIT margin at 29.5% in FY17-19E. We value the
stock at | 1145 based on 13x FY19 EPS.
Exhibit 7: One year forward rolling PE
0
360
720
1080
1440
1800
Aug-10
Feb-11
Aug-11
Feb-12
Aug-12
Feb-13
Aug-13
Feb-14
Aug-14
Feb-15
Aug-15
Feb-16
Aug-16
Feb-17
Aug-17
Price 16 13 10 7 4
Source: Company, ICICIdirect.com Research
Exhibit 8: Valuations
Sales Growth EPS Growth PE EV/EBITDA RoNW RoCE
(| cr) (%) (|) (%) (x) (x) (%) (%)
FY16 1,314 39.5 82.2 47.5 15.6 9.8 31.3 40.0
FY17 1,330 1.2 86.4 5.1 14.8 10.0 29.1 34.5
FY18E 1,286 (3.3) 80.4 (6.9) 15.9 10.8 23.9 28.9
FY19E 1,426 10.9 88.2 9.6 14.5 9.6 23.7 29.4
Source: Company, ICICIdirect.com Research
ICICI Securities Ltd | Retail Equity Research Page 8
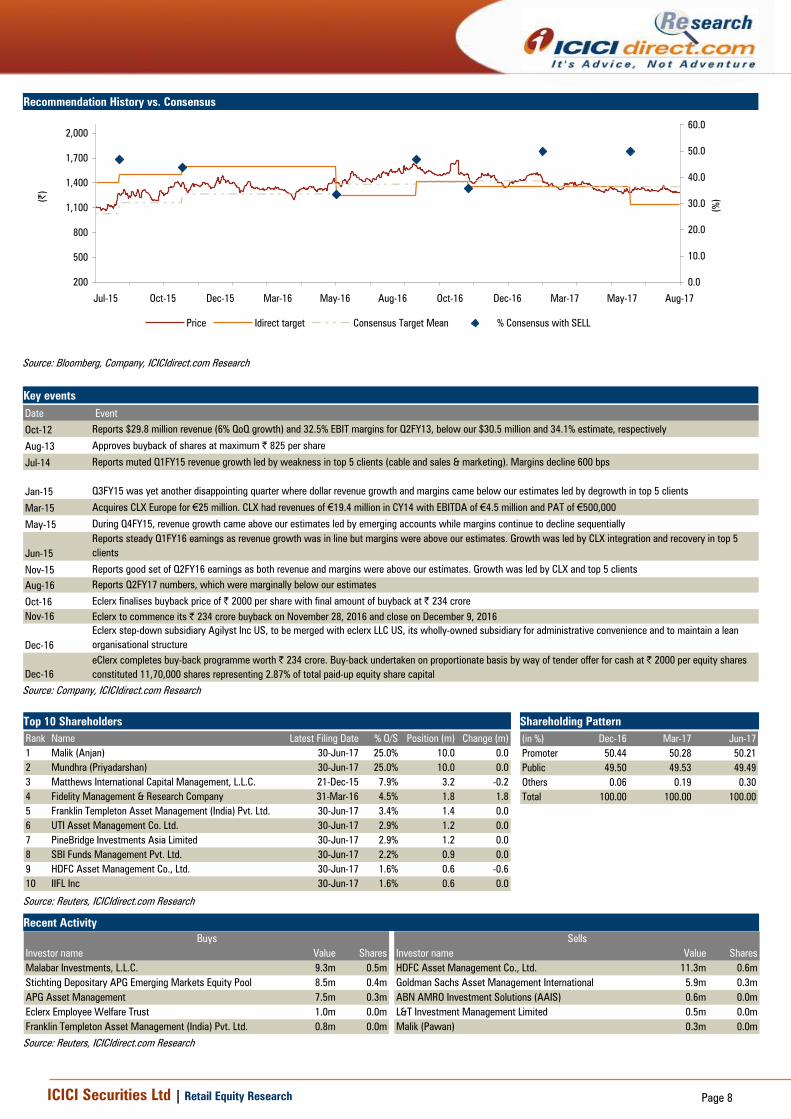
Recommendation History vs. Consensus
200
500
800
1,100
1,400
1,700
2,000
Aug-17May-17Mar-17Dec-16Oct-16Aug-16May-16Mar-16Dec-15Oct-15Jul-15
(|
)
0.0
10.0
20.0
30.0
40.0
50.0
60.0
(%
)
Price Idirect target Consensus Target Mean % Consensus with SELL
Source: Bloomberg, Company, ICICIdirect.com Research
Key events
Date Event
Oct-12 Reports $29.8 million revenue (6% QoQ growth) and 32.5% EBIT margins for Q2FY13, below our $30.5 million and 34.1% estimate, respectively
Aug-13 Approves buyback of shares at maximum | 825 per share
Jul-14 Reports muted Q1FY15 revenue growth led by weakness in top 5 clients (cable and sales & marketing). Margins decline 600 bps
Jan-15 Q3FY15 was yet another disappointing quarter where dollar revenue growth and margins came below our estimates led by degrowth in top 5 clients
Mar-15 Acquires CLX Europe for €25 million. CLX had revenues of €19.4 million in CY14 with EBITDA of €4.5 million and PAT of €500,000
May-15 During Q4FY15, revenue growth came above our estimates led by emerging accounts while margins continue to decline sequentially
Jun-15
Reports steady Q1FY16 earnings as revenue growth was in line but margins were above our estimates. Growth was led by CLX integration and recovery in top 5
clients
Nov-15 Reports good set of Q2FY16 earnings as both revenue and margins were above our estimates. Growth was led by CLX and top 5 clients
Aug-16 Reports Q2FY17 numbers, which were marginally below our estimates
Oct-16 Eclerx finalises buyback price of | 2000 per share with final amount of buyback at | 234 crore
Nov-16 Eclerx to commence its | 234 crore buyback on November 28, 2016 and close on December 9, 2016
Dec-16
Eclerx step-down subsidiary Agilyst Inc US, to be merged with eclerx LLC US, its wholly-owned subsidiary for administrative convenience and to maintain a lean
organisational structure
Dec-16
eClerx completes buy-back programme worth | 234 crore. Buy-back undertaken on proportionate basis by way of tender offer for cash at | 2000 per equity shares
constituted 11,70,000 shares representing 2.87% of total paid-up equity share capital
Source: Company, ICICIdirect.com Research
Top 10 Shareholders Shareholding Pattern
Rank Name Latest Filing Date % O/S Position (m) Change (m)
1 Malik (Anjan) 30-Jun-17 25.0% 10.0 0.0
2 Mundhra (Priyadarshan) 30-Jun-17 25.0% 10.0 0.0
3 Matthews International Capital Management, L.L.C. 21-Dec-15 7.9% 3.2 -0.2
4 Fidelity Management & Research Company 31-Mar-16 4.5% 1.8 1.8
5 Franklin Templeton Asset Management (India) Pvt. Ltd. 30-Jun-17 3.4% 1.4 0.0
6 UTI Asset Management Co. Ltd. 30-Jun-17 2.9% 1.2 0.0
7 PineBridge Investments Asia Limited 30-Jun-17 2.9% 1.2 0.0
8 SBI Funds Management Pvt. Ltd. 30-Jun-17 2.2% 0.9 0.0
9 HDFC Asset Management Co., Ltd. 30-Jun-17 1.6% 0.6 -0.6
10 IIFL Inc 30-Jun-17 1.6% 0.6 0.0
(in %) Dec-16 Mar-17 Jun-17
Promoter 50.44 50.28 50.21
Public 49.50 49.53 49.49
Others 0.06 0.19 0.30
Total 100.00 100.00 100.00
Source: Reuters, ICICIdirect.com Research
Recent Activity
Investor name Value Shares Investor name Value Shares
Malabar Investments, L.L.C. 9.3m 0.5m HDFC Asset Management Co., Ltd. 11.3m 0.6m
Stichting Depositary APG Emerging Markets Equity Pool 8.5m 0.4m Goldman Sachs Asset Management International 5.9m 0.3m
APG Asset Management 7.5m 0.3m ABN AMRO Investment Solutions (AAIS) 0.6m 0.0m
Eclerx Employee Welfare Trust 1.0m 0.0m L&T Investment Management Limited 0.5m 0.0m
Franklin Templeton Asset Management (India) Pvt. Ltd. 0.8m 0.0m Malik (Pawan) 0.3m 0.0m
Buys Sells
Source: Reuters, ICICIdirect.com Research

ICICI Securities Ltd | Retail Equity Research Page 9
.
Financial summary
Profit and loss statement | Crore
FY16 FY17 FY18E FY19E
Total Revenues 1,314 1,330 1,286 1,426
Growth (%) 39.5 1.2 (3.3) 10.9
Employee expenses 503 525 533 586
Other Expenditure 331 337 331 364
EBITDA 481 469 423 476
Growth (%) 52.3 (2.5) (9.7) 12.6
Depreciation 57 52 50 56
Other Income 37 19 30 32
Interest expense - 0 - -
PBT before Exceptional Items 461 436 403 453
Growth (%) 54.7 (5.5) (7.5) 12.4
Tax 118 82 81 100
PAT before Exceptional Items 343 354 322 353
Exceptional items - - - -
PAT before MI 343 354 322 353
Minority Int & Pft. from associates 0 (0) - -
PAT 342 354 322 353
Growth (%) 49.0 3.4 (9.0) 9.6
EPS 82 86 80 88
EPS (Growth %) 47.5 5.1 (6.9) 9.6
Source: Company, ICICIdirect.com Research
Cash flow statement | Crore
FY16 FY17 FY18E FY19E
Net profit before Tax 461 436 403 453
Depreciation 57 52 50 56
(inc)/dec in Current Assets (63) (33) 42 (148)
(inc)/dec in current Liabilities (113) (103) (81) (100)
CF from operations 419 312 342 235
Other Investments (63) (30) - -
Other income 37 19 30 -
(Purchase)/Sale of Fixed Assets (52) (30) (64) (71)
CF from investing Activities (165) (170) (34) (39)
Inc / (Dec) in Equity Capital 14 (2) - -
Dividend & Divendend tax (128) (5) (189) (208)
Interest Paid on Loans (0) (0) - -
CF from Financial Activities (165) (245) (190) (208)
Exchange rate differences (3) (6) - -
Opening cash balance 287 328 356 473
Other adjustments (45) 135 - -
Closing cash 328 356 473 461
Source: Company, ICICIdirect.com Research
Balance sheet | Crore
FY16 FY17 FY18E FY19E
Equity 41 40 40 40
Reserves & Surplus 1,052 1,176 1,309 1,454
Networth 1,093 1,215 1,348 1,494
Minority Interest 1 0 0 0
Loans 4 1 - -
Other liabilities 55 46 46 46
Source of funds 1,148 1,260 1,394 1,540
Gross Block 123 139 204 275
Acc.dep 36 69 119 175
Net Block 87 70 84 100
CWIP - 2 2 2
Other Intangible assets 67 55 55 55
Other non current assets 49 59 59 59
Investments 219 251 251 251
Goodwill 211 200 200 200
Debtors 186 214 108 249
Cash & Cash equivalents 328 356 473 461
Loans and advances - - 84 93
Other current assets 141 191 197 201
Trade payables 14 13 3 3
Current liabilities 53 46 39 43
Provisions 74 77 77 86
Application of funds 1,148 1,260 1,393 1,539
Source: Company, ICICIdirect.com Research
Key ratios
FY16 FY17 FY18E FY19E
Per share data (|)
EPS 82.2 86.4 80.4 88.2
Cash EPS 95.8 99.0 93.0 102.1
BV 262.3 296.5 336.4 372.8
DPS 1.0 1.0 40.2 44.1
Cash Per Share 78.9 86.8 118.0 115.2
Operating Ratios (%)
EBITDA Margin 36.6 35.2 32.9 33.4
PBT Margin 35.1 32.8 31.3 31.8
PAT Margin 26.0 26.6 25.1 24.8
Debtor days 52 59 31 64
Creditor days 4 4 1 1
Return Ratios (%)
RoE 31.3 29.1 23.9 23.7
RoCE 40.0 34.5 28.9 29.4
RoIC 154.9 122.8 105.3 82.3
Valuation Ratios (x)
P/E 15.6 14.8 15.9 14.5
EV / EBITDA 9.8 10.0 10.8 9.6
EV / Net Sales 3.6 3.5 3.5 3.2
Market Cap / Sales 4.0 4.0 4.1 3.7
Price to Book Value 4.9 4.3 3.8 3.4
Solvency Ratios
Debt/EBITDA 0.0 0.0 - -
Debt / Equity 0.0 0.0 - -
Current Ratio 2.3 3.0 3.3 4.1
Quick Ratio 2.3 3.0 3.3 4.1
Source: Company, ICICIdirect.com Research

ICICI Securities Ltd | Retail Equity Research Page 10
ICICIdirect.com coverage universe (IT)
CMP M Cap EPS (|) P/E (x) RoCE (%) RoE(%)
(|) TP(|) Rating (| Cr) FY16 FY17P FY18E FY16 FY17P FY18E FY16 FY17P FY18E FY16 FY17P FY18E FY16 FY17P FY18E
Cyient (INFENT) 491 545 Hold 5,528 29.0 30.5 35.2 17.0 16.1 14.0 11.6 9.7 7.6 20.3 19.7 20.7 17.8 16.2 16.8
Eclerx (ECLSER) 1,280 1,145 Sell 5,277 82.2 86.4 80.4 15.6 14.8 15.9 9.8 10.0 10.8 40.0 34.5 28.9 31.3 29.1 23.9
Firstsource (FIRSOU) 35 40 Buy 2,323 3.9 4.1 4.0 8.7 8.2 8.4 7.7 6.8 6.2 11.6 11.7 11.7 14.7 13.8 11.9
HCL Tech (HCLTEC) 860 930 Hold 121,406 52.1 60.0 59.7 16.5 14.3 14.4 12.8 10.4 9.8 31.2 30.3 30.6 26.9 26.6 25.5
Infosys (INFTEC) 982 1,040 Hold 224,438 59.0 62.8 64.7 16.6 15.6 15.2 11.1 10.5 10.7 30.2 28.8 31.2 21.8 20.8 22.4
KPIT Tech (KPISYS) 112 140 Hold 2,229 14.1 10.6 9.9 7.9 10.5 11.3 4.7 6.1 6.2 23.7 16.3 14.9 20.4 15.4 11.7
Mindtree (MINCON) 467 470 Hold 7,842 32.9 24.9 26.9 14.2 18.8 17.4 9.0 10.1 10.5 29.1 21.2 24.2 22.9 16.2 18.8
NIIT Technologies (NIITEC) 486 575 Hold 1,741 45.8 43.5 44.7 10.6 10.2 10.9 2.8 2.4 2.2 30.5 30.0 27.8 17.6 15.0 13.9
Persistent (PSYS) 610 700 Buy 4,879 37.2 37.6 38.8 17.1 16.9 16.4 10.8 9.9 9.0 23.4 20.7 19.4 17.7 15.9 14.6
TCS (TCS) 2,469 2,400 Hold 483,603 122.9 133.4 133.1 20.1 18.5 18.5 14.8 13.6 13.6 42.2 38.0 37.6 33.1 29.8 29.5
Tech Mahindra (TECMAH) 402 450 Hold 39,505 31.7 31.7 32.4 12.7 12.7 12.4 8.3 8.4 7.6 22.3 19.4 17.3 20.5 17.1 15.5
Wipro (WIPRO) 288 285 Hold 70,937 22.6 17.5 18.1 12.7 16.5 15.9 4.7 4.3 5.3 19.6 16.8 17.3 19.1 16.3 17.0
Sector / Company
EV/EBITDA (x)
Source: Company, ICICIdirect.com Research

ICICI Securities Ltd | Retail Equity Research Page 11
RATING RATIONALE
ICICIdirect.com endeavours to provide objective opinions and recommendations. ICICIdirect.com assigns
ratings to its stocks according to their notional target price vs. current market price and then categorises them
as Strong Buy, Buy, Hold and Sell. The performance horizon is two years unless specified and the notional
target price is defined as the analysts' valuation for a stock.
Strong Buy: >15%/20% for large caps/midcaps, respectively, with high conviction;
Buy: >10%/15% for large caps/midcaps, respectively;
Hold: Up to +/-10%;
Sell: -10% or more;
Pankaj Pandey Head – Research [email protected]
ICICIdirect.com Research Desk,
ICICI Securities Limited,
1st Floor, Akruti Trade Centre,
Road No 7, MIDC,
Andheri (East)
Mumbai – 400 093

ICICI Securities Ltd | Retail Equity Research Page 12
ANALYST CERTIFICATION
We /I, Deepak Purswani, CFA MBA (Finance), Deepti Tayal, MBA, Research Analysts, authors and the names subscribed to this report, hereby certify that all of the views expressed in this research report
accurately reflect our views about the subject issuer(s) or securities. We also certify that no part of our compensation was, is, or will be directly or indirectly related to the specific recommendation(s) or
view(s) in this report.
Terms & conditions and other disclosures:
ICICI Securities Limited (ICICI Securities) is a full-service, integrated investment banking and is, inter alia, engaged in the business of stock brokering and distribution of financial products. ICICI Securities
Limited is a Sebi registered Research Analyst with Sebi Registration Number – INH000000990. ICICI Securities is a wholly-owned subsidiary of ICICI Bank which is India’s largest private sector bank and has
its various subsidiaries engaged in businesses of housing finance, asset management, life insurance, general insurance, venture capital fund management, etc. (“associates”), the details in respect of which
are available on www.icicibank.com.
ICICI Securities is one of the leading merchant bankers/ underwriters of securities and participate in virtually all securities trading markets in India. We and our associates might have investment banking
and other business relationship with a significant percentage of companies covered by our Investment Research Department. ICICI Securities generally prohibits its analysts, persons reporting to analysts
and their relatives from maintaining a financial interest in the securities or derivatives of any companies that the analysts cover.
The information and opinions in this report have been prepared by ICICI Securities and are subject to change without any notice. The report and information contained herein is strictly confidential and
meant solely for the selected recipient and may not be altered in any way, transmitted to, copied or distributed, in part or in whole, to any other person or to the media or reproduced in any form, without
prior written consent of ICICI Securities. While we would endeavour to update the information herein on a reasonable basis, ICICI Securities is under no obligation to update or keep the information current.
Also, there may be regulatory, compliance or other reasons that may prevent ICICI Securities from doing so. Non-rated securities indicate that rating on a particular security has been suspended
temporarily and such suspension is in compliance with applicable regulations and/or ICICI Securities policies, in circumstances where ICICI Securities might be acting in an advisory capacity to this
company, or in certain other circumstances.
This report is based on information obtained from public sources and sources believed to be reliable, but no independent verification has been made nor is its accuracy or completeness guaranteed. This
report and information herein is solely for informational purpose and shall not be used or considered as an offer document or solicitation of offer to buy or sell or subscribe for securities or other financial
instruments. Though disseminated to all the customers simultaneously, not all customers may receive this report at the same time. ICICI Securities will not treat recipients as customers by virtue of their
receiving this report. Nothing in this report constitutes investment, legal, accounting and tax advice or a representation that any investment or strategy is suitable or appropriate to your specific
circumstances. The securities discussed and opinions expressed in this report may not be suitable for all investors, who must make their own investment decisions, based on their own investment
objectives, financial positions and needs of specific recipient. This may not be taken in substitution for the exercise of independent judgment by any recipient. The recipient should independently evaluate
the investment risks. The value and return on investment may vary because of changes in interest rates, foreign exchange rates or any other reason. ICICI Securities accepts no liabilities whatsoever for any
loss or damage of any kind arising out of the use of this report. Past performance is not necessarily a guide to future performance. Investors are advised to see Risk Disclosure Document to understand the
risks associated before investing in the securities markets. Actual results may differ materially from those set forth in projections. Forward-looking statements are not predictions and may be subject to
change without notice.
ICICI Securities or its associates might have managed or co-managed public offering of securities for the subject company or might have been mandated by the subject company for any other assignment
in the past twelve months.
ICICI Securities or its associates might have received any compensation from the companies mentioned in the report during the period preceding twelve months from the date of this report for services in
respect of managing or co-managing public offerings, corporate finance, investment banking or merchant banking, brokerage services or other advisory service in a merger or specific transaction.
ICICI Securities or its associates might have received any compensation for products or services other than investment banking or merchant banking or brokerage services from the companies mentioned
in the report in the past twelve months.
ICICI Securities encourages independence in research report preparation and strives to minimize conflict in preparation of research report. ICICI Securities or its associates or its analysts did not receive any
compensation or other benefits from the companies mentioned in the report or third party in connection with preparation of the research report. Accordingly, neither ICICI Securities nor Research Analysts
and their relatives have any material conflict of interest at the time of publication of this report.
It is confirmed that Deepak Purswani, CFA MBA (Finance), Deepti Tayal, MBA, Research Analysts of this report have not received any compensation from the companies mentioned in the report in the
preceding twelve months.
Compensation of our Research Analysts is not based on any specific merchant banking, investment banking or brokerage service transactions.
ICICI Securities or its subsidiaries collectively or Research Analysts or their relatives do not own 1% or more of the equity securities of the Company mentioned in the report as of the last day of the month
preceding the publication of the research report.
Since associates of ICICI Securities are engaged in various financial service businesses, they might have financial interests or beneficial ownership in various companies including the subject
company/companies mentioned in this report.
It is confirmed that Deepak Purswani, CFA MBA (Finance), Deepti Tayal, MBA, Research Analysts do not serve as an officer, director or employee of the companies mentioned in the report.
ICICI Securities may have issued other reports that are inconsistent with and reach different conclusion from the information presented in this report.
Neither the Research Analysts nor ICICI Securities have been engaged in market making activity for the companies mentioned in the report.
We submit that no material disciplinary action has been taken on ICICI Securities by any Regulatory Authority impacting Equity Research Analysis activities.
This report is not directed or intended for distribution to, or use by, any person or entity who is a citizen or resident of or located in any locality, state, country or other jurisdiction, where such distribution,
publication, availability or use would be contrary to law, regulation or which would subject ICICI Securities and affiliates to any registration or licensing requirement within such jurisdiction. The securities
described herein may or may not be eligible for sale in all jurisdictions or to certain category of investors. Persons in whose possession this document may come are required to inform themselves of and
to observe such restriction.