Echolocation Calls of the Eleven Insectivorous Bats of Taiwan · kuhlii, 34.55 ± 4.86 kHz for...
30
台灣生物多樣性研究(TW J. of Biodivers.) 14 (3-4): 33 -62, 2012 33 Echolocation Calls of the Eleven Insectivorous Bats of Taiwan 臺灣 11 種食蟲性蝙蝠的回聲定位研究 Cheng-Han Chou and Hsi-Chi Cheng * 周政翰 鄭錫奇 * Endemic Species Research Institute, JiJi, Nantou, Taiwan 行政院農業委員會特有生物研究保育中心 55244 南投縣集集鎮民生東路 1 號 * Corresponding author: [email protected] *通訊作者:[email protected] Abstract Insectivorous bat emits ultrasound and listens to its echo in flight, the so-called echolocation call, to detect surrounding and to identify prey. Information on its patterns of different species is useful for the inventory survey, particularly when capturing is difficult. There are over 30 species of insectivorous bats in Taiwan, but such information was scarce. This study was intended to collect basic characters of echolocation calls of common insectivorous bats in Taiwan to establish their reference database for the intra- and inter-species identification. In March 2005 to November 2006, 249 individuals of 11 species of bats were caught with harp traps and mist nets around Taiwan and on the Kinmen Island. Ten parameters of the echo pulses were recorded and analyzed with the AnaBat system bat detector. Among these species Rhinolophus monoceros and Hipposideros terasensis emitted constant frequency (CF) type echo-calls; whereas the other 9 species had frequency modulated (FM) type echo-calls. For the former, the mean frequency (Fmean) and the constant part of the CF calls were 111.14 ± 2.57 kHz, respectively, for R monoceros, and 67.56 ± 1.53 kHz for H. terasensis. For the latter the mean frequency was 50.40 ± 3.91 kHz for Pipistrellus abramus, 45.41 ± 5.26 kHz for Arielulus torquatus, 46.91 ± 3.96 kHz for Scotophilus kuhlii , 34.55 ± 4.86 kHz for Eptesicus serotinus horikawai , 51.30 ± 8.86 kHz for Miniopterus schreibersii, 86.84 ± 10.30 kHz for Murina puta, 54.77 ± 3.19 kHz for Myotis latirostris, 54.05 ± 4.65 kHz for Myotis
Transcript of Echolocation Calls of the Eleven Insectivorous Bats of Taiwan · kuhlii, 34.55 ± 4.86 kHz for...
台灣生物多樣性研究(TW J. of Biodivers.) 14 (3-4): 33 -62, 2012 33
Echolocation Calls of the Eleven Insectivorous Bats of Taiwan
臺灣 11 種食蟲性蝙蝠的回聲定位研究
Cheng-Han Chou and Hsi-Chi Cheng*
周政翰 鄭錫奇*
Endemic Species Research Institute, JiJi, Nantou, Taiwan
行政院農業委員會特有生物研究保育中心 55244 南投縣集集鎮民生東路 1 號
* Corresponding author: [email protected]
*通訊作者:[email protected]
Abstract
Insectivorous bat emits ultrasound and listens to its echo in flight, the so-called echolocation call, to
detect surrounding and to identify prey. Information on its patterns of different species is useful for the
inventory survey, particularly when capturing is difficult. There are over 30 species of insectivorous bats
in Taiwan, but such information was scarce. This study was intended to collect basic characters of
echolocation calls of common insectivorous bats in Taiwan to establish their reference database for the
intra- and inter-species identification. In March 2005 to November 2006, 249 individuals of 11 species of
bats were caught with harp traps and mist nets around Taiwan and on the Kinmen Island. Ten parameters
of the echo pulses were recorded and analyzed with the AnaBat system bat detector. Among these species
Rhinolophus monoceros and Hipposideros terasensis emitted constant frequency (CF) type echo-calls;
whereas the other 9 species had frequency modulated (FM) type echo-calls. For the former, the mean
frequency (Fmean) and the constant part of the CF calls were 111.14 ± 2.57 kHz, respectively, for R
monoceros, and 67.56 ± 1.53 kHz for H. terasensis. For the latter the mean frequency was 50.40 ± 3.91
kHz for Pipistrellus abramus, 45.41 ± 5.26 kHz for Arielulus torquatus, 46.91 ± 3.96 kHz for Scotophilus
kuhlii, 34.55 ± 4.86 kHz for Eptesicus serotinus horikawai, 51.30 ± 8.86 kHz for Miniopterus schreibersii,
86.84 ± 10.30 kHz for Murina puta, 54.77 ± 3.19 kHz for Myotis latirostris, 54.05 ± 4.65 kHz for Myotis

34 Echolocation Calls of the Eleven Insectivorous Bats of Taiwan
sp.2, and 57.55 ± 4.46 kHz for Myotis sp.3. Jamming avoidance responses to echolocation calls were
observed in some of the colonies of P. abramus and S. kuhlii. Dialects were found among colonies of Mi.
schreibersii.
摘 要
食蟲性蝙蝠以回聲定位偵測環境及分辨獵物。在進行蝙蝠調查時,研究人員可利用每種蝙蝠獨
特的回聲定位來辨識物種,尤其是在不易以捕捉進行蝙蝠調查的地點。臺灣地區現已知有超過三十
種的食蟲性蝙蝠,但其回聲定位資訊仍相當有限。本研究目的在於蒐錄臺灣地區常見食蟲性蝙蝠的
回聲定位聲音,測量其音頻形值以建立作為辨識種類依據的資料庫,並藉以檢視種間及種內變異。
自 2005 年 3 月至 2006 年 11 月,我們在臺灣與金門地區共計捕獲 11 種蝙蝠 249 隻個體,確定
種類後以蝙蝠偵測器(AnaBat系統 )錄音測量,單一脈波皆測量 10 個特徵值。其中臺灣小蹄鼻蝠
(Rhinolophus monoceros)與臺灣葉鼻蝠(Hipposideros terasensis)為常頻式(CF)回聲音頻,其他 9 種則
使用調頻式(FM)回聲音頻。臺灣小蹄鼻蝠的特徵音頻(Fc)約為 112 卂赫(111.14 ± 2.57 卂赫),而臺
灣葉鼻蝠約為 65 卂赫(67.56 ± 1.53 卂赫)。調頻式音頻的東亞家蝠(Pipistrellus abramus)的平均音頻
(Fmean)為 50.40 ± 3.91 卂赫,黃頸蝠(Arielulus torquatus)為 45.41 ± 5.26 卂赫,高頭蝠(Scotophilus
kuhlii)為 46.91 ± 3.96 卂赫,堀川氏棕蝠(Eptesicus serotinus horikawai)為 34.55 ± 4.86 卂赫,摺翅蝠
(Miniopterus schreibersii)為 51.30 ± 8.86 卂赫,臺灣管鼻蝠(Murina puta)為 86.84 ± 10.30 卂赫,寬
吻鼠耳蝠(Myotis latirostris)為 54.77 ± 3.19 卂赫,長趾鼠耳蝠(Myotis sp.2)為 54.05 ± 4.65 卂赫,以
及長尾鼠耳蝠(Myotis sp.3)為 57.55 ± 4.46 卂赫。此外,我們也發現東亞家蝠與高頭蝠在一隻以上的
個體出現於同一區域時彼此的音頻會有避免干擾的調整,而不同地區的摺翅蝠則具有方言的現象。
Key words: echolocation, insectivorous bats, jamming avoidance, dialect, Taiwan
關鍵詞:回聲定位、食蟲性蝙蝠、避免干擾、方言、臺灣
Received: June 06, 2012 Accepted: September 24, 2012
收件日期:2012 年 06 月 06 日 接受日期:2012 年 09 月 24 日
Introduction
Insectivorous bat uses echolocation call in
flight in night to locate its position and to detect
potential prey items (Kalko and Schnitzler 1989;
Obrist 1995). A typical sequence of the call
used in the prey detection has two phases: an
approach-phase call during the time of pursuit,

台灣生物多樣性研究(TW J. of Biodivers.) 14 (3-4): 33 -62, 2012 35
and a terminal-phase call (feeding buzzes) just
before the capture (Griffin et al. 1960; Kalko
and Schnitzler 1989). Search-phase calls are
ideal for studying acoustic identification of
species because they are emitted more often by
foraging bats than other types of the calls and are
more often encountered by investigators in the
field (Fenton and Bell 1981; Fenton and Morris
1976).
Echolocation call structure may be described
in terms of frequency and temporal parameters,
of which duration, duty cycle, bandwidth, intensity
etc. vary among species. The frequency has two
categories: constant frequency (CF) that is a single
tone at one frequency for a period of time, and
frequency modulated (FM) that is a sweeping up
or down in frequency for a period of time. A call
may be made up of the combination of the two
categories as CF/FM call (with a CF followed by
FM component) (Vaughan et al. 1997; Schnitzler
and Kalko 1998; Fenton 1999).
A search-phase call also exhibits a consistent
sequence pattern with species- specificity (Ahlen
1981; Fenton and Bell 1981; O‟Farrell et al.
1999; Schnitzler and Kolko 2001) but has
intraspecific variation, resulting in obscurity in
species distinction (Barelay 1999; Betts 1998;
Brigham et al. 1989; Thomas et al. 1987). Also,
echolocation call may vary among individuals of
a species due to differences in size, age, sex
(Buchler 1980; Heller and Helversen 1989; Jones
et al. 1992 and 1994), foraging habitat, and
microhabitat types (Jacobs 1999; Jensen and
Miller 1999; Rydell 1990, 1993). The variation
among populations from different geographic
regions has been also demonstrated in some of
the species (Parsons 1997; Thomas et al. 1987).
With combination of the above factors,
atmospheric attenuation, Doppler shift,
directionality of emitted signal, and directionality
of the detector may also cause wide ranges of
intraspecific variation (Obrist 1995; Parsons
1997; Pye 1993), resulting in wide overlap of the
calls among species. Therefore, a comprehensive
knowledge on the intraspecific variation is
important for the specific distinction (Barclay
1999; Betts 1998; Brigham et al. 1989; Thomas
et al. 1987).
In Taiwan there are more than 30 insectivorous
bats, of which many are endemic (Lin et al.
2004; Cheng et al. 2010). Information of their
echolocation calls is very scarce. This study was
intended to establish the reference database of
echolocation calls of common insectivorous bats
of Taiwan.
Materials and Methods
1. Bat capture and echo-call recording
We randomly selected some suitable sites in
fields to set up harp traps and mist nets to catch
flying bats in night around Taiwan and on the
Kinmen Island. When a bat was caught, a small
chemiluminescent tag (2.9*23 mm) was attached
to its dorsal side of the body (Buchler 1976;
Hovorka 1996). The bat was then taken to an
open area, 100-300 m in diameter and less than
0.5 km from the capture site; it was released and
its echolocation call when flying away was
recorded.

36 Echolocation Calls of the Eleven Insectivorous Bats of Taiwan
The recording equipment used was consisted
of an Anabat Ⅱ bat detector, a Zero Crossing
Analysis Interface Module (ZCAIM), and a
laptop computer with the Anabat software (Titley
Electronics, Ballina, New South Wales, Australia).
The Anabat Ⅱ detector was broadband (10-200
kHz), divide-by detector, which divided the
frequencies of incoming signal by a preset division
ratio (set at 16 in this study) to bring it within the
audible ranges for the analysis. The signal then
passed through ZCAIM where frequency information
for the harmonic with the highest energy (usually
the fundamental) was determined with the zero-
crossing analysis, and the multiple harmonics
were excluded. The ZCAIM was connected to a
laptop computer to construct a oscillogram with
the Anabat software (versions 6.2d or 5.7i), and
saved it for later analysis. We also recorded the
echolocation calls of Rhinolophus monoceros
and Miniopterus schreibersii when they emerged
from the roosts in dusk.
2. Data analysis
A typical sequence of echolocation call was
found to be consisted of an approach-phase pulse
and a terminal-phase pulse for feeding buzzes,
and echoes, extraneous noise, and fragmentary
pulses. The sequence was edited by quantitatively
removal of non-search-phase portions by the
filter options and remaining fragmentary calls
by the Mark-off Points options in the software
program Analook (version 4.9j, Titley Electronics
). When the editing process was completed, the
values of parameters for each of the pulses within
the call sequence were saved for later statistic
analysis. When edited call sequence had less than
5 pulses, it was excluded from the analysis. When
the parameters were from the sequences of more
than 5 individuals, they were used to examine the
intrerpecific variation.
Ten parameters were examined. They were
five frequency components, three time components
and two slope components. The five frequency
components were maximum frequency (Fmax),
minimum frequency (Fmin), frequency at the
knee (Fk), frequency of body (Fmean), and
characteristic frequency (Fc). The three time
components were total duration of the pulse
(Dur), time into the pulse when the knee was
reached (Tk), and time into the pulse when the
characteristic frequency was reached (Tc). The
two slope components were slope of the body (Sl)
and characteristic section (Sc). The body was the
flattest part of the call (lowest frequency change
over time) equivalent to the narrow-band component
(Caddle and Lumsden 1997).
3. Statistic analysis
Each of the parameters of the echo pulses of
each species obtained was analyzed specifically
with SAS software 9.13 and expressed as mean ±
standard deviations and range. Multivariate
discriminated function analysis (DFA) with
cross-validation was used to examine the inter-
and intra-specific variations. The DFA was
performed with SPSS for Windows version 12
and the significant level was kept at p < 0.05.

台灣生物多樣性研究(TW J. of Biodivers.) 14 (3-4): 33 -62, 2012 37
Results
In March 2005 to November 2006, echolocation
calls were recorded from 249 individuals of 11
insectivorous bats, Rhinolophus monoceros ,
Hipposideros terasensis , Arielulus torquatus,
Pipistrellus abramus , Scotophi lus kuhlii ,
Eptesicus serotinus horikawai , Miniopterus
schreibersii , Murina puta, Myotis latirostris,
Myotis sp.2, and Myotis sp.3, in Taiwan and
Kinmen. The echo pulses had two types: constant
frequency (CF) type and frequency-modulated
(FM) type. The echoes of R. monoceros and H.
terasensis belonged to the CF type, whereas the
echoes of P. abramus, A. torquatus, S. kuhlii, E.
serotinus horikawai, Mi. schreibersii, Mu. puta,
My. latirostris, Myotis sp.2, and Myotis sp.3 were
the FM type. They are described as follows:
1. CF type echoes
(1) Rhinolophus monoceros
An echo pulse of R. monoceros had a two –
frequency modulated part and a constant frequency
part (Fig. 1). Its characters had Fmin of 96.50 ±
9.83 kHz, Fmax of 112.82 ± 2.09 kHz, Fc of 112.15
± 3.0 kHz, and Fmean of 111.14 ± 2.57 kHz. The
two-frequency modulated part had an in itial
frequency of around 86 kHz for 2.67 ± 4.56
ms from the start and 2.02 ± 1.60 ms from the
constant frequency part to the end of the pulse.
The constant frequency was approximately 112
kHz for 14.31 ± 9.41 ms. The total duration of
the pulses was 18.94 ± 11.38 ms. Table 1 shows
the other parameters of the echo pulses.
(2) Hipposideros terasensis
An echo pulse of H. t erasensi s had a one -
frequency modulated part and a constant part (Fig.
2). The pulse was similar in shape to that of R.
monoceros but distinguishable easily between the
two species by the characters of the constant part.
The main characters were Fmin 61.63 ± 2.30
kHz, Fmax 68.80 ± 1.90 kHz, Fc 68.41 ± 1.91
kHz, and Fmean 67.56 ± 1.53 kHz. The initial
frequency of the pulse was around 65 kHz and
had a prolonged constant part for 6.26 ± 2.32 ms.
From the end of the constant part, the frequency
showed a downward trend to 60 kHz to the end
of the pulse. The total duration of the pulse was
8.44 ± 2.49 ms. Table 1 shows the other parameters
of the echo calls.
2. FM type echoes:
(1) Pipistrellus abramus
Echo pulses of P. abramus were curvilinear in
shape with the durations of 4.52 ± 1.69 ms (Fig.
3). They had Fmin of 47.68 ± 3.01 kHz, Fmax of
58.90 ± 10.12 kHz, Fc of 47.92 ± 3.38 kHz, and
Fmean of 50.40 ± 3.91 kHz. The other characters
are shown in Table 2.
(2) Arielulus torquatus
The echolocation pulses of A. torquatus were
curvilinear in shape with the duration of 3.10 ±
1.07 ms (Fig. 4). They had Fmin of 39.50 ± 6.00
kHz, Fmax of 64.13 ± 10.43 kHz, Fc of 41.84 ±
5.57 kHz, and Fmean of 45.41 ± 5.26 kHz. The
other characters are shown in Table 2.
(3) Scotophilus kuhlii
The shape of the echolocation calls of S. kuhlii
was curvilinear with the duration of 4.19 ± 2.00
ms (Fig. 5). They had Fmin of 41.04 ± 2.27 kHz,

38 Echolocation Calls of the Eleven Insectivorous Bats of Taiwan
Fmax of 65.62 ± 12.42 kHz, Fc of 41.64 ± 2.60
kHz, and Fmean of 46.91 ± 3.96 kHz. The other
characters are shown in Table 2.
(4) Eptesicus serotinus horikawai
The shape of the echolocation calls of E.
serotinus horikawai was curvilinear with the
duration of 7.97 ± 3.18 ms (Fig. 6). They had Fmin
of 29.52 ± 3.83 kHz, Fmax of 46.92 ± 10.91 kHz,
Fc of 30.20 ± 4.64 kHz, and Fmean of 34.55 ± 4.86
kHz. The other characters are shown in Table 2.
(5) Miniopterus schreibersii
The shape of the echolocation calls of Mi.
schreibersii was curvilinear with the duration of
3.74 ± 1.50 ms (Fig. 7). They had Fmin of 46.61
± 5.64 kHz, Fmax of 66.40 ± 18.99 kHz, Fc of
47.01 ± 6.60 kHz, and Fmean of 51.30 ± 8.86
kHz. The other characters are shown in Table 2.
(6) Murina puta
The shape of the echolocation calls of Mu.
pupta was linear with the duration of 1.33 ±
0.52 ms (Fig. 8). They had Fmin of 64.82 ± 10.52
kHz, Fmax of 115.50 ± 12.56 kHz, Fc of 100.06
± 15.02 kHz, and Fmean of 86.84 ± 10.30 kHz.
The other characters are shown in Table 2.
(7) Myotis latirostris
The shape of the echolocation calls of My.
latirostris was curvilinear with the duration of
2.66 ± 0.75 ms (Fig. 9). They had Fmin of 49.78
± 2.15 kHz, Fmax of 72.72 ± 14.15 kHz, Fc of
49.97 ± 2.37, and Fmean of 54.77 ± 3.19 kHz.
The other characters are shown in Table 2.
(8) Myotis sp.2
The shape of the echolocation calls of Myotis
sp.2 was curvilinear with the duration of 1.84 ±
0.68 ms (Fig. 10). They had Fmin of 48.14 ± 2.80
kHz, Fmax of 70.02 ± 13.29 Hz, Fc of 50.67 ±
5.67 kHz, and Fmean of 54.05 ± 4.65 kHz. The
other characters are shown in Table 2.
(9) Myotis sp.3
The shape of the echolocation calls of Myotis
sp.3 was linear with the duration of 1.07 ± 0.38
ms (Fig. 11). They had Fmin of 48.38 ± 2.76 kHz,
Fmax of 76.98 ± 10.54 kHz, Fc of 61.99 ± 8.75
kHz, and Fmean of 57.55 ± 4.46 kHz. The other
characters are shown in Table 2.
3. Species discrimination
(1) CF bats
Except the slope of characteristic section (Sc),
the other 9 parameters of the echo pulses were
significantly different between R. monoceros and
H. terasensis, based on the Duncan's Multiple
Range Test with the generalized linear model
(GLM) procedure (Table1). There were a lot of
discrepancies in the calls between the two bats,
particularly in characteristic frequency (Fc), a
character useful in specific distinction.
(2) FM bats
Based on the Duncan's Multiple Range Test
with GLM procedure, the 9 species with the FM-
type echoes could be separated into 8 groups
(Groups A to H) by the pulse duration (Dur); 7
groups (group A to G) on Fmean and Fk, and
Fmin and Tk, 6 groups (Group A to F) by Fc,
Fmax and Tc; and 5 groups (Group A to E) by Sl
and Sc (Table 2).
The best model was the stepwise discrimination
analysis with the parameters Fk, Fmin, Dur, Sc,
Fmax, Fmean, Tk and Fc, that produced an
overall classification rate of 57.3% and the
variance of 86.1% among the 9 species by the

台灣生物多樣性研究(TW J. of Biodivers.) 14 (3-4): 33 -62, 2012 39
first two DFA function (Fig. 12). The frequency
parameters including Fk, Fc, Fmean, and Fmin
occupied the first fourth status in the first
discriminating function. Furthermore, the most
important parameter of the second function was
time into the pulse when the knee was reached
(Tk) (Table 3).
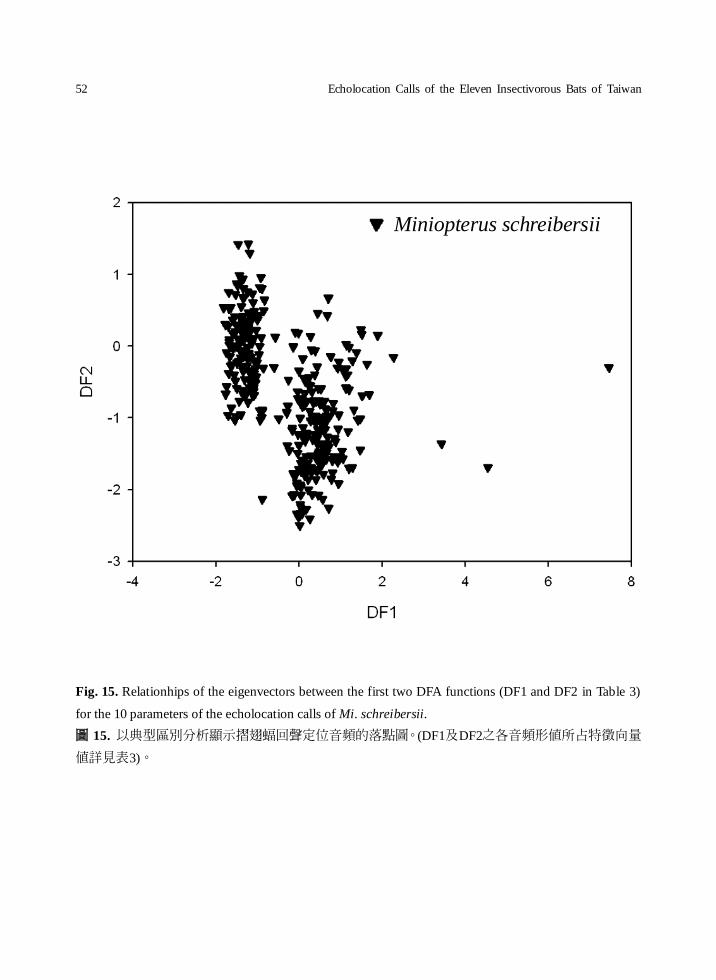
According to the first two discriminating
factors, there were remarkable intra-species
variations in Mu. puta, and Myotis sp.3 (Figs. 16
and 19). It was worth to point that the echo calls
of Mi. schreibersii could be separated into two
main groups by DF1 (Fig. 15). Based on the DF2,
we separated echo calls of A. torquatus from
those of E. serotinus horikawai (Figs.13 and 14).
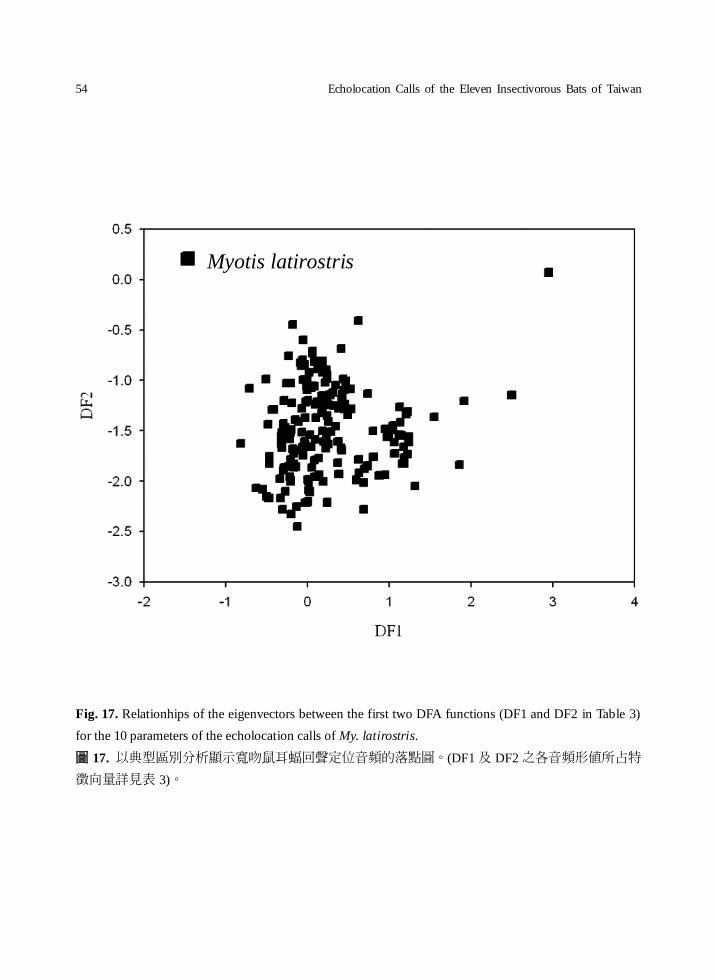
However, it was still difficult to distinguish the
calls among P. abramus, S. kuhlii, My. latirostris,
and Myotis sp.2 based on the DF1 and DF2
factors in our study (Figs. 18, 21, 17 and 20).
Discussion
Species-specific characters
The results of this study showed that R.
monoceros and H. terasensis used CF type
echolocation calls, whereas the other 9 species
used FM type calls. The former two species could
be distinguished easily by the oscillogram of their
echolocation calls, but not for the latter 9 species.
For these species, Mu. puta and Myotis sp.3 made
a linear echo type call, while the remaining 7
species were the curvilinear echo type. The 10
echo parameters measured were found to be
useful in identification of the 11 species studied.
For the parameters, duration of pulse (Dur) was
the most important in distinguishing the FM bat
species. However, it was noted that Mu. puta and
Myotis sp.3 were not distinguishable by the
duration of pulse alone but by the frequency and
the slope of the pulses. Furthermore, we found
that My. latirostris and Myotis sp.2, were difficult
to distinguish; they had a similar echo pattern,
and more information is needed for the species
identification.
Inter-specific variation
1. Jamming avoidance response
Fenton and Bell (1979) found that an individual
of My. volan avoids interferences from other
individual when feeding in the same area by
modulating its own call, the so-called “jamming
avoidance response” (Jones et al. 1994; Ulanovsky
et al. 2004). Lee (2007) first reported H. armiger,
a CF type species, to have the jamming avoidance
response in Taiwan. In our study, we recorded
two FM-type species, P. abramus and S. kuhlii,
to have the jamming avoidance response in open
field near the colony roost when different individuals
emerged simultaneously (Figs. 22 and 23). One
of co-active individuals would switch and adjust
its echo to various calls to avoid the interferences.
2. Dialects
The results of the DFA analysis (Fig.15)
showed the presence of two main groups of the
FM type bats by DF1. There was a great
discrepancy in the frequency among different
geographical colonies of Mi. schreibersii (Fig.
24). The population from Taiwan emits the
minimum frequency (Fmin) around 50 kHz,
40 Echolocation Calls of the Eleven Insectivorous Bats of Taiwan
whereas the population from the Kinmen Island
had approximately 40 kHz. Such geographic
variation was also found for V. darlingtoni by
Law et al. (2002) who call it “dialects.” However,
this paper first reports the dialect of bat in Taiwan.
Foraging strategies
Different types of echolocation calls used
by insectivorous bats when flying in night may
associate with their behavior and foraging strategies.
Aerial foraging species always emit lower
frequency calls to avoid the atmospheric reduced
effect (Schnitzler and Kalko 1998). On the other
hand, gleaner foraging species glean insects under
the canopy or on the surface of vegetation by
low-intensity, brief, and broadband calls to avoid
overlap between their pulses and echoes when
closing targets (Vaughan et al. 1997). Based on
the echolocation data obtained and observation
made in the wild, we concluded that M. schreibersii,
E. serotinus horikawai, S. kuhlii , A. torquatus,
My. latirostris, and Myotis sp.2 were the aerial
foraging species, whereas Mu. puta and Myotis
sp.3 were possible glean foraging species; they
had the maneuverable feeding behavior and flied
closer to the ground.
Table 1. Sample sizes, means, standard deviations and range of 10 parameters of the two insectivorous
species using CF-type echolocation.calls (Dur, duration of pulse; Fmax, maximum frequency; Fmin,
minimum frequency; Fmean, mean frequency; TK, time into the pulse when the knee is reached; FK,
frequency at the knee; TC, time into the pulse when the characteristic frequency is reached; Fc,
characteristic frequency; SI, initial slope of pulse; Sc, slope of the characteristic section; Ne, sample sizes
sufficient for the statistic analysis; N, number of samples; and the grouping method was used for
Duncan's Multiple Range Test by Generalized linear model (GLM)
表 1. 常頻式臺灣小蹄鼻蝠與臺灣葉鼻蝠的 10 個回聲定位音頻形值、樣本數、平均值、標準偏差及
範圍。音頻形值包含持續時間(毫秒)、最高頻率(卂赫)、最低頻率(卂赫)、平均頻率(卂赫)、起始音
頻到轉折點時間(毫秒)、轉折點頻率(卂赫)、起始音頻到特徵點時間(毫秒)、特徵點頻率(卂赫)、起
始斜率,以及特徵點斜率。以多變量分析並藉線性模式的鄧肯檢定作為分群檢定。N 表示測錄蝙蝠
數量,Ne 表示測錄分析蝙蝠回聲定位脈波數
Species Dur Fmax Fmin Fmean Tk Fk Tc Fc S1 Sc
(Ne/N) (ms) (kHz) (kHz) (kHz) (ms) (kHz) (ms) (kHz) (kHz/ms) (kHz/ms)
R. monoceros
(197/19)
18.94
±11.39A
112.82
±2.09A
96.50
±9.83A
111.14
±2.57A
2.62
±4.56A
111.94
±3.04A
16.93
±10.53A
112.15
±3.04A
-440.99
±733.33A
-5.12
±97.29A
0.30~
54.80
99.38~
115.94
80~
113.48
95.92~
114.58
0 ~
41.53
92.49~
115.11
0.15~
53.21
93.02~
115.11
-4304.75~
1064.41
-866.04~
628.97
H. terasensis 8.44 68.80 61.63 67.56 0.39 68.26 6.65 68.41 -3.01 0.74

台灣生物多樣性研究(TW J. of Biodivers.) 14 (3-4): 33 -62, 2012 41
(191/54) ±2.49B ±1.90B ±2.30B ±1.53B ±0.71B ±1.88B ±2.47B ±1.91B ±92.37 B ±15.25A
0.52~
15.77
65.04~
71.75
57.55~
70.80
62.02~
71.23
0~
8.05
64.00~
71.75
0.39~
14.15
61.54~
71.11
-702.70~
224.55
-8.97~
206.87
Note: Significant different between A group and B group (Duncan's Multiple Range Test, p < 0.05).
註:A 與 B為各音頻形值由鄧肯檢定分析顯示顯著的兩個分群排序。
Table 2. Sample sizes, types, means, standard deviations and range of 10 echoes parameters of 9
insectivorous bat species using FM-type echolocation calls (abbreviations similar to those denoted in Table 1)
表 2. 臺灣地區 9種調頻式蝙蝠的 10 個回聲定位音頻形值、樣本數、平均值、標準偏差及範圍。音
頻形值包含持續時間(毫秒)、最高頻率(卂赫)、最低頻率(卂赫)、平均頻率(卂赫)、起始音頻到轉折
點時間(毫秒)、轉折點頻率(卂赫)、起始音頻到特徵點時間(毫秒)、特徵點頻率(卂赫)、起始斜率,
以及特徵點斜率。以多變量分析並藉線性模式的鄧肯檢定作為分群檢定。CL 表示曲線型,L 表示
線型音頻。N 表示測錄蝙蝠數量,Ne 表示測錄分析蝙蝠回聲定位脈波數
Species Type Dur Fmax Fmin Fmean Tk Fk Tc Fc S1 Sc
(Ne/N) (ms) (kHz) (kHz) (kHz) (ms) (kHz) (ms) (kHz) (kHz/ms) (kHz/ms)
Pipistrellus
abramus
CL 4.52
±1.69B
58.90
±10.12E
47.68
±3.01C
50.40
±3.91D
1.34
±0.89D
50.55
± 3.89E
4.28
± 1.56B
47.92
± 3.38D
188.56
± 245.32E
41.22
± 55.30F
(270/45) 0.58~
8.60
42.11~
86.02
40.82~
63.75
41.44~
70.66
0~
3.67
42.11~
4.01
0.26~
7.84
40.82~
9.57
-1880.91~
1047.81
-20.70~
408.17
Arielulus
torquatus
CL 3.10
± 1.07E
64.13
± 10.43D
39.50
± 6.00F
45.41
±5.26F
1.70
±0.87C
44.65
± 6.11F
2.78
± 1.23D
41.84
±5.57E
83.45
± 1051.50F
D147.13
±195.41
(135/7) 0.42~
5.39
44.82~
85.11
25.32~
72.73
35.13~
76.01
0~
3.35
32.13~
74.07
0.2~
5.02
30.25~
9.6
-3926.83~
3056.11
-516.60~
748.90
Scotophilus
kuhlii
CL 4.19
± 2.00C
65.62
± 12.42D
41.04
± 2.27E
46.91
± 3.96E
2.05
±1.12B
44.48
± 2.86F
3.79
±1.96C
41.64
± 2.60E
313.16
±424.38D
87.81
± 87.84E
(467/46) 0.55~
13.69
39.22~
87.43
35.4~
56.14
37.74~
58.39
0~
9.21
37.3~
63.49
0.26~
13
35.56~
60.84
-4225.53~
2023.61
-157.17~
685.29
Eptesicus
serotinus
horikawai
CL 7.97
± 3.18A
46.92
± 10.91F
29.52
± 3.83G
34.55
± 4.86G
3.75
±2.21A
33.57
±5.03G
7.38
± 3.13A
30.20
± 4.64F
165.29
±407.07E
66.90
± 68.05E

42 Echolocation Calls of the Eleven Insectivorous Bats of Taiwan
Note: Eight significant difference groups ranked from A to H by Duncan's Multiple Range Test.
註:A 至 H 為各音頻形值由鄧肯檢定分析顯著的 8 個分群排序。
(168/13) 1.01~
22.49
26.8~
76.92
23.15~
54.24
25.23~
58.35
0.20~
14.43
25.44~
62.75
0.66~
20.98
23.15~
59.04
-2190.96~
2930.22
-1.78~
364.06
Miniopterus
schreibersii
CL 3.74
± 1.50D
66.40
± 18.99D
46.61
± 5.64D
51.30
± 8.86D
1.44
±0.92D
50.30
±6.95E
3.55
± 1.49C
47.01
± 6.60D
206.72
± 579.83E
61.76
± 75.71F
(335/13) 0.57~
8.10
40.10~
115.11
38.55~
66.12
39.75~
83.5
0~
5.36
40.10~
103.23
0.07~
7.23
39.02~
107.38
-3323.26~
1688.80
-791.05~
467.52
Murina
puta
L 1.33
± 0.52H
115.05
±12.56A
64.82
±10.52A
86.84
± 10.30A
0.20
± 0.27G
108.24
± 15.02A
0.44
± 0.29F
100.06
±15.02A
384.47
± 797.59C
537.78
± 339.42B
(91/6) 0.27~
2.49
88.40~
146.79
51.28~
116.79
70.48~
126.18
0~
1.25
65.04~
144.14
0.07~
1.51
59.48~
128.00
-3333.94~
2484.83
-971.09~
1713.43
Myotis
latirostris
CL 2.66±
0.75F
72.72
± 14.15C
49.78
±2.15B
54.77
± 3.19C
1.22
±0.66E
53.32
± 2.74D
2.58
± 0.76D
49.97
± 2.37C
501.27
± 277.38B
84.38
± 100.99E
(191/15) 0.59~
4.23
50.96~
101.91
44.82~
55.36
49.20~
64.23
0~
3.06
49.38~
71.11
0.29~
4.23
45.58~
59.7
-961.23~
1895.4
5.5~
1287.82
Myotis sp.2
CL 1.84
± 0.68G
70.02
± 13.29C
48.14
± 2.80C
54.05
± 4.65C
0.80
± 0.52F
55.18
±6.99C
1.66
± 0.81E
50.67
± 5.67C
459.47
±428.01C
233.60
± 236.01C
(383/23) 0.60~
3.65
43.72~
101.91
38.19~
53.69
41.52~
66.39
0~
2.27
41.88~
93.57
0.14~
3.65
38.65~
86.02
-1963.86~
1338.55
22.26~
1062.88
Myotis sp.3
L 1.07
± 0.38H
76.98
± 10.54B
48.38
± 2.76C
57.55
± 4.46B
0.22
± 0.23G
69.44
± 9.17B
0.49
± 0.27F
61.99
± 8.75B
708.18
± 268.10A
634.67
± 205.65A
(109/8) 0.54~
3.08
57.55~
106.67
41.13~
56.74
49.61~
69.46
0~
1.13
54.98~
100.63
0.10~
1.74
48.34~
91.95
-903.86~
1557.11
-45.58~
1313.19

台灣生物多樣性研究(TW J. of Biodivers.) 14 (3-4): 33 -62, 2012 43
Table 3. Eigenvectors of the first two DFA functions (DF1 and DF2) for the 10 parameters of the
echolocation calls 9 species of bats using the FM-type echo calls
表 3. 調頻式蝙蝠 10 個回聲定位音頻形值於判別分析第一與第二因子所占的特徵向量值
Parameters1/ DF1 DF2
Dur -0.49411 0.838164
Fmax -0.51956 -1.72225
Fmin -0.19953 -1.47523
Fmean 0.837549 1.935487
Tk -0.32372 0.75349
Fk -0.36782 0.647562
Tc 0.882245 -0.72182
Fc 1.092281 -0.28172
Sl 0.133029 0.000699
Sc 0.356043 0.228875
Proportion 67.93904 86.08585
1/ Abbreviation of the pulse parameters similar to those denoted in Table 1.
Fig. 1. The oscillogram of R. monoceros (X-axis, time scale (20 ms each period); Y-axis, log frequency
scale, and Fc between 100 kHz and 115 kHz).
圖 1. 臺灣小蹄鼻蝠的回聲定位音頻波形圖。X 軸為時間軸(每格為 20 毫秒),Y 軸為頻率(卂赫),
特徵音頻範圍自 100 到 115 卂赫。

44 Echolocation Calls of the Eleven Insectivorous Bats of Taiwan
Fig. 2. The oscillogram of H. terasensis (X-axis, time scale (20 ms each period); Y-axis, log frequency
scale, and Fc between 65 kHz and 70 kHz).
圖 2. 臺灣葉鼻蝠的回聲定位音頻波形圖。X 軸為時間軸(每格為 20 毫秒),Y 軸為頻率(卂赫),特
徵音頻範圍自 65 到 70 卂赫。
Fig. 3. The oscillogram of P. abramus (X-axis, time scale (20 ms each period); Y-axis, log frequency
scale, and Fc between 40 kHz and 100 kHz).
圖 3. 東亞家蝠的回聲定位音頻波形圖。X 軸為時間軸(每格為 20 毫秒),Y 軸為頻率(卂赫),特徵
音頻範圍自 40 到 100 卂赫。

台灣生物多樣性研究(TW J. of Biodivers.) 14 (3-4): 33 -62, 2012 45
Fig. 4. The oscillogram of A. torquatus (X-axis, time scale (20 ms each period); Y-axis, log frequency
scale, and Fc between 25 kHz and 70 kHz).
圖 4. 黃頸蝠的回聲定位音頻波形圖。X 軸為時間軸(每格為 20 毫秒),Y 軸為頻率(卂赫),特徵音
頻範圍自 25 到 70 卂赫。
Fig. 5. The oscillogram of S. kuhlii (X-axis, time scale (20 ms each period); Y-axis, log frequency scale,
and Fc between 35 kHz and 85 kHz).
圖 5. 高頭蝠的回聲定位音頻波形圖。X 軸為時間軸(每格為 20 毫秒),Y 軸為頻率(卂赫),特徵音
頻範圍自 35 到 85 卂赫。

46 Echolocation Calls of the Eleven Insectivorous Bats of Taiwan
Fig. 6. The oscillogram of E. serotinus horikawai (X-axis, time scale (20 ms each period); Y-axis, log
frequency scale, and Fc between20 kHz and 60 kHz).
圖 6. 堀川氏棕蝠的回聲定位音頻波形圖。X 軸為時間軸(每格為 20 毫秒),Y 軸為頻率(卂赫),特
徵音頻範圍自 20 到 60 卂赫。
Fig. 7. The oscillogram of Mi. schreibersii (X-axis, time scale (20 ms each period); Y-axis, log frequency
scale, and Fc between 50 kHz and 110 kHz).
圖 7. 摺翅蝠的回聲定位音頻波形圖。X 軸為時間軸(每格為 20 毫秒),Y 軸為頻率(卂赫),特徵音
頻範圍自 50 到 110 卂赫。

台灣生物多樣性研究(TW J. of Biodivers.) 14 (3-4): 33 -62, 2012 47
Fig. 8. The oscillogram of Mu. puta (X-axis, time scale (20 ms each period); Y-axis, log frequency scale,
and Fc between 40 kHz and 170 kHz).
圖 8. 臺灣管鼻蝠的回聲定位音頻波形圖。X 軸為時間軸(每格為 20 毫秒),Y 軸為頻率(卂赫),特
徵音頻範圍自 40 到 170 卂赫。
Fig. 9. The oscillogram of My. latirostris (X-axis, time scale (20 ms each period); Y-axis, log frequency
scale, and Fc between 40 kHz and 100 kHz).
圖 9. 寬吻鼠耳蝠的回聲定位音頻波形圖。X 軸為時間軸(每格為 20 毫秒),Y 軸為頻率(卂赫),特
徵音頻範圍自 40 到 100 卂赫。

48 Echolocation Calls of the Eleven Insectivorous Bats of Taiwan
Fig. 10. The oscillogram of Myotis sp.2 (X-axis, time scale (20 ms each period); Y-axis, log frequency
scale, and Fc between 40 kHz and 80 kHz).
圖 10. 長趾鼠耳蝠的回聲定位音頻波形圖。X 軸為時間軸(每格為 20 毫秒),Y 軸為頻率(卂赫),範
圍自 40 到 80 卂赫。
Fig. 11. The oscillogram of Myotis sp.3 (X-axis, time scale (20 ms each period); Y-axis, log frequency
scale, and Fc between 35 kHz and 120 kHz).
圖 11. 長尾鼠耳蝠的回聲定位音頻波形圖。X 軸為時間軸(每格為 20 毫秒),Y 軸為頻率(卂赫),特
徵音頻範圍自 35 到 120 卂赫。

台灣生物多樣性研究(TW J. of Biodivers.) 14 (3-4): 33 -62, 2012 49
Fig. 12. Relationhips of the eigenvectors between the first two DFA functions (DF1 and DF2 in Table 3)
for the 10 parameters of the echolocation calls of the 9 species of FM-type bats.
圖 12. 調頻式蝙蝠音頻測量值於典型區別分析的落點圖。(DF1及DF2之各音頻形值所占的特徵向量
值詳見表3)。
● Arielulus torquatus
○ Eptesicus serotinus horikawai
▼ Miniopterus schreibersii
△ Murina puta
▓ Myotis latirostris
□ Myotis sp.2
◆ Myotis sp.3
◇ Pipistrellus abramus
▲ Scotophilus kuhlii

50 Echolocation Calls of the Eleven Insectivorous Bats of Taiwan
Fig. 13. Relationhips of the eigenvectors between the first two DFA functions (DF1 and DF2 in Table 3)
for the 10 parameters of the echolocation calls of A. torquatus.
圖 13. 以典型區別分析顯示黃頸蝠回聲定位音頻的落點圖。(DF1 及 DF2 之各音頻形值所占的特徵
向量值詳見表 3)。
Arielulus torquatus

台灣生物多樣性研究(TW J. of Biodivers.) 14 (3-4): 33 -62, 2012 51
Fig. 14. Relationhips of the eigenvectors between the first two DFA functions (DF1 and DF2 in Table 3)
for the 10 parameters of the echolocation calls of E. serotinus horikawai.
圖 14. 以典型區別分析顯示堀川氏棕蝠回聲定位音頻的落點圖。(DF1及DF2之各音頻形值所占特徵
向量詳見表3)。
Eptesicus serotinus horikawai
52 Echolocation Calls of the Eleven Insectivorous Bats of Taiwan
Fig. 15. Relationhips of the eigenvectors between the first two DFA functions (DF1 and DF2 in Table 3)
for the 10 parameters of the echolocation calls of Mi. schreibersii.
圖 15. 以典型區別分析顯示摺翅蝠回聲定位音頻的落點圖。(DF1及DF2之各音頻形值所占特徵向量
值詳見表3)。
Miniopterus schreibersii

台灣生物多樣性研究(TW J. of Biodivers.) 14 (3-4): 33 -62, 2012 53
Fig. 16. Relationhips of the eigenvectors between the first two DFA functions (DF1 and DF2 in Table 3)
for the 10 parameters of the echolocation calls Mu. puta.
圖 16. 以典型區別分析顯示臺灣管鼻蝠回聲定位音頻的落點圖。(DF1 及 DF2 之各音頻形值所占特
徵向量值詳見表 3)。
Murina puta
54 Echolocation Calls of the Eleven Insectivorous Bats of Taiwan
Fig. 17. Relationhips of the eigenvectors between the first two DFA functions (DF1 and DF2 in Table 3)
for the 10 parameters of the echolocation calls of My. latirostris.
圖 17. 以典型區別分析顯示寬吻鼠耳蝠回聲定位音頻的落點圖。(DF1 及 DF2 之各音頻形值所占特
徵向量詳見表 3)。
Myotis latirostris

台灣生物多樣性研究(TW J. of Biodivers.) 14 (3-4): 33 -62, 2012 55
Fig. 18. Relationhips of the eigenvectors between the first two DFA functions (DF1 and DF2 in Table 3)
for the 10 parameters of the echolocation calls Myotis sp.2.
圖 18. 以典型區別分析顯示長趾鼠耳蝠回聲定位音頻的落點圖。(DF1 及 DF2 之各音頻形值所占特
徵向量詳見表 3)。
Myotis sp.2

56 Echolocation Calls of the Eleven Insectivorous Bats of Taiwan
Fig. 19. Relationhips of the eigenvectors between the first two DFA functions (DF1 and DF2 in Table 3)
for the 10 parameters of the echolocation calls of Myotis sp.3.
圖 19. 以典型區別分析顯示長尾鼠耳蝠回聲定位音頻的落點圖。(DF1 及 DF2 之各音頻形值所占特
徵向量詳見表 3)。
Myotis sp.3

台灣生物多樣性研究(TW J. of Biodivers.) 14 (3-4): 33 -62, 2012 57
Fig. 20. Relationhips of the eigenvectors between the first two DFA functions (DF1 and DF2 in Table 3)
for the 10 parameters of the echolocation calls of P. abramus.
圖 20. 以典型區別分析顯示東亞家蝠回聲定位音頻的落點圖。(DF1 及 DF2 之各音頻形值所占特徵
向量詳見表 3)。
Pipistrellus abramus

58 Echolocation Calls of the Eleven Insectivorous Bats of Taiwan
Fig. 21. Relationhips of the eigenvectors between the first two DFA functions (DF1 and DF2 in Table 3)
for the 10 parameters of the echolocation calls of S. kuhlii.
圖 21. 以典型區別分析顯示高頭蝠回聲定位音頻的落點圖。(DF1 及 DF2 之各音頻形值所占特徵向
量詳見表 3)。
Scotophilus kuhlii

台灣生物多樣性研究(TW J. of Biodivers.) 14 (3-4): 33 -62, 2012 59
Fig. 22. The oscillogram showing jamming avoidance (overlapping plus) of P. abramus (X-axis, time
scale (10 ms each period); Y-axis, log frequency scale).
圖 22. 東亞家蝠的避免干擾音頻調整現象,圖中為共域兩隻個體的音頻波形圖;X 軸為時間軸(每
格為 10 毫秒),Y 軸為頻率(卂赫)。
Fig. 23. The oscillogram showing jamming avoidance (overlapping plus) of S. kuhlii (X-axis, time scale
(10 ms each period); Y-axis, log frequency scale).
圖 23. 高頭蝠的避免干擾音頻調整現象,圖中為多隻高頭蝠共域飛行的音頻波形圖;X 軸為時間軸
(每格為 10 毫秒),Y 軸為頻率(卂赫)。

60 Echolocation Calls of the Eleven Insectivorous Bats of Taiwan
Fig. 24. The oscillograms of Mi. schreibersii showing different dialetics from 3 colonies: (a) Rueifang,
New Taipei City, northern Taiwan (50.79~115.11 kHz); (b) Qishan, Kaohsiung, southern Taiwan, ranging
(47.2~100 kHz); and (c) Lieyu, Kinmen Island (38.55~77.67 kHz) (X-axis, time scale (20 ms each
period); Y-axis, log frequency scale).
圖 24. 不同地區摺翅蝠的回聲定位音頻頻譜圖,(a)瑞芳區,新北市,北臺灣,音頻範圍 50.79~115.11
卂赫(b)旗山區,高雄,南臺灣,音頻範圍 47.2~100 卂赫(c)列嶼,金門地區,音頻範圍 38.55~77.67
卂赫。此種差異現象稱為「方言」;X 軸為時間軸(每格為 20 毫秒),Y 軸為頻率(卂赫)。
a
b
c

台灣生物多樣性研究(TW J. of Biodivers.) 14 (3-4): 33 -62, 2012 61
Acknowledgements
We express our thanks to Dr. Lindy Lumsden,
Wildlife Ecology Section of the Arthur Rylah
Institute, Department of Sustainability and
Environment, Victoria Australia, who provided
us advice how to use the AnaBat system and data
analysis. Thanks also go to Hu Po-Hi, Lin Yun-An,
Huang Guang-Long and Chang Chun-Hsiang for
helping recording the echo-sounds of bats in the
field. This study was funded in part by the Taiwan
Endemic Species Research Institute.
Literature Cited
Ahlen, I. 1981. Identification of Scandinavian
bats by their sounds. Department of Wildlife
Ecology, Swedish University of Agricultural
Sciences, Report 6:1-56.
Barclay, R. M. R. 1999. Bats are not birds: a
cautionary note on using echolocation calls
to identify bats. Journal of Mammalogy 80:
290-296.
Betts, B. J. 1998. Effect of inter individual variation
in echolocation calls on identification of big
brown and silver-haired bats. The Journal of
Wildlife Management 62:1003-1010.
Brigham, R. M., J. E. Cebek and M. B. C. Hickey.
1989. Intraspecific variation in the echolocation
calls of two species of insectivorous bats.
Journal of Mammalogy 70:426-428.
Buchler, E. R. 1976. A chemiluminescent tag
for tracking bats and other small nocturnal
animals. Journal of Mammalogy 57:173-176.
Buchler, E. R. 1980. The development of flight,
foraging, and echolocation in the little
brown bat (Myotis lucifugus). Behavioral
Ecology and Sociobiology 6:211-218.
Caddle, C. and L. Lumsden. 1997. Some hints on
how to use the new Analook. The Australian
Bat Society Newsletter 8:18-20.
Cheng, H. C., Y. P. Fang and C. H. Chou. 2010.
A Photographic Guide to the Bats of Taiwan.
Endemic Species Research Institute. 143pp.
(in Chinese with English remarks)
Fenton, M. B. 1999. Describing the echolocation
calls and behavior of bats. Acta Chiropterologica
1:127-136.
Fenton, M. B. and G. P. Bell. 1979. Echolocation
and feeding behaviour in four species of
Myotis (Chiroptera). Canadian Journal of
Zoology 57:1271-1277.
Fenton, M. B. and G. P. Bell. 1981. Recognition
of species of insectivorous bats by their
echolocation calls. Journal of Mammalogy
62:233-243.
Fenton, M. B. and G. K. Morris. 1976. Opportunistic
feeding by desert bats, Myotis spp. Canadian
Journal of Zoology, 54:526-530.
Griffin D. R., Webster F. A. and C. R. Michael.
1960. The echolocation of flying insects by
bats. Animal Behaviour 8:141-154.
Hovorka, M. D., C. S. Marks and E. Muller. 1996.
An improved chemiluminescent tag for bats.
Wildlife Society Bulletin 24:709-712.
Heller, K. G. and O. V. Helversen. 1989. Resource
partitioning of sonar frequency bands in
rhinolophoid bats. Oceologia 80:178-186.
Jacobes, D. S. 1999. Intraspecific variation in
wingspan and echolocation call flexibility
might explain the use of different habitats
by the insectivorous bat, Miniopterus schreibersii
(Vespertilionidae: Miniopterinae). Acta
Chiropterologica 1:93-103.
Jensen, M. E. and L. A. Miller. 1999. Echolocation
signals of the bat Eptesicus serotinus recorded
using a vertical microphone array: effect
of flight altitude on searching signals.
62 Echolocation Calls of the Insectivorous Bats of Taiwan
Behavioral Ecology and Sociobiology 47:
60-69.
Jones, G., T. Gordon and J. Nightingale. 1992.
Sex and age differences in the echolocation
calls of the lesser horseshoe bat, Rhinolophus
hipposideros. Mammalia 56:189-193.
Jones, G., K. Sripathi, D. A.Waters and G.
Marimuthu. 1994. Individual variation
in the echolocation calls of three sympatric
Indian hipposiderid bats, and an experimental
attempt to jam bat echolocation. Folia
Zoologica 43:347-362.
Kalko, E. K. V. and H. U. Schnitzler. 1989. The
echolocation and hunting behavior of
Daubenton‟s bat,Myotis daubentoni.
Behavioral Ecology and Sociobiology 24:
225-238.
Law, B. S., L. Reinhold and M. Pennay. 2002.
Geographic variation in the echolocation
calls of Vespadelus spp. (Vespertiliondae)
from New South Wales and Queensland,
Australia. Acta Chiropterologica 4:201-215.
Lee, P. J. 2007. Jamming avoidance response
in echolocation calls of the Formosan
leaf-nosed bat (Hipposideros armiger).
Master thesis of National Taiwan University,
60 pp. (in Chinese with English abstract)
Lin, L. K., L. L. Lee and H. C. Cheng. 2004. Bats
of Taiwan. National Museum of Natural
Science. 177pp. (in Chinese with English
remarks)
Obrist, M. K. 1995. Flexible bat echolocation:
the influence of individual, habitat and
conspecifics on sonar signal design.
Behavioral Ecology and Sociobiology
36:207-219.
O‟Farrell , M. J. and B. W. Miller. 1999. Use
of vocal signatures for the inventory of
free-flying neotropical bats. Biotropica
31:507-516.
Parsons, S. 1997. Search-phase echolocation calls
of the New Zealand short-tailed bat (Mystacina
tuberculata) and long-tailed bat (Chalinolobus
tuberculatus).Canadian Journal of Zoology
75:1487-1494.
Pye, J. D. 1993. Is fidelity futile? The „true‟
signal is illusory, especially with ultrasound.
Bioacoustics 4:271-286.
Rydell, J. 1990. Behavioural variation in
echolocation pulses of the northern bat,
Eptesicus nilssoni. Ethology 85:103-113.
Rydell, J. 1993. Variation in the sonar of an aerial
hawking bat (Eptesicus nilssonii). Ethology
93:275-284.
Schnitzler, H. U. and E. K. V. Kalko. 1998.
Echolocation and foraging behavior of the
lesser bulldog bat, Noctilio albiventris :
preadaptations for piscivory? Behavioral
Ecology and Sociobiology 42: 305-319.
Schnitzler, H. U. and E. K. V. Kalko. 2001.
Echolocation by insect-eating bats.
Bioscience 51:557-569.
Thomas, D. W., G. P. Bell and M. B. Fenton.
1987. Variation in the echolocation call
frequencies recorded from North American
vespertilionid bats: a cautionary note.
Journal of Mammalogy 68:842-847.
Ulanovsky, N., M. B. Fenton, A. Tsoar and C.
Korine. 2004. Dynamics of jamming
avoidance in echolocating bats. Proceedings
of the Royal Society B: Biological Sciences
271:1467-1475.
Vaughan, N., G. Jones and S. Harris. 1997. Habitat
use by bats (Chiroptera) assessed by means
of a broad-band acoustic method. Journal of
Applied Ecology 34:716-730.