
ECHOCARDIOGRAPHIC EVALUATION OF AORTIC STENOSIS
144
EVALUATION OF AORTIC STENOSIS An Echocardiographic Approach Dr. NAGULA PRAVEEN 2 nd yr PG 2/18/2015
-
Upload
praveen-nagula -
Category
Education
-
view
523 -
download
2
Transcript of ECHOCARDIOGRAPHIC EVALUATION OF AORTIC STENOSIS

EVALUATION OF
AORTIC STENOSIS
An Echocardiographic Approach
Dr. NAGULA PRAVEEN2nd yr PG 2/18/2015

Aortic valve
• Aortic valve is composed of three cusps of equal size, each of which
is surrounded by a sinus, separated by a commissure and supported by
a fibrous annulus.
• Cusps are crescent shaped, open fully in systole to allow forward flow
and close in diastole.
• The free edge of cusp curves upward from the commissure and forms
a slight thickening at the tip or midpoint, called the node of Arantius.
• When the valve closes, three nodes meet in the center, three lines of
fusion radiate outward viewed as a Yshape in short axis view.
• Overlap of valve tissue along the lines of closure produces a tight seal
and prevents backflow during diastole.


Normal Aortic valve

Sinus of Valsalva
• Behind each cusp is its assosciated sinus (outpouchings).
• Support cusps during systole and provide a reservoir of blood to
augment coronary artery flow during diastole.
• LCA – arise from left sinus.
• RCA – arise form right sinus.
• Noncoronary cusp is Posterior and Rightward, just above the base
of interatrial spetum.
• At the superior margins of the sinuses, aortic root narrows at the
Sinotubular junction.

Normal aortic valve cusps appear thin and delicate, difficult
to visualize.
Long axis view – cusps appear as linear parallel lines close to
the walls of the aorta(systole).
Basal short axis view –
Three aortic cusps can be visualized within the annulus during
diastole – Y shape or inverted Mercedes Benz sign.
Aortic annulus can be visualized clearly in systole.
Number of cusps, fusion of one or more commissures can be
known.
Acquired valvular aortic stenosis – cusps become thickened,
restricted.
Position during systole is no longer parallel to the aortic walls.
Edges point toward the center of the aorta.
Severe cases – total lack of mobility. identification of cusps may be
impossible.

2D Echo-Long axis view
Diastole Systole

2D Echo-Short axis view
Diastole Systole
Y or inverted Mercedes-Benz sign
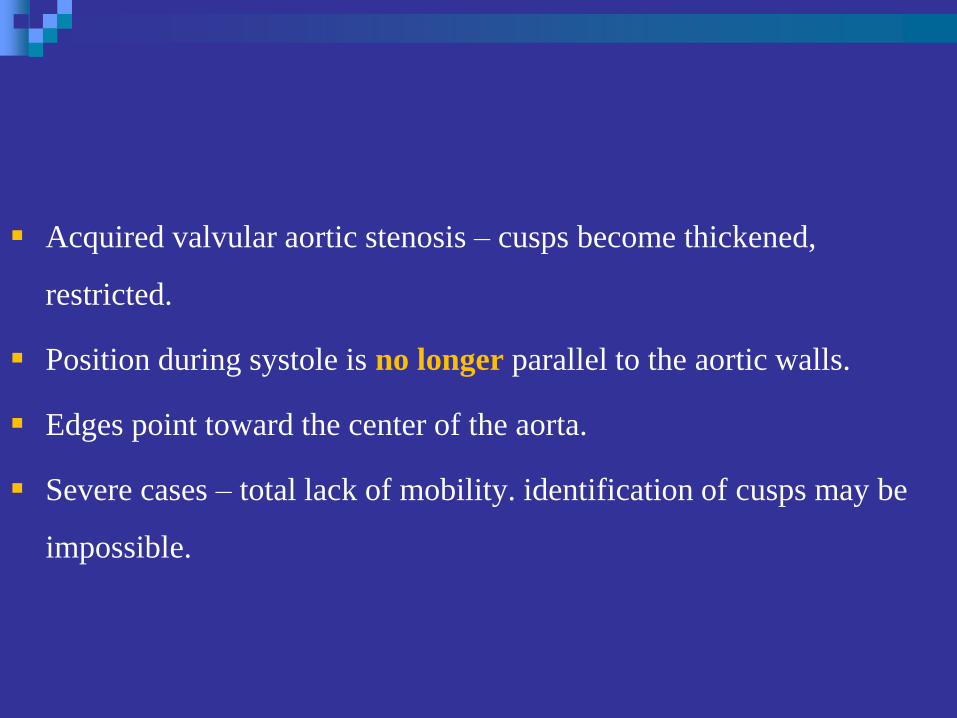
2D - Apical five chamber view

2D – Suprasternal view

CLASSIFICATION OF
AORTIC STENOSIS

Aortic stenosis
Congenital
Valvular
Bicuspid aortic valve
Unicuspid
Quadricuspid
Subvalvular
Dynamic
HOCM
Fixed
Membranous Fibromuscular
Acquired
Degenerative Rheumatic
Native valve
disease
Prosthetic valve
PPM
IESupravalvular Type I
TypeII
Type III

Aortic sclerosis
About 25% of all adults over age 65 yrs have aortic valve sclerosis.
Thickened calcified cusps with preserved mobility.
No significant obstruction to LV outflow.
Typically associated with peak doppler velocity of < 2.5 m/sec.
In Cardiovascular Health Study ,for group of patients 65 yrs,the
aortic valve was normal in 70% of cases,sclerotic in 29% and stenotic
in 2%. JACC.1997;29(3):630-4.
In Euro Heart Survey of 4910 pts in 25 countries,AS was the most
frequent lesion,accounting for 43% of patients with VHD.
Eur Heart J.2003;24(13):1231-43.
Calcific Aortic Stenosis
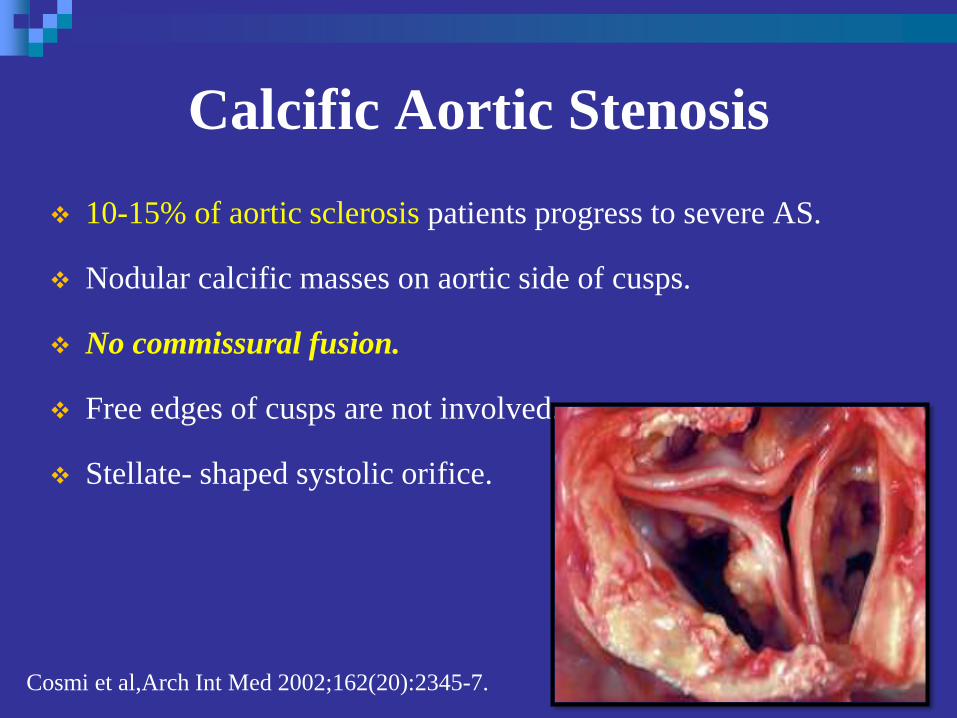
10-15% of aortic sclerosis patients progress to severe AS.
Nodular calcific masses on aortic side of cusps.
No commissural fusion.
Free edges of cusps are not involved.
Stellate- shaped systolic orifice.
Cosmi et al,Arch Int Med 2002;162(20):2345-7.
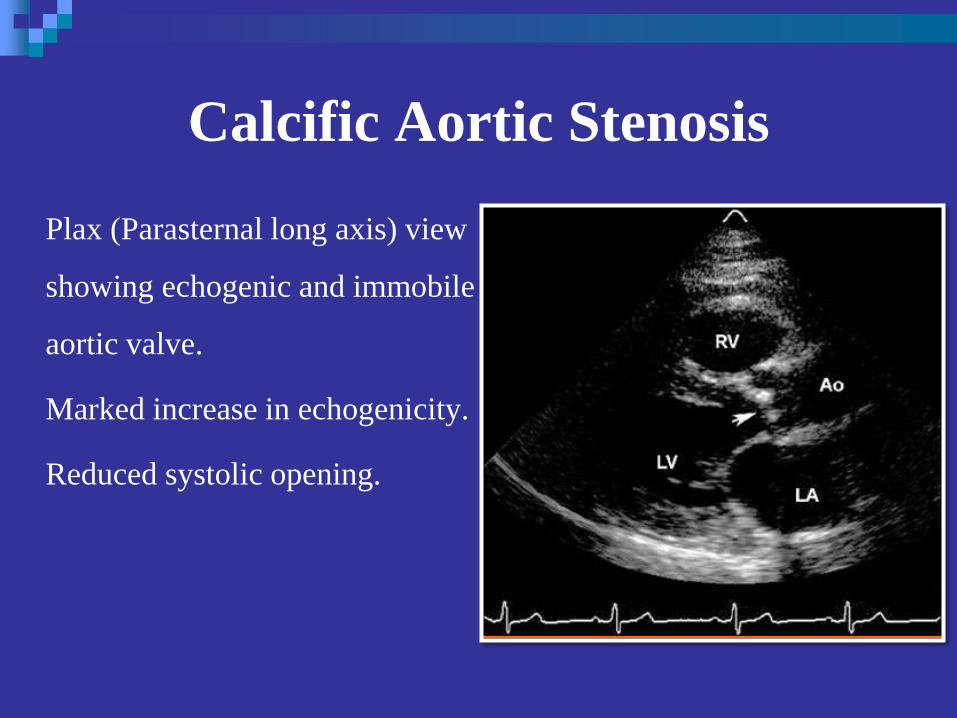
Calcific Aortic Stenosis
Plax (Parasternal long axis) view
showing echogenic and immobile
aortic valve.
Marked increase in echogenicity.
Reduced systolic opening.
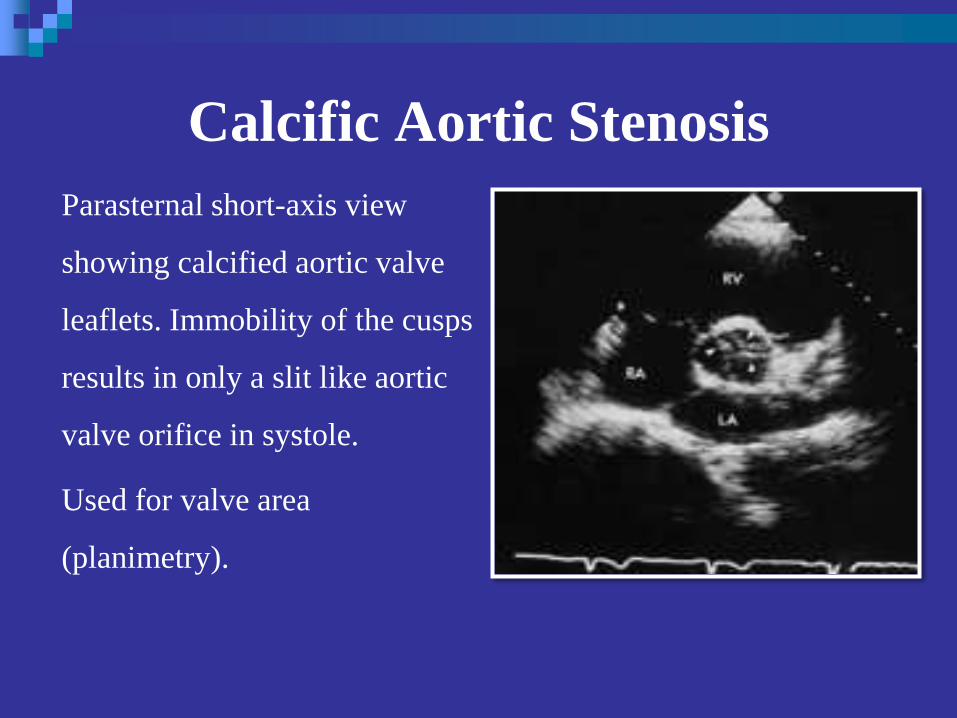
Calcific Aortic Stenosis
Parasternal short-axis view
showing calcified aortic valve
leaflets. Immobility of the cusps
results in only a slit like aortic
valve orifice in systole.
Used for valve area
(planimetry).

Calcific Aortic Stenosis
Calcification of a bicuspid or tricuspid valve, the severity can be graded semi-quantitatively as
0 1+ 2+ 3+ 4+Schaefer BM et al.Heart 2008;94:1634–1638.
The degree of valve calcification is a predictor of clinical outcome.Rosenhek R et al. N Engl J Med 2000;343:611–7.
Imp points.
Directly planimetered aortic valve areas should be interpreted with
caution because of the complex anatomy of the orifice and calcific
shadowing and reverberation, even with 3D imaging.
Direct measurement of valve area on imaging reflects anatomic valve
area, whereas the doppler data provide functional area.

Bicuspid Aortic valve

Bicuspid Aortic Valve (BAV)
Accounts for 2/3rd of cases of severe AS in adults < 70 yrs.
1/3rd of cases in adults > 70 yrs of age.
Severe AS of a BAV is difficult to be differentiated from that of
tricuspid one.
Usual view for differentiation is PARASTERNAL SHORT AXIS
VIEW at the level of great vessels in systole.
PARASTERNAL Long axis view shows systolic bowing of the
leaflets into aorta – “Dome like”.
M MODE – Eccentric closure line (to be taken at the tips of bowed
leaflets).

Two cusps are seen in systole with only two commissures framing an
elliptical systolic orifice (the fish mouth appearance).
Diastolic images may mimic a tricuspid valve when a raphe is
present.
Bicuspid Aortic valve

Bicuspid Aortic valve
In children, valve may be stenotic
without extensive calcification.
In adults, stenosis typically is due
to calcific changes, which often
obscures the number of cusps,
making determination of bicuspid
vs. tricuspid valve difficult.

Eccentricity index

M mode of BAV


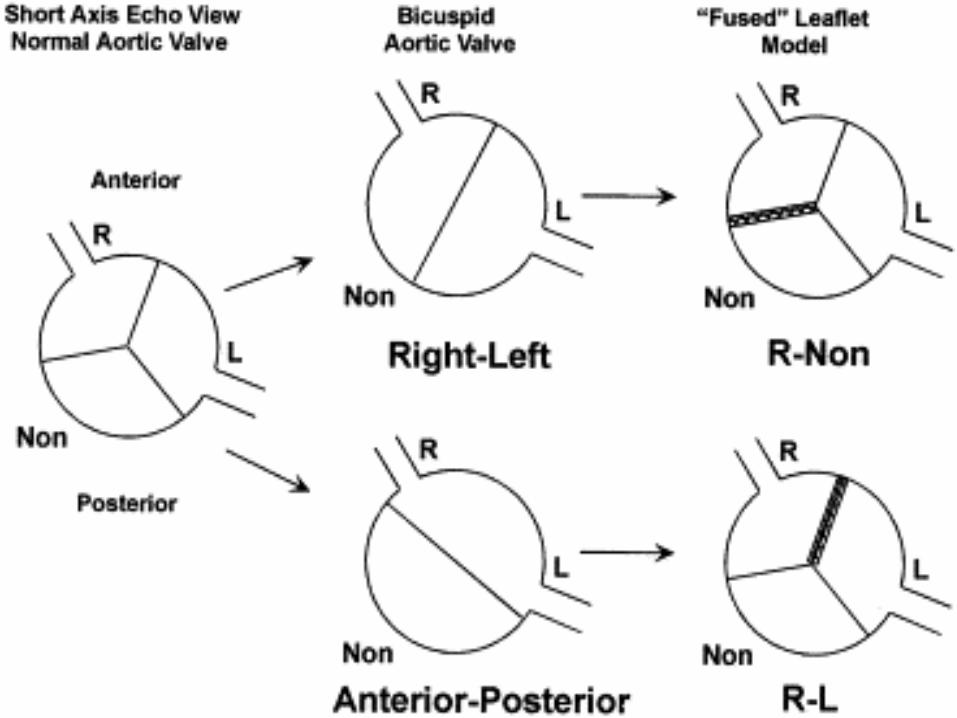
Types of BAV
FUSION OF CUSPS FREQUENCY LEAFLET
CLOSURE LINEREMARKS
RIGHT AND LEFT 70 -80% Anterolateral –
posteromedial closure
line
Larger anterior
leaflet.
RIGHT AND
NONCORONARY
20-30% Anterior –posterior
closure line
Larger
rightward leaflet
LEFT AND
NONCORONARY
1-2% Medial – lateral closure
line
Many bicuspid aortic valves have a raphe in the larger leaflet.
Clear identification of number of leaflets is possible only in systole.
Schaefer et al ,Am J Cardiol 99(5);686-90.2007


Assosciated conditions
Dilated aortic root
Coarctation of aorta


Unicuspid aortic valve
Single eccentric orifice
Prominent systolic doming.
Acommisural
unicommisural


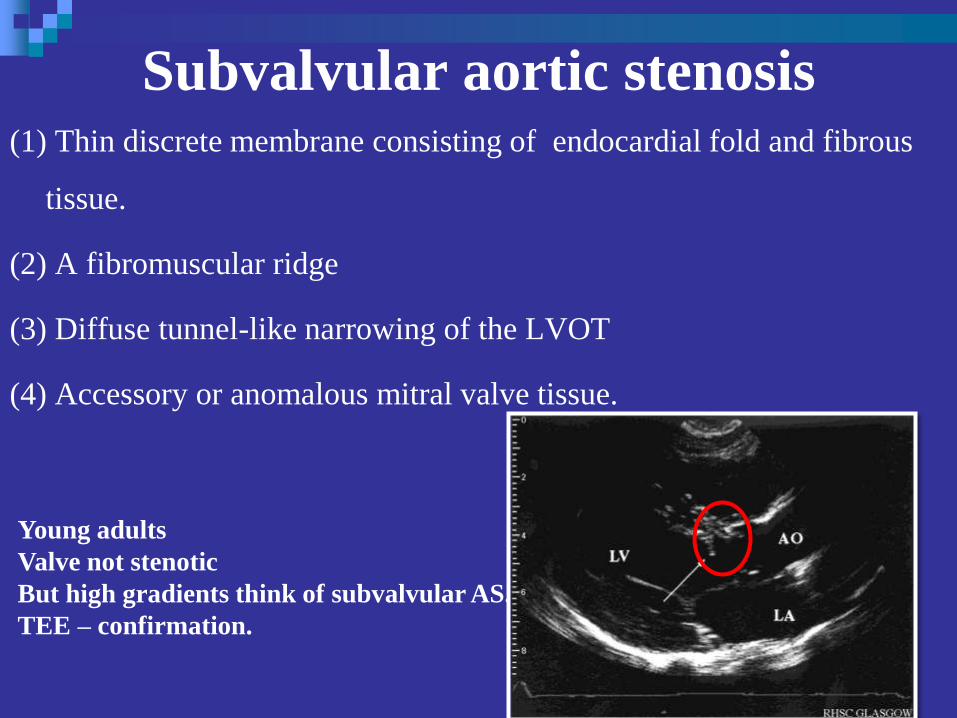
Subvalvular aortic stenosis(1) Thin discrete membrane consisting of endocardial fold and fibrous
tissue.
(2) A fibromuscular ridge
(3) Diffuse tunnel-like narrowing of the LVOT
(4) Accessory or anomalous mitral valve tissue.
Young adults
Valve not stenotic
But high gradients think of subvalvular AS.
TEE – confirmation.

Supravalvular Aortic stenosis
Type I - Thick, fibrous ring above the aortic valve with less
mobility and has the easily identifiable 'hourglass' appearance
of the aorta.

Type II - Thin, discrete fibrous membrane
located above the aortic valve
The membrane usually mobile and may demonstrate doming during
systole.
Type III - Diffuse narrowing
Supravalvular Aortic stenosis

The spatial orientation of the jet and the shape of the CW
doppler velocity curve are similar for fixed obstructions
whether subvalvular,supravalvular,or valvular.
Pulsed doppler,color flow imaging allows localization of the
level of obstruction.
PW – site of increase in flow velocity
COLOR FLOW – Post Stenotic Flow Disturbance.
In patients with both subvalvular and valvular
obstruction,
high pulse repetition frequency doppler ultrasound
will be helpful in defining the maximum velocities
at each site of obstruction.

Rheumatic Aortic StenosisCharacterized by
Commissural fusion
Triangular systolic orifice
Thickening & calcification
Accompanied by rheumatic mitral valve changes.
30% of patients with MS,aortic valve is also affected in
RHD.

Parasternal short axis view showing commissural fusion, leaflet
thickening and calcification, small triangular systolic orifice
Rheumatic aortic stenosis

Differentiation of
Rheumatic vs Calcified AS
RHEUMATIC AS CALCIFIC AS
COMMISSURES FUSED FREE
LEAFLETS TIPS TO BASE BASE TO TIPS
ORIFICE TRIANGULAR STELLATE SHAPED
AGE OF PATIENT NO PARTICULAR USUALLY ELDERLY
MITRAL VALVE 30% OF MS CASES MAC +
OTHERS TIPS THICKENED,
CALCIFIED (INEXTREME)
TIPS ARE FREE (CALCIFIC
NODULES CAN BE
PRESENT not at TIPS)


How to Assess Aortic Stenosis

Aortic stenosis
Valvular AS is most common.
Goals of echocardiographic evaluation of this condition
Establishing a diagnosis.
Defining the cause. level of obstruction
Quantifying the severity.
Evaluation of coexisting valvular lesions
Assessing LV function.
In patients with known AS, for routine annual evaluation of
asymptomatic severe AS, reevaluation in case of change in clinical
status.
It is not recommended to annually reevaluate asymptomatic mild AS,
unless there is change in clinical status.

Reduced LV function - alters the relationship between transvalvular
pressure gradient and aortic valve area, complicating the quantitative
determination of severity.
Also need to be assessed are
Proximal aortic dilation.
Coexisting mitral valve disease
Measurement of PAP.


M Mode- Normal aortic valve

Maximal aortic cusp separation (MACS)
Vertical distance between right CC and non CC during systole
M Mode- Aortic Stenosis
Aortic valve area MACS Measurement Predictive value
Normal AVA >2Cm2 Normal MACS >15mm 100%
AVA>1.0 > 12mm 96%
AVA< 0.75 < 8mm 97%
Gray area 8-12 mm …..
DeMaria A N et al. Circulation.Suppl II. 58:232,1978

M Mode- Aortic Stenosis

Limitations
Single dimension
Asymmetrical AV involvement
Calcification / thickness
↓ LV systolic function
↓ CO status
M Mode- Aortic Stenosis

M mode of Aortic valve in
LV dysfunction

M mode of AS with AR

HOCM

Sub aortic membrane

BAV
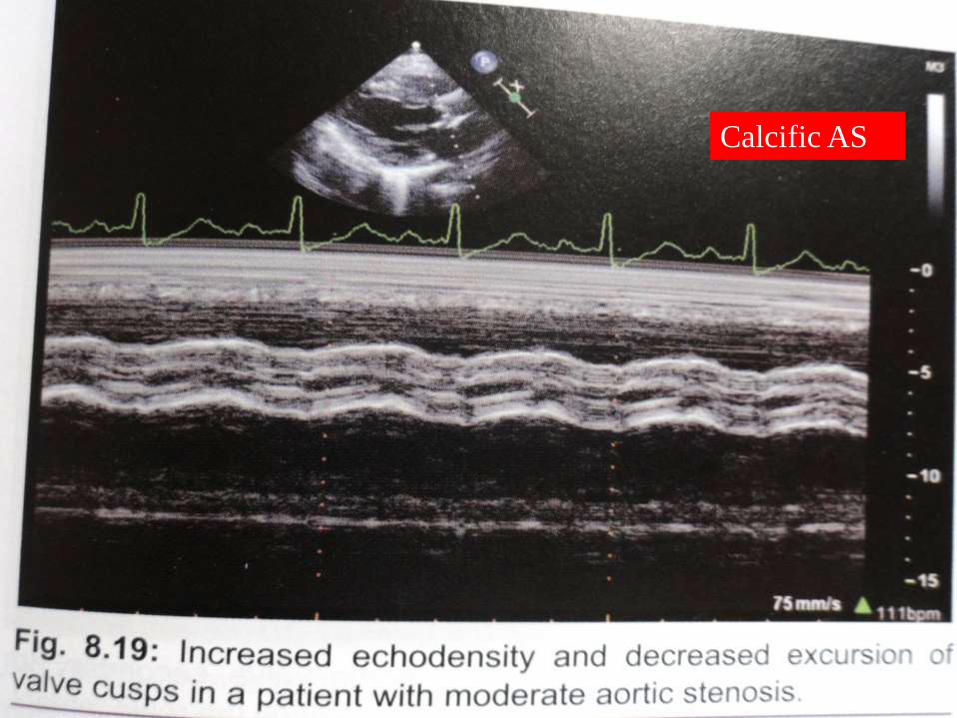
Calcific AS

Qualitative information of stenosis
by 2D echo
Thickened calcified cusps that display preserved mobility define
aortic sclerosis (peak doppler velocity of 2.5 m/sec).
Heavily calcified cusps with little or no mobility suggest severe aortic
stenosis.
If one cusp is seen to move normally, critical aortic stenosis has
been excluded.
Can lead to overestimation of severity.
To be combined with doppler assessment.

Doppler assessment
Pratical noninvasive method for determining the pressure gradient
across the stenotic aortic valve.
Maximal jet velocity through the stenotic valve.
Simplified Bernoulli equation – peak instantaneous gradient (validated
both in invitro and clinically).
Correlates well with simultaneous measurements obtained by
invasive means.
Maximal jet velocity through the stenotic orifice to be recorded for an
accurate assessment, irrespective of the view taken.

“ Aortic jet velocity alone is the strongest predictor of clinical
outcome,the most reliable and reproducible measure for
serial follow up studies and a key element in decision
making about the time of valve replacement.”
Higher signal to noise ratio - CW doppler
As blood accelerates through the valve, peak velocity coinicides
temporally with maximal pressure gradient.
Peak velocity usually occurs in mid systole.
As AS worsens, velocity tends to peak later in systole and the shape
becomes more rounded and less peaked.
Late peaking jets are also characteristic of dynamic sub aortic
obstruction as in HOCM.

Apical five chamber view, suprasternal view, right parasternal view to
be used for assessment.
Rarely subcostal view, left parasternal window.
Align the doppler beam with the direction of flow of the stenotic jet.
Failure to do this – underestimation of severity.
Color doppler may be used to improve alignment.
Highest jet velocity obtained should be used for calculation of
gradient.

Intercept angle
Parallel intercept angle between direction of the jet and the ultrasound
beam.
Cosine = 1
Intercept angles within 15 of parallel – will result in an error in
velocity of 5% or less
Intercept angle of 30 - error of 30%
This will result in even larger error in calculated pressure gradient.

Other high velocity systolic jets that may
be mistaken for aortic stenosis
Subaortic obstruction(fixed or dynamic)
Mitral regurgitation
Tricuspid regurgitation
Ventricular septal defect
Pulmonic or branch pulmonary artery stenosis
Subclavian artery stenosis

Maximal gradient is derived from the equation.(simplified
bernoulli equation)
P(in mmHg) = 4v²
v = maximal jet velocity expressed in meters per
second.
Distal velocity is sufficiently greater than the proximal
velocity that the latter can be ignored.

In cases where the proximal velocity is greater than 1.5m/sec and
the distal velocity is modestly elevated(<3.5m/sec),the proximal
velocity cannot be ignored,then
P(in mmHg) = 4(Vmax² - Vproximal²)
Severe AR
Combined valvular and subvalvular stenosis

Mean Pressure Gradient
1.45=
P mean(in mmHg)
It is most often obtained by planimetry of the doppler envelope,which
allows the computer to integrate the instantaneous velocity data and
provide a mean value.
Mean gradient cannot be obtained by squaring the mean velocity.
Mean gradient is linearly related to the maximal gradient, can be
estimated from the formula:
P max +2 mm Hg
Mean gradient is approx. 2/3 rd s of the peak instantaneous gradient.
Both mean and peak gradients to be reported .

Accuracy of Bernoulli equation
Well established in quantification of stenosis pressure gradients.
Doppler gradients tend to be slightly higher than the
corresponding values obtained in the catheterization
laboratory.the difference is due to phenomenon of pressure
recovery,not due to inaccuracy of either technique.
The conversion of potential energy to kinetic energy across a
narrowed valve results in a high velocity and a drop in pressure.
Distal to the orifice, flow decelerates again. Kinetic energy will be
reconverted into potential energy with a corresponding increase in
pressure, the so-called PR.
Pressure recovery

Pressure recovery
In the setting of native aortic valve stenosis, some recovery of
pressure downstream from the vena contracta can be expected.
This occurs as the jet expands and decelerates downstream from the
vena contracta resulting in a lower net pressure gradient compared to
peak pressure gradient.
The net gradient is measured in the catheterization laboratory,
typically as the pressure difference between LV and ascending aorta.
Peak pressure gradient is derived from CW doppler by measuring
the highest velocity within the vena contracta at the level of the
orifice.
In most cases, pressure recovery has a negligible effect on the
accuracy of gradient calculation.

Pressure recovery is greatest in stenosis with gradual distal widening
Aortic stenosis with its abrupt widening from the small orifice to the
larger aorta has an unfavorable geometry for pressure recovery
PR= 4v²× 2EOA/AoA (1-EOA/AoA)
Pressure recovery


Pressure recovery
Pressure recovery is more significant
Small aortic root,ascending aorta(<3.0cm in diameter)*
Domed congenital aortic stenosis
Certain types of prosthetic valves.
Higher pressure gradient by doppler within the vena contracta.
Catheter –derived pressure will be obtained further
downstream,record a lower gradient.

Pressure recovery
Prosthetic valves
Tapered stenosis
Supravalvular AS
coarctation

Discrepancies ,think of ..
1.Technically poor doppler recording
2.Inability to align the interrogation angle parallel to flow also
results in underestimation.
low velocty jets <3m/sec, the error is modest .
Angle less than 20- insignificant degree of underestimation.
Intercept angle increases beyond 20,the magnitude of error
increases rapidly.
Measures velocity over time ,doppler derived data always represent
instantaneous gradient.
In catheterization laboratory,peak to peak gradient is reported which
is often less than the peak instantaneous gradient,they are contrived
and never exist in time..
Mean gradients to be used,correlate well between the catheterization
and echocardiographic data.
Valve gradients are dynamic measurements that vary with HR,loading
conditions,blood pressure and inotropic state.

Overestimation of the pressure
gradient
Mistaken identity of the recorded signal.
Mitral regurgitation jet has a contour similar to that of the jet of
severe aortic stenosis.because of similarities in location and
direction of the two jets,mistaken identity can occur.
Can be avoided by
1.two jets should be recorded by sweeping the transducer back
and forth to clearly indicate to the interpreter which jet is which.
2.timing of the two jets – MR jet is of longer duration,beginning
during isovolumic contraction and extending into isovolumic
relaxation.

Comparing pressure gradients calculated from
doppler velocities to pressures measured at cardiac catheterization.

Comparing pressure gradients calculated from
doppler velocities to pressures measured at cardiac
catheterization.
Currie PJ et al. Circulation 1985;71:1162-1169

Aortic valve area
Continuity equation

Continuity equation
Determination of aortic valve area.
Based on the principle of conservation of mass,the continuity
equation states that the stroke volume proximal to the aortic
valve (within the left ventricular outflow tract) must equal the
stroke volume through he stenotic orifice.
Stroke volume is the product of cross sectional area (CSA)
and time velocity integral (TVI),the continuity equation can be
arranged to yield.
AV area = CSA LVOT TVI LVOT / TVI AS
CSA To measure the CSA of the outflow tract,the diameter of the outflow
tract is generally measured from the parasternal long axis view and the
shape is assumed to be circular.
Area = r²
Small errors in measuring in measuring the linear dimension will be
compounded in the final formula.
The smaller the annulus,the greater is the percentage error introduced
by any given mismeasurement.
Potential factors for errors – image quality,annular calcification(which
obscures the true dimension),non circular annulus(which invalidates
the formula).
Underestimation is more common than overestimation.

TVI of outflow tract/AS
From the apical window
Pulsed doppler imaging
Positioning the sample volume just proximal to the stenotic valve.
(still laminar)
From same transducer position CW doppler imaging should be used
to record the jet velocity envelope.
Using planimetry,the TVI of both can be derived.
If units for the measurement of the outflow tract diameter are
centimeters,the value of the aortic valve area will be centimeters
squared.


AV area = CSA LVOT V LVOT/V AS

Continuity equation has been validated in a variety of invitro and
clinical settings.
Correlates well with the invasive data using the gorlin equation.
Errors – area and flow assessment to be done at the same level.
The point at which flow is laminar in apical view to be taken for the
measurement of TVI of LVOT.

Advantages of continuity equation
Not influenced by the presence of Aortic regurgitation.
Not affected by the stroke volume
“..a determination of aortic valve area is especially
important in patients with significant aortic regurgitation
and/or reduced left ventricular function.”

Limitations of continuity-equation
valve area
Intra- and interobserver variability
AS jet and LVOT velocity 3 to4%.
LVOT diameter 5% to 8%.
When sub aortic flow velocities are abnormal SV calculation at this
site are not accurate
Sample volume placement near to septum or anterior mitral leaflet
Observed changes in valve area with changes in flow rate
AS and normal LV function, the effects of flow rate are minimal
This effect may be significant in presence concurrent LV dysfunction.
Limitations of continuity-equation valve
area

Interplay between velocity, stroke
volume and aortic valve area
Left ventricular systolic dysfunction
Low-flow low-gradient AS includes the following conditions:
Effective orifice area < 1.0 Cm2
LV ejection fraction < 40%
Mean pressure gradient < 30–40 mmHg
Severe AS and severely reduced LVEF represent 5% of AS patients
Vahanian A et al. Eur Heart J 2007;28:230–68.

Approaches to quantify stenosis

Another approach to reducing error related to LVOT diameter measurements is removing CSA from the simplified continuity equation.
This dimensionless velocity ratio expresses the size of the valvular effective area as a proportion of the CSA of the LVOT.
Velocity ratio= VLVOT/VAV
In the absence of valve stenosis, the velocity ratio approaches 1, with smaller numbers indicating more severe stenosis.
Velocity Ratio/ Dimensionless index

Aortic valve resistance
flow independent measure of stenosis severity that depends on
the ratio of mean pressure gradient and mean flow rate and is
calculated as
Resistance = P mean / Q mean 1333
Relation between the mean resistance and valve area is given by
the formula:
Resistance = 28 Gradient mean / AV area
Advantages over the continuity equation ,have not been
established.

Stroke Work Loss
Novel approach to calculate severity of aortic stenosis
100 P mean
Left ventricle expends work during systole to keep the aortic
valve open and to eject blood into the aorta.it is less dependent
on the flow compared with other parameters.
A cut off value more than 25% effectively discriminated
between patient experiencing a good and poor outcome.
Calculation of SWL has limited practical application.
P mean +SBP SWL (%) =
Energy loss indexDamien Garcia.et al. Circulation. 2000;101:765-771.
Fluid energy loss across stenotic aortic valves is influenced by
factors other than the valve effective orifice area .
An experimental model was designed to measure EOA and
energy loss in 2 fixed stenoses and 7 bioprosthetic valves for
different flow rates and 2 different aortic sizes (25 and 38 mm).
EOA and energy loss is influenced by both flow rate and AA
and that the energy loss is systematically higher (15±2%) in the
large aorta.
Damien Garcia.et al. Circulation. 2000;101:765-771.

Energy loss coefficient (EOA × AA)/(AA - EOA) accurately
predicted the energy loss in all situations .
closely related to the increase in left ventricular workload than EOA.
To account for varying flow rates, the coefficient was indexed for
body surface area in a retrospective study of 138 patients with
moderate or severe aortic stenosis.
The energy loss index measured by Doppler echocardiography was
superior to the EOA in predicting the end points
An energy loss index >0.52 cm2/m2 was the best predictor of
diverse outcomes (positive predictive value of 67%).
Energy loss indexDamien Garcia.et al. Circulation. 2000;101:765-771.
Aortic valve area -Planimetry
Planimetry may be an acceptable alternative when
Doppler estimation of flow velocities is unreliable
Planimetry may be inaccurate when valve calcification
causes shadows or reverberations limiting identification
of the orifice
Doppler-derived mean-valve area correlated better with
maximal anatomic area than with mean-anatomic area.Marie Arsenault, et al. J. Am. Coll. Cardiol. 1998;32;1931-1937

Aortic valve area - Planimetry

Defining the severity of Aortic stenosis
Normal adults , aortic valve area is between 3.0 and 4.0 cm².
Clinically significant aortic stenosis generally requires the valve area
to be reduced to less than one fourth of normal or between 0.75 and
1.0 cm2.
Relationship between valve area and severity is further influenced by
patient size – aortic valve area of 0.9cm² may be severe in a large
patient but only moderate in a smaller person.
Inconsistent relationship between valve area and symptoms.

ACC/AHA guidelines2014


IIa B
IIa C

Effects of concurrent conditions
on assessment of severity

Left ventricular systolic dysfunction
Left ventricular hypertrophy
Small ventricular cavity & small LV ejects a small SV so that,
even in severe AS the AS velocity and mean gradient may be
lower than expected.
Continuity-equation valve area is accurate in this situation

Hypertension
35–45% of patients
primarily affect flow and gradients but less AVA measurements
Control of blood pressure is recommended
The echocardiographic report should always include a blood
pressure measurement

Aortic regurgitation
About 80% of adults with AS also have aortic regurgitation
High transaortic volume flow rate, maximum velocity, and
mean gradient will be higher than expected for a given valve
area
In this situation, reporting accurate quantitative data for the
severity of both stenosis and regurgitation
Effect of concurrent conditions contd…

Mitral valve disease
With severe MR, transaortic flow rate may be low resulting in a
low gradient .Valve area calculations remain accurate in this
setting
A high-velocity MR jet may be mistaken for the AS jet. Timing
of the signal is the most reliable way to distinguish
Effect of concurrent conditions contd…

High cardiac output
Relatively high gradients in the presence of mild or moderate AS
The shape of the CWD spectrum with a very early peak may help to
quantify the severity correctly
Ascending aorta
Aortic root dilation
Coarctation of aorta
Effect of concurrent conditions contd…
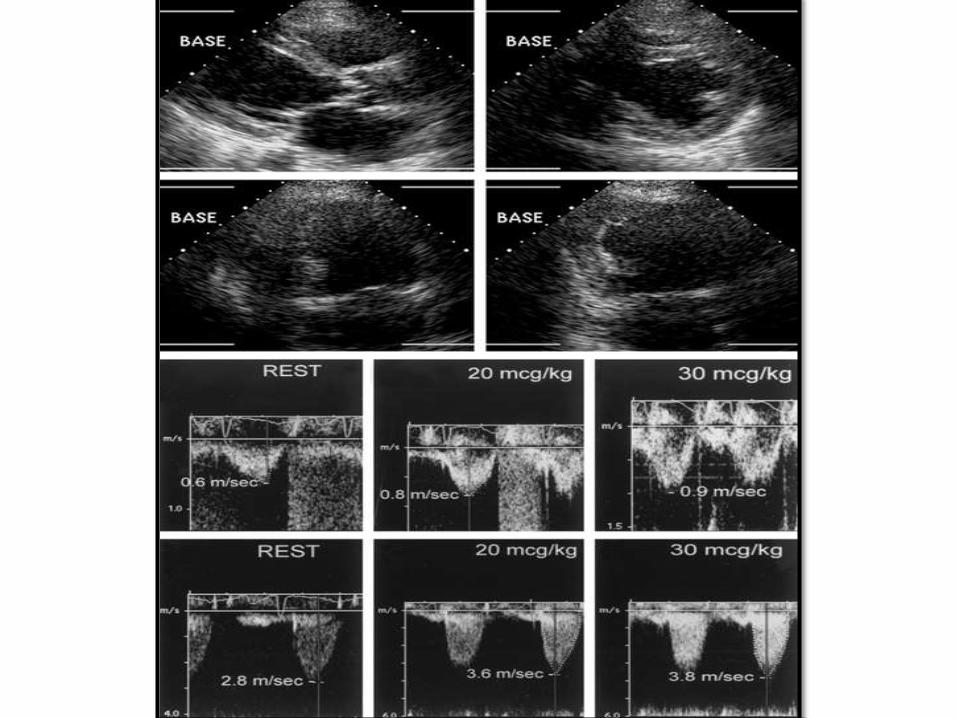
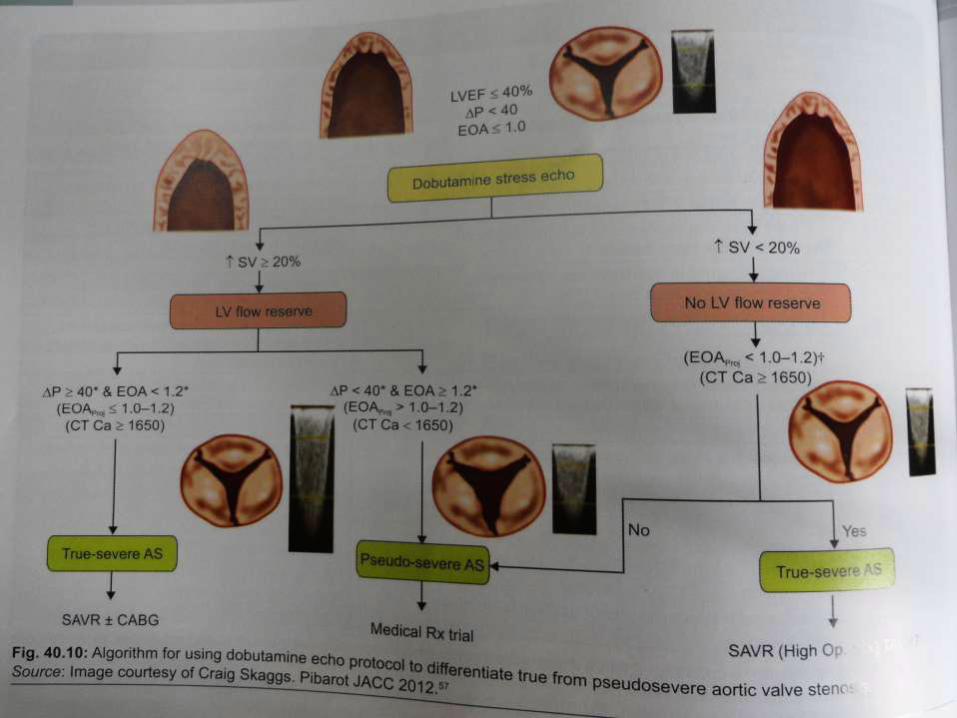
Provides information on the changes in aortic velocity, mean
gradient, and valve area as flow rate increases.
Measure of the contractile response to dobutamine
Helpful to differentiate two clinical situations
Severe AS causing LV systolic dysfunction
Moderate AS with another cause of LV dysfunction
Stepwise infusion of dobutamine from 5 to 20 g/kg/min( in an
effort to increase the stroke volume).
Dobutamine stress Echo

An increase in valve area during infusion to > 1.0cm2 is
consistent with mild to moderate stenosis..
True aortic stenosis is assosciated with a fixed valve area that
will not change with dobutamine infusion.
Dobutamine infusion will increase the maximal velocity of both
the outflow tract and jet proportionally. ratio of peak velocity in
the outflow tract and of the jet will remain the same.
In milder forms of stenosis,the increase in the outflow tract will
be much greater than that of the jet (due to increase in valve
area).ratio of outflow tract to jet velocity will increase compared
to the baseline.

Another possible response to dobutamine is a failure of the left
ventricle to augment,in which case neither the gradient not the
valve area changes significantly.
This response is assosciated with a poor overall prognosis and
raises the possibility of concurrent CAD.

A low dose starting at 2.5 or 5 ủg/kg/min with an incremental
increase in the infusion every 3–5 min to a maximum dose of
10–20 ủg/kg/min
The infusion should be stopped as soon as
Positive result is obtained
Heart rate begins to rise more than 10–20 bpm over
baseline or exceeds 100bpm
Dobutamine stress Echo

Role in decision-making in adults with AS is
controversial and the findings recommend as reliable
are
Stress findings of severe stenosis
AVA<1cm²
Jet velocity>4m/s
Mean gradient>40mm of Hg
Nishimura RA et al. Circulation 2002;106:809-13.
Lack of contractile reserve-
Failure of LVEF to ↑ by 20% is a poor prognostic sign
Monin JL et al. Circulation 2003;108:319-24..
Dobutamine stress Echo


TEE
Transducer facing anteriorly and horizontally (0) in mid
esophagus.
Pulling transducer up – ascending aorta,right pulmonary
artery.
120 - reverse parasternal long axis TTE view.
Transgastric level – transducer 180 - descending aorta.
Atheroma garding
Aortic aneurysm
Aortic dissection

3D ECHO
Strain imaging
Global longitudinal strain by speckle tracking may be a more robust
measure of systolic function in patients with severe aortic stenosis.
A longitudinal strain less than 15.9% significantly predicted those at
higher risk of death,symptoms or need for surgery during follow up,as
opposed to EF,which had no discriminatory ability.

During TAVI

After prosthetic valve implantation
Assessing the severity of stenosis
PPM
Pressure recovery
EOA in patients with pressure recovery.