ECG changes in experimental acute pulmonary hypertension with and without hypoxia
6
J. ELECTROCARDIOLOGY, 7 (2) 109-114, 1974 ECG Changes in Experimental Acute Pulmonary Hypertension With and Without Hypoxia* BY MASOOD AHMAD, M.D.,t C. GUNNAR BLOMQVIST, M.D.,** AND CHARLES B. MULLINS, M.D.S SUMMARY Recent clinical studies of pulmonary em- bolism indicate that typical ECG changes of acute right ventricular overload become evi- dent only with severe pulmonary hyper- tension. The present study was performed to determine whether less obvious yet consis- tent ECG changes are present during mild and moderate pulmonary hypertension and to what extent hypoxia modifies the ECG response. Three series of experiments were per- formed; each employed 6 dogs. The orthogo- nal ECG (McFee system) was recorded at 3 levels of pulmonary artery (PA) mean pres- sures: control, 20 and 40 mm tIg in closed- chest dogs with and without hypoxia. Mean arterial pO2 was 53 mm Hg in the hypoxic series. Pulmonary hypertension was induced by means of a PA balloon catheter. Right ventricular (RV) volumes were determined from biplane cineangiograms in a separate series. The ECG analysis was performed utilizing digital computer techniques. No significant ECG changes were pro- duced by a mean PA pressure of 20 mm Hg despite a 17% increase in RV end-diastolic volume above control values. At 40 mm Hg and a 45% increase in RV volume, dogs in the series without hypoxia showed a small but *From the Pauline and Adolph Weinberger Laboratory for Cardiopulmonary Research, Department of Internal Medicine, University of Texas Southwestern Medical School at Dallas, Dal- las, Texas. This study was supported by grants from the NHLI (HL 14187 and HL 06296) and from NASA (NGR-012-151). tFellow in cardiology supported by NHLI training Grant HL 05812. **Established Investigator of the American Heart Association and Associate Professor of Medicine and Physiology, UTSMS. STeaching Scholar, American Heart Association and Associate Professor of Medicine and Chief of Clinical Cardiology, UTSMS. Reprint requests to: Charles B. Mullins, M.D., Cardiopulmonary -- D-710, 5323 Harry Hines Boulevard, Dallas, Texas 75235. significant posterior shift of the initial QRS vector. Hypoxic dogs demonstrated direc- tionally similar but more prominent changes with significant posterior displacement of both early and late QRS vectors and posterior-superior ST displacement. Thus, this study confirmed clinical data suggesting that the ECG is an insensitive indicator of acute RV pressure overload. ECG changes present at high PA pressures were accentuated by hypoxia. Recent clinical studies suggest that the ECG changes of acute right ventricular over- load become evident only with severe pulmo- nary hypertension. 1-3 However, a high over- all incidence of ECG abnormalities in a series of patients with acute pulmonary hyper- tension has also been reported. 4 The ECG correlation with pulmonary embolism encompasses a wide variation in pulmonary hypertension and hypoxia. Controlled com- bined electrocardiographic and hemodynamic studies have been performed only on open- chest dogs and/or with extreme degrees of pulmonary hypertension and hypoxia. The present study, based on exact computer analysis of the orthogonal ECG in closed- chest dogs during controlled progressive pulmonary hypertension, was undertaken to investigate whether mild to moderate acute pulmonary hypertension is associated with subtle but still consistent ECG changes, and to what extent any ECG changes during acute pulmonary hypertension are modified or ac- centuated by hypoxia. Angiographic right ventricular volumes in a series of dogs using an identical experimental protocol were correlated with the ECG changes induced at each level of pulmonary hypertension in order to determine the influence of right ventri- cular volume changes on the ECG. 109 MATERIALS AND METHODS Three series of experiments were performed. In the first series, the effects of pulmonary hyper- tension alone were studied. Six mongrel dogs weighing between 18 and 22 kg were anesthetized using a combination of morphine and sodium pentothal in doses of 3 mg/kg and 15 mg/kg, respectively. The McFee 5 lead system was used for
-
Upload
masood-ahmad -
Category
Documents
-
view
213 -
download
1
Transcript of ECG changes in experimental acute pulmonary hypertension with and without hypoxia
J. ELECTROCARDIOLOGY, 7 (2) 109-114, 1974
ECG Changes in Experimental Acute Pulmonary Hypertension With and Without Hypoxia*
BY MASOOD AHMAD, M.D.,t C. GUNNAR BLOMQVIST, M.D.,** AND CHARLES B. MULLINS, M.D.S
SUMMARY Recent clinical studies of pulmonary em-
bolism indicate that typical ECG changes of acute right ventricular overload become evi- dent only with severe pulmonary hyper- tension. The present study was performed to determine whether less obvious yet consis- tent ECG changes are present during mild and moderate pulmonary hypertension and to what extent hypoxia modifies the ECG response.
Three series of experiments were per- formed; each employed 6 dogs. The orthogo- nal ECG (McFee system) was recorded at 3 levels of pulmonary artery (PA) mean pres- sures: control, 20 and 40 mm tIg in closed- chest dogs with and without hypoxia. Mean arterial pO2 was 53 mm Hg in the hypoxic series. Pulmonary hypertension was induced by means of a PA balloon catheter. Right ventricular (RV) volumes were determined from biplane cineangiograms in a separate series. The ECG analysis was performed utilizing digital computer techniques.
No significant ECG changes were pro- duced by a mean PA pressure of 20 mm Hg despite a 17% increase in RV end-diastolic volume above control values. At 40 mm Hg and a 45% increase in RV volume, dogs in the series without hypoxia showed a small but
*From the Pauline and Adolph Weinberger Laboratory for Cardiopulmonary Research, Department of Internal Medicine, University of Texas Southwestern Medical School at Dallas, Dal- las, Texas. This study was supported by grants from the NHLI (HL 14187 and HL 06296) and from NASA (NGR-012-151). tFellow in cardiology supported by NHLI training Grant HL 05812. **Established Investigator of the American Heart Association and Associate Professor of Medicine and Physiology, UTSMS. STeaching Scholar, American Heart Association and Associate Professor of Medicine and Chief of Clinical Cardiology, UTSMS. Reprint requests to: Charles B. Mullins, M.D., Cardiopulmonary - - D-710, 5323 Harry Hines Boulevard, Dallas, Texas 75235.
significant posterior shift of the initial QRS vector. Hypoxic dogs demonstrated direc- tionally similar but more prominent changes with significant posterior displacement of both early and late QRS vectors and posterior-superior ST displacement.
Thus, this study confirmed clinical data suggesting that the ECG is an insensitive indicator o f acute RV pressure overload. ECG changes present at high PA pressures were accentuated by hypoxia.
Recent clinical studies suggest that the ECG changes of acute r ight ventr icular over- load become evident only with severe pulmo- nary hypertension. 1-3 However, a high over- all incidence of ECG abnormali t ies in a series of patients with acute pulmonary hyper- tension has also been reported. 4 The ECG c o r r e l a t i o n wi th p u l m o n a r y e m b o l i s m encompasses a wide var ia t ion in pulmonary hypertension and hypoxia. Controlled com- bined electrocardiographic and hemodynamic studies have been performed only on open- chest dogs and/or with extreme degrees of pulmonary hypertension and hypoxia.
The present study, based on exact computer analysis of the orthogonal ECG in closed- chest dogs during controlled progressive pulmonary hypertension, was under taken to investigate whether mild to moderate acute pulmonary hypertension is associated with subtle but still consistent ECG changes, and to what extent any ECG changes during acute pulmonary hypertension are modified or ac- centuated by hypoxia. Angiographic r ight ventr icular volumes in a series of dogs using an identical exper imenta l protocol were correlated with the ECG changes induced at each level of pulmonary hypertension in order to determine the influence of right ventri- cular volume changes on the ECG.
109
MATERIALS AND METHODS Three series of experiments were performed. In
the first series, the effects of pulmonary hyper- tension alone were studied. Six mongrel dogs weighing between 18 and 22 kg were anesthetized using a combination of morphine and sodium pentothal in doses of 3 mg/kg and 15 mg/kg, respectively. The McFee 5 lead system was used for
110 AHMAD ET AL
obtaining the ECG recordings. The McFee system was selected in preference to the more commonly used Frank system since only the McFee system has been specifically adapted for use in dogs. The areas for electrode at tachment were shaved and cleaned with acetone. Intubation was performed and ventilation was controlled by using a Harvard respirator. Each dog was positioned supine on the table. Cutdowns were performed in the right and left femoral areas, using r ight and left femoral ar- teries and veins for catheter placement.
A triple-lumen (8F Dotter Lukas) distensible balloon-tipped catheter was advanced via the femoral vein through the right-sided chambers into the pulmonary outflow tract under biplane fluoroscopic guidance. In a similar fashion cathe- ters were positioned in the ascending aorta (8F Cournand) and right ventricle (8F Gensini). All pressures were measured with Statham P23Db transducers and recorded along with orthogonal ECG leads X, Y, and Z, both on multichannel photographic recorder (Electronics for Medicine DR-8) and magnetic tape for subsequent analysis.
The dogs were respired with 100% oxygen, and a control ar ter ial blood gas analysis and a control ECG recording were obtained at the baseline pulmonary artery pressure. Mean pulmonary ar- tery pressure was then raised to 20 mm Hg and maintained for 30 min by saline inflation of the balloon in the main pulmonary artery.
Recordings were made at the end of the 30-minute period of pulmonary hypertension. In a similar fashion, mean pulmonary artery pressure was raised to 40 mm Hg and recordings were again obtained after 30 min of stabilization.
Blood gas analyses were performed at each level of pulmonary artery pressure and acid-base bal- ance was regulated by varying the respiratory rate
and depth and by use of intravenous sodium bicar- bonate.
In the second series of experiments, 6 closed- chest mongrel dogs were studied in a similar fash- ion. However, after obtaining the control recording with baseline normal blood gases, hypoxia was in- duced by respiring the dog on a 13% oxygen mix- ture with nitrogen balance. A mean arter ial pO2 of 53 .2- + 1.0 mm Hg was achieved by this technique. Recordings were obtained at 20 and 40 mm Hg of mean pulmonary ar tery pressures after 30 min of stabilization at each level.
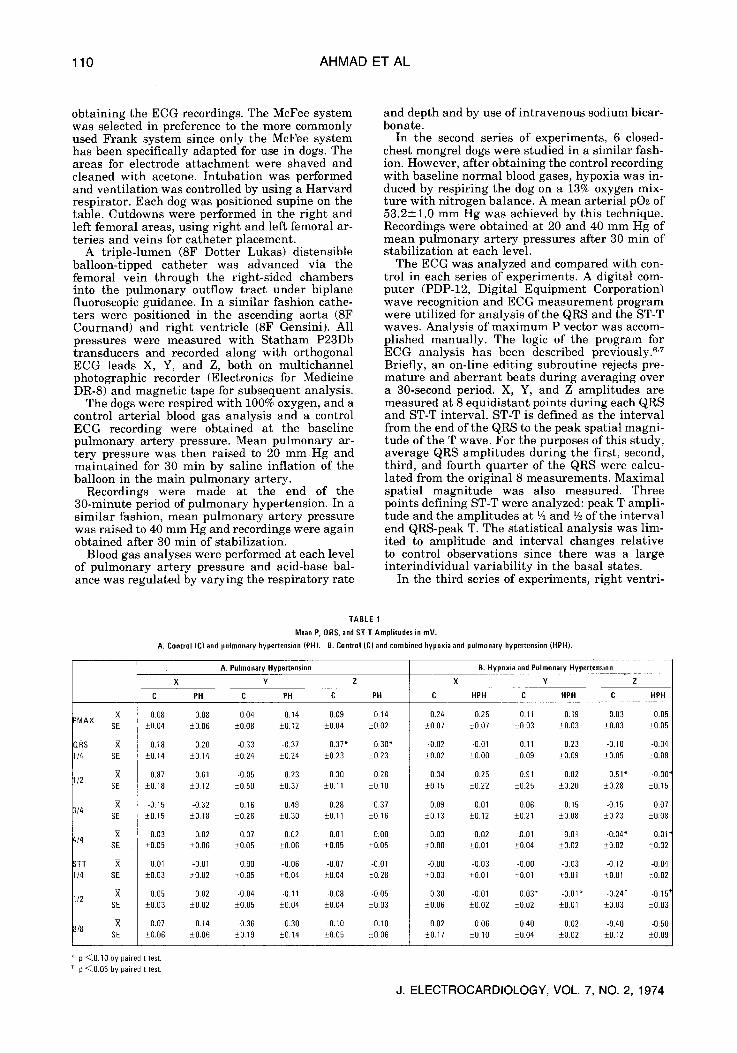
The ECG was analyzed and compared with con- trol in each series of experiments. A digital com- puter (PDP-12, Digital Equipment Corporation) wave recognition and ECG measurement program were utilized for analysis of the QRS and the ST-T waves. Analysis of maximum P vector was accom- plished manually. The logic of the program for ECG analysis has been described previously, s'7 Briefly, an on-line editing subroutine rejects pre- mature and aberrant beats during averaging over a 30-second period. X, Y, and Z amplitudes are measured at 8 equidistant points during each QRS and ST-T interval. ST-T is defined as the interval from the end of the QRS to the peak spatial magni- tude of the T wave. For the purposes of this study, average QRS amplitudes during the first, second, third, and fourth quarter of the QRS were calcu- lated from the original 8 measurements. Maximal spatial magnitude was also measured. Three points defining ST-T were analyzed: peak T ampli- tude and the amplitudes at t4 and V2 of the interval end QRS-peak T. The statistical analysis was lim- ited to amplitude and interval changes relative to control observations since there was a large interindividual var iabi l i ty in the basal states.
In the third series of experiments, r ight ventri-
TABLE 1
Mean P, QRS, and ST-T Amplitudes in mV.
A. Control (C) and pulmonary hypertension (PH). B. Control (C) and combined hypoxia and pulmonary hypertension (HPH).
X =MAX
SE
DRS I/4 SE
I/2 SE
X 3/4
SE
;/4 SE
3TT I/4 SE
1/2 SE
X 3/8
SE
A. Pulmonary Hypertension B. Hypoxia and Pulmonary Hypertension
X Y Z X Y Z
C PH C PH C PH
0.08 0.08 0.04 0.14 0.09 0.14 _+0.04 _+0.06 • +0.12 +0.04 4_-0.02
0.18 0.20 -0.33 -0.37 -0.37* -0.30* +0.14 +0.14 +0.24 +0.24 _+0.23 +0.23
0.87 0.61 -0.05 0.23 0.30 0.28 +0.18 +0.12 _+0.50 • +0.11 +0.10
-0.15 -0.32 0.16 0.49 0.28 0.37 +0.15 +0.18 • _+0.30 +0.11 +0.16
0.03 -0.02 0.07 -0.02 -021 0.00 +0.05 • • _+0.06 -+&05 •
0.01 -0.01 0.00 -0.06 -0.07 -0.01 +0.03 -+0.02 _+0.05 +0.04 • _+0.28
0.05 0.02 -0.04 -0.11 -0.08 -0,05 • • +0.05 +0.04 +0.04 +0.03
0.07 0.14 -0.36 -0.30 -0.10 -0.10 +0.06 _+0.06 • • +0.05 _+0.06
C HPH C HPH C HPH
0.24 0.25 0.11 0.19 -0.03 -0.05 +_0.07 • +0.03 +0.03 +0.03 +0.05
-0.02 -0.01 0.11 0.23 -0.10 -0.04 +0.02 +0.00 +0.09 +0.09 +0.05 •
0.34 0.25 0.91 0.82 -0.51" -0.00" +0.15 +0.22 +0.25 +0.20 • _+0.15
0.09 0.01 0.06 0.15 -0.15 0.07 +0.13 +0.12 +0,21 -+0.08 i0.23 _+0.08
-0.03 -0.02 -0.01 -0.01 -&04" 0.01 * _+0.00 • • +0.02 +0.02 _+0.02
-0.00 -0.03 -020 -0.03 -0.12 -0.04 +0.03 +0.01 +0.01 -+021 • •
0.30 -0.01 0.03* -0.01" -0.24 t -0.15 ~ +0.06 +0.02 +0.02 +0.01 +0.03 +0.03
0.02 0.06 &40 0.02 -0.40 -0.50 +0.17 • +0.04 +0.02 _+0.12 _+0.09
p <0.10 by paired t test. p <0.05 by paired t test.
J. ELECTROCARDIOLOGY, VOL. 7, NO. 2, 1974
ECG IN ACUTE PULMONARY HYPERTENSION 111
X
mV 1 . 0 0
0.80
0.60
0.40
0.20
0
0.20
P U L M O N A R Y HYPERTENSION (PH)
#%
HYPOXIA -4- PULMONARY HYPERTENSION (HPH)
�9 "-'-" CONTROL . . . . . . A PA 40
al , . . . . . . . , . . .
I-
Y
i .00
0.80
0.60
0.40 / \ & �9
0.20 , , ] ,,
I '\ i i ' . . . . . . . . . . . . . ~.k. 0.20 k % , ' 7 \.,,.. / "%' "<" 0 . 4 0 ~- ~
0 .40
0.20
Z 0
0.20
0.40
0.60
, ! \ %1 ) @~.@A ""~A J
\ f ""-:::,,,,
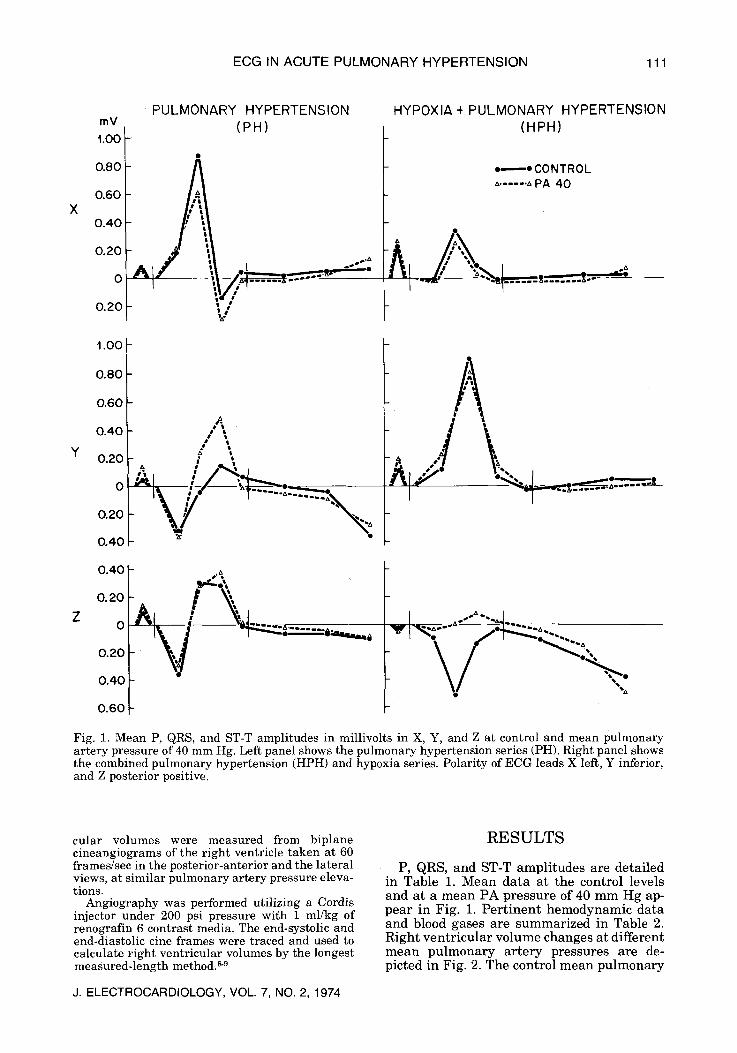
V %: Fig. 1. Mean P, QRS, and ST-T amplitudes in millivolts in X, Y, and Z at control and mean pulmonary artery pressure of 40 mm Hg. Left panel shows the pulmonary hypertension series (PH). Right panel shows the combined pulmonary hypertension (HPH) and hypoxia series. Polarity of ECG leads X left, Y inferior, and Z posterior positive.
cular volumes were measured from biplane cineangiograms of the right ventricle taken at 60 frames/sec in the posterior-anterior and the lateral views, at similar pulmonary artery pressure eleva- tions.
Angiography was performed utilizing a Cordis injector under 200 psi pressure with 1 ml/kg of renografin 6 contrast media. The end-systolic and end-diastolic cine frames were traced and used to calculate right ventricular volumes by the longest measured-length method, s'9
J. ELECTROCARDIOLOGY, VOL. 7, NO. 2, 1974
RESULTS
P, QRS, and ST-T a m p l i t u d e s are de ta i led in Tab le 1. M e a n d a t a a t the control levels and a t a m e a n PA p r e s s u r e of 40 m m H g ap- p e a r in Fig. 1. P e r t i n e n t h e m o d y n a m i c da t a and blood gases a re s u m m a r i z e d in Table 2. R igh t v e n t r i c u l a r v o l u m e changes a t d i f ferent m e a n p u l m o n a r y a r t e r y p ressu res are de- picted in Fig. 2. The control m e a n p u l m o n a r y
112 AHMAD ET AL
TABLE 2
Hemodynamic data, arter a pl-I, and arterial p02 during induced pulmonary hypertension with and without hypoxia. Mean values +standard error of the mean. N = 6.
Right Ventricular Mean Pulmonary End-Diastolic Mean Aortic Cardiac Pa 02 Artery Pressure Pressure Pressure Output Heart Rate
Condition (mm Hg) (mm Hg) (mm Hg) (L/min) (beats/min) pH a (mm Rg)
Control 9.0 • 0.3 2.s + {3.2 90.0 + 2.2 2.0 _+ 0.0 120.0 + 16.6 7.40 110.0 _+ 5.8
Pulmonary Hypertension 40.0 6.3 _+ 0.1 82.0 + 3.2 1.7 + 0.2 106.2 + 6.9 7.37 103.7 _+ 2.3
Control 8.7 _+ 0.4 2.1 + 0.0 87.3 i 2.0 2.2 +_ 0.1 87.2 _+ 5.0 7.43 93.8 + 2.5
Hvpoxia and Pulmonary Hypertension 40.0 5.8 J_ 0.2 76.8 + 2.3 2.2 + 0.1 117.8 + 11.1 7.37 53.2 + 1.0
The mean pulmonary artery pressure and pH a were regulated at the levels indicated above.
artery pressure was similar in both the hypoxic and nonhypoxic series. There was a significant increase in right ventricular end- diastolic pressure with increasing PA pres- sures but no difference between the two series. Mean aortic pressure decreased but was maintained well above shock levels in both series. There were no significant changes in cardiac output.
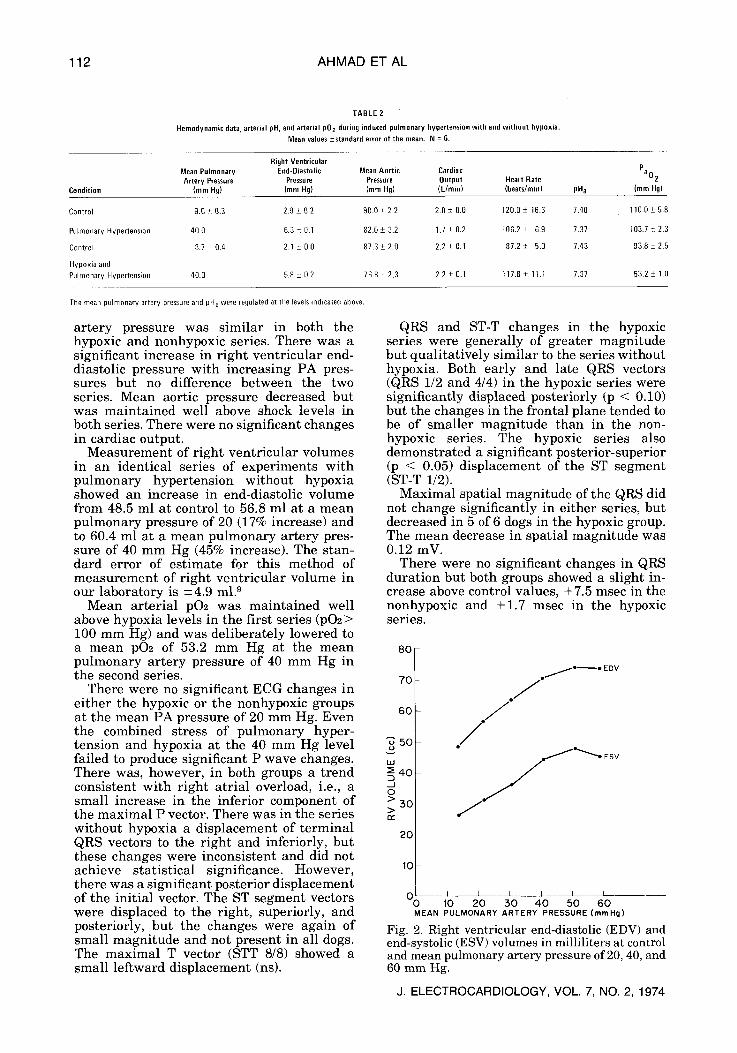
Measurement of right ventricular volumes in an identical series of experiments with pulmonary hypertension without hypoxia showed an increase in end-diastolic volume from 48.5 ml at control to 56.8 ml at a mean pulmonary pressure of 20 (17% increase) and to 60.4 ml at a mean pulmonary artery pres- sure of 40 mm Hg (45% increase). The stan- dard error of estimate for this method of measurement of right ventricular volume in our laboratory is +-4.9 m12
Mean arterial pO2 was maintained well above hypoxia levels in the first series (pO2> 100 mm Hg) and was deliberately lowered to a mean pO2 of 53.2 mm Hg at the mean pulmonary artery pressure of 40 mm Hg in the second series.
There were no significant ECG changes in either the hypoxic or the nonhypoxic groups at the mean PA pressure of 20 mm Hg. Even the combined stress of pulmonary hyper- tension and hypoxia at the 40 mm Hg level failed to produce significant P wave changes. There was, however, in both groups a trend consistent with right atrial overload, i.e., a small increase in the inferior component of the maximal P vector. There was in the series without hypoxia a displacement of terminal QRS vectors to the right and inferiorly, but these changes were inconsistent and did not achieve statistical significance. However, there was a significant posterior displacement of the initial vector. The ST segment vectors were displaced to the right, superiorly, and posteriorly, but the changes were again of small magnitude and not present in all dogs. The maximal T vector (STT 8/8) showed a small leftward displacement (ns).
QRS and ST-T changes in the hypoxic series were generally of greater magnitude but quali tat ively similar to the series without hypoxia. Both early and late QRS vectors (QRS 1/2 and 4/4) in the hypoxic series were significantly displaced posteriorly (p < 0.10) but the changes in the frontal plane tended to be of smaller magnitude than in the non- hypoxic series. The hypoxic series also demonstrated a significant posterior-superior (p < 0.05) displacement of the ST segment (ST-T 1/2).
Maximal spatial magnitude of the QRS did not change significantly in either series, but decreased in 5 of 6 dogs in the hypoxic group. The mean decrease in spatial magnitude was 0.12 mV.
There were no significant changes in QRS durat ion but both groups showed a slight in- crease above control values, +7.5 msec in the nonhypoxic and +1.7 msec in the hypoxic series.
8 0
70
6 0
"~ 5 0
I.sJ == 40 d O >
5 0 > or"
20
10
. j , , / . ~ o E DV
/ /
. / / .
O 0 J I L I i I _ _ 10 2 0 5 0 4 0 5 0 6 0
MEAN PULMONARY ARTERY PRESSURE(mmHg)
Fig. 2. Right ventricular end-diastolic (EDV) and end-systolic (ESV) volumes in milliliters at control and mean pulmonary artery pressure of 20, 40, and 60 mm Hg.
J. ELECTROCARDIOLOGY, VOL. 7, NO. 2, 1974
ECG IN ACUTE PULMONARY HYPERTENSION 113
DISCUSSION The present study utilized rigidly standar-
dized experimental conditions and objective, quant i ta t ive methods for ECG analysis in order to define electrophysiological abnor- malities that might reliably indicate acute right ventricular pressure overload and in- creased right ventricular volume. The effect of hypoxia on the ECG response to acute pulmonary hypertension was also evaluated. The observed ECG changes from control conditions were generally small and variable but followed the expected pat tern with 1) an increased vertical component of the P vector, 2) posterior displacement of early and mid- QRS vectors , and r i g h t w a r d - p o s t e r i o r displacement of terminal QRS vectors, and 3) S-T s egmen t d i sp l acemen t pos te r io r ly , superiorly, and to the right. There were no significant changes at tr ibutable to hypoxia alone or hypoxia combined with moderate pulmonary hypertension. The only significant and consistent deviation from the baseline ECG in the series with pulmonary hyper- tension without hypoxia was a small posterior displacement of the initial QRS vector. This occurred only at a level of pulmonary hyper- tension with a mean PA pressure of 40 mm Hg that caused a marked dilatation (45% increase) of the right ventricle. Hypoxia tended to accentuate the magnitude of the changes induced by pulmonary hypertension without introducing any significant quali- tat ive differences. The mechanisms whereby hypoxia accentuates the ECG changes in acute RV pressure overload remain to be de- fined. A component of right or left ventricular ischemia 1~ may partially be responsible for the ST-T changes. It is evident from Fig. 1 that the ECG response included changes both in spatial magnitude and direction of the vec- tors. Thus, the changes cannot be at tr ibuted to a simple change in anatomical heart posi- tion.
Although a large number of clinical and experimental studies of E CG changes in acute cor pulmonale have been published following the original observations by McGinn and White in 1935,11 no truly quanti tat ive ECG information is available in the literature. Early experimental studies by Krumbharr , 12 Otto, 13 Love et al, 14 Buchbinder and Katz '5 demonstrated that severe pulmonary hyper- tension generally is associated with tall P waves and ST-T changes in the vertical leads and less consistent QRS changes. Rigid cr i ter ia for the diagnosis of QRS or ST-T abnormalit ies were not employed in any of these experimental studies, and the elevation of pulmonary arterial pressure was associated with a variable degree of hypoxia.
In a more recent study on experimental
J. ELECTROCARDIOLOGY, VOL. 7, NO. 2, 1974
pulmonary embolism in dogs by Stein et al 1~ ST-T wave abnormalities, predominantly in the vertical leads, were present in 7 of 11 dogs at mean PA pressures varying from 32 to 77 mm Hg. These ST-T changes were generally abolished after rel ief from the hypoxia accompanying pulmonary embolization with- out any reduction in PA pressure. QRS abnormalit ies were noted only in 3 of 11 dogs.
Recent clinical studies by McIntyre et al, 1 Miller and Sutton, 3 Szucs et al, ~7 and Wenger et al ~s emphasize that only massive pulmo- nary embolisms are likely to cause ECG changes of right ventricular strain. The study by McIntyre et al is of particular interest. It included hemodynamic measurements in a series of patients free of intrinsic cardiopul- monary disease with various degrees of pul- monary hypertension and a wide range of angiographic obstruction (10 to 68%). Only 4 pat ients demonstrated ECG changes sugges- tive or diagnostic of right ventricular strain, and all of these patients also had acute hemo- dynamic cor pulmonale defined as pulmonary ar tery mean pressure exceeding 30 mm Hg, increased right atrial mean pressure, total p u l m o n a r y r e s i s t a n c e exceed ing 500 dynes-sec-cm -5, and depressed cardiac index. No patient with all these findings failed to display ECG changes. Miller and Sutton 3 re- ported a high incidence (78%) of ECG changes indicating right ventricular strain in a series of 20 patients who all had massive pulmonary embolism according to clinical criteria. The patients in this series had only a moderate degree of pulmonary hypertension with an average pulmonary artery systolic pressure of 38.4 mm Hg, but had elevated right ventri- cular end-diastolic pressure, and a subnormal cardiac output. It should be noted that pulmonary artery mean pressure, at least in experimental pulmonary embolism, ~9 shows a rapid decline after an initial peak, and the majority of the patients in the series reported by Miller and Sutton 3 were studied 6 hours or more after the onset of symptoms.
Thus, our experimental data indicate that obvious ECG changes of acute RV strain are associated not only with severe pulmonary hypertension but also with marked increases in right ventricular volume. These ECG changes are accentuated by hypoxia.
Acknowledgments: The authors are indebted to John E. Stewart, James E. Jones, and Willie E. Moore, Jr. for excellent technical assistance.

114 AHMAD ET AL
R E F E R E N C E S
1. MCINTYRE, K M, SASAHARA, A A AND LITTMAN, D: Relation of the electrocardiogram to hemo- dynamic alterations in pulmonary embolism. Am J Cardiol 30:205, 1972
2. SPODICK, D H: Electrocardiographic responses to pulmonary embolism; mechanisms and sources of variability. Am J Cardio] 30:695, 1972
3. MILLER, G A AND SUTTON, G C: Acute massive pulmonary embolism; clinical and haemo- dynamic findings in 23 patients studied by cardiac catheterization and pulmonary ar- teriography. Brit Heart J 32:518, 1970
4. WEBER, D M AND PHILLIPS, J H, JR: A re- evaluation of electrocardiographic changes accompanying acute pulmonary embolism. Am J Med Sci 251:381, 1966
5. MCFEE, R AND PARUNGAO, A: An orthogonal lead system for clinical electrocardiography. Am Heart J 62:93, 1961
6. BLOMQVIST, G: The Frank lead exercise elec- trocardiogram. Acta Med Scand 178 (Suppl 440): 1, 1965
7. BLOMQVIST, G, BERGMAN, S A, HEMMING, C AND TRIEBWASSER, H H: ST-T wave abnor- malities at rest and during exercise in patients with arteriosclerotic heart disease; chronic diseases of the heart. Proc International Symp, Bad Krozingen, Germany, 1972, in press
8. MULLINS, C B ANDJONES, D C: A computerized approach to a new model for measurement of right ventricular volume. Clin Res 17:18, 1969
9. MULLINS, C B, JONES, D C AND FREEBORN, W A: Comparison of models for measurement of right ventricular volume. Clin Res 18:321, 1970
10. BUCKBERG, G D, FIXLER, D E, ARCHIE, J P AND HOFFMAN, J I E: Experimental subendocardial ischemia in dogs with normal coronary ar- teries. Circ Res 30:67, 1972
11. MCGINN, S AND WHITE, P D: Acute cor pul- monale resulting from pulmonary embolism; its clinical recognition. JAMA 104:1473, 1935
12. KRUMBHAAR, E B: Note on EKG changes accompanying acutely increased pressure fol- lowing pulmonary artery ligature. Am J Med Sci 187:792, 1934
13. OTTO, H L: The effect of sudden increase in the intracardiac pressure upon the form ofT-wave of the EKG. J Lab Clin Med 14:643, 1929
14. LOVE, W S, JR, •RUGLER, G W AND WINSLOW, N: Electrocardiographic studies in clinical and experimental pulmonary embolization. Ann Int Med 11:2109, 1938
15. BUCHBINDER, W C AND KATZ, L N: The electro- cardiogram in acute experimental distention of the right heart. Am J Med Sci 187:785, 1934
16. STEIN, P D, ALSHABKHOUN, S, HATEN, C, PuR-SHAHRIARI, A A, HAYNES, F W, HARKEN, D E AND DEXTER, L: Coronary artery blood flow in acute pulmonary embolism. Am J Car- diol 21:32, 1968
17. Szucs, M M, JR, BROOKS, H L, GROSSMAN, W, BANAS, J S, JR, MEISTER, S G, DEXTER, L AND DALEN, J E: Diagnostic sensitivity of labora- tory findings in acute pulmonary embolism. Ann Int Med 74:161, 1971
18. WENGER, N K, STEIN, P D AND WILLIS, P W, III: Massive acute pulmonary embolism; the deceivingly nonspecific manifestations. JAMA 220:843, 1972
19. DALEN, J E, HAYNES, F W, HOPPIN, F G, JR, EVANS, G L, BHARDWAJ, P AND DEXTER, L: Cardiovascular response to experimental pulmonary embolism. Am J Cardio120:3, 1967
J. ELECTROCARDIOLOGY, VOL. 7, NO. 2, 1974