ECA special reports: Rural Development Programming … · Rural Development Programming EU support...
30
ECA special reports: Rural Development Programming EU support for young farmers Joint Oireachtas Committee on Agriculture, Food and the Marine 24 January 2018 Page 1 Janusz Wojciechowski ECA Member
Transcript of ECA special reports: Rural Development Programming … · Rural Development Programming EU support...

ECA special reports: Rural Development Programming EU support for young farmers
Joint Oireachtas Committee on Agriculture, Food and the Marine
24 January 2018
Page 1
Janusz Wojciechowski
ECA Member
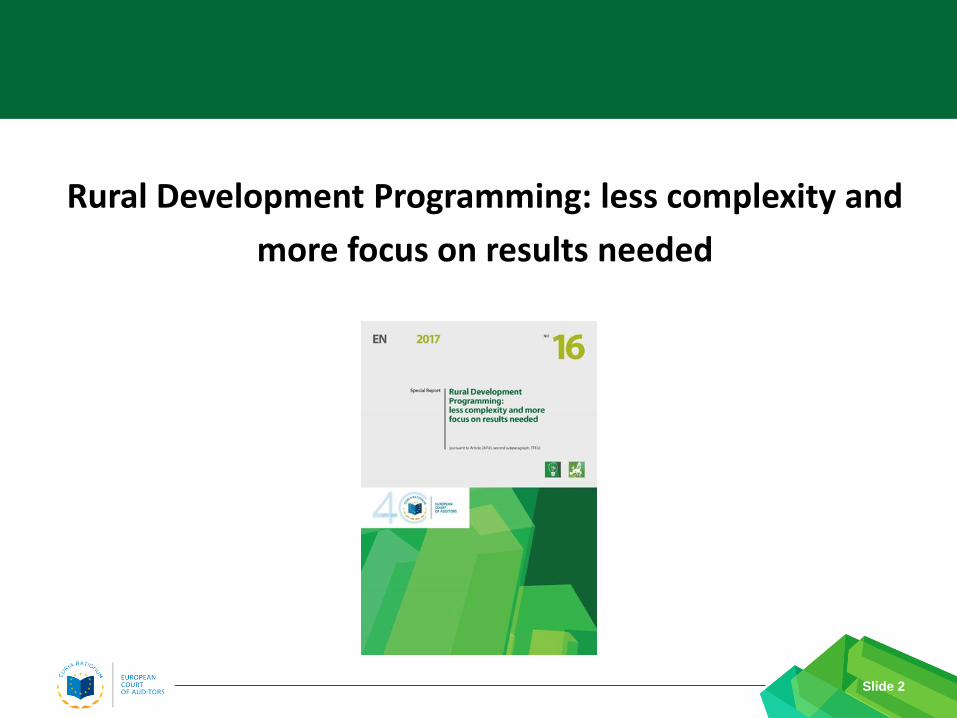
Rural Development Programming: less complexity and
more focus on results needed
Slide 2
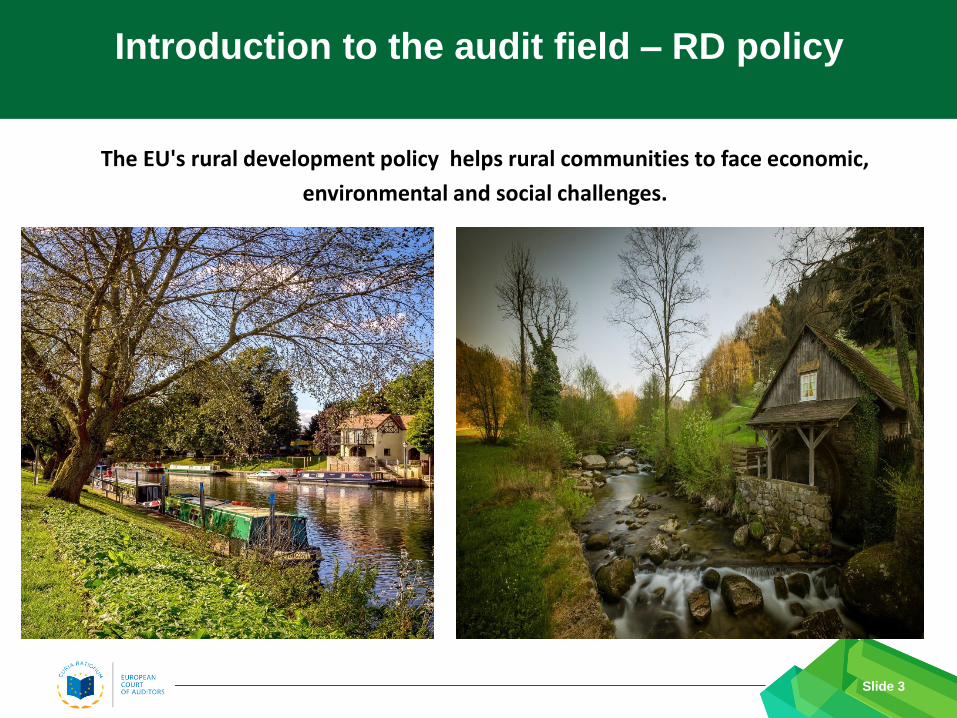
The EU's rural development policy helps rural communities to face economic,
environmental and social challenges.
Slide 3
Introduction to the audit field – RD policy
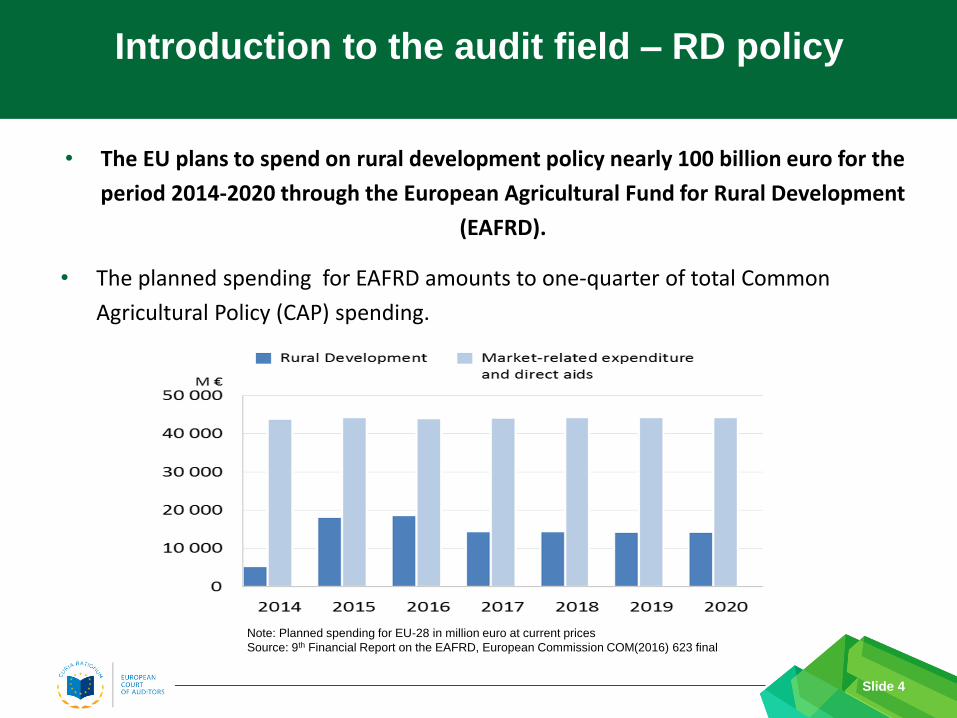
• The EU plans to spend on rural development policy nearly 100 billion euro for the
period 2014‐2020 through the European Agricultural Fund for Rural Development
(EAFRD).
• The planned spending for EAFRD amounts to one-quarter of total Common
Agricultural Policy (CAP) spending.
Slide 4
Introduction to the audit field – RD policy
Note: Planned spending for EU-28 in million euro at current prices
Source: 9th Financial Report on the EAFRD, European Commission COM(2016) 623 final

Slide 5
Introduction to the audit field – RD policy
Note: Due to rounding, the total may not correspond with the sum of the separate figures
Source: Annex I of the Regulation (EU)1305/2013 (incl. modifications by Regulations (EU) 2015/791 and 2016/142)
Why did we do this audit ?
Slide 6
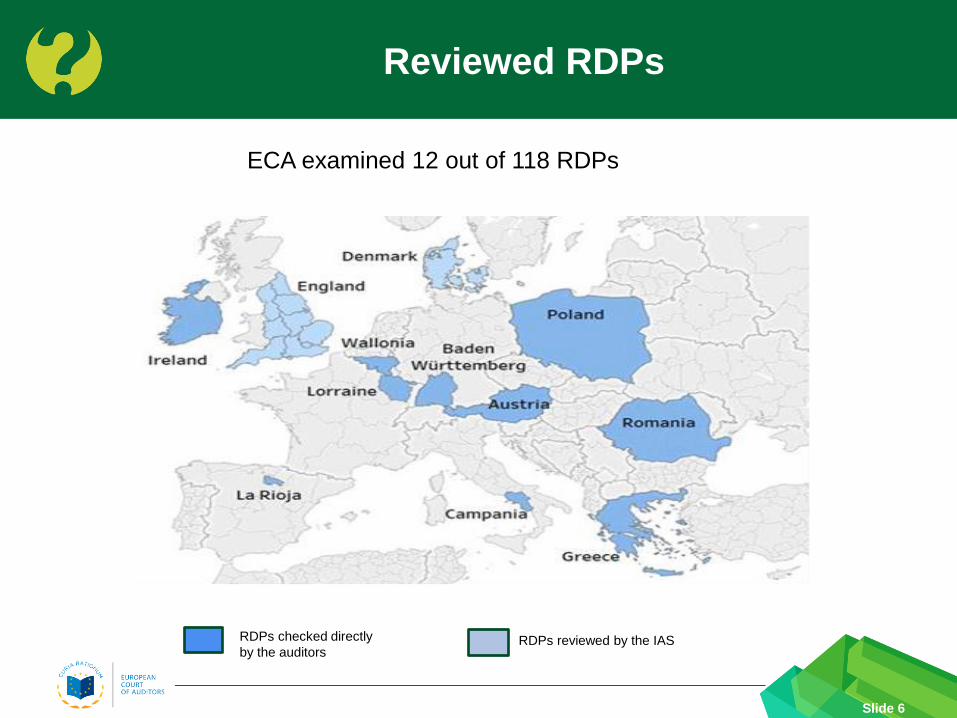
Reviewed RDPs
ECA examined 12 out of 118 RDPs
RDPs checked directly
by the auditors RDPs reviewed by the IAS

Why did we do this audit ?
Slide 7
Audit questions
Focus on performance
Is the focus on performance
reflected in the legislative
framework?
Do RDPs have potential to
contribute to better results?
Programming process
How was the programming
process managed by
the Commission?

Why did we do this audit ?
Slide 8
Main audit conclusions
RDPs were too general
RDPS were too long and complex
Programming process was too lengthy
RDPs were insufficiently focused on results
Why did we do this audit ?
Slide 9
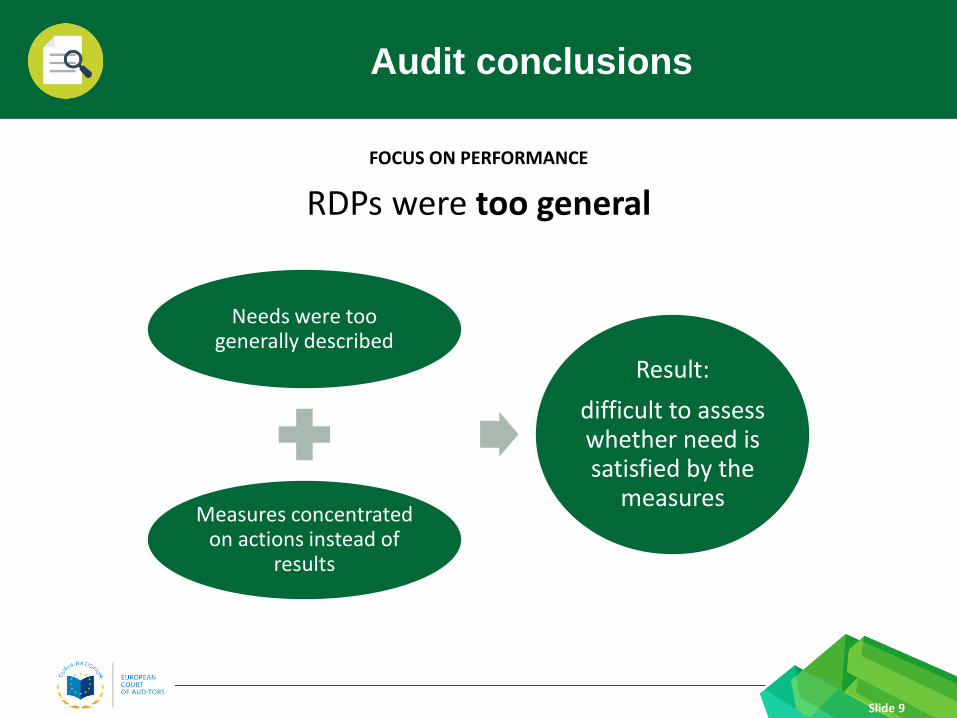
Audit conclusions
FOCUS ON PERFORMANCE
RDPs were too general
Needs were too generally described
Measures concentrated on actions instead of
results
Result:
difficult to assess whether need is satisfied by the
measures

Why did we do this audit ?
Slide 10
Audit conclusions
FOCUS ON PERFORMANCE
RDPs were too general
Examples of vaguely defined needs:
Ireland: “A well targeted and designed Agri-Environment Scheme” Romania: “Increase and diversify the number of jobs in rural areas” Poland: “Restoring and preserving biodiversity, including NATURA 2000, and in areas facing natural constraints”
Why did we do this audit ?
Slide 11
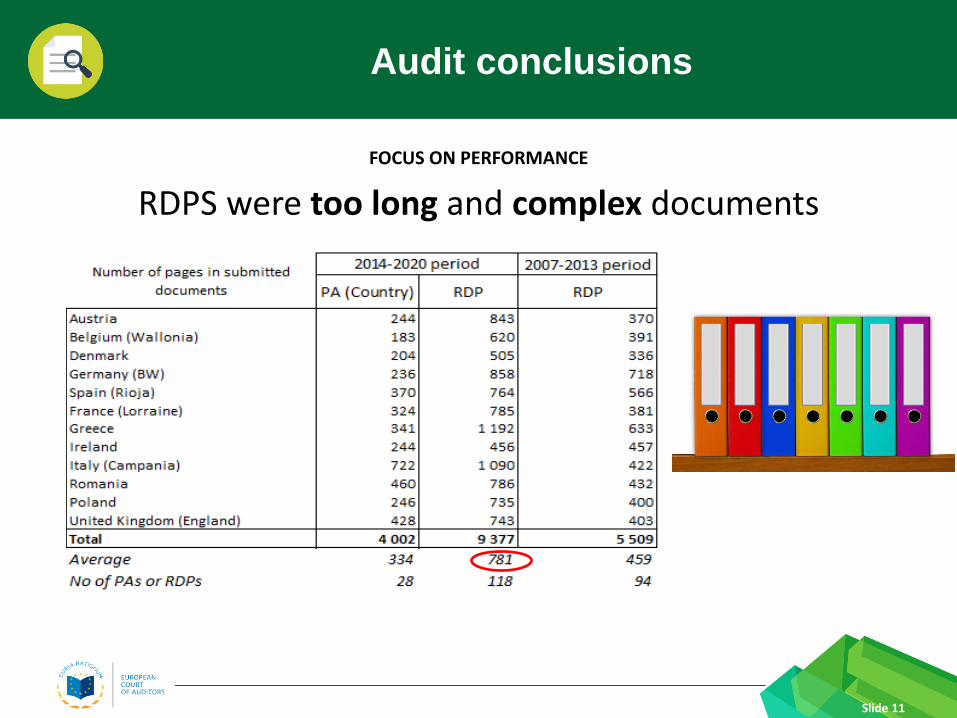
Audit conclusions
FOCUS ON PERFORMANCE
RDPS were too long and complex documents

Why did we do this audit ?
Slide 12
Audit conclusions
FOCUS ON PERFORMANCE
RDPS were too long and complex documents

Why did we do this audit ?
Slide 13
Audit recommendations
We recommend to the Commission:
• improve the consistency between RDPs and other strategic documents
• concentrate the monitoring on measuring the results using relevant indicators
• simplify the content of RDPs and reduce the number of requirements
The European Commission accepted the recommendations
insofar as it is concerned

Why did we do this audit ?
Slide 14
Audit conclusions
FOCUS ON THE PROGRAMMING PROCESS
Programming process was too long
Delayed start of RDP’s implementation
Spending over the first three years was lower than in the previous period
Why did we do this audit ?
Slide 15
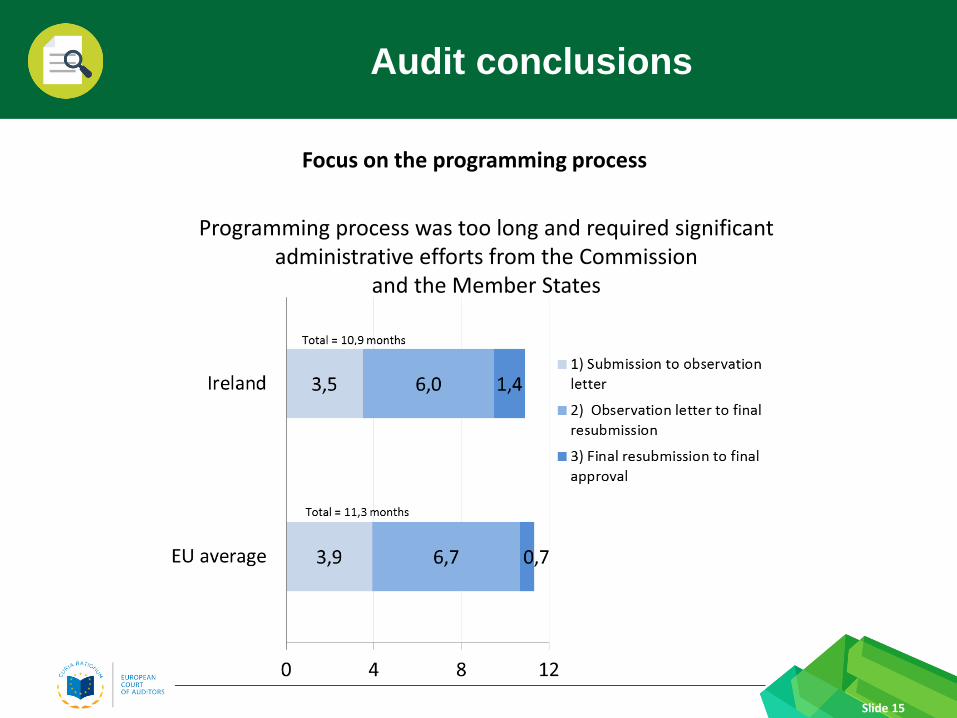
Audit conclusions
Programming process was too long and required significant administrative efforts from the Commission
and the Member States
Focus on the programming process
Why did we do this audit ?
Slide 16
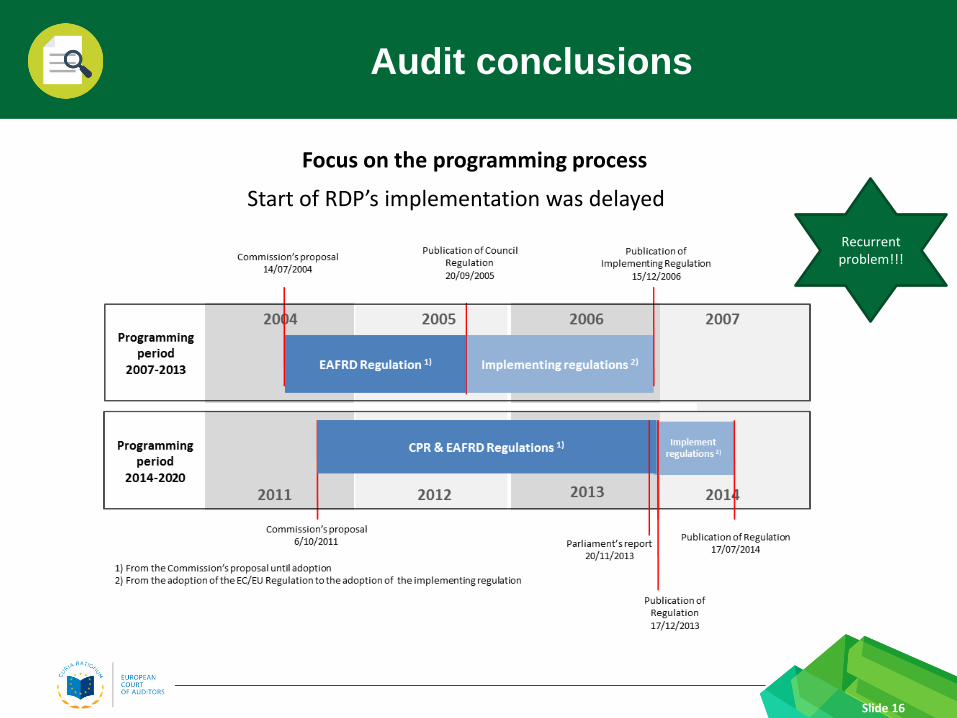
Audit conclusions
Start of RDP’s implementation was delayed
Focus on the programming process
Figure 6
Recurrent problem!!!

Why did we do this audit ?
Slide 17
Audit conclusions
Spending at the end of the fourth year out of seven years perspective is lower than in the previous period
Focus on the programming process

Why did we do this audit ?
Slide 18
Programming period 2007-2013
Note: Expenditure declared by MS in SFC2007, not including pre-financing

Why did we do this audit ?
Slide 19
Programming period 2014-2020
Note: Expenditure declared by MS in SFC2014, not including pre-financing

Why did we do this audit ?
Slide 20
Audit recommendation
We recommend to the Commission:
to prepare its legislative proposals for rural development policy post 2020 in
good time in order to allow approval at the start of the next programming period
The European Commission accepted the recommendation
Why did we do this audit ?
Slide 21
Audit conclusions
RDPS were not sufficiently focused on results
Contribution of individual RDPs to EUROPE 2020 will be difficult to assess
Complementarity and synergies of RDPs with other EU funds was
not developed
Monitoring concentrated on measuring outputs instead of results

EU support to young farmers should be better targeted
to foster effective generational renewal
Slide 22

Why did we do this audit ?
Slide 23
Evolution of the number of holdings held by young farmers, the average size of
their holdings and the total number of hectares held by young farmers in the
27 EU Member States
Million hectares 2005 2007 2010 2013
Total number of hectares held by young farmers
57,7
54,8
55,2
51,9
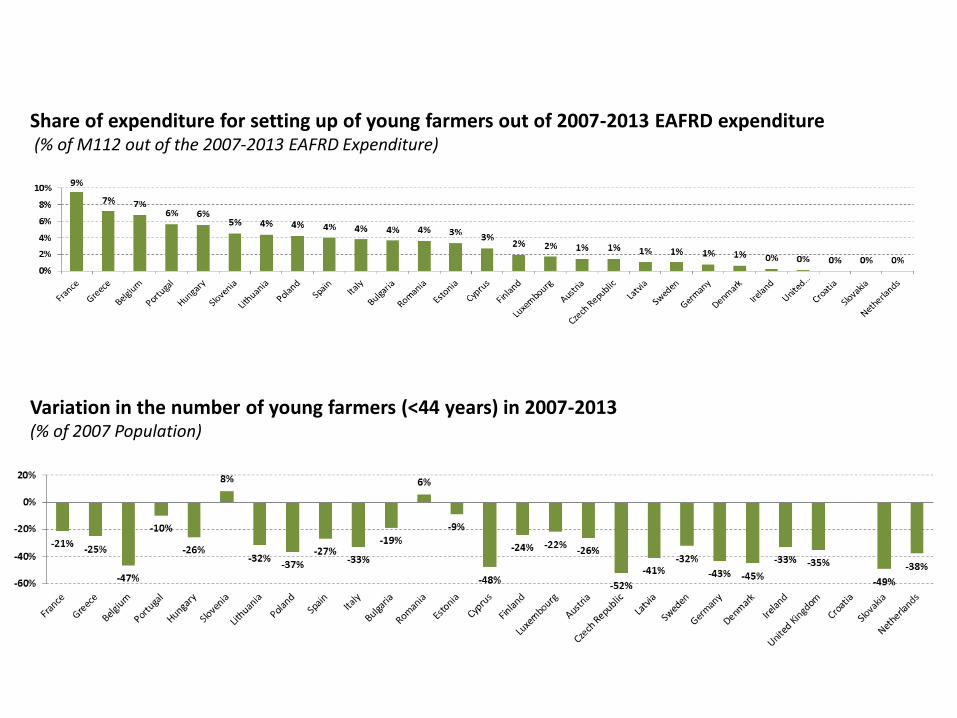
Share of expenditure for setting up of young farmers out of 2007-2013 EAFRD expenditure (% of M112 out of the 2007-2013 EAFRD Expenditure)
Variation in the number of young farmers (<44 years) in 2007-2013 (% of 2007 Population)


Distribution of farmers per age group in Member States in 2007 and 2013
Member State <35 35–44 45–54 55–64 65+
2007 2013 2007 2013 2007 2013 2007 2013 2007 2013
Belgium 6,1% 4,0% 22,2% 15,2% 28,6% 32,9% 22,7% 26,8% 20,5% 21,2%
Bułgaria 3,1% 6,4% 9,4% 13,2% 17,5% 18,5% 25,1% 25,2% 45,0% 36,7%
Czech Republic 9,7% 4,6% 17,4% 14,8% 27,2% 23,8% 28,5% 33,9% 17,2% 23,0%
Denmark 5,9% 2,5% 21,4% 14,7% 29,1% 31,2% 23,9% 27,6% 19,6% 24,0%
Germany 7,7% 6,8% 28,2% 19,7% 33,9% 37,2% 22,6% 29,8% 7,5% 6,5%
Estonia 6,2% 7,5% 15,8% 16,8% 23,1% 23,4% 23,8% 21,8% 31,1% 30,4%
Ireland 8,1% 6,3% 18,3% 16,7% 24,6% 25,1% 25,5% 25,5% 23,5% 26,5%
Greece 6,9% 5,2% 15,1% 14,7% 21,6% 23,9% 20,2% 24,9% 36,3% 31,3%
Spain 5,2% 3,7% 15,6% 12,7% 23,3% 25,0% 24,5% 25,2% 31,4% 33,3%
France 8,1% 8,8% 23,6% 19,1% 31,5% 32,7% 23,9% 27,0% 12,9% 12,4%
Croatia Data not available
Italy 3,1% 4,5% 10,7% 10,8% 19,4% 21,6% 23,9% 23,3% 42,9% 39,7%
Cyprus 2,4% 1,7% 12,0% 6,9% 26,7% 21,4% 29,1% 30,1% 29,8% 40,0%
Latvia 7,1% 5,0% 18,1% 14,5% 25,0% 26,3% 20,7% 24,1% 29,2% 30,1%
Lithuania 4,4% 5,6% 16,9% 13,9% 21,4% 25,6% 18,2% 20,9% 39,1% 34,0%
Luxembourg 7,4% 8,7% 22,5% 17,3% 33,8% 32,2% 22,5% 27,4% 13,9% 14,4%
Hungary 7,6% 6,1% 14,6% 14,9% 23,2% 19,4% 27,1% 29,2% 27,5% 30,3%
Malta 4,9% 3,8% 10,3% 12,9% 29,3% 24,8% 32,4% 33,4% 23,0% 25,1%
Netherlands 4,0% 3,1% 23,5% 16,3% 28,7% 32,7% 26,1% 26,9% 17,7% 21,0%
Austria 11,0% 10,9% 29,7% 24,4% 33,3% 36,5% 16,5% 19,6% 9,4% 8,6%
Poland 12,2% 12,1% 21,6% 23,7% 31,1% 30,2% 19,3% 24,3% 15,8% 9,6%
Portugal 2,2% 2,5% 8,2% 7,2% 17,6% 16,6% 25,4% 23,6% 46,7% 50,1%
Romania 4,4% 4,7% 11,9% 13,9% 17,0% 16,9% 22,6% 23,5% 44,2% 41,0%
Slovenia 4,0% 4,8% 13,0% 14,4% 24,6% 26,4% 23,5% 29,1% 34,9% 25,3%
Slovakia 3,8% 8,1% 12,0% 15,4% 25,2% 24,9% 27,3% 30,0% 31,7% 21,6%
Finland 9,2% 8,5% 22,8% 22,0% 32,0% 30,1% 29,8% 29,1% 6,2% 10,2%
Sweden 6,0% 4,4% 17,4% 12,8% 26,7% 24,8% 29,3% 28,0% 20,6% 30,0%
UK 3,9% 3,9% 15,0% 11,0% 25,0% 26,6% 28,6% 27,9% 27,6% 30,6%
UE-27: 6,3% 6,0% 15,5% 15,3% 22,8% 22,9% 22,7% 24,7% 32,7% 31,1%
Why did we do this audit ?
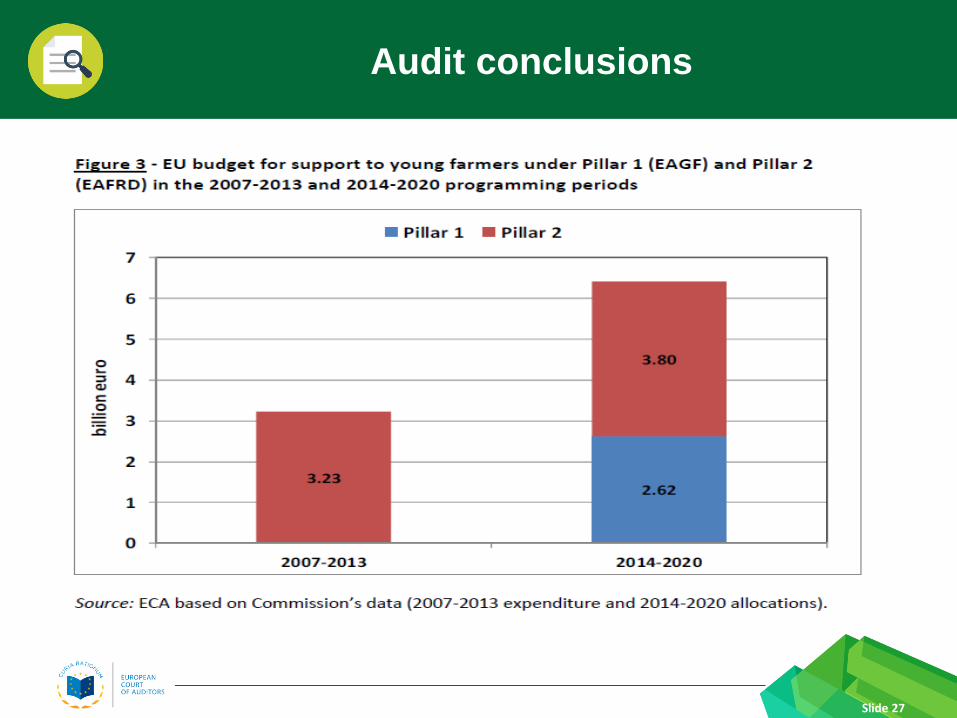
Slide 27
Audit conclusions
Why did we do this audit ?
Slide 28
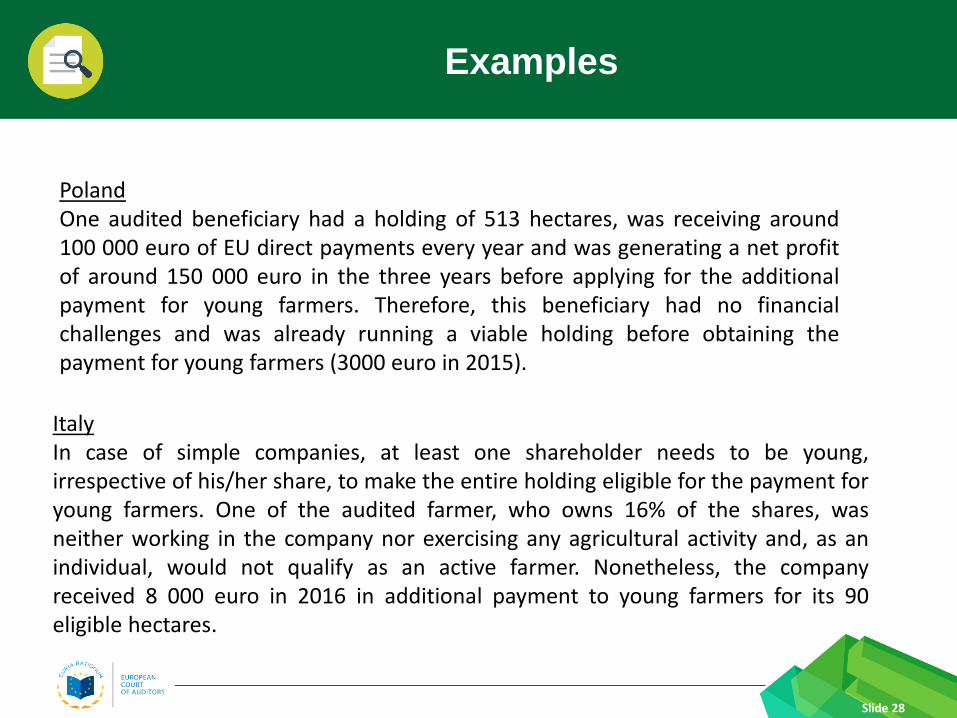
Examples
Italy In case of simple companies, at least one shareholder needs to be young, irrespective of his/her share, to make the entire holding eligible for the payment for young farmers. One of the audited farmer, who owns 16% of the shares, was neither working in the company nor exercising any agricultural activity and, as an individual, would not qualify as an active farmer. Nonetheless, the company received 8 000 euro in 2016 in additional payment to young farmers for its 90 eligible hectares.
Poland One audited beneficiary had a holding of 513 hectares, was receiving around 100 000 euro of EU direct payments every year and was generating a net profit of around 150 000 euro in the three years before applying for the additional payment for young farmers. Therefore, this beneficiary had no financial challenges and was already running a viable holding before obtaining the payment for young farmers (3000 euro in 2015).

Decreasing farming population: falling from 14.5 million in 2005 to 10.7 million in 2013
The number of young farmers (up to 44 years old) decreased from 3.3 million in 2005
to 2.3 million in 2013
Evolution of the number of farmers by age group in the 27 EU Member States
Slide 29
Farming population
0
2
4
6
8
10
12
14
16
2005 2007 2010 2013
mill
ion
s
<35 35-44 45-54 55-64 65+
Decreasing farmland
Janusz Wojciechowski
ECA Member
European Court of Auditors
12, rue Alcide De Gasperi
1615 Luxembourg
eca.europa.eu
@EUAuditorsECA
Slide 30
Thank you for your attention!