EBOS Group Ltd - NZX · • EBOS remains the largest diversified Australasian marketer, wholesaler,...
24
EBOS Group Ltd Results presentation for the Half Year ended 31 December 2014 Patrick Davies Chief Executive Officer John Cullity Chief Financial Officer 25 February 2015
Transcript of EBOS Group Ltd - NZX · • EBOS remains the largest diversified Australasian marketer, wholesaler,...
EBOS Group Ltd Results presentation for the Half Year ended 31 December 2014
Patrick Davies Chief Executive Officer
John Cullity Chief Financial Officer
25 February 2015
2
Disclaimer
The information in this presentation was prepared by EBOS Group Ltd with due care and attention. However, the information is supplied in summary form and is therefore not necessarily complete, and no representation is made as to the accuracy, completeness or reliability of the information. In addition, neither the EBOS Group nor any of its subsidiaries, directors, employees, shareholders nor any other person shall have liability whatsoever to any person for any loss (including, without limitation, arising from any fault or negligence) arising from this presentation or any information supplied in connection with it. This presentation may contain forward-looking statements and projections. These reflect EBOS’s current expectations, based on what it thinks are reasonable assumptions. EBOS gives no warranty or representation as to its future financial performance or any future matter. Except as required by law or NZX or ASX listing rules, EBOS is not obliged to update this presentation after its release, even if things change materially. This presentation does not constitute financial advice. Further, this presentation is not and should not be construed as an offer to sell or a solicitation of an offer to buy EBOS Group securities and may not be relied upon in connection with any purchase of EBOS Group securities. This presentation contains a number of non-GAAP financial measures, including Gross Profit, Gross Operating Revenue, EBIT, EBITA, EBITDA, Free Cash Flow, Interest cover, Net Debt and Return on Capital Employed. Because they are not defined by GAAP or IFRS, EBOS’s calculation of these measures may differ from similarly titled measures presented by other companies and they should not be considered in isolation from, or construed as an alternative to, other financial measures determined in accordance with GAAP. Although EBOS believes they provide useful information in measuring the financial performance and condition of EBOS's business, readers are cautioned not to place undue reliance on these non-GAAP financial measures. The information contained in this presentation should be considered in conjunction with the consolidated financial statements for the period ended 31 December 2014, which are available at: http://www.ebosgroup.com/information/investor-information/ All currency amounts are in New Zealand dollars unless stated otherwise.

3
1. Group Overview and Results

4
First Half Overview
• NPAT of $53.9m for the first half, an increase of 9.2% on last year or 11.5% on a constant FX basis.
• EBITDA growth in both Healthcare (10.3%) and Animal Care (8.9%) (constant FX).
• Operating cash flow of $30.5m.
• Earnings per share of 36.2 cents, an increase of 6.5% on last year or 8.7% on a constant FX basis.
Strong financial results
• Strategic 25% equity investment in Good Price Pharmacy Warehouse (‘GPPW’). (Aug14)
• Opening of new Keysborough distribution facility in Melbourne on time and on budget. (Sep14)
• Acquisition of BlackHawk premium pet food business. (Nov14)
Continued Investment across
the business
• Announcement in January 2015 of Onelink’s contract with NSW Health to provide warehousing and distribution services for medical consumable products to all NSW public hospitals.
Trans-Tasman expertise creating new opportunities
• Cash generated from Operating activities of $30.5m.
• Industry leading cash conversion cycle of 24 days.
• Bank debt successfully refinanced August 2014 at improved margins and extended terms.
• Interim dividend of 22.0 cents, an increase of 7.3% on H1 FY14.
Capital Management
5
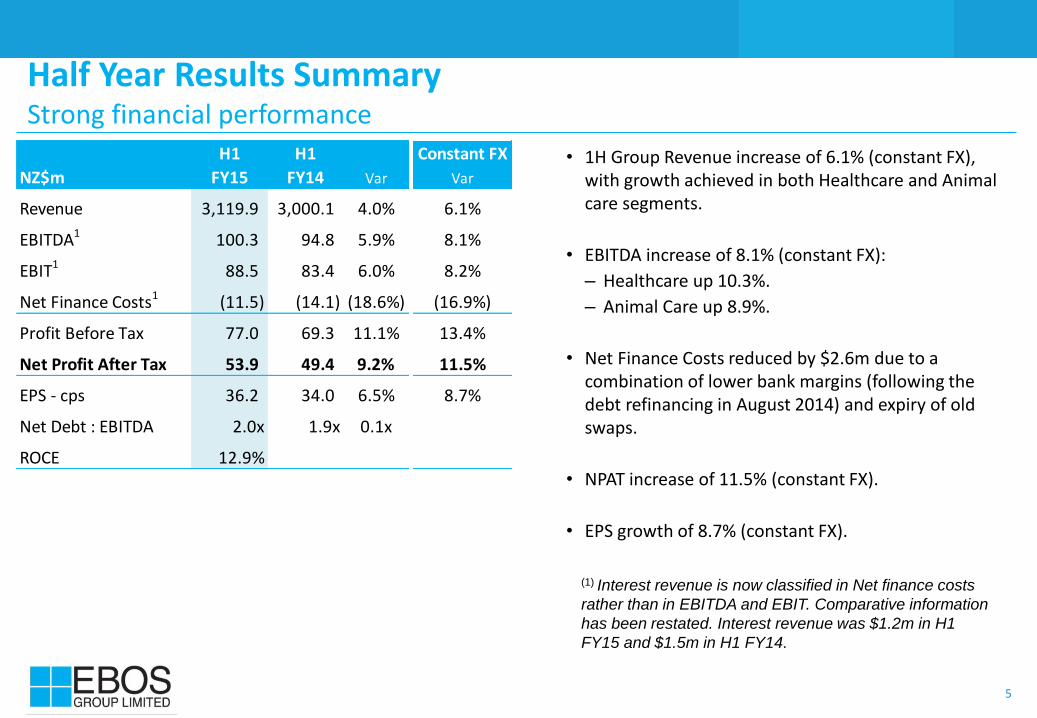
Half Year Results Summary Strong financial performance
• 1H Group Revenue increase of 6.1% (constant FX), with growth achieved in both Healthcare and Animal care segments.
• EBITDA increase of 8.1% (constant FX):
– Healthcare up 10.3%.
– Animal Care up 8.9%.
• Net Finance Costs reduced by $2.6m due to a combination of lower bank margins (following the debt refinancing in August 2014) and expiry of old swaps.
• NPAT increase of 11.5% (constant FX).
• EPS growth of 8.7% (constant FX).
H1 H1 Constant FX
NZ$m FY15 FY14 Var Var
Revenue 3,119.9 3,000.1 4.0% 6.1%
EBITDA1 100.3 94.8 5.9% 8.1%
EBIT1 88.5 83.4 6.0% 8.2%
Net Finance Costs1 (11.5) (14.1) (18.6%) (16.9%)
Profit Before Tax 77.0 69.3 11.1% 13.4%
Net Profit After Tax 53.9 49.4 9.2% 11.5%
EPS - cps 36.2 34.0 6.5% 8.7%
Net Debt : EBITDA 2.0x 1.9x 0.1x
ROCE 12.9%
(1) Interest revenue is now classified in Net finance costs
rather than in EBITDA and EBIT. Comparative information
has been restated. Interest revenue was $1.2m in H1
FY15 and $1.5m in H1 FY14.
6
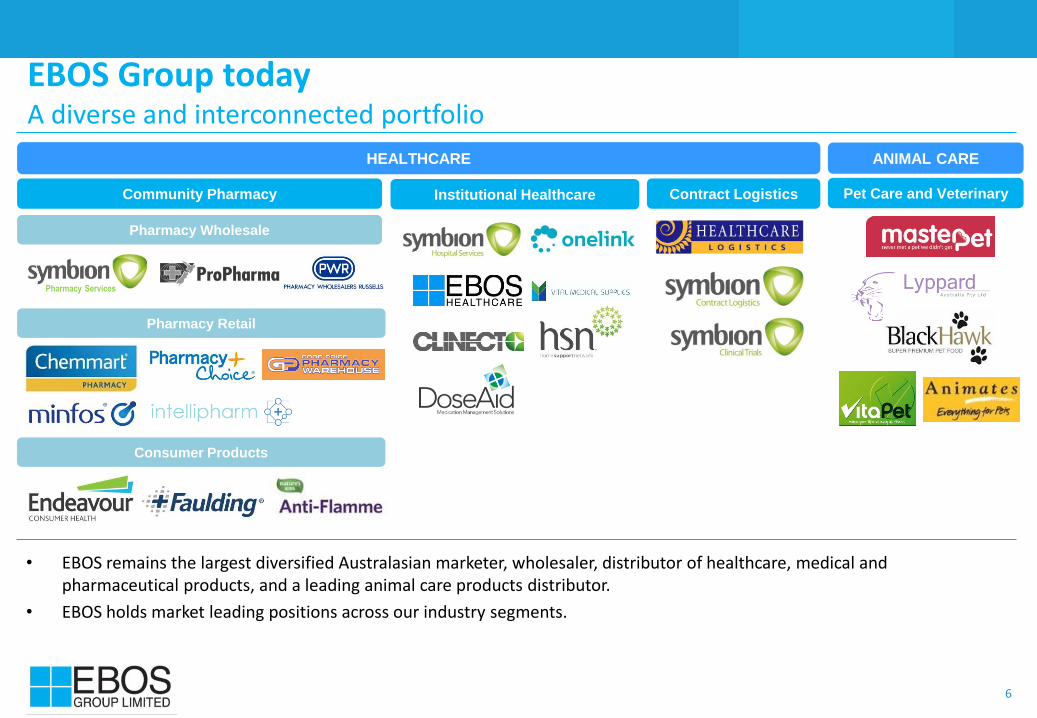
EBOS Group today A diverse and interconnected portfolio
• EBOS remains the largest diversified Australasian marketer, wholesaler, distributor of healthcare, medical and pharmaceutical products, and a leading animal care products distributor.
• EBOS holds market leading positions across our industry segments.
ANIMAL CARE
Pharmacy Services
HEALTHCARE
Institutional Healthcare Contract Logistics Community Pharmacy
Pharmacy Wholesale
Pharmacy Retail
Consumer Products
Pet Care and Veterinary

7
2. Segment Overview and Results

8
Segment earnings overview
EBITDA by segment
• Very strong performance across both business segments.
• Gross Operating Revenue mix by division has remained stable over the period.
• H1 FY15 Corporate costs reflect the new management structure effective 1 July 2014.
Gross Operating Revenue H1 FY15
H1 H1 Constant FX
NZ$m FY15 FY14 Var Var
Healthcare 88.5 81.9 8.1% 10.3%
Animal Care 16.8 15.7 7.1% 8.9%
Corporate (5.0) (2.8) (79.5%) (76.4%)#DIV/0!
Group 100.3 94.8 5.9% 8.1%

9
H1 H1 Constant FX
NZ$m FY15 FY14 Var Var
Healthcare segment
Revenue 2,928.7 2,823.0 3.7% 5.9%
EBITDA 88.5 81.9 8.1% 10.3%
EBIT 78.5 72.3 8.5% 10.8%
EBITDA % 3.02% 2.90% 12pts 12pts
Australia
Revenue 2,285.3 2,202.9 3.7% 6.5%
EBITDA 72.2 65.6 10.1% 13.0%
EBIT 63.4 57.1 11.1% 14.1%
EBITDA % 3.16% 2.98% 18pts 18pts
New Zealand
Revenue 643.4 620.1 3.7%
EBITDA 16.3 16.3 0.0%
EBIT 15.1 15.2 (0.7%)
EBITDA % 2.53% 2.63% (10pts)
78%
22%
FY15 Revenue
Australia
New Zealand
82%
18%
FY15 EBITDA
Australia
New Zealand
Healthcare segment Half Year Results Summary
EBITDA (First Half FY15)
Net Revenue (First Half FY15)
H1 FY14: Australia 78%, NZ 22% H1 FY14: Australia 80%, NZ 20%
• Healthcare Revenue increase of 5.9% (constant FX):
– Australia up 6.5%.
– New Zealand up 3.7%.
• EBITDA increase of 10.3% (constant FX):
– Australia up 13.0%.
– New Zealand flat to last year.
10
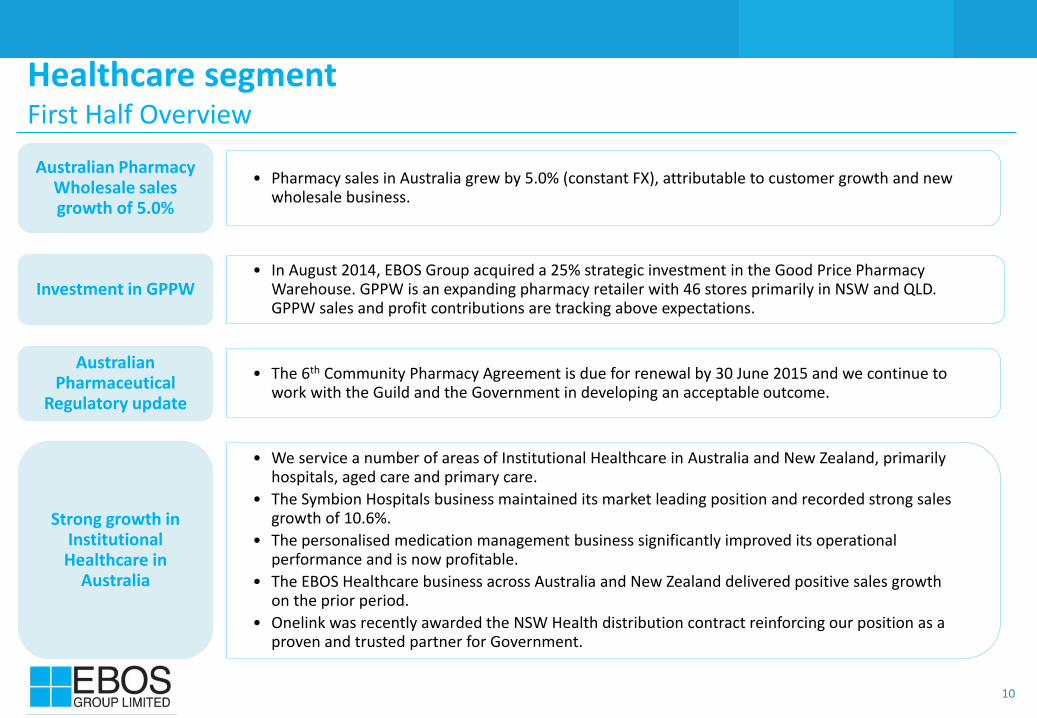
Healthcare segment First Half Overview
• Pharmacy sales in Australia grew by 5.0% (constant FX), attributable to customer growth and new wholesale business.
Australian Pharmacy Wholesale sales growth of 5.0%
• In August 2014, EBOS Group acquired a 25% strategic investment in the Good Price Pharmacy Warehouse. GPPW is an expanding pharmacy retailer with 46 stores primarily in NSW and QLD. GPPW sales and profit contributions are tracking above expectations.
Investment in GPPW
• The 6th Community Pharmacy Agreement is due for renewal by 30 June 2015 and we continue to work with the Guild and the Government in developing an acceptable outcome.
Australian Pharmaceutical
Regulatory update
• We service a number of areas of Institutional Healthcare in Australia and New Zealand, primarily hospitals, aged care and primary care.
• The Symbion Hospitals business maintained its market leading position and recorded strong sales growth of 10.6%.
• The personalised medication management business significantly improved its operational performance and is now profitable.
• The EBOS Healthcare business across Australia and New Zealand delivered positive sales growth on the prior period.
• Onelink was recently awarded the NSW Health distribution contract reinforcing our position as a proven and trusted partner for Government.
Strong growth in Institutional Healthcare in
Australia
11
Healthcare segment First Half Overview (continued)
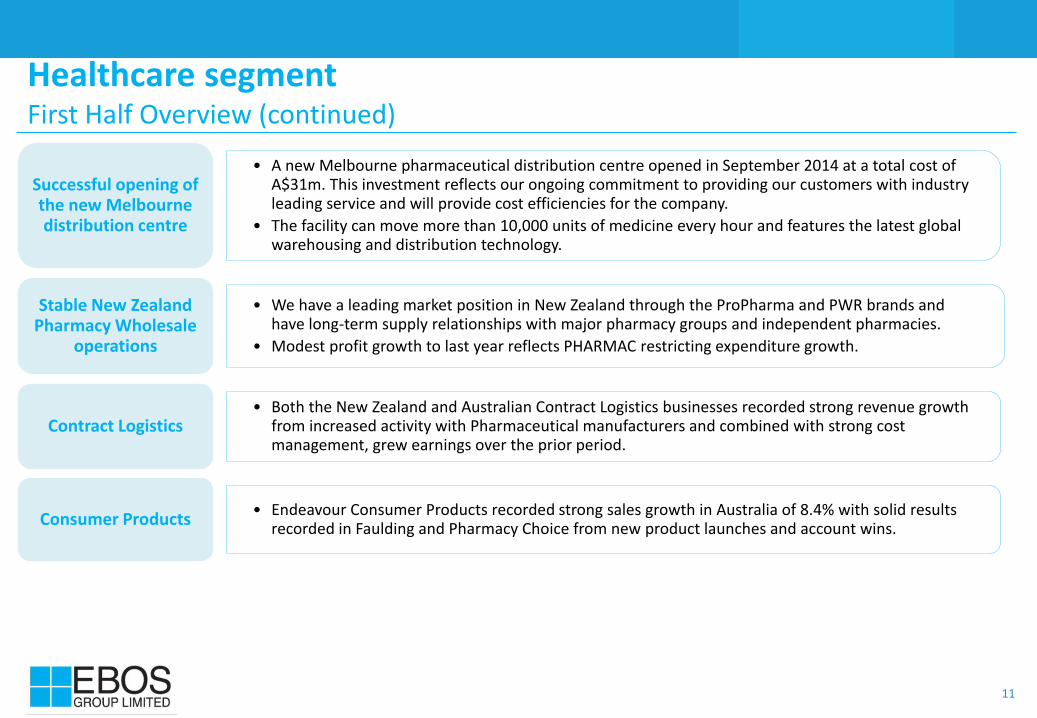
• A new Melbourne pharmaceutical distribution centre opened in September 2014 at a total cost of A$31m. This investment reflects our ongoing commitment to providing our customers with industry leading service and will provide cost efficiencies for the company.
• The facility can move more than 10,000 units of medicine every hour and features the latest global warehousing and distribution technology.
Successful opening of the new Melbourne distribution centre
• We have a leading market position in New Zealand through the ProPharma and PWR brands and have long-term supply relationships with major pharmacy groups and independent pharmacies.
• Modest profit growth to last year reflects PHARMAC restricting expenditure growth.
Stable New Zealand Pharmacy Wholesale
operations
• Both the New Zealand and Australian Contract Logistics businesses recorded strong revenue growth from increased activity with Pharmaceutical manufacturers and combined with strong cost management, grew earnings over the prior period.
Contract Logistics
• Endeavour Consumer Products recorded strong sales growth in Australia of 8.4% with solid results recorded in Faulding and Pharmacy Choice from new product launches and account wins.
Consumer Products

12
Animal Care segment Half Year Results Summary
H1 FY14: Australia 83%, NZ 17%
• Revenue increase of 10.3% (constant FX) primarily from growth of branded products (including BlackHawk) and wholesale operations (Lyppard).
• EBITDA increase of 8.9% (constant FX) attributable to:
– revenue growth; and
– includes the impact of additional advertising and marketing spend as we continue to build our brands.
EBITDA (First Half FY15)
Net Revenue (First Half FY15)
84%
16%
FY15 Revenue
Australia
New Zealand
66%
34%
FY15 EBITDA
Australia
New Zealand
H1 FY14: Australia 64%, NZ 36%
H1 H1 Constant FX
NZ$m FY15 FY14 Var Var
Animal Care segment
Revenue 191.1 177.0 8.0% 10.3%
EBITDA 16.8 15.7 7.1% 8.9%
EBIT 15.0 13.9 7.5% 9.2%
EBITDA % 8.81% 8.88% (7pts) (12pts)
13
Animal Care segment First Half Overview
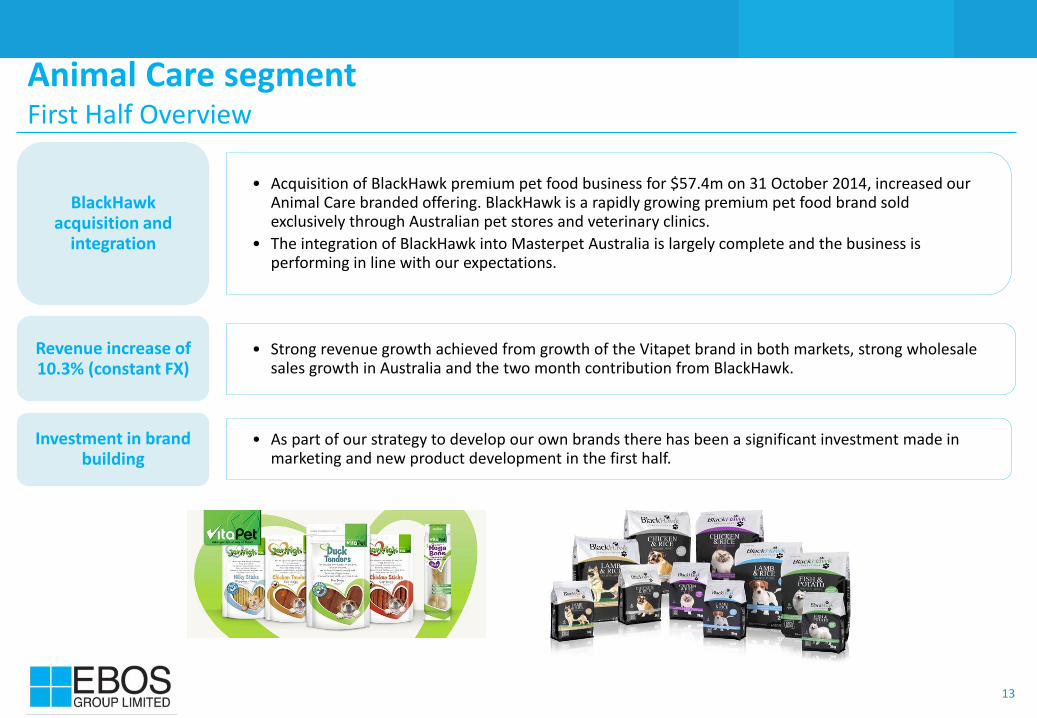
• Acquisition of BlackHawk premium pet food business for $57.4m on 31 October 2014, increased our Animal Care branded offering. BlackHawk is a rapidly growing premium pet food brand sold exclusively through Australian pet stores and veterinary clinics.
• The integration of BlackHawk into Masterpet Australia is largely complete and the business is performing in line with our expectations.
BlackHawk acquisition and
integration
• Strong revenue growth achieved from growth of the Vitapet brand in both markets, strong wholesale sales growth in Australia and the two month contribution from BlackHawk.
Revenue increase of 10.3% (constant FX)
• As part of our strategy to develop our own brands there has been a significant investment made in marketing and new product development in the first half.
Investment in brand building
14
3. Group Financial Information
15
Cash Flow EBOS has an excellent portfolio of strong cash generating businesses
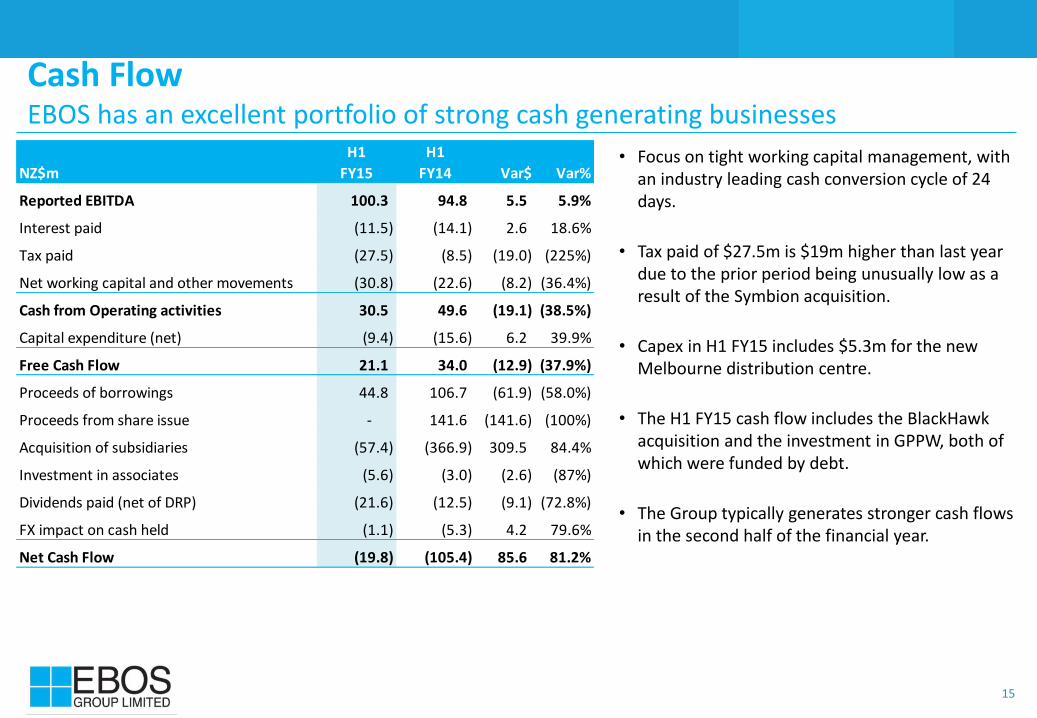
• Focus on tight working capital management, with an industry leading cash conversion cycle of 24 days.
• Tax paid of $27.5m is $19m higher than last year due to the prior period being unusually low as a result of the Symbion acquisition.
• Capex in H1 FY15 includes $5.3m for the new Melbourne distribution centre.
• The H1 FY15 cash flow includes the BlackHawk acquisition and the investment in GPPW, both of which were funded by debt.
• The Group typically generates stronger cash flows in the second half of the financial year.
H1 H1
NZ$m FY15 FY14 Var$ Var%
Reported EBITDA 100.3 94.8 5.5 5.9%
Interest paid (11.5) (14.1) 2.6 18.6%
Tax paid (27.5) (8.5) (19.0) (225%)
Net working capital and other movements (30.8) (22.6) (8.2) (36.4%)
Cash from Operating activities 30.5 49.6 (19.1) (38.5%)
Capital expenditure (net) (9.4) (15.6) 6.2 39.9%
Free Cash Flow 21.1 34.0 (12.9) (37.9%)
Proceeds of borrowings 44.8 106.7 (61.9) (58.0%)
Proceeds from share issue - 141.6 (141.6) (100%)
Acquisition of subsidiaries (57.4) (366.9) 309.5 84.4%
Investment in associates (5.6) (3.0) (2.6) (87%)
Dividends paid (net of DRP) (21.6) (12.5) (9.1) (72.8%)
FX impact on cash held (1.1) (5.3) 4.2 79.6%
Net Cash Flow (19.8) (105.4) 85.6 81.2%
16
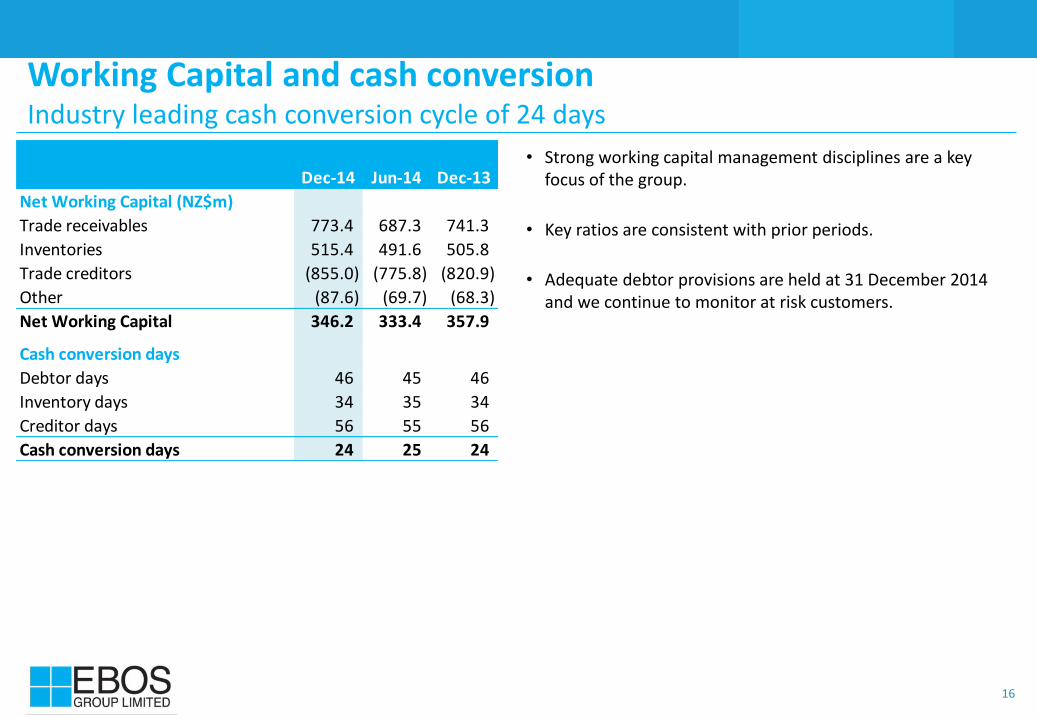
• Strong working capital management disciplines are a key focus of the group.
• Key ratios are consistent with prior periods.
• Adequate debtor provisions are held at 31 December 2014 and we continue to monitor at risk customers.
Working Capital and cash conversion Industry leading cash conversion cycle of 24 days
Dec-14 Jun-14 Dec-13
Net Working Capital (NZ$m)
Trade receivables 773.4 687.3 741.3
Inventories 515.4 491.6 505.8
Trade creditors (855.0) (775.8) (820.9)
Other (87.6) (69.7) (68.3)
Net Working Capital 346.2 333.4 357.9
Cash conversion days
Debtor days 46 45 46
Inventory days 34 35 34
Creditor days 56 55 56
Cash conversion days 24 25 24

17
• Marginal increase in the Gearing ratio from 24.4% at June 2014 to 26.9% at December 2014 – primarily due to the 100% debt financing of the BlackHawk acquisition.
• Interest cover increased to 8.8x at December 2014 (June 2014: 6.5x).
• Ample headroom available in debt facilities to undertake further acquisitions.
Debt profile
Debt maturity profile
• NZ$402m (A$385m) Securitisation facility renegotiated in August 2014 for a 3 year term expiring in FY18 on improved margins.
• Term debt of NZ$260m extended on improved margins.
• Debt facility split: Australia 80%, NZ 20%.
Net debt and Gearing
77 92 92
176
-
30
60
90
120
150
180
FY17 FY18 FY19 FY20
NZ$
m
Term debt Securitisation
350
316
368
26.7%24.4%
26.9%
0%
5%
10%
15%
20%
25%
30%
35%
40%
0
50
100
150
200
250
300
350
400
Dec-13 Jun-14 Dec-14
Gea
rin
g ra
tio
Net
deb
t (N
Z$m
)
Net Debt Gearing ratio (Net debt)

18
32.5 41.0
20.5 22.0
46.8
62.8
34.0 36.2
FY13 FY14 H1 FY14 H1 FY15
NZ$
cen
ts p
er s
har
e
DPS EPS
• EPS growth of 6.5% (8.7% constant FX) in first half following a 34% increase in FY14.
• Interim dividend of 22.0 cents (imputed to 30%), an increase of 1.5 cents or 7.3% from H1 FY14.
• Dividend payout ratio of 61%.
Dividends and Earnings per share
Earnings per share Return on Capital Employed
• Return on Capital Employed of 12.9% at December 2014, an increase of 0.1% from June 2014.
10.9%
12.8% 12.9%
FY13 FY14 H1 FY15
RO
CE
%
ROCE
ROCE
19
0.82
0.84
0.86
0.88
0.90
0.92
0.94
0.96
0.98
Jul-1
3
Oct
-13
Jan-
14
Apr
-14
Jul-1
4
Oct
-14
Daily FX Rate
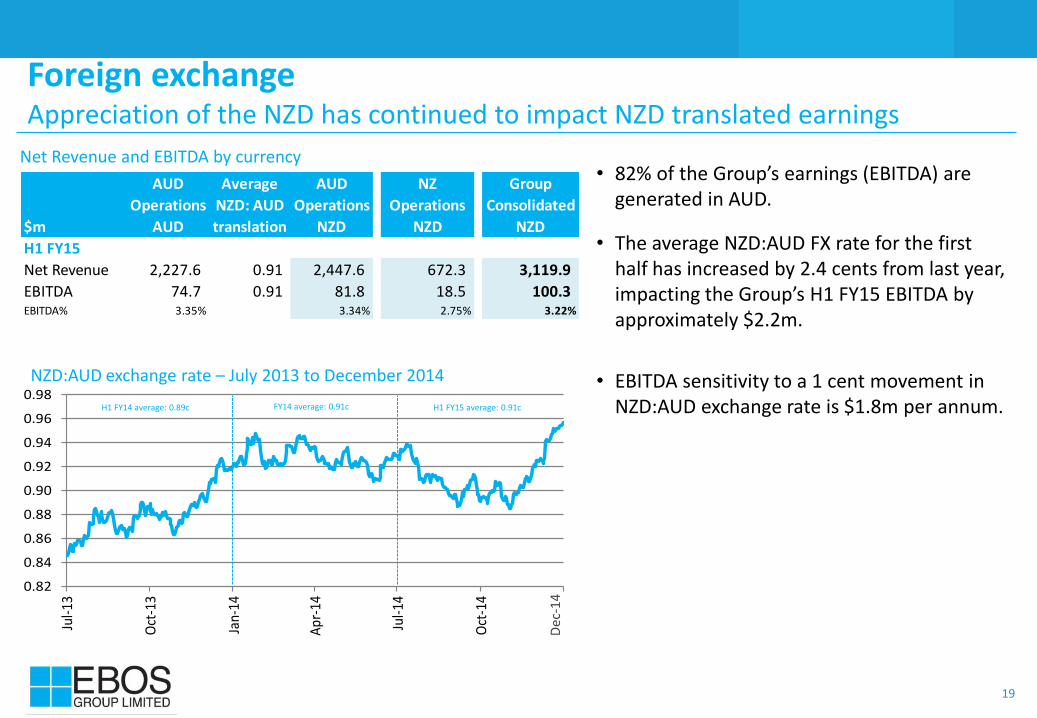
• 82% of the Group’s earnings (EBITDA) are generated in AUD.
• The average NZD:AUD FX rate for the first half has increased by 2.4 cents from last year, impacting the Group’s H1 FY15 EBITDA by approximately $2.2m.
• EBITDA sensitivity to a 1 cent movement in NZD:AUD exchange rate is $1.8m per annum.
Foreign exchange Appreciation of the NZD has continued to impact NZD translated earnings
Net Revenue and EBITDA by currency
H1 FY14 average: 0.89c FY14 average: 0.91c H1 FY15 average: 0.91c
NZD:AUD exchange rate – July 2013 to December 2014
AUD Average AUD NZ Group
Operations NZD: AUD Operations Operations Consolidated
$m AUD translation NZD NZD NZD
H1 FY15
Net Revenue 2,227.6 0.91 2,447.6 672.3 3,119.9
EBITDA 74.7 0.91 81.8 18.5 100.3 EBITDA% 3.35% 3.34% 2.75% 3.22%
Dec
-14

20
4. Outlook
21
Outlook
• We see continued growth in our business across both Healthcare and Animal Care and expect second half constant currency profit growth to be approximately the same rate as recorded in the first half.
22
Supporting information

23
Glossary of terms and measures
Except where noted, common terms and measures used in this document are based upon the following definitions:
Term Definition
Actual results Results translated into NZ dollars at the applicable actual monthly exchange rates ruling in each period.
Cash conversion cycle
Net working capital days, being Debtor days plus Inventory days less Creditor days.
Constant FX/currency
Calculated by translating the prior period results into NZ dollars at the actual monthly exchange rates applicable in the current period.
Creditor days Trade creditors at the end of period divided by Cost of Sales for the period, multiplied by number of days in the period.
Debtor days Trade debtors at the end of period divided by Revenue for the period, multiplied by number of days in the period.
Earnings per share (EPS)
Profit after tax divided by the weighted average number of shares on issue during the period.
EBIT Earnings before interest and tax.
EBITDA Earnings before interest, tax, depreciation and amortisation.
Gross Operating Revenue (GOR)
Net Revenue less cost of sales and the write-down of inventory
Inventory days Inventory at the end of period divided by Cost of Sales for the period, multiplied by number of days in the period.
Net Debt : EBITDA Ratio of net debt at period end to EBITDA for the Consolidated Group for 12 months. EBITDA for this ratio includes 12 months of pro-forma earnings for acquired entities.
Return on Capital Employed (ROCE)
Measured as earnings before interest, tax and amortisation of finite life intangibles for the prior 12 month period divided by closing capital employed (including a pro-rata adjustment for entities acquired).
Revenue Net Revenue from the sale of goods and the rendering of services.
www.ebosgroup.com