EAZY: A FAST, PUBLIC PHOTOMETRIC REDSHIFT CODE · EAZY: A FAST, PUBLIC PHOTOMETRIC REDSHIFT CODE...
13
Accepted to The Astrophysical Journal Preprint typeset using L A T E X style emulateapj v. 03/07/07 EAZY: A FAST, PUBLIC PHOTOMETRIC REDSHIFT CODE Gabriel B. Brammer 1 , Pieter G. van Dokkum 1 , and Paolo Coppi 1 Accepted to The Astrophysical Journal ABSTRACT We describe a new program for determining photometric redshifts, dubbed EAZY. The program is optimized for cases where spectroscopic redshifts are not available, or only available for a biased subset of the galaxies. The code combines features from various existing codes: it can fit linear combinations of templates, it includes optional flux- and redshift-based priors, and its user interface is modeled on the popular HYPERZ code. A novel feature is that the default template set, as well as the default functional forms of the priors, are not based on (usually highly biased) spectroscopic samples, but on semi-analytical models. Furthermore, template mismatch is addressed by a novel rest-frame template error function. This function gives different wavelength regions different weights, and ensures that the formal redshift uncertainties are realistic. We introduce a redshift quality parameter, Q z , that provides a robust estimate of the reliability of the photometric redshift estimate. Despite the fact that EAZY is not ”trained” on spectroscopic samples, the code (with default parameters) performs very well on existing public datasets. For K-selected samples in CDF-South and other deep fields we find a 1σ scatter in Δz/(1 + z ) of 0.034, and we provide updated photometric redshift catalogs for the FIRES, MUSYC, and FIREWORKS surveys. Subject headings: cosmology: observations — galaxies: evolution — galaxies: formation 1. INTRODUCTION Accurate redshifts of distant galaxies are crucial for nearly all of observational cosmology. Whereas exten- sive spectroscopy with multi-object spectrographs on 8- 10m class telescopes has yielded redshifts for thousands, and in some cases tens of thousands, of galaxies (e.g., Steidel et al. 2003; Davis et al. 2003; Le F` evre et al. 2005), these galaxies tend to be relatively bright at opti- cal wavelengths. For galaxies fainter than R ∼ 25 we rely almost exclusively on photometric redshifts, derived from fitting template spectra to broad- or medium-band pho- tometry (e.g., Lanzetta, Yahil, & Fern´ andez-Soto 1996; Wolf et al. 2003; Franx et al. 2003; Mobasher et al. 2004; Drory et al. 2005). This situation is not likely to change, even with the advent of efficient spectrographs with very wide fields (such as WFMOS; Bassett, Nichol, & Eisenstein 2005), multi-object capabilities in the near- infrared (e.g., MOIRCS; Ichikawa et al. 2006), or larger telescopes. The signal-to-noise ratio (S/N) per resolution element in the continuum decreases with spectral resolu- tion as S/N ∝ R -0.5 for a given exposure time. There- fore, the required integration time to maintain a given S/N per resolution element increases linearly with the spectral resolution, quite independent of the details of the telescope and instruments. As a typical set of broad band filters corresponds to R ∼ 5 and typical faint ob- ject spectrographs have R ∼ 1000, spectroscopy is about two orders of magnitude more time consuming than pho- tometry for a given telescope size. A notable exception is spectroscopy of emission line objects, which can be extremely efficient at faint magnitudes. The methodology for determining photometric red- shifts using the template-fitting approach is essentially straightforward: the photometric data are compared to synthetic photometry for a large range of template spec- 1 Department of Astronomy, Yale University, New Haven, CT 06520-8101 tra and redshifts, and the most likely redshift follows from a statistical analysis of the differences between ob- served and synthetic data. Several codes exist that per- form this task, each employing its own techniques for creating the synthetic photometry and interpreting the residuals in the redshift – template plane. Popular ex- amples include HYPERZ (Bolzonella, Miralles, & Pell´o 2000), ImpZ (Babbedge et al. 2004), and Le PHARE 2 (Arnouts & Ilbert), which do a straightforward χ 2 min- imization; GREGZ 3 (Rudnick et al. 2001, 2003), which allows linear combinations of templates and uses Monte Carlo methods to determine the redshift uncertainties; BPZ (Ben´ ıtez 2000), which uses Bayesian statistics allow- ing the use of priors; and ZEBRA (Feldmann et al. 2006) and kcorrect (Blanton & Roweis 2007; hereafter BR07), which include (distinct) iterative template-optimization routines that make use of the extensive spectroscopic databases of the zCOSMOS (Lilly et al. 2006) and Sloane Digital Sky Survey (SDSS; York et al. 2000) projects, re- spectively. For obvious reasons photometric redshifts benefit from having high quality photometry in many bandpasses and from sampling strong continuum features in the observed wavelength region (such as a Lyman or Balmer break), irrespective of the methodology. However, given a set of objects with good quality photometry, the aspect that is of paramount importance for obtaining reliable photo- metric redshifts is the selection of the template set (see Feldmann et al. 2006, §2.2). Feldmann et al. (2006) obtain very good results by iteratively adapting the tem- plates, minimizing the systematic differences between the best fitting templates and the actual galaxy photometry. This approach not only reduces the random uncertainty in the photometric redshifts but can also eliminate sys- 2 http://www.oamp.fr/people/arnouts/LE PHARE.html 3 Greg Rudnick did not name his code; the name GREGZ is used for convenience in the present paper.
Transcript of EAZY: A FAST, PUBLIC PHOTOMETRIC REDSHIFT CODE · EAZY: A FAST, PUBLIC PHOTOMETRIC REDSHIFT CODE...

Accepted to The Astrophysical JournalPreprint typeset using LATEX style emulateapj v. 03/07/07
EAZY: A FAST, PUBLIC PHOTOMETRIC REDSHIFT CODE
Gabriel B. Brammer1, Pieter G. van Dokkum1, and Paolo Coppi1
Accepted to The Astrophysical Journal
ABSTRACT
We describe a new program for determining photometric redshifts, dubbed EAZY. The program isoptimized for cases where spectroscopic redshifts are not available, or only available for a biased subsetof the galaxies. The code combines features from various existing codes: it can fit linear combinationsof templates, it includes optional flux- and redshift-based priors, and its user interface is modeled onthe popular HYPERZ code. A novel feature is that the default template set, as well as the defaultfunctional forms of the priors, are not based on (usually highly biased) spectroscopic samples, but onsemi-analytical models. Furthermore, template mismatch is addressed by a novel rest-frame templateerror function. This function gives different wavelength regions different weights, and ensures thatthe formal redshift uncertainties are realistic. We introduce a redshift quality parameter, Qz, thatprovides a robust estimate of the reliability of the photometric redshift estimate. Despite the factthat EAZY is not ”trained” on spectroscopic samples, the code (with default parameters) performsvery well on existing public datasets. For K-selected samples in CDF-South and other deep fields wefind a 1σ scatter in ∆z/(1+ z) of 0.034, and we provide updated photometric redshift catalogs for theFIRES, MUSYC, and FIREWORKS surveys.Subject headings: cosmology: observations — galaxies: evolution — galaxies: formation
1. INTRODUCTION
Accurate redshifts of distant galaxies are crucial fornearly all of observational cosmology. Whereas exten-sive spectroscopy with multi-object spectrographs on 8-10m class telescopes has yielded redshifts for thousands,and in some cases tens of thousands, of galaxies (e.g.,Steidel et al. 2003; Davis et al. 2003; Le Fevre et al.2005), these galaxies tend to be relatively bright at opti-cal wavelengths. For galaxies fainter than R ∼ 25 we relyalmost exclusively on photometric redshifts, derived fromfitting template spectra to broad- or medium-band pho-tometry (e.g., Lanzetta, Yahil, & Fernandez-Soto 1996;Wolf et al. 2003; Franx et al. 2003; Mobasher et al.2004; Drory et al. 2005). This situation is not likely tochange, even with the advent of efficient spectrographswith very wide fields (such as WFMOS; Bassett, Nichol,& Eisenstein 2005), multi-object capabilities in the near-infrared (e.g., MOIRCS; Ichikawa et al. 2006), or largertelescopes. The signal-to-noise ratio (S/N) per resolutionelement in the continuum decreases with spectral resolu-tion as S/N ∝ R−0.5 for a given exposure time. There-fore, the required integration time to maintain a givenS/N per resolution element increases linearly with thespectral resolution, quite independent of the details ofthe telescope and instruments. As a typical set of broadband filters corresponds to R ∼ 5 and typical faint ob-ject spectrographs have R ∼ 1000, spectroscopy is abouttwo orders of magnitude more time consuming than pho-tometry for a given telescope size. A notable exceptionis spectroscopy of emission line objects, which can beextremely efficient at faint magnitudes.
The methodology for determining photometric red-shifts using the template-fitting approach is essentiallystraightforward: the photometric data are compared tosynthetic photometry for a large range of template spec-
1 Department of Astronomy, Yale University, New Haven, CT06520-8101
tra and redshifts, and the most likely redshift followsfrom a statistical analysis of the differences between ob-served and synthetic data. Several codes exist that per-form this task, each employing its own techniques forcreating the synthetic photometry and interpreting theresiduals in the redshift – template plane. Popular ex-amples include HYPERZ (Bolzonella, Miralles, & Pello2000), ImpZ (Babbedge et al. 2004), and Le PHARE 2
(Arnouts & Ilbert), which do a straightforward χ2 min-imization; GREGZ3 (Rudnick et al. 2001, 2003), whichallows linear combinations of templates and uses MonteCarlo methods to determine the redshift uncertainties;BPZ (Benıtez 2000), which uses Bayesian statistics allow-ing the use of priors; and ZEBRA (Feldmann et al. 2006)and kcorrect (Blanton & Roweis 2007; hereafter BR07),which include (distinct) iterative template-optimizationroutines that make use of the extensive spectroscopicdatabases of the zCOSMOS (Lilly et al. 2006) and SloaneDigital Sky Survey (SDSS; York et al. 2000) projects, re-spectively.
For obvious reasons photometric redshifts benefit fromhaving high quality photometry in many bandpasses andfrom sampling strong continuum features in the observedwavelength region (such as a Lyman or Balmer break),irrespective of the methodology. However, given a set ofobjects with good quality photometry, the aspect thatis of paramount importance for obtaining reliable photo-metric redshifts is the selection of the template set (seeFeldmann et al. 2006, §2.2). Feldmann et al. (2006)obtain very good results by iteratively adapting the tem-plates, minimizing the systematic differences between thebest fitting templates and the actual galaxy photometry.This approach not only reduces the random uncertaintyin the photometric redshifts but can also eliminate sys-
2 http://www.oamp.fr/people/arnouts/LE PHARE.html3 Greg Rudnick did not name his code; the name GREGZ is
used for convenience in the present paper.

2 EAZY
tematic effects in certain redshift ranges (see Feldmannet al. 2006). The disadvantage of this optimization isthat its effects can only be assessed when a large sampleof galaxies with spectroscopic redshifts is available, andwhen this sample is a random subset of the entire pho-tometric sample. This assumption may be valid in thecase of zCOSMOS, but this is generally not the case instudies of galaxy samples which are significantly fainterthan the spectroscopic limit.
In this paper we describe a new photometric redshiftcode which was written specifically for samples with in-complete and/or biased spectroscopic information (suchas, for example, faint K-selected samples). Rather thanminimizing the scatter in the relation between photo-metric and spectroscopic redshift using the spectroscopicsample as a training set, a user-defined template er-ror function is introduced to account for wavelength-dependent template mismatch. The code combines fea-tures from various existing programs: the possibilityof fitting linear combinations of templates (as done inGREGZ), the use of priors (as first done in BPZ), anda user-friendly interface based on HYPERZ. The defaulttemplate set and the redshift-magnitude priors are de-rived from semi-analytical models. These models are,of course, only an approximation of reality, but their“perfect” completeness down to very faint magnitudesoutweighs their imperfect representation of the real Uni-verse.
The outline of this paper is as follows. In §2 we de-scribe the implementation of the code, including the op-timized template set and redshift priors derived fromsemi-analytical models and the template error functionderived from the GOODS-CDFS photometric catalog. In§3 we test the code on a combined photometric catalogfrom a variety of deep multi-wavelength surveys and com-pare the photometric redshifts to spectroscopic redshiftsof nearly 2000 galaxies at 0 < z < 4. In §4 we discussthe reliability of the photometric redshift estimates andprovide cautionary examples for relying solely on spec-troscopic samples to estimate the photometric redshiftquality. Finally, in §5 we summarize the features andperformance of the photometric redshift code and dis-cuss future avenues for improvement.
2. IMPLEMENTATION
2.1. Basic Algorithm
The basic algorithm is similar to many existing pho-tometric redshift codes. The algorithm steps through auser-defined grid of redshifts, and at each redshift findsthe best fitting synthetic template spectrum by minimiz-ing
χ2z,i =
Nfilt∑
j=1
(Tz,i,j − Fj)2
(δFj)2 , (1)
with Nfilt the number of filters, Tz,i,j the synthetic flux oftemplate i in filter j for redshift z, Fj the observed fluxin filter j, and δFj the uncertainty in Fj . Templates arecorrected for absorption by intervening H I clouds fol-lowing the Madau (1995) prescription. The template fitis done in linear space, as this allows a proper treatmentof flux errors and of negative flux measurements.
In most photometric redshift codes (e.g., HYPERZ,
Fig. 1.— Distribution of K magnitudes of 104 galaxies fromour simulated lightcone catalog. The K-band number counts ofthe two deep fields from the FIRES survey (Labbe et al. 2003;Forster Schreiber et al. 2006) are shown for comparison, scaled bythe ratio of the number of galaxies with Ks < 23.5 in these fieldscompared to the lightcone catalog.inset: Redshift distribution ofthe galaxies in the lightcone catalog. The widths of the shadedFIRES distributions and the error bars on the histograms are thepoisson-like errors for small numbers calculated following Gehrels(1986). The simulated number counts are generally consistent withthe observed values to within a factor of ∼2. The simulated cat-alog provides a unique template calibration set that is completeat the limiting magnitudes characteristic of deep imaging surveys,and that includes thousands of galaxies at z > 2 where observedspectroscopic samples are sparse.
BPZ, ZEBRA) each template Ti is a single-componentempirical or synthetic spectral energy distribution(SED). However, in practice many galaxies are not wellrepresented by any individual template from the user-supplied library, and as a result template mismatch is theprimary source of error in photometric redshift estimates.In ZEBRA, the detailed form of each template is adaptediteratively based on residuals from fits to galaxies withspectroscopic redshifts. Instead, we follow GREGZ andallow linear combinations of templates. Rather than find-ing the best-fitting template Ti the code finds the best-fitting coefficients, αi, in
Tz =
Ntemp∑
i=1
αiTz,i, (2)
with all αi ≥ 0. The number of template componentsfit simultaneously is one, two, or all of the templates ina user-defined list. For the one- and two-template fitsthe coefficients, αi, are determined using analytic least-squares fits, while for the latter option the coefficients forevery template in the library are determined iterativelyfollowing the algorithm of Sha et al. (2007). In practice,the choice between a 2-template fit and an N -templatefit is a trade-off between accuracy and computation time.The improvement going from two templates to N tem-plates can be significant if the number of templates inthe library is small (. 5), but is usually negligible whenthe number of templates is large (& 10).
2.2. Optimized template set
Brammer, van Dokkum & Coppi 3
Fig. 2.— left: Five templates generated following the Blanton & Roweis (2007) algorithm with PEGASE models and a calibration set ofsynthetic photometry derived from semi-analytic models. Shown in grey is the additional young and dusty template added to compensatefor the lack of extremely dusty galaxies in the SAMs. All of the templates are shown normalized at 6000A. middle: “Default” template setof Blanton & Roweis (2007). right: Empirical templates from Coleman, Wu, & Weedman (1980) plus the “SB1” starburst spectrum fromKinney et al. (1996) that are frequently used for photometric redshifts. The templates shown are extended into the NUV and NIR withBruzual & Charlot (2003) models (dashed regions; see, e.g., Rudnick et al. 2001).
The recent significant improvement in the quality ofmaximum-likelihood photometric redshift estimates hascome largely from optimizing the template set that isfit to the broad-band photometry. In practice, the tem-plate set needs to be large enough that it spans the broadrange of multi-band galaxy colors and small enough thatthe color and redshift degeneracies are kept to a mini-mum (e.g. Benıtez 2000). The combined set of empiricalgalaxy templates from Coleman et al. (1980) and Kin-ney et al. (1996) (hereafter, CK) is the most frequentlyused set for photometric redshift measurements BPZ,ZEBRA, Ilbert et al. (2006); Mobasher et al. (2006),and it provides the additional benefit of allowing a roughestimate of an individual galaxy’s spectral type as wellas its redshift. The CK set suffers from a number of dis-advantages, however: it is determined from local galax-ies and is therefore not guaranteed (or expected) to berepresentative of galaxies at high redshift, and the tem-plates need to be extended into the UV and NIR foruse with photometry from modern multi-wavelength sur-veys. Several of the recent photometric redshift effortsaddress the first issue by iteratively adjusting the basisCK templates based on fits to large broad-band photo-metric datasets (ZEBRA, Ilbert et al. (2006), Assef et al.(2007)). While this technique is shown to significantlyimprove the quality of the redshift estimates, it requiresa large spectroscopic redshift calibration sample and re-mains largely unproven at z & 1.5.
We derive a new minimal template set based purely onstellar population synthesis models that is designed fordeep optical-NIR broad-band surveys and that requiresno optimization based on spectroscopic samples. Thetemplate set is calculated following the novel “nonneg-ative matrix factorization” (NMF) algorithm of BR07,which essentially takes a large number, Nin, of syntheticmodels and computes a reduced set of Nout basis tem-plates that best reproduce a supplied broad-band pho-tometric calibration catalog. The Nout basis templatesare non-negative linear combinations of the Nin modelsand can be considered to be the “principal-component”spectral templates of the calibration catalog. For ex-ample, BR07 compute Nout = 5 basis templates froma list of Nin = 485 Bruzual & Charlot (2003) models
that efficiently reproduce a large sample of photometricobservations from the SDSS.
While the SDSS offers precision photometric and spec-troscopic information for a spectacular number of galax-ies, it is limited to the nearby universe – which meansthat templates determined from (or optimized by) SDSSobservations are subject to similar uncertainties when ex-tended to higher redshifts as those of the CK templatesdescribed above. Flux-limited spectroscopic samples arenow available up to R ≈ 24.5 (e.g. DEEP2, Davis et al.2003; VVDS, Le Fevre et al. 2005), but deep imagingsurveys reach well beyond the limits of these spectro-scopic surveys. In order to obtain a calibration samplethat extends to faint magnitudes and high redshifts, weturn to theoretical models of galaxy formation and evolu-tion that are complete to the extent that they reproduceobserved galaxy properties at high redshift. Specifically,we obtain synthetic UBVRIzJHK “photometry” of galax-ies in a 1 deg2 lightcone (Blaizot et al. 2005) created fromgalaxies in the semi-analytic model (SAM) of De Lucia& Blaizot (2007), which is based on the Millennium Sim-ulation (Springel et al. 2005). Synthetic spectral en-ergy distributions (SEDs) are generated from Bruzual& Charlot (2003) models following the non-trivial starformation histories of the galaxies in the semi-analyticmodel. While the models do not exactly reproduce therelative fractions of red and blue galaxies at high red-shift (Marchesini & van Dokkum 2007) and the simpli-fied treatment of dust obscuration is probably inadequate(Kitzbichler & White 2007), the models should containa more representative sample of galaxy SEDs over thebroad redshift range 0 < z . 4 than purely local surveys.For the calibration set of the template optimization rou-tine, we randomly select a subsample of 104 galaxies withKAB < 25 from the lightcone catalog. The redshift andK magnitude distributions of galaxies in the calibrationsample are shown in Figure 1.
For the input list of Nin models to the BR07 NMFalgorithm, we use the library of PEGASE models (Fioc& Rocca-Volmerange 1997) described by Grazian et al.(2006), which those authors use to obtain high-qualityphotometric redshifts over 0 < z < 2 in the GOODS-South field. The library includes Nin ∼ 3000 models with

4 EAZY
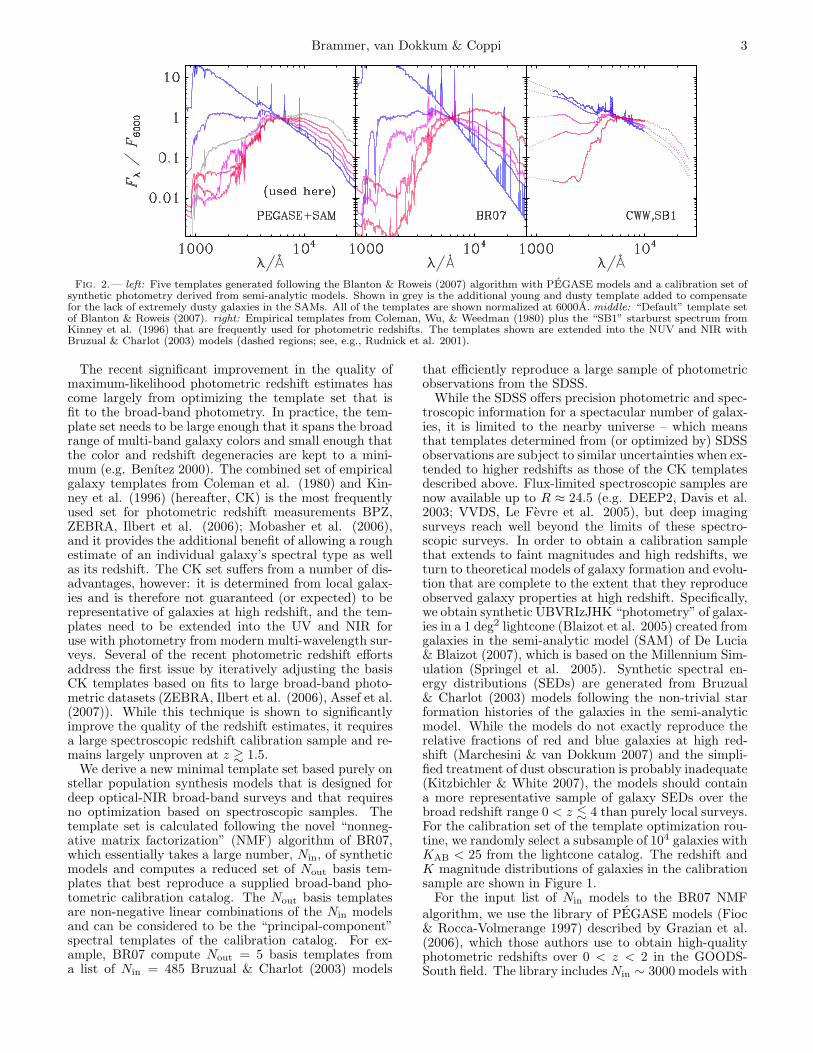
Fig. 3.— top panel: Normalized residuals (∆Fj = Tz,j − Fj) of redshift/template fits to the full GOODS-CDFS photometric catalog(Wuyts et al. 2008), shifted into the rest-frame using the photometric redshifts of each source, estimated using the “NMF” templatesdescribed in §2.2. Only objects with a measured flux in all bands are shown. The dashed line indicates the median of the residual absolutevalues in wavelength bins with widths such that each bin contains ∼2000 data points. bottom panel: Binned residuals (absolute value)shown with the vertical scale expanded. The dashed line is the same as in the top panel. The dot-dashed line is the median photometricerror, σj/Fj , multiplied by a factor of 0.67 to scale the errors from 1-σ (68%) to 50% confidence intervals. We subtract in quadrature themedian photometric error from the median observed residual in each bin to determine the contribution from “template-error” (filled circles).The solid line is our adopted template error function, which has been smoothed and extended into the NUV to avoid a discontinuity atthe Lyman break. We extend the error function beyond the longest wavelength bin to have σTE = 1.0 at λ = 10 µm to account for thepresence of dust emission in the NIR that is not included in the templates.
ages between 1 Myr and 20 Gyr and having a variety ofstar formation histories including exponentially decreas-ing star formation rates characterized by the exponentialdecay rate, τ∗, and constant star formation models thatare truncated. Roughly half of the models in the libraryare constant star formation models with additional red-dening [0.5 ≤ E(B − V ) ≤ 1.1] applied using the extinc-tion curve of Calzetti et al. (2000), which are designed
to represent young, dusty objects. PEGASE models pro-vide a self-consistent treatment of emission lines, whichare not included in the Bruzual & Charlot (2003) models.Though the synthetic photometry in the lightcone cata-log does not include emission lines, we use the PEGASEtemplate set with and without emission lines and findslightly better results with the output templates whenemission lines are included.
The final Nout = 5 templates computed from the indi-vidual PEGASE templates as fit to the lightcone catalogare shown in Figure 2, along with the BR07 and CK tem-plate sets for comparison. The two NMF-derived tem-plate sets span a larger range of optical-NIR colors thanthe CK set, and the NMF templates contain more infor-mation in the NUV than the simple power-law extrapo-lations of the CK set. The higher spectral resolution ofthe pure-model NMF templates is not likely to affect pho-tometric redshift estimates, but more realistic colors inthe rest-UV should be important as optical filters samplethis portion of the SED at moderate redshift, z & 1. Theprimary difference between the BR07 template set andthe set derived here is the presence of the dusty (and old)template that is the reddest template in the BR07 set.Though there are models with significant dust absorp-
tion in the PEGASE library, the NMF algorithm doesnot require a dusty template to fit the lightcone photo-metric catalog. This is likely due to the fact that thesimple dust prescription in the lightcone model is unableto produce any extremely dusty galaxies. Therefore weadd a dusty starburst model (t = 50 Myr, AV = 2.75) tothe set of 5 NMF-derived templates to compensate forthe lack of dusty galaxies in the SAM calibration sample(Figure 2). While the parameters chosen for this addi-tional template are somewhat arbitrary, they are chosensuch that the template fills in regions of the rest-framecolor space not sampled by the 5 NMF-derived templates(Figure 2). In §3 we compute photometric redshifts fora variety of publicly available optically- and K-selectedphotometric survey fields and we compare the quality ofredshifts estimated using these three template sets.
2.3. The template error function
Multi-wavelength surveys frequently sample rest-framewavelengths from the UV to the near-IR for galaxiesat z . 4, and the quality of the calibration of pop-ulation synthesis models is not constant over that fullwavelength range. This can be caused by a number offactors, such as (1) uncertainties in the stellar evolution-ary tracks; (2) transformation of the physical parametersof the models to observable quantities; (3) variations inthe dust extinction law; and (4) stochastic spectral fea-tures that are simply not included in the models. Forexample, relevant to item (1) above, Maraston (2005)find that short-lived thermally-pulsating asymptotic gi-ant branch stars, which had not been previously properlyincluded in isochrone synthesis models, can contributesignificantly to the emergent NIR flux from stellar pop-

Brammer, van Dokkum & Coppi 5
ulations younger than ∼1.5 Gyr. Considering item (4),the presence/strength of emission lines depends stronglyon properties of the ISM, which are only loosely coupledto the evolution of stars within a galaxy. For example, inthe extreme case of Lyman-α, Steidel et al. (2000) findequivalent widths ranging over 1–2 orders of magnitudein emission and absorption for a relatively homogeneoussample of Lyman-break galaxies at z ∼ 3.
No single generalized template set could hope to ac-count for all of these uncertainties, and it is therefore nosurprise that corrections to a minimal template set are re-quired to optimize photometric redshifts for a given pho-tometric catalog (e.g. Ilbert et al. 2006). As discussedin §2.2, such optimization requires an extensive calibra-tion set of galaxies with spectroscopically-measured red-shifts, which is often unavailable or at best incompletefor deep imaging surveys. Here we derive a “templateerror function” that seeks to incorporate uncertaintiessuch as those mentioned above into the template fittingalgorithm (Eq. 1). Besides the calibration uncertaintiesdescribed above, any set of individual templates will havedifficulties reproducing the wide variety of star formationhistories and dust extinction in galaxies. To make mat-ters worse, such properties not only vary among galaxiesat a given cosmic epoch, but also vary systematicallywith time (or redshift). Along with allowing for multi-ple linear combinations of individual templates, the tem-plate error function developed here helps to account forthese variations. The exact form of the template errorfunction depends on the chosen set of templates, but itis computed in such a way that it generally applicableespecially when no spectroscopic calibration sample isavailable.
The template error function is derived in the followingway. First, photometric redshifts are determined with auniform template error function (set at a constant 0.05mag; see, e.g., Rudnick et al. 2001), for the photometriccatalog of the GOODS-CDFS field described by Wuytset al. (2008). We use the CDFS because it provides thedeepest survey with extensive multi-wavelength coveragethat includes the NIR IRAC bands.4 Next, we calculatethe residuals from the best-fitting model spectra and de-redshift them into the rest-frame. These residuals areshown in the top panel of Fig. 3 (after several iterations).The binned median absolute values of these residuals areshown by the solid symbols in the bottom panel of Fig.3, along with a smoothly varying function that is fit tothe solid symbols (dashed line). Finally, the templateerror function (solid line) is created by subtracting inquadrature the (scaled) photometric errors (indicated bythe dot-dashed line) from this smoothly varying function.The procedure is repeated until convergence is reached.
The residuals in Figure 3 are only shown for bands withsignal-to-noise (S/N) > 10. To test whether the derivederror function depends on the S/N of the flux measure-ments, we also compute the template error for differentlimits 3 > S/N > 20. The sizes of the median resid-uals and photometric errors decrease as the S/N limit
4 Since we wish to determine how well the PEGASE templateset matches observed data, we cannot use the synthetic lightconephotometry as that would only illustrate differences between SEDs
produced by the PEGASE and Bruzual & Charlot (2003) popula-tion synthesis codes.
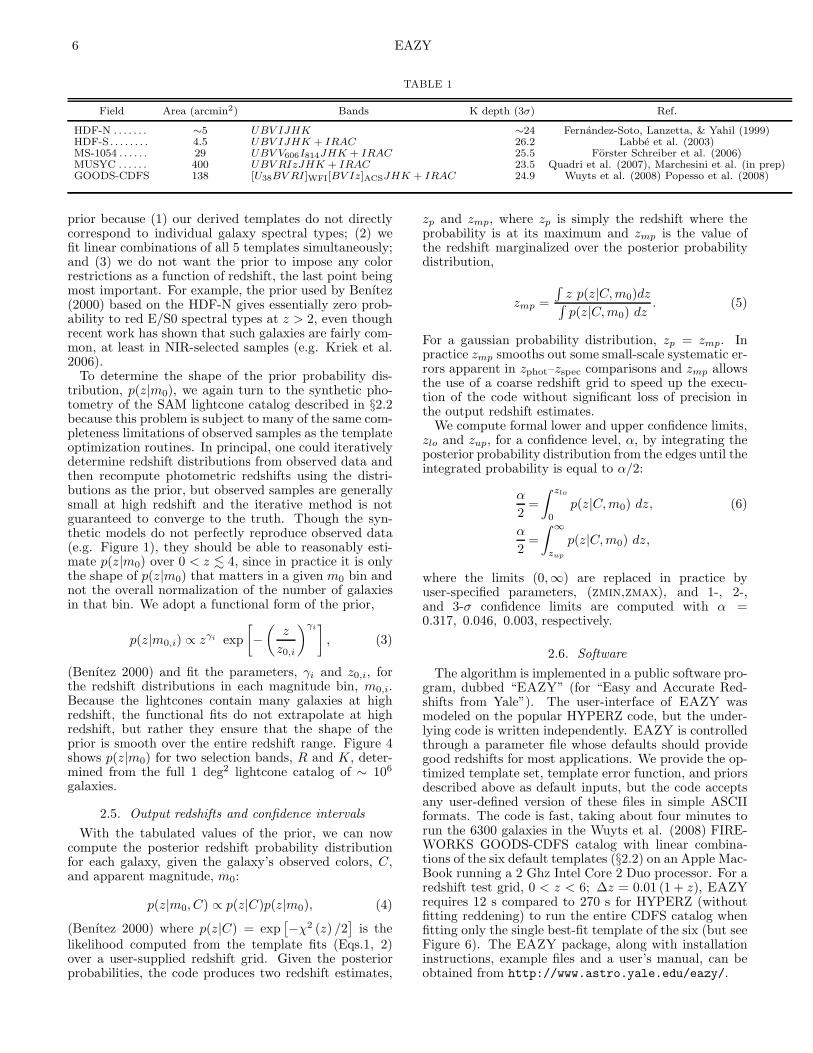
Fig. 4.— Prior probabilities, p(z|m0), a function of observed Rand K (AB) magnitudes. The shape of the priors is given by themodel redshift distributions of galaxies in the lightcone catalog,normalized to
R
p(z|m0 dz = 1.
increases, but we find that the quadratic difference ofthe two remains mostly unchanged. The shape of thetemplate error function roughly follows what one mightexpect following the considerations enumerated above:the template error is lowest in the rest frame optical,λ =3500 A– 9000 A, where stellar isochrones are well-calibrated; the template error is large in the UV wheredust extinction is strongest and most variable; and thetemplate error increases again in the NIR where the stel-lar isochrones are uncertain (e.g. Maraston 2005) andwhere thermal dust emission and stochastic PAH linefeatures begin to appear at λ > 3µm.
2.4. Bayesian Prior
The template-fitting method of estimating photomet-ric redshifts suffers from the fact that template colors arefrequently degenerate with redshift, such that the red-shift probability distributions can have multiple peaksover a broad range of redshifts. For example, relativelyfeatureless blue SEDs can often be fit equally well atz = 0 and z ∼ 3 because the templates are unable to dis-tinguish blue colors redward of the Balmer and Lymanbreaks, respectively. The degeneracies can sometimes bebroken by adding additional photometric bands (in theprevious example, adding IRAC photometry helps) or byincorporating statistical methods to help choose betweenmultiple probability peaks at different redshifts.
Benıtez (2000) was the first to develop a Bayesian ap-proach to estimating photometric redshifts that includesthe use of a Bayesian prior, which adds additional in-formation besides the observed photometric colors tohelp constrain the redshift estimates. Following Benıtez(2000), we adopt an apparent magnitude prior, p(z|m0),which is the redshift distribution of galaxies with appar-ent magnitude, m0. This is essentially a “luminosity-function-times-volume” prior that assigns a low proba-bility to very low redshifts where the volume sampled issmall and a similarly low probability of finding extremelybright galaxies at high redshift. In contrast to Benıtez(2000), we do not include spectral (template) type in the
6 EAZY
TABLE 1
Field Area (arcmin2) Bands K depth (3σ) Ref.
HDF-N . . . . . . . ∼5 UBV IJHK ∼24 Fernandez-Soto, Lanzetta, & Yahil (1999)HDF-S . . . . . . . . 4.5 UBV IJHK + IRAC 26.2 Labbe et al. (2003)MS-1054 . . . . . . 29 UBV V606I814JHK + IRAC 25.5 Forster Schreiber et al. (2006)MUSYC . . . . . . 400 UBV RIzJHK + IRAC 23.5 Quadri et al. (2007), Marchesini et al. (in prep)GOODS-CDFS 138 [U38BV RI]WFI[BV Iz]ACSJHK + IRAC 24.9 Wuyts et al. (2008) Popesso et al. (2008)
prior because (1) our derived templates do not directlycorrespond to individual galaxy spectral types; (2) wefit linear combinations of all 5 templates simultaneously;and (3) we do not want the prior to impose any colorrestrictions as a function of redshift, the last point beingmost important. For example, the prior used by Benıtez(2000) based on the HDF-N gives essentially zero prob-ability to red E/S0 spectral types at z > 2, even thoughrecent work has shown that such galaxies are fairly com-mon, at least in NIR-selected samples (e.g. Kriek et al.2006).
To determine the shape of the prior probability dis-tribution, p(z|m0), we again turn to the synthetic pho-tometry of the SAM lightcone catalog described in §2.2because this problem is subject to many of the same com-pleteness limitations of observed samples as the templateoptimization routines. In principal, one could iterativelydetermine redshift distributions from observed data andthen recompute photometric redshifts using the distri-butions as the prior, but observed samples are generallysmall at high redshift and the iterative method is notguaranteed to converge to the truth. Though the syn-thetic models do not perfectly reproduce observed data(e.g. Figure 1), they should be able to reasonably esti-mate p(z|m0) over 0 < z . 4, since in practice it is onlythe shape of p(z|m0) that matters in a given m0 bin andnot the overall normalization of the number of galaxiesin that bin. We adopt a functional form of the prior,
p(z|m0,i) ∝ zγi exp
[
−
(
z
z0,i
)γi]
, (3)
(Benıtez 2000) and fit the parameters, γi and z0,i, forthe redshift distributions in each magnitude bin, m0,i.Because the lightcones contain many galaxies at highredshift, the functional fits do not extrapolate at highredshift, but rather they ensure that the shape of theprior is smooth over the entire redshift range. Figure 4shows p(z|m0) for two selection bands, R and K, deter-mined from the full 1 deg2 lightcone catalog of ∼ 106
galaxies.
2.5. Output redshifts and confidence intervals
With the tabulated values of the prior, we can nowcompute the posterior redshift probability distributionfor each galaxy, given the galaxy’s observed colors, C,and apparent magnitude, m0:
p(z|m0, C) ∝ p(z|C)p(z|m0), (4)
(Benıtez 2000) where p(z|C) = exp[
−χ2 (z) /2]
is thelikelihood computed from the template fits (Eqs.1, 2)over a user-supplied redshift grid. Given the posteriorprobabilities, the code produces two redshift estimates,
zp and zmp, where zp is simply the redshift where theprobability is at its maximum and zmp is the value ofthe redshift marginalized over the posterior probabilitydistribution,
zmp =
∫
z p(z|C, m0)dz∫
p(z|C, m0) dz. (5)
For a gaussian probability distribution, zp = zmp. Inpractice zmp smooths out some small-scale systematic er-rors apparent in zphot–zspec comparisons and zmp allowsthe use of a coarse redshift grid to speed up the execu-tion of the code without significant loss of precision inthe output redshift estimates.
We compute formal lower and upper confidence limits,zlo and zup, for a confidence level, α, by integrating theposterior probability distribution from the edges until theintegrated probability is equal to α/2:
α
2=
∫ zlo
0
p(z|C, m0) dz, (6)
α
2=
∫
∞
zup
p(z|C, m0) dz,
where the limits (0,∞) are replaced in practice byuser-specified parameters, (zmin,zmax), and 1-, 2-,and 3-σ confidence limits are computed with α =0.317, 0.046, 0.003, respectively.
2.6. Software
The algorithm is implemented in a public software pro-gram, dubbed “EAZY” (for “Easy and Accurate Red-shifts from Yale”). The user-interface of EAZY wasmodeled on the popular HYPERZ code, but the under-lying code is written independently. EAZY is controlledthrough a parameter file whose defaults should providegood redshifts for most applications. We provide the op-timized template set, template error function, and priorsdescribed above as default inputs, but the code acceptsany user-defined version of these files in simple ASCIIformats. The code is fast, taking about four minutes torun the 6300 galaxies in the Wuyts et al. (2008) FIRE-WORKS GOODS-CDFS catalog with linear combina-tions of the six default templates (§2.2) on an Apple Mac-Book running a 2 Ghz Intel Core 2 Duo processor. For aredshift test grid, 0 < z < 6; ∆z = 0.01 (1 + z), EAZYrequires 12 s compared to 270 s for HYPERZ (withoutfitting reddening) to run the entire CDFS catalog whenfitting only the single best-fit template of the six (but seeFigure 6). The EAZY package, along with installationinstructions, example files and a user’s manual, can beobtained from http://www.astro.yale.edu/eazy/.
Brammer, van Dokkum & Coppi 7
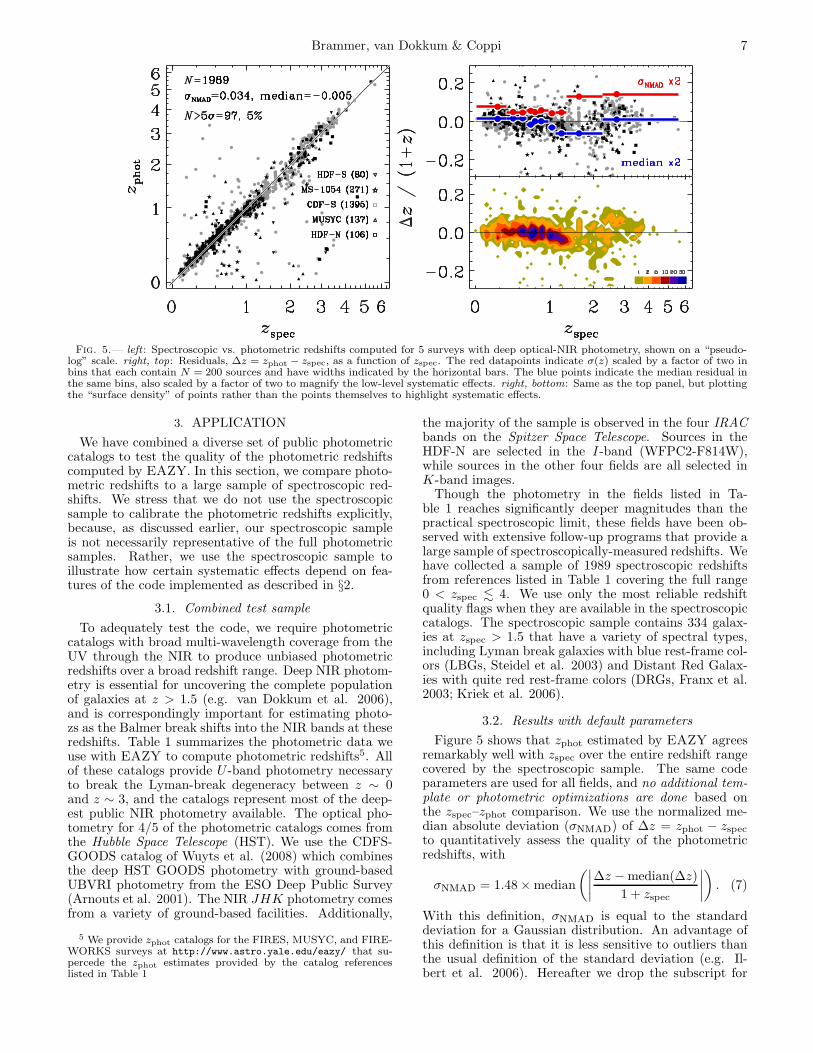
Fig. 5.— left : Spectroscopic vs. photometric redshifts computed for 5 surveys with deep optical-NIR photometry, shown on a “pseudo-log” scale. right, top: Residuals, ∆z = zphot − zspec, as a function of zspec. The red datapoints indicate σ(z) scaled by a factor of two inbins that each contain N = 200 sources and have widths indicated by the horizontal bars. The blue points indicate the median residual inthe same bins, also scaled by a factor of two to magnify the low-level systematic effects. right, bottom: Same as the top panel, but plottingthe “surface density” of points rather than the points themselves to highlight systematic effects.
3. APPLICATION
We have combined a diverse set of public photometriccatalogs to test the quality of the photometric redshiftscomputed by EAZY. In this section, we compare photo-metric redshifts to a large sample of spectroscopic red-shifts. We stress that we do not use the spectroscopicsample to calibrate the photometric redshifts explicitly,because, as discussed earlier, our spectroscopic sampleis not necessarily representative of the full photometricsamples. Rather, we use the spectroscopic sample toillustrate how certain systematic effects depend on fea-tures of the code implemented as described in §2.
3.1. Combined test sample
To adequately test the code, we require photometriccatalogs with broad multi-wavelength coverage from theUV through the NIR to produce unbiased photometricredshifts over a broad redshift range. Deep NIR photom-etry is essential for uncovering the complete populationof galaxies at z > 1.5 (e.g. van Dokkum et al. 2006),and is correspondingly important for estimating photo-zs as the Balmer break shifts into the NIR bands at theseredshifts. Table 1 summarizes the photometric data weuse with EAZY to compute photometric redshifts5. Allof these catalogs provide U -band photometry necessaryto break the Lyman-break degeneracy between z ∼ 0and z ∼ 3, and the catalogs represent most of the deep-est public NIR photometry available. The optical pho-tometry for 4/5 of the photometric catalogs comes fromthe Hubble Space Telescope (HST). We use the CDFS-GOODS catalog of Wuyts et al. (2008) which combinesthe deep HST GOODS photometry with ground-basedUBVRI photometry from the ESO Deep Public Survey(Arnouts et al. 2001). The NIR JHK photometry comesfrom a variety of ground-based facilities. Additionally,
5 We provide zphot catalogs for the FIRES, MUSYC, and FIRE-WORKS surveys at http://www.astro.yale.edu/eazy/ that su-percede the zphot estimates provided by the catalog referenceslisted in Table 1
the majority of the sample is observed in the four IRACbands on the Spitzer Space Telescope. Sources in theHDF-N are selected in the I -band (WFPC2-F814W),while sources in the other four fields are all selected inK-band images.
Though the photometry in the fields listed in Ta-ble 1 reaches significantly deeper magnitudes than thepractical spectroscopic limit, these fields have been ob-served with extensive follow-up programs that provide alarge sample of spectroscopically-measured redshifts. Wehave collected a sample of 1989 spectroscopic redshiftsfrom references listed in Table 1 covering the full range0 < zspec . 4. We use only the most reliable redshiftquality flags when they are available in the spectroscopiccatalogs. The spectroscopic sample contains 334 galax-ies at zspec > 1.5 that have a variety of spectral types,including Lyman break galaxies with blue rest-frame col-ors (LBGs, Steidel et al. 2003) and Distant Red Galax-ies with quite red rest-frame colors (DRGs, Franx et al.2003; Kriek et al. 2006).
3.2. Results with default parameters
Figure 5 shows that zphot estimated by EAZY agreesremarkably well with zspec over the entire redshift rangecovered by the spectroscopic sample. The same codeparameters are used for all fields, and no additional tem-plate or photometric optimizations are done based onthe zspec–zphot comparison. We use the normalized me-dian absolute deviation (σnmad) of ∆z = zphot − zspec
to quantitatively assess the quality of the photometricredshifts, with
σnmad = 1.48 × median
(∣
∣
∣
∣
∆z − median(∆z)
1 + zspec
∣
∣
∣
∣
)
. (7)
With this definition, σnmad is equal to the standarddeviation for a Gaussian distribution. An advantage ofthis definition is that it is less sensitive to outliers thanthe usual definition of the standard deviation (e.g. Il-bert et al. 2006). Hereafter we drop the subscript for

8 EAZY
Fig. 6.— Residuals, ∆z = zphot − zspec, for different combinations of input parameters. The scatter, σ, and the number of 5σ outliersare indicated in each panel with the outliers divided into N > 5σ (superscript) and N < −5σ (subscript). left, top: identical to Figure
5. The “best” parameter set fits all of the PEGASE templates simultaneously (§2.2) and includes the template error function (§2.3); left,bottom: Template error not used; center, top: kcorrect templates from Blanton & Roweis (2007); center, bottom: Empirical templates
from Coleman et al. (1980) and Kinney et al. (1996); right, top: Pairs of PEGASE templates, rather than all simultaneously; right, bottom:
Single PEGASE templates.
clarity (σ = σnmad). The scatter, σ, is nearly con-stant as a function of zspec, with σ = 0.034 for the entirespectroscopic sample. The scatter does increase abovezspec > 1.5 where σ = 0.075. Systematic deviationsfrom the zphot = zspec line are very small at most red-shifts, with the exception that zphot underestimates zspec
at z = 1.0−1.4 by ∼5% (median). Figure 5 shows a rela-tively small number of sources that have estimated zphot
very different from zspec. These “catastrophic outliers”(defined here to have ∆z/(1 + z) > 5σ) make up 5%of our spectroscopic sample. We note that we have notperformed any cuts on the spectroscopic sample basedon signal-to-noise or coincidence with X-ray sources thatcould indicate the presence of an AGN, both of whichcould contribute to a poor estimate of zphot. In §4.2 wedescribe how the catastrophic outlier fraction can be de-creased using observables computed from the zphot fit.
3.3. Effects of changing the default parameters
We have computed zphot for the spectroscopic sam-ple using different combinations of input parameters todemonstrate the effects that the features of the code im-plementation (§2) have on the quality of the computedzphot. In a separate paper, E. N. Taylor et al. (in prep)present additional quantitative tests that show not onlyhow the EAZY zphot estimates depend on changing in-put parameters such as the template set, but how thescience results based on those redshifts—specifically theevolution of rest-frame colors and stellar masses of redgalaxies over 0 < z < 2—also vary systematically withdifferent code inputs. The residuals, ∆z, for the differentzphot sets are shown in Figure 6. The “best” reference
parameter set fits the 6 PEGASE NMF templates simul-taneously and includes the template error function. Fig-ure 6b shows the residuals for fits that do not include thetemplate error function; the scatter is somewhat higherthan when the template error is used, and systematic ef-fects appear as a function of zspec. Galaxies at z < 1 havezphot overestimated by 10%. The number of catastrophic
outliers is similar whether or not the template error func-tion is used, though when the template error function isnot used the majority of outliers have zphot >> zspec.This is potentially problematic for science applicationsthat would be adversely affected by bright, low-z galax-ies scattering into high-z samples (e.g. luminosity func-tions). The number of 5σ outliers is nearly constant in allof the panels of Figure 6, however the number of sourceswith ∆z/(1+z) greater than some fixed value, e.g 0.2, issignificantly lower for the best template/parameter set.
Figures 6c,d show residuals for zphot computed us-ing the BR07 and empirical CK template sets, respec-tively. The differences between fits using the PEGASEand BR07 templates are small, though the systematiceffects are somewhat worse when using the BR07 tem-plates: galaxies at zspec > 1.5 have zphot systematicallylow by ∆z ∼ 0.2. The scatter is significantly higherwhen using the empirical templates compared to eithersynthetic template set. The zphot estimated with the em-pirical templates are also systematically underestimatedat 0.5 < zspec < 1.5. This effect has been observed pre-viously in other photometric redshift studies and it hasoften been “cured” by correcting the templates based onthe input photometry (e.g. Feldmann et al. 2006). How-ever, we demonstrate here that our carefully-determinedsynthetic template set (Figure 5) itself greatly reducesthese systematic effects without requiring any additionalcorrections based on spectroscopic calibration samples.
Figures 6e and 6f show residuals for zphot for Ntemp =2 and 1, respectively (Eq. 2), given the 6 templates of the
PEGASE NMF set. The primary effect of fitting multi-ple templates simultaneously is a striking reduction inσ. This technique does not allow for the simple spec-tral classification provided by single-template fits, how-ever the increased precision of the photometric redshiftsshould allow more physical separations of photometricsamples based on, for example, rest frame colors.
Figure 7 shows how the incorporation of the redshift

Brammer, van Dokkum & Coppi 9
Fig. 7.— Effect of the prior. The sources where the prior movedthe maximum likelihood redshift by
˛
˛zprior − zML
˛
˛ > 0.03(1+zspec)are indicated with a large point at zphot = zprior and a tail extend-ing to zphot = zML. The cases where the prior improves zphot areshown in green, and the cases where the prior incorrectly pusheszphot away from zspec are shown in red.
prior affects the zphot estimates. While the prior gener-ally improves zphot, it does not efficiently discriminatebetween multiple probability peaks in all cases. Forexample, there is a handful of galaxies in the spectro-scopic sample at zspec ∼ 3 but with zphot ∼ 0.2 resultingfrom the degeneracy between fitting the Balmer breakat low redshift and the Lyman break at high redshift.The prior breaks this degeneracy for the single case indi-cated, but does not work for the remaining galaxies withdiscrepant zphot. The prior does, however, affect moresources with similar degeneracies from the full photo-metric sample (without zspec). Figure 8 indicates thatthere are “clouds” of sources in zML − zprior space thatfollow the behavior indicated by only one or two sourceswith measured zspec. For example, there is a cloud ofsources with zML ∼ 0.2 and zprior ∼ 3. The galaxies inthis cloud likely have similar colors that all result in thesame redshift degeneracy of the template fits (see, e.g.Oyaizu et al. 2007). If the single source with a mea-sured zspec is representative of this group, than zprior islikely closer to the true redshift for all of the sources inthis group. The opposite could be true for the groupof sources at zML > 3.5 and zprior < 1, where the twosources with zspec indicates that zML is likely a betterestimate of the true redshift than zprior. Nearly all of the“clouds” in Figure 8 have one or two counterparts withmeasured zspec, so such a figure could be used to choosethe optimal zphot estimate for all of the sources in thefull photometric sample.
3.4. Comparison to neural network redshifts
If our assumption that the synthetic photometry ofthe lightcone catalogs is representative of true galaxyphotometry over 0 < z < 4 (§2.2), then the syntheticphotometry could perhaps be used to train a neuralnetwork that could estimate photometric redshifts in-dependently of our template-fitting approach. We use
Fig. 8.— Maximum likelihood zphot vs. zphot after includingthe prior (Eq. 4 for the full photometric sample of galaxies fromthe surveys listed in Table 1. Sources with measured zspec andwhere
˛
˛zprior − zML
˛
˛ > 0.03(1+zspec) are indicated, as in Figure 7.
Here, the tails point from [x, y] =ˆ
zML, zprior
˜
to [zspec, zspec].Therefore, horizontally oriented tails indicate cases where the priorimproves zphot. Cases where zML ∼ zprior but both are differentthan zspec, which would lie along the one-to-one line on the figure,are not shown.
the ANNz code (Collister & Lahav 2004) to train acommittee of five 11:10:10:1 neural networks directly on11-band (UBV RIzJHK + IRAC1, 2) lightcone catalog.The photometric redshifts estimated for the validationsample (a random subset of the lightcone catalog) haveσ ∼ 0.03, indicating that the network training works rea-sonably well. We test the neural network on the observedphotometry of the MUSYC HDFS-1 field, which contains114 spectroscopic redshifts over 0 < z < 3 and whosefilter transmission curves are identical to those used tocompute the synthetic lightcone photometry.
The photometric redshifts estimated by (EAZY,ANNz) have σ = (0.046, 0.100) for the full MUSYC-HDFS spectroscopic sample and σ = (0.075, 0.105) for18 galaxies at zspec > 2. Along with the increased scat-ter, the ANNz photometric redshifts show systematic er-rors that are not seen in the EAZY redshifts. Thesediscrepancies are likely caused by the fact that the neu-ral network technique depends more critically on the as-sumption that the training catalog has identical proper-ties to the full data catalog. For example, Collister &Lahav (2004) point out that ANNz is able to account forthe internal redenning of SDSS galaxies in their train-ing and validation samples, but if the dust model of thelightcones is incorrect, the neural networks trained onthem will have systematic problems matching real obser-vations. These sorts of problems also affect the template-fitting approach, though our additional dusty templateand the template error function are designed to addresssuch systematic uncertainties.
4. RELIABILITY OF PHOTOMETRIC REDSHIFTS
4.1. Confidence intervals

10 EAZY
We can assess how well the confidence intervals com-puted by Eq. 7 reflect the zphot uncertainties by observ-ing how often the measured zspec falls within the inter-val. For example, 41% of sources have zspec outside ofthe 68% confidence interval, while 32% are expected .In general, however, zspec lies close to the edge of theconfidence intervals, and expanding the 68% confidenceinterval by a factor of only 0.01 × (1 + zspec) decreasesthe number of discrepant sources to 29%. We find thatthe probability distributions, p(z|C, m0), and thereforethe confidence intervals computed by Eq. 7 for individ-ual sources, are consistent with the zphot distributionsof Monte-Carlo simulations in which we measure zphot
after perturbing the photometric fluxes within their as-sociated uncertainties. In general, we conclude that theconfidence intervals provide a reasonable representationof the uncertainties of the zphot estimates.
4.2. Reliability parameter
There is a small number of sources where zspec lies welloutside even the 99% confidence intervals. These sourcesusually have sharply-peaked probability distributions, sono alternate definition of Eq. 7 (e.g. Fernandez-Sotoet al. 2002) or Monte-Carlo simulations could signif-icantly improve the confidence intervals. Catastrophicoutliers can be caused by (a combination of) a number offactors: (1) intrinsic SEDs that are not well-reproducedby the template set, (2) degeneracies in color-z space thatresult in multiple peaks in p(z)–especially for very bluegalaxies with featureless SEDS–(3) one or more anoma-lous photometric measurements, or (4) simply that thespectroscopic source was incorrectly matched to a pho-tometric source or that the redshift was misidentified inthe spectrum. Quantitative features of the zphot fit canbe used to identify catastrophic outliers caused by oneor more of the problems described above. For example,Benıtez (2000) defines a parameter, p∆z, that representsthe fraction of the total integrated probability that lieswithin ±∆z of the zphot estimate, and is designed to iden-tify sources that have broad and/or multi-modal proba-bility distributions. Mobasher et al. (2006) find that thezphot scatter is an increasing function of a parameter,D95 that is defined as the ratio of the 95% confidenceinterval to (1+zphot). Here we define a parameter, Qz,that is a hybrid of the parameters proposed by Benıtez(2000) and Mobasher et al. (2006), and also includes theχ2 of the template fit:
Qz =χ2
Nfilt − 3
z99up − z99
lo
p∆z=0.2. (8)
The inclusion of χ2 should allow us to address the “catas-trophic” cases (1-3) above. Figure 9 shows the zphot
residuals and σ as a function of Qz. We show Qz–σ forthe spectroscopic sample and also for a simulated sam-ple following Benıtez (2000), where we fit zphot for eachsource in the CDFS photometric catalog; set the tem-plate colors of the fit at zphot to be the new photometriccolors; add photometric scatter following the photomet-ric errors; and finally refit zphot for the new syntheticphotometry. The zphot scatter increases sharply aboveQz = 2 − 3 in both the synthetic and observed spectro-scopic samples. The 5 − σ outlier fraction at Qz > 2(3)is 0.3 (0.4), so quality cuts based on Qz can eliminate
Fig. 9.— Redshift residuals as a function of the redshift qualityparameter, Qz (Eq. 8). The red line indicates σ(Qz), scaled by afactor of 10 so that variations are visible on the plot scale.
a large fraction of the outliers at the expense of a smallnumber of satisfactory zphot estimates. We have verifiedthat quality cuts based on Qz are independent of red-shift, that is, cutting on Qz > 3 does not preferentiallyremove only high-z sources.
4.3. The false security of zphot – zspec plots
We have emphasized that EAZY has been designed toestimate photometric redshifts of galaxies in deep photo-metric surveys that lack representative calibration sam-ples with measured spectroscopic redshifts. Such a situa-tion will be the case for the latest generation of large NIRsurveys that will reach K ∼ 25 (e.g. UKIDSS Lawrenceet al. 2007) and probe galaxies with L⋆ luminosities atz ∼ 3.5 (e.g. Marchesini et al. 2007). Although EAZY(and other codes) performs very well in zphot – zspec plots,many systematic effects are “hidden” in such diagrams.This is implicit in Fig. 8: this Figure demonstrates thatthere are large groups of sources whose photometric red-shifts are very sensitive to the details of the optimizationroutine, but that this behavior is only “sampled” by, at-best, one or two sources with measured zspec. A singleoutlier, such as the object at (zspec = 4.5, zphot = 1.25),might not appear noteworthy in a plot like Figure 7, butit could represent a large number of objects.
We explore this effect further by comparing zphot com-puted for the full CDFS catalog of Wuyts et al. (2008)and for a perturbed version of the same catalog. Forthe perturbed catalog, we add random zeropoint offsetsto each of the photometric bands with a maximum off-set of 5%, and we remove the J-band from the zphot
fit. The zphot for the normal and perturbed catalogsare shown in Figure 10. The small zeropoint offsetscause systematic effects visible as kinks in Figure 10 be-tween 0 < zphot < 1. Without the J-band, the tem-plate fits cannot efficiently isolate the Balmer break at1.5 < z < 2.5, and the degeneracy of the zphot fits atthese redshifts are visible in Figure 10. Now we considerhow these systematic effects are traced by the subsampleof galaxies from a flux-limited spectroscopic survey, inthis case the I < 24 spectroscopic survey of the VVDS

Brammer, van Dokkum & Coppi 11
Fig. 10.— Comparison of zphot computed before and after addingrandom zeropoint errors of up to ∼5% to the CDFS photomet-ric catalog of Wuyts et al. (2008). The full photometric sampleis shown in the greyscale contours, while the red points indicategalaxies with spectroscopic redshifts measured by the VVDS (LeFevre et al. 2005). The contour levels are the same as those inFigure 8.
(Le Fevre et al. 2005). At redshifts where the spectro-scopic survey is complete, here z . 1.5, the spectroscopicsample effectively traces the systematic effects of the fullphotometric sample and the sources with spectroscopicredshifts can be used to calibrate the photometric red-shift algorithms. There are a few galaxies at z > 2 in thespectroscopic sample, but their zphot are nearly identicalfrom both the normal and perturbed photometry. Onewould not be able to distinguish between the two cat-alogs — or similarly between two separate photometricredshift algorithms (Hildebrandt, Wolf, & Benıtez 2008)— if each produces the same zphot estimates, even if thezphot estimates suffer from serious systematic uncertain-ties for sources beyond the flux limits of the spectroscopiccomparison sample.
Similar effects are demonstrated in Fig. 11. Here, wedid not perturb the zeropoints, but mimicked the filterset of the POWIR survey (Conselice et al. 2007), which isone of the largest K-selected surveys to date. Again, thespectroscopic sample (in this case, redshifts down to theDEEP2 limit R < 24.1) would suggest reasonably robustredshifts for either the full CDFS (σ = 0.037) or partialPOWIR (σ = 0.048) filter sets at 1 < z < 2. Consider-ing the entire CDFS photometric sample however, it isapparent that there are significant discrepancies betweenthe two filter combinations at z > 1.25. These degenera-cies have important implications for the interpretation ofhigh-z galaxy samples, for example surface densities intwo bins, 1.5 < z < 2 and 2 < z < 2.5, differ by morethan a factor of 2 depending on the filters used to es-timate zphot. These discrepancies would likely be morepronounced in surveys with limited filter coverage thatare also significantly shallower than the CDFS photom-etry.
5. SUMMARY
Fig. 11.— Comparison of zphot computed for the full CDFSfilter set and for a subset of the filters, BRIJK (the filter set usedin the POWIR survey; Conselice et al. 2007). CDFS sources withmeasured zspec and R < 24.1 corresponding to the limit of theDEEP2 spectroscopic limit are shown in the large red points.
This paper presents a new photometric redshift code,dubbed “EAZY”. The philosophy of the code is differ-ent from other recent photometric redshift codes, in thatit does not aim to minimize the scatter in zphot – zspec
comparisons. This type of minimization works well ifthe spectroscopic sample is a random subset of the pho-tometric sample, but may lead to erroneous results if thespectroscopic sample is biased. In K- or IRAC-selectedsamples the vast majority of objects is very faint in theobserver’s optical (see, e.g. van Dokkum et al. 2006)and the subset of galaxies with a spectroscopic redshiftis highly a-typical. We therefore develop a new templateset (§2.2) based on synthetic photometry of galaxies in asemi-analytic model that is essentially complete at red-shifts significantly beyond the reach of current spectro-scopic surveys. Furthermore, we introduce a “templateerror function” (§2.3) that accounts for both randomand systematic differences between observed photome-try and the templates and minimizes systematic errors inzphot without the need to optimize either the templatesor the photometry based on a spectroscopic calibrationsample. The template set and template error functionprovided here are intended to be generally applicable toNIR-selected samples. With these default parametersand without further optimization, we find that the scat-ter in zphot–zspec diagrams (σ = 0.034) is at least as lowas achieved by other methods and systematic errors areminimal over the full range 0 < z < 4 (§3).
The reliability of the uncertainties in the redshifts isalmost as important as the reliability of the redshiftsthemselves. The uncertainties that our code providesbehave well for galaxies with a spectroscopic redshift (inthe sense that the confidence intervals correctly describethe deviations from the true redshifts), but we cannottest the behavior in the same way for the majority ofobjects without a spectroscopic redshift. Assessing thereliability of photometric redshifts for a sample in whichthe spectroscopic redshifts are not a representative sam-ple of the full photometric sample can be misleading (§4).

12 EAZY
This is especially true when only limited filter coverage isavailable and large systematic effects can be present thatare not clearly traced by the spectroscopic sample. Inpractice, we expect that the “Qz” parameter (§4.2) givesa reasonable indication of the robustness of a redshift.
Progress in the study and interpretation of faint galaxysamples is currently limited by the uncertainties in pho-tometric redshift estimates. What is sorely needed is acomplete set of faint, K-selected galaxies with reliableredshifts, so that photometric redshifts can be bettercalibrated. At relatively bright K-magnitudes progresscan be expected from near-IR spectroscopy, particularlywith multi-object near-IR spectrographs. Initial resultsof such programs already point to problems with somephotometric redshift estimates (Kriek et al. 2008), al-though we note that the Kriek et al. sample is well-fit byEAZY. Deeper samples may be obtained through differ-
ent methods. A program is underway with NEWFIRMon the Kitt Peak 4m telescope to obtain medium bandphotometry for a complete sample of ∼ 105 galaxies withK ≤ 21.5, and this should provide much-needed tests ofthe broad-band results reported in the literature.
The authors are grateful to Gabriella de Lucia andJeremy Blaizot for computing a large set of model galaxymagnitudes for the filters used in this paper and con-structing a set of light-cones specifically designed for ourstudy, which are a critical component of this paper. Wealso thank Stijn Wuyts, Ned Taylor, Rik Williams, andRyan Quadri for extensive tests of early versions of thecode, and Gregory Rudnick and Marijn Franx for valu-able suggestions and comments.
REFERENCES
Arnouts, S., Vandame, B., Benoist, C., Groenewegen, M. A. T.,da Costa, L., Schirmer, M., Mignani, R. P., Slijkhuis, R., et al.2001, A&A, 379, 740
Assef, R. J., Kochanek, C. S., Brodwin, M., Brown, M. J. I.,Caldwell, N., Cool, R. J., Eisenhardt, P., Eisenstein, D., et al.2008, ApJ, 676, 286
Babbedge, T. S. R., Rowan-Robinson, M., Gonzalez-Solares, E.,Polletta, M., Berta, S., Perez-Fournon, I., Oliver, S., Salaman,D. M., et al. 2004, MNRAS, 353, 654
Bassett, B. A., Nichol, B., & Eisenstein, D. J. 2005, Astronomyand Geophysics, 46, 26
Benıtez, N. 2000, ApJ, 536, 571Blaizot, J., Wadadekar, Y., Guiderdoni, B., Colombi, S. T., Bertin,
E., Bouchet, F. R., Devriendt, J. E. G., & Hatton, S. 2005,MNRAS, 360, 159
Blanton, M. R., & Roweis, S. 2007, AJ, 133, 734Bolzonella, M., Miralles, J.-M., & Pello, R. 2000, A&A, 363, 476Bruzual, G., & Charlot, S. 2003, MNRAS, 344, 1000Calzetti, D., Armus, L., Bohlin, R. C., Kinney, A. L., Koornneef,
J., & Storchi-Bergmann, T. 2000, ApJ, 533, 682Coleman, G. D., Wu, C.-C., & Weedman, D. W. 1980, ApJS, 43,
393Collister, A. A. & Lahav, O. 2004, PASP, 116, 345Conselice, C. J., Bundy, K., Trujillo, I., Coil, A., Eisenhardt, P.,
Ellis, R. S., Georgakakis, A., Huang, J., et al. 2007, MNRAS,381, 962
Davis, M., Faber, S. M., Newman, J., Phillips, A. C., Ellis, R. S.,Steidel, C. C., Conselice, C., & et al., X. 2003, in Discoveriesand Research Prospects from 6- to 10-Meter-Class TelescopesII. Edited by Guhathakurta, Puragra. Proceedings of the SPIE,Volume 4834, pp. 161-172 (2003)., ed. P. Guhathakurta, 161–172
De Lucia, G., & Blaizot, J. 2007, MNRAS, 375, 2Drory, N., Salvato, M., Gabasch, A., Bender, R., Hopp, U., Feulner,
G., & Pannella, M. 2005, ApJ, 619, L131Feldmann, R., Carollo, C. M., Porciani, C., Lilly, S. J., Capak, P.,
Taniguchi, Y., Fevre, O. L., Renzini, A., et al. 2006, MNRAS,372, 565
Fernandez-Soto, A., Lanzetta, K. M., & Yahil, A. 1999, ApJ, 513,34
Fernandez-Soto, A., Lanzetta, K. M., Chen, H.-W., Levine, B., &Yahata, N. 2002, MNRAS, 330, 889
Fioc, M., & Rocca-Volmerange, B. 1997, A&A, 326, 950Forster Schreiber, N. M., Franx, M., Labbe, I., Rudnick, G., van
Dokkum, P. G., Illingworth, G. D., Kuijken, K., Moorwood,A. F. M., et al. 2006, AJ, 131, 1891
Franx, M., Labbe, I., Rudnick, G., van Dokkum, P. G., Daddi, E.,Forster Schreiber, N. M., Moorwood, A., Rix, H., et al. 2003,ApJ, 587, L79
Gehrels, N. 1986, ApJ, 303, 336Grazian, A., Fontana, A., de Santis, C., Nonino, M., Salimbeni, S.,
Giallongo, E., Cristiani, S., Gallozzi, S., et al. 2006, A&A, 449,951
Hildebrandt, H., Wolf, C., & Benıtez, N. 2008, A&A, 480, 703Ichikawa, T., Suzuki, R., Tokoku, C., Uchimoto, Y. K., Konishi, M.,
Yoshikawa, T., Yamada, T., Tanaka, I., et al. 2006, in Ground-based and Airborne Instrumentation for Astronomy. Edited byMcLean, Ian S.; Iye, Masanori. Proceedings of the SPIE, Volume6269, pp. 626916 (2006).
Ilbert, O., Arnouts, S., McCracken, H. J., Bolzonella, M., Bertin,E., Le Fevre, O., Mellier, Y., Zamorani, G., et al. 2006, A&A,457, 841
Kinney, A. L., Calzetti, D., Bohlin, R. C., McQuade, K., Storchi-Bergmann, T., & Schmitt, H. R. 1996, ApJ, 467, 38
Kitzbichler, M. G., & White, S. D. M. 2007, MNRAS, 376, 2Kriek, M., van Dokkum, P. G., Franx, M., Forster Schreiber, N. M.,
Gawiser, E., Illingworth, G. D., Labbe, I., Marchesini, D., et al.2006, ApJ, 645, 44
Kriek, M., van Dokkum, P. G., Franx, M., Illingworth, G. D.,Marchesini, D., Quadri, R., Rudnick, G., Taylor, E. N., et al.2008, ApJ, 677, 219
Labbe, I., Franx, M., Rudnick, G., Schreiber, N. M. F., Rix, H.,Moorwood, A., van Dokkum, P. G., van der Werf, P., et al. 2003,AJ, 125, 1107
Lanzetta, K. M., Yahil, A., & Fernandez-Soto, A. 1996, Nature,381, 759
Lawrence, A., Warren, S. J., Almaini, O., Edge, A. C., Hambly,N. C., Jameson, R. F., Lucas, P., Casali, M., et al. 2007, MNRAS,379, 1599
Le Fevre, O., Vettolani, G., Garilli, B., Tresse, L., Bottini, D., LeBrun, V., Maccagni, D., Picat, J. P., et al. 2005, A&A, 439, 845
Lilly, S. J., Le Fevre, O., Renzini, A., Zamorani, G., Scodeggio,M., Contini, T., Carollo, C. M., Hasinger, G., et al. 2007, ApJS,172, 70
Madau, P. 1995, ApJ, 441, 18Maraston, C. 2005, MNRAS, 362, 799Marchesini, D., van Dokkum, P., Quadri, R., Rudnick, G., Franx,
M., Lira, P., Wuyts, S., Gawiser, E., et al. 2007, ApJ, 656, 42Marchesini, D., & van Dokkum, P. G. 2007, ApJ, 663, L89Mobasher, B., Capak, P., Scoville, N. Z., Dahlen, T., Salvato, M.,
Aussel, H., Thompson, D. J., Feldmann, R., et al. 2007, ApJS,172, 117
Mobasher, B., Idzi, R., Benıtez, N., Cimatti, A., Cristiani, S.,Daddi, E., Dahlen, T., & et al., 2004, ApJ, 600, L167
Oyaizu, H., Lima, M., Cunha, C. E., Lin, H., & Frieman, J. 2007,ArXiv e-prints, 711
Popesso, P., Dickinson, M., Nonino, M., Vanzella, E., Daddi, E.,Fosbury, R. A. E., Kuntschner, H., Mainieri, V., et al. 2008,ArXiv e-prints, 802
Quadri, R., Marchesini, D., van Dokkum, P., Gawiser, E., Franx,M., Lira, P., Rudnick, G., Urry, C. M., et al. 2007, AJ, 134, 1103
Rudnick, G., Franx, M., Rix, H., Moorwood, A., Kuijken, K., vanStarkenburg, L., van der Werf, P., Rottgering, H., et al. 2001,AJ, 122, 2205
Rudnick, G., Rix, H., Franx, M., Labbe, I., Blanton, M., Daddi,E., Forster Schreiber, N. M., Moorwood, A., et al. 2003, ApJ,599, 847
Sha, F., Lin, Y., Saul, L. K., & Lee, D. D. 2007, NeuralComputation, 19, 2004
Springel, V., White, S. D. M., Jenkins, A., Frenk, C. S., Yoshida,N., Gao, L., Navarro, J., Thacker, R., et al. 2005, Nature, 435,629
Steidel, C. C., Adelberger, K. L., Shapley, A. E., Pettini, M.,Dickinson, M., & Giavalisco, M. 2000, ApJ, 532, 170
Steidel, C. C., Adelberger, K. L., Shapley, A. E., Pettini, M.,Dickinson, M., & Giavalisco, M. 2003, ApJ, 592, 728
van Dokkum, P. G., Quadri, R., Marchesini, D., Rudnick, G.,Franx, M., Gawiser, E., Herrera, D., Wuyts, S., et al. 2006, ApJ,638, L59
Wolf, C., Meisenheimer, K., Rix, H.-W., Borch, A., Dye, S., &Kleinheinrich, M. 2003, A&A, 401, 73
Wuyts, S., Labbe, I., Forster Schreiber, N. M., Franx, M., Rudnick,G., Brammer, G. B., & van Dokkum, P. G. 2008, ArXiv e-prints,804

Brammer, van Dokkum & Coppi 13
York, D. G., Adelman, J., Anderson, J. E., Anderson, S. F., Annis,J., Bahcall, N. A., Bakken, J. A., & et al. 2000, AJ, 120, 1579