EATON VANCE CORP - AnnualReports.com · James M. Salois Eric S. Robertson Ryan B. Landers William...
76
EATON V ANCE CORP . 2007 ANNUAL REPORT
-
Upload
duongduong -
Category
Documents
-
view
224 -
download
0
Transcript of EATON VANCE CORP - AnnualReports.com · James M. Salois Eric S. Robertson Ryan B. Landers William...

Eaton Vance Corp. Elsie A. Flaherty Patricia M. Procopio Violet Apalakian Janet E. Sanders Dianne Sillers Patricia M. Shea Jean M. Plante James B. Hawkes Charles A. BrownJean F. McGoey Constance T. Wagner Linda C. Hanson Stuart B. Strong Patricia A. Andersen Nora B. Bernazzani Wayne R. Saulnier Linda S. Pingiaro William J. Austin Mark A. Carlson Anne M. Morgan Theresa S. Thorley Daniel C. Cataldo Jenilde A. Mastrangelo Mark S. Venezia Barbara E. Wagner Jane A. Nussbaum Linda A. DohertyThomas E. Faust Jennifer J. Kirk Cynthia J. Clemson Susan S. Kiewra Lauren T. Mannone Donna M. D’Addario Marlo-Jean Tulis Anne Marie Gallagher Margaret M. RedmondStephanie H. Brady Duncan W. Richardson Thomas M. Metzold Mary D. Maestranzi Jill D. Lyons James F. Foley Veth S. Huorn William M. Gillen Mary V. Little Kelley CreedonR. Douglas McMahon Louise E. Kelley Diane Brissette David L. Stokkink William H. Ahern Rosemary Leavitt Scott H. Page Lynn W. Ostberg Marie Y. Calixte Kathleen McManusJames A. Thebado Lynne M. Hetu Clifford H. Krauss Payson F. Swaffield Cornelius J. Sullivan Michael W. Weilheimer Robert B. MacIntosh Karen M. Zemotel Barbara E. Campbell Hugh J. Gilmartin Christopher R. Berg Paul F. Jones Amy B. Ursillo Bonnie B. Ramage Perry D. Hooker John W. Gibson Gregory P. Parker Hadi C. MezherDelores A. Wood Timothy P. Roach Peter D. Stokinger Julie A. Neviera Richard Finelli Morgan C. Mohrman Jeffrey P. Beale Mark D. Nelson Linda D. Newkirk A J. MurphyDeanna R. Berry Jane A. Rudnick Walter W. Shulits Leighton Young Geoffrey G. Marshall Robert H. Bortnick Cecilia J. O’Keefe Louann Penzo Barclay Tittmann Elizabeth S. Kenyon Maureen Gemma David A. Michaud John M. Trotsky Christine M. Johnston David C. Olivieri Laurie G. Hylton Jie Lu William M. Steul Stanley B. Weiland Kathleen Fryer Kathleen M. Costello Jonathan G. Isaac Thomas H. Luster Thomas P. Luka James A. Naughton John P. Pumphrey Dana C. Robinson Thomas J. Weyl James J. Godfrey Stefan L. Thielen Dorothy J. Bouchard Cynthia M. Beckhusen Mary K. Kreider Denis J. Hill Marie T. Preston Olympia K. Wheeler William R. Cross Lewis R. Piantedosi Christopher Gaylord Walter A. Row David McDonald Elizabeth Prall John W. Vaughan Alan R. Dynner John Macejka Joseph K. NelsonMarie Y. Charles Brian Dunkley Derek Devine Leanne A. Parziale Mark D. Burkhard Peter F. Crowley Andrew O. Ogren Craig P. Russ Jerome A. Vainisi James C. QueenMelissa E. Haskell Thomas P. Huggins Michelle A. Green Roseann Sulano Bree E. Barletto Yana S. Barton Michael Botthof Vincent M. Cottone Lisa B. Hill Deborah TrachtenbergMartha Locke John P. Redding Paul M. O’Neil Kristin S. Anagnost Duke E. Laflamme Tiffany T. Cayarga Sotiria Kourtelidis Joanne M. Mey William J. Delahunty Linda B. Carter John D. Crowley Michael R. McGurn Heather L. Griffin Roberto Crugnale Michael A. Kinahan Daniel J. Ethier Karyn P. Parker Maria C. Cappellano Steven J. O’Brien Noah J. Coons Daniel M. Puopolo Adam Weigold Shannon M. Price Craig R. Brandon Kerry A. Smith Kirsten Ulich Sandra L. Letourneau Arthur S. JonesScott W. Firth Catherine Gerardi Catherine M. Gagnon David J. Zimmerman Eric F. Caplinger Linda A. Grasso Andrew N. Sveen Simone N. Santiago Scott W. Nelson Judith A. Saryan Henry M. Kozowyk Carolee B. MacLellan Mary Arutyunyan Margaret E. Pier Jeanene E. Foster Amanda R. Madison John B. Tracey Kiersten ChristensenNeal B. Pearlman Gregory P. Walsh Jeremiah P. Casey Todd P. Larson Bruce R. Lewis James Sarantopoulos Clyde F. Wertz Donald D. McCaughey Effie Kalantzis Erica L. BurkeLilly P. Scher Michael R. Mach Gregory A. Piaseckyj Arieh Coll Jeffrey R. Hesselbein Tina U. Holmes Ira G. Baron Andrew K. Cavanagh John F. Dolan Timothy P. McEwenWilliam R. Squadroni Adam K. Ferrante Robert R. Curtis Lisa C. Flynn Ben Moreno Philip Pace Russell E. Curtis Linda K. Nishi Lauren B. Kiernan Jane Queenan Aaron A. Berman Michael A. Allison John D. Gill Peter D. Hartman Greg S. Whitehead Edward A. Ciancarelli Elizabeth A. McNamara John W. Hartley Michael J. Meli Deborah A. Chlebek Samuel C. Scholz Gregory S. Newman Stephen C. Concannon Sara P. Anderson Craig Castriano Christine E. O’Neill Christine M. Bogossian Aamer KhanAndrew W. McClelland Ryan P. Cannon Michael D. Nappi Tracy J. Alter Catherine C. McDermott Phyllis E. Mastin Lawrence M. Sinsimer Stephen N. Soltys Michael P. Sullivan Randall J. Skarda Elaine Pereira Vincenzo Falbo Steven G. Leveille Kimberly J. Pacheco Julie A. Watson Ami S. Dion Kevin A. Sullivan Patrick J. CosgroveDouglas R. Rogers Andrew M. Gullotti James K. McCuddy Michael P. Devlin Lidia Sheykina Michael J. Costello Katharine S. Walker David B. Deans Randall A. Clark Steven J. Widder Jonathan M. Zadrozny Bradford M. Otis Michelle A. Baran Carl D. Carlson Kenneth T. Evans Michael D. McLean Mylene M. Cassel Paul J. Rose Donald M. Murphy Judith H. Snow May James R. Durocher Callie J. Gauzer Thomas J. Hughes James R. Putman Kristen R. Tragethon Coleen M. Lynch Kevin M. BilenchiElizabeth P. Johnson Kristen R. Abruzzese John J. Santoro William J. McKenney Christopher P. Berry Linda A. Bailey Timothy D. Breer Robert B. Ellerbeck Donna M. SmithMichael J. Tordone Qiang Cui David M. Lochiatto Michele A. Mulligan Deborah W. Porter Ann Marie Mruczek Daniel Yifru Jason A. McGrath Karen A. Boland James M. Gavin Laura B. Lang Christopher J. Mason Brian J. Herbert Joseph L. Furey Bradford W. Godfrey Lea M. Moscariello Amy J. Schwartz Harold T. Whalen John S. Khodarahmi Lawrence L. Fahey Katherine D. Spooner Stephen H. Whalen John C. Greenway Deidre E. Walsh Gregor D. Yuska Lynn A. Cadigan Jorge E. GutierrezThomas A. Wimer Charles J. Kace Michael A. Cirami Michael B. Maguire Whiting R. Willauer Christian E. Howe Heath A. Christensen Ralph H. Hinckley Allyson E. BuncePeter M. Campo Russell L. Kubie Christopher H. Hayes Lori A. Miller Crystal Sheets Sheila M. Keane Paul H. Nicely Peter D. Voulgaris Charles B. Gaffney Ian P. McGinn G. West Saltonstall Christopher R. McCool Meghann L. Clark Cheng G. Shi Lee LoPorto Jamie L. Lawrence Frank J. Sweeney Maureen F. Canney Todd M. Dickinson Joseph P. Rofino J. Timothy Ford Daniel J. Curtin Frederick S. Marius Amanda A. Jordan Manuel A. Resendes John A. Brodbine Ronald A. Randall Daniel L. Flynn Sheila T. Irizarry Mark Milan Joseph C. Yasinski Laurie C. Phillips Allard Mason B. Gillespie Michael J. Keffer Joshua D. Lipchin Benjamin M. Pomeroy Elizabeth L. StedmanAlyssa E. Thompson William E. Pannella Kristin A. Pagliuca John H. Croft Eileen Tam Edward P. Bliss Tasha M. Corthouts Leonard F. Dolan Nancy J. Jacobson Susan R. Martland Ina J. Mazer Deborah W. Moses Emily J. Murphy Samuel D. Perry Mary-Ann Spadafora Jonathan B. Treat Jonathan R. Urbon Kevin M. Darrow Jean D. Desanges George R. Nelson Marc R. Moran Rukma Raybardhan Lauren K. Loehning Keriann Kaestner David M. Richman Kathleen A. Meany Steven M. GemmaErin E. Auffrey John T. Murphy Jamie M. Babineau David P. Becker Nicole E. Thibeault Sharon M. Gordon Charlyne M. Ciccone Jason D. Fisher David A. Saraceno Daniel P. McElaney Bradford P. Murphy Gigi K. Szekely Brian J. Kiernan Mark Slavin Christopher J. Teixeira Joseph R. Hernandez Charles P. Manning William E. Holt Stacey L. Starner Emily Griffin Milagros L. Catanzaro Kwang C. Kim Gary R. LeFave Stephen L. Newton Nagaveni Puttaraju Christine S. Power Stephen A. Stowe Barbara Andre Jeffrey J. Sine Richard A. Michaels Erick Lopez Frank J. Spitaleri Matthew McNamara J. Scott Craig Richard G. Milano Christopher L. Sechler Scott H. CoughlanBrendan M. MacKenzie Jamie L. Regan Theodore D. Stern Stewart D. Taylor Sean W. Broussard Thomas R. Tajmajer David A. Lefcourt Aamir Moin Robert D. Carson Anatoliy A. Eybelman Kathryn A. McElroy Michael P. Curran Jonathan M. Kotler Richard P. Wyke Rebecca L. Burke Kevin M. Connerty Janet G. Daubenspeck Michael G. Ducharme John M. Mahoney Claire A. Muollo Michael P. O’Brien Lisa M. Jones Bridget Fangueiro Kelley G. Baccei Ho Yu Lau Jordana B. Mirel Raymond G. Sleight Adam V. Pacelli Michael J. Parker Michael E. Quinn Stacey L. Smith Jeffrey A. Rawlins Dan R. Strelow Mark P. McLennan Peter J. Popovics John R. Baur Alicia N. Botticelli Richard A. Kelly Patrick R. Carney Timothy W. Fetter Christopher W. Marek Michael P. Reidy Sebastian Vargas Jakub M. Cabaj Sara M. Dombrosky Jay A. Schlott Sarah E. Morton Stephanie M. Douglas Robert O. Lopez Jennifer L. Morales James R. Crowley Monica C. Connarton Patrick B. Gill Marsh C. Enquist Thomas Guiendon Carl J. Iannacci Ashley C. Ryan Kate E. Santangelo Diana E. Varco Alexander U. Rockwell Matthew T. Buckley Justin M. Huber James M. Salois Eric S. Robertson Ryan B. Landers William A. Irvine Paul F. Norton Walter T. Fullerton Carla F. Lopez-Codio Laura T. Donovan Ivan A. Huerta Dan A. MaaloulyBrittany E. Mitchell Maryanne B. Spacciapoli George Torruella Hogan Coreen S. Kraysler Gerald S. Martinez Lauren E. Lashute Louis M. Membrino Rebecca J. Bazyk Lori A. Bradley Kara E. Merkel Andrew L. Merrill Linda Yung Adan C. Gutierrez Stephen B. Byrnes Tracey A. Carter Dexter A. Dodge Thomas A. Kelliher Bernadette MahoneyDavid C. McCabe Michael J. Striglio Michael P. Keogh Calixto Perez Jason R. Cyr Michaella Callaghan Michael W. Collins Patricia A. Greene Panayiotis N. KalogeropoulosMichael J. Batts Michelle L. DiChiara Elizabeth A. Aldrich Anthony M. Dintino Nancy B. Tooke Patricia W. Bishop Charles P. Biron Susan M. Brengle Francine A. Craig Gayle C. Hodus Maureen Magner Kevin D. Taylor Henry S. Hong Anthony F. Jacobs Stephen A. Renaud Peter F. Welch Edward D. Devereaux Michelle Berardinelli Stanley G. Deutsch Bernard Scozzafava Brian R. Boyden Victoria L. Crane Isabel B. Depina Christine Landry Krystal D. Bertoni Michael A. Ciccone Andrew C. Frenette Brian A. Taranto Rick J. Polsinello Eriks F. Rancans Katherine E. Kennedy Katherine E. Fornal Allison E. Forrest Brian S. Pomerleau Michael B. Shea Alan R. Simeon Michael A. Ashton Katy D. Burke Christopher B. Doyle Emily L. Smith Paula A. DeAngelico Melissa E. Gross Eleanor M. McDonough Meghan E. Moses Edward A. SullivanJennifer Tawiah Evelyn L. Haygood John A. Casamassima Katherine F. Bonanno John L. Shea Jolie P. Twiss Brian F. Shuell Kenneth Clark Swartzel Spencer M. Dalton Jeremy M. Bomba Talia A. Correira Matthew C. Dework Derek J. DiGregorio Andrea L. DiPirro Brian C. Hassler Patrick K. Kent Elizabeth A. Terranova Megan E. ThompsonMichael J. Turgel Matthew F. Beaudry Nhung K. Le Sarah K. Rego Michael R. Ferrante Michael P. Roppolo Vatsady Sivongxay Annemarie Ng Sean J. Caplice Richard V. HoweBrian F. O’Neill Melissa A. Anderson Brian R. Mazzocchi Melissa A. Rongone Eric B. Dorman Kevin M. Gill Danielle K. O’Brien Katharine M. Kasper Brian M. Coole Bradley R. Schultz Carlos E. Mahecha Justin H. Bourgette Tullan W. Cunningham Oh-Mee E. Howard Tod P. Salisbury Erin F. Casey Holly-Anne Quinn Jennifer L. TarantinoDaniel J. McCarthy Jeanne K. Frawley Darrell Fixler Jonathan Broome Steven J. Pietricola Livia G. Lisker-Blount Jami E. Sickoll Jay C. Jentz David S. Andrews Pamela L. Gentile Irene L. Deane Scott R. Forst Stephen J. O’Loughlin James J. Lanza Michael A. Mazzei Tyler J. Neenan Matthew J. Saindon Christopher A. Webber Kathleen D. Yantosca Daniel J. McCarthy Stuart W. Muter Andrew M. Nepomuceno Sarah A. Bombardier Daniel E. TenPas Natalia Degtjarjova Tristan W. Benoit Richard W. Cooney David L. Griesbauer Sylvia Villamizar William B. Alicandro Jeanette L. Harrison-Sullivan Kerry L. Klaas Ryan C. Wilson Christopher J. Yourell Adam KorabChristopher M. Sansone Jeanmarie V. Lee David M. Gordon Nelson J. Cohn Ryan F. DeBoe Dominic A. DeSantis George E. Hopkins Brandon M. Jordan Chad M. SimmonsCourtney M. Roth Christopher H. Stoner Janice Korpusik William H. Gerber Collette A. Keenan Raphael A. Leeman Danat Abdrakhmanov Randolph J. Verzillo Katie A. RoAndrew P. Szczurowski Matthew J. Dellelo Virginia Gockelman Jessica Savageau Michael R. Sullivan Mikel Plluska Colleen M. Duffey Torrey A. Shillieto Marconi D. BomfimRobert J. Whelan Helen T. Hedberg Conrad G. Morin David A. Ryder Kenneth J. Lyons Morgynn J. Haggett John M. Ring Jennifer L. Johnson Kevin P. Longacre John A. Jannino Maureen M. Renzi Paul J. Costa Matthew J. Witkos Julie A. McGee Sharon S. Sendaydiego Gail S. Dowd Bastian Wagner Stephanie Rosander Kathleen M. Walsh Nina B. Bove Eileen Storz-Salino Bradley S. Wagoner Charles Cheng Taylor J. Evans H. T. Harlow Danene K. Kibbe Amanda M. Marino James F. KirchnerJoseph C. Gannon Tatiana I. Koltsova Shane Torchiana Ross A. Anderson Amanda J. Buchholz Nicholas S. Fincher Steven A. Mazzuchelli Andrew J. Mohr Kelli D. MorsePatrick W. Scanlon Mary Gillespie Kelley M. Hand Stephen McDermott Darren E. Walters Robert J. Bastien Nitzan Gordon Jake T. Lemle Andrea E. Lynch Anthony MorraRobert E. Greene Donna N. Drewes Alexis B. Vanderhye Gregory P. Fuccillo Adam J. Krenn Christopher S. Mitchell Natasha Paredes Lianne M. Busa Steven L. Dansreau Julie A. DeBaggis Michael Ferreira Tara C. O’Brien Ralph M. Studley Susan E. Black William H. Wolfe Joseph E. Lynch Nicholas S. Bellistri Jaime P. Smoller Michael A. BarryGonzalo A. Cabello William A. Flemer Clinton D. Lynch Jillian Courtemanche Judith A. Cranna Michelle Rousseau Willard H. Watson Anne E. Sternlicht Mary C. ProlerJoanne M. Haddow Christina Salomon John Pelletier Sarah D. Ayott Stephanie A. DesRuisseau Lee-Elizabeth C. Johnston Wilhelmina R. Roda Alison L. Romano Atlanta Capital Management Company LLC Dallas L. Lundy Daniel W. Boone Walter F. Reames Deborah H. Bishop Marilyn R. Irvin Mary K. McTague Gregory L. Coleman Jerry D. DeVore Lara S. Ratcliff Margaret W. Taylor James A. Womack William R. Hackney Bethany R. Glover R K. Williams Gillian A. Moore Thomas J. Ullman L S. Marger Janette E. Andrews Charles B. Reed Joseph M. Roman Amanda A. Kokan Robert R. Walton William O. Bell Paul J. Marshall Meghan A. McGinty Michelle Breig Tanya A. Blocker Glenn H. Shaw James S. Skesavage Deborah L. Henry Joseph P. Ward William M. Hereford Dorothy T. Kopp Darin S. Clauson Earl A. Brown Richard B. England Brian K. Smith Juliene E. Blevins Susan E. Griffin Mary M. Biddix Robert D. Allen Jennifer N. Kennedy Rhonda M. Forde Tyler Partridge Phuong M. Cam Valery Jean-Phillippe Jason M. Recio Nichole Shepherd Daniel C. Sullivan Rose-Lucie Croisiere Lance V. Garrison James N. Stafford Kyle W. Johns Brian P. Mansfield Fox Asset Management LLC Rebecca W. Olson Sandra M. Seibert Cherie L. Weisse Stuart E. Briskey Donald A. Grella John W. Feaster Kimberly A. HingNorah C. Castillo Sherri A. Peterpaul Gregory R. Greene Colette M. Jacobsen Douglas P. Edler Constance Barrella Sheri A. Datre Michael Dellipaoli Michael K. West Jill M. Halligan J. Bradley Ohlmuller Murtuza A. Khan Marian A. McGlincy William E. Dodge Lorna M. Morrison Christos Skiadopoulos Joseph Vurchio Emil Kurtisi Robert J. Milmore Michelle B. Chumash William Howarth Jennifer A. Barbieri Jessica DeVergilio Bradley S. Daniels Valerie Crono Daenna M. Rabaglia Jessica B. Groom Andrew D. Massey Matthew Villa Parametric Portfolio Associates LLC Karla M. Shannon Brian D. Langstraat Andrew D. Abramsky David M. Stein Kurt L. Galley Tyson E. Alexander Jeffrey N. DuVall Richard D. Wilson Lee R. Thacker Steven J. Kauffman Thomas C. Seto Far Salimian Robert J. BreshockAaron H. Cartozian Shalamar C. Kanemoto Jared S. Gray Jeffrey L. Brown Xiaozhen Li Bruce D. McIntosh Vincent N. Petisme Jackie A. Viars Aaron W. Singleton Matthew Amundson Luke Britton Laura A. Edain Nicolas Schuitemaker John Simchuk Vassilii Nemtchinov Eugene Lee Ian D. Schuelke James F. Reber Megan Keaty Noriko Ogawa Charles Brophy Jodi M. Wong Melinda Olson Trevor Williams Gordon Wotherspoon Todd Wathey Joseph E. Daniels Geoff Longmeier Brooke Beresh Matthew J. Dufort Julie Challman Kimberly R. Williams Paul E. McCallick Joel C. Marcus Scott Timmerman Marc R. Hermer Ross K. Chapin Caroline D. Romerosa FrattoJennifer Mihara Rainer Germann Dan Clayton Hemambara D. Vadlamudi Elena Balekha Jean M. Carlos Paul W. Bouchey Ryan S. Newby Michelle S. Wu Adam Bodnarchuk Bronagh Creegan Travis Bohon Aubin Quesnell Steven Kleyn Robin M. Burge Yullya Makhanov Stephen J. Riley Karen Morrison Michael Nagamatsu David L. Perry Christian Johnson Christopher Hackman Ho-Chuin R. Yen Terry Stewart Bradley S. Berggren Lawrence M. Berman Kenneth L. Everding Jonathan Orseck Patrick J. Escarcega Haley Carey Mallory Brick Elaine D. Peretti Kenny S. Tsang Olivia Fredrikson Megan Gordon Roger Weber Alissa Coward Matthew Gerken Sean Stokke Brett Anderson Catherine Weisnewski Brandon W. Chapman Jason T. Gifford ETOCM-AR-07
EEAATTOONN VVAANNCCEE CCOORRPP..2007 ANNUAL REPORT
175734.BCFC 1/11/08 9:19 PM Page 1
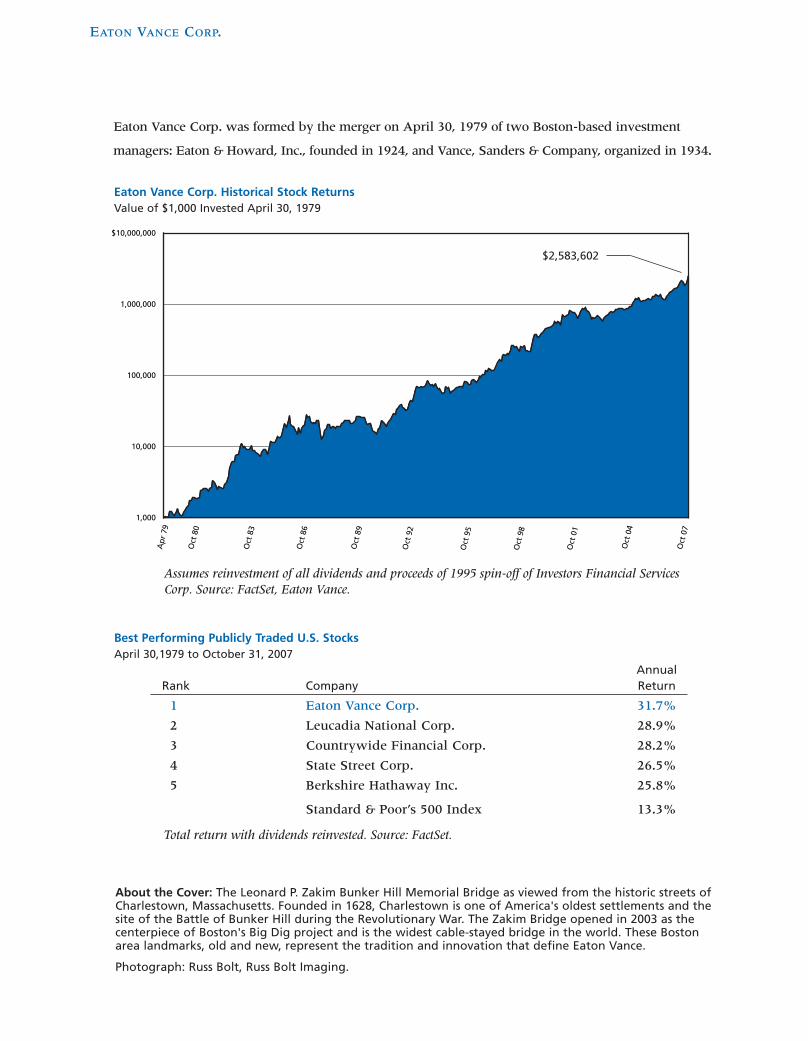
Best Performing Publicly Traded U.S. StocksApril 30,1979 to October 31, 2007
AnnualRank Company Return
1 Eaton Vance Corp. 31.7%
2 Leucadia National Corp. 28.9%
3 Countrywide Financial Corp. 28.2%
4 State Street Corp. 26.5%
5 Berkshire Hathaway Inc. 25.8%
Standard & Poor’s 500 Index 13.3%
EATON VANCE CORP.
$10,000,000
1,000,000
100,000
10,000
1,000
Assumes reinvestment of all dividends and proceeds of 1995 spin-off of Investors Financial ServicesCorp. Source: FactSet, Eaton Vance.
Total return with dividends reinvested. Source: FactSet.
About the Cover: The Leonard P. Zakim Bunker Hill Memorial Bridge as viewed from the historic streets ofCharlestown, Massachusetts. Founded in 1628, Charlestown is one of America's oldest settlements and thesite of the Battle of Bunker Hill during the Revolutionary War. The Zakim Bridge opened in 2003 as thecenterpiece of Boston's Big Dig project and is the widest cable-stayed bridge in the world. These Bostonarea landmarks, old and new, represent the tradition and innovation that define Eaton Vance.
Photograph: Russ Bolt, Russ Bolt Imaging.
Eaton Vance Corp. Historical Stock ReturnsValue of $1,000 Invested April 30, 1979
Eaton Vance Corp. was formed by the merger on April 30, 1979 of two Boston-based investment
managers: Eaton & Howard, Inc., founded in 1924, and Vance, Sanders & Company, organized in 1934.
$2,583,602
EATON VANCE CORP. MISSION AND CORE VALUES
Our Mission
Eaton Vance strives to be the premier investment management
organization. We seek to provide clients with superior performance,
top quality service and value-added products across a range of
investment disciplines and distribution channels. We seek to provide an attractive work
environment and fulfilling careers for our dedicated employees. Through the success of
clients and associates, we thereby seek to build long-term shareholder value.
Our Core Values
Integrity • Honest in word and deed
• Adheres to the Company’s Code of Ethics, industry standards
of business conduct and applicable law
• Deals fairly and forthrightly with clients, colleagues and
business partners
Professionalism • Demonstrates maturity, dedication and a strong work ethic
• Behaves appropriately; respectful of clients, colleagues and
business partners
• Uses the Company’s resources wisely
Teamwork • Works collaboratively with others to achieve shared goals
• Communicates openly and follows through on commitments
• Enhances the work experience of colleagues
Client Focus • Places the interests of clients first
• Meets or exceeds client performance expectations
Creativity/Adaptability • Develops business opportunities and process improvements
• Open and adaptable to change
• Works to achieve personal development
Excellence • Achieves outstanding results for clients and shareholders
• Advances the record and reputation of Eaton Vance as an
industry leader
175734.BCFC 1/15/08 6:10 PM Page 2
1
KEY STATISTICS
Equity67%
Floating-RateIncome13%
FixedIncome
20%
Ending Assets Under ManagementBy Asset Class
Private Funds19%
Open-EndFunds36%
Institutional/High-Net-WorthSeparate Accounts15%
Retail ManagedAccounts9%
Closed-EndFunds
21%
Ending Assets Under ManagementBy Product Category
% Fiscal Year Ending October 31 2007 2006 Change(in millions, except per share and employee amounts)
Ending assets under management $161,671 $128,907 +25
Average assets under management $145,973 $117,365 +24
Gross inflows $ 46,416 $ 25,822 +80
Revenue $ 1,084 $ 862 +26
Operating income $ 233 $ 265 -12
Operating income margin 21% 31%
Net income $ 143 $ 159 -10
Net income margin 13% 18%
Earnings per diluted share $ 1.06 $ 1.17 -9
Dividends declared per share $ 0.51 $ 0.42 +21
Cash, cash equivalents and
short-term investments $ 485 $ 227 +114
Long-term debt $ 500 $ – nm
Employees 953 869 +10
Market capitalization $ 5,893 $ 3,915 +51
175734.P 1/16/08 11:55 AM Page 1

22
Fiscal 2007 was an outstandingyear for the shareholders andemployees of Eaton Vanceand the clients we serve.
Assets under managementincreased 25 percent to arecord $161.7 billion.
We launched the largest everinitial public offering of aclosed-end fund and arepositioned, for the fifth yearin a row, to lead our industryin closed-end fund sales.
Thomas E. Faust Jr.
To Shareholders and Friends of Eaton Vance:
am pleased to report that fiscal 2007 was an
outstanding year for the shareholders and
employees of Eaton Vance and the clients
we serve. Long-term investment performance across a broad
range of asset classes continued to excel. Assets under
management increased 25 percent to a record $161.7 billion.
Gross and net flows into Eaton Vance funds and separate
accounts were the highest in Company history by a wide
margin. We launched the largest ever initial public offering of a
closed-end fund and are positioned, for the fifth year in a row,
to lead our industry in closed-end fund sales. We rebalanced
our capital structure with the successful placement of $500
million of ten-year senior notes and the repurchase during the
fiscal year of 10.8 million shares of the Company’s stock. At the
close of the fiscal year, our Board of Directors voted to increase
the Company’s quarterly dividend by 25 percent to an annual
rate of $0.60 per share.
For fiscal 2007, Eaton Vance earned $1.06 per
diluted share compared to $1.17 per diluted share in fiscal
2006. Earnings for the fiscal year were reduced approximately
$0.65 per diluted share by closed-end fund-related expenses
and approximately $0.05 per diluted share by costs associated
with the reorganization of Eaton Vance Distributors, Inc.
announced in October and a loss realized on an interest rate
lock entered into in connection with our senior note offering.
Fiscal 2006 earnings were reduced approximately $0.10 per
diluted share by expenses associated with the early retirement
of long-term debt and a write-off of intangible assets at
affiliate Fox Asset Management.
Assets under management increased 25 percent to
$161.7 billion on October 31, 2007 from $128.9 billion on
October 31, 2006. The growth in assets under management
reflects long-term fund and separate account net inflows of
$22.9 billion and net price appreciation of $11.9 billion. The
fiscal year’s record net inflows represent an 18 percent organic
growth rate, and were aided significantly by the record $10.0
175734.P 1/16/08 12:00 PM Page 2

3
Fiscal 2007 revenue increased26 percent to $1.084 billion.
Our fund business reachednew highs, with record netinflows and ending fundassets under management up24 percent.
billion of closed-end fund assets raised. But the strong flow
trends of our core fund and separate account businesses would
have enabled us to achieve a double-digit organic growth rate
for the fiscal year even without any closed-end fund sales.
Consistent with the growth in assets under manage-
ment, fiscal 2007 revenue increased 26 percent to $1.084 billion
compared to fiscal 2006 revenue of $862.2 million. Operating
income for the fiscal year decreased 12 percent to $232.9
million from $265.0 million in fiscal 2006, reflecting the
$90.8 million in structuring fees and incentive compensation
paid in connection with new closed-end fund sales during
the fiscal year and one-time payments of $52.2 million made
to terminate previous agreements to pay ongoing dealer
compensation on closed-end funds offered in prior years.
Although expenses associated with our growing closed-end
fund business hurt fiscal 2007 operating results, they position
the Company to earn higher income in future years from the
management of these long-lived and stable assets.
Our fund business reached new highs in fiscal 2007,
with record net flows of $19.2 billion into long-term funds
and ending fund assets under management of $122.1 billion,
up 24 percent. The Company experienced robust growth
in equity fund assets, up 42 percent, led by our strong-
performing value and equity income funds. Fixed-income
and floating-rate bank loan fund assets under management
also grew despite turmoil in the credit markets in the second
half of the fiscal year. Long-term fixed-income fund assets
under management increased 15 percent during the fiscal
year, reflecting net inflows of $3.5 billion into municipal bond
funds and $0.5 billion into taxable fixed-income funds. We
finished the fiscal year with 2 percent growth in bank loan
fund assets managed, as flows into institutional loan funds
more than offset retail fund withdrawals.
175734.P 1/15/08 6:18 PM Page 3

4
Our long-term fund perfor-mance continued to excelacross a broad range ofdisciplines.
Our long-term oriented, risk-sensitive investment approachis time tested and repeatable.
Our retail managed accountsbusiness had record netinflows and ending assetsunder management up 56percent.
4
Our long-term fund performance continued to
excel across a broad range of investment disciplines. As of
the end of October, we had 53 funds with four or five star
Morningstar ratings for at least one share class. Our performance
as measured by Lipper is equally strong. At fiscal year-end, 79
percent of our mutual fund assets were in funds that beat
their Lipper peer group average over the past three years, 76
percent over the past five years and 92 percent over the past
10 years.
We understand that our success as a Company hinges
on the performance of the funds and accounts we manage. Our
long-term oriented, risk-sensitive investment approach across
equity and income disciplines is time tested and repeatable.
Our investment teams are strong and cohesive, and dedicated
to achieving performance excellence over the long term. They
are the heart and soul of Eaton Vance and our most important
strategic asset.
Our retail managed accounts business also reached
new high levels in fiscal 2007, with net inflows of over $3.7
billion and ending assets under management of $14.8 billion,
up 56 percent. We continue to see momentum building in this
channel, as several of our investment disciplines now rank as
top performers in their respective asset classes. In addition,
Parametric Portfolio Associate’s highly differentiated tax-
managed core and overlay products are showing rapid growth
in this marketplace. We are pleased that our multi-year
endeavor to build an industry-leading position in retail
managed accounts is now coming to fruition, with strong
business momentum that we expect to carry forward into
fiscal 2008.
Turning to the institutional market, we are
encouraged by the steady progress achieved in building Eaton
Vance Management’s institutional business, with more than
$2.3 billion in new mandates funded in calendar 2007.
175734.P 1/11/08 9:47 PM Page 4

While bank loans continue to be EVM’s most popular
institutional asset class, we are also winning new assignments
in structured emerging market equities (managed by Parametric),
large-cap value and high-yield bonds. And due to sharply
improved performance, the outflows experienced by affiliates
Atlanta Capital Management and Fox Asset Management
in recent years have tapered off and offer the prospect of
reversing in fiscal 2008. All told, our institutional outlook
is very encouraging.
There were also favorable developments during
the fiscal year in our high-net-worth and family office units.
Eaton Vance Investment Counsel added three experienced
investment counselors in a renewed focus on expansion and
business development. Parametric’s family office unit also
augmented its capabilities in fiscal 2007 with the launch of
Parametric Risk Advisors (PRA). PRA is a 40 percent owned
affiliate of Parametric that specializes in the use of options and
other derivatives in the management of client investment
portfolios, offering covered call writing and other programs to
enhance the risk/return characteristics of concentrated stock
positions and diversified equity portfolios. Since the close of the
transaction forming PRA in May, it has been a major contributor
to Parametric’s growth in the family office market. In fiscal 2008,
we look to expand distribution of PRA’s capabilities to a broader
range of clients and markets.
Our retail sales company, Eaton Vance Distributors,
Inc. (EVD), has been under new leadership since May, when
Matt Witkos joined us to fill the void created by the untimely
death of long-time EVD President Whit Whitaker. In October,
Matt unveiled a new management structure to better align
EVD with the needs of customers and to support expanded
product offerings. The new initiative integrates leadership
of our sales and national account functions for the
Company’s major distribution channels. We are forming
a new Wealth Management Solutions Group to support the
marketing of the Company’s products and services tailored to
the high-net-worth marketplace served by financial advisors.
5
Eaton Vance Management’sinstitutional business won$2.3 billion in new mandatesin calendar 2007.
Parametric Risk Advisorsspecializes in the use ofoptions and other derivativesin the management of clientinvestment portfolios.
Eaton Vance Distributors, Inc.unveiled a new managementstructure to better align itselfwith the needs of customersand to support expandedproduct offerings.
175734.P 1/15/08 6:19 PM Page 5

We are increasing resources devoted to the high-potential
registered investment advisor, sub-advisory and retirement
market opportunities. And we are strengthening our
marketing communications and use of market data to enhance
the efficiency and effectiveness of our sales efforts. We are
excited about the potential to take EVD to an even higher level
of performance under Matt’s leadership.
Fiscal 2007 was not only a year of outstanding
performance for Eaton Vance, it was also a period of transition
in the senior leadership of the Company. As noted above,
Whit Whitaker, our head of retail distribution, passed away
during the year. And three other long-serving senior executives,
Chief Executive Officer Jim Hawkes, Chief Financial Officer
Bill Steul and Chief Legal Officer Alan Dynner, retired at
the end of the fiscal year in accordance with the Company’s
retirement policy for senior executives. This group of
remarkable individuals has served Eaton Vance with
distinction for many years and contributed immeasurably
to the Company’s growth and success.
On the inside front cover of this report is a chart
showing the more than 2500 times build-up in value of an
investment in Eaton Vance stock over the period since the
Company’s formation through a merger in 1979. On the same
page is a table showing that Eaton Vance is the top-performing
publicly traded U.S. stock over the 281/2 years since our
inception. People unfamiliar with Eaton Vance may wonder
what accounts for the Company’s extraordinary record of long-
term performance. No doubt a significant debt of gratitude is
owed to the vision, energy and leadership provided to the
Company by managers such as those retiring at fiscal year end
and their predecessors. No doubt we have been blessed to
operate in an industry with attractive financial characteristics
and supported by the tailwind of generally favorable securities
6
Fiscal 2007 was a period oftransition in the seniorleadership of the Company.
People unfamiliar with EatonVance may wonder whataccounts for the Company’sextraordinary record of long-term performance.
175734.P 1/15/08 6:20 PM Page 6

7
price trends. But more than these, I point to the culture of
Eaton Vance and the mission and values we embrace, which
are set forth on the inside back cover of this report.
Eaton Vance is the product of a union between
two Boston-based money managers whose roots date to the
founding days of the U.S. investment management industry:
Eaton & Howard, formed in 1924, and Vance, Sanders
& Company, organized in 1934. From these predecessor
organizations, Eaton Vance inherited a steadfast approach
to business and investing, grounded in the principles of
fiduciary responsibility and prudent care of client assets. Our
forebears didn’t like to lose money, either their clients’ or their
own. The traditions of integrity and responsible stewardship
they established are cornerstones of today’s Eaton Vance.
More recent in origin, but equally ingrained, is the
spirit of innovation and entrepreneurship that pervades our
organization. The modern history of Eaton Vance is in large
part a story of invention. Countless times, we have identified
significant changes in market, demographic, legal and
regulatory environments and then moved quickly to create
important new investment opportunities for our clients and
significant new business opportunities for our Company.
Eaton Vance carries a well-deserved reputation as a leading
developer of innovative and timely investment strategies with
strong investment merit. At Eaton Vance, product develop-
ment is not the responsibility of a single group or committee,
but a passion shared by all.
A third distinctive element of Eaton Vance’s culture
that contributes enormously to our success is the way in
which Eaton Vance people interact. Ours is a culture of caring
and sharing, in which group success is celebrated and the
rewards for outstanding accomplishment are broadly
distributed. Ours is a culture of professionalism and civility.
The traditions of integrity and responsible stewardshipestablished by our forebearsare cornerstones of today’sEaton Vance.
The modern history of EatonVance is in large part a storyof invention.
7
175734.P 1/11/08 9:48 PM Page 7

Being nice to one another is a way of life at Eaton Vance.
We are fortunate to operate in an industry where neither
heavy lifting nor exposure to demanding physical environments
is often required. But in some organizations, those workplace
advantages are negated by a harsh interpersonal environment.
That’s not Eaton Vance. The congenial, collaborative atmosphere
we offer is one of the characteristics that attracts so many
talented individuals to Eaton Vance and accounts in significant
part for the long employment tenures and low staff turnover
we enjoy. Investment management is a people business.
Treating co-workers well is the best way I know to ensure that
they perform well for our clients and business partners.
As I move into the position of Chairman and CEO,
I am sometimes asked about my agenda for changing the
Company. I respond by saying that, while change is a constant
in our business, there is nothing of a fundamental nature
I want to change about the character of Eaton Vance.
Consistency and continuity are hallmarks of the Company
that I seek to preserve. My career here goes back 22
years, and I’ve enjoyed every minute. I like our business and
competitive position, and the cultural groundings that underlie
our past success. My goal is to build on the legacy of success
that I inherit, to continue moving the Company forward,
seeking opportunities to innovate, excel and grow in all
market environments.
The mission of Eaton Vance, in short, is to serve our
clients and employees well, and thereby build shareholder value
over the long term. I like our chances for continued success.
Sincerely,
Thomas E. Faust Jr.
Chairman and Chief Executive Officer
8
Being nice to one another is away of life at Eaton Vance.Ours is a culture of caring andsharing.
Consistency and continuityare hallmarks of theCompany.
The mission of Eaton Vance,in short, is to serve our clientsand employees well, andthereby build shareholdervalue over the long term.
8
175734.P 1/11/08 9:48 PM Page 8

Fiscal 2007 completes the service to the
Company of our long-time Chairman and
Chief Executive Officer, James B. Hawkes,
who retired on October 31, 2007. Jim joined predecessor Vance,
Sanders & Company in 1970 as an equity analyst and served in
investment, marketing and general management roles prior to his
election as CEO in 1996. Jim has contributed to Eaton Vance as a
product development genius, corporate ambassador and spokesman,
bridge between the investment and marketing parts of the organi-
zation, and as a decent, compassionate human being able to effectively
translate those characteristics to the Company as a whole. Jim’s record
as a leader, manager, innovator and visionary has few rivals in the
investment management industry. During his eleven years as CEO,
the Company’s assets under management grew nearly tenfold and our
stock appreciated nearly twentyfold, achieving a total return of 31.8
percent per annum over the period. Upon Jim’s retirement, we
celebrate the legacy of success and the culture of caring he passes
down to future generations.
A T R I B U T E T O J A M E S B . H A W K E S
175734.P 1/15/08 8:59 PM Page 9

10
Closed-End Fund Assets Under Management (in billions)
$35
30
25
20
15
10
5
098 99 00 01 02 03 04 05 06 07
1.20%
1.00%
0.80%
0.60%
0.40%
0.20%
0%
Market ShareLong-Term Fund Assets
98 99 00 01 02 03 04 05 06 07 Source: Strategic Insight. Calendar Year End, Except October 2007
EATON VANCE PERFORMANCE
$200
150
100
50
0
Assets Under Management(in billions)
98 99 00 01 02 03 04 05 06 07
Equity Assets Under Management(in billions)
98 99 00 01 02 03 04 05 06 07
Includes Balanced Accounts
$120
100
80
60
40
20
10
0
Retail Managed Account Assets Under Management (in billions)
$15
12
9
6
3
098 99 00 01 02 03 04 05 06 07
$50
40
30
20
10
0
Gross Sales/Inflows(in billions)
98 99 00 01 02 03 04 05 06 07
$300
250
200
150
100
50
0
Operating Income(in millions)
98 99 00 01 02 03 04 05 06 07
$0.60
0.50
0.40
0.30
0.20
0.10
0
Dividends Per Share10 Year CAGR: 26%
98 99 00 01 02 03 04 05 06 07
$1,200
1,000
800
600
400
200
0
Revenue(in millions)
98 99 00 01 02 03 04 05 06 07
175734.P 1/15/08 6:28 PM Page 10

11
$60
50
40
30
20
10
0
98 99 00 01 02 03 04 05 06 07
Quarterly High and Low Stock Prices
Adjusted for two-for-one stock splits August 31, 1998, November 13, 2000 and January 14, 2005
2/1Split
2/1Split
2/1Split
$600
500
400
300
200
100
0
Cash Returned To Shareholders(in millions)
98 99 00 01 02 03 04 05 06 07 Defined as dividends paid plus cash used for stock repurchases.
Stock RepurchasesDividend Paid
1,000
800
600
400
200
0
Employees
98 99 00 01 02 03 04 05 06 07
$6
5
4
3
2
1
0
Market Capitalization(in billions)
98 99 00 01 02 03 04 05 06 07
175734.P 1/15/08 6:29 PM Page 11
12
Five Year Financial Summary……………………………………………13
Management’s Discussion and Analysis…………………………………14
Consolidated Statements of Income……………………………………40
Consolidated Balance Sheets……………………………………………41
Consolidated Statements of Shareholders’ Equity
and Comprehensive Income…………………………………………42
Consolidated Statements of Cash Flows………………………………44
Notes to Consolidated Financial Statements......................................45
Report of Independent Registered Public Accounting Firm …………69
Corporate and Investor Information ……………………………………71
FINANCIAL REVIEW
175734.P 1/15/08 6:42 PM Page 12

Five-Year Financial Summary
Years Ended October 31,
(in thousands, except per share data) 2007 2006 2005 2004 2003
Income Statement Data
Revenue: Investment advisory and administration fees 773,612$ 594,632$ 503,085$ 413,102$ 296,344$ Distribution and underwriter fees 148,369 139,111 138,485 150,018 146,907 Service fees 154,736 124,025 105,202 92,087 74,605 Other revenue 7,383 4,426 6,403 6,606 5,277 Total revenue 1,084,100 862,194 753,175 661,813 523,133
Expenses: Compensation of officers and employees 316,963 244,620 205,663 172,411 130,011 Distribution expense 253,344 114,052 101,661 80,356 54,157 Service fee expense 121,748 98,262 87,983 77,823 64,918 Amortization of deferred sales commissions 55,060 52,048 63,535 81,202 85,192 Fund expenses 19,974 16,589 12,019 4,034 5,413 Other expenses 84,074 71,657 49,707 45,347 34,880 Total expenses 851,163 597,228 520,568 461,173 374,571
Operating income 232,937 264,966 232,607 200,640 148,562
Other Income (Expense): Interest income 10,511 8,033 4,354 2,799 4,848 Interest expense (2,894) (12,850) (1,464) (5,898) (5,761) Gains/(losses) on investments (1,943) 3,667 38 275 2,346 Foreign currency gains (losses) (262) (222) (32) (85) 18 Impairment loss on investments - (592) (2,120) - -
Income before income taxes, minority interest, equity in net income of affiliates and cumulative effect of change in accounting principle 238,349 263,002 233,383 197,731 150,013 Income taxes (93,200) (102,245) (90,871) (72,493) (53,781) Minority interest (6,258) (5,103) (5,037) (4,559) (1,593) Equity in net income of affiliates, net of tax 3,920 4,349 1,231 1,283 171
Income before cumulative effect of change in accounting principle 142,811 160,003 138,706 121,962 94,810
Cumulative effect of change in accounting principle, net of tax - (626) - - -
Net income 142,811$ 159,377$ 138,706$ 121,962$ 94,810$
Earnings per share before cumulative effect of change in accounting principle: Basic 1.15$ 1.25$ 1.05$ 0.90$ 0.69$
Diluted 1.06$ 1.18$ 0.99$ 0.87$ 0.67$
Earnings per share: Basic 1.15$ 1.25$ 1.05$ 0.90$ 0.69$
Diluted 1.06$ 1.17$ 0.99$ 0.87$ 0.67$
Dividends declared, per share 0.51$ 0.42$ 0.34$ 0.28$ 0.20$
Weighted average shares outstanding: Basic 124,527 127,807 131,591 134,938 137,832
Diluted 135,252 137,004 140,520 144,313 145,917
Balance Sheet Data
Total assets 966,831$ 668,195$ 702,544$ 743,566$ 658,702$ Long-term debt 500,000$ -$ 75,467$ 74,347$ 118,736$ Shareholders' equity 229,168$ 496,485$ 476,296$ 464,328$ 426,511$ Shareholders' equity per share 1.94$ 3.93$ 3.68$ 3.48$ 3.12$
13
175734.FIN.CS3.indd 13175734.FIN.CS3.indd 13 1/15/08 7:17:42 PM1/15/08 7:17:42 PM

Management’s Discussion and Analysis of Financial Condition and Results of Operations
This Item includes statements that are “forward-looking statements” within the meaning of Section 27A of the Securities Act of 1933, as amended, and Section 21E of the Securities Exchange Act of 1934, as amended, including statements regarding our expectations, intentions or strategies regarding the future. All statements, other than statements of historical facts, included in this Form 10-K regarding our financial position, business strategy and other plans and objectives for future operations are forward-looking statements. Although we believe that the assumptions and expectations reflected in such forward-looking statements are reasonable, we can give no assurance that such expectations reflected in such forward-looking statements will prove to have been correct or that we will take any actions that may presently be planned. Certain important factors that could cause actual results to differ materially from our expectations are disclosed in Item 1A, “Risk Factors.” All subsequent written or oral forward-looking statements attributable to us or persons acting on our behalf are expressly qualified in their entirety by such factors.
General
Our principal business is managing investment funds and providing investment management and counseling services to high-net-worth individuals and institutions. Our long-term strategy is to develop and sustain value-added core competencies in a range of investment disciplines and to offer industry-leading investment products and services across multiple distribution channels. In executing this strategy, we have developed a broadly diversified product line and a powerful marketing, distribution and customer service capability.
We are a market leader in a number of investment areas, including tax-managed equity, value equity, equity income, emerging market equity, floating-rate bank loan, municipal bond, investment grade and high-yield bond investing. Our diversified product line offers fund shareholders, retail managed account investors, institutional investors and high-net-worth clients a wide range of products and services designed and managed to generate attractive risk-adjusted returns over the long term.
Our principal retail marketing strategy is to distribute funds and separately managed accounts through financial intermediaries in the advice channel. We have a broad reach in this marketplace, with distribution partners including national and regional broker/dealers, independent broker/dealers, independent financial advisory firms, banks and insurance companies. We support these distribution partners with a team of more than 140 Boston-based and regional sales professionals across the U.S. and internationally. Specialized sales and marketing professionals in our Wealth Management Solutions Group serve as a resource to financial advisors seeking to help high-net-worth clients address wealth management issues and support the marketing of our products and services tailored to this marketplace.
We also commit significant resources to serving institutional and high-net-worth clients who access investment advice outside of traditional retail broker/dealer channels. Through our wholly owned affiliates and consolidated subsidiaries Atlanta Capital Management Company, LLC (“Atlanta Capital”), Fox Asset Management LLC (“Fox Asset Management”), Parametric Portfolio Associates LLC (“Parametric Portfolio Associates”) and Parametric Risk Advisors LLC (“Parametric Risk Advisors”), we manage investments for a broad range of clients in the institutional and high-net-worth marketplace, including corporations, endowments, foundations, family offices and public and private employee retirement plans. Specialized sales teams at our affiliates develop relationships in this market and deal directly with these clients.
14
175734.FIN.CS3.indd 14175734.FIN.CS3.indd 14 1/15/08 7:17:43 PM1/15/08 7:17:43 PM

Our revenue is derived primarily from investment advisory, administration, distribution and service fees received from Eaton Vance funds and investment advisory fees received from separate accounts. Our fees are based primarily on the value of the investment portfolios we manage and fluctuate with changes in the total value and mix of assets under management. Such fees are recognized over the period that we manage these assets. Our major expenses are employee compensation, distribution-related expenses and amortization of deferred sales commissions.
Our discussion and analysis of our financial condition and results of operations are based upon our consolidated financial statements, which have been prepared in accordance with accounting principles generally accepted in the United States of America. The preparation of these financial statements requires us to make estimates and judgments that affect the reported amounts of assets, liabilities, revenue and expenses and related disclosures of contingent assets and liabilities. On an ongoing basis, we evaluate our estimates, including those related to deferred sales commissions, goodwill and intangible assets, income taxes, investments, stock-based compensation and litigation. We base our estimates on historical experience and on various assumptions that we believe to be reasonable under current circumstances, the results of which form the basis for making judgments about the carrying values of assets and liabilities that are not readily available from other sources. Actual results may differ from these estimates under different assumptions or conditions.
Assets Under Management
Assets under management of $161.7 billion on October 31, 2007 were 25 percent higher than the $128.9 billion reported a year earlier. Long-term fund net inflows contributed $19.2 billion to growth in assets under management over the last twelve months, including $10.0 billion of closed-end fund net inflows and $9.2 billion of open-end and private fund net inflows. Retail managed account net inflows contributed $3.7 billion to growth in assets under management, while institutional and high-net-worth acquisitions contributed an additional $0.3 billion. Market price appreciation, reflecting favorable equity markets, contributed $11.9 billion, while a decrease in cash management assets reduced assets under management by $2.1 billion.
Ending Assets Under Management by Investment Category(1)
October 31, 2007 vs. 2006 vs. (in billions) 2007 2006 2005 2006 2005Equity assets $ 108.4 $ 76.8 $ 66.2 41% 16% Fixed income assets 31.9 30.8 23.2 4% 33% Floating-rate bank loan assets 21.4 21.3 19.1 0% 12% Total $ 161.7 $ 128.9 $ 108.5 25% 19%
(1) Includes funds and separate accounts.
Equity assets represented 67 percent of total assets under management on October 31, 2007, compared to 60 percent on October 31, 2006 and 61 percent on October 31, 2005. Assets in equity funds managed for after-tax returns totaled $55.1 billion, $39.1 billion and $34.6 billion on October 31, 2007, 2006 and 2005, respectively. Fixed income assets, including cash management funds, represented 20 percent of total assets under management on October 31, 2007, compared to 24 percent on October 31, 2006 and 21 percent on October 31, 2005. Fixed income assets included $17.7 billion, $14.8 billion and $11.7 billion of tax-exempt municipal bond assets and $1.6 billion, $3.7 billion and $0.7 billion of cash management fund assets on October 31, 2007, 2006 and 2005, respectively. Floating-rate bank loan assets represented 13 percent of total assets under management on October 31, 2007, compared to 16 percent on October 31, 2006 and 18 percent October 31, 2005.
15
175734.FIN.CS3.indd 15175734.FIN.CS3.indd 15 1/15/08 7:17:43 PM1/15/08 7:17:43 PM

Long-Term Fund and Separate Account Net Flows
For the Years Ended October 31, 2007vs.
2006vs.
(in billions) 2007 2006 2005 2006 2005
Long-term funds: Closed-end funds $10.0 $0.3 $5.0 NM (3) -94% Open-end funds (1) 7.6 5.6 2.2 36% 155% Private funds 1.6 2.2 1.2 -27% 83% Total long-term fund net inflows 19.2 8.1 8.4 137% -4% Institutional/HNW(2) accounts - (2.1) (0.6) NM -250% Retail managed accounts 3.7 1.4 1.6 164% -13% Total separate account net inflows (outflows) 3.7 (0.7) 1.0 NM -170% Total net inflows $22.9 $7.4 $9.4 209% -21%
(1) Includes net flows of bank loan interval funds. (2) High-net-worth (“HNW”) (3) Not meaningful (“NM”)
Long-term fund net inflows totaled $19.2 billion in fiscal 2007 compared to $8.1 billion in fiscal 2006 and $8.4 billion in fiscal 2005. Closed-end fund offerings contributed significantly to net inflows in fiscal 2007, with $10.0 billion in closed-end fund assets added compared to contributions of $0.3 billion and $5.0 billion in fiscal 2006 and fiscal 2005, respectively. Open-end fund net inflows of $7.6 billion, $5.6 billion and $2.2 billion for fiscal 2007, 2006 and 2005, respectively, reflect gross inflows of $21.1 billion, $15.0 billion and $10.4 billion and redemptions of $13.5 billion, $9.4 billion and $8.2 billion in fiscal 2007, 2006 and 2005, respectively. Private funds, which include privately offered equity and bank loan funds as well as collateralized debt obligation entities, had net inflows of $1.6 billion, $2.2 billion and $1.2 billion in fiscal 2007, 2006 and 2005, respectively.
Separate accounts contributed net inflows of $3.7 billion in fiscal 2007, compared to net outflows of $0.7 billion in fiscal 2006 and net inflows of $1.0 billion fiscal 2005. Retail managed account net inflows increased to $3.7 billion in fiscal 2007 from $1.4 billion and $1.6 billion in fiscal 2006 and 2005, respectively, reflecting strong net sales of Parametric Portfolio Associates’ overlay and tax-efficient core equity products and Eaton Vance Management’s (“EVM’s”) large cap value product. Institutional and high-net-worth gross inflows of $4.4 billion in fiscal 2007 were offset by outflows of $4.4 billion, reflecting primarily withdrawals from certain low-fee institutional relationships at Atlanta Capital. Institutional and high-net-worth net outflows totaled $2.1 billion and $0.6 billion in fiscal 2006 and 2005, respectively.
Cash management fund assets, which are not included in long-term fund net flows because of their short-term characteristics, decreased to $1.6 billion on October 31, 2007 from $3.7 billion on October 31, 2006 and $0.7 billion on October 31, 2005. The decrease in cash management fund assets in fiscal 2007 can be primarily attributed to an increase in short-term treasury fund redemptions by institutional clients. The increase in cash management fund assets in fiscal 2006 can be primarily attributed to investments by institutional clients in our sponsored short-term income funds and the introduction of a cash collateral fund accompanying a securities lending program in which certain of our sponsored funds participate.
16
175734.FIN.CS3.indd 16175734.FIN.CS3.indd 16 1/15/08 7:17:43 PM1/15/08 7:17:43 PM

The following table summarizes the asset flows by investment category for fiscal years ended October 31, 2007, 2006 and 2005:
Asset FlowsFor the Years Ended
October 31,
(in billions) 2007 2006 20052007 vs.
20062006 vs.
2005
Equity fund assets – beginning $ 53.2 $ 45.2 $ 36.9 18% 22% Sales/inflows 21.7 7.8 9.7 178% -20% Redemptions/outflows (6.9) (5.4) (4.3) 28% 26% Exchanges - - - - - Market value change 7.5 5.6 2.9 34% 93% Equity fund assets – ending 75.5 53.2 45.2 42% 18%
Fixed income fund assets – beginning 21.5 18.2 17.4 18% 5% Sales/inflows 7.5 5.1 3.2 47% 59% Redemptions/outflows (3.5) (2.2) (2.0) 59% 10% Exchanges (0.1) - (0.1) NM -100% Market value change (0.8) 0.4 (0.3) NM NM Fixed income fund assets – ending 24.6 21.5 18.2 14% 18%
Floating-rate bank loan fund assets – beginning 20.0 16.8 15.0 19% 12% Sales/inflows 6.6 7.0 5.2 -6% 35% Redemptions/outflows (6.2) (4.2) (3.3) 48% 27% Exchanges (0.1) (0.1) - 0% NM Market value change 0.1 0.5 (0.1) -80% NM Floating-rate bank loan fund assets – ending 20.4 20.0 16.8 2% 19%
Total long-term fund assets – beginning 94.7 80.2 69.3 18% 16% Sales/inflows 35.8 19.9 18.1 80% 10% Redemptions/outflows (16.6) (11.8) (9.6) 41% 23% Exchanges (0.2) (0.1) (0.1) 100% 0% Market value change 6.8 6.5 2.5 5% 160% Total long-term fund assets – ending 120.5 94.7 80.2 27% 18%
Separate accounts – beginning 30.5 27.6 24.4 11% 13% Inflows – HNW and institutional 4.4 2.3 2.9 91% -21% Outflows – HNW and institutional (4.4) (4.4) (3.5) 0% 26% Inflows – retail managed accounts 6.1 3.6 3.2 69% 13% Outflows – retail managed accounts (2.4) (2.2) (1.6) 9% 38% Market value change 5.1 3.1 2.1 65% 48% Assets acquired 0.3 0.5 0.1 -40% 400% Separate accounts – ending 39.6 30.5 27.6 30% 11%
Cash management fund assets – ending 1.6 3.7 0.7 -57% 429% Assets under management – ending $ 161.7 $ 128.9 $ 108.5 25% 19%
17
175734.FIN.CS3.indd 17175734.FIN.CS3.indd 17 1/15/08 7:17:43 PM1/15/08 7:17:43 PM

Ending Assets Under Management by Asset Class
October 31, 2007 vs. 2006 vs. (in billions) 2007 2006 2005 2006 2005Open-end funds:
Class A (1) $ 35.4 $ 27.0 $ 18.8 31% 44% Class B (1) 6.0 6.8 7.7 -12% -12% Class C (1) 10.1 8.4 7.4 20% 14% Class I (1) 3.7 4.5 1.5 -18% 200% Other (2) 3.3 2.8 2.6 18% 8%
Total open-end funds 58.5 49.5 38.0 18% 30% Private funds (3) 30.0 26.4 21.8 14% 21% Closed-end funds 33.6 22.5 21.1 49% 7% Total fund assets 122.1 98.4 80.9 24% 22% HNW and institutional account assets 24.8 21.0 20.5 18% 2%Retail managed account assets 14.8 9.5 7.1 56% 34%Total separate account assets 39.6 30.5 27.6 30% 11% Total $ 161.7 $ 128.9 $ 108.5 25% 19%
(1) Includes bank loan interval funds with similar pricing structures. (2) Includes other classes of Eaton Vance open-end funds and non-Eaton Vance funds subadvised by Atlanta
Capital, Fox Asset Management and Parametric Portfolio Associates. (3) Includes privately offered equity and bank loan funds and CDO entities.
We currently sell our sponsored open-end mutual funds under four primary pricing structures: front-end load commission (“Class A”); spread-load commission (“Class B”); level-load commission (“Class C”); and institutional no-load (“Class I”). We waive the sales load on Class A shares under certain circumstances. In such cases, the shares are sold at net asset value.
Fund assets represented 76 percent of total assets under management at October 31, 2007, compared to 76 percent and 75 percent at October 31, 2006 and 2005, respectively. Class A share assets increased to 22 percent of total assets under management at October 31, 2007 from 21 percent and 17 percent at October 31, 2006 and 2005, respectively, while Class B shares dropped to 4 percent at October 31, 2007 from 5 percent and 7 percent at October 31, 2006 and 2005, respectively. The shift from Class B share assets to Class A share assets reflects the overall increasing popularity of Class A shares and the declining popularity of Class B shares in broker/dealer distribution systems. Class C share assets represented 6 percent of total assets under management on October 31, 2007, and 7 percent on both October 31, 2006 and 2005, while Class I share assets represented 2 percent of total assets under management on October 31, 2007, compared to 3 percent on October 31, 2006 and 1 percent on October 31, 2005. Private funds represented 19 percent of total assets under management at October 31, 2007, compared to 20 percent on both October 31, 2006 and 2005. Closed-end funds increased to 21 percent of the Company’s total assets under management on October 31, 2007, up from 17 percent on October 31, 2006 and 19 percent on October 31, 2005.
Separate account assets, including high-net-worth, institutional and retail managed account assets, totaled $39.6 billion at October 31, 2007, up from $30.5 billion and $27.6 billion at October 31, 2006 and 2005, respectively. High-net-worth and institutional account assets increased by 18 percent and 2 percent in fiscal 2007 and 2006, respectively, while retail managed account assets increased by 56 percent and 34 percent in the same periods. Retail managed account assets were positively impacted in both fiscal 2007 and 2006 by strong net sales of Parametric Portfolio Associates’ overlay and tax-efficient core equity products and EVM’s large-cap value product.
18
175734.FIN.CS3.indd 18175734.FIN.CS3.indd 18 1/15/08 7:17:43 PM1/15/08 7:17:43 PM

The average assets under management presented in the following table represent a monthly average by asset class. This table is intended to provide useful information in the analysis of our asset-based revenue and distribution expenses. With the exception of our separate account investment advisory fees, which are generally calculated as a percentage of either beginning, average or ending quarterly assets, our investment advisory, administration, distribution and service fees are calculated as a percentage of average daily assets.
Average Assets Under Management by Asset Class (1)
For the Years Ended October 31, 2007 vs. 2006 vs.
(in billions) 2007 2006 2005 2006 2005Open-end funds:
Class A (2) $ 31.8 $ 22.7 $ 17.2 40% 32% Class B (2) 6.4 7.3 8.3 -12% -12% Class C (2) 9.4 7.8 7.3 21% 7% Class I (2) 3.0 2.4 1.2 25% 100% Other (3) 2.8 2.5 2.3 12% 9%
Total open-end funds 53.4 42.7 36.3 25% 18% Private funds (4) 28.5 23.7 20.9 20% 13% Closed-end funds 29.9 21.8 18.2 37% 20% Total fund assets 111.8 88.2 75.4 27% 17% HNW and institutional account assets 22.2 21.0 20.0 6% 5% Retail managed account assets 12.0 8.2 6.1 46% 34% Total separate account assets 34.2 29.2 26.1 17% 12% Total $ 146.0 $ 117.4 $ 101.5 24% 16%
(1) Assets under management attributable to acquisitions that closed during the relevant periods are included on a weighted average basis for the period from their respective closing dates.
(2) Includes bank loan interval funds with similar pricing structures. (3) Includes other classes of Eaton Vance open-end funds and non-Eaton Vance funds subadvised by Atlanta
Capital, Fox Asset Management and Parametric Portfolio Associates. (4) Includes privately offered equity and bank loan funds and CDO entities.
Results of Operations
We reported net income of $142.8 million, or $1.06 per diluted share, in fiscal 2007 compared to $159.4 million, or $1.17 per diluted share, in fiscal 2006 and $138.7 million, or $0.99 per diluted share, in fiscal 2005. Operating results for fiscal 2007 reflect the payment of $76.0 million in one-time structuring fees and $14.8 million in marketing incentives related to three closed-end funds offered during the fiscal year. These one-time structuring fees and marketing incentives, which are included in distribution expense and compensation expense, respectively, reduced fiscal 2007 earnings by $0.41 per diluted share. Operating results for fiscal 2007 also include payments totaling $52.2 million to Merrill, Lynch, Pierce, Fenner & Smith and A.G. Edwards & Sons, Inc. to terminate compensation agreements in respect of certain of our previously offered closed-end funds under which we were obligated to make payments over time based on the assets of the respective closed-end funds. These one-time termination payments, which are included in distribution expense, reduced diluted earnings for fiscal 2007 by approximately $0.24 per share. Earnings for the fiscal year were also reduced by $3.9 million, or $0.02 per diluted share, by costs associated with the management reorganization of Eaton Vance Distributors, Inc. (“EVD”) announced in October and a loss of $6.7 million, or $0.03 per diluted share, realized on an interest rate lock entered into in connection with the offering of senior notes.
19
175734.FIN.CS3.indd 19175734.FIN.CS3.indd 19 1/15/08 7:17:43 PM1/15/08 7:17:43 PM

Fiscal 2006 results include the acceleration of non-cash amortization to write off intangible assets of $8.9 million, or $0.04 per diluted share, relating to the termination of certain institutional and high-net-worth asset management contracts at Fox Asset Management, as well as the recognition of $9.8 million in interest expense and the write-off of $1.5 million of deferred financing fees associated with the retirement of EVM’s zero-coupon exchangeable notes in August 2006. The additional interest expense and the write-off of the deferred financing fees reduced fiscal 2006 earnings by $0.06 per diluted share.
In conjunction with the adoption of Statement of Financial Accounting Standards (“SFAS”) No. 123R, “Share-Based Payment,” in the first quarter of fiscal 2006, we recognized a cumulative effect of change in accounting principle. In our calculations of stock option expense for the purposes of pro forma disclosure in previous filings, we chose to recognize forfeitures when they occurred rather than estimate them at grant date. Upon adoption of SFAS No. 123R, we were required to recognize the difference between actual forfeitures of awards granted prior to adoption and the calculation of expected forfeitures for these awards as an adjustment to compensation cost. The cumulative effect, net of tax, was $0.6 million.
Results of Operations
For the Years Ended October 31,
(in thousands, except per share data) 2007 2006 20052007 vs.
20062006 vs.
2005
Net income $142,811 $159,377 $138,706 -10% 15% Earnings per share before cumulative effect of change in accounting principle: Basic $1.15 $1.25 $1.05 -8% 19% Diluted $1.06 $1.18 $0.99 -10% 19% Earnings per share: Basic $1.15 $1.25 $1.05 -8% 19% Diluted $1.06 $1.17 $0.99 -9% 18% Operating margin 21% 31% 31% NM NM
In evaluating operating performance we consider operating income and net income, which are calculated on a basis consistent with accounting principles generally accepted in the United States of America (“GAAP”), as well as adjusted operating income, an internally derived non-GAAP performance measure. We define adjusted operating income as operating income plus closed-end fund structuring fees and one-time payments, stock-based compensation and any write-off of intangible assets or goodwill. We believe that adjusted operating income is a key indicator of our ongoing profitability and therefore use this measure as the basis for calculating performance-based management incentives. Adjusted operating income is not, and should not be construed to be, a substitute for operating income computed in accordance with GAAP. However, in assessing the performance of the business, our management and the Board of Directors look at adjusted operating income as a measure of underlying performance, since amounts resulting from one-time events (e.g., the offering of a closed-end fund) do not necessarily represent normal results of operations. In addition, when assessing performance, management and the Board look at performance both with and without stock-based compensation.
20
175734.FIN.CS3.indd 20175734.FIN.CS3.indd 20 1/15/08 7:17:43 PM1/15/08 7:17:43 PM

The following table provides a reconciliation of operating income to adjusted operating income:
For the Years Ended October 31,
(in thousands) 2007 2006 20052007 vs.
20062006 vs.
2005
Operating income $ 232,937 $ 264,966 $ 232,607 -12% 14% Closed-end fund structuring fees 75,998 1,610 9,290 NM -83% Payments to terminate closed- end fund compensation agreements 52,178 - - NM NM Write-off of intangible assets - 8,876 - NM NM Stock-based compensation 43,304 36,314 28,655 19% 27% Adjusted operating income $ 404,417 $ 311,766 $ 270,552 30% 15% Adjusted operating margin 37% 36% 36%
Revenue
Our average effective fee rate (total revenue as a percentage of average assets under management) was 74 basis points in fiscal 2007 compared to 73 basis points in fiscal 2006 and 74 basis points in fiscal 2005.
Revenue For the Years Ended
October 31,
(in thousands) 2007 2006 20052007 vs.
20062006 vs.
2005
Investment advisory and administration fees $ 773,612 $ 594,632 $ 503,085 30% 18% Distribution and underwriter fees (1) 148,369 139,111 138,485 7% 0% Service fees (1) 154,736 124,025 105,202 25% 18% Other revenue 7,383 4,426 6,403 67% -31% Total revenue $ 1,084,100 $ 862,194 $ 753,175 26% 14%
(1) Certain amounts from prior years have been reclassified to conform to the current year presentation. See footnote 1 in Item 8 for further discussion of this change.
Investment advisory and administration fees Investment advisory and administration fees are determined by contractual agreements with our sponsored funds and separate accounts and are generally based upon a percentage of the market value of assets under management. Net asset flows and changes in the market value of managed assets affect the amount of managed assets on which investment advisory and administration fees are earned, while shifts in asset mix affect the Company’s average effective fee rate.
The increase in investment advisory and administration fees of 30 percent and 18 percent in fiscal 2007 and 2006, respectively, over the same periods a year earlier can be attributed primarily to an increase in average assets under management, which increased by 24 percent and 16 percent in fiscal 2007 and 2006, respectively, and a modest increase in our average effective investment advisory and administration fee rates. Fund average effective fee rates increased to 59 basis points in fiscal 2007 from 57 basis points and 56 basis points in fiscal 2006 and 2005, respectively. Separately managed account average effective fee rates were 32 basis points in fiscal 2007, 2006 and 2005.
21
175734.FIN.CS3.indd 21175734.FIN.CS3.indd 21 1/15/08 7:17:43 PM1/15/08 7:17:43 PM

Distribution and underwriter fees Distribution plan payments, which are made under contractual agreements with our sponsored funds, are calculated as a percentage of average assets under management in specific share classes of our mutual funds, as well as certain private funds. These fees fluctuate with both the level of average assets under management and the relative mix of assets. Underwriter commissions are earned on the sale of shares of our sponsored mutual funds on which investors pay a sales charge at the time of purchase (Class A share sales). Sales charges and underwriter commissions are waived or reduced on sales that exceed specified minimum amounts and on certain categories of sales. Underwriter commissions fluctuate with the level of Class A share sales and the mix of Class A shares offered with and without sales charges.
Distribution plan payments increased 6 percent, or $7.1 million, to $133.3 million in fiscal 2007, reflecting an increase in average Class A, Class C and certain private fund assets subject to distribution fees, partially offset by a decrease in average Class B share assets. Class A share distribution fees increased by 124 percent to $2.3 million, reflecting a 131 percent increase in average Class A share assets that are subject to distribution fees (primarily in funds advised by Lloyd George Management). Class C and certain private fund distribution fees increased by 21 percent and 15 percent to $67.5 million and $13.7 million, respectively, reflecting increases in average assets subject to distribution fees of 20 percent and 12 percent, respectively. Class B share distribution fees decreased by 14 percent to $49.5 million, reflecting a decrease in average Class B share assets under management of 12 percent year-over-year. Underwriter fees and other distribution income increased 17 percent, or $2.2 million, to $15.0 million in fiscal 2007, primarily reflecting an increase of $0.4 million in underwriter fees received on sales of Class A shares and an increase of $1.3 million in contingent deferred sales charges received on certain Class A share redemptions.
Distribution plan payments decreased 4 percent, or $4.8 million, to $126.3 million in fiscal 2006, reflecting a decrease in average Class B share assets subject to distribution fees, partially offset by an increase in average Class A, Class C and certain private fund assets subject to distribution fees. Class B share distribution fees decreased by 13 percent to $57.7 million, reflecting a decrease in average Class B share assets under management of 12 percent. Class A share distribution fees increased by 44 percent to $1.0 million, reflecting a 56 percent increase in average Class A share assets under management subject to distribution fees. Class C and certain private fund distribution fees increased by 5 percent and 14 percent to $55.6 million and $11.9 million, respectively, reflecting increases in average assets subject to distribution fees of 6 percent and 7 percent, respectively. Underwriter fees and other distribution income increased 61 percent, or $4.8 million, to $12.8 million in fiscal 2006, primarily reflecting an increase of $3.3 million in underwriter fees received on sales of Class A shares and an increase of $1.0 million in contingent deferred sales charges received on certain Class A share redemptions.
Service fees Service plan payments, which are made under contractual agreements with our sponsored funds, are calculated as a percent of average assets under management in specific share classes of our mutual funds (principally Classes A, B and C) as well as certain private funds. Service fees represent payments made by sponsored funds to EVD as principal underwriter for service and/or the maintenance of shareholder accounts.
Service fee revenue increased by 25 percent in fiscal 2007, primarily reflecting a 23 percent increase in average assets under management in Class A, B, and C shares and private funds that pay service fees. Service fee revenue increased by 18 percent in fiscal 2006, reflecting a 15 percent increase in average Class A, B, C and certain private fund assets under management.
22
175734.FIN.CS3.indd 22175734.FIN.CS3.indd 22 1/15/08 7:17:44 PM1/15/08 7:17:44 PM

Other revenue Other revenue, which consists primarily of shareholder service fees, miscellaneous dealer income, custody fees, and investment income earned by consolidated funds, increased by 67 percent in fiscal 2007. The increase in other revenue in fiscal 2007 can be attributed primarily to realized and unrealized gains and losses on securities classified as trading. The 31 percent decrease in other revenue in fiscal 2006 can be attributed primarily to a decrease in investment income related to Eaton Vance Institutional Short Term Income Fund and Eaton Vance Institutional Short Term Treasury Fund, which we stopped consolidating in April 2005 and April 2006, respectively. Other revenue for fiscal 2007, 2006 and 2005 includes $1.5 million, $1.2 million and $2.2 million, respectively, of investment income related to consolidated funds and certain limited partnerships for the periods during which they were consolidated.
Expenses
Operating expenses increased by 43 percent in fiscal 2007, primarily reflecting increases in compensation and distribution expense driven by the offering of $10.0 billion in new closed-end funds in fiscal 2007, current year payments to terminate certain closed-end fund compensation agreements, an increase in adjusted operating income-based incentives driven by increased profitability, an increase in asset-based distribution expenses driven by an increase in average assets under management and an increase in other operating expenses as described below. Operating expenses increased by 15 percent in fiscal 2006, primarily reflecting increases in stock-based compensation associated with the implementation of SFAS No. 123R, increases in asset-based distribution expenses associated with an increase in average assets under management and increases in fund and other operating expenses as described below.
Expenses For the Years Ended
October 31,
(in thousands) 2007 2006 20052007 vs.
20062006 vs.
2005Compensation of officers and employees: Cash compensation $ 273,659 $ 208,306 $ 177,008 31% 18% Stock-based compensation 43,304 36,314 28,655 19% 27% Total compensation of officers and employees 316,963 244,620 205,663 30% 19% Distribution expense (1) 253,344 114,052 101,661 122% 12% Service fee expense (1) 121,748 98,262 87,983 24% 12% Amortization of deferred sales commissions 55,060 52,048 63,535 6% -18% Fund expenses 19,974 16,589 12,019 20% 38% Other expenses 84,074 71,657 49,707 17% 44% Total expenses $ 851,163 $ 597,228 $ 520,568 43% 15%
(1) Certain amounts from prior years have been reclassified to conform to the current year presentation. See footnote 1 in Item 8 for further discussion of this change.
Compensation of officers and employees Compensation expense increased by 30 percent in fiscal 2007, reflecting increases in both cash and stock-based compensation expense. The increase in cash compensation expense of 31 percent, or $65.4 million, can be primarily attributed to $14.8 million in closed-end fund incentive compensation paid; an increase in other sales incentives of $10.0 million, reflecting the increase in open-end fund and retail managed account sales; an increase in base compensation, employee benefits and payroll taxes of 14 percent, or $14.0 million, reflecting an 11 percent increase in average headcount; an increase in severance costs of $3.9 million associated with the reorganization of EVD in October 2007; and an increase in adjusted operating income-
23
175734.FIN.CS3.indd 23175734.FIN.CS3.indd 23 1/15/08 7:17:44 PM1/15/08 7:17:44 PM

based incentives of 36 percent or, $23.5 million, primarily reflecting a 30 percent increase in adjusted operating income. The increase in headcount in fiscal 2007 reflects additions to our investment management, marketing and operations teams. Stock-based compensation increased by 19 percent or $7.0 million, reflecting an 11 percent increase in average headcount and the acceleration of the recognition of stock-based compensation expense associated with option grants made to retirement-eligible employees.
Compensation expense increased by 19 percent in fiscal 2006 reflecting an 18 percent, or $31.3 million, increase in cash compensation expense and a 27 percent, or $7.7 million, increase in stock-based compensation expense. The increase in cash compensation expense can be primarily attributed to an increase in base compensation, employee benefits and income taxes of 19 percent, or $12.6 million, reflecting a 15 percent increase in average headcount and an increase in adjusted operating income-based incentives of 29 percent, or $14.7 million, reflecting in part a 15 percent increase in adjusted operating income. Stock-based compensation increased by 27 percent, or $7.7 million, reflecting in part a 15 percent increase in average headcount and the acceleration of the recognition of stock-based compensation associated with option grants made to retirement-eligible employees.
Our retirement policy provides that an employee is eligible for retirement at age 65, or for early retirement when the employee reaches age 55 and has a combined age plus years of service of at least 75 years or with our consent. Because many of our outstanding stock options allow for nonforfeiture of options upon retirement, the adoption of SFAS No. 123R on November 1, 2005 resulted in the immediate recognition of compensation expense at grant date for all awards granted to retirement-eligible employees on or after the adoption of SFAS No. 123R. For awards granted to employees approaching retirement eligibility, the adoption of SFAS No. 123R resulted in compensation expense on a straight-line basis over the period from the grant date through the retirement eligibility date. Stock-based compensation expense for employees who will not become retirement eligible during the vesting period of the options (five years) is recognized on a straight-line basis. Prior to the implementation of SFAS No. 123R, and consistent with SFAS No. 123, it had been our policy to recognize all stock-based compensation expense over the vesting period without regard to retirement eligibility.
The accelerated recognition of compensation cost for employees who are retirement-eligible or are nearing retirement eligibility under our retirement policy is applicable for all grants made on or after our adoption of SAFS No. 123R (November 1, 2005). The accelerated recognition of compensation expense associated with stock option grants to retirement-eligible employees in the quarter when the options are granted (the first quarter of each fiscal year) reduces the associated stock-based compensation expense recognized in subsequent quarters.
Distribution expense Distribution expense consists primarily of ongoing payments made to distribution partners pursuant to third-party distribution arrangements for certain Class C share and closed-end fund assets, calculated as a percentage of average assets under management, commissions paid to broker/dealers on the sale of Class A shares at net asset value, structuring fees paid on new closed-end fund offerings and other marketing expenses, including marketing expenses associated with revenue sharing arrangements with our distribution partners.
Distribution expense increased by 122 percent, or $139.3 million, in fiscal 2007, primarily reflecting the payment of $76.0 million in one-time structuring fees associated with the offering of three closed-end funds: Eaton Vance Tax-Managed Diversified Equity Fund in the first quarter of fiscal 2007, Eaton Vance Tax-Managed Global Diversified Equity Income Fund in the second quarter of fiscal 2007, and Eaton Vance Risk-Managed Diversified Equity Income Fund in the third quarter of fiscal 2007. Distribution expense for fiscal 2007 also includes $52.2 million in payments made to Merrill Lynch, Pierce, Fenner & Smith and A.G. Edwards & Sons, Inc. to terminate certain closed-end fund compensation agreements under which we were obligated to make recurring payments over time based on the assets of the respective closed-end funds. Class C distribution fees increased by $6.2 million to $46.1 million in fiscal
24
175734.FIN.CS3.indd 24175734.FIN.CS3.indd 24 1/15/08 7:17:44 PM1/15/08 7:17:44 PM
2007, reflecting the increase in Class C share sales and assets year-over-year. Marketing expenses associated with revenue sharing arrangements with our distribution partners increased by $6.7 million to $26.1 million in fiscal 2007, reflecting the increase in sales and assets under management that are subject to these arrangements.
Distribution expense increased by 12 percent in fiscal 2006, largely as a result of increases in average closed-end fund assets and other assets subject to third-party distribution and revenue-sharing arrangements.
Service fee expense Service fees we receive from sponsored funds are generally retained in the first year and paid to broker/dealers after the first year pursuant to third-party service arrangements. These fees are calculated as a percent of average assets under management in specific share classes of our mutual funds (principally Classes A, B, and C) as well as certain private funds. Service fee expense increased by 24 percent in fiscal 2007 and 12 percent in fiscal 2006, reflecting increases in average fund assets retained more than one year in funds and share classes that are subject to service fees.
Amortization of deferred sales commissions Amortization expense is affected by ongoing sales and redemptions of mutual fund Class B shares, Class C shares and certain private funds. Amortization of deferred sales commissions increased by 6 percent in fiscal 2007 due to the increase in Class C share deferred sales commissions, which are amortized over a 12 month period, offset by a decrease in Class B share deferred sales commissions, which are amortized over a period not to exceed six years. Class C share sales increased by 38 percent in fiscal 2007, while Class B share sales declined by 24 percent. As a result of this change in product mix, amortization of deferred sales commissions as a percentage of average deferred sales commission assets increased to 51 percent in fiscal 2007 from 44 percent in fiscal 2006.
Amortization expense in fiscal 2006 decreased by 18 percent, primarily reflecting a decrease in Class B share deferred sales commissions.
Fund expenses Fund expenses consist primarily of fees paid to subadvisors, compliance costs and other fund-related expenses we incurred. Fund expenses increased by 20 percent in fiscal 2007 and 38 percent in fiscal 2006, primarily reflecting increases in subadvisory fees and other fund-related expenses. The increase in subadvisory fees can be attributed to the increase in average assets under management in funds for which external investment advisors act as subadvisors. The increase in other fund-related expenses can be attributed to an increase in fund expenses for certain institutional funds for which we are paid an all-in management fee and bear the funds’ non-advisory expenses.
Other expenses Other expenses consist primarily of travel, facilities, information technology, consulting, communications and other corporate expenses, including the amortization of intangible assets.
Other expenses increased by 17 percent, or $12.4 million, in fiscal 2007, primarily reflecting increases in travel expense of $2.8 million, facilities-related expenses of $5.9 million, information technology expense of $8.9 million and consulting expense of $3.2 million offset by a decrease in the amortization of intangible assets of $9.0 million. The increase in travel expense can be attributed primarily to additional travel costs incurred in connection with the three closed-end fund offerings during the fiscal year. The increase in facilities-related expenses can be attributed to an increase in rent and insurance associated with additional office space leased to support the growth in headcount and accelerated amortization of leasehold improvements in anticipation of our move to new corporate headquarters in Boston in fiscal 2009. The increase in information technology expense can be attributed to an increase in outside data services and consulting costs incurred in conjunction with several significant system implementations. The increase in consulting costs can be attributed primarily to increases in recruiting, other general consulting and audit costs
25
175734.FIN.CS3.indd 25175734.FIN.CS3.indd 25 1/15/08 7:17:44 PM1/15/08 7:17:44 PM
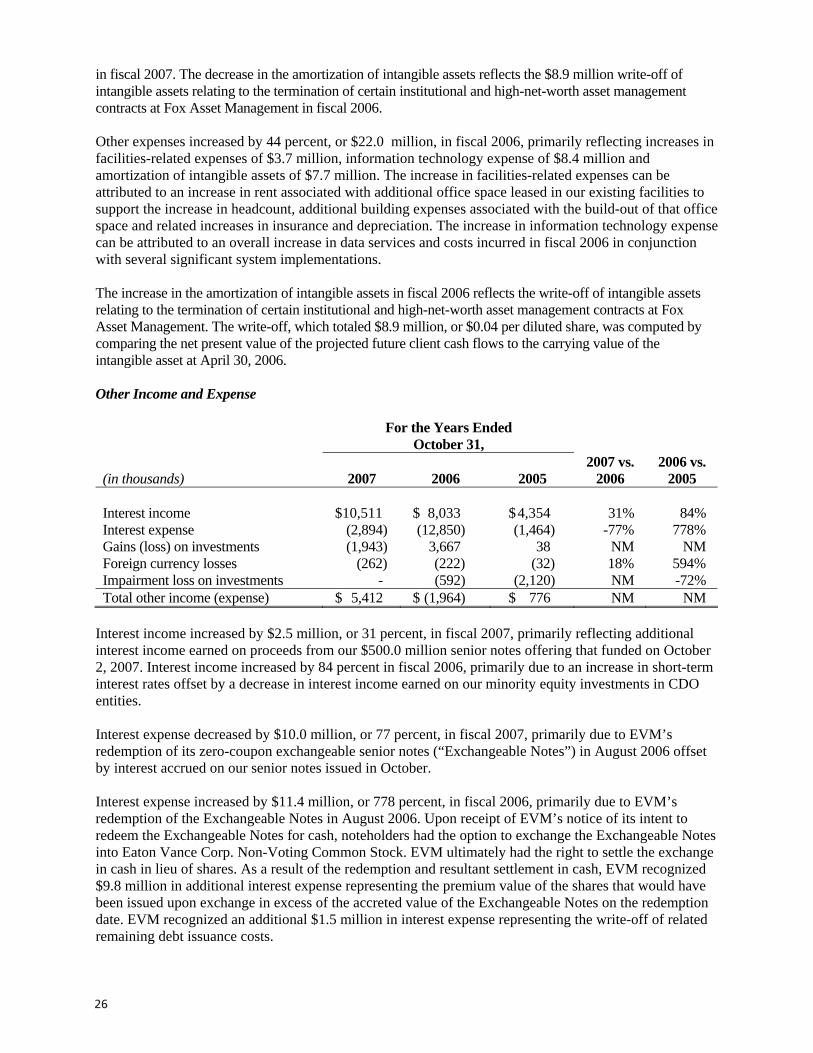
in fiscal 2007. The decrease in the amortization of intangible assets reflects the $8.9 million write-off of intangible assets relating to the termination of certain institutional and high-net-worth asset management contracts at Fox Asset Management in fiscal 2006.
Other expenses increased by 44 percent, or $22.0 million, in fiscal 2006, primarily reflecting increases in facilities-related expenses of $3.7 million, information technology expense of $8.4 million and amortization of intangible assets of $7.7 million. The increase in facilities-related expenses can be attributed to an increase in rent associated with additional office space leased in our existing facilities to support the increase in headcount, additional building expenses associated with the build-out of that office space and related increases in insurance and depreciation. The increase in information technology expense can be attributed to an overall increase in data services and costs incurred in fiscal 2006 in conjunction with several significant system implementations.
The increase in the amortization of intangible assets in fiscal 2006 reflects the write-off of intangible assets relating to the termination of certain institutional and high-net-worth asset management contracts at Fox Asset Management. The write-off, which totaled $8.9 million, or $0.04 per diluted share, was computed by comparing the net present value of the projected future client cash flows to the carrying value of the intangible asset at April 30, 2006.
Other Income and Expense
For the Years Ended October 31,
(in thousands) 2007 2006 20052007 vs.
20062006 vs.
2005
Interest income $10,511 $ 8,033 $ 4,354 31% 84% Interest expense (2,894) (12,850) (1,464) -77% 778% Gains (loss) on investments (1,943) 3,667 38 NM NM Foreign currency losses (262) (222) (32) 18% 594% Impairment loss on investments - (592) (2,120) NM -72% Total other income (expense) $ 5,412 $ (1,964) $ 776 NM NM
Interest income increased by $2.5 million, or 31 percent, in fiscal 2007, primarily reflecting additional interest income earned on proceeds from our $500.0 million senior notes offering that funded on October 2, 2007. Interest income increased by 84 percent in fiscal 2006, primarily due to an increase in short-term interest rates offset by a decrease in interest income earned on our minority equity investments in CDO entities.
Interest expense decreased by $10.0 million, or 77 percent, in fiscal 2007, primarily due to EVM’s redemption of its zero-coupon exchangeable senior notes (“Exchangeable Notes”) in August 2006 offset by interest accrued on our senior notes issued in October.
Interest expense increased by $11.4 million, or 778 percent, in fiscal 2006, primarily due to EVM’s redemption of the Exchangeable Notes in August 2006. Upon receipt of EVM’s notice of its intent to redeem the Exchangeable Notes for cash, noteholders had the option to exchange the Exchangeable Notes into Eaton Vance Corp. Non-Voting Common Stock. EVM ultimately had the right to settle the exchange in cash in lieu of shares. As a result of the redemption and resultant settlement in cash, EVM recognized $9.8 million in additional interest expense representing the premium value of the shares that would have been issued upon exchange in excess of the accreted value of the Exchangeable Notes on the redemption date. EVM recognized an additional $1.5 million in interest expense representing the write-off of related remaining debt issuance costs.
26
175734.FIN.CS3.indd 26175734.FIN.CS3.indd 26 1/15/08 7:17:44 PM1/15/08 7:17:44 PM

In fiscal 2007, we incurred net realized losses on investments totaling $1.9 million, consisting of a $6.7 million loss on the termination of an interest rate lock offset by net investment gains of $3.0 million realized on the disposition of certain investments in sponsored funds and $1.8 million realized on the liquidation of an investment in a collateralized debt obligation entity, respectively. The interest rate lock was entered into as a hedge against adverse movements in Treasury rates in anticipation of the issuance of senior notes with a maturity in excess of ten years. When we determined that we would not issue senior notes with a maturity in excess of ten years, the interest rate lock was terminated and the net settlement amount was recorded as a loss on investments.
In fiscal 2006, we recognized net gains of $2.2 million upon the disposition of certain investments in sponsored funds and $1.4 million in gains on liquidation of investments in two CDO entities.
In addition, we recognized an impairment loss of $0.6 million in fiscal 2006 related to our investments in two CDO entities. The impairment loss resulted from the effect of tightening credit spreads and higher than forecasted prepayment rates on the entities’ investments.
Income Taxes
Our effective tax rate (income taxes as a percentage of income before income taxes, minority interest, equity in net income of affiliates, and the cumulative effect of a change in accounting principle) was 39 percent in fiscal 2007, 2006 and 2005.
Our policy for accounting for income taxes includes monitoring our business activities and tax policies to ensure that we are in compliance with federal, state and foreign tax laws. In the ordinary course of business, various taxing authorities may not agree with certain tax positions we have taken, or applicable law may not be clear. We periodically review these tax positions and provide for and adjust as necessary estimated liabilities relating to such positions as part of our overall tax provision. There were no significant changes to our overall tax position during fiscal 2007.
Minority Interest
Minority interest increased by 23 percent, 1 percent and 10 percent in fiscal 2007, 2006 and 2005, respectively, primarily due to the increased profitability of majority-owned subsidiaries Atlanta Capital and Parametric Portfolio Associates.
Minority interest is not adjusted for taxes due to the underlying tax status of our consolidated subsidiaries. Atlanta Capital, Fox Asset Management, Parametric Portfolio Associates and Parametric Risk Advisors are limited liability companies that are treated as partnerships for tax purposes. Funds we consolidate are registered investment companies or private funds that are treated as pass-through entities for tax purposes.
Equity in Net Income of Affiliates, Net of Tax
Equity in net income of affiliates, net of tax, at October 31, 2007 reflects our 20 percent minority equity interest in Lloyd George Management and a 7 percent minority equity interest in a private equity partnership. Equity in net income of affiliates, net of tax, decreased by $0.4 million, or 10 percent, in fiscal 2007 primarily due to our sale of certain investments in sponsored mutual funds that were accounted for under the equity method in prior periods, offset by increases in equity in net income of both Lloyd George Management and the private equity partnership. Equity in net income of affiliates, net of tax, increased by $3.1 million, or 253 percent, in fiscal 2006, primarily due to a $2.8 million increase in net income (after tax) attributed to our minority equity investment in Eaton Vance Institutional Short Term Income Fund.
27
175734.FIN.CS3.indd 27175734.FIN.CS3.indd 27 1/15/08 7:17:44 PM1/15/08 7:17:44 PM

Changes in Financial Condition and Liquidity and Capital Resources
The following table summarizes certain key financial data relating to our liquidity and capital resources on October 31, 2007, 2006 and 2005 and for the years then ended:
Balance Sheet and Cash Flow Data
October 31,
(in thousands) 2007 2006 20052007 vs.
20062006 vs.
2005Balance sheet data: Cash and cash equivalents $434,957 $206,705 $146,389 110% 41% Short-term investments 50,183 20,669 127,858 143% -84% Long-term investments 86,111 73,075 61,766 18% 18% Deferred sales commissions 99,670 112,314 126,113 -11% -11%
Long-term debt 500,000 - 75,467 NM -100% Deferred income taxes 11,740 22,520 29,804 -48% -24%
For the Years Ended October 31,
(in thousands) 2007 2006 20052007 vs.
20062006 vs.
2005Cash flow data: Operating cash flows $266,357 $262,851 $104,052 1% 153% Investing cash flows (75,354) (26,197) (30,868) 188% -15% Financing cash flows 37,196 (176,407) (73,856) NM 139%
Our financial condition is highly liquid, with a significant percentage of our assets represented by cash and cash equivalents. Short-term investments include investments in our sponsored cash management funds. Long-term investments consist principally of investments in certain of our sponsored mutual funds, investments in affiliates and investments in CDO entities.
We had significant demands on our cash flow during fiscal 2007. Cash outflows included $52.2 million in one-time payments made by the Company to terminate certain closed-end fund compensation agreements, $76.0 million in structuring fee payments related to new closed-end fund offerings and $14.8 million in sales-based incentives related to new closed-end fund offerings.
Deferred sales commissions paid to broker/dealers in connection with the distribution of the Company’s Class B and Class C fund shares, as well as certain private funds, decreased by 11 percent in both fiscal 2007 and fiscal 2006, primarily reflecting the ongoing decline in Class B share sales and assets. Deferred income taxes, which relate principally to the deferred tax liability for deferred sales commissions offset by the deferred tax benefit for stock-based compensation, decreased by 48 percent in fiscal 2007 and 24 percent in fiscal 2006. Upon adoption of SFAS No. 123R in the first quarter of fiscal 2006, the Company established a deferred tax asset of $21.3 million.
In October 2007, we issued $500.0 million in aggregate principal amount of 6.5% ten-year senior notes due 2017.
28
175734.FIN.CS3.indd 28175734.FIN.CS3.indd 28 1/15/08 7:17:44 PM1/15/08 7:17:44 PM

The following table details our future contractual obligations as of October 31, 2007:
Contractual Obligations Payments due
(in millions) Total Less than 1
Year 1-3
Years 4-5
Years After 5 Years
Operating leases – facilities and equipment $198.9 $10.4 $25.4 $26.1 $137.0Senior notes 500.0 - - - 500.0Investment in private equity partnership 7.4 - 7.4 - -Total $706.3 $10.4 $32.8 $26.1 $637.0
In July 2006, we committed to invest $15.0 million in a private equity partnership that invests in companies in the financial services industry. As of October 31, 2007, we had invested $7.6 million of the total $15.0 million of committed capital.
In September 2006, we signed a long-term lease to move the Company’s corporate headquarters to a new location in Boston. The lease will commence in May 2009.
Excluded from the table above are future payments to be made by us to purchase the interests retained by minority investors in Atlanta Capital, Fox Asset Management, Parametric Portfolio Associates and Parmetric Risk Advisors. The acquisition agreements provide the minority shareholders the right to require us to purchase these retained interests at specific intervals over time. These agreements also provide us with the right to require the minority shareholders to sell their retained equity interests to us at specific intervals over time, as well as upon the occurrence of certain events such as death and permanent disability. These purchases and sales can occur at varying times in varying amounts over the next six years, and will generally be based upon a multiple of earnings before interest and taxes, a measure that is intended to represent fair market value. Although the timing and amounts of these purchases cannot be predicted with certainty, we anticipate that the purchase of minority interests in our consolidated subsidiaries may be a significant use of cash in future years.
In the third quarter of fiscal 2007, minority shareholders of Parametric Portfolio Associates exercised a put option whereby units representing a 2 percent capital interest in Parametric Portfolio Associates were sold to us for $6.1 million, increasing our capital ownership interest from 82 to 84 percent. In addition, we purchased a 3 percent interest in Atlanta Capital from minority interest holders for $2.9 million upon exercise of a minority investor put option in the third quarter of fiscal 2007, increasing the Company’s ownership interest from 77 percent to 80 percent. The additional purchase price in each case was allocated between intangible assets and goodwill based on an independent valuation. Minority interest decreased by $0.3 million as a result of these transactions.
In April 2007, Parametric Portfolio Associates announced the signing of a definitive agreement with Managed Risk Advisors, LLC, an investment management and derivatives investment advisory firm based in Westport, Connecticut, to merge with Parametric Risk Advisors LLC, a newly formed Parametric Portfolio Associates’ affiliate. The transaction was completed on May 1, 2007. Parametric Risk Advisors is owned 60 percent by its principals and 40 percent by Parametric Portfolio Associates. Pursuant to the acquisition agreements, Parametric Portfolio Associates will have the right to require the other shareholders in Parametric Risk Advisors to sell their equity interests to Parametric Portfolio Associates at specific intervals over time at a price based upon a multiple of earnings before interest and taxes, a measure that is intended to represent fair market value.
In fiscal 2006, the Company exercised a call option and purchased an additional 2 percent interest in Parametric Portfolio Associates from minority interest holders for $4.0 million, increasing the Company’s capital ownership interest from 80 percent to 82 percent. In addition, the Company purchased an additional 7 percent interest in Atlanta Capital from minority interest holders for $7.2 million upon exercise of a minority
29
175734.FIN.CS3.indd 29175734.FIN.CS3.indd 29 1/15/08 7:17:44 PM1/15/08 7:17:44 PM

investor put option, increasing the Company’s ownership from 70 to 77 percent. The additional purchase price in each case was allocated between intangible assets and goodwill based on independent valuations. Minority interest decreased by $0.3 million as a result of these transactions.
On July 28, 2006, EVM announced its intention to redeem for cash all of its outstanding Exchangeable Notes ($110.9 million principal amount at maturity with an accreted value on redemption date of $76.4 million). Upon receipt of EVM’s notice of its intent to redeem, holders of the Exchangeable Notes had the option to exchange the Exchangeable Notes into Eaton Vance Corp. Non-Voting Common Stock at a rate of 28.7314 shares of common stock per $1,000 principal amount at maturity. All but $6,000 principal amount at maturity of the Exchangeable Notes were tendered for exchange into the Company’s Non-Voting Common Stock. EVM elected to pay the holders cash in lieu of delivering stock as provided for in the indenture agreement governing the Exchangeable Notes. As a result, EVM paid $86.2 million to holders who presented their Exchangeable Notes for exchange. The remaining Exchangeable Notes with a principal amount at maturity of $6,000 were redeemed by the Company for cash in the aggregate amount of $4,130.
The redemption of the Exchangeable Notes described above resulted in the elimination of all of the Company’s then-outstanding long-term debt and reduced its diluted shares outstanding by 3.2 million shares. The $9.8 million premium value of the shares in excess of the accreted value of the Exchangeable Notes was recorded as interest expense, as was $1.5 million of related debt issuance costs that was written off. Approximately $2.6 million of the premium value was not deductible for tax purposes.
We maintain a revolving credit facility with several banks, which expires on August 13, 2012. The facility, which was extended in August 2007, provides that we may borrow up to $200.0 million at LIBOR-based rates of interest that vary depending on the level of usage of the facility and our credit ratings. The agreement contains financial covenants with respect to leverage and interest coverage and requires us to pay an annual commitment fee on any unused portion. On October 31, 2007, we had no outstanding borrowings under our revolving credit facility.
Operating Cash Flows
Our operating cash flows are calculated by adjusting net income to reflect changes in assets and liabilities, deferred sales commissions, stock-based compensation, deferred income taxes and investments classified as trading. Cash provided by operating activities totaled $266.4 million, $262.9 million and $104.1 million in the fiscal years ended October 31, 2007, 2006 and 2005, respectively. The increase in cash provided by operating activities in fiscal 2007 can be attributed primarily to an increase in cash provided by the purchase and sale of trading securities by consolidated mutual funds, which regularly purchase and sell securities. In fiscal 2007, net proceeds received from the purchase and sale of trading securities by our consolidated funds increased cash by $16.0 million. Net cash provided by (used for) the purchase and sale of trading securities totaled $30.6 million and ($68.8) million in fiscal 2006 and 2005. Operating cash flows in 2007 were reduced by $52.2 million in payments made to terminate certain closed-end fund compensation agreements and $76.0 million in structuring fee payments related to the offering of three closed-end funds.
Operating cash flows in 2007 also include the payment of $4.5 million to settle an interest rate lock transaction associated with our ten-year senior note offering. We entered into the interest rate lock to hedge against movement in ten-year Treasury prices between the time at which the decision was made to issue the debt and the pricing of the securities. At the time the debt was issued, we terminated the interest rate lock and settled the transaction in cash. At termination, the interest rate lock was determined to be a fully effective cash flow hedge and the $4.5 million settlement cost was recorded as a component of other comprehensive income. The amount recorded in other comprehensive income will ultimately be amortized over the life of the senior notes and recorded as a component of interest expense.
30
175734.FIN.CS3.indd 30175734.FIN.CS3.indd 30 1/15/08 7:17:44 PM1/15/08 7:17:44 PM

Capitalized sales commissions paid to financial intermediaries for the distribution of our Class B and Class C fund shares and certain private funds increased by $1.9 million in fiscal 2007, due primarily to a 38 percent increase in Class C share sales. Capitalized sales commissions increased by $6.9 million in fiscal 2006 due primarily to a 23 percent increase in Class C share sales. We anticipate that the payment of capitalized sales commissions will continue to be a significant use of cash in the future.
Investing Cash Flows
Investing activities consist primarily of the purchase of equipment and leasehold improvements, the purchase of equity interests from minority investors in our majority owned subsidiaries, and the purchase and sale of investments in our sponsored mutual funds and other sponsored investment products that we do not consolidate. Cash used for investing activities totaled $75.4 million, $26.2 million and $30.9 million in fiscal 2007, 2006 and 2005, respectively.
In fiscal 2007, additions to equipment and leasehold improvements totaled $12.7 million, compared to $12.7 million in fiscal 2006 and $3.4 million in fiscal 2005. Fiscal 2007 and 2006 additions reflect leasehold improvements made in conjunction with additional office space leased to accommodate the increase in headcount in those years. Investing cash flows in fiscal 2007 also reflect the purchase of an additional 2 percent interest in Parametric Portfolio Associates and an additional 3 percent interest in Atlanta Capital for a total of $9.1 million. These purchases increased our ownership interests in Parametric Portfolio Associates and Atlanta Capital to 84 percent and 80 percent, respectively. Fiscal 2006 and 2005 purchases of additional interests in majority-owned subsidiaries totaled $11.3 million and $0.4 million, respectively. In fiscal 2007, the purchase and sale of available-for-sale investments resulted in a net use of cash totaling $52.9 million. In fiscal 2006 and 2005, the purchase and sale of available-for-sale investments reduced investing cash flows by $0.5 million and $26.6 million, respectively.
Financing Cash Flows
Financing cash flows primarily reflect the issuance and repayment of long-term debt, the issuance and repurchase of our Non-Voting Common Stock, excess tax benefits associated with stock option exercises and the payment of dividends to our shareholders. Financing cash flows also include proceeds from the issuance of capital stock by consolidated investment companies and cash paid to meet redemptions by minority shareholders of these funds. Cash provided by (used for) financing activities totaled $37.2 million, ($176.4) million and ($73.9) million in fiscal 2007, 2006 and 2005.
In fiscal 2007, we repurchased a total of 10.8 million shares of our Non-Voting Common Stock for $442.3 million under our authorized repurchase programs and issued 2.5 million shares of Non-Voting Common Stock in connection with the exercise of stock options and other employee stock purchases for total proceeds of $41.9 million. We have authorization to purchase an additional 7.2 million shares under our current share repurchase authorization and anticipate that future repurchases will continue to be a significant use of cash. Our dividends per share were $0.51 in fiscal 2007, $0.42 in fiscal 2006 and $0.34 in fiscal 2005. We increased our quarterly dividend by 25 percent to $0.15 per share in the fourth quarter of fiscal 2007. We currently expect to continue to declare and pay comparable dividends on our Voting and Non-Voting Common Stock on a quarterly basis.
In October 2007, we issued $500.0 million in aggregate principal amount of 6.5% ten year senior notes due 2017. In conjunction with the senior note offering, we paid approximately $5.2 million in debt offering costs that will be amortized over the life of the notes and recognized as a component of interest expense.
In August 2006, EVM retired in full its then outstanding Exchangeable Notes with an accreted value on redemption date of $76.4 million. We made no long-term debt payments in fiscal 2005.
31
175734.FIN.CS3.indd 31175734.FIN.CS3.indd 31 1/15/08 7:17:44 PM1/15/08 7:17:44 PM

We believe that proceeds from our $500.0 million senior note offering, cash provided by current operating activities and borrowings available under our $200.0 million credit facility will provide us with sufficient liquidity to meet our short-term and long-term operating needs.
Off-Balance Sheet Arrangements
We do not invest in any off-balance sheet vehicles that provide financing, liquidity, market or credit risk support or engage in any leasing activities that expose us to any liability that is not reflected in the Consolidated Financial Statements.
Critical Accounting Policies
We believe the following critical accounting policies, among others, affect our more significant judgments and estimates used in the preparation of our consolidated financial statements. Actual results may differ from these estimates.
Deferred Sales Commissions
Sales commissions paid to broker/dealers in connection with the sale of certain classes of shares of open-end funds and private funds are generally capitalized and amortized over the period during which redemptions by the purchasing shareholder are subject to a contingent deferred sales charge, which does not exceed six years from purchase. Distribution plan payments received from these funds are recorded in revenue as earned. Contingent deferred sales charges and early withdrawal charges received from redeeming shareholders of these funds are generally applied to reduce the Company’s unamortized deferred sales commission assets. Should we lose our ability to recover such sales commissions through distribution plan payments and contingent deferred sales charges, the value of these assets would immediately decline, as would future cash flows. We periodically review the recoverability of deferred sales commission assets as events or changes in circumstances indicate that the carrying amount of deferred sales commission assets may not be recoverable and adjust the deferred sales commission assets accordingly.
Goodwill and Intangible Assets
Goodwill represents the excess of the cost of our investment in the net assets of acquired companies over the fair value of the underlying identifiable net assets at the dates of acquisition. We attribute all goodwill associated with the acquisitions of Atlanta Capital, Fox Asset Management and Parametric Portfolio Associates to a single reporting unit. Goodwill is not amortized but is tested at least annually for impairment by comparing the fair value of the reporting unit to its carrying amount, including goodwill. We establish fair value for the purpose of impairment testing using discounted cash flow analyses and appropriate market multiples. In this process, we make assumptions related to projected future earnings and cash flow, market multiples and applicable discount rates. Changes in these estimates could materially affect our impairment conclusion.
Identifiable intangible assets generally represent the cost of client relationships and management contracts acquired. In valuing these assets, we make assumptions regarding useful lives and projected growth rates, and significant judgment is required. In most instances, we engage third party consultants to perform these valuations. We periodically review identifiable intangibles for impairment as events or changes in circumstances indicate that the carrying amount of such assets may not be recoverable. If the carrying amounts of the assets exceed their respective fair values, additional impairment tests are performed to measure the amount of the impairment loss, if any.
32
175734.FIN.CS3.indd 32175734.FIN.CS3.indd 32 1/15/08 7:17:44 PM1/15/08 7:17:44 PM

Accounting for Income Taxes
Our effective tax rate reflects the statutory tax rates of the many jurisdictions in which we operate. Significant judgment is required in determining our effective tax rate and in evaluating our tax positions. In the ordinary course of business, many transactions occur for which the ultimate tax outcome is uncertain, and we adjust our income tax provision in the period in which we determine that actual outcomes will likely be different from our estimates. Contingent tax liabilities are established when, despite our belief that the tax return positions are fully supportable, there is the potential that they may be successfully challenged. These contingent tax liabilities, as well as the related interest, are adjusted regularly to reflect changing facts and circumstances. While we have considered future taxable income and ongoing tax planning in assessing our taxes, changes in tax laws may result in a change to our tax position and effective tax rate. The Company classifies any interest or penalties incurred as a component of income tax expense.
Deferred income taxes reflect the expected future tax consequences of temporary differences between the carrying amounts and tax bases of our assets and liabilities. Our deferred taxes relate principally to stock-based compensation expense and capitalized sales commissions paid to broker/dealers. Under IRS regulations, stock-based compensation is deductible for tax purposes at the time the employee recognizes the income (upon vesting of restricted stock, exercise of non-qualified stock option grants and any disqualifying dispositions of incentive stock options). Capitalized sales commission payments are deductible for tax purposes at the time of payment.
As discussed in “Accounting Developments” below, our accounting for income taxes will be impacted by the adoption of FASB Interpretation No. 48, “Accounting for the Uncertainty in Income Taxes – an interpretation of FASB Statement No. 109” (“FIN 48”).
Investments in CDO Entities
We act as collateral or investment manager for a number of CDO entities pursuant to management agreements between us and each CDO entity. At October 31, 2007, combined assets under management in these CDO entities upon which we earn a management fee were approximately $3.3 billion. We had combined investments of $19.0 million in five of these entities on October 31, 2007.
We account for our investments in CDO entities under Emerging Issues Task Force (“EITF”) 99-20, “Recognition of Interest Income and Impairment on Purchased and Retained Beneficial Interests in Securitized Financial Assets.” The excess of future cash flows over the initial investment at the date of purchase is recognized as interest income over the life of the investment using the effective yield method. We review cash flow estimates throughout the life of each CDO investment pool to determine whether an impairment of its investments should be recognized. Cash flow estimates are based on the underlying pool of collateral securities and take into account the overall credit quality of the issuers of the collateral securities, the forecasted default rate of the collateral securities and our past experience in managing similar securities. If the updated estimate of future cash flows (taking into account both timing and amounts) is less than the last revised estimate, an impairment loss is recognized based on the excess of the carrying amount of the investment over its fair value. Fair value is determined using current information, notably market yields and projected cash flows based on forecasted default and recovery rates that a market participant would use in determining the current fair value of the interest. Market yields, default rates and recovery rates used in our estimate of fair value vary based on the nature of the investments in the underlying collateral pools. In periods of rising credit default rates and lower debt recovery rates, the fair value, and therefore carrying value, of our investments in these CDO entities may be adversely affected. Our risk of loss in the CDO entities is limited to the $19.0 million carrying value of the investments on our Consolidated Balance Sheet at October 31, 2007.
33
175734.FIN.CS3.indd 33175734.FIN.CS3.indd 33 1/15/08 7:17:45 PM1/15/08 7:17:45 PM

A CDO entity issues non-recourse debt and equity securities, which are sold in a private offering to institutional and high-net-worth investors. The CDO debt securities issued by the CDO entity are secured by collateral in the form of floating-rate bank loans, high-yield bonds and/or other types of approved securities that the CDO entity purchases. We manage the collateral securities for a fee and, in most cases, are a minority investor in the equity interests of the CDO entity. An equity interest in a CDO entity is subordinated to all other interests in the CDO entity and entitles the investor to receive the residual cash flows, if any, from the CDO entity. As a result, our equity investment in a CDO entity is highly sensitive to changes in the credit quality of the issuers of the collateral securities, including changes in the forecasted default rates and any declines in anticipated recovery rates. Our financial exposure to the CDO entities we manage is limited to our interests in the CDO entities as reflected in our Consolidated Balance Sheet.
Stock-Based Compensation
Stock-based compensation expense reflects the fair value of stock-based awards measured at grant date, is recognized over the relevant service period, and is adjusted each period for anticipated forfeitures. The fair value of each option award is estimated on the date of grant using the Black-Scholes option valuation model. The Black-Scholes option valuation model incorporates assumptions as to dividend yield, volatility, an appropriate risk-free interest rate and the expected life of the option. Many of these assumptions require management’s judgment. Management must also apply judgment in developing an expectation of awards that may be forfeited. If actual experience differs significantly from these estimates, stock-based compensation expense and our results of operations could be materially affected.
Loss Contingencies
We continually review any investor, employee or vendor complaints and pending or threatened litigation. The likelihood that a loss contingency exists is evaluated under the criteria of SFAS No. 5, “Accounting for Contingencies,” through consultation with legal counsel and a loss contingency is recorded if the contingency is probable and reasonably estimable at the date of the financial statements. There are no losses of this nature that are currently deemed probable and reasonably estimable, and thus none have been recorded in the financial statements included in this report.
Inflation
Our assets are, to a large extent, liquid in nature and therefore we do not believe that inflation has had a material impact on our results of operations. To the extent that inflation or the expectation thereof results in rising interest rates, it may adversely affect our financial condition and results of operations. A substantial decline in the value of fixed-income or equity investments could adversely affect the net asset value of funds and accounts we manage, which in turn would result in a decline in revenue.
Accounting Developments
In December 2007, the Financial Accounting Standards Board (“FASB”) issued SFAS No. 160, “Noncontrolling Interests in Consolidated Financial Statements, an Amendment of ARB No. 51.” SFAS No. 160 amends ARB No. 51 to establish accounting and reporting standards for noncontrolling interests in subsidiaries and for the deconsolidation of subsidiaries. It clarifies that a noncontrolling interest in a subsidiary is an ownership interest that should be reported as equity in the consolidated financial statements. The provisions of SFAS No. 160 are effective for fiscal years beginning on or after December 15, 2008, and interim periods within those fiscal years. SFAS No. 160 is effective for the Company’s fiscal year that begins on November 1, 2009. We are currently evaluating the potential impact, if any, on our consolidated financial statements.
34
175734.FIN.CS3.indd 34175734.FIN.CS3.indd 34 1/15/08 7:17:45 PM1/15/08 7:17:45 PM
In December 2007, the FASB amended SFAS No. 141, “Business Combinations.” SFAS No. 141, as amended, establishes principles and requirements for how an acquirer recognizes and measures in its financial statements the identifiable assets acquired, the liabilities assumed, and any noncontrolling interest in the acquiree. The provisions of SFAS No. 141, as amended, are effective for fiscal years beginning on or after December 15, 2008. SFAS No. 141, as amended, is effective for the Company’s fiscal year that begins on November 1, 2009. We are currently evaluating the potential impact, if any, on our consolidated financial statements.
In June 2007, the FASB ratified the consensus reached by the EITF in EITF Issue No. 06-11, “Accounting for Income Tax Benefits of Dividends on Share-Based Payment Awards” (“EITF 06-11”). Under the provisions of EITF 06-11, a realized income tax benefit from dividends or dividend equivalents that are charged to retained earnings and are paid to employees for equity classified non-vested equity shares, non-vested equity share units, and outstanding equity share options should be recognized as an increase to additional paid-in capital. The amount recognized in additional paid-in capital for the realized income tax benefit from dividends on those awards should be included in the pool of excess tax benefits available to absorb tax deficiencies on share-based payment awards. EITF 06-11 should be applied prospectively to the income tax benefits that result from dividends on equity-classified employee share-based payment awards that are declared in fiscal years beginning after December 15, 2007, and interim periods within those fiscal years. EITF 06-11 is effective for the Company’s fiscal year that begins on November 1, 2008. We are currently evaluating the potential impact of EITF 06-11, if any, on our consolidated financial statements.
In February 2007, the FASB issued SFAS No. 159, “The Fair Value Option for Financial Assets and Financial Liabilities.” SFAS No. 159 permits entities to choose to measure many financial instruments and certain other items at fair value. The objective of the statement is to improve financial reporting by providing entities with the opportunity to mitigate volatility in reported earnings caused by measuring related assets and liabilities differently without having to apply complex hedge accounting provisions. The provisions of SFAS No. 159 are effective for fiscal years beginning after November 15, 2007. SFAS No. 159 is effective for the Company’s fiscal year that begins on November 1, 2008. We are currently evaluating this standard and its impact, if any, on our consolidated financial statements.
In September 2006, the FASB issued SFAS No. 157, “Fair Value Measurements.” SFAS No. 157 defines fair value, establishes a framework for measuring fair value, and expands disclosure requirements about fair value measurements. SFAS No. 157 applies under other accounting pronouncements that require or permit fair value measurements but does not in itself require any new fair value measurements. The provisions of SFAS No. 157 are effective for fiscal years beginning after November 15, 2007 and interim periods within those fiscal years. SFAS No. 157 is effective for the Company’s fiscal year that begins on November 1, 2008. We are currently evaluating this standard and its impact, if any, on our consolidated financial statements.
In June 2006, the FASB issued Interpretation No. 48, “Accounting for Uncertainty in Income Taxes—an interpretation of FASB Statement No. 109” (“FIN 48”), to clarify certain aspects of accounting for uncertain tax positions. FIN 48 clarifies the accounting for income taxes by prescribing a minimum recognition threshold for tax positions, “more-likely-than-not” (i.e. greater than 50 percent), before being recognized in the financial statements. FIN 48 is effective for fiscal years beginning after December 15, 2006. We will adopt FIN 48 as of November 1, 2007, as required.
FIN 48 provides that interest recognized as a result of the application of FIN 48 may be classified as either income taxes or interest expense. FIN 48 further provides that any penalties recognized as a result of applying FIN 48 may be classified in the financial statements as either income taxes or another expense classification. The classification of these items is based upon the accounting policy election of the company. Our historical accounting policy with respect to interest and penalties recognized for tax uncertainties has been to classify these amounts as income taxes. We will continue this classification upon the adoption of FIN 48.
35
175734.FIN.CS3.indd 35175734.FIN.CS3.indd 35 1/15/08 7:17:45 PM1/15/08 7:17:45 PM

We are continuing to evaluate the impact of FIN 48 on our financial statements, and currently anticipate recognizing a charge to retained earnings of approximately $5.0 million upon adoption. In addition, we anticipate that, upon adoption, our deferred tax assets and income taxes payable will increase by approximately $85.0 million on the Company’s Consolidated Balance Sheet.
Quantitative and Qualitative Disclosures about Market Risk
In the normal course of business, our financial position is subject to different types of risk, including market risk. Market risk is the risk that we will incur losses due to adverse changes in equity and bond prices, interest rates, credit risk or currency exchange rates. Management is responsible for identifying, assessing and managing market and other risks.
In evaluating market risk, it is important to note that most of our revenue is based on the market value of assets under management. As noted in “Risk Factors” in Item 1A, declines of financial market values will negatively impact our revenue and net income.
Our primary direct exposure to equity price risk arises from our investments in sponsored equity funds, our equity interest in affiliates and equity securities held by sponsored funds we consolidate. Our investments in sponsored equity funds and equity securities are carried at fair value on our Consolidated Balance Sheets. Equity price risk as it relates to these investments represents the potential future loss of value that would result from a decline in the fair values of the fund shares or underlying equity securities. The following is a summary of the effect that a 10 percent increase or decrease in equity prices would have on our investments subject to equity price fluctuation at October 31, 2007:
(in thousands) Carrying
Value
Carrying Value
assuming a 10%
increase
Carrying Value
assuming a 10%
decrease
Trading: Equity securities $14,368 $15,805 $12,931 Available-for-sale securities: Sponsored funds 82,627 90,890 74,364 Investment in affiliates 16,297 17,927 14,667 Total $113,292 $124,622 $101,962
36
175734.FIN.CS3.indd 36175734.FIN.CS3.indd 36 1/15/08 7:17:45 PM1/15/08 7:17:45 PM

Our primary direct exposure to interest rate risk arises from our investment in fixed and floating-rate income funds sponsored by us and debt securities held by sponsored funds we consolidate. We considered the negative effect on pre-tax interest income of a 50 basis point (0.50 percent) decline in interest rates as of October 31, 2007. A 50 basis point decline in interest rates is a hypothetical scenario used to demonstrate potential risk and does not represent our management’s view of future market changes. The following is a summary of the effect that a 50 basis point percent (0.50 percent) decline in interest rates would have on our pre-tax net income as of October 31, 2007:
(in thousands) Carrying
Value
Pre-tax interest income impact of a
50 basis point decline in interest rates
Trading: Debt securities $ 770 $ 4 Available-for-sale securities: Sponsored funds 2,320 12Total $ 3,090 $ 16
From time to time, we seek to offset our exposure to changing interest rates associated with our debt financing. In October 2007, we issued $500.0 million in aggregate principal amount of 6.5 percent ten year senior notes due 2017. In conjunction with the offering, we entered into an interest rate lock intended to hedge against adverse Treasury rate movements between the time at which the decision was made to issue the debt and the pricing of the securities. At the time the debt was issued, we terminated the lock and settled the transaction in cash. At termination, the lock was determined to be a fully effective cash flow hedge and the $4.5 million settlement cost was recorded as a component of other comprehensive income. There can be no assurance that our hedge instruments will meet their overall objective of reducing our interest expense or that we will be successful in obtaining hedging contracts on any future debt offerings.
Our primary direct exposure to credit risk arises from our interests in CDO entities that are included in long-term investments in our Consolidated Balance Sheets. As an investor in a CDO entity, we are entitled to only a residual interest in the CDO entity, making these investments highly sensitive to the default rates of the underlying issuers of the high-yield bonds or floating-rate income instruments held by the CDO entity. Our investments are subject to an impairment loss in the event that the cash flows generated by the collateral securities are not sufficient to allow equity holders to recover their investments. If there is deterioration in the credit quality of the issuers underlying the collateral securities and a corresponding increase in the number of defaults, cash flows generated by the collateral securities may be adversely impacted and we may be unable to recover our investment. Our total investment in interests in CDO entities is approximately $19.0 million at October 31, 2007, which represents our total value at risk with respect to such entities as of October 31, 2007.
We operate primarily in the United States, and accordingly most of our consolidated revenue and associated expenses are denominated in U.S. dollars. We also provide services and earn revenue outside of the United States; therefore, the portion of our revenue and expenses denominated in foreign currencies may be impacted by movements in currency exchange rates. This situation may change in the future as our business continues to grow outside of the United States. We do not enter into foreign currency transactions for speculative purposes and currently have no material investments that would expose us to foreign currency exchange risk.
37
175734.FIN.CS3.indd 37175734.FIN.CS3.indd 37 1/15/08 7:17:45 PM1/15/08 7:17:45 PM

Risk Factors
We are subject to substantial competition in all aspects of our investment management business and there are few barriers to entry. Our funds and separate accounts compete against an increasing number of investment products and services sold to the public by investment management companies, investment dealers, banks, insurance companies and others. Many institutions we compete with have greater financial resources than us. We compete with other providers of investment products on the basis of the products offered, the investment performance of such products, quality of service, fees charged, the level and type of financial intermediary compensation, the manner in which such products are marketed and distributed, reputation and the services provided to investors. In addition, our ability to market investment products is highly dependent on access to the various distribution systems of national and regional securities dealer firms, which generally offer competing affiliated and externally managed investment products that could limit the distribution of our investment products. There can be no assurance that we will be able to retain access to these channels. The inability to have such access could have a material adverse effect on our business. To the extent that existing or potential customers, including securities broker/dealers, decide to invest in or broaden distribution relationships with our competitors, the sales of our products as well as our market share, revenue and net income could decline.
We derive almost all of our revenue from investment advisory and administration fees, distribution income and service fees received from the Eaton Vance funds and separate accounts. As a result, we are dependent upon management contracts, administration contracts, distribution contracts, underwriting contracts or service contracts under which these fees and income are paid. Generally, these contracts are terminable upon 30 to 60 days’ notice without penalty. If any of these contracts are terminated, not renewed, or amended to reduce fees, our financial results could be adversely affected.
Our assets under management, which impact revenue, are subject to significant fluctuations. Our major sources of revenue (i.e., investment advisory, administration, distribution, and service fees) are calculated as percentages of assets under management. A decline in securities prices or the sale of investment products or an increase in fund redemptions or client withdrawals generally would reduce fee income. Financial market declines or adverse changes in interest rates would generally negatively impact the level of our assets under management and consequently our revenue and net income. A recession or other economic or political events could also adversely impact our revenue if it led to a decreased demand for products, a higher redemption rate, or a decline in securities prices. Any decrease in the level of assets under management resulting from price declines, interest rate volatility or uncertainty or other factors could negatively impact our revenue and net income.
Poor investment performance of our products could affect our sales or reduce the amount of assets under management, potentially negatively impacting revenue and net income. Investment performance, along with achieving and maintaining superior distribution and client service, is critical to our success. While strong investment performance could stimulate sales of our investment products, poor investment performance as compared to third-party benchmarks or competitive products could lead to a decrease in sales and stimulate higher redemptions, thereby lowering the amount of assets under management and reducing the investment advisory fees we earn. Past or present performance in the investment products we manage is not indicative of future performance.
Our success depends on key personnel and our financial performance could be negatively affected by the loss of their services. Our success depends upon our ability to attract, retain and motivate qualified portfolio managers, analysts, investment counselors, sales and management personnel and other key professionals including our executive officers. Investment professionals are in high demand, and we face strong competition for qualified personnel. Our key employees do not have employment contracts and may voluntarily terminate their employment at any time. Certain senior executives and directors are subject to our mandatory retirement policy. The loss of the services of key personnel or our failure to attract replacement or additional qualified personnel could negatively affect our financial performance. An increase in compensation made to attract or retain personnel could result in a decrease in net income.
38
175734.FIN.CS3.indd 38175734.FIN.CS3.indd 38 1/15/08 7:17:45 PM1/15/08 7:17:45 PM

Our expenses are subject to fluctuations that could materially affect our operating results. Our results of operations are dependent on the level of expenses, which can vary significantly. Our expenses may fluctuate as a result of variations in the level of total compensation expense, expenses incurred to support distribution of our investment products, expenses incurred to enhance our infrastructure (including technology and compliance) and impairments of intangible assets or goodwill.
Our reputation could be damaged. We have spent over 80 years building a reputation based on strong investment performance, a high level of integrity and superior client service. Our reputation is extremely important to our success. Any damage to our reputation could result in client withdrawals from funds or separate accounts that are advised by us and ultimately impede our ability to attract and retain key personnel. The loss of either client relationships or key personnel could reduce the amount of assets under management and cause us to suffer a loss in revenue or net income.
We are subject to federal securities laws, state laws regarding securities fraud, other federal and state laws and rules, and regulations of certain regulatory and self-regulatory organizations, including, among others, the SEC, FINRA, the FSA and the New York Stock Exchange. In addition, financial reporting requirements are comprehensive and complex. While we have focused significant attention and resources on the development and implementation of compliance policies, procedures and practices, non-compliance with applicable laws, rules or regulations, either in the United States or abroad, or our inability to adapt to a complex and ever-changing regulatory environment could result in sanctions against us, which could adversely affect our reputation, prospects, revenue, and earnings.
We could be impacted by changes in tax policy due to our tax-managed focus. Changes in U.S. tax policy may affect us to a greater degree than many of our competitors because we emphasize managing funds and separate accounts with an after-tax return objective. We believe an increase in overall tax rates could have a positive impact on our municipal income and tax-managed equity businesses that seek to minimize realized capital gains and/or maximize realized capital losses. An increase in the tax rate on qualified dividends could have a negative impact on our tax-advantaged equity income business. Changes in tax policy could also affect our ability to introduce new privately offered equity funds.
Evaluation of Disclosure Controls and Procedures
We evaluated the effectiveness of our disclosure controls and procedures as of October 31, 2007. Disclosure controls and procedures are designed to ensure that the information we are required to disclose in the reports that we file or submit under the Exchange Act is recorded, processed, summarized and reported within the time period specified in the SEC’s rule and forms. Disclosure controls and procedures include, without limitation, controls and procedures accumulated and communicated to our management, including our Chief Executive Officer (“CEO”) and Chief Financial Officer (“CFO”), to allow timely decisions regarding required disclosure. Our CEO and CFO participated in this evaluation and concluded that, as of the date of their evaluation, our disclosure controls and procedures were effective.
There have been no changes in our internal control over financial reporting that occurred during our fourth fiscal quarter that have materially affected, or are reasonably likely to materially affect, our internal control over financial reporting.
39
175734.FIN.CS3.indd 39175734.FIN.CS3.indd 39 1/15/08 7:17:45 PM1/15/08 7:17:45 PM

Consolidated Statements of IncomeYears Ended October 31,
(in thousands, except per share data) 2007 2006 2005
Revenue:
Investment advisory and administration fees $ 773,612 $ 594,632 $ 503,085
Distribution and underwriter fees 148,369 139,111 138,485
Service fees 154,736 124,025 105,202
Other revenue 7,383 4,426 6,403
Total revenue 1,084,100 862,194 753,175
Expenses:
Compensation of officers and employees 316,963 244,620 205,663
Distribution expense 253,344 114,052 101,661
Service fee expense 121,748 98,262 87,983
Amortization of deferred sales commissions 55,060 52,048 63,535
Fund expenses 19,974 16,589 12,019
Other expenses 84,074 71,657 49,707
Total expenses 851,163 597,228 520,568
Operating income 232,937 264,966 232,607
Other Income (Expense):
Interest income 10,511 8,033 4,354
Interest expense (2,894) (12,850) (1,464)
Gains/(losses) on investments (1,943) 3,667 38
Foreign currency losses (262) (222) (32)
Impairment loss on investments - (592) (2,120)
Income before income taxes, minority interest, equity in net income of affiliates and cumulative effect of change in accounting principle 238,349 263,002 233,383
Income taxes (93,200) (102,245) (90,871)
Minority interest (6,258) (5,103) (5,037)
Equity in net income of affiliates, net of tax 3,920 4,349 1,231
Income before cumulative effect of change in accounting principle 142,811 160,003 138,706
Cumulative effect of change in accounting principle, net of tax - (626) -
Net income $ 142,811 $ 159,377 $ 138,706
Earnings per share before cumulative effect of change in accounting principle:
Basic $ 1.15 $ 1.25 $ 1.05
Diluted $ 1.06 $ 1.18 $ 0.99
Earnings per share:
Basic $ 1.15 $ 1.25 $ 1.05
Diluted $ 1.06 $ 1.17 $ 0.99
Weighted average shares outstanding:
Basic 124,527 127,807 131,591
Diluted 135,252 137,004 140,520
See notes to consolidated financial statements.
40
175734.FIN.CS3.indd 40175734.FIN.CS3.indd 40 1/15/08 7:17:45 PM1/15/08 7:17:45 PM

Consolidated Balance SheetsOctober 31,
(in thousands, except share data) 2007 2006
ASSETS
Current Assets:
Cash and cash equivalents $ 434,957 $ 206,705
Short-term investments 50,183 20,669
Investment advisory fees and other receivables 116,979 94,669
Other current assets 8,033 7,324
Total current assets 610,152 329,367
Other Assets:
Deferred sales commissions 99,670 112,314
Goodwill 103,003 96,837
Other intangible assets, net 35,988 34,549
Long-term investments 86,111 73,075
Equipment and leasehold improvements, net 26,247 21,495
Other assets 5,660 558
Total other assets 356,679 338,828
Total assets $ 966,831 $ 668,195
LIABILITIES AND SHAREHOLDERS' EQUITY
Current Liabilities:
Accrued compensation $ 106,167 $ 80,975
Accounts payable and accrued expenses 66,955 33,660
Dividends payable 17,780 15,187
Other current liabilities 26,797 9,823
Total current liabilities 217,699 139,645
Long-Term Liabilities:
Long-term debt 500,000 -
Deferred income taxes 11,740 22,520
Total long-term liabilities 511,740 22,520
Total liabilities 729,439 162,165
Minority interest 8,224 9,545
Commitments and contingencies (See Note 7) - -
Shareholders' Equity:
Voting Common Stock, par value $0.00390625 per share:
Authorized, 1,280,000 shares
Issued and outstanding, 371,386 and 309,760 shares, respectively 1 1
Non-Voting Common Stock, par value $0.00390625 per share:
Authorized, 190,720,000 shares
Issued and outstanding, 117,798,378 and 126,125,717 shares, respectively 460 493
Notes receivable from stock option exercises (2,342) (1,891)
Accumulated other comprehensive income 3,193 4,383
Retained earnings 227,856 493,499
Total shareholders' equity 229,168 496,485
Total liabilities and shareholders' equity $ 966,831 $ 668,195
See notes to consolidated financial statements.
41
175734.FIN.CS3.indd 41175734.FIN.CS3.indd 41 1/15/08 7:17:45 PM1/15/08 7:17:45 PM
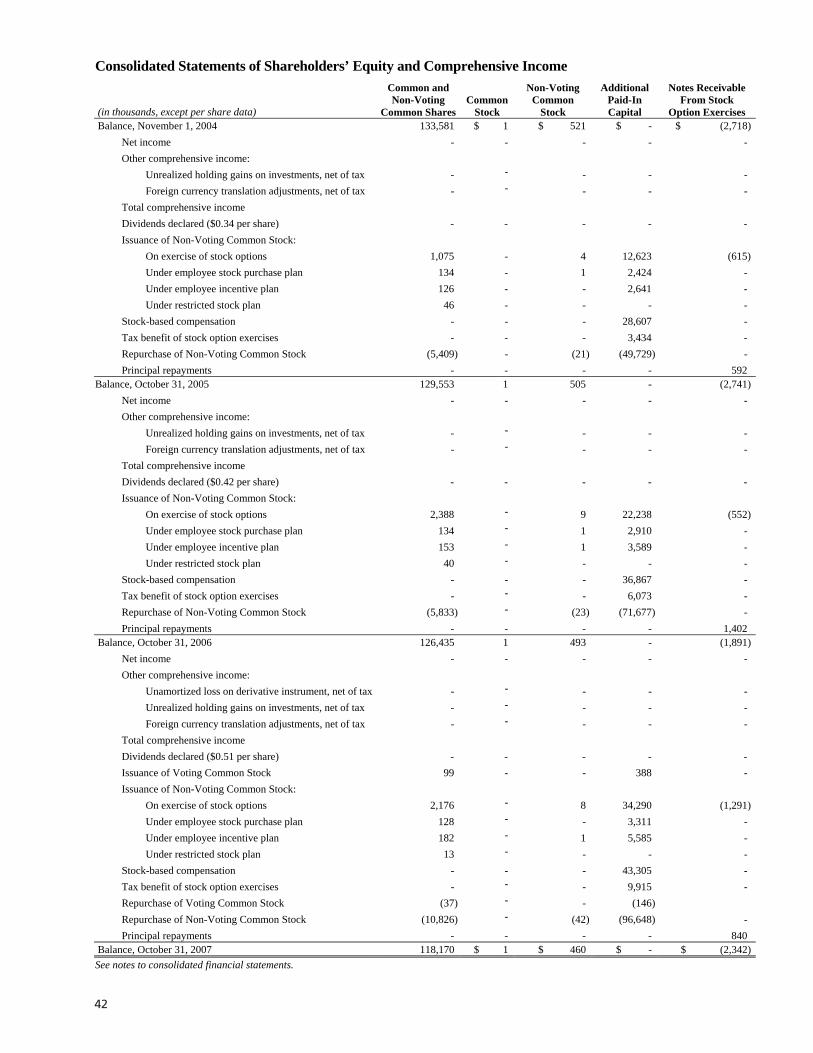
Consolidated Statements of Shareholders’ Equity and Comprehensive Income
(in thousands, except per share data)
Common and Non-Voting
Common SharesCommon
Stock
Non-VotingCommon
Stock
Additional Paid-In
Notes Receivable From Stock
Capital Option Exercises Balance, November 1, 2004 133,581 $ 1 $ 521 $ - $ (2,718)
Net income - - - - -
Other comprehensive income:
Unrealized holding gains on investments, net of tax - - - - -
Foreign currency translation adjustments, net of tax - - - - -
Total comprehensive income
Dividends declared ($0.34 per share) - - - - -
Issuance of Non-Voting Common Stock:
On exercise of stock options 1,075 - 4 12,623 (615)
Under employee stock purchase plan 134 - 1 2,424 -
Under employee incentive plan 126 - - 2,641 -
Under restricted stock plan 46 - - - -
Stock-based compensation - - - 28,607 -
Tax benefit of stock option exercises - - - 3,434 -
Repurchase of Non-Voting Common Stock (5,409) - (21) (49,729) -
Principal repayments - - - - 592Balance, October 31, 2005 129,553 1 505 - (2,741)
Net income - - - - -
Other comprehensive income: - Unrealized holding gains on investments, net of tax - - - -- Foreign currency translation adjustments, net of tax - - - -
Total comprehensive income
Dividends declared ($0.42 per share) - - - - -
Issuance of Non-Voting Common Stock:
On exercise of stock options 2,388 - 9 22,238 (552)
Under employee stock purchase plan 134 - 1 2,910 -
Under employee incentive plan 153 - 1 3,589 -
Under restricted stock plan 40 - - - -
Stock-based compensation - - - 36,867 -
Tax benefit of stock option exercises - - - 6,073 -
Repurchase of Non-Voting Common Stock (5,833) - (23) (71,677) -
Principal repayments - - - - 1,402 Balance, October 31, 2006 126,435 1 493 - (1,891)
Net income - - - - -
Other comprehensive income:
Unamortized loss on derivative instrument, net of tax - - - - -
Unrealized holding gains on investments, net of tax - - - - -
Foreign currency translation adjustments, net of tax - - - - -
Total comprehensive income
Dividends declared ($0.51 per share) - - - - -
Issuance of Voting Common Stock 99 - - 388 -
Issuance of Non-Voting Common Stock:
On exercise of stock options 2,176 - 8 34,290 (1,291)
Under employee stock purchase plan 128 - - 3,311 -
Under employee incentive plan 182 - 1 5,585 -
Under restricted stock plan 13 - - - -
Stock-based compensation - - - 43,305 -
Tax benefit of stock option exercises - - - 9,915 -
Repurchase of Voting Common Stock (37) - - (146)
Repurchase of Non-Voting Common Stock (10,826) - (42) (96,648) -
Principal repayments - - - - 840 Balance, October 31, 2007 118,170 $ 1 $ 460 $ - $ (2,342)
See notes to consolidated financial statements.
42
175734.FIN.CS3.indd 42175734.FIN.CS3.indd 42 1/15/08 7:17:45 PM1/15/08 7:17:45 PM

Consolidated Statements of Shareholders’ Equity and Comprehensive Income (Continued)
Accumulated Other Total
Comprehensive Retained Shareholders' Comprehensive
(in thousands, except per share data) Income (Loss) Earnings Equity Income (Loss) Balance, November 1, 2004 $ 1,854 $ 464,670 $ 464,328
Net income - 138,706 138,706 $ 138,706
Other comprehensive income: Unrealized holding gains on investments, net of tax 760 - 760 760
Foreign currency translation adjustments, net of tax (48) - (48) (48)
Total comprehensive income $ 139,418
Dividends declared ($0.34 per share) - (44,539) (44,539)
Issuance of Non-Voting Common Stock:
On exercise of stock options - - 12,012
Under employee stock purchase plan - - 2,425
Under employee incentive plan - - 2,641
Under restricted stock plan - - -
Stock-based compensation - - 28,607
Tax benefit of stock option exercises - - 3,434
Repurchase of Non-Voting Common Stock - (82,872) (132,622)
Principal repayments - - 592Balance, October 31, 2005 2,566 475,965 476,296
Net income - 159,377 159,377 $ 159,377
Other comprehensive income: Unrealized holding gains on investments, net of tax 1,754 - 1,754 1,754
Foreign currency translation adjustments, net of tax 63 - 63 63
Total comprehensive income $ 161,194
Dividends declared ($0.42 per share) - (53,629) (53,629)
Issuance of Non-Voting Common Stock:
On exercise of stock options - - 21,695
Under employee stock purchase plan - - 2,911
Under employee incentive plan - - 3,590
Under restricted stock plan - - -
Stock-based compensation - - 36,867
Tax benefit of stock option exercises - - 6,073
Repurchase of Non-Voting Common Stock - (88,214) (159,914)
Principal repayments - - 1,402 Balance, October 31, 2006 4,383 493,499 496,485
Net income - 142,811 142,811 $ 142,811
Other comprehensive income:
Unamortized loss on derivative instrument, net of tax (2,872) - (2,872) (2,872)
Unrealized holding gains on investments, net of tax 1,628 - 1,628 1,628
Foreign currency translation adjustments, net of tax 54 - 54 54
Total comprehensive income $ 141,621
Dividends declared ($0.51 per share) - (62,893) (62,893)
Issuance of Voting Common Stock - - 388
Issuance of Non-Voting Common Stock:
On exercise of stock options - - 33,007
Under employee stock purchase plan - - 3,311
Under employee incentive plan - - 5,586
Under restricted stock plan - - -
Stock-based compensation - - 43,305
Tax benefit of stock option exercises - - 9,915
Repurchase of Voting Common Stock - - (146)
Repurchase of Non-Voting Common Stock - (345,561) (442,251)
Principal repayments - - 840Balance, October 31, 2007 $ 3,193 $ 227,856 $ 229,168
See notes to consolidated financial statements.
43
175734.FIN.CS3.indd 43175734.FIN.CS3.indd 43 1/15/08 7:17:45 PM1/15/08 7:17:45 PM
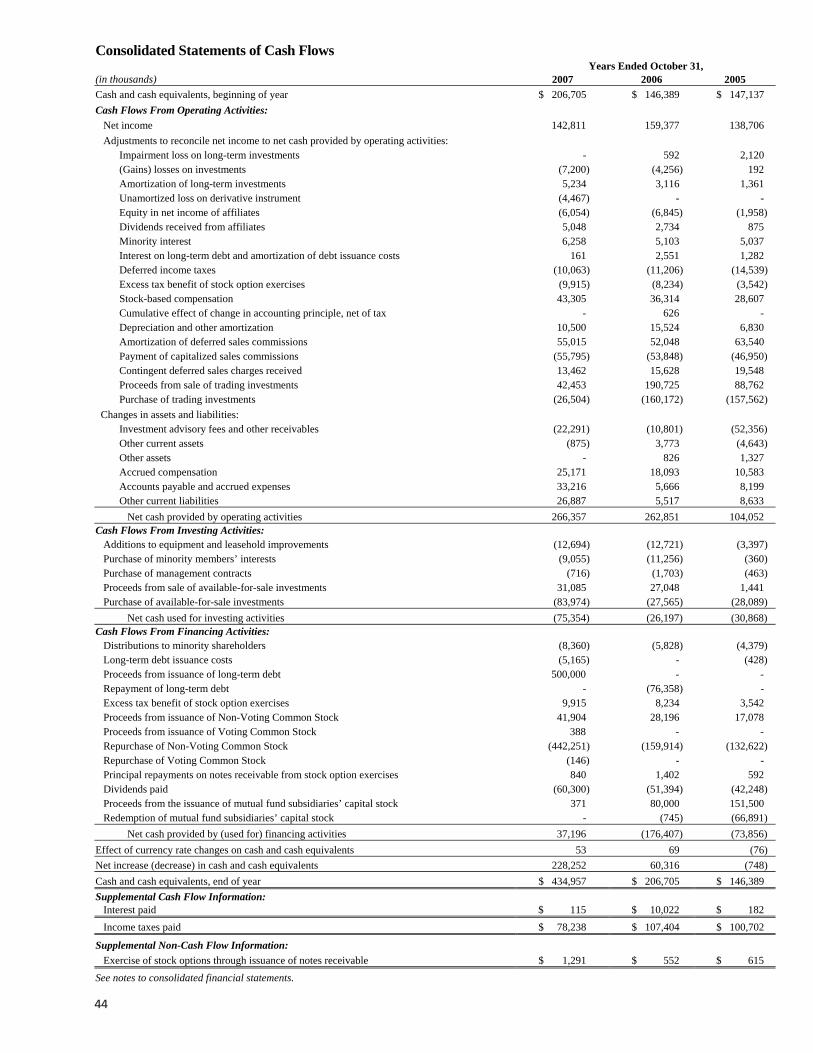
Consolidated Statements of Cash Flows Years Ended October 31,
(in thousands) 2007 2006 2005Cash and cash equivalents, beginning of year $ 206,705 $ 146,389 $ 147,137
Cash Flows From Operating Activities:
Net income 142,811 159,377 138,706
Adjustments to reconcile net income to net cash provided by operating activities: Impairment loss on long-term investments - 592 2,120 (Gains) losses on investments (7,200) (4,256) 192 Amortization of long-term investments 5,234 3,116 1,361 Unamortized loss on derivative instrument (4,467) - - Equity in net income of affiliates (6,054) (6,845) (1,958) Dividends received from affiliates 5,048 2,734 875 Minority interest 6,258 5,103 5,037 Interest on long-term debt and amortization of debt issuance costs 161 2,551 1,282 Deferred income taxes (10,063) (11,206) (14,539) Excess tax benefit of stock option exercises (9,915) (8,234) (3,542) Stock-based compensation 43,305 36,314 28,607 Cumulative effect of change in accounting principle, net of tax - 626 - Depreciation and other amortization 10,500 15,524 6,830 Amortization of deferred sales commissions 55,015 52,048 63,540 Payment of capitalized sales commissions (55,795) (53,848) (46,950) Contingent deferred sales charges received 13,462 15,628 19,548 Proceeds from sale of trading investments 42,453 190,725 88,762 Purchase of trading investments (26,504) (160,172) (157,562)
Changes in assets and liabilities: Investment advisory fees and other receivables (22,291) (10,801) (52,356) Other current assets (875) 3,773 (4,643) Other assets - 826 1,327 Accrued compensation 25,171 18,093 10,583 Accounts payable and accrued expenses 33,216 5,666 8,199 Other current liabilities 26,887 5,517 8,633
Net cash provided by operating activities 266,357 262,851 104,052 Cash Flows From Investing Activities: Additions to equipment and leasehold improvements (12,694) (12,721) (3,397) Purchase of minority members’ interests (9,055) (11,256) (360) Purchase of management contracts (716) (1,703) (463) Proceeds from sale of available-for-sale investments 31,085 27,048 1,441 Purchase of available-for-sale investments (83,974) (27,565) (28,089)
Net cash used for investing activities (75,354) (26,197) (30,868)Cash Flows From Financing Activities: Distributions to minority shareholders (8,360) (5,828) (4,379) Long-term debt issuance costs (5,165) - (428) Proceeds from issuance of long-term debt 500,000 - - Repayment of long-term debt - (76,358) - Excess tax benefit of stock option exercises 9,915 8,234 3,542 Proceeds from issuance of Non-Voting Common Stock 41,904 28,196 17,078 Proceeds from issuance of Voting Common Stock 388 - - Repurchase of Non-Voting Common Stock (442,251) (159,914) (132,622) Repurchase of Voting Common Stock (146) - - Principal repayments on notes receivable from stock option exercises 840 1,402 592 Dividends paid (60,300) (51,394) (42,248) Proceeds from the issuance of mutual fund subsidiaries’ capital stock 371 80,000 151,500 Redemption of mutual fund subsidiaries’ capital stock - (745) (66,891)
Net cash provided by (used for) financing activities 37,196 (176,407) (73,856)
Effect of currency rate changes on cash and cash equivalents 53 69 (76)
Net increase (decrease) in cash and cash equivalents 228,252 60,316 (748)
Cash and cash equivalents, end of year $ 434,957 $ 206,705 $ 146,389
Supplemental Cash Flow Information: Interest paid $ 115 $ 10,022 $ 182
Income taxes paid $ 78,238 $ 107,404 $ 100,702
Supplemental Non-Cash Flow Information:
Exercise of stock options through issuance of notes receivable $ 1,291 $ 552 $ 615
See notes to consolidated financial statements.
44
175734.FIN.CS3.indd 44175734.FIN.CS3.indd 44 1/15/08 7:17:46 PM1/15/08 7:17:46 PM

Notes to Consolidated Financial Statements
1. Summary of Significant Accounting Policies
Business and Organization
Eaton Vance Corp. and its subsidiaries (“the Company”) manage investment funds and provide investment management and counseling services to high-net-worth individuals and institutions. The Company’s principal retail marketing strategy is to distribute funds and separately managed accounts primarily through financial intermediaries in the advice channel. We also commit significant resources to serving institutional and high-net-worth clients who access investment advice outside of traditional broker/dealer channels.
Revenue is largely dependent on the total value and composition of assets under management, which include sponsored funds and other investment portfolios. Accordingly, fluctuations in financial markets and in the composition of assets under management impact revenue and the results of operations.
Principles of Consolidation
The consolidated financial statements include the accounts of the Company and its wholly and majority-owned subsidiaries. The equity method of accounting is used for investments in affiliates in which the Company’s ownership ranges from 20 to 50 percent, or in instances in which the Company is able to exercise significant influence, but not control, over the investee (such as representation on the investee’s board of directors). The Company consolidates all investments in affiliates in which the Company’s ownership exceeds 50 percent. The Company provides for minority interests in consolidated companies for which the Company’s ownership is less than 100 percent. All intercompany accounts and transactions have been eliminated.
Reclassification and Presentation
Certain prior year amounts have been reclassified to conform to the current year presentation. Certain service fees have been reclassified from distribution and underwriter fees. Certain fund related expenses have been reclassified from other expenses to fund expenses. Certain fees earned on Class A shares have been reclassified from distribution expenses to distribution and underwriter fees.
Segment Information
Statement of Financial Accounting Standards (“SFAS”) No. 131, “Disclosures about Segments of an Enterprise and Related Information,” establishes disclosure requirements relating to operating segments in annual and interim financial statements. Management has determined that the Company operates in one business segment, namely as an investment adviser managing funds and separate accounts.
Although the Company does make some disclosure regarding assets under management and other asset flows by product (primarily distinguishing between funds and separately managed accounts), the Company’s determination that it operates in one business segment is based on the fact that the Company’s chief operating decision maker (namely the Company’s Chief Executive Officer) reviews the Company’s financial performance at an aggregate level. All of the products and services provided by the Company relate to investment management and are subject to a similar regulatory framework. Investment management teams at the Company are generally not aligned with specific product lines or distribution channels; in many instances, the investment professionals who manage the Company’s funds are the same investment professionals who manage the Company’s separately managed accounts.
45
175734.FIN.CS3.indd 45175734.FIN.CS3.indd 45 1/15/08 7:17:46 PM1/15/08 7:17:46 PM
Use of Estimates
The preparation of the Company’s consolidated financial statements in conformity with accounting principles generally accepted in the United States of America (“U.S. GAAP”) requires management to make estimates and assumptions that affect the amounts reported in the consolidated financial statements and related notes to the consolidated financial statements. Actual results could differ from those estimates.
Cash, Cash Equivalents and Short-Term Investments
Cash and cash equivalents consist principally of cash and short-term, highly liquid investments in sponsored cash management mutual funds and commercial paper, which are readily convertible to cash. Cash equivalents have original maturities of less than three months on the date of acquisition and are stated at cost, which approximates market value due to the short-term maturity of these investments. Short-term investments consist of securities with maturities greater than three months at the time of purchase. Short-term investments are carried at fair value based on quoted market prices.
Investments
Marketable securities classified as trading consist primarily of investments in debt and equity securities held in the portfolios of sponsored funds consolidated by the Company and other debt and equity securities held by the Company in separately managed accounts. Securities classified as trading are carried at fair value based on quoted market prices. Net unrealized holding gains or losses, as well as realized gains or losses, are reflected as a component of other revenue. The specific identified cost method is used to determine the realized gain or loss on securities sold.
Marketable securities classified as available-for-sale consist primarily of investments in sponsored funds and are carried at fair value based on quoted market prices. Unrealized holding gains or losses are reported net of deferred tax as a separate component of accumulated other comprehensive income (loss) until realized. Realized gains or losses are reflected as a component of gain (loss) on investments. The specific identified cost method is used to determine the realized gain or loss on the sale of shares of sponsored funds.
The Company evaluates the carrying value of marketable securities for impairment on a quarterly basis. In its impairment analysis, the Company takes into consideration numerous criteria, including the duration and extent of any decline in fair value. If the decline in value is determined to be other than temporary, the carrying value of the security is written down to fair value through net income.
Investments in the equity of collateralized debt obligation entities (“CDO entities”) are carried at fair value based on discounted cash flows. The excess of actual and anticipated future cash flows over the initial investment at the date of purchase is recognized as interest income over the life of the investment using the effective yield method. The Company reviews cash flow estimates throughout the life of each CDO entity. If the updated estimate of future cash flows (taking into account both timing and amounts) is less than the last revised estimate, an impairment loss is recognized based on the excess of the carrying amount of the investment over its fair value.
Certain other investments are carried at the lower of cost or management’s estimate of net realizable value owing primarily to restrictions on resale of the investments.
46
175734.FIN.CS3.indd 46175734.FIN.CS3.indd 46 1/15/08 7:17:46 PM1/15/08 7:17:46 PM

Derivative Instruments
The Company may utilize derivative financial instruments to manage foreign currency risk inherent in investments denominated in foreign currencies and to manage interest rate risk inherent in long-term debt offerings. Derivative financial instruments are not entered into for trading or speculative purposes.
The Company records all derivatives on the balance sheet at fair value. If a derivative qualifies as a cash flow hedge, the effective portion of the unrealized gain or loss is recorded in other comprehensive income as a separate component of shareholders’ equity and is reclassified into earnings over the life of the hedge. To the extent that the critical terms of the hedged item and the derivative are not identical, hedge ineffectiveness is reported in earnings.
Deferred Sales Commissions
Sales commissions paid by the Company to broker/dealers in connection with the sale of certain classes of shares of open-end funds and private funds are generally capitalized and amortized over the period during which redemptions by the purchasing shareholder are subject to a contingent deferred sales charge, which does not exceed six years. Distribution plan payments received by the Company from these funds are recorded in revenue as earned. Contingent deferred sales charges and early withdrawal charges received by the Company from redeeming shareholders of open-end funds are generally applied to reduce the Company’s unamortized deferred sales commission assets.
The Company evaluates the carrying value of its deferred sales commission asset for impairment on a quarterly basis. In its impairment analysis, the Company compares the carrying value of the deferred sales commission asset to the undiscounted cash flows expected to be generated by the asset over its remaining useful life to determine whether impairment has occurred. If the carrying value of the asset exceeds the undiscounted cash flows, the asset is written down to fair value based on discounted cash flows. Impairment adjustments are recognized in operating income as a component of amortization of deferred sales commissions.
Goodwill and Other Intangible Assets
Goodwill represents the excess of the cost of the Company’s investment in the net assets of acquired companies over the fair value of the underlying identifiable net assets at the dates of acquisition. Goodwill is not amortized, but is tested at least annually for impairment.
Identifiable intangible assets generally represent the cost of client relationships and management contracts acquired. Identifiable intangible assets with indefinite useful lives are not amortized. Identifiable intangible assets with discrete useful lives are amortized on a straight-line basis over their weighted average lives. The Company periodically reviews identifiable intangible assets for impairment as events or changes in circumstances indicate that the carrying amount of such assets may not be recoverable.
Equipment and Leasehold Improvements
Equipment and other fixed assets are recorded at cost and depreciated on a straight-line basis over their estimated useful lives, which range from three to five years. Accelerated methods are used for income tax purposes. Leasehold improvements are amortized on a straight-line basis over the shorter of their estimated useful lives or the term of the lease.
47
175734.FIN.CS3.indd 47175734.FIN.CS3.indd 47 1/15/08 7:17:46 PM1/15/08 7:17:46 PM

Debt Issuance Costs
Deferred debt issuance costs are amortized on a straight-line basis over the related term of the debt and are included in other assets. The amortization of deferred debt issuance costs is included in interest expense.
Revenue Recognition
Investment advisory, administration, distribution and service fees for the funds and investment advisory fees for separate accounts managed by the Company are recognized as the services are performed. Such fees are primarily based on predetermined percentages of the market values of the assets under management. With the exception of the Company’s separate account investment advisory fees, which are calculated generally as a percentage of either beginning, average or ending quarterly assets, the Company’s investment advisory, administration, distribution and service fees are calculated principally as a percentage of average daily assets. The Company may waive certain fees for investment and administration services at its discretion. Investment advisory and administration fees are recorded gross of any subadvisory arrangements, with the corresponding fees paid to any subadvisor based on the terms of those arrangements included in other expenses. In instances where the Company acts as subadvisor or co-manager, investment advisory fees are recorded net. Distribution and service fees are recorded gross of any third-party distribution and service arrangements; the expenses associated with these third-party distribution and service arrangements are recorded in distribution and service fee expense, respectively.
Sales of shares of investment companies in connection with the Company’s activities as principal underwriter are accounted for on a settlement date basis, which approximates trade date basis, with the related commission income and expense recorded on a trade date basis.
Interest income is accrued as earned. Dividend income is recorded on the ex-dividend date.
Income Taxes
The Company’s effective tax rate reflects the statutory tax rates of the many jurisdictions in which it operates. Significant judgment is required in determining its effective tax rate and in evaluating its tax positions. In the ordinary course of business, many transactions occur for which the ultimate tax outcome is uncertain. The Company adjusts its income tax provision in the period in which it determines that actual outcomes will likely be different from its estimates. Tax reserves are established when, despite the Company’s belief that the tax return positions are fully supportable, there is the potential that it may be successfully challenged. All SFAS No. 5 items have been properly accrued for as applicable. These reserves, as well as the related interest and potential penalties, are adjusted regularly to reflect changing facts and circumstances. While the Company has considered future taxable income and ongoing tax planning in assessing its taxes, changes in tax laws may result in a change to the Company’s tax position and effective tax rate. The Company classifies any interest or penalties incurred as a component of income tax expense.
Deferred income taxes reflect the expected future tax consequences of temporary differences between the carrying amounts and tax bases of the Company’s assets and liabilities measured using rates expected to be in effect when such differences reverse. Deferred taxes relate principally to stock-based compensation expense and capitalized sales commissions paid to brokers and dealers. Under IRS regulations, stock-based compensation is deductible for tax purposes at the time the employee recognizes the income (upon vesting of restricted stock, exercise of non-qualified stock options and disqualifying dispositions of incentive stock options). Capitalized sales commission payments are deductible for tax purposes at the time of payment. To the extent that deferred tax assets are considered more likely than not to be unrealizable, valuation allowances are provided.
48
175734.FIN.CS3.indd 48175734.FIN.CS3.indd 48 1/15/08 7:17:46 PM1/15/08 7:17:46 PM

As discussed in “Accounting Developments” below, the Company’s accounting for income taxes in future years will be impacted by the adoption of FASB Interpretation No. 48, “Accounting for the Uncertainty in Income Taxes – an interpretation of FASB Statement No. 109” (“FIN 48”).
Earnings Per Share
Earnings per basic share are based on the weighted-average number of common shares outstanding during each period less non-vested restricted stock. Earnings per diluted share are based on basic shares as determined above plus the incremental shares that would be issued upon the assumed exercise of in-the-money stock options, non-vested restricted stock using the treasury stock method and contingently convertible debt using the if-converted method.
Stock-Based Compensation
The Company accounts for stock-based compensation expense using the fair value method. Under the fair value method, stock-based compensation expense reflects the fair value of stock-based awards measured at grant date, is recognized over the relevant service period, and is adjusted each period for anticipated forfeitures. The fair value of each option award is estimated using the Black-Scholes option valuation model. The Black-Scholes option valuation model incorporates assumptions as to dividend yield, volatility, an appropriate risk-free interest rate and the expected life of the option. Stock-based compensation expense for employees who are not retirement eligible is recognized on a straight-line basis over the service or vesting period of the option (generally five years). Prior to the implementation of SFAS No. 123R, and consistent with SFAS 123 “Accounting for Stock-Based Compensation,” it had been the Company’s policy to recognize all stock-based compensation expense over the vesting period without regard to retirement eligibility. The Company continues to recognize all stock-based compensation expense for awards granted to retirement-eligible employees prior to November 1, 2005 over the vesting period. The Company immediately recognizes compensation expense at grant date for all awards granted to retirement-eligible employees on or after adoption of SFAS No. 123R on November 1, 2005. For awards granted to employees approaching retirement eligibility, compensation expense is recognized on a straight-line basis over the period from the grant date through the retirement eligibility date.
Foreign Currency Translation
Assets and liabilities of foreign subsidiaries are translated into U.S. dollars at current exchange rates as of the end of the accounting period. Related revenue and expenses are translated at average exchange rates in effect during the accounting period. Net translation exchange gains and losses are excluded from income and recorded in accumulated other comprehensive income. Foreign currency transaction gains and losses are reflected in other income currently as they occur.
Comprehensive Income
The Company reports all changes in comprehensive income in the Consolidated Statements of Shareholders’ Equity and Comprehensive Income. Comprehensive income includes net income, unrealized gains and losses on investment securities classified as available-for-sale (net of income tax), activity from terminated cash flow hedges (net of income tax), and foreign currency translation adjustments (net of income tax).
49
175734.FIN.CS3.indd 49175734.FIN.CS3.indd 49 1/15/08 7:17:46 PM1/15/08 7:17:46 PM
Loss Contingencies
The Company continuously reviews any investor, employee or vendor complaints and pending or threatened litigation. The likelihood that a loss contingency exists is evaluated under the criteria of SFAS No. 5, “Accounting for Contingencies,” through consultation with legal counsel and a loss contingency is recorded if the contingency is probable and reasonably estimable at the date of the financial statements. There are no losses of this nature that are currently deemed probable and reasonably estimable, and thus none have been recorded in the accompanying consolidated financial statements.
2. Accounting Developments
In December 2007, the Financial Accounting Standards Board (“FASB”) issued SFAS No. 160, “Noncontrolling Interests in Consolidated Financial Statements, an Amendment of ARB No. 51.” SFAS No. 160 amends ARB No. 51 to establish accounting and reporting standards for noncontrolling interests in subsidiaries and for the deconsolidation of subsidiaries. It clarifies that a noncontrolling interest in a subsidiary is an ownership interest that should be reported as equity in the consolidated financial statements. The provisions of SFAS No. 160 are effective for fiscal years beginning on or after December 15, 2008, and interim periods within those fiscal years. SFAS No. 160 is effective for the Company’s fiscal year that begins on November 1, 2009. Management is currently evaluating the potential impact, if any, on the Company’s consolidated financial statements.
In December 2007, the FASB amended SFAS No. 141, “Business Combinations.” SFAS No. 141, as amended, establishes principles and requirements for how an acquirer recognizes and measures in its financial statements the identifiable assets acquired, the liabilities assumed, and any noncontrolling interest in the acquiree. The provisions of SFAS No. 141, as amended, are effective for fiscal years beginning on or after December 15, 2008. SFAS No. 141, as amended, is effective for the Company’s fiscal year that begins on November 1, 2009. Management is currently evaluating the potential impact, if any, on the Company’s consolidated financial statements.
In June 2007, the FASB ratified the consensus reached by the Emerging Issues Task Force (“EITF”) in EITF Issue No. 06-11, “Accounting for Income Tax Benefits of Dividends on Share-Based Payment Awards”. Under the provisions of EITF 06-11, a realized income tax benefit from dividends or dividend equivalents that are charged to retained earnings and are paid to employees for equity classified nonvested equity shares, nonvested equity share units, and outstanding equity share options should be recognized as an increase to additional paid-in capital. The amount recognized in additional paid-in capital for the realized income tax benefit from dividends on those awards should be included in the pool of excess tax benefits available to absorb tax deficiencies on share-based payment awards. EITF 06-11 should be applied prospectively to the income tax benefits that result from dividends on equity-classified employee share-based payment awards that are declared in fiscal years beginning after December 15, 2007, and interim periods within those fiscal years. EITF 06-11 is effective for the Company’s fiscal year that begins on November 1, 2008. Management is currently evaluating the potential impact of EITF 06-11, if any, on the Company’s consolidated financial statements.
In February 2007, the FASB issued SFAS No. 159, “The Fair Value Option for Financial Assets and Financial Liabilities.” SFAS No. 159 permits entities to choose to measure many financial instruments and certain other items at fair value. The objective of the statement is to improve financial reporting by providing entities with the opportunity to mitigate volatility in reported earnings caused by measuring related assets and liabilities differently without having to apply
50
175734.FIN.CS3.indd 50175734.FIN.CS3.indd 50 1/15/08 7:17:46 PM1/15/08 7:17:46 PM

complex hedge accounting provisions. The provisions of SFAS No. 159 are effective for fiscal years beginning after November 15, 2007. SFAS No. 159 is effective for the Company’s fiscal year that begins on November 1, 2008. Management is currently evaluating this standard and its impact, if any, on the Company’s consolidated financial statements.
In September 2006, the FASB issued SFAS No. 157, “Fair Value Measurements.” SFAS No. 157 defines fair value, establishes a framework for measuring fair value, and expands disclosure requirements about fair value measurements. SFAS No. 157 applies to other accounting pronouncements that require or permit fair value measurements but does not in itself require any new fair value measurements. The provisions of SFAS No. 157 are effective for fiscal years beginning after November 15, 2007 and interim periods within those fiscal years. SFAS No. 157 is effective for the Company’s fiscal year that begins on November 1, 2008. Management is currently evaluating this standard and its impact, if any, on the Company’s consolidated financial statements.
In June 2006, the FASB issued Interpretation No. 48, “Accounting for Uncertainty in Income Taxes—an interpretation of FASB Statement No. 109” (“FIN 48”), to clarify certain aspects of accounting for uncertain tax positions. FIN 48 clarifies the accounting for income taxes by prescribing a minimum recognition threshold for tax positions, “more-likely-than-not” (i.e. greater than 50 percent), before being recognized in the financial statements. FIN 48 is effective for fiscal years beginning after December 15, 2006. The Company will adopt FIN 48 as of November 1, 2007, as required.
FIN 48 provides that interest recognized as a result of the application of FIN 48 may be classified as either income taxes or interest expense. FIN 48 further provides that any penalties recognized as a result of applying FIN 48 may be classified in the financial statements as either income taxes or another expense classification. The classification of these items is based upon the accounting policy election of the company. The Company’s historical accounting policy with respect to interest and penalties recognized for tax uncertainties has been to classify these amounts as income taxes. The Company will continue this classification upon the adoption of FIN 48.
The Company is continuing to evaluate the impact of FIN 48 on its financial statements, and currently anticipates recognizing a charge to retained earning of approximately $5.0 million upon adoption. In addition, the Company anticipates that, upon adoption, its deferred tax assets and income taxes payable will increase by approximately $85.0 million on the Company’s Consolidated Balance Sheet.
3. Acquisitions, Goodwill and Other Intangible Assets
In fiscal 2003, the Company acquired a majority interest in Parametric Portfolio Associates LLC (“Parametric Portfolio Associates”). The Company has an 84.3 percent capital and an 81.2 percent profits interest in Parametric Portfolio Associates at October 31, 2007. Certain minority shareholders of Parametric Portfolio Associates have the right to sell and the Company has the right to purchase an additional 4.3 percent of the capital of Parametric Portfolio Associates based on the financial results of Parametric Portfolio Associates for the calendar year ending December 31, 2007. Certain minority shareholders of Parametric Portfolio Associates will have the right to sell and the Company will have the right to purchase the remaining 11.4 percent of the capital of Parametric Portfolio Associates (which entitles the holder to the remaining 18.8 percent profits interest) over a six-year period based on financial results of Parametric Portfolio Associates for the calendar year ending December 31, 2007 and the next five calendar years. The price for acquiring the remaining capital and profits interests in Parametric Portfolio Associates will be based on a multiple of earnings before interest and taxes (a measure that is intended to approximate fair market value).
51
175734.FIN.CS3.indd 51175734.FIN.CS3.indd 51 1/15/08 7:17:46 PM1/15/08 7:17:46 PM

In fiscal 2007, the minority shareholders of Parametric Portfolio Associates exercised a put option whereby units representing a 2 percent capital ownership interest in Parametric Portfolio Associates were sold to the Company for $6.1 million based on a multiple of earnings before taxes of Parametric Portfolio Associates for the calendar year ended December 31, 2006. In conjunction with the purchase, the Company recorded intangible assets of $1.8 million (representing $1.0 million of amortizable intangible assets and $0.8 million of non-amortizable assets) and goodwill of $4.1 million. The remainder of the purchase price was allocated to minority interest. In fiscal 2006, the Company exercised a call option with the minority shareholders of Parametric Portfolio Associates whereby units representing a 2 percent capital ownership interest in Parametric were sold to the Company for $4.0 million based on a multiple of earnings before taxes for the calendar year ended December 31, 2005. In conjunction with the purchase, the Company recorded intangible assets of $1.4 million (representing $0.7 million of amortizable intangible assets and $0.7 million of non-amortizable intangible assets) and goodwill of $2.5 million. The remainder of the purchase price was allocated to minority interest.
In fiscal 2001, the Company acquired majority interests in Atlanta Capital Management, LLC (“Atlanta Capital”) and Fox Asset Management LLC (“Fox Asset Management”). The Company has an 80.4 percent interest in Atlanta Capital and an 80 percent interest in Fox Asset Management at October 31, 2007. Atlanta Capital’s minority shareholders have the right to sell and the Company has the right to purchase the remaining 19.6 percent of Atlanta Capital over a two-year period based on financial results of Atlanta Capital for the calendar years ending December 31, 2007 and 2008 at a price based on a multiple of earnings before taxes. Fox Assets Management’s minority shareholders have the right to sell and the Company has the right to purchase the remaining 20 percent of Fox Asset Management over a four-year period based on financial results of Fox Asset Management for the calendar years ending December 31, 2007 and the next three calendar years at a price based on a multiple of earnings before taxes.
In fiscal 2007, the minority shareholders of Atlanta Capital exercised a put option whereby units representing a 3 percent ownership interest in Atlanta Capital were sold to the Company for $2.9 million based on a multiple of earnings before taxes of Atlanta Capital for the calendar year ended December 31, 2006. In conjunction with the transaction, the Company recorded amortizable intangible assets of $0.8 million representing client relationships acquired and goodwill of $2.0 million. The remainder of the purchase price was allocated to minority interest. In fiscal 2006, the minority shareholders of Atlanta Capital exercised a put option whereby units representing a 7 percent ownership interest in Atlanta Capital were sold to the Company for $7.2 million based on a multiple of earnings of Atlanta Capital before taxes for the calendar year ended December 31, 2005. In conjunction with the transaction, the Company recorded amortizable intangible assets of $2.4 million representing client relationships acquired and goodwill of $4.7 million. The remainder of the purchase price was allocated to minority interest.
In April 2007, Parametric Portfolio Associates announced the signing of a definitive agreement with Managed Risk Advisors, LLC, an investment management and derivatives investment advisory firm based in Westport, Connecticut, to merge with Parametric Risk Advisors LLC (“Parametric Risk Advisors”), a newly formed Parametric Portfolio Associates’ affiliate. The transaction was completed on May 1, 2007. Parametric Risk Advisors is owned 60 percent by its principals and 40 percent by Parametric Portfolio Associates. Pursuant to the acquisition agreements, Parametric Portfolio Associates will have the right to require the other shareholders in Parametric Risk Advisors to sell their equity interests to Parametric Portfolio Associates at specific intervals over time at a price based upon a multiple of earnings before interest and taxes, a measure that is intended to represent fair market value. As a result of the transaction, the Company recorded intangible assets of $0.7 million representing client relationships acquired.
52
175734.FIN.CS3.indd 52175734.FIN.CS3.indd 52 1/15/08 7:17:46 PM1/15/08 7:17:46 PM
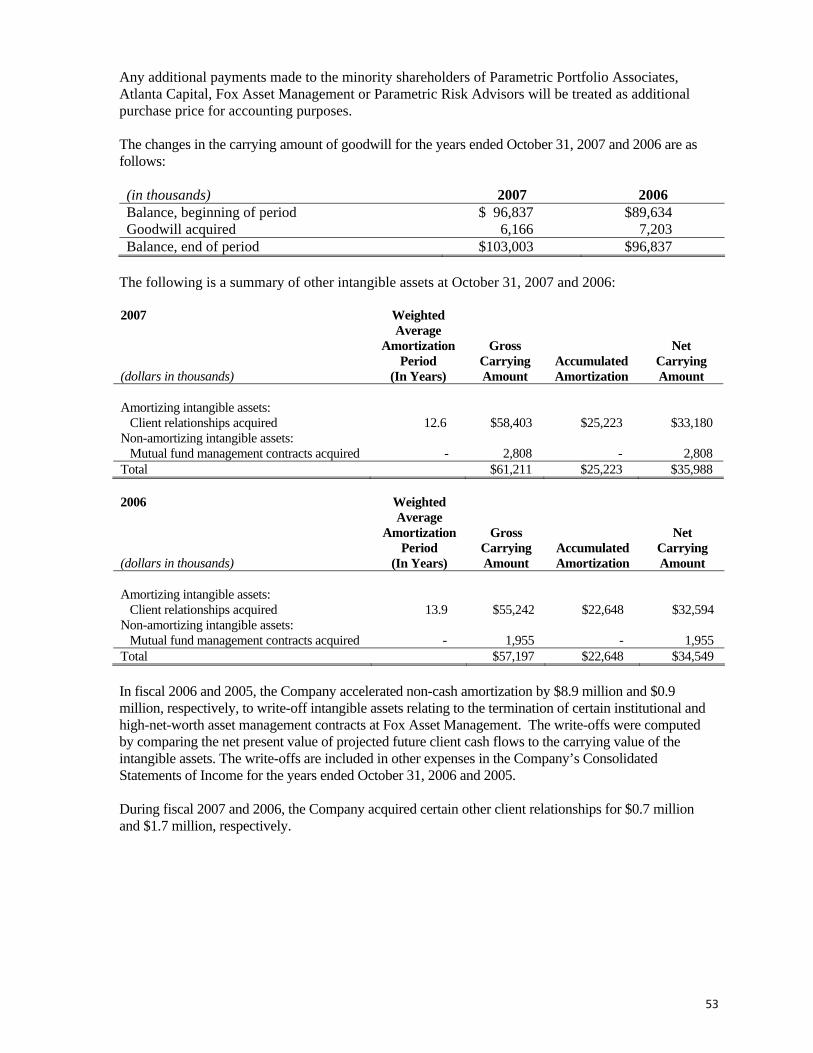
Any additional payments made to the minority shareholders of Parametric Portfolio Associates, Atlanta Capital, Fox Asset Management or Parametric Risk Advisors will be treated as additional purchase price for accounting purposes.
The changes in the carrying amount of goodwill for the years ended October 31, 2007 and 2006 are as follows:
(in thousands) 2007 2006Balance, beginning of period $ 96,837 $89,634 Goodwill acquired 6,166 7,203Balance, end of period $103,003 $96,837
The following is a summary of other intangible assets at October 31, 2007 and 2006:
2007
(dollars in thousands)
Weighted Average
AmortizationPeriod
(In Years)
GrossCarryingAmount
Accumulated Amortization
NetCarryingAmount
Amortizing intangible assets: Client relationships acquired 12.6 $58,403 $25,223 $33,180Non-amortizing intangible assets: Mutual fund management contracts acquired - 2,808 - 2,808Total $61,211 $25,223 $35,988
2006 Weighted Average
AmortizationPeriod
(In Years)
GrossCarryingAmount
Accumulated Amortization
NetCarryingAmount(dollars in thousands)
Amortizing intangible assets: Client relationships acquired 13.9 $55,242 $22,648 $32,594Non-amortizing intangible assets: Mutual fund management contracts acquired - 1,955 - 1,955Total $57,197 $22,648 $34,549
In fiscal 2006 and 2005, the Company accelerated non-cash amortization by $8.9 million and $0.9 million, respectively, to write-off intangible assets relating to the termination of certain institutional and high-net-worth asset management contracts at Fox Asset Management. The write-offs were computed by comparing the net present value of projected future client cash flows to the carrying value of the intangible assets. The write-offs are included in other expenses in the Company’s Consolidated Statements of Income for the years ended October 31, 2006 and 2005.
During fiscal 2007 and 2006, the Company acquired certain other client relationships for $0.7 million and $1.7 million, respectively.
53
175734.FIN.CS3.indd 53175734.FIN.CS3.indd 53 1/15/08 7:17:46 PM1/15/08 7:17:46 PM

Amortization expense, including the write-offs of intangible assets noted above, was $2.6 million, $11.5 million and $3.8 million for the years ended October 31, 2007, 2006 and 2005, respectively. Estimated amortization expense for the next five years is as follows:
Year Ending October 31, (in thousands)
Estimated Amortization Expense
2008 $2,7112009 2,7112010 2,7112011 2,7112012 2,711
4. Investments
The following is a summary of investments at October 31, 2007 and 2006:
(in thousands) 2007 2006
Short-term investments: Sponsored funds $ 50,183 $ - Investment in affiliate - 20,669 Total $ 50,183 $ 20,669
Long-term investments: Debt securities $ 770 $ 761 Equity securities 14,368 12,775 Sponsored funds 34,764 36,483 Collateralized debt obligation entities 18,962 9,105 Investments in affiliates 16,297 13,006 Other investments 950 945Total $ 86,111 $ 73,075
Investments in sponsored funds and equity securities classified as available-for-sale
The following is a summary of the cost and fair value of investments classified as available-for-sale at October 31, 2007 and 2006:
2007 Gross Unrealized (in thousands) Cost Gains Losses Fair Value Sponsored fund $ 75,537 $ 9,524 $ (114) $ 84,947 Total $ 75,537 $ 9,524 $ (114) $ 84,947
2006 Gross Unrealized(in thousands) Cost Gains Losses Fair Value Equity securities $ 5,455 $ 438 $ (76) $ 5,817 Sponsored funds 30,051 6,446 (14) 36,483Total $ 35,506 $ 6,884 $ (90) $ 42,300
Gross unrealized gains and losses on investments in sponsored funds and equity securities classified as available-for-sale have been excluded from earnings and reported as a component of accumulated other comprehensive income, net of deferred taxes. No investment with a gross unrealized loss has been in a loss position for greater than one year.
54
175734.FIN.CS3.indd 54175734.FIN.CS3.indd 54 1/15/08 7:17:47 PM1/15/08 7:17:47 PM

The Company has reviewed the gross unrealized losses of $114,000 as of October 31, 2007 and determined that these losses were not other than temporary, primarily because the Company has the ability and intent to hold the investments for a period of time sufficient to recover such losses. The aggregate fair value of investments associated with the unrealized losses was $1.5 million at October 31, 2007.
The following is a summary of the Company’s realized gains and (losses) upon disposition of sponsored funds and certain equity securities classified as available-for-sale for the years ended October 31, 2007, 2006 and 2005. The cost basis for sales of securities is determined on a specific identification basis.
(in thousands) 2007 2006 2005
Gains $4,746 $4,252 $ 267 Losses (1) (484) (44)Net realized gain $4,745 $3,768 $ 223
Investments in debt and equity securities classified as trading
The following is a summary of the cost and fair value of investments classified as trading at October 31, 2007 and 2006:
2007(in thousands) Cost Fair Value Long-term investments: Debt securities $ 773 $ 770 Equity securities 13,908 14,368Total $ 14,681 $ 15,138
2006(in thousands) Cost Fair Value Long-term investments: Debt securities $ 759 $ 761 Equity securities 6,955 6,958Total $ 7,714 $ 7,719
Gross unrealized gains and losses on debt and equity securities classified as trading investments have been reported in income currently as a component of other revenue.
The Company recognized $2.5 million of realized gains and $0.4 million of realized losses related to investments classified as trading for the year ended October 31, 2007.
Investments in collateralized debt obligation entities
The Company provides investment management services for, and has made investments in, a number of CDO entities. The Company’s ownership interests in the CDO entities are reported at fair value. The Company earns investment management fees, including subordinated management fees in some cases, for managing the collateral for the CDO entities, as well as incentive fees that are contingent on certain performance conditions. At October 31, 2007, combined assets under management in the pools of these CDO entities were $3.3 billion. The Company’s maximum exposure to loss as a result
55
175734.FIN.CS3.indd 55175734.FIN.CS3.indd 55 1/15/08 7:17:47 PM1/15/08 7:17:47 PM
of its investments in the equity of CDO entities was $19.0 million, which is the carrying value of these investments at October 31, 2007. Investors in CDO entities have no recourse against the Company for any losses sustained in the CDO structure. Management has concluded that the Company is not required to consolidate any of the CDO entities in which it has a minority equity investment.
The Company recognized impairment losses of $0.6 million and $2.1 million for the years ended October 31, 2006 and 2005, respectively, related to its investments in CDO entities. The impairment losses resulted from the effect of tightening credit spreads and higher than forecasted prepayment rates on the underlying collateral pools.
The carrying value of $19.0 million and $9.1 million at October 31, 2007 and 2006, respectively, for the Company’s ownership interests in the CDO entities is their estimated fair value.
Investments in affiliates
The Company has a 20 percent equity interest in Lloyd George Management (BVI) Limited (“LGM”), an independent investment management company based in Hong Kong that primarily manages emerging market equity funds and separate accounts, including several funds sponsored by the Company. The Company’s investment in LGM was $9.2 million and $8.3 million at October 31, 2007 and 2006, respectively. At October 31, 2007, the Company’s investment exceeded its share of the underlying net assets of LGM by $3.0 million. The Company considers the excess to be goodwill and therefore does not amortize this excess.
The Company has a 7 percent equity interest in a private equity partnership that invests in companies in the financial services industry. The Company’s investment in the partnership was $7.1 million and $4.2 million at October 31, 2007 and 2006, respectively. At October 31, 2007, the Company’s investment in the partnership was equal to its share of the underlying net assets.
At October 31, 2006, the Company had a 20 percent interest in the Eaton Vance Institutional Short Term Income Fund (“EVSI”), an open-end mutual fund that invests in short-term debt securities. The Company classified this investment as a short-term investment for financial reporting purposes due to the short-term nature of the underlying securities in which EVSI invests. The Company’s investment in EVSI was $20.7 million at October 31, 2006.
At October 31, 2006, the Company also had equity interests in excess of 20 percent in various other sponsored investment partnerships and funds. The Company’s investment in these affiliates totaled $0.5 million at October 31, 2006.
The Company reviews its equity method investments annually for impairment pursuant to Accounting Principles Board (“APB”) Opinion No. 18, “The Equity Method of Accounting for Investments in Common Stock.”
Other investments
Included in other investments are certain investments carried at cost totaling $1.0 million and $0.9 million at October 31, 2007 and October 31, 2006. Management believes that the fair value of these investments approximates their carrying value.
56
175734.FIN.CS3.indd 56175734.FIN.CS3.indd 56 1/15/08 7:17:47 PM1/15/08 7:17:47 PM

5. Equipment and Leasehold Improvements
The following is a summary of equipment and leasehold improvements at October 31, 2007 and 2006:
(in thousands) 2007 2006
Equipment $37,683 $26,845Leasehold improvements 15,771 14,649Subtotal 53,454 41,494Less: Accumulated depreciation and amortization (27,207) (19,999) Equipment and leasehold improvements, net $26,247 $21,495
Depreciation and amortization expense was $7.9 million, $4.0 million and $3.0 million for the years ended October 31, 2007, 2006 and 2005, respectively.
6. Long-term Debt
Ten-Year Senior Notes
On October 2, 2007, the Company issued $500.0 million in aggregate principal amount of 6.50% ten- year senior notes (“Senior Notes”) due October 2, 2017, resulting in net proceeds of approximately $496.1 million after payment of debt issuance costs. Interest is payable semi-annually in arrears on April 2 and October 2 of each year, commencing on October 2, 2007.
For fair value purposes, the Senior Notes have been valued utilizing market prices obtained from a third-party valuation firm.
Zero-coupon Exchangeable Senior Notes
On July 28, 2006, Eaton Vance Management (“EVM”), a wholly owned subsidiary of the Company, announced its intention to redeem for cash all of its outstanding zero-coupon exchangeable senior notes (“the Exchangeable Notes”), representing $110.9 million principal amount at maturity with an accreted value on redemption date of $76.4 million. Upon receipt of EVM’s notice of its intent to redeem, holders of the Exchangeable Notes had the option to exchange the Exchangeable Notes into Eaton Vance Corp. Non-Voting Common Stock at a rate of 28.7314 shares of common stock per $1,000 principal amount at maturity until the close of business on August 10, 2006. As of the close of business on August 10, 2006, all but $6,000 principal amount at maturity of the Exchangeable Notes were tendered for exchange into the Company’s Non-Voting Common Stock. EVM elected to pay the holders cash in lieu of delivering stock, as provided for in the indenture agreement governing the Exchangeable Notes. As a result, EVM paid $86.2 million to holders of the Exchangeable Notes who presented their Exchangeable Notes for exchange. The remaining Exchangeable Notes with a principal amount at maturity of $6,000 were redeemed for cash in the aggregate amount of $4,130.
The redemption of the Exchangeable Notes resulted in a reduction in diluted shares outstanding on the redemption date of 3.2 million shares. The $9.8 million premium value of the shares in excess of the accreted value of the Exchangeable Notes paid in cash to Exchangeable Note holders was recorded as interest expense in the Company’s 2006 fiscal fourth quarter income statement, in addition to the write-off of $1.5 million of related debt issuance costs. Approximately $2.6 million of the total premium value was not deductible for tax purposes.
57
175734.FIN.CS3.indd 57175734.FIN.CS3.indd 57 1/15/08 7:17:47 PM1/15/08 7:17:47 PM

Corporate Credit Facility
The Company amended its revolving credit facility on August 13, 2007, increasing its borrowing capacity and extending the expiration of the facility to August 13, 2012. Under the amended facility, the Company may borrow up to $200.0 million at LIBOR-based rates of interest that vary depending on the level of usage of the facility and credit ratings of the Company. The facility agreement contains financial covenants with respect to leverage and interest coverage, and requires the Company to pay an annual commitment fee on any unused portion. Neither financial covenants nor fee rates were affected by the amendment. As of October 31, 2007 and 2006, the Company had no borrowings outstanding under its revolving credit facility and was in compliance with all covenants.
7. Commitments and Contingencies
In the normal course of business, the Company enters into agreements that include indemnities in favor of third parties, such as engagement letters with advisors and consultants, information technology agreements, distribution agreements and service agreements. The Company has also agreed to indemnify its directors, officers and employees in accordance with the Company’s Articles of Incorporation, as amended. Certain agreements do not contain any limits on the Company’s liability and, therefore, it is not possible to estimate the Company’s potential liability under these indemnities. In certain cases, the Company may have recourse against third parties with respect to these indemnities. Further, the Company maintains insurance policies that may provide coverage against certain claims under these indemnities.
The Company and its subsidiaries are also subject to various legal proceedings. In the opinion of management, after discussions with legal counsel, the ultimate resolution of these matters would not have a material adverse effect on the consolidated financial condition or results of operations of the Company.
The Company leases certain office space and equipment under noncancelable operating leases. Rent expense under these leases in 2007, 2006 and 2005 amounted to $9.6 million, $8.2 million and $6.8 million, respectively. In September 2006, the Company signed a long-term lease to move the Company’s corporate headquarters to a new location in Boston, Massachusetts. The lease will commence in May 2009. Future minimum lease commitments are as follows:
Year Ending October 31, (in thousands) Amount 2008 $ 10,406 2009 11,926 2010 13,508 2011 13,190 2012 – thereafter 149,841 Total $ 198,871
In July 2006, the Company committed to invest $15.0 million in a private equity partnership that invests in companies in the financial services industry. The Company had invested $7.6 million of the total $15.0 million of committed capital at October 31, 2007.
58
175734.FIN.CS3.indd 58175734.FIN.CS3.indd 58 1/15/08 7:17:47 PM1/15/08 7:17:47 PM

8. Stock-Based Compensation Plans
Effective November 1, 2005, the Company adopted SFAS No. 123R, using the modified version of the retrospective transition method. Using this transition method, the Company restated all prior period results on a basis consistent with the pro forma disclosures previously made under SFAS No. 123. Upon the adoption of SFAS No. 123R under the modified retrospective method, the Company established a deferred tax asset of $21.3 million and increased retained earnings by $18.7 million.
Under SFAS No. 123, the Company had previously made the election to recognize actual forfeitures when they occurred rather than estimate them at the grant date. Under SFAS No. 123R, this election no longer exists. The Company recognized a cumulative effect of a change in accounting principle of $0.6 million on November 1, 2005, the adoption date, in order to adjust for expected forfeitures in excess of actual forfeitures on all grants made prior to October 31, 2005.
The Company recognized total compensation expense related to its stock-based compensation plans of $43.3 million, $36.3 million and $28.6 million for the years ended October 31, 2007, 2006 and 2005, respectively. The total income tax benefit recognized for stock-based compensation arrangements was $11.1 million, $10.0 million and $6.9 million for the years ended October 31, 2007, 2006 and 2005, respectively.
Stock Option Plan
The Company has a Stock Option Plan (the “1998 Plan”) administered by the Compensation Committee of the Board of Directors under which options to purchase shares of the Company’s Non-Voting Common Stock may be granted to all eligible employees and are automatically granted to independent directors of the Company. No stock options may be granted under the 1998 Plan with an exercise price that is less than the fair market value of the stock at the time the stock option is granted. The options granted under the 1998 Plan expire five to ten years from the date of grant and options to employees vest over a five-year period as stipulated in each grant. The 1998 Plan contains provisions that, in the event of a change of control of the Company, may accelerate the vesting of awards. A total of 40.0 million shares have been reserved for issuance under the 1998 Plan. Through October 31, 2007, options to purchase 37.8 million shares have been issued pursuant to the 1998 Plan.
On October 24, 2007, the Board of Directors approved the 2007 Stock Option Plan (the “2007 Plan”). Options granted under the 2007 Plan expire ten years from the date of grant and vest over five years. The 2007 Plan contains provisions that, in the event of a change of control of the Company, may accelerate the vesting of awards. No options may be granted under the 2007 Plan with an exercise price that is less than the fair market value of the stock at the time the stock option is granted. A total of 4.0 million shares have been reserved for issuance under the 2007 Plan. Through October 31, 2007 no options have been issued pursuant to the 2007 Plan.
The fair value of each stock option award is estimated on the date of grant using the Black-Scholes option valuation model. The Black-Scholes option valuation model incorporates assumptions as to dividend yield, volatility, an appropriate risk-free interest rate and the expected life of the option. Many of these assumptions require management’s judgment. The Company’s stock volatility assumption is based upon its historical stock price fluctuations. The Company has no reason to believe that its future stock price volatility will differ from the past. The Company uses historical data to estimate option forfeiture rates. The expected term of options granted is derived using the simplified method in accordance with SEC Staff Accounting Bulletin No. 107 (“SAB 107”). The simplified method under SAB 107 is applicable to grants of options made through December 31, 2007. Effective for grants subsequent to December 31, 2007, the Company will use an actual computation for the expected term of options granted. The risk-free rate for periods within the contractual life of the option is based on the U.S. Treasury yield curve in effect at the time of grant.
59
175734.FIN.CS3.indd 59175734.FIN.CS3.indd 59 1/15/08 7:17:47 PM1/15/08 7:17:47 PM
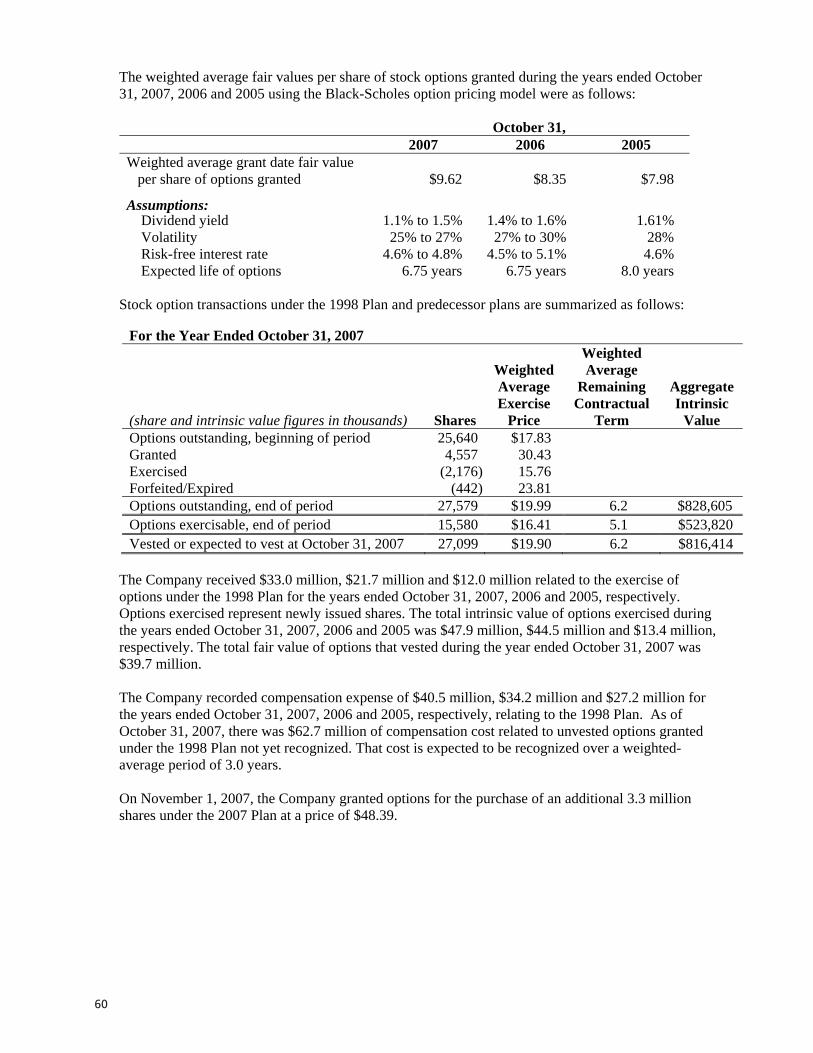
The weighted average fair values per share of stock options granted during the years ended October 31, 2007, 2006 and 2005 using the Black-Scholes option pricing model were as follows:
October 31, 2007 2006 2005
Weighted average grant date fair value per share of options granted $9.62 $8.35 $7.98
Assumptions: Dividend yield 1.1% to 1.5% 1.4% to 1.6% 1.61% Volatility 25% to 27% 27% to 30% 28%Risk-free interest rate 4.6% to 4.8% 4.5% to 5.1% 4.6% Expected life of options 6.75 years 6.75 years 8.0 years
Stock option transactions under the 1998 Plan and predecessor plans are summarized as follows:
For the Year Ended October 31, 2007
(share and intrinsic value figures in thousands) Shares
WeightedAverageExercise
Price
WeightedAverage
RemainingContractual
Term
AggregateIntrinsic
ValueOptions outstanding, beginning of period 25,640 $17.83 Granted 4,557 30.43 Exercised (2,176) 15.76 Forfeited/Expired (442) 23.81 Options outstanding, end of period 27,579 $19.99 6.2 $828,605 Options exercisable, end of period 15,580 $16.41 5.1 $523,820 Vested or expected to vest at October 31, 2007 27,099 $19.90 6.2 $816,414
The Company received $33.0 million, $21.7 million and $12.0 million related to the exercise of options under the 1998 Plan for the years ended October 31, 2007, 2006 and 2005, respectively. Options exercised represent newly issued shares. The total intrinsic value of options exercised during the years ended October 31, 2007, 2006 and 2005 was $47.9 million, $44.5 million and $13.4 million, respectively. The total fair value of options that vested during the year ended October 31, 2007 was $39.7 million.
The Company recorded compensation expense of $40.5 million, $34.2 million and $27.2 million for the years ended October 31, 2007, 2006 and 2005, respectively, relating to the 1998 Plan. As of October 31, 2007, there was $62.7 million of compensation cost related to unvested options granted under the 1998 Plan not yet recognized. That cost is expected to be recognized over a weighted-average period of 3.0 years.
On November 1, 2007, the Company granted options for the purchase of an additional 3.3 million shares under the 2007 Plan at a price of $48.39.
60
175734.FIN.CS3.indd 60175734.FIN.CS3.indd 60 1/15/08 7:17:47 PM1/15/08 7:17:47 PM

Restricted Stock Plan
The Company has a Restricted Stock Plan administered by the Compensation Committee of the Board of Directors under which restricted stock may be granted to key employees. Shares of the Company’s Non-Voting Common Stock granted under the plan are subject to restrictions on transferability and carry the risk of forfeiture, based in each case on such considerations as the Compensation Committee shall determine. Unless the Compensation Committee determines otherwise, restricted stock that is still subject to restrictions upon termination of employment shall be forfeited. Restrictions on shares granted lapse over the period ending five years from date of grant. A total of 2.0 million shares have been reserved under the plan. Through October 31, 2007, 0.9 million shares have been issued pursuant to this plan.
In the years ended October 31, 2007, 2006 and 2005, 13,269, 40,209 and 45,546 shares, respectively, were issued pursuant to the plan at a weighted average grant date fair value of $45.22, $24.87 and $21.96 per share. Because these shares are contingently forfeitable, compensation expense is recorded over the forfeiture period. The Company recorded compensation expense of $1.0 million, $1.0 million and $0.8 million for the years ended October 31, 2007, 2006 and 2005, respectively, relating to shares issued pursuant to this plan. As of October 31, 2007, there was $2.2 million of compensation cost related to unvested awards not yet recognized. That cost is expected to be recognized over a weighted average period of 2.7 years.
A summary of the Company's restricted stock activity for the year ended October 31, 2007 is presented below:
For the Year Ended October 31, 2007 (share figures in thousands)
Shares
WeightedAverageGrant
Date Fair Value
Unvested, beginning of period 210 $19.79 Granted 13 45.22 Vested (45) 18.84 Forfeited/expired - -Unvested, end of period 178 $21.93
On November 1, 2007, the Company granted 29,965 shares of restricted stock under the plan at a price of $48.39.
Employee Stock Purchase Plan
A total of 9.0 million shares of the Company’s Non-Voting Common Stock have been reserved for issuance under the Employee Stock Purchase Plan. The plan qualifies under Section 423 of the United States Internal Revenue Code and permits eligible employees to direct up to 15 percent of their salaries to a maximum of $12,500 per six-month offering period toward the purchase of Eaton Vance Corp. Non-Voting Common Stock at the lower of 90 percent of the market price of the Non-Voting Common Stock at the beginning or at the end of each six-month offering period. Through October 31, 2007, 7.2 million shares have been issued pursuant to this plan. The Company recorded compensation
61
175734.FIN.CS3.indd 61175734.FIN.CS3.indd 61 1/15/08 7:17:47 PM1/15/08 7:17:47 PM

expense of $1.0 million, $0.6 million and $0.6 million for the years ended October 31, 2007, 2006 and 2005, respectively, relating to the Employee Stock Purchase Plan. The Company received $3.3 million, $2.9 million and $2.4 million related to shares issued under the Employee Stock Purchase Plan for the years ended October 31, 2007, 2006 and 2005 respectively.
Incentive Plan – Stock Alternative
A total of 4.8 million shares of the Company’s Non-Voting Common Stock have been reserved for issuance under the Incentive Plan – Stock Alternative. The plan permits employees and officers to direct up to half of their monthly and annual incentive bonuses toward the purchase of Non-Voting Common Stock at 90 percent of the average market price of the stock for five business days subsequent to the end of the offering period. Through October 31, 2007, 3.1 million shares have been issued pursuant to this plan. The Company received $5.6 million, $3.6 million and $2.6 million related to shares issued under the Incentive Plan – Stock Alternative for the years ended October 31, 2007, 2006 and 2005, respectively. In accordance with SFAS 123R, the Company recorded compensation expense of $0.8 million and $0.5 million for the years ended October 31, 2007 and 2006, respectively, relating to the Incentive Plan – Stock Alternative. The Company did not record any compensation cost related to this plan in fiscal 2005, as it was not subject to the provisions of SFAS No. 123.
Stock Option Income Deferral Plan
The Company has established an unfunded, non-qualified Stock Option Income Deferral Plan. The Plan is intended to permit key employees to defer recognition of income upon exercise of non-qualified stock options previously granted by the Company. As of October 31, 2007, options to purchase 1.3 million shares have been exercised and placed in trust with the Company.
Employee Loan Program
The Company has established an Employee Loan Program under which a program maximum of $10.0 million is available for loans to officers (other than executive officers) and other key employees of the Company for purposes of financing the exercise of employee stock options. Loans are written for a seven-year period, at varying fixed interest rates (currently ranging from 2.8 percent to 6.3 percent), are payable in annual installments commencing with the third year in which the loan is outstanding, and are collateralized by the stock issued upon exercise of the option. Loans outstanding under this program are reflected as notes receivable from stock option exercises in shareholders’ equity and amounted to $2.3 million and $1.9 million at October 31, 2007 and 2006, respectively.
The fair value of loans receivable has been determined by discounting expected future cash flows using management’s estimates of current market interest rates for such receivables. The fair value of these receivables approximates their carrying value (see Note 15).
9. Employee Benefit Plans
Profit Sharing Retirement Plan
The Company has a profit sharing retirement plan for the benefit of substantially all employees. The Company has contributed $10.8 million, $9.9 million and $8.2 million for the years ended October 31, 2007, 2006 and 2005, respectively, representing 15 percent of eligible employee compensation for each of the three years.
62
175734.FIN.CS3.indd 62175734.FIN.CS3.indd 62 1/15/08 7:17:47 PM1/15/08 7:17:47 PM
Savings Plan and Trust
The Company has a Savings Plan and Trust that is qualified under Section 401 of the Internal Revenue Code. All full-time employees who have met certain age and length of service requirements are eligible to participate in the plan. This plan allows participating employees to make elective deferrals up to the plan’s annual limits. The Company then matches each participant’s contribution on a dollar-for-dollar basis to a maximum of $1,040 per annum. The Company’s expense under the plan was $0.8 million, $0.6 million and $0.5 million for the years ended October 31, 2007, 2006 and 2005, respectively.
Supplemental Profit Sharing Plan
The Company has an unfunded, non-qualified Supplemental Profit Sharing Plan whereby certain key employees of the Company may receive profit sharing contributions in excess of the amounts allowed under the profit sharing retirement plan. No employee may receive combined contributions in excess of $33,000 per annum related to the Profit Sharing Retirement Plan and the Supplemental Profit Sharing Plan. The Company’s expense under the supplemental plan for the years ended October 31, 2007, 2006 and 2005 was $105,000, $77,000 and $55,000, respectively.
10. Common Stock
All outstanding shares of the Company’s Voting Common Stock are deposited in a voting trust, the trustees of which have unrestricted voting rights with respect to the voting common stock. The trustees of the voting trust are all officers of the Company. Non-voting common shares do not have voting rights under any circumstances.
In fiscal 2007, the Company issued approximately 99,000 shares of its Voting Common Stock and repurchased approximately 37,000 shares of its Voting Common Stock.
The Company’s current share repurchase program was announced on October 24, 2007. The Board authorized management to repurchase up to 8.0 million shares of its Non-Voting Common Stock on the open market and in private transactions in accordance with applicable securities laws. The Company’s stock repurchase plan is not subject to an expiration date.
In fiscal 2007, the Company purchased approximately 10.0 million shares of its Non-Voting Common Stock under previous share repurchase authorizations and 0.8 million shares under the current share repurchase authorization. Approximately 7.2 million additional shares may be repurchased under the current authorization.
11. Income Taxes
The provision for income taxes for the years ended October 31, 2007, 2006 and 2005 consists of the following:
(in thousands) 2007 2006 2005Current: Federal $ 92,397 $102,297 $ 94,330 State 10,866 11,153 11,080 Deferred: Federal (9,063) (10,228) (12,976) State (1,000) (977) (1,563)Total $ 93,200 $102,245 $ 90,871
63
175734.FIN.CS3.indd 63175734.FIN.CS3.indd 63 1/15/08 7:17:47 PM1/15/08 7:17:47 PM
Deferred income taxes reflect the expected future tax consequences of temporary differences between the carrying amounts and tax bases of the Company’s assets and liabilities. The significant components of deferred income taxes are as follows:
(in thousands) 2007 2006
Deferred tax assets: Stock-based compensation $ 33,899 $ 26,584 Deferred rent 676 838 Differences between book and tax bases of investments 619 1,993 Differences between book and tax bases of property 1,111 160 Unrealized losses on derivative instruments 1,558 - Other 1,931 483Total deferred tax asset $ 39,794 $ 30,058
Deferred tax liabilities: Deferred sales commissions $ (37,573) $ (41,947) Differences between book and tax bases of goodwill and intangibles (8,858) (6,371) Unrealized net holding gains on investments (3,600) (2,584)Total deferred tax liability $ (50,031) $ (50,902) Net deferred tax liability $ (10,237) $ (20,844)
Deferred tax assets and liabilities are reflected on the Company’s Consolidated Balance Sheets at October 31, 2007 and 2006 as follows:
(in thousands) 2007 2006
Net current deferred tax asset, included in other current assets $ 1,503 $ 1,676 Net non-current deferred tax liability (11,740) (22,520)Net deferred tax liability $ (10,237) $ (20,844)
A reconciliation from the U.S. Federal statutory income tax rate to the Company’s effective income tax rate for the years ended October 31, 2007, 2006 and 2005 is as follows:
2007 2006 2005
Federal statutory rate 35.0% 35.0% 35.0% State and local income tax, net of federal income tax benefit 2.7 2.5 2.9Minority interest (0.9) (0.7) (0.8)Stock-based compensation 1.9 1.2 1.6Other 0.4 0.9 0.2Effective income tax rate 39.1% 38.9% 38.9%
The exercise of non-qualified stock options resulted in a reduction of taxes payable of approximately $9.9 million, $8.2 million and $3.5 million for the years ended October 31, 2007, 2006 and 2005, respectively. Such benefit has been reflected as a component of shareholders’ equity.
64
175734.FIN.CS3.indd 64175734.FIN.CS3.indd 64 1/15/08 7:17:48 PM1/15/08 7:17:48 PM

12. Derivative Financial Instruments
In October 2007, the Company issued $500.0 million in aggregate principal amount of 6.5 percent ten-year senior notes due October 2017. In anticipation of the offering, the Company entered into an interest rate lock transaction with an aggregate notional amount of $200.0 million intended to hedge against movements in ten-year Treasury rates between the time at which the decision was made to issue the debt and the pricing of the securities. The prevailing Treasury rate declined to the time of the pricing of the securities, and the interest rate lock was settled for a payment by the Company of $4.5 million. At termination, the interest rate lock was determined to be an effective cash flow hedge and the $4.5 million settlement cost was recorded as a loss in other comprehensive income, net of tax.
The loss recorded in other comprehensive income will be reclassified to earnings as a component of interest expense over the term of the debt. During the fiscal year ended October 31, 2007, the Company reclassified $37,000 of the loss on the Treasury lock transaction into interest expense. At October 31, 2007, the remaining unamortized loss on this transaction was $4.4 million. During fiscal 2008, the Company expects to reclassify approximately $0.4 million of the loss on the Treasury lock transaction into interest expense.
In addition to the effective cash flow hedge described above, the Company entered into a second Treasury rate lock transaction with an aggregate notional amount of $200.0 million in anticipation of the issuance of senior notes with a maturity in excess of ten years. When it was determined that the Company would not issue senior notes with a maturity in excess of ten years, this interest rate lock was terminated and the net settlement of $6.7 million was recorded as a loss on investments in the Company’s Consolidated Statement of Income.
13. Comprehensive Income
Total comprehensive income is reported in the Consolidated Statements of Shareholders’ Equity and Comprehensive Income and is composed of net income and other comprehensive income (loss), net of tax.
The components of other comprehensive income (loss) at October 31, 2007, 2006 and 2005 are as follows:
(in thousands) Gross
Amount
Tax(Expense)or Benefit
NetAmount
2007Net unrealized holding gains on available-for-sale securities $ 2,615 $ (987) $ 1,628 Foreign currency translation adjustments 84 (30) 54 Unamortized loss on derivative instruments (4,430) 1,558 (2,872)Other comprehensive income (loss) $ (1,731) $ 541 $ (1,190)2006Net unrealized holding gains on available-for-sale securities $ 2,793 $ (1,039) $ 1,754 Foreign currency translation adjustments 99 (36) 63 Other comprehensive income (loss) $ 2,892 $ (1,075) $ 1,817 2005Net unrealized holding gains on available-for-sale securities $ 1,201 $ (441) $ 760 Foreign currency translation adjustments (71) 23 (48)Other comprehensive income (loss) $ 1,130 $ (418) $ 712
65
175734.FIN.CS3.indd 65175734.FIN.CS3.indd 65 1/15/08 7:17:48 PM1/15/08 7:17:48 PM

During the years ended October 31, 2007, 2006 and 2005, the Company reclassified gains of $2.9 million, $4.1 million and $0.2 million, respectively, from other comprehensive income (loss) to net income as gains and losses were realized on the sale of available-for-sale securities.
Accumulated other comprehensive income is reported in the Consolidated Statements of Shareholders’ Equity and Comprehensive Income. The components of accumulated other comprehensive income at October 31, 2007 and 2006 are as follows:
(in thousands) 2007 2006Net unrealized gains on available-for-sale securities, net of tax $5,903 $4,275Foreign currency translation adjustments, net of tax 162 108 Unamortized loss on derivative instruments, net of tax (2,872) -Total $3,193 $4,383
14. Earnings Per Share
The following table provides a reconciliation of net income and common shares used in the earnings per basic share and earnings per diluted share computations for the years ended October 31, 2007, 2006 and 2005:
(in thousands, except per share data) 2007 2006 2005Net income – basic $142,811 $159,377 $138,706 Interest adjustment related to contingently convertible debt, net of tax - 1,512 740 Net income – diluted $142,811 $160,889 $139,446
Weighted average shares outstanding – basic 124,527 127,807 131,591 Incremental common shares from stock options and restricted stock awards 10,725 6,726 5,741 Incremental common shares related to contingently convertible debt - 2,471 3,188 Weighted average shares outstanding – diluted 135,252 137,004 140,520 Earnings per share: Basic $1.15 $1.25 $1.05 Diluted $1.06 $1.17 $0.99
The Company uses the treasury stock method to account for the dilutive effect of unexercised stock options and unvested restricted stock in earnings diluted per share. Antidilutive incremental common shares related to stock options excluded from the computation of earnings per share were 73,700, 140,000, and 63,000 for the years ended October 31, 2007, 2006 and 2005, respectively.
66
175734.FIN.CS3.indd 66175734.FIN.CS3.indd 66 1/15/08 7:17:48 PM1/15/08 7:17:48 PM
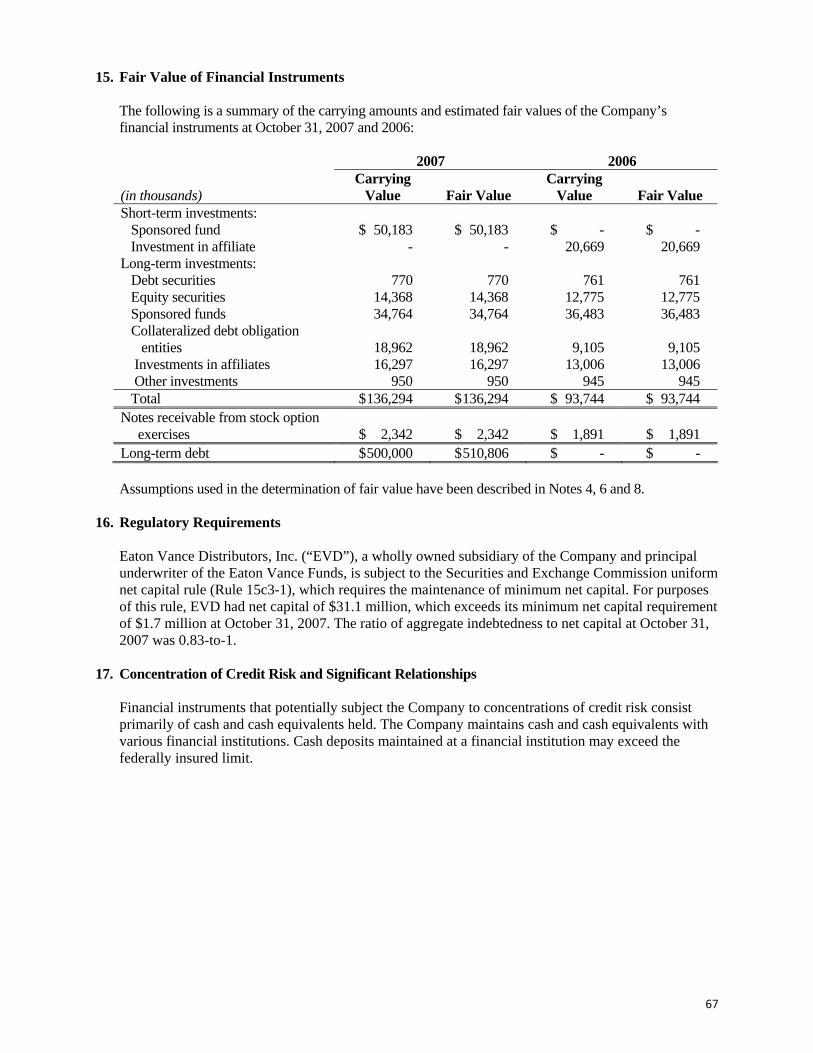
15. Fair Value of Financial Instruments
The following is a summary of the carrying amounts and estimated fair values of the Company’s financial instruments at October 31, 2007 and 2006:
2007 2006
(in thousands) Carrying
Value Fair Value Carrying
Value Fair Value Short-term investments: Sponsored fund $ 50,183 $ 50,183 $ - $ - Investment in affiliate - - 20,669 20,669Long-term investments: Debt securities 770 770 761 761 Equity securities 14,368 14,368 12,775 12,775 Sponsored funds 34,764 34,764 36,483 36,483 Collateralized debt obligation entities 18,962 18,962 9,105 9,105 Investments in affiliates 16,297 16,297 13,006 13,006 Other investments 950 950 945 945 Total $ 136,294 $ 136,294 $ 93,744 $ 93,744 Notes receivable from stock option exercises $ 2,342 $ 2,342 $ 1,891 $ 1,891 Long-term debt $ 500,000 $ 510,806 $ - $ -
Assumptions used in the determination of fair value have been described in Notes 4, 6 and 8.
16. Regulatory Requirements
Eaton Vance Distributors, Inc. (“EVD”), a wholly owned subsidiary of the Company and principal underwriter of the Eaton Vance Funds, is subject to the Securities and Exchange Commission uniform net capital rule (Rule 15c3-1), which requires the maintenance of minimum net capital. For purposes of this rule, EVD had net capital of $31.1 million, which exceeds its minimum net capital requirement of $1.7 million at October 31, 2007. The ratio of aggregate indebtedness to net capital at October 31, 2007 was 0.83-to-1.
17. Concentration of Credit Risk and Significant Relationships
Financial instruments that potentially subject the Company to concentrations of credit risk consist primarily of cash and cash equivalents held. The Company maintains cash and cash equivalents with various financial institutions. Cash deposits maintained at a financial institution may exceed the federally insured limit.
67
175734.FIN.CS3.indd 67175734.FIN.CS3.indd 67 1/15/08 7:17:48 PM1/15/08 7:17:48 PM

The following portfolio and related funds provided over 10 percent of the total revenue of the Company:
For the Years Ended October 31, (dollar figures in thousands) 2007 2006 2005
Tax-Managed Growth Portfolio and related funds:
Investment advisory and administration fees, underwriting commissions, distribution plan payments, contingent deferred sales charges and service fees $204,433 $192,109 $190,461
Percent of revenue 18.9% 22.2% 25.3%
18. Comparative Quarterly Financial Information (Unaudited)
2007First
(in thousands, except per share data)
2006
(in thousands, except per share data) First
QuarterSecondQuarter
ThirdQuarter
FourthQuarter
FullYear
Total revenue(1) $206,540 $211,796 $216,575 $227,283 $862,194 Operating income $ 64,079 $ 60,617 $ 67,885 $ 72,385 $264,966 Net income $ 39,131 $ 39,900 $ 41,819 $ 38,527 $159,377 Earnings per share:
Basic $ 0.30 $ 0.31 $ 0.33 $ 0.30 $ 1.25 Diluted $ 0.28 $ 0.29 $ 0.31 $ 0.29 $ 1.17
QuarterSecondQuarter
ThirdQuarter
FourthQuarter
FullYear
Total revenue $243,176 $260,184 $ 286,932 $293,808 $1,084,100 Operating income $ 1,997 $ 36,292 $ 88,858 $105,790 $ 232,937 Net income $ 2,559 $ 23,093 $ 55,776 $ 61,383 $ 142,811 Earnings per share:
Basic $ 0.02 $ 0.18 $ 0.45 $ 0.51 $ 1.15 Diluted $ 0.02 $ 0.17 $ 0.41 $ 0.47 $ 1.06
(1) Certain amounts from prior quarters have been reclassified to conform to the current quarter presentation. See footnote 1 for further discussion of this change.
68
175734.FIN.CS3.indd 68175734.FIN.CS3.indd 68 1/15/08 7:17:48 PM1/15/08 7:17:48 PM

Report of Independent Registered Public Accounting Firm
To the Board of Directors and Shareholders of Eaton Vance Corp.:
We have audited the accompanying consolidated balance sheets of Eaton Vance Corp. and subsidiaries (the “Company”) as of October 31, 2007 and 2006, and the related consolidated statements of income, shareholders’ equity and comprehensive income, and cash flows for each of the three years in the period ended October 31, 2007. These financial statements are the responsibility of the Company's management. Our responsibility is to express an opinion on these financial statements based on our audits.
We conducted our audits in accordance with the standards of the Public Company Accounting Oversight Board (United States). Those standards require that we plan and perform the audit to obtain reasonable assurance about whether the financial statements are free of material misstatement. An audit includes examining, on a test basis, evidence supporting the amounts and disclosures in the financial statements. An audit also includes assessing the accounting principles used and significant estimates made by management, as well as evaluating the overall financial statement presentation. We believe that our audits provide a reasonable basis for our opinion.
In our opinion, such consolidated financial statements present fairly, in all material respects, the financial position of Eaton Vance Corp. and subsidiaries as of October 31, 2007 and 2006, and the results of their operations and their cash flows for each of the three years in the period ended October 31, 2007, in conformity with accounting principles generally accepted in the United States of America.
We have also audited, in accordance with the standards of the Public Company Accounting Oversight Board (United States), the effectiveness of the Company's internal control over financial reporting as of October 31, 2007, based on the criteria established in Internal Control—Integrated Framework issued by the Committee of Sponsoring Organizations of the Treadway Commission and our report dated December 20, 2007 expressed an unqualified opinion on management's assessment of the effectiveness of the Company's internal control over financial reporting and an unqualified opinion on the effectiveness of the Company's internal control over financial reporting.
DELOITTE & TOUCHE LLP
Boston, Massachusetts December 20, 2007
69
175734.FIN.CS3.indd 69175734.FIN.CS3.indd 69 1/15/08 7:17:48 PM1/15/08 7:17:48 PM

70
175734.FIN.CS3.indd 70175734.FIN.CS3.indd 70 1/15/08 7:17:48 PM1/15/08 7:17:48 PM

71
EATON VANCE CORP.
Directors
Ann E. Berman(1,3)
Thomas E. Faust Jr.
Leo I. Higdon, Jr.(2,3)
Vincent M. O’Reilly*(1,2,3)
Dorothy E. Puhy(1,2,3)
Winthrop H. Smith, Jr.(1,2,3)
* Lead Director
Board Committees:1. Audit2. Compensation3. Nominating and Governance
Officers
Thomas E. Faust Jr.Chairman and Chief Executive Officer
Duncan W. RichardsonExecutive Vice President and Chief Equity Investment Officer
Jeffrey P. BealeVice President and Chief Administrative Officer
Laurie G. HyltonVice President and Chief Accounting Officer
Frederick S. MariusVice President and Secretary
John E. PelletierVice President and Chief Legal Officer
Payson F. SwaffieldVice President and Chief Income Investment Officer
Robert J. WhelanVice President, Treasurer and Chief Financial Officer
175734.P 1/16/08 1:28 PM Page 71

72
INVESTOR INFORMATION
Eaton Vance Corp. and Form 10-K
Eaton Vance Corp. has filed an Annual
Report on Form 10-K with the Securities and
Exchange Commission for the 2007 fiscal year.
For a copy of that Report, which is available free
of charge to shareholders of Eaton Vance Corp.
upon request, or other information regarding the
Company, please contact:
Robert J. Whelan
Chief Financial Officer
Eaton Vance Corp.
The Eaton Vance Building
255 State Street
Boston, MA 02109
(617) 482-8260
The foregoing Report and other information
about Eaton Vance Corp. are also available on
the Company’s website: www.eatonvance.com.
The Company has included as Exhibit 31 to its
Annual Report on Form 10-K for fiscal year
2007 certificates of the Chief Executive Officer
and Chief Financial Officer of the Company
certifying the quality of the Company’s public
disclosure. The Company has submitted to the
New York Stock Exchange a certificate of the
Chief Executive Officer certifying that he is not
aware of any violation by the Company of
New York Stock Exchange corporate
governance listing standards.
Transfer Agent and Registrar
Computershare Investor Services is the
Transfer Agent and Registrar for the
Company’s common stock and maintains
shareholder accounting records. The Transfer
Agent should be contacted regarding
changes in address, name or ownership, lost
certificates and consolidation of accounts.
When corresponding with the Transfer Agent,
shareholders should state the exact name(s)
in which the stock is registered and the
certificate number, as well as other pertinent
account information.
Please contact:
Computershare Investor Services
P.O. Box 43078
Providence, RI 02940-3078
(877) 282-1168
www.computershare.com
Independent Registered Public Accounting Firm
Deloitte & Touche LLP
200 Berkeley Street
Boston, MA 02116
(617) 437-2000
175734.P 1/15/08 7:06 PM Page 72

Best Performing Publicly Traded U.S. StocksApril 30,1979 to October 31, 2007
AnnualRank Company Return
1 Eaton Vance Corp. 31.7%
2 Leucadia National Corp. 28.9%
3 Countrywide Financial Corp. 28.2%
4 State Street Corp. 26.5%
5 Berkshire Hathaway Inc. 25.8%
Standard & Poor’s 500 Index 13.3%
EATON VANCE CORP.
$10,000,000
1,000,000
100,000
10,000
1,000
Assumes reinvestment of all dividends and proceeds of 1995 spin-off of Investors Financial ServicesCorp. Source: FactSet, Eaton Vance.
Total return with dividends reinvested. Source: FactSet.
About the Cover: The Leonard P. Zakim Bunker Hill Memorial Bridge as viewed from the historic streets ofCharlestown, Massachusetts. Founded in 1628, Charlestown is one of America's oldest settlements and thesite of the Battle of Bunker Hill during the Revolutionary War. The Zakim Bridge opened in 2003 as thecenterpiece of Boston's Big Dig project and is the widest cable-stayed bridge in the world. These Bostonarea landmarks, old and new, represent the tradition and innovation that define Eaton Vance.
Photograph: Russ Bolt, Russ Bolt Imaging.
Eaton Vance Corp. Historical Stock ReturnsValue of $1,000 Invested April 30, 1979
Eaton Vance Corp. was formed by the merger on April 30, 1979 of two Boston-based investment
managers: Eaton & Howard, Inc., founded in 1924, and Vance, Sanders & Company, organized in 1934.
$2,583,602
EATON VANCE CORP. MISSION AND CORE VALUES
Our Mission
Eaton Vance strives to be the premier investment management
organization. We seek to provide clients with superior performance,
top quality service and value-added products across a range of
investment disciplines and distribution channels. We seek to provide an attractive work
environment and fulfilling careers for our dedicated employees. Through the success of
clients and associates, we thereby seek to build long-term shareholder value.
Our Core Values
Integrity • Honest in word and deed
• Adheres to the Company’s Code of Ethics, industry standards
of business conduct and applicable law
• Deals fairly and forthrightly with clients, colleagues and
business partners
Professionalism • Demonstrates maturity, dedication and a strong work ethic
• Behaves appropriately; respectful of clients, colleagues and
business partners
• Uses the Company’s resources wisely
Teamwork • Works collaboratively with others to achieve shared goals
• Communicates openly and follows through on commitments
• Enhances the work experience of colleagues
Client Focus • Places the interests of clients first
• Meets or exceeds client performance expectations
Creativity/Adaptability • Develops business opportunities and process improvements
• Open and adaptable to change
• Works to achieve personal development
Excellence • Achieves outstanding results for clients and shareholders
• Advances the record and reputation of Eaton Vance as an
industry leader
175734.BCFC 1/15/08 6:10 PM Page 2

Eaton Vance Corp. Elsie A. Flaherty Patricia M. Procopio Violet Apalakian Janet E. Sanders Dianne Sillers Patricia M. Shea Jean M. Plante James B. Hawkes Charles A. BrownJean F. McGoey Constance T. Wagner Linda C. Hanson Stuart B. Strong Patricia A. Andersen Nora B. Bernazzani Wayne R. Saulnier Linda S. Pingiaro William J. Austin Mark A. Carlson Anne M. Morgan Theresa S. Thorley Daniel C. Cataldo Jenilde A. Mastrangelo Mark S. Venezia Barbara E. Wagner Jane A. Nussbaum Linda A. DohertyThomas E. Faust Jennifer J. Kirk Cynthia J. Clemson Susan S. Kiewra Lauren T. Mannone Donna M. D’Addario Marlo-Jean Tulis Anne Marie Gallagher Margaret M. RedmondStephanie H. Brady Duncan W. Richardson Thomas M. Metzold Mary D. Maestranzi Jill D. Lyons James F. Foley Veth S. Huorn William M. Gillen Mary V. Little Kelley CreedonR. Douglas McMahon Louise E. Kelley Diane Brissette David L. Stokkink William H. Ahern Rosemary Leavitt Scott H. Page Lynn W. Ostberg Marie Y. Calixte Kathleen McManusJames A. Thebado Lynne M. Hetu Clifford H. Krauss Payson F. Swaffield Cornelius J. Sullivan Michael W. Weilheimer Robert B. MacIntosh Karen M. Zemotel Barbara E. Campbell Hugh J. Gilmartin Christopher R. Berg Paul F. Jones Amy B. Ursillo Bonnie B. Ramage Perry D. Hooker John W. Gibson Gregory P. Parker Hadi C. MezherDelores A. Wood Timothy P. Roach Peter D. Stokinger Julie A. Neviera Richard Finelli Morgan C. Mohrman Jeffrey P. Beale Mark D. Nelson Linda D. Newkirk A J. MurphyDeanna R. Berry Jane A. Rudnick Walter W. Shulits Leighton Young Geoffrey G. Marshall Robert H. Bortnick Cecilia J. O’Keefe Louann Penzo Barclay Tittmann Elizabeth S. Kenyon Maureen Gemma David A. Michaud John M. Trotsky Christine M. Johnston David C. Olivieri Laurie G. Hylton Jie Lu William M. Steul Stanley B. Weiland Kathleen Fryer Kathleen M. Costello Jonathan G. Isaac Thomas H. Luster Thomas P. Luka James A. Naughton John P. Pumphrey Dana C. Robinson Thomas J. Weyl James J. Godfrey Stefan L. Thielen Dorothy J. Bouchard Cynthia M. Beckhusen Mary K. Kreider Denis J. Hill Marie T. Preston Olympia K. Wheeler William R. Cross Lewis R. Piantedosi Christopher Gaylord Walter A. Row David McDonald Elizabeth Prall John W. Vaughan Alan R. Dynner John Macejka Joseph K. NelsonMarie Y. Charles Brian Dunkley Derek Devine Leanne A. Parziale Mark D. Burkhard Peter F. Crowley Andrew O. Ogren Craig P. Russ Jerome A. Vainisi James C. QueenMelissa E. Haskell Thomas P. Huggins Michelle A. Green Roseann Sulano Bree E. Barletto Yana S. Barton Michael Botthof Vincent M. Cottone Lisa B. Hill Deborah TrachtenbergMartha Locke John P. Redding Paul M. O’Neil Kristin S. Anagnost Duke E. Laflamme Tiffany T. Cayarga Sotiria Kourtelidis Joanne M. Mey William J. Delahunty Linda B. Carter John D. Crowley Michael R. McGurn Heather L. Griffin Roberto Crugnale Michael A. Kinahan Daniel J. Ethier Karyn P. Parker Maria C. Cappellano Steven J. O’Brien Noah J. Coons Daniel M. Puopolo Adam Weigold Shannon M. Price Craig R. Brandon Kerry A. Smith Kirsten Ulich Sandra L. Letourneau Arthur S. JonesScott W. Firth Catherine Gerardi Catherine M. Gagnon David J. Zimmerman Eric F. Caplinger Linda A. Grasso Andrew N. Sveen Simone N. Santiago Scott W. Nelson Judith A. Saryan Henry M. Kozowyk Carolee B. MacLellan Mary Arutyunyan Margaret E. Pier Jeanene E. Foster Amanda R. Madison John B. Tracey Kiersten ChristensenNeal B. Pearlman Gregory P. Walsh Jeremiah P. Casey Todd P. Larson Bruce R. Lewis James Sarantopoulos Clyde F. Wertz Donald D. McCaughey Effie Kalantzis Erica L. BurkeLilly P. Scher Michael R. Mach Gregory A. Piaseckyj Arieh Coll Jeffrey R. Hesselbein Tina U. Holmes Ira G. Baron Andrew K. Cavanagh John F. Dolan Timothy P. McEwenWilliam R. Squadroni Adam K. Ferrante Robert R. Curtis Lisa C. Flynn Ben Moreno Philip Pace Russell E. Curtis Linda K. Nishi Lauren B. Kiernan Jane Queenan Aaron A. Berman Michael A. Allison John D. Gill Peter D. Hartman Greg S. Whitehead Edward A. Ciancarelli Elizabeth A. McNamara John W. Hartley Michael J. Meli Deborah A. Chlebek Samuel C. Scholz Gregory S. Newman Stephen C. Concannon Sara P. Anderson Craig Castriano Christine E. O’Neill Christine M. Bogossian Aamer KhanAndrew W. McClelland Ryan P. Cannon Michael D. Nappi Tracy J. Alter Catherine C. McDermott Phyllis E. Mastin Lawrence M. Sinsimer Stephen N. Soltys Michael P. Sullivan Randall J. Skarda Elaine Pereira Vincenzo Falbo Steven G. Leveille Kimberly J. Pacheco Julie A. Watson Ami S. Dion Kevin A. Sullivan Patrick J. CosgroveDouglas R. Rogers Andrew M. Gullotti James K. McCuddy Michael P. Devlin Lidia Sheykina Michael J. Costello Katharine S. Walker David B. Deans Randall A. Clark Steven J. Widder Jonathan M. Zadrozny Bradford M. Otis Michelle A. Baran Carl D. Carlson Kenneth T. Evans Michael D. McLean Mylene M. Cassel Paul J. Rose Donald M. Murphy Judith H. Snow May James R. Durocher Callie J. Gauzer Thomas J. Hughes James R. Putman Kristen R. Tragethon Coleen M. Lynch Kevin M. BilenchiElizabeth P. Johnson Kristen R. Abruzzese John J. Santoro William J. McKenney Christopher P. Berry Linda A. Bailey Timothy D. Breer Robert B. Ellerbeck Donna M. SmithMichael J. Tordone Qiang Cui David M. Lochiatto Michele A. Mulligan Deborah W. Porter Ann Marie Mruczek Daniel Yifru Jason A. McGrath Karen A. Boland James M. Gavin Laura B. Lang Christopher J. Mason Brian J. Herbert Joseph L. Furey Bradford W. Godfrey Lea M. Moscariello Amy J. Schwartz Harold T. Whalen John S. Khodarahmi Lawrence L. Fahey Katherine D. Spooner Stephen H. Whalen John C. Greenway Deidre E. Walsh Gregor D. Yuska Lynn A. Cadigan Jorge E. GutierrezThomas A. Wimer Charles J. Kace Michael A. Cirami Michael B. Maguire Whiting R. Willauer Christian E. Howe Heath A. Christensen Ralph H. Hinckley Allyson E. BuncePeter M. Campo Russell L. Kubie Christopher H. Hayes Lori A. Miller Crystal Sheets Sheila M. Keane Paul H. Nicely Peter D. Voulgaris Charles B. Gaffney Ian P. McGinn G. West Saltonstall Christopher R. McCool Meghann L. Clark Cheng G. Shi Lee LoPorto Jamie L. Lawrence Frank J. Sweeney Maureen F. Canney Todd M. Dickinson Joseph P. Rofino J. Timothy Ford Daniel J. Curtin Frederick S. Marius Amanda A. Jordan Manuel A. Resendes John A. Brodbine Ronald A. Randall Daniel L. Flynn Sheila T. Irizarry Mark Milan Joseph C. Yasinski Laurie C. Phillips Allard Mason B. Gillespie Michael J. Keffer Joshua D. Lipchin Benjamin M. Pomeroy Elizabeth L. StedmanAlyssa E. Thompson William E. Pannella Kristin A. Pagliuca John H. Croft Eileen Tam Edward P. Bliss Tasha M. Corthouts Leonard F. Dolan Nancy J. Jacobson Susan R. Martland Ina J. Mazer Deborah W. Moses Emily J. Murphy Samuel D. Perry Mary-Ann Spadafora Jonathan B. Treat Jonathan R. Urbon Kevin M. Darrow Jean D. Desanges George R. Nelson Marc R. Moran Rukma Raybardhan Lauren K. Loehning Keriann Kaestner David M. Richman Kathleen A. Meany Steven M. GemmaErin E. Auffrey John T. Murphy Jamie M. Babineau David P. Becker Nicole E. Thibeault Sharon M. Gordon Charlyne M. Ciccone Jason D. Fisher David A. Saraceno Daniel P. McElaney Bradford P. Murphy Gigi K. Szekely Brian J. Kiernan Mark Slavin Christopher J. Teixeira Joseph R. Hernandez Charles P. Manning William E. Holt Stacey L. Starner Emily Griffin Milagros L. Catanzaro Kwang C. Kim Gary R. LeFave Stephen L. Newton Nagaveni Puttaraju Christine S. Power Stephen A. Stowe Barbara Andre Jeffrey J. Sine Richard A. Michaels Erick Lopez Frank J. Spitaleri Matthew McNamara J. Scott Craig Richard G. Milano Christopher L. Sechler Scott H. CoughlanBrendan M. MacKenzie Jamie L. Regan Theodore D. Stern Stewart D. Taylor Sean W. Broussard Thomas R. Tajmajer David A. Lefcourt Aamir Moin Robert D. Carson Anatoliy A. Eybelman Kathryn A. McElroy Michael P. Curran Jonathan M. Kotler Richard P. Wyke Rebecca L. Burke Kevin M. Connerty Janet G. Daubenspeck Michael G. Ducharme John M. Mahoney Claire A. Muollo Michael P. O’Brien Lisa M. Jones Bridget Fangueiro Kelley G. Baccei Ho Yu Lau Jordana B. Mirel Raymond G. Sleight Adam V. Pacelli Michael J. Parker Michael E. Quinn Stacey L. Smith Jeffrey A. Rawlins Dan R. Strelow Mark P. McLennan Peter J. Popovics John R. Baur Alicia N. Botticelli Richard A. Kelly Patrick R. Carney Timothy W. Fetter Christopher W. Marek Michael P. Reidy Sebastian Vargas Jakub M. Cabaj Sara M. Dombrosky Jay A. Schlott Sarah E. Morton Stephanie M. Douglas Robert O. Lopez Jennifer L. Morales James R. Crowley Monica C. Connarton Patrick B. Gill Marsh C. Enquist Thomas Guiendon Carl J. Iannacci Ashley C. Ryan Kate E. Santangelo Diana E. Varco Alexander U. Rockwell Matthew T. Buckley Justin M. Huber James M. Salois Eric S. Robertson Ryan B. Landers William A. Irvine Paul F. Norton Walter T. Fullerton Carla F. Lopez-Codio Laura T. Donovan Ivan A. Huerta Dan A. MaaloulyBrittany E. Mitchell Maryanne B. Spacciapoli George Torruella Hogan Coreen S. Kraysler Gerald S. Martinez Lauren E. Lashute Louis M. Membrino Rebecca J. Bazyk Lori A. Bradley Kara E. Merkel Andrew L. Merrill Linda Yung Adan C. Gutierrez Stephen B. Byrnes Tracey A. Carter Dexter A. Dodge Thomas A. Kelliher Bernadette MahoneyDavid C. McCabe Michael J. Striglio Michael P. Keogh Calixto Perez Jason R. Cyr Michaella Callaghan Michael W. Collins Patricia A. Greene Panayiotis N. KalogeropoulosMichael J. Batts Michelle L. DiChiara Elizabeth A. Aldrich Anthony M. Dintino Nancy B. Tooke Patricia W. Bishop Charles P. Biron Susan M. Brengle Francine A. Craig Gayle C. Hodus Maureen Magner Kevin D. Taylor Henry S. Hong Anthony F. Jacobs Stephen A. Renaud Peter F. Welch Edward D. Devereaux Michelle Berardinelli Stanley G. Deutsch Bernard Scozzafava Brian R. Boyden Victoria L. Crane Isabel B. Depina Christine Landry Krystal D. Bertoni Michael A. Ciccone Andrew C. Frenette Brian A. Taranto Rick J. Polsinello Eriks F. Rancans Katherine E. Kennedy Katherine E. Fornal Allison E. Forrest Brian S. Pomerleau Michael B. Shea Alan R. Simeon Michael A. Ashton Katy D. Burke Christopher B. Doyle Emily L. Smith Paula A. DeAngelico Melissa E. Gross Eleanor M. McDonough Meghan E. Moses Edward A. SullivanJennifer Tawiah Evelyn L. Haygood John A. Casamassima Katherine F. Bonanno John L. Shea Jolie P. Twiss Brian F. Shuell Kenneth Clark Swartzel Spencer M. Dalton Jeremy M. Bomba Talia A. Correira Matthew C. Dework Derek J. DiGregorio Andrea L. DiPirro Brian C. Hassler Patrick K. Kent Elizabeth A. Terranova Megan E. ThompsonMichael J. Turgel Matthew F. Beaudry Nhung K. Le Sarah K. Rego Michael R. Ferrante Michael P. Roppolo Vatsady Sivongxay Annemarie Ng Sean J. Caplice Richard V. HoweBrian F. O’Neill Melissa A. Anderson Brian R. Mazzocchi Melissa A. Rongone Eric B. Dorman Kevin M. Gill Danielle K. O’Brien Katharine M. Kasper Brian M. Coole Bradley R. Schultz Carlos E. Mahecha Justin H. Bourgette Tullan W. Cunningham Oh-Mee E. Howard Tod P. Salisbury Erin F. Casey Holly-Anne Quinn Jennifer L. TarantinoDaniel J. McCarthy Jeanne K. Frawley Darrell Fixler Jonathan Broome Steven J. Pietricola Livia G. Lisker-Blount Jami E. Sickoll Jay C. Jentz David S. Andrews Pamela L. Gentile Irene L. Deane Scott R. Forst Stephen J. O’Loughlin James J. Lanza Michael A. Mazzei Tyler J. Neenan Matthew J. Saindon Christopher A. Webber Kathleen D. Yantosca Daniel J. McCarthy Stuart W. Muter Andrew M. Nepomuceno Sarah A. Bombardier Daniel E. TenPas Natalia Degtjarjova Tristan W. Benoit Richard W. Cooney David L. Griesbauer Sylvia Villamizar William B. Alicandro Jeanette L. Harrison-Sullivan Kerry L. Klaas Ryan C. Wilson Christopher J. Yourell Adam KorabChristopher M. Sansone Jeanmarie V. Lee David M. Gordon Nelson J. Cohn Ryan F. DeBoe Dominic A. DeSantis George E. Hopkins Brandon M. Jordan Chad M. SimmonsCourtney M. Roth Christopher H. Stoner Janice Korpusik William H. Gerber Collette A. Keenan Raphael A. Leeman Danat Abdrakhmanov Randolph J. Verzillo Katie A. RoAndrew P. Szczurowski Matthew J. Dellelo Virginia Gockelman Jessica Savageau Michael R. Sullivan Mikel Plluska Colleen M. Duffey Torrey A. Shillieto Marconi D. BomfimRobert J. Whelan Helen T. Hedberg Conrad G. Morin David A. Ryder Kenneth J. Lyons Morgynn J. Haggett John M. Ring Jennifer L. Johnson Kevin P. Longacre John A. Jannino Maureen M. Renzi Paul J. Costa Matthew J. Witkos Julie A. McGee Sharon S. Sendaydiego Gail S. Dowd Bastian Wagner Stephanie Rosander Kathleen M. Walsh Nina B. Bove Eileen Storz-Salino Bradley S. Wagoner Charles Cheng Taylor J. Evans H. T. Harlow Danene K. Kibbe Amanda M. Marino James F. KirchnerJoseph C. Gannon Tatiana I. Koltsova Shane Torchiana Ross A. Anderson Amanda J. Buchholz Nicholas S. Fincher Steven A. Mazzuchelli Andrew J. Mohr Kelli D. MorsePatrick W. Scanlon Mary Gillespie Kelley M. Hand Stephen McDermott Darren E. Walters Robert J. Bastien Nitzan Gordon Jake T. Lemle Andrea E. Lynch Anthony MorraRobert E. Greene Donna N. Drewes Alexis B. Vanderhye Gregory P. Fuccillo Adam J. Krenn Christopher S. Mitchell Natasha Paredes Lianne M. Busa Steven L. Dansreau Julie A. DeBaggis Michael Ferreira Tara C. O’Brien Ralph M. Studley Susan E. Black William H. Wolfe Joseph E. Lynch Nicholas S. Bellistri Jaime P. Smoller Michael A. BarryGonzalo A. Cabello William A. Flemer Clinton D. Lynch Jillian Courtemanche Judith A. Cranna Michelle Rousseau Willard H. Watson Anne E. Sternlicht Mary C. ProlerJoanne M. Haddow Christina Salomon John Pelletier Sarah D. Ayott Stephanie A. DesRuisseau Lee-Elizabeth C. Johnston Wilhelmina R. Roda Alison L. Romano Atlanta Capital Management Company LLC Dallas L. Lundy Daniel W. Boone Walter F. Reames Deborah H. Bishop Marilyn R. Irvin Mary K. McTague Gregory L. Coleman Jerry D. DeVore Lara S. Ratcliff Margaret W. Taylor James A. Womack William R. Hackney Bethany R. Glover R K. Williams Gillian A. Moore Thomas J. Ullman L S. Marger Janette E. Andrews Charles B. Reed Joseph M. Roman Amanda A. Kokan Robert R. Walton William O. Bell Paul J. Marshall Meghan A. McGinty Michelle Breig Tanya A. Blocker Glenn H. Shaw James S. Skesavage Deborah L. Henry Joseph P. Ward William M. Hereford Dorothy T. Kopp Darin S. Clauson Earl A. Brown Richard B. England Brian K. Smith Juliene E. Blevins Susan E. Griffin Mary M. Biddix Robert D. Allen Jennifer N. Kennedy Rhonda M. Forde Tyler Partridge Phuong M. Cam Valery Jean-Phillippe Jason M. Recio Nichole Shepherd Daniel C. Sullivan Rose-Lucie Croisiere Lance V. Garrison James N. Stafford Kyle W. Johns Brian P. Mansfield Fox Asset Management LLC Rebecca W. Olson Sandra M. Seibert Cherie L. Weisse Stuart E. Briskey Donald A. Grella John W. Feaster Kimberly A. HingNorah C. Castillo Sherri A. Peterpaul Gregory R. Greene Colette M. Jacobsen Douglas P. Edler Constance Barrella Sheri A. Datre Michael Dellipaoli Michael K. West Jill M. Halligan J. Bradley Ohlmuller Murtuza A. Khan Marian A. McGlincy William E. Dodge Lorna M. Morrison Christos Skiadopoulos Joseph Vurchio Emil Kurtisi Robert J. Milmore Michelle B. Chumash William Howarth Jennifer A. Barbieri Jessica DeVergilio Bradley S. Daniels Valerie Crono Daenna M. Rabaglia Jessica B. Groom Andrew D. Massey Matthew Villa Parametric Portfolio Associates LLC Karla M. Shannon Brian D. Langstraat Andrew D. Abramsky David M. Stein Kurt L. Galley Tyson E. Alexander Jeffrey N. DuVall Richard D. Wilson Lee R. Thacker Steven J. Kauffman Thomas C. Seto Far Salimian Robert J. BreshockAaron H. Cartozian Shalamar C. Kanemoto Jared S. Gray Jeffrey L. Brown Xiaozhen Li Bruce D. McIntosh Vincent N. Petisme Jackie A. Viars Aaron W. Singleton Matthew Amundson Luke Britton Laura A. Edain Nicolas Schuitemaker John Simchuk Vassilii Nemtchinov Eugene Lee Ian D. Schuelke James F. Reber Megan Keaty Noriko Ogawa Charles Brophy Jodi M. Wong Melinda Olson Trevor Williams Gordon Wotherspoon Todd Wathey Joseph E. Daniels Geoff Longmeier Brooke Beresh Matthew J. Dufort Julie Challman Kimberly R. Williams Paul E. McCallick Joel C. Marcus Scott Timmerman Marc R. Hermer Ross K. Chapin Caroline D. Romerosa FrattoJennifer Mihara Rainer Germann Dan Clayton Hemambara D. Vadlamudi Elena Balekha Jean M. Carlos Paul W. Bouchey Ryan S. Newby Michelle S. Wu Adam Bodnarchuk Bronagh Creegan Travis Bohon Aubin Quesnell Steven Kleyn Robin M. Burge Yullya Makhanov Stephen J. Riley Karen Morrison Michael Nagamatsu David L. Perry Christian Johnson Christopher Hackman Ho-Chuin R. Yen Terry Stewart Bradley S. Berggren Lawrence M. Berman Kenneth L. Everding Jonathan Orseck Patrick J. Escarcega Haley Carey Mallory Brick Elaine D. Peretti Kenny S. Tsang Olivia Fredrikson Megan Gordon Roger Weber Alissa Coward Matthew Gerken Sean Stokke Brett Anderson Catherine Weisnewski Brandon W. Chapman Jason T. Gifford ETOCM-AR-07
EEAATTOONN VVAANNCCEE CCOORRPP..2007 ANNUAL REPORT
175734.BCFC 1/11/08 9:19 PM Page 1