Eastern Wind Integration and Transmission Study Presentation to FERC Dave Corbus
31
Eastern Wind Integration and Transmission Study Presentation to FERC Dave Corbus National Renewable
description
Eastern Wind Integration and Transmission Study Presentation to FERC Dave Corbus National Renewable Energy Lab. What is Needed to Integrate 20% Wind in the Eastern Interconnect?. - PowerPoint PPT Presentation
Transcript of Eastern Wind Integration and Transmission Study Presentation to FERC Dave Corbus
Eastern Wind Integration and
Transmission Study
Presentation toFERC
Dave CorbusNational Renewable
Energy Lab
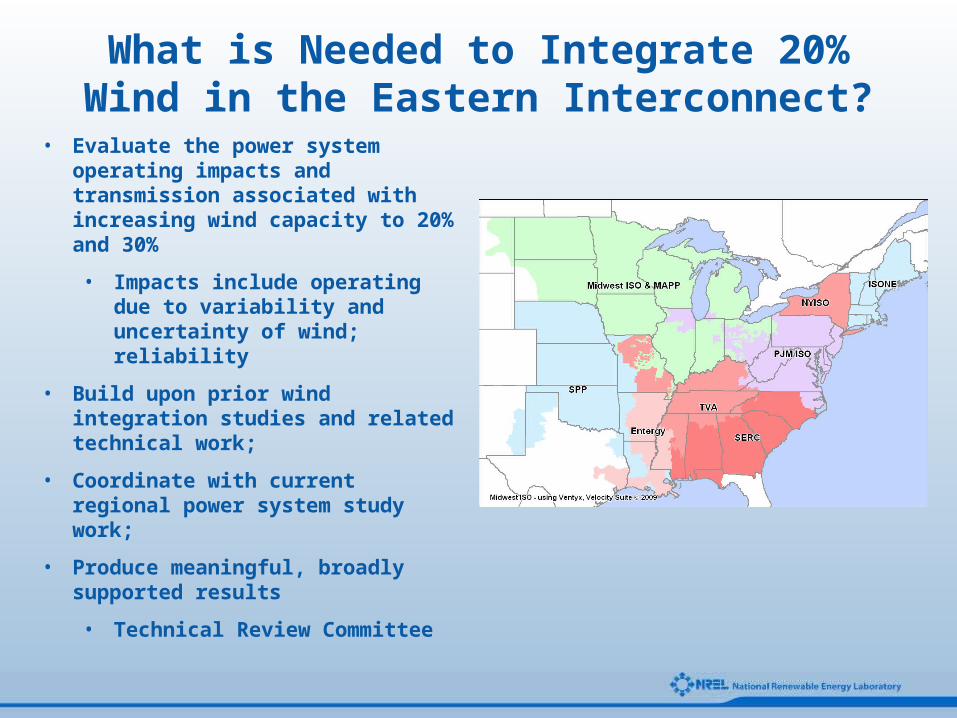
What is Needed to Integrate 20% Wind in the Eastern Interconnect?
• Evaluate the power system operating impacts and transmission associated with increasing wind capacity to 20% and 30%
• Impacts include operating due to variability and uncertainty of wind; reliability
• Build upon prior wind integration studies and related technical work;
• Coordinate with current regional power system study work;
• Produce meaningful, broadly supported results
• Technical Review Committee
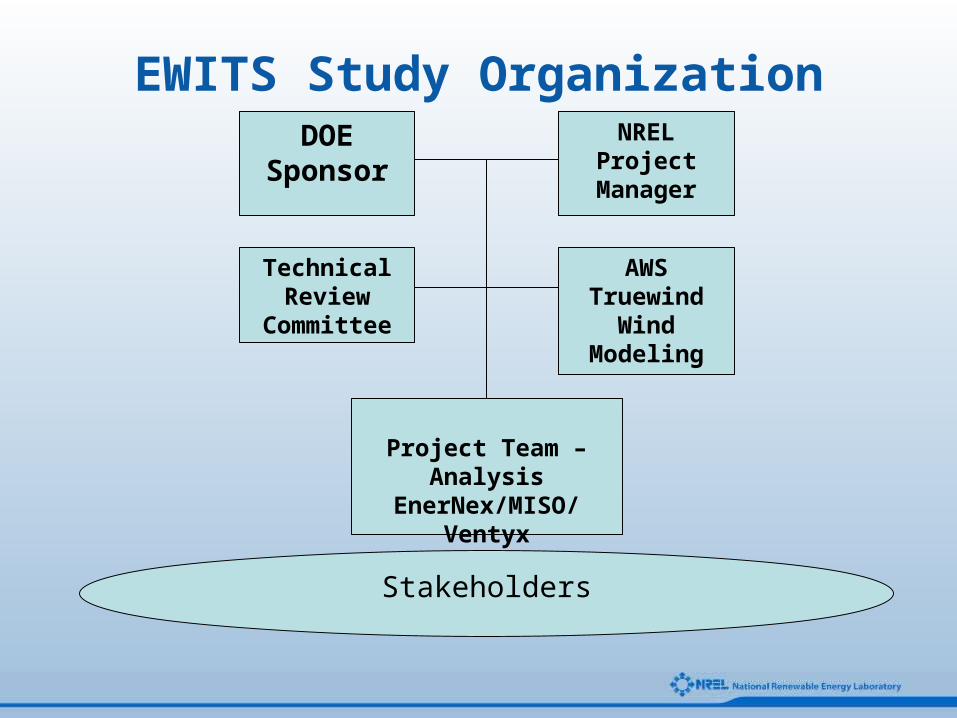
EWITS Study OrganizationDOE
SponsorNRELProject
Manager
Technical Review
Committee
Stakeholders
AWS Truewind
Wind Modeling
Project Team – AnalysisEnerNex/MISO/Ventyx
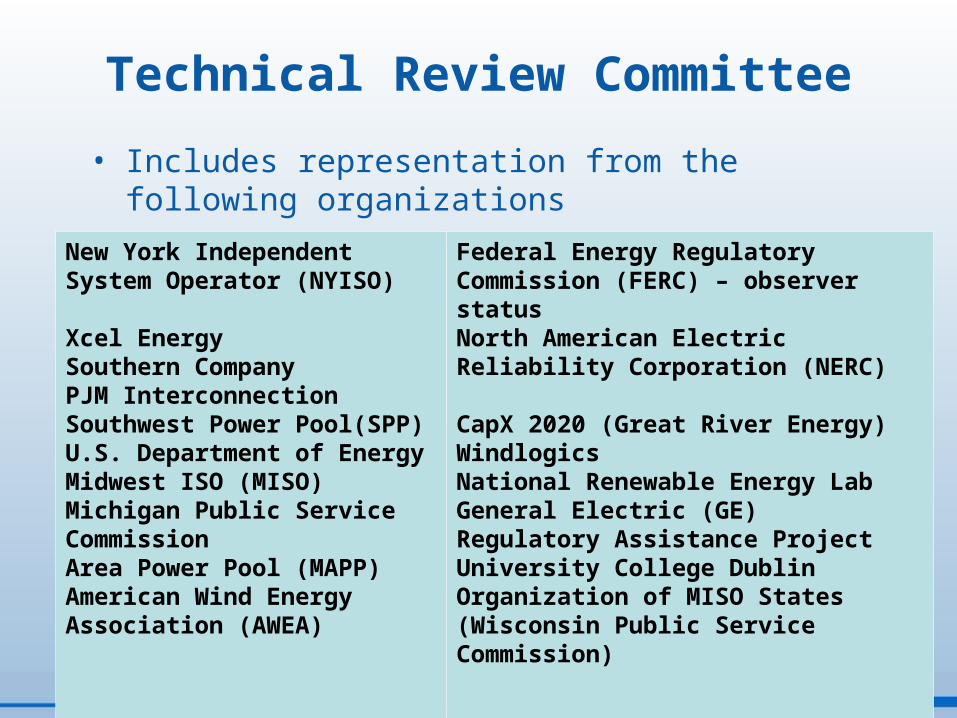
Technical Review Committee• Includes representation from the following
organizationsNew York Independent System Operator (NYISO)Xcel EnergySouthern CompanyPJM InterconnectionSouthwest Power Pool(SPP)U.S. Department of Energy Midwest ISO (MISO)Michigan Public Service CommissionArea Power Pool (MAPP)American Wind Energy Association (AWEA)
Federal Energy Regulatory Commission (FERC) – observer statusNorth American Electric Reliability Corporation (NERC)CapX 2020 (Great River Energy)WindlogicsNational Renewable Energy LabGeneral Electric (GE)Regulatory Assistance ProjectUniversity College DublinOrganization of MISO States (Wisconsin Public Service Commission)
The Technical Work Conducted in EWITS Yielded Detailed Quantitative Information on
• Wind generation required to produce 20% of the projected electric energy demand over the U.S. portion of the Eastern Interconnection in 2024
• Transmission concepts for delivering energy economically for each scenario
• Economic sensitivity simulations of the hourly operation of the power system defined by a wind generation forecast scenario and the associated transmission overlay
• The contribution made by wind generation to resource adequacy and planning capacity margin
EWITS – Not an End All Catch All but a Link in the Chain
• The scenarios developed for this study do not in any way constitute a plan; instead, they should be seen as an initial perspective on a top-down, high-level view of four different 2024 futures.
• The study assumptions were developed in close coordination with the TRC– Changes in the assumptions, such as the cost of various
fuels, the impact of regulation and policy would have a major influence
• A complete evaluation of any of the scenarios would require additional technical analysis including– An AC analysis which examines in more detail the power
transfer limitations assumed in the production modeling and includes power flows that look at voltage and reactive compensation issues, dynamic and transient stability, and HVDC terminal control.
Key Tasks- Eastern Wind Integration & Transmission Study
• Mesoscale modeling and Siting– Develop high quality wind resource data sets for
the wind integration study area– Develop wind power plant outputs– Identify wind sites and develop siting scenarios
• Transmission Study – Develop transmission concepts for different wind scenarios
• Integration Study– Evaluate Operating Impacts– Evaluate Reliability Impacts– Compare Scenario Costs
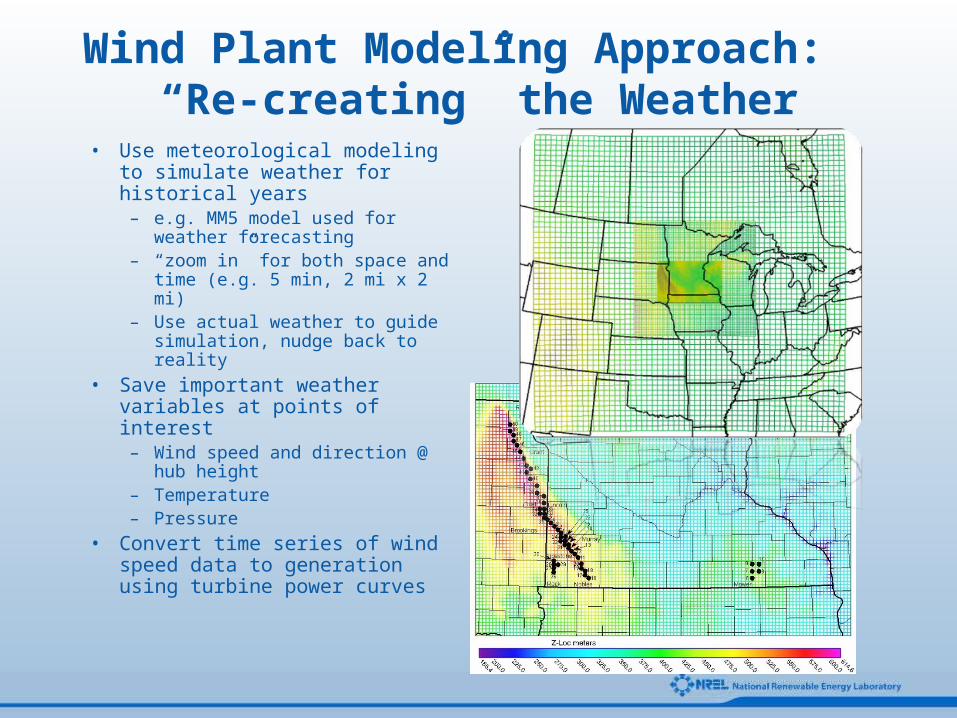
Wind Plant Modeling Approach: “Re-creating” the Weather
• Use meteorological modeling to simulate weather for historical years
– e.g. MM5 model used for weather forecasting
– “zoom in” for both space and time (e.g. 5 min, 2 mi x 2 mi)
– Use actual weather to guide simulation, nudge back to reality
• Save important weather variables at points of interest
– Wind speed and direction @ hub height
– Temperature– Pressure
• Convert time series of wind speed data to generation using turbine power curves
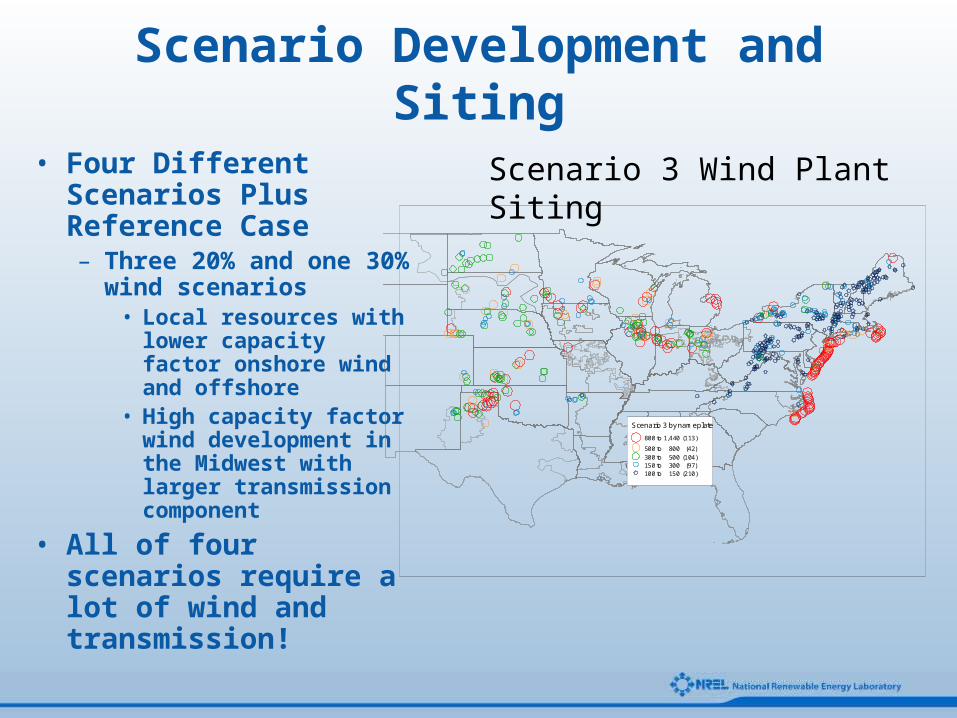
Scenario Development and Siting• Four Different
Scenarios Plus Reference Case– Three 20% and one 30%
wind scenarios• Local resources with
lower capacity factor onshore wind and offshore
• High capacity factor wind development in the Midwest with larger transmission component
• All of four scenarios require a lot of wind and transmission!
Scenario 3 by nameplate
800 to 1,440 (113)
500 to 800 (42)300 to 500 (104)150 to 300 (97)100 to 150 (210)
Scenario 3 Wind Plant Siting
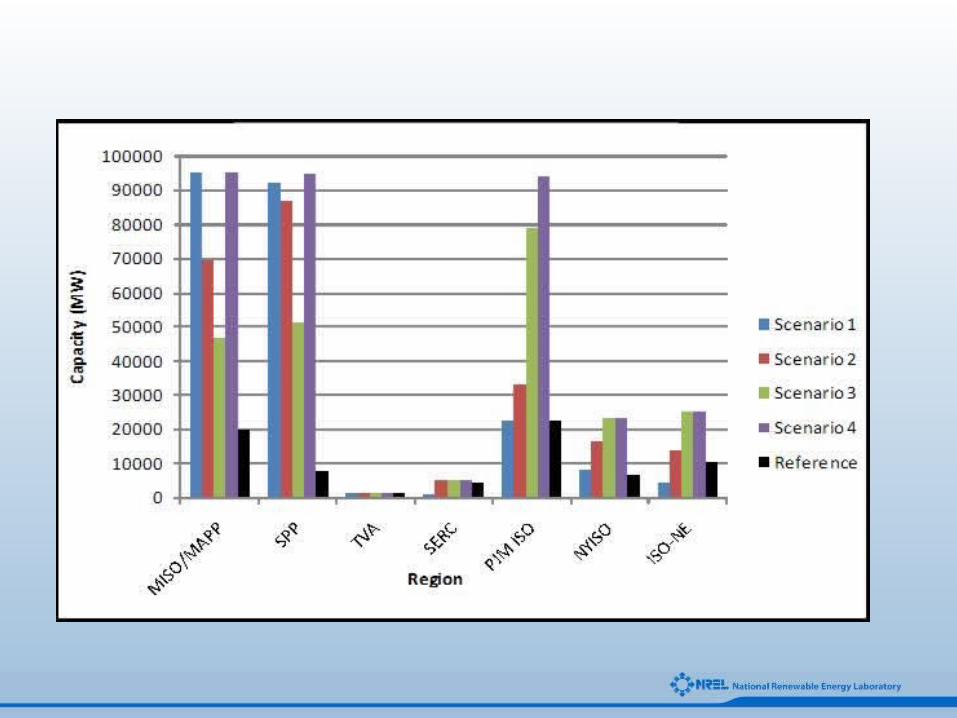
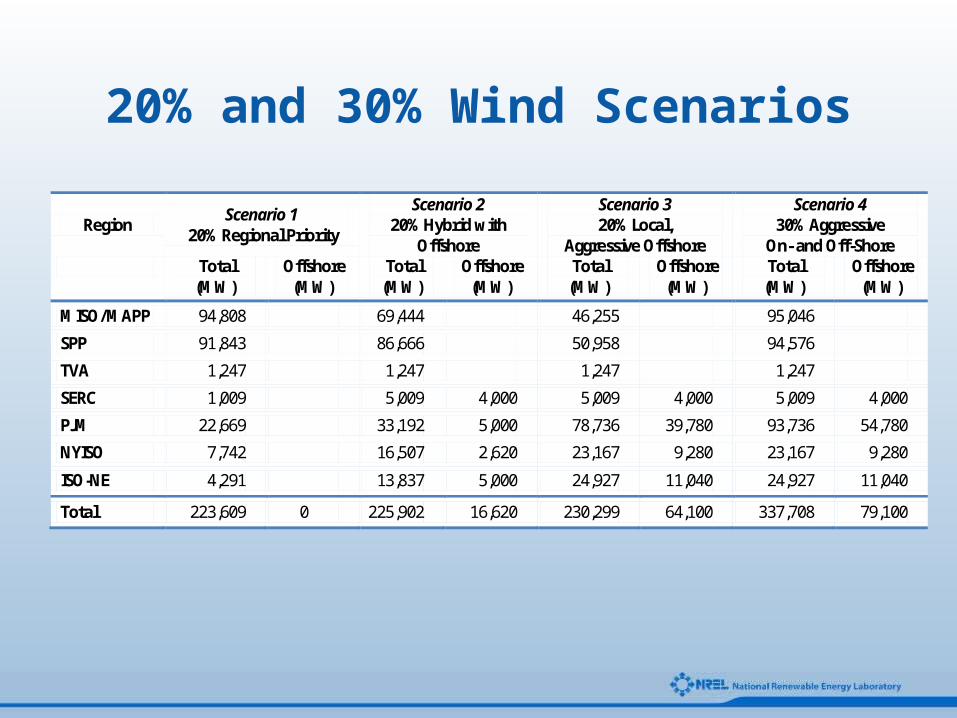
20% and 30% Wind Scenarios
Region Scenario 1 20% Regional Priority
Scenario 2 20% Hybrid with
Offshore
Scenario 3 20% Local,
Aggressive Offshore
Scenario 4 30% Aggressive
On- and Off-Shore Total
(MW) Offshore
(MW) Total (MW)
Offshore (MW)
Total (MW)
Offshore (MW)
Total (MW)
Offshore (MW)
MISO/MAPP 94,808 69,444 46,255 95,046
SPP 91,843 86,666 50,958 94,576
TVA 1,247 1,247 1,247 1,247
SERC 1,009 5,009 4,000 5,009 4,000 5,009 4,000
PJM 22,669 33,192 5,000 78,736 39,780 93,736 54,780
NYISO 7,742 16,507 2,620 23,167 9,280 23,167 9,280
ISO-NE 4,291 13,837 5,000 24,927 11,040 24,927 11,040
Total 223,609 0 225,902 16,620 230,299 64,100 337,708 79,100
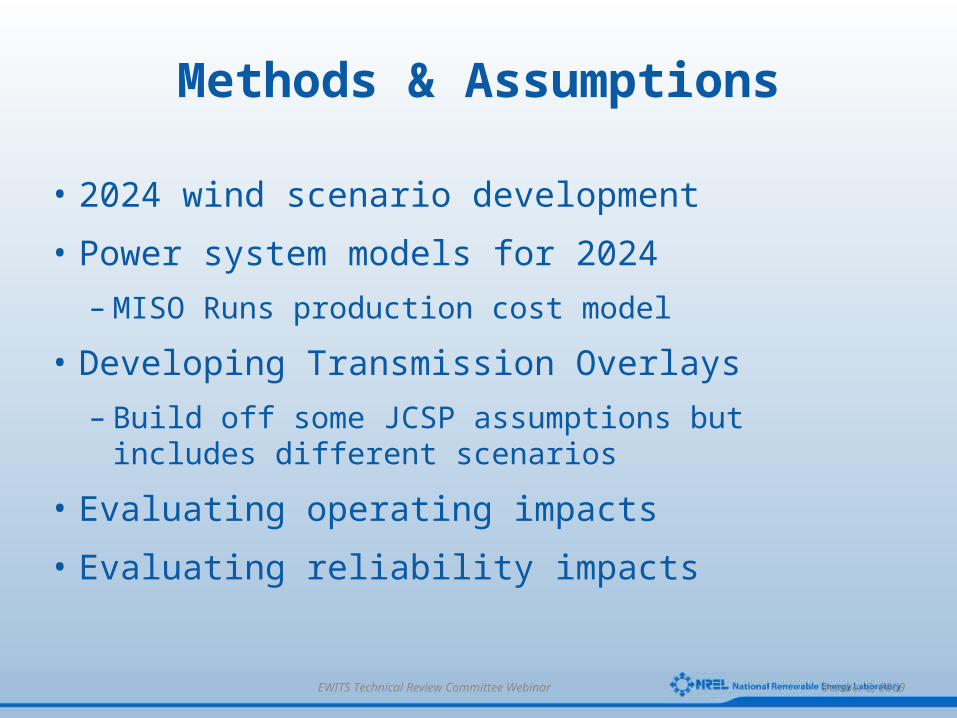
Methods & Assumptions
• 2024 wind scenario development
• Power system models for 2024– MISO Runs production cost model
• Developing Transmission Overlays– Build off some JCSP assumptions but includes
different scenarios
• Evaluating operating impacts
• Evaluating reliability impacts
October 2, 2009 EWITS Technical Review Committee Webinar
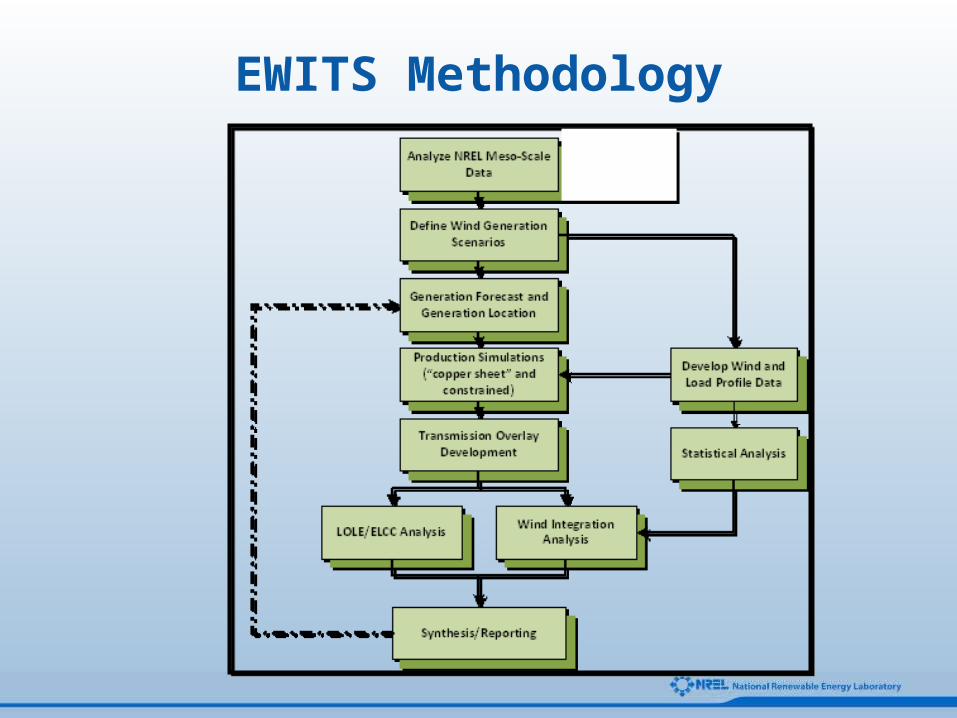
EWITS Methodology
Transmission Requirements• High levels of new transmission are needed across the 4
scenarios– Some transmission elements are common to all overlays
• Reference case, 20% and 30% wind scenarios all require a significant transmission build out, otherwise they are not feasible
• Transmission reduces variability and provides capacity benefits in its own right, and enhances the reliability contribution of wind generation by a measureable and significant amount.
• The EHV DC transmission that constitutes a major portion of the overlays has additional benefits
• The conceptual transmission overlays consist of multiple 800kV HVDC and EHV AC lines
October 2, 2009 EWITS Technical Review Committee Webinar
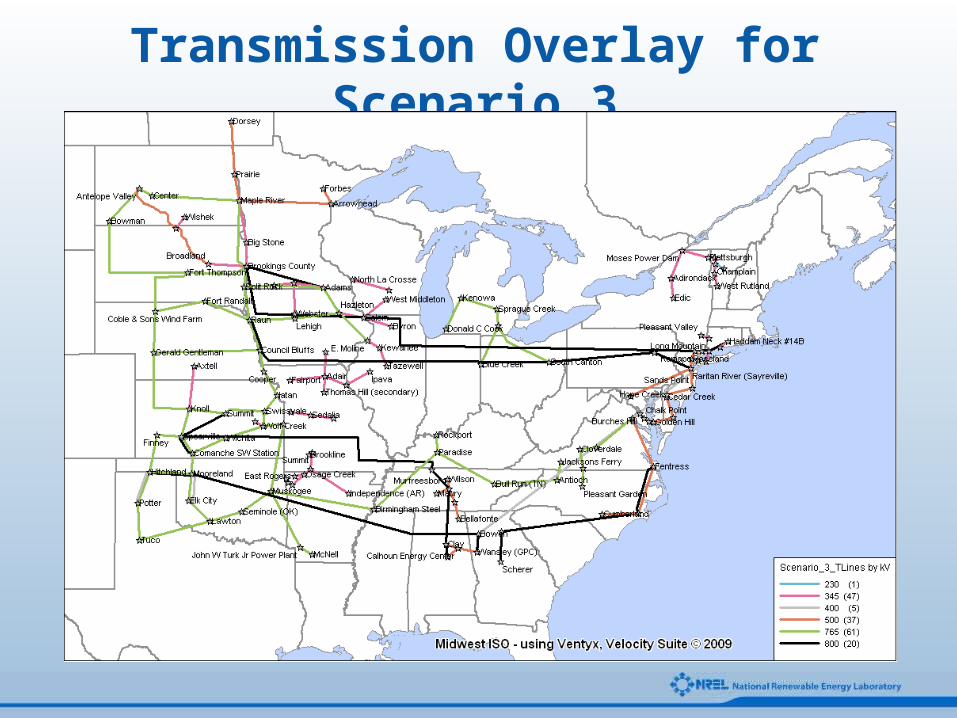
Transmission Overlay for Scenario 3
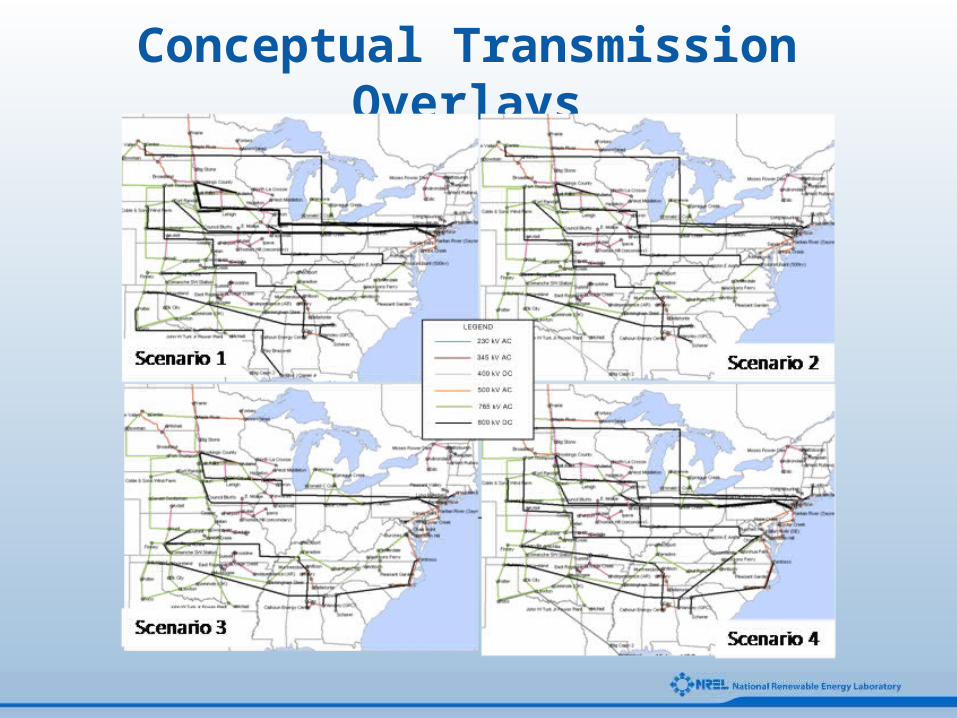
Conceptual Transmission Overlays
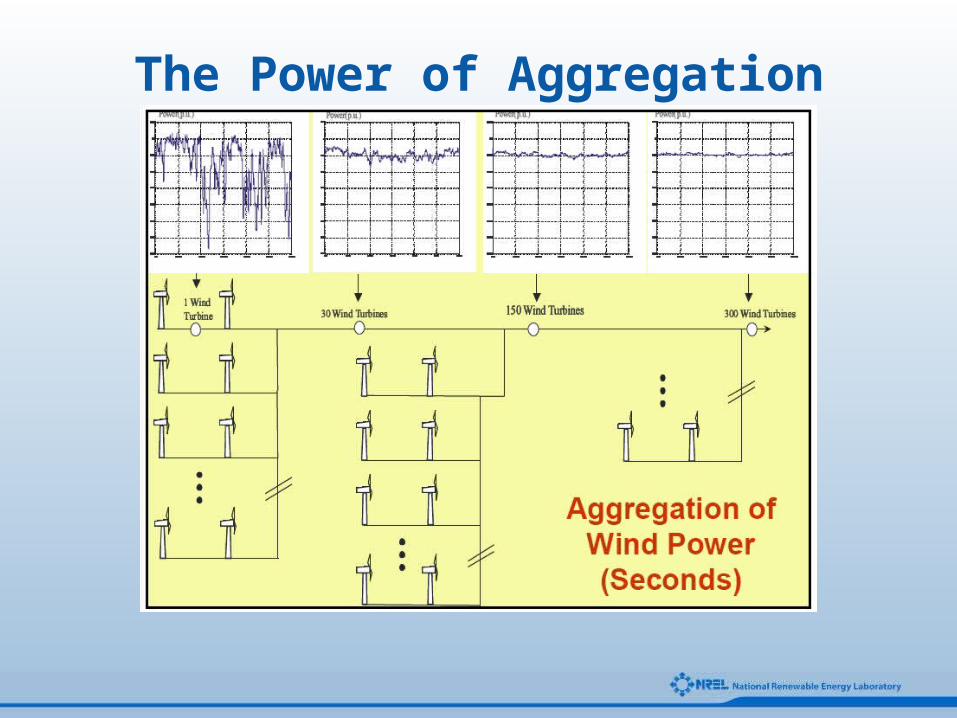
The Power of Aggregation
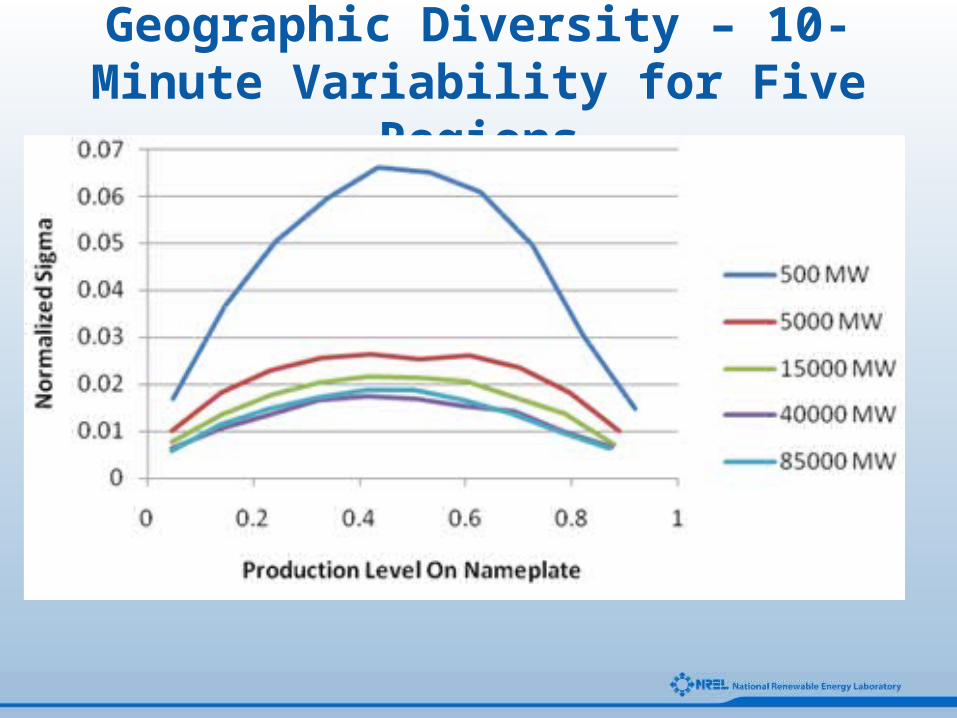
Geographic Diversity – 10-Minute Variability for Five Regions
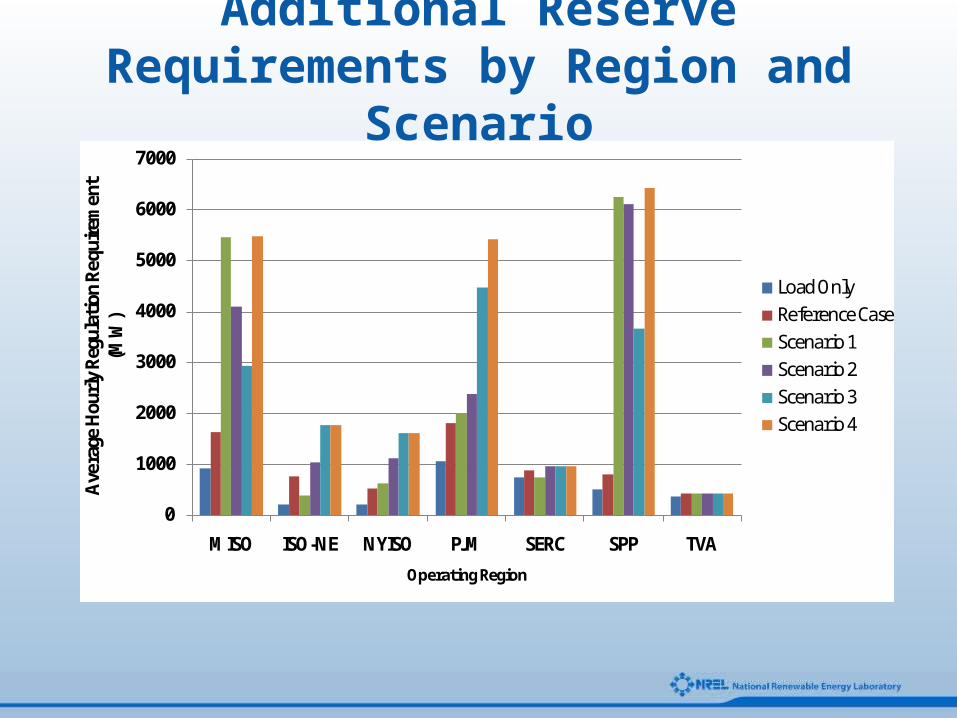
Additional Reserve Requirements by Region and Scenario
0
1000
2000
3000
4000
5000
6000
7000
MISO ISO-NE NYISO PJM SERC SPP TVA
Aver
age
Hour
ly R
egul
ation
Req
uire
men
t (M
W)
Operating Region
Load OnlyReference CaseScenario 1Scenario 2Scenario 3Scenario 4
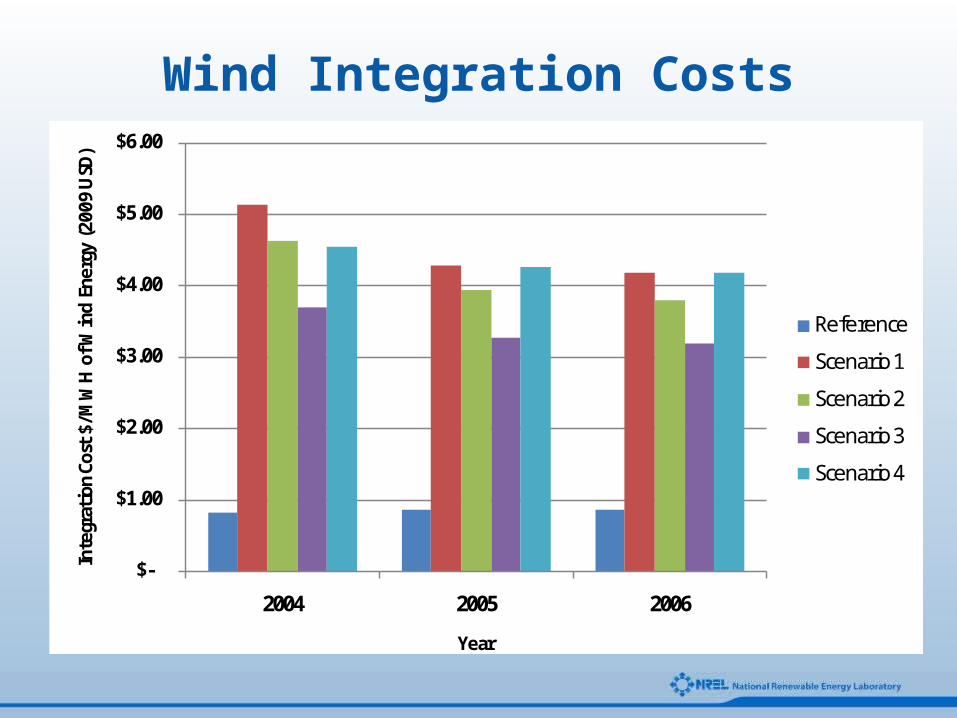
Wind Integration Costs
$-
$1.00
$2.00
$3.00
$4.00
$5.00
$6.00
2004 2005 2006
Inte
grati
on C
ost $
/MW
H of
Win
d En
ergy
(200
9 U
SD)
Year
Reference
Scenario 1
Scenario 2
Scenario 3
Scenario 4
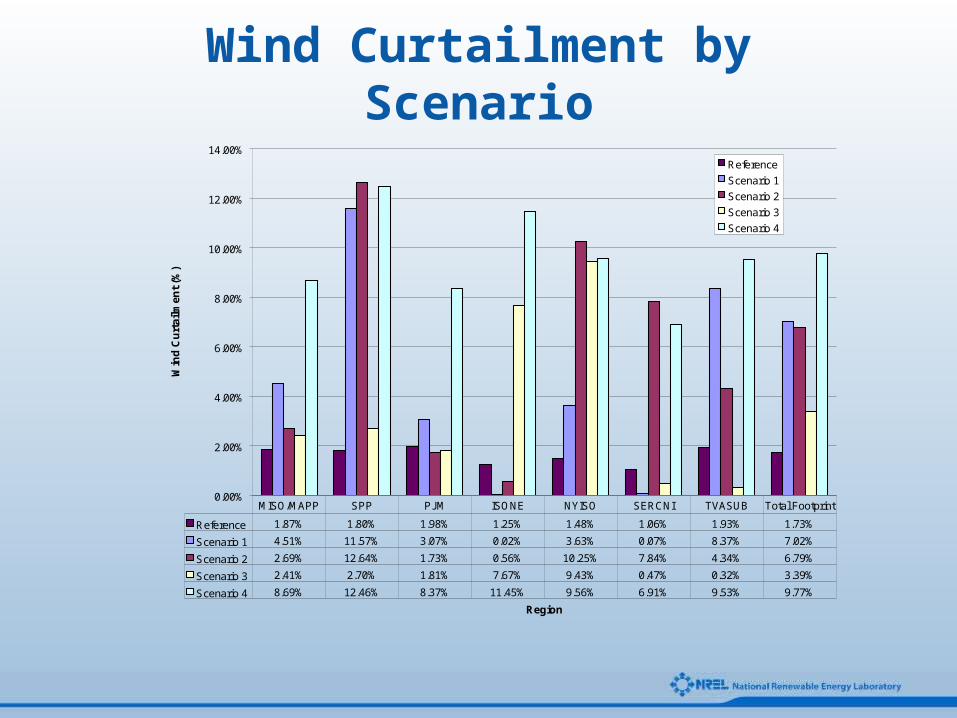
Wind Curtailment by Scenario
0.00%
2.00%
4.00%
6.00%
8.00%
10.00%
12.00%
14.00%
Region
Win
d C
urta
ilmen
t (%
)ReferenceScenario 1Scenario 2Scenario 3Scenario 4
Reference 1.87% 1.80% 1.98% 1.25% 1.48% 1.06% 1.93% 1.73%
Scenario 1 4.51% 11.57% 3.07% 0.02% 3.63% 0.07% 8.37% 7.02%
Scenario 2 2.69% 12.64% 1.73% 0.56% 10.25% 7.84% 4.34% 6.79%
Scenario 3 2.41% 2.70% 1.81% 7.67% 9.43% 0.47% 0.32% 3.39%
Scenario 4 8.69% 12.46% 8.37% 11.45% 9.56% 6.91% 9.53% 9.77%
MISO/MAPP SPP PJM ISONE NYISO SERCNI TVASUB Total Footprint
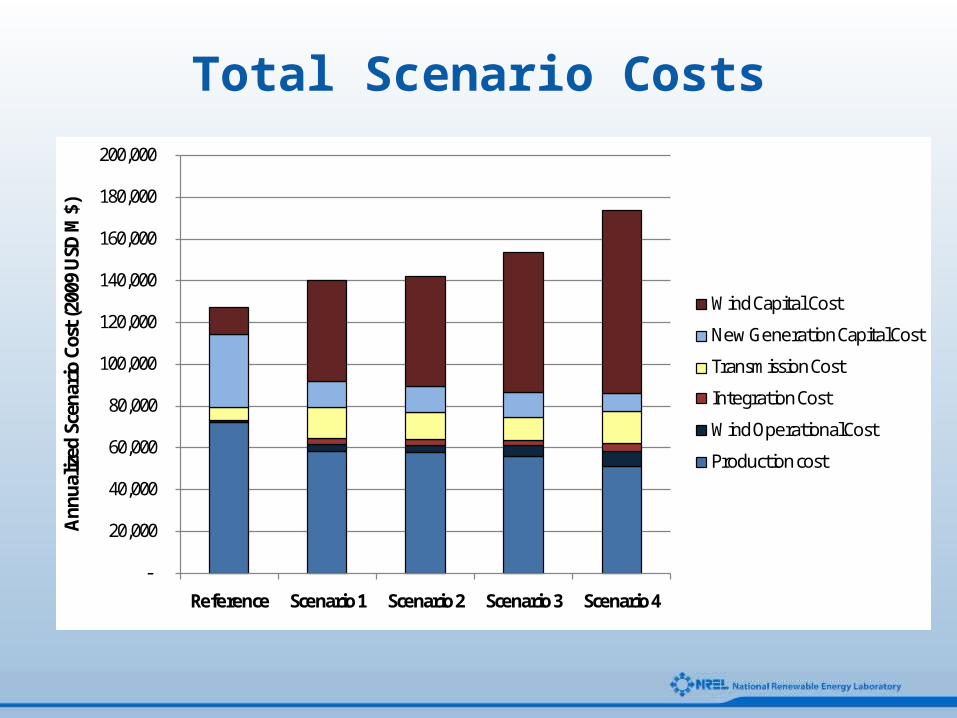
Total Scenario Costs
-
20,000
40,000
60,000
80,000
100,000
120,000
140,000
160,000
180,000
200,000
Reference Scenario 1 Scenario 2 Scenario 3 Scenario 4
Annu
alize
d Sc
enar
io C
ost (
2009
USD
M$)
Wind Capital Cost
New Generation Capital Cost
Transmission Cost
Integration Cost
Wind Operational Cost
Production cost
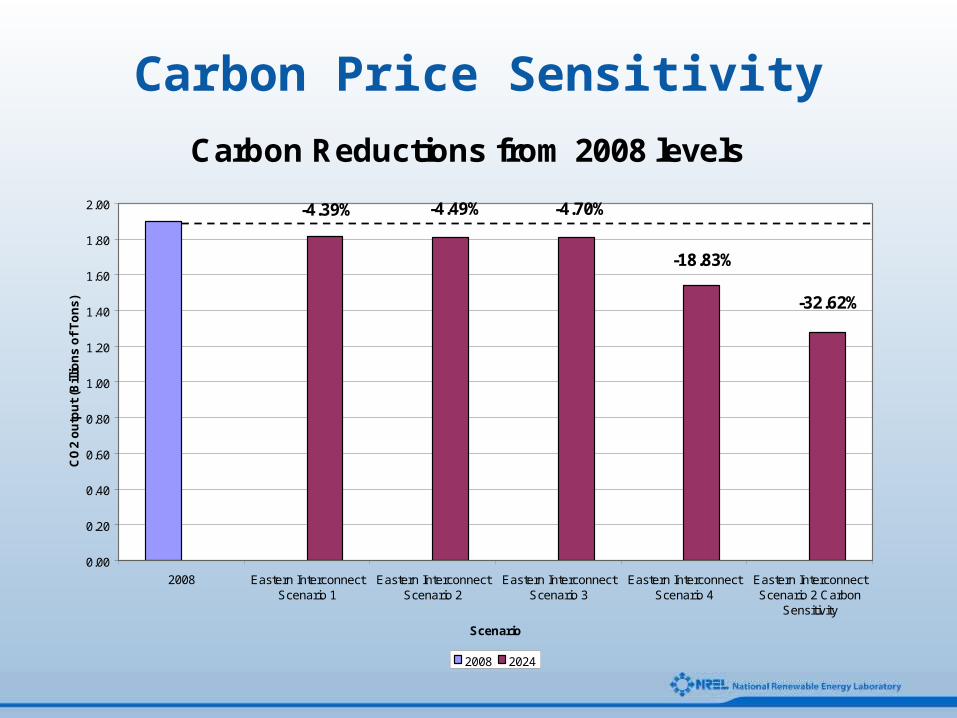
Carbon Price Sensitivity
Carbon Reductions from 2008 levels-4.39% -4.49% -4.70%
-18.83%
-32.62%
0.00
0.20
0.40
0.60
0.80
1.00
1.20
1.40
1.60
1.80
2.00
2008 Eastern InterconnectScenario 1
Eastern InterconnectScenario 2
Eastern InterconnectScenario 3
Eastern InterconnectScenario 4
Eastern InterconnectScenario 2 Carbon
Sensitivity
Scenario
CO
2 ou
tput
(Bill
ions
of T
ons)
2008 2024
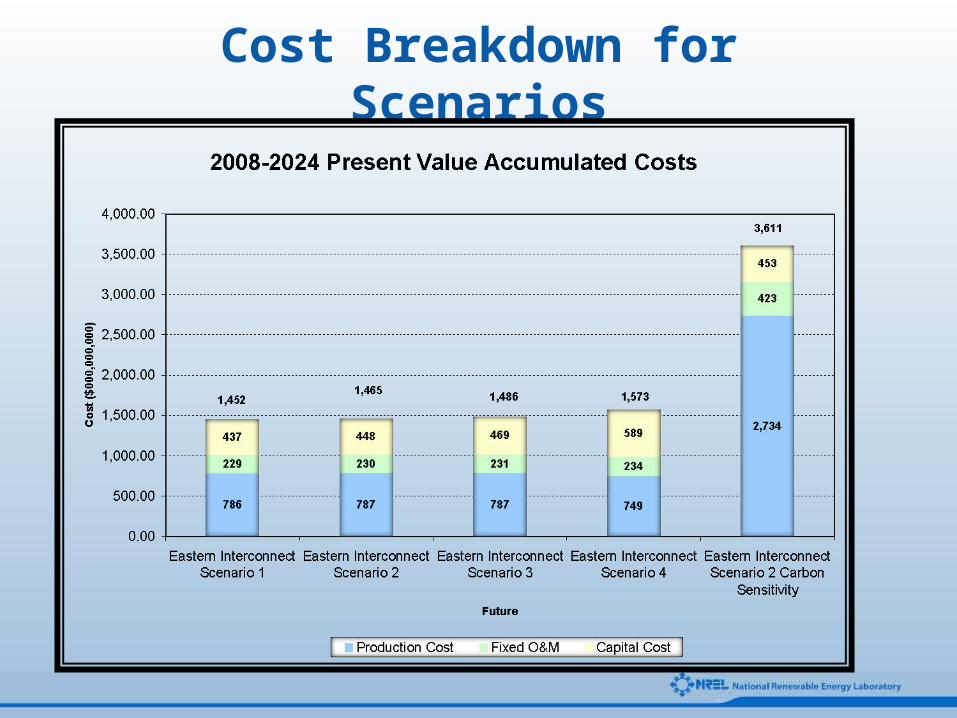
Cost Breakdown for Scenarios
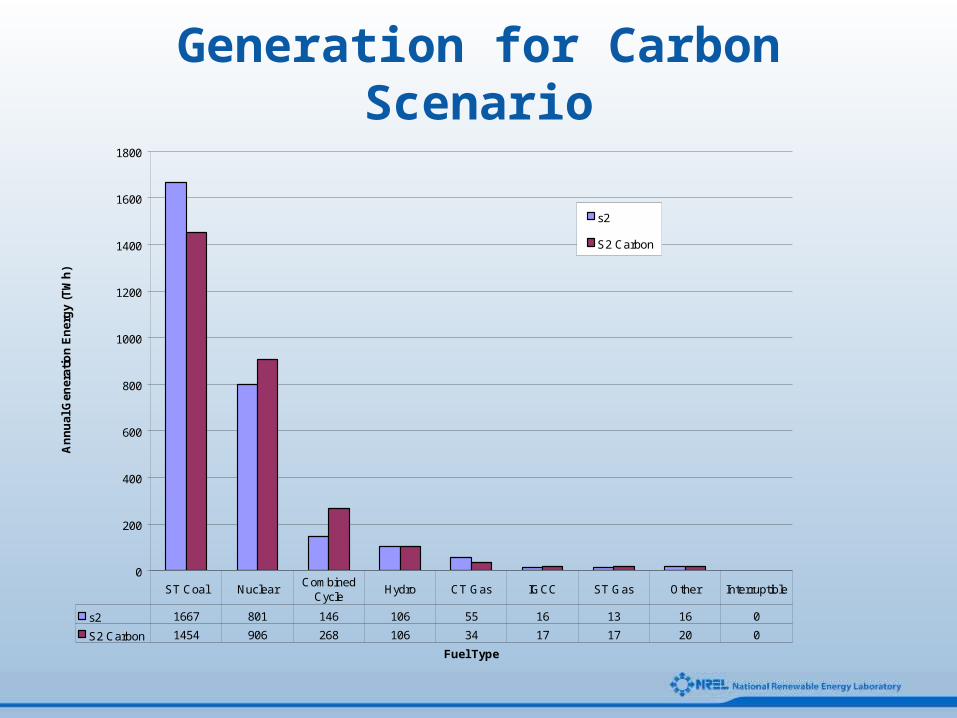
Generation for Carbon Scenario
0
200
400
600
800
1000
1200
1400
1600
1800
Fuel Type
Ann
ual G
ener
atio
n En
ergy
(TW
h)
s2
S2 Carbon
s2 1667 801 146 106 55 16 13 16 0
S2 Carbon 1454 906 268 106 34 17 17 20 0
ST Coal Nuclear Combined Cycle Hydro CT Gas IGCC ST Gas Other Interruptible
and the conclusion is…• There are no fundamental technical barriers to the
integration of 20% wind energy into the electrical system, but…
• There needs to be a continuing evolution of transmission planning and system operation policy and market development for this to be achieved.
EWITS Conclusions• High penetrations of wind generation—providing 20% to 30% of
the electric energy requirements of Eastern Interconnection—are technically feasible with significant expansion of the transmission infrastructure.
• New transmission will be required for all the future wind scenarios in the Eastern Interconnection, including the reference case. Planning for this transmission, then, is imperative because it takes longer to build new transmission capacity than it does to build new wind plants.
• Without transmission enhancements, substantial curtailment of wind generation would be required for all of the 20% scenarios.
• Interconnection-wide costs for integrating large amounts of wind generation are manageable with large regional operating pools, where benefits of load and wind diversity can be exploited and large numbers of supply resources are efficiently committed and dispatched.
EWITS Conclusions• Transmission helps reduce the impacts of the variability of
the wind, which reduces wind integration costs, increases reliability of the electrical grid, and helps make more efficient use of the available generation resources.
• Although costs for aggressive expansions of the existing grid are significant, they do make up a relatively small piece of the total annualized costs in any of the scenarios studied.
• Wind generation displaces carbon-based fuels, directly reducing carbon dioxide (CO2) emissions. Emissions continue to decline as more wind is added to the supply picture. Increasing the cost of carbon in the analysis results in higher total production costs.
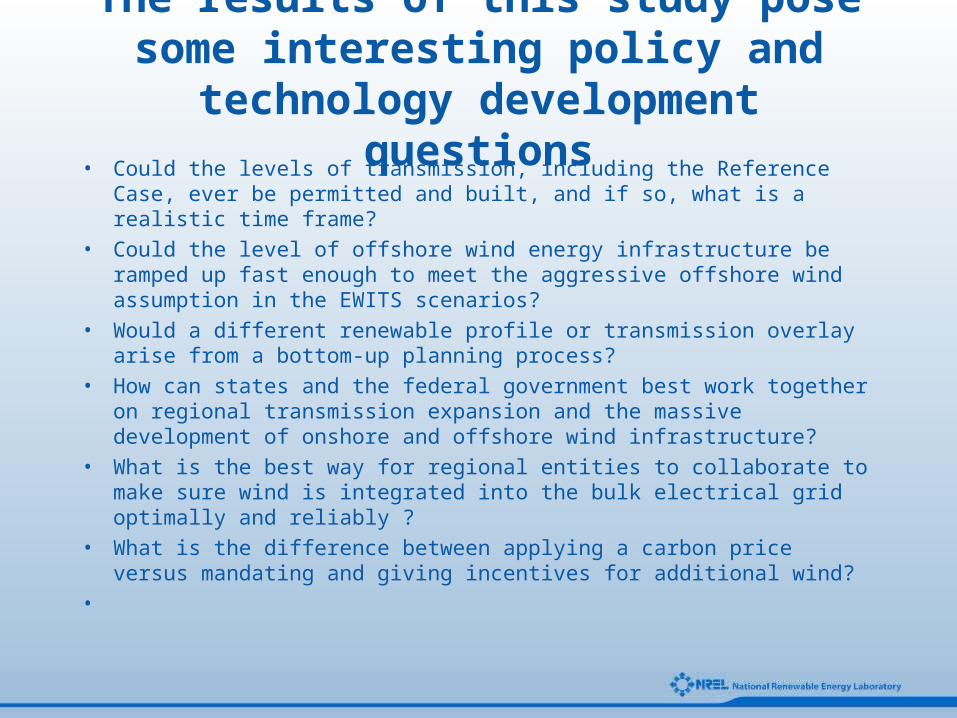
The results of this study pose some interesting policy and technology
development questions• Could the levels of transmission, including the Reference Case, ever be
permitted and built, and if so, what is a realistic time frame?• Could the level of offshore wind energy infrastructure be ramped up fast
enough to meet the aggressive offshore wind assumption in the EWITS scenarios?
• Would a different renewable profile or transmission overlay arise from a bottom-up planning process?
• How can states and the federal government best work together on regional transmission expansion and the massive development of onshore and offshore wind infrastructure?
• What is the best way for regional entities to collaborate to make sure wind is integrated into the bulk electrical grid optimally and reliably ?
• What is the difference between applying a carbon price versus mandating and giving incentives for additional wind?
•
EWITS Schedule & Contacts• Report going to print next week
• EWITS roll out January 20th , 10 AM, Washington DC.
– You are all invited!
• Development of Phase II of EWITS in first quarter 2010
• Contact: Dave Corbus at [email protected]
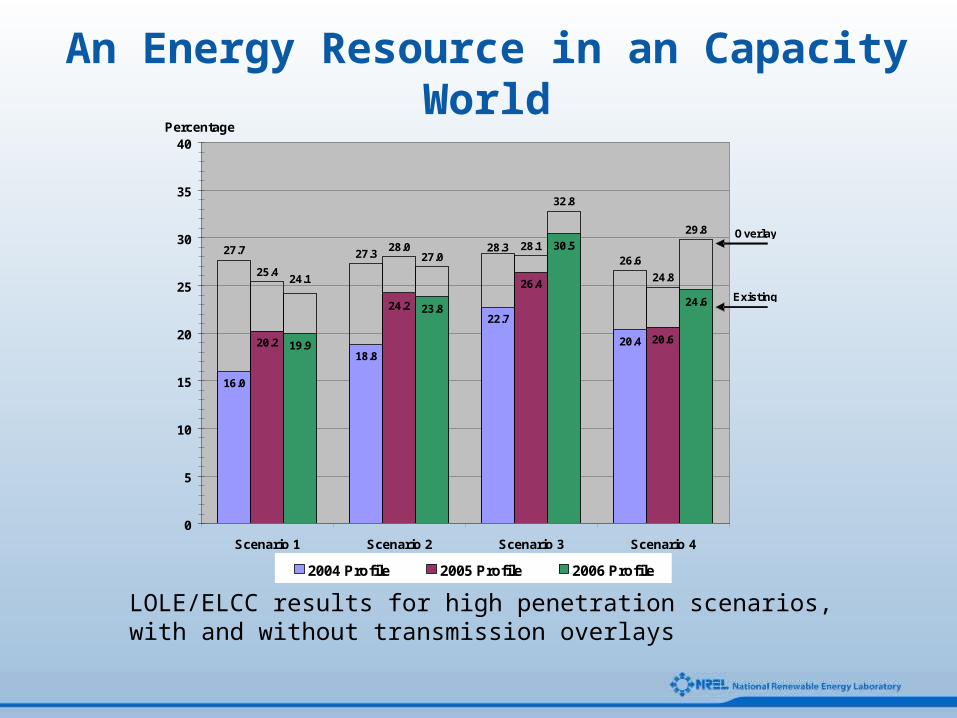
An Energy Resource in an Capacity World
27.7 27.3 26.625.4
28.0 28.1
24.8
27.0
32.8
29.828.3
24.1
20.4
22.7
18.8
16.0
20.6
26.4
24.2
20.2
24.6
30.5
23.8
19.9
0
5
10
15
20
25
30
35
40
Scenario 1 Scenario 2 Scenario 3 Scenario 4
Percentage
2004 Profile 2005 Profile 2006 Profile
Overlay
Existing
LOLE/ELCC results for high penetration scenarios, with and without transmission overlays