Optimal Reserves in the Eastern Caribbean Currency Union; Mario ...
© 2005 International Monetary Fund August 2005
IMF Country Report No. 05/305
Eastern Caribbean Currency Union: Selected Issues
This Selected Issues paper for the Eastern Caribbean Currency Union (ECCU) was prepared by a staff team of the International Monetary Fund as background documentation for the periodic regional surveillance on the ECCU. It is based on the information available at the time it was completed on June 28, 2005. The views expressed in this document are those of the staff team and do not necessarily reflect the views of the institutions or governments of the ECCU or the Executive Board of the IMF. The policy of publication of staff reports and other documents by the IMF allows for the deletion of market-sensitive information. To assist the IMF in evaluating the publication policy, reader comments are invited and may be sent by e-mail to [email protected].
Copies of this report are available to the public from
International Monetary Fund ● Publication Services 700 19th Street, N.W. ● Washington, D.C. 20431
Telephone: (202) 623 7430 ● Telefax: (202) 623 7201 E-mail: [email protected] ● Internet: http://www.imf.org
Price: $15.00 a copy
International Monetary Fund
Washington, D.C.

INTERNATIONAL MONETARY FUND
EASTERN CARIBBEAN CURRENCY UNION
Selected Issues
Prepared by Paul Cashin, Jingqing Chai, Rupa Duttagupta, Pawel Dyczewski, Rishi Goyal, Montfort Mlachila, Tobias Rasmussen, Wendell Samuel,
Guillermo Tolosa, Ping Wang (all WHD), and Prachi Mishra (FAD)
Approved by the Western Hemisphere Department
June 28, 2005 Contents Page
I. Macroeconomic Fluctuations in the Eastern Caribbean Currency Union ..................................3 A. Introduction...................................................................................................................3 B. Data and Estimation Technique ....................................................................................4 C. Main Features of Macroeconomic Fluctuations............................................................5 D. Conclusion and Summary of Findings..........................................................................9
II. Islands of Stability? Determinants of Macroeconomic Volatility in the ECCU.....................18 A. Introduction.................................................................................................................18 B. Stylized Facts: High Vulnerability but Low Volatility ...............................................20 C. Economic Volatility: Cross-Country Evidence...........................................................21 D. Concluding Remarks...................................................................................................25
III. Government Responses to Natural Disasters in the Caribbean .............................................35 A. Introduction.................................................................................................................35 B. Disaster Risk Mitigation .............................................................................................35 C. Implications and Weaknesses of the Caribbean Natural Disaster Management Approach..........................................................................................................................37 D. Scope for Improved Disaster Management.................................................................41 E. Issues of Relevance to Developing Countries .............................................................43 F. Conclusion ...................................................................................................................45
IV. Fiscal Policy in a Regional Currency Union .........................................................................51 A. Introduction.................................................................................................................51 B. Fixed Exchange Rates, Currency Unions, and Fiscal Discipline................................52 C. Fiscal Policies in the Eastern Caribbean Currency Union ..........................................55 D. Empirical Analysis......................................................................................................57 E. Conclusion...................................................................................................................62
- 2 -
V. Tax Concessions and Foreign Direct Investment in the ECCU..............................................73 A. Introduction.................................................................................................................73 B. Tax Concessions in the ECCU: A Brief Overview.....................................................74 C. Revenue Costs of Concessions....................................................................................77 D. Benefits of Incentives: FDI Performance in the ECCU..............................................79 E. Summary and Policy Conclusions...............................................................................82
VI. Emigration and Brain-Drain: Evidence from the Caribbean .................................................93 A. Introduction.................................................................................................................93 B. Theory .........................................................................................................................95 C. Data and Evidence.......................................................................................................98 D. Results.......................................................................................................................101 E. Conclusion and Policy Implications..........................................................................103
VII. Integration and Growth in the Eastern Caribbean..............................................................126 A. Introduction...............................................................................................................126 B. The Integration and Growth Literature .....................................................................126 C. The ECCU Experience with Regional Integration and Growth................................129 D. Modeling the Contribution of Integration to Growth in the ECCU..........................136 E. Concluding Remarks .................................................................................................139
- 3 -
I. MACROECONOMIC FLUCTUATIONS IN THE EASTERN CARIBBEAN CURRENCY UNION1
A. Introduction 1. An important area of research in quantitative macroeconomic analysis has been to understand and distinguish between the short- and long-run determinants of fluctuations in macroeconomic time series. This work has concentrated on documenting the empirical regularities of macroeconomic fluctuations and the determinants of national business cycles. Unfortunately, the bulk of this research has examined macroeconomic fluctuations in developed countries, with little work undertaken on developing countries (see Backus and Kehoe, 1992). Exceptions are Agénor, McDermott and Prasad (2000), Rand and Tarp (2002) and Kaminsky, Reinhart and Végh (2004), who analyze the stylized facts of macroeconomic fluctuations in developing countries. This chapter extends this analysis of macroeconomic fluctuations to the members of the Eastern Caribbean Currency Union.2 2. Several key questions remain unresolved in the literature. Do the empirical regularities observed for macroeconomic fluctuations in developed countries differ from those observed for developing countries, and are the regularities broadly similar for countries located in different geographic regions or with different exchange rate regimes? These issues are also central to macroeconomic policymaking, as use of potentially inappropriate conclusions regarding the stylized facts of macroeconomic fluctuations in developing countries can adversely affect the efficacy of stabilization policy (Cashin, 2004).
3. This study of business cycle regularities in the eastern Caribbean covers a wide range of macroeconomic series. These series include annual observations on domestic and world output, inflation, government expenditure and revenue, real interest rates, external assistance, commodity prices, workers’ remittances, and current account balances. The relationship between fluctuations in these macroeconomic time series and a key measure of economic activity—gross domestic product—is examined.3
4. The empirical methodology used in the chapter measures the extent of comovement between economic time series. In keeping with the literature on the business cycle of developed countries, the results in this chapter are based on unconditional correlations between variables. As noted by Agénor, McDermott and Prasad (2000), such correlations do not imply causation, but do provide information on the type of shocks affecting eastern Caribbean economies and lay the groundwork for more formal economic 1 Prepared by Paul Cashin and Ping Wang.
2 Earlier analyses of Caribbean business cycles include Mamingi (1999), Borda, Manioc and Mantauban (2000), Craigwell and Maurin (2002), and Cashin (2004).
3 We also analyze the evolution of various measures of per capita incomes in the eastern Caribbean, to ascertain if incomes in the region have converged or diverged in the previous two decades (see the Appendix).
- 4 -
models. In addition, given that many of the macroeconomic time series used in this paper have distinct trend components, the series need to be rendered stationary prior to undertaking statistical analysis. In detrending the data we follow Cashin and Ouliaris (2004) and use the frequency domain filter developed by Corbae, Ouliaris and Phillips (2002).
5. The plan of this chapter is as follows. The data are described in Section B, along with the estimation technique used to ensure stationarity of the data. In Section C the empirical regularities of macroeconomic fluctuations in the ECCU are described, examining the relationship between a set of macroeconomic time series and domestic output, for each of the six Fund members of the ECCU. Section D concludes.
B. Data and Estimation Technique
6. Data used in the empirical analysis include series on domestic output, as well as other key macroeconomic variables. The macroeconomic time series cover the six Fund members of the Eastern Caribbean Currency Union (Antigua and Barbuda, Dominica, Grenada, St. Kitts and Nevis, St. Lucia, and St. Vincent and the Grenadines), and the ECCU as a regional aggregate.4 The logarithm of annual real GDP (in millions of local currency, base year 1990) is used to measure real output in each country.5 Data series are annual in frequency, and cover the period 1975 to 2004. All macroeconomic time series are converted into logarithms for the empirical work, except the world real interest rate, inflation rate, inflation tax rate and current account balance. The derivation and description of the data is contained in the Annex.
7. In this chapter we examine economic fluctuations at business cycle frequencies. In doing so, we need to decompose all of our macroeconomic time series into nonstationary (trending) and stationary (cyclical) components, as cross-correlations and other statistical analyses are inappropriate for nonstationary data. To arrive at stationary data, we use the frequency domain (FD) filter of Corbae and Ouliaris (2003) and Corbae, Ouliaris and Phillips (2002). The FD filter is a univariate detrending technique that removes the low-frequency (trend) and high-frequency (irregular) components of the data, leaving behind the business cycle components of the data. Following Cashin (2004), Cashin and Ouliaris
4 The ECCU aggregated data on domestic output and the current account balance are taken from the Eastern Caribbean Central Bank. The aggregate ECCU fiscal (expenditures and revenues) data are calculated as the sum of individual country data. Similarly, the aggregate ECCU workers’ remittances and overseas development assistance data are the sum of the national data for the six Fund-member ECCU countries. See the Annex for additional details. 5 The annual national accounts GDP data are taken from the Eastern Caribbean Central Bank, the IMF’s International Financial Statistics and World Economic Outlook databases, and from Fund staff estimates. Information on the statistical features (mean and variability) of detrended real GDP for the eastern Caribbean can also be found in Cashin (2004).
- 5 -
(2004), and Burns and Mitchell’s (1946) ‘cycle dating rules,’ the cyclical component is set at frequencies of between two and eight years.6 7
C. Main Features of Macroeconomic Fluctuations
8. A key attribute of macroeconomic fluctuations concerns their comovement with domestic output. The empirical methodology used in the chapter measures the extent of comovement between economic time series. Correlations are between the stationary (cyclical) components of each of two series—typically domestic output and a second macroeconomic time series—with the cyclical components of both series derived using the FD filter.
9. We use the correlation coefficient to measure comovement between two macroeconomic time series. In doing so, we follow Agénor, McDermott and Prasad (2000) in measuring the extent of comovement of time series yt with real GDP xt by the magnitude of the cross-correlation coefficient at (annual) lag k, ρ(k), where k ∈ {0, ±1, ±2, ±3}. These correlations are between the stationary components of both series (yt and xt), with the stationary components derived using the FD filter. In line with the existing literature, we deem a series yt to be procyclical, countercyclical or acyclical depending on whether the contemporaneous correlation coefficient ρ(0) is positive, negative or not significantly different from zero. In addition, a series yt is viewed as:
• strongly contemporaneously correlated if ρ(0) is 0.36 ≤ |ρ(0)| < 1;
• weakly contemporaneously correlated if ρ(0) is 0.18 ≤ |ρ(0)| < 0.36; and
• contemporaneously uncorrelated if ρ(0) is 0 ≤ |ρ(0)| < 0.18.8
6 For data measured at annual frequency, Baxter and King (1999) note that using their band-pass filter on developed country data, researchers should isolate cycles with periodicities of eight years and higher. They point out that since the shortest detectable cycle in a time series using annual data is one that lasts two years, the annual business cycle filter passes components with cycle length between two and eight years. In this case, the band-pass filter is equivalent to a high-pass filter, which removes low frequency (or long cycle) components of greater than eight years, and allows high frequency (or short cycle) components to pass through. That is, the band-pass filter removes the trend components of the data, leaving behind the cycle (or filtered data).
7 We also checked the robustness of our results using the commonly-used Hodrick-Prescott (1980) filter. Typically, we found a very high correlation between the cyclical components of the data obtained using the Hodrick-Prescott and the FD univariate filters.
8 Following Agénor, McDermott and Prasad (2000), the approximate standard error of the correlation coefficients, computed under the null hypothesis that the true correlation coefficient is zero, is 0.18 (given T=30).
- 6 -
10. Cross-correlations of each macroeconomic variable with output at one- to three-period leads and lags reveal no clear pattern. In examining the leads and lags in the relationship between (stationary) domestic output and (stationary) macroeconomic time series, we find that for most ECCU countries the correlations peak at or near lag zero. That is, most statistically significant results are found for contemporaneous correlations, which are reported in this chapter. This finding also suggests that macroeconomic fluctuations in the Caribbean are transmitted fairly quickly.
Domestic output and the real sector
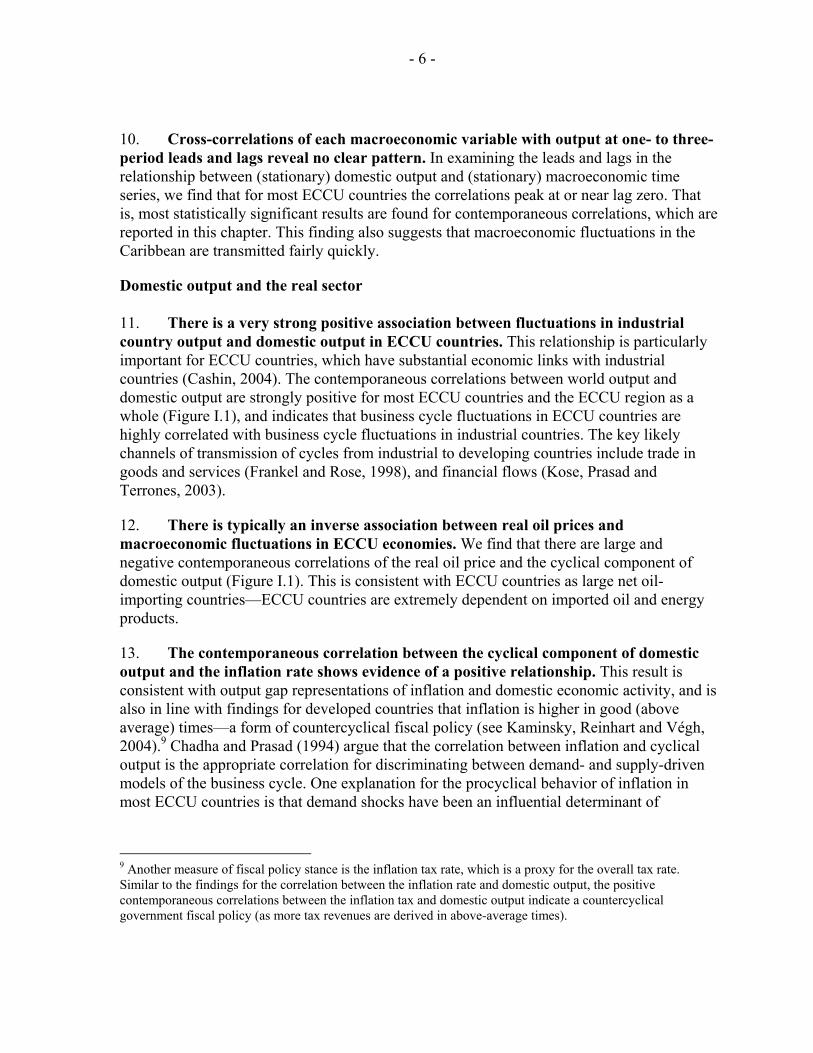
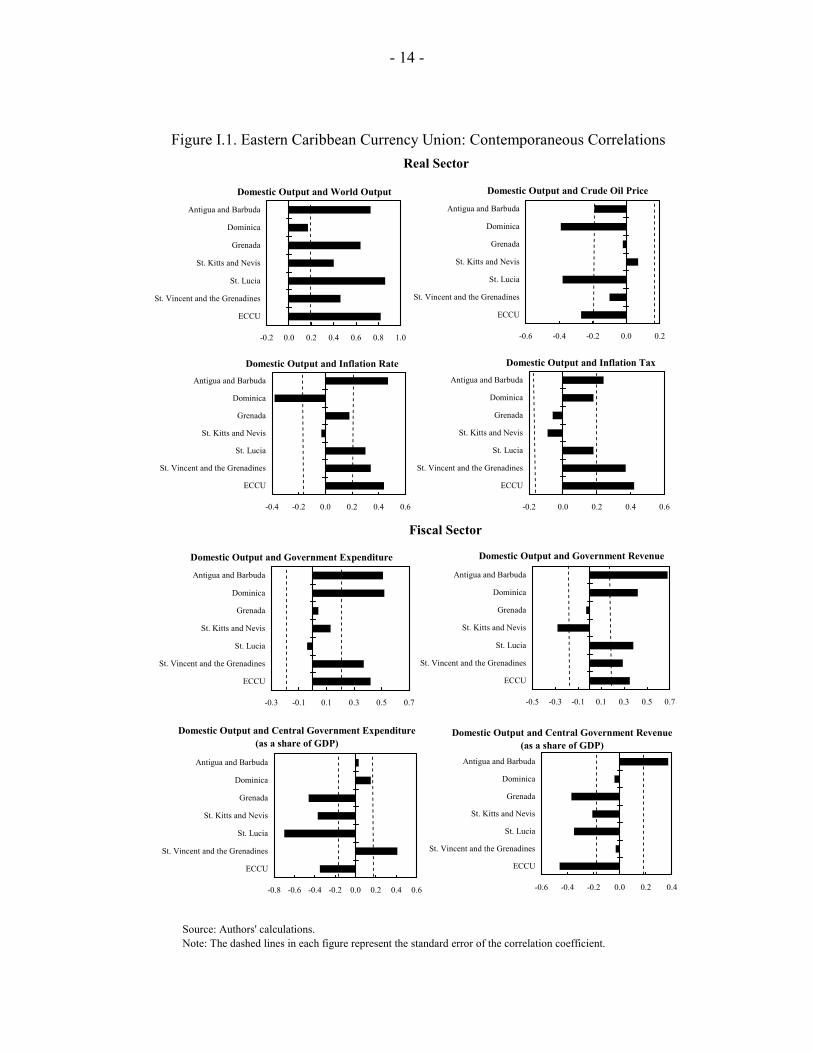
11. There is a very strong positive association between fluctuations in industrial country output and domestic output in ECCU countries. This relationship is particularly important for ECCU countries, which have substantial economic links with industrial countries (Cashin, 2004). The contemporaneous correlations between world output and domestic output are strongly positive for most ECCU countries and the ECCU region as a whole (Figure I.1), and indicates that business cycle fluctuations in ECCU countries are highly correlated with business cycle fluctuations in industrial countries. The key likely channels of transmission of cycles from industrial to developing countries include trade in goods and services (Frankel and Rose, 1998), and financial flows (Kose, Prasad and Terrones, 2003).
12. There is typically an inverse association between real oil prices and macroeconomic fluctuations in ECCU economies. We find that there are large and negative contemporaneous correlations of the real oil price and the cyclical component of domestic output (Figure I.1). This is consistent with ECCU countries as large net oil-importing countries—ECCU countries are extremely dependent on imported oil and energy products.
13. The contemporaneous correlation between the cyclical component of domestic output and the inflation rate shows evidence of a positive relationship. This result is consistent with output gap representations of inflation and domestic economic activity, and is also in line with findings for developed countries that inflation is higher in good (above average) times—a form of countercyclical fiscal policy (see Kaminsky, Reinhart and Végh, 2004).9 Chadha and Prasad (1994) argue that the correlation between inflation and cyclical output is the appropriate correlation for discriminating between demand- and supply-driven models of the business cycle. One explanation for the procyclical behavior of inflation in most ECCU countries is that demand shocks have been an influential determinant of
9 Another measure of fiscal policy stance is the inflation tax rate, which is a proxy for the overall tax rate. Similar to the findings for the correlation between the inflation rate and domestic output, the positive contemporaneous correlations between the inflation tax and domestic output indicate a countercyclical government fiscal policy (as more tax revenues are derived in above-average times).
- 7 -
domestic economic fluctuations, which for a given level of aggregate supply, has typically caused aggregate demand and equilibrium prices to move in the same direction.10
Domestic output and the fiscal sector
14. In this subsection we examine the relationship between fluctuations in economic activity and the fiscal sector. Examining the relationship between aggregate economic activity and government expenditure and revenue has analytical value from the perspective of business cycle modeling. It is also important from a policy perspective, to ascertain whether government exacerbates or smoothes cycles in economic activity. In so doing we follow Kaminsky, Reinhart and Végh (2004) in defining the cyclicality of fiscal policy in terms of policy instruments rather than outcomes—hence fiscal policy will be determined by government spending and tax rates (as opposed to tax revenues). Under this definition, a countercyclical fiscal policy would be associated with lower (higher) government spending and higher (lower) tax rates in good (bad) economic times.11
15. Apart from St. Lucia, the positive contemporaneous correlation between domestic output and the cyclical component of central government expenditure is evidence of a largely procyclical role for government expenditure. This result suggests that ECCU government expenditure tends to reinforce domestic business cycles. This is consistent with Gavin and Perotti (1997), Talvi and Végh (2000) and Kaminsky, Reinhart, and Végh (2004), who find that developing countries typically have a positive correlation between cyclical components of government consumption and output—due largely to credit constraints. This result is also consistent with Rasmussen and Tolosa (2005), who find that while government spending in the ECCU is mildly procyclical, it is much less procyclical than for other developing countries. In contrast, Kaminsky, Reinhart and Végh (2004) find that developed countries tend to have countercyclical or acyclical fiscal policies.12
16. Contemporaneous correlations between cyclical components of real government revenue and domestic output in ECCU countries are largely positive. This result is consistent with countercyclical fiscal policy, in the sense of stabilizing the business cycle. In 10 In contrast to Chadha and Prasad (1994), we find that the positive correlation between the cyclical component of output and inflation is accompanied by a positive correlation between the cyclical component of output and prices. This is further evidence in support of demand-side shocks driving Caribbean economic fluctuations.
11 Taxation revenue is composed of the interaction of the tax rate and tax base, where the latter is defined to be high in good times and low in bad times.
12 An alternative measure of the expenditure stance is central government expenditure (as a share of GDP). Apart from St. Vincent and the Grenadines, the contemporaneous correlations between domestic output and central government expenditure (as a share of GDP) are largely negative. This result is consistent with the findings of Agénor, McDermott and Prasad (2000) for developing countries. However, according to Kaminsky, Reinhart and Végh (2004) this measure could be misleading, since the cyclical stance of government spending (as numerator) may be dominated by the cyclical behavior of output (as denominator).
- 8 -
this sense, Caribbean countries are similar to developed countries, where revenue also tends to exhibit a positive correlation with output (see Kaminsky, Reinhart and Végh, 2004). The negative correlation between revenue and domestic output for St. Kitts and Nevis may reflect the dampening effect on aggregate demand of growing tax revenues (due to rising tax rates).13
Domestic output and the external sector
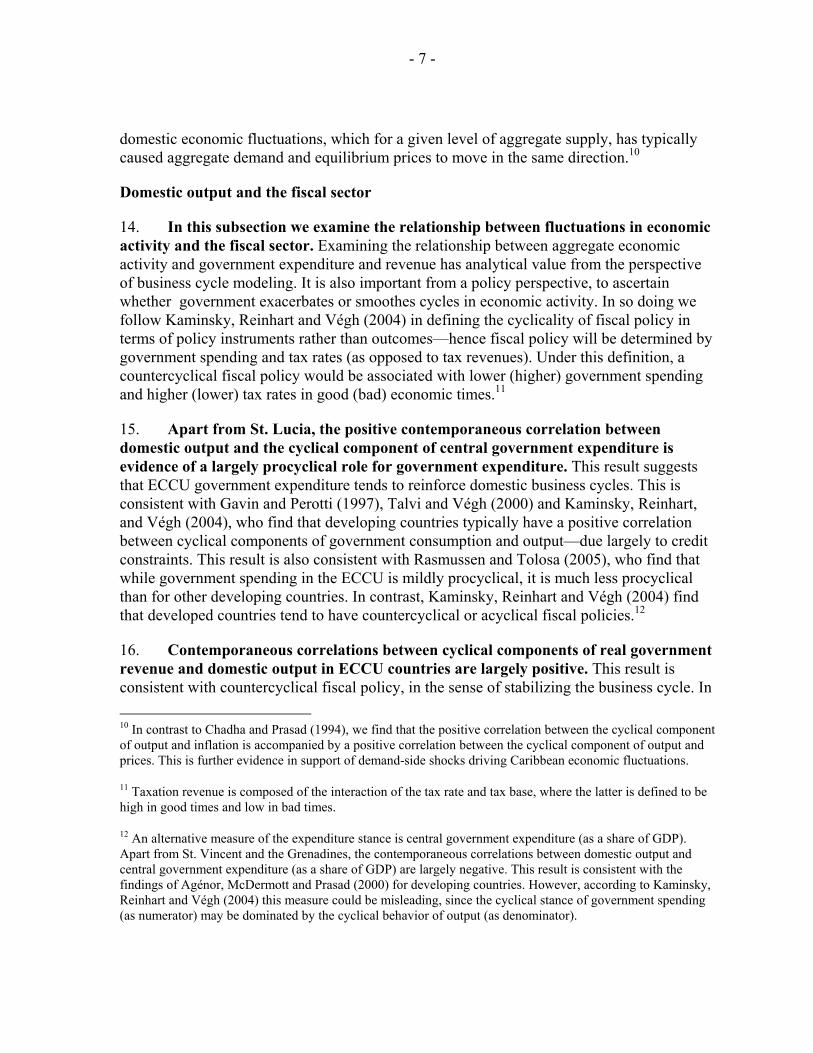
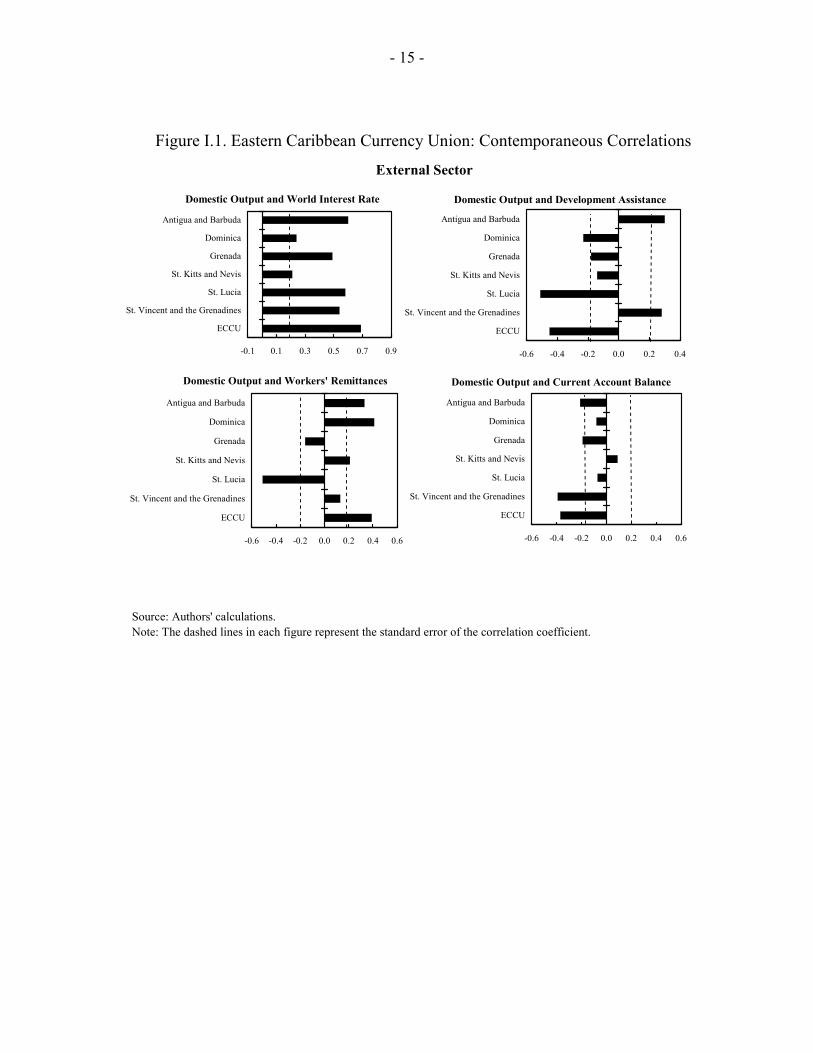
17. There is a very strong positive association between world real interest rates and economic fluctuations in ECCU economies. The strong correlations between (filtered) domestic output in ECCU economies and the world real interest rate are indicative of the influence of industrial country business cycle conditions on domestic fluctuations in ECCU countries. For most ECCU economies, the contemporaneous correlations between domestic output and the world real interest rate are strongly significantly positive. This could reflect the fact that the real interest rate in industrial economies tends to be procyclical and that changes in output in industrial countries, through trade and finance links, have positive spillover effects on output in ECCU economies (see Agénor, McDermott and Prasad, 2000).
18. For most ECCU countries, the contemporaneous correlations between (filtered) domestic output and official development assistance flows are largely negative. These results differ considerably from those of Pallage and Robe (2001), who find the bivariate correlation is overwhelmingly positive for African countries, and typically acyclical for non-African developing countries. Accordingly, an important result is that unlike most other regions, aid flows to eastern Caribbean countries are countercyclical, and appear to assist in smoothing output fluctuations.
19. Contemporaneous correlations between the cyclical component of domestic output and workers’ remittances are chiefly positive. This result seems counterintuitive, as one might expect a countercyclical relationship (more remittance flows when the recipient country is in an economic slump) along the lines of the “insurance motive” for remittances derived from micro-level studies (see Docquier and Rapoport, 2004; Mishra, 2005). However, given the strongly procyclical correlation between industrial country and ECCU output cycles, it is not surprising that remittance flows increase when industrial country output rises.
20. The contemporaneous association between the current account balance and domestic output is countercyclical for four countries (including the ECCU aggregate), and acyclical for the remainder. A countercyclical correlation indicates that above-average domestic output is associated with a deteriorating current account balance. A countercyclical
13 In contrast, the correlations between central government revenue (as a share of GDP) and cyclical component of domestic output give ambiguous readings. The bivariate correlations are acyclical for two countries and countercyclical for the others, excepting Antigua and Barbuda.

- 9 -
current account correlation is also reflective of largely procyclical borrowing (and foreign direct investment), and an economy which avails itself of foreign saving. This negative association between the current account balance and domestic output for the eastern Caribbean echoes results found for industrial countries (Freund, 2000).
D. Conclusion and Summary of Findings
21. Our results have several policy implications. We briefly summarize here the main findings of the chapter.
• Strongly positive links exist between activity in industrial countries and output fluctuations in ECCU countries, both directly and indirectly through higher world real interest rates. This finding emphasizes the openness of ECCU economies, and the important role that world economic growth plays as a channel of business cycle transmission to the Caribbean.
• Contemporaneous correlations between output and government spending are largely procyclical (as spending rises in good times and contracts in bad times), while correlations between output and government revenue are countercyclical (as revenue moves in the same direction as output).
• Overseas development assistance flows are largely countercyclical, indicating that assistance rises when Caribbean output is in a slump.
• Both domestic output and prices and domestic output and inflation are positively correlated, which is consistent with output gap representations of inflation and domestic economic activity. Real oil prices are negatively associated with domestic output, consistent with the oil-importing status of all ECCU countries.
• Contemporaneous correlations between real current account balances and domestic output are largely negative. This is indicative of procyclical external borrowing (including foreign direct investment) and the lack of borrowing constraints that ECCU countries faced during the period under study.
22. In this chapter we have examined the cyclical properties of several important macroeconomic time series for the six Fund members of the Eastern Caribbean Currency Union. In so doing, we emphasized the patterns of comovement (unconditional correlations) between domestic output and macroeconomic time series, in an attempt to discern some of the “stylized facts” of macroeconomic fluctuations in the Caribbean. We also set out the key differences and similarities between our Caribbean results and those obtained in other studies of business cycle fluctuations in developed and developing countries. It is hoped that in future work, researchers will apply the stylized facts established here in designing more formal, structural models of Caribbean business cycles.
- 10 - ANNEX
DATA SOURCES The primary sources of data used in this paper are the International Monetary Fund’s International Financial Statistics (IFS), World Economic Outlook (WEO), Eastern Caribbean Central Bank, country authorities and IMF staff’s estimates, supplemented by other sources. Data series are in annual frequency and run from 1975 to 2004. All series are converted into logarithms for the empirical work, except the world real interest rate, inflation rate, inflation tax rate and current account balance. All data are available upon request. Real gross domestic output is obtained from the Eastern Caribbean Central Bank and from
IMF staff estimates.
World real output is the gross domestic product (at constant prices) for industrial countries from the WEO (series W110NGDP_R).
GDP deflator is from Eastern Caribbean Central Bank.
Real crude oil price in U.S. dollars per barrel is the simple average of three spot prices—dated Brent, West Texas Intermediate, and Dubai Fateh (IFS, series 11176RGZLF...), deflated by the manufactured unit export index of industrial countries (IFS, series 11074..DZF...).
Inflation (π) is the annual percentage change of consumer price index (CPI), with the CPI index taken from the WEO (series W_PCPI).
Inflation tax is defined as π/1+ π.
Real central government expenditure is provided by Eastern Caribbean Central Bank and IMF staff, and is deflated by the GDP deflator.
Real central government revenue is the nominal central government revenue retrieved from WEO (series W_GCRG), divided by GDP deflator.
World real interest rate is proxied by the difference between the nominal 6-month euro-dollar rate in London (IFS, series 11260D..ZF...) and the rate of inflation in consumer prices in industrial countries (IFS, series 11064..XZF...).
Overseas development assistance is total concessional aid (including loans and grants), obtained from the website of Organization for Economic Co-operation and Development (http://www.oecd.org). The GDP deflator is used to convert the series to real terms.
- 11 - ANNEX
Workers’ remittances are defined as the value of monetary transfers sent home from workers abroad for more than one year. The series are obtained from the website of University of California at Davis and the World Bank’s World Development Indicators for 1986 to 1995, and from country authorities from 1996 onwards. The GDP deflator is used to convert the series to real terms.
Current account balance is taken from WEO (series W_BCA) and is deflated by GDP deflator.
We performed the Phillips-Perron unit root tests on cyclical components of all series, derived with the filters employed in this chapter, and confirmed they were all stationary.14 In addition, we found that unfiltered inflation rates (measured as the annual percentage change of CPI) were not stationary for a few countries in our sample, but filtered inflation rates (which we used in the analysis) were. The results of these unit root tests are not reported, but are available upon request.
14 Workers’ remittances for Antigua and Barbuda and St. Kitts and Nevis, and broad money and private sector credit for St. Lucia passed the Phillips-Perron test at the 10 percent level of significance. All other series passed at the 5 percent level or lower.
APPENDIX
-12 -
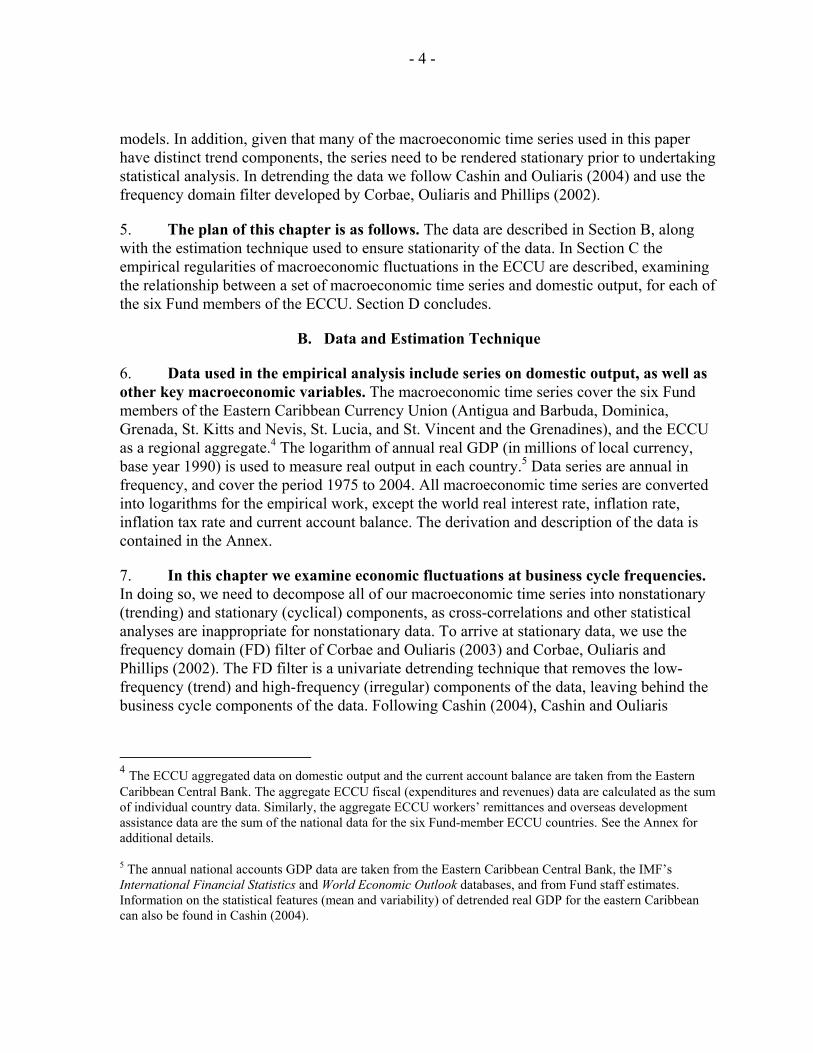
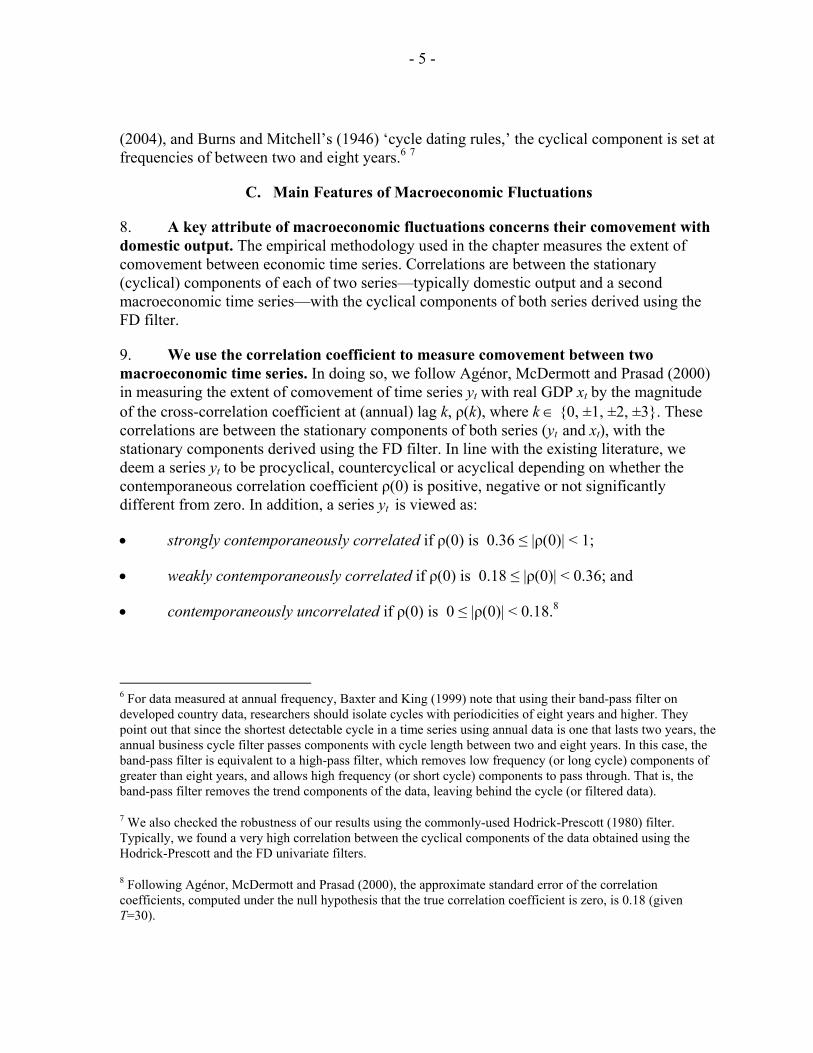
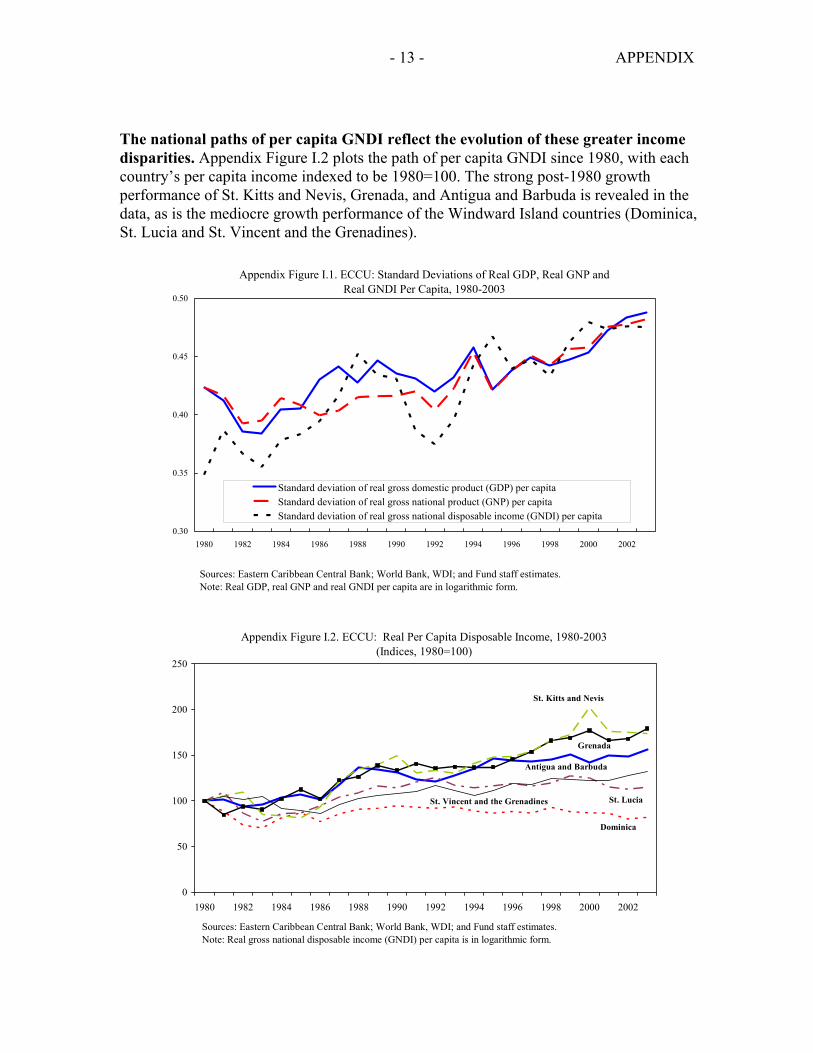
INCOME CONVERGENCE IN THE ECCU Over the last two decades, economic growth in the countries of the Eastern Caribbean Currency Union (ECCU) has been rather volatile (Rasmussen and Tolosa, 2005). An important question is whether, during this volatile growth process, flows of labor, capital, and remittances have served to equalize per capita incomes across member countries of the ECCU? Following the growth literature, we measure the extent of σ-convergence—that is, we examine whether the dispersion of real per capita incomes across the economies of the ECCU have tended to fall over time, which would indicate that income levels in the rich and poor countries of the ECCU are becoming more similar. In analyzing σ-convergence it is assumed that ECCU countries share the same long-run equilibrium level of per capita income, determined by common technologies and common preferences for saving. We use three concepts of income in the analysis: gross domestic product (GDP), gross national product (GNP), and gross national disposable income (GNDI). GDP (at market prices) is the sum of gross value-added by all resident producers in the economy, plus any product taxes and less any subsidies not included in the value of the products; GNP is GDP plus net receipts of factor income from abroad (compensation of short-term employees and property income); while GNDI is GNP plus net current transfers from abroad (workers’ remittances). As a result, GNDI is the broadest measure of income, as it captures both short-term (compensation of employees) and long-term (worker remittances) transfers, and other types of current transfers (such as official transfers).15 GNDI thus represents the total income available to residents of an economy for consumption and saving, excluding any foreign borrowing. Given the large numbers of Caribbean emigrants working abroad, it is important to capture the remittances of the Caribbean diaspora in calculating the broadest possible definition of each country’s income. There appears to be little evidence that incomes in initially-poor ECCU countries are converging to (catching up with) those of their initially-rich ECCU counterparts. Appendix Figure I.1 shows the cross-sectional standard deviation of the logarithm of real per capita income (the coefficient of variation), for each of the three definitions of income. We observe that the dispersion rose from about 0.42 (for GDP and GNP) in 1980 to reach about 0.47 by 2003; the dispersion of GNDI rose even further, from 0.35 in 1980 to about 0.47 in 2003. While the dispersion of per capita incomes was broadly stable until the early 1990s, after that time income divergence occurred across the countries of the ECCU. Hence it appears that, contrary to expectation, remittances did not disproportionately flow to the poorer ECCU countries over the period.
15 To the extent that official data does not fully capture worker remittances, then GNDI will be an underestimate. GNDI also does not include migrant transfers (defined as capital transfers of migrants), which have been important in some ECCU countries, such as Grenada.
- 13 - APPENDIX
The national paths of per capita GNDI reflect the evolution of these greater income disparities. Appendix Figure I.2 plots the path of per capita GNDI since 1980, with each country’s per capita income indexed to be 1980=100. The strong post-1980 growth performance of St. Kitts and Nevis, Grenada, and Antigua and Barbuda is revealed in the data, as is the mediocre growth performance of the Windward Island countries (Dominica, St. Lucia and St. Vincent and the Grenadines).
0
50
100
150
200
250
1980 1982 1984 1986 1988 1990 1992 1994 1996 1998 2000 2002
Appendix Figure I.2. ECCU: Real Per Capita Disposable Income, 1980-2003 (Indices, 1980=100)
Sources: Eastern Caribbean Central Bank; World Bank, WDI; and Fund staff estimates.Note: Real gross national disposable income (GNDI) per capita is in logarithmic form.
St. Kitts and Nevis
Grenada
Dominica
Antigua and Barbuda
St. LuciaSt. Vincent and the Grenadines
0.30
0.35
0.40
0.45
0.50
1980 1982 1984 1986 1988 1990 1992 1994 1996 1998 2000 2002
Standard deviation of real gross domestic product (GDP) per capitaStandard deviation of real gross national product (GNP) per capitaStandard deviation of real gross national disposable income (GNDI) per capita
Appendix Figure I.1. ECCU: Standard Deviations of Real GDP, Real GNP and Real GNDI Per Capita, 1980-2003
Sources: Eastern Caribbean Central Bank; World Bank, WDI; and Fund staff estimates.Note: Real GDP, real GNP and real GNDI per capita are in logarithmic form.
- 14 -
Figure I.1. Eastern Caribbean Currency Union: Contemporaneous Correlations
-0.2 0.0 0.2 0.4 0.6 0.8 1.0
ECCU
St. Vincent and the Grenadines
St. Lucia
St. Kitts and Nevis
Grenada
Dominica
Antigua and Barbuda
Domestic Output and World Output
-0.6 -0.4 -0.2 0.0 0.2
ECCU
St. Vincent and the Grenadines
St. Lucia
St. Kitts and Nevis
Grenada
Dominica
Antigua and Barbuda
Domestic Output and Crude Oil Price
-0.4 -0.2 0.0 0.2 0.4 0.6
ECCU
St. Vincent and the Grenadines
St. Lucia
St. Kitts and Nevis
Grenada
Dominica
Antigua and Barbuda
Domestic Output and Inflation Rate
Real Sector
-0.2 0.0 0.2 0.4 0.6
ECCU
St. Vincent and the Grenadines
St. Lucia
St. Kitts and Nevis
Grenada
Dominica
Antigua and Barbuda
Domestic Output and Inflation Tax
Fiscal Sector
-0.3 -0.1 0.1 0.3 0.5 0.7
ECCU
St. Vincent and the Grenadines
St. Lucia
St. Kitts and Nevis
Grenada
Dominica
Antigua and Barbuda
Domestic Output and Government Expenditure
-0.5 -0.3 -0.1 0.1 0.3 0.5 0.7
ECCU
St. Vincent and the Grenadines
St. Lucia
St. Kitts and Nevis
Grenada
Dominica
Antigua and Barbuda
Domestic Output and Government Revenue
-0.8 -0.6 -0.4 -0.2 0.0 0.2 0.4 0.6
ECCU
St. Vincent and the Grenadines
St. Lucia
St. Kitts and Nevis
Grenada
Dominica
Antigua and Barbuda
Domestic Output and Central Government Expenditure (as a share of GDP)
-0.6 -0.4 -0.2 0.0 0.2 0.4
ECCU
St. Vincent and the Grenadines
St. Lucia
St. Kitts and Nevis
Grenada
Dominica
Antigua and Barbuda
Domestic Output and Central Government Revenue (as a share of GDP)
Source: Authors' calculations.Note: The dashed lines in each figure represent the standard error of the correlation coefficient.
- 15 -
Figure I.1. Eastern Caribbean Currency Union: Contemporaneous Correlations
External Sector
-0.1 0.1 0.3 0.5 0.7 0.9
ECCU
St. Vincent and the Grenadines
St. Lucia
St. Kitts and Nevis
Grenada
Dominica
Antigua and Barbuda
Domestic Output and World Interest Rate
-0.6 -0.4 -0.2 0.0 0.2 0.4
ECCU
St. Vincent and the Grenadines
St. Lucia
St. Kitts and Nevis
Grenada
Dominica
Antigua and Barbuda
Domestic Output and Development Assistance
-0.6 -0.4 -0.2 0.0 0.2 0.4 0.6
ECCU
St. Vincent and the Grenadines
St. Lucia
St. Kitts and Nevis
Grenada
Dominica
Antigua and Barbuda
Domestic Output and Workers' Remittances
-0.6 -0.4 -0.2 0.0 0.2 0.4 0.6
ECCU
St. Vincent and the Grenadines
St. Lucia
St. Kitts and Nevis
Grenada
Dominica
Antigua and Barbuda
Domestic Output and Current Account Balance
Source: Authors' calculations.Note: The dashed lines in each figure represent the standard error of the correlation coefficient.
- 16 -
REFERENCES
Agénor, P-R., C. J. McDermott, and E. Prasad, 2000, “Macroeconomic Fluctuations in Developing Countries: Some Stylized Facts,” World Bank Economic Review, Vol. 14, pp. 251–85.
Backus, D., and P. Kehoe, 1992, “International Evidence on the Historical Properties of
Business Cycles,” American Economic Review, Vol. 82, pp. 864–88. Baxter, M., and R. King, 1999, “Measuring Business Cycles: Approximate Band-Pass Filters
for Economic Time Series,” Review of Economics and Statistics, Vol. 81, pp. 575–93. Borda, P., O. Manioc, and J. G. Montauban, 2000, “The Contribution of U.S. Monetary
Policy to Caribbean Business Cycles,” Social and Economic Studies, Vol. 49, pp. 225–50.
Burns, A., and W. Mitchell, 1946, Measuring Business Cycles (New York City: National
Bureau of Economic Research). Cashin, P., 2004, “Caribbean Business Cycles,” IMF Working Paper 04/136
(Washington DC: International Monetary Fund). Cashin, P., and S. Ouliaris, 2004, “Key Features of Australian Business Cycles,” Australian
Economic Papers, Vol. 43, pp. 39–58. Chadha, B. and E. Prasad, 1994, “Are Prices Countercyclical? Evidence from the G7,”
Journal of Monetary Economics, Vol. 34, pp. 239–57. Corbae, P. D., and S. Ouliaris, 2003, “Extracting Cycles from Non-Stationary Data,” in
Econometric Theory and Practice: Frontiers of Analysis and Applied Research, Essays in Honor of Peter C. B. Phillips, edited by P. Dean Corbae, Bruce Hansen, and Stephen Durlauf (forthcoming).
Corbae, P. D., S. Ouliaris, and P.C.B. Phillips, 2002, “Band Spectral Regression Using
Trending Data,” Econometrica, Vol. 70, pp. 1067–1109. Craigwell, R., and A. Maurin, 2002, “Production and Unemployment Cycles in the
Caribbean: The Case of Barbados and Trinidad and Tobago,” (unpublished, Research Department, Central Bank of Barbados).
Docquier, F., and H. Rapoport, 2004, “Skilled Migration: The Perspective of Developing
Countries,” Policy Research Working Paper No. 3382 (Washington DC: World Bank).
- 17 -
Frankel, J. and A. K. Rose, 1998, “The Endogeneity of the Optimum Currency Area Criteria,” Economic Journal, Vol. 108, pp. 1009–25.
Freund, C., 2000, “Current Account Adjustment in Industrialized Countries,” International
Finance Discussion Paper No. 692 (Washington DC: Board of Governors of the Federal Reserve System).
Gavin, M. and R. Perotti, 1997, “Fiscal Policy in Latin America,” NBER Macroeconomics
Annual (Cambridge, MA: MIT Press), pp. 11-61. Hodrick, R. J., and E. C. Prescott, 1980, “Post-War U.S. Business Cycles: An Empirical
Investigation,” Discussion Paper No. 451 (Pittsbrugh, PA: Carnegie-Mellon University).
Kaminsky G., C. Reinhart, and C. Végh, 2004, “When it Rains, it Pours: Procyclical Capital
Flows and Macroeconomic Policies,” NBER Working Paper No. 10780 (Cambridge, MA: National Bureau of Economic Research).
Kose, A., E. Prasad, and M. Terrones, 2003, “How Does Globalization Affect the
Synchronization of Business Cycles?,” American Economic Review Papers and Proceedings, Vol. 93, pp. 57–62.
Mamingi, N., 1999, “Testing for Convergence and Common Features in International
Output: The Case of the Eastern Caribbean Countries,” Journal of Eastern Caribbean Studies, Vol. 24, pp. 15–40.
Mishra, P., 2005, “Emigration and Brain-Drain: Evidence from the Caribbean,” in Eastern
Caribbean Currency Union: Selected Issues, Chapter VI. Pallage, S. and M. Robe, 2001, “Foreign Aid and the Business Cycle,” Review of
International Economics, Vol. 9, pp. 641–72. Rand, J., and F. Tarp, 2002, “Business Cycles in Developing Countries: Are They
Different?,” World Development, Vol. 30, pp. 2071–88. Rasmussen, T. and G. Tolosa, 2005, “Islands of Stability? Determinants of Macroeconomic
Volatility in the ECCU,” in Eastern Caribbean Currency Union: Selected Issues, Chapter II.
Talvi, E. and C.A. Végh, 2000, “Tax Base Variability and Procyclical Fiscal Policy,” NBER
Working Paper 7499 (Cambridge, MA: National Bureau of Economic Research).

- 18 -
II. ISLANDS OF STABILITY? DETERMINANTS OF MACROECONOMIC VOLATILITY IN THE ECCU1
A. Introduction
1. This chapter explores the determinants of macroeconomic volatility in the Eastern Caribbean Currency Union (ECCU). Considering their high degree of openness, dependence on tourism, and proneness to natural disasters, the ECCU economies are unusually exposed to external shocks. Nevertheless, the volatility of economic output in the ECCU has over the past decades been markedly lower than in other high-middle-income countries. This chapter finds that this relative stability is explained by fiscal policies and international capital flows that are less procyclical than typically is the case in other developing countries. The scope for continued stability could be ending, however, as high public debt may force outcomes to become more procyclical.
2. The literature on macroeconomic volatility would predict high output volatility in the ECCU; however, the evidence in the region does not support this hypothesis. A number of studies—including Acemoglu and Zilbotti (1997), Easterly and Kraay (2000), Easterly et al. (2000), and Pritchett (2000)—have sought to uncover the sources of economic volatility. Their findings suggest that output volatility is typically associated with a low level of income, lack of diversification, and high openness to trade. With the sum of imports and exports amounting to about 130 percent of GDP, tourism receipts accounting for about half of total exports of goods and services, and a high frequency of devastating hurricanes, one would expect the ECCU countries to be extremely volatile. Historically, however, the ECCU economies have been remarkably stable. Indeed, the analysis finds that the standard indicators of vulnerability identified in the literature suggest a level of real GDP volatility that is about twice as high as that actually observed. The exceptionally low volatility of the ECCU would therefore seem related to factors that are unique to the region.
3. The low level of output volatility in the ECCU has so far received little attention. There is a large literature on the special vulnerability of small island states (see Atkins et al., 2000) but most of the studies do not address the fact that the ECCU countries fail to fit into this picture in terms of their historical output volatility. Berezin et al. (2002)—in one of the few studies to mention this anomaly—suggest five causes: macroeconomic stability; absence of large-scale social conflicts; a declining role of agriculture; low correlation between sectors; and stable export earnings. This chapter builds on their work by exploring the causes of low output volatility and discusses possible implications.
4. The region’s reliance on tourism has contributed to the relative stability, but it does not appear to be the dominating determinant. Dependence on tourism has not created volatility as one could have expected, as it is an unusually stable industry. Indeed, 1 Prepared by Tobias Rasmussen and Guillermo Tolosa.
- 19 -
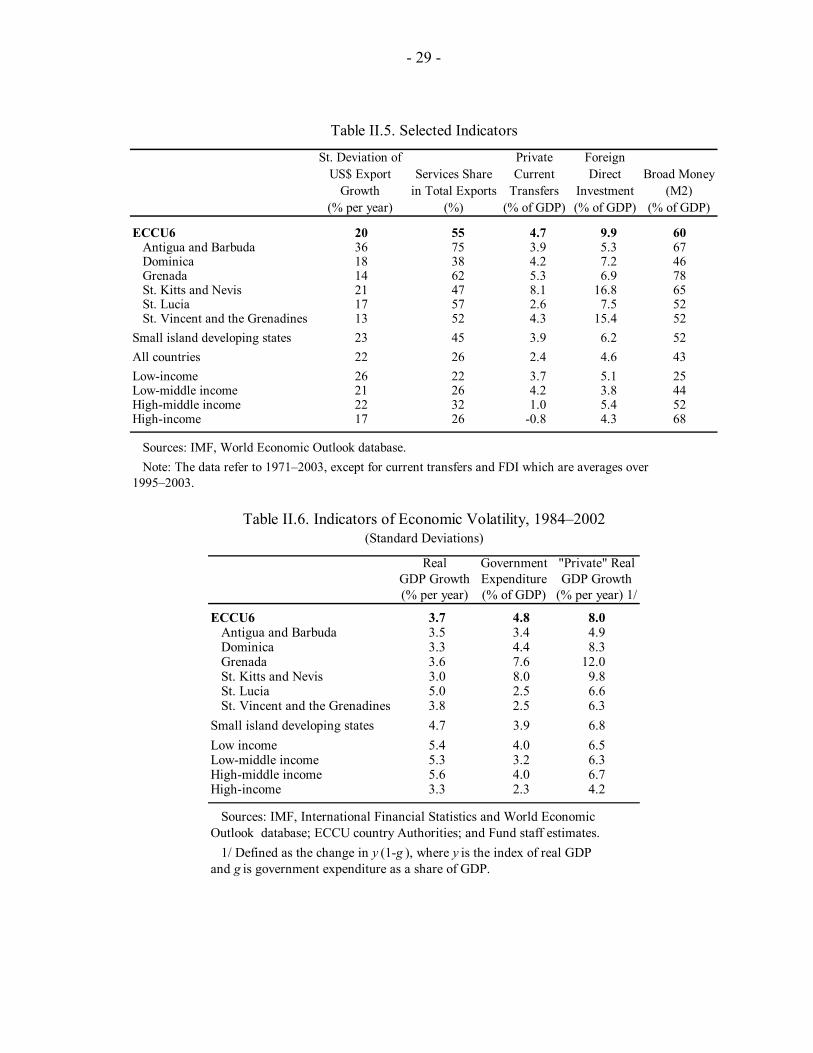
despite the lack of diversification, the volatility of overall exports of goods and services is lower in the ECCU than in the average developing country. In addition, private capital inflows into the ECCU countries are predominantly in the form of comparatively stable foreign direct investments. Nevertheless, the impact of these two sources of stability appears limited, as estimates suggest that private sector volatility in the ECCU is relatively high.
5. A key source of stability in the ECCU has been the ability to pursue counter-cyclical policies. Contrary to the procyclical tendencies in developing countries documented by Kaminsky, Reinhart, and Végh (2004), fiscal policy and international capital flows in the ECCU countries are found to have been only mildly procyclical or even counter-cyclical. The absence of this “when it rains, it pours” syndrome helps explain why the effects of high external vulnerability have been so muted. A key reason for the ECCU countries’ ability to pursue counter-cyclical policy is that they have had relatively easy access to capital in good and bad times. This, in turn, may be related to the exceptional stability of the common quasi-currency board arrangement, with the Eastern Caribbean dollar pegged to the U.S. dollar since 1976 and to the pound sterling before that. Such an explanation would also be consistent with recent studies by Acemoglu et al. (2003) and Satyanath and Subramanian (2004) who argue that institutions are the fundamental determinants of economic outcomes, and that macroeconomic policies are symptoms rather than root causes of volatility. This may be a mixed blessing, however. If the monetary arrangement has provided easier access to capital it may also have contributed to the build-up of debt.2
6. While the ECCU countries so far have been islands of stability, there are worrying signs that this might be ending. Fiscal balances have deteriorated sharply in the ECCU since the mid-1990s, and public debt has risen rapidly. With public debt to GDP ratios now among the highest in the world, governments will not likely be able to borrow to the extent they have in the past when faced with the next downturn. Such procyclical tendencies would lead to greater volatility and have detrimental consequences. Ramey and Ramey (1995), for example, find that higher output volatility leads to significantly lower economic growth. In addition, given risk aversion and a limited capacity to insure, volatility itself is associated with a welfare cost that may be very large in developing countries (Pallage and Robe, 2003; Cashin and Dyczewski, 2005).
7. The remainder of this chapter is organized as follows. Section B documents the features of the ECCU economies that make them vulnerable to external shocks. Section C compares the historical level of economic volatility in the ECCU with the rest of the world and seeks to identify the underlying determinants. Section D concludes.
2 See Duttagupta and Tolosa (2005) for a discussion of the moral hazard problem inherent in the monetary arrangement.
- 20 -
B. Stylized Facts: High Vulnerability but Low Volatility
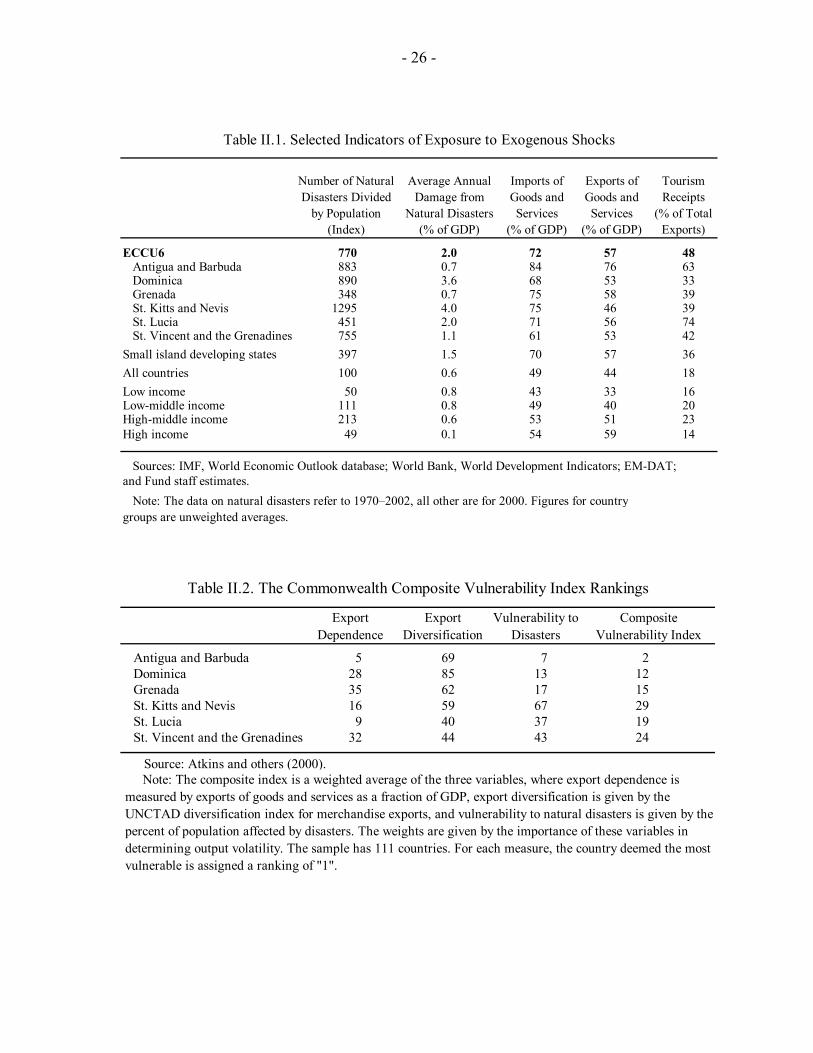
8. The ECCU countries share a number of structural features that make them exceptionally vulnerable to external shocks. Part of this exposure is related to their very small size—the combined annual GDP of the six Fund member countries is less than US$3 billion and the total population is just 570,000. The countries also share a number of other features that add to their vulnerability (Table II.1).3 9. The most visible vulnerability is the exposure to natural disasters. As documented in Rasmussen (2004), the ECCU countries face some of the highest frequencies of natural disasters in the world, primarily because of hurricanes but also due to earthquakes and volcanoes. Estimates of the costs of natural disasters are subject to considerable uncertainty, but available data suggest that the value of damage in the ECCU is equivalent to 2 percent of GDP per year on average. Some catastrophic events caused damage exceeding 100 percent of GDP, such as 1979 Hurricane David in Dominica, 1998 Hurricane Georges in St. Kitts and Nevis, and 2004 Hurricane Ivan in Grenada. Over the past three decades, the 12 most damaging disasters in the region were associated with a median 2.2 percentage point same-year decline in the growth rate of real GDP, which has clearly contributed to output volatility.
10. A second striking feature of the ECCU economies is their dependence on international trade. High openness renders countries vulnerable to volatile international markets and has been found to lead to high output volatility (Easterly and Kraay, 2000). In the ECCU countries the sum of exports and imports is very high at about 130 percent of GDP. Imports alone represent about 70 percent of GDP, reflecting the high dependence of the tourism sector and domestic markets on imported goods.
11. A third source of vulnerability is the lack of economic diversification. A concentrated production structure can be expected to lead to higher output volatility (Jansen (2004) and Mobarak (2004)). In the ECCU the large export sector is heavily dependent on tourism. In addition, a single agricultural crop typically dominates merchandise exports.
12. All the standard indicators of economic vulnerability would suggest that the ECCU economies are among the most vulnerable in the world. A number of studies have sought to synthesize the various variables in a composite vulnerability index, as exemplified in Table II.2. By this measure, all ECCU countries are among the top 30 of the 111 countries considered, with Antigua and Barbuda taking second place.4
3 In this chapter, ECCU6 denotes the six Fund-member countries of the ECCU.
4 Other vulnerability indices have been produced by Briguglio (1992, 1993, 1995, 1997) and Crowards (1998 and 2000). These other indices also consider transport costs and dependence on strategic imports as sources of vulnerability, and the general conclusion is that small island states tend to be more economically vulnerable than other groups of countries.
- 21 -
13. The ECCU countries may also lack resilience to adverse events stemming from a low capacity to absorb shocks. Hausmann and Gavin (1996) find that inflexible exchange rate regimes contribute to higher macroeconomic volatility because of their inability to absorb real shocks. Thus, most of the adjustment must take place via changes in output. From this perspective, the ECCU’s fixed exchange rate regime would be a source of added volatility. Also contributing to low resilience is that even if some relative price movements take place, the responsiveness of tourism tends to be smaller than that of other exports.5 Consequently, countries would find it difficult to expand tourism to compensate for downturns in other parts of the economy. This general tendency may well be especially pronounced in the ECCU, where the dominant form of high-end tourism is widely considered price inelastic.
C. Economic Volatility: Cross-Country Evidence
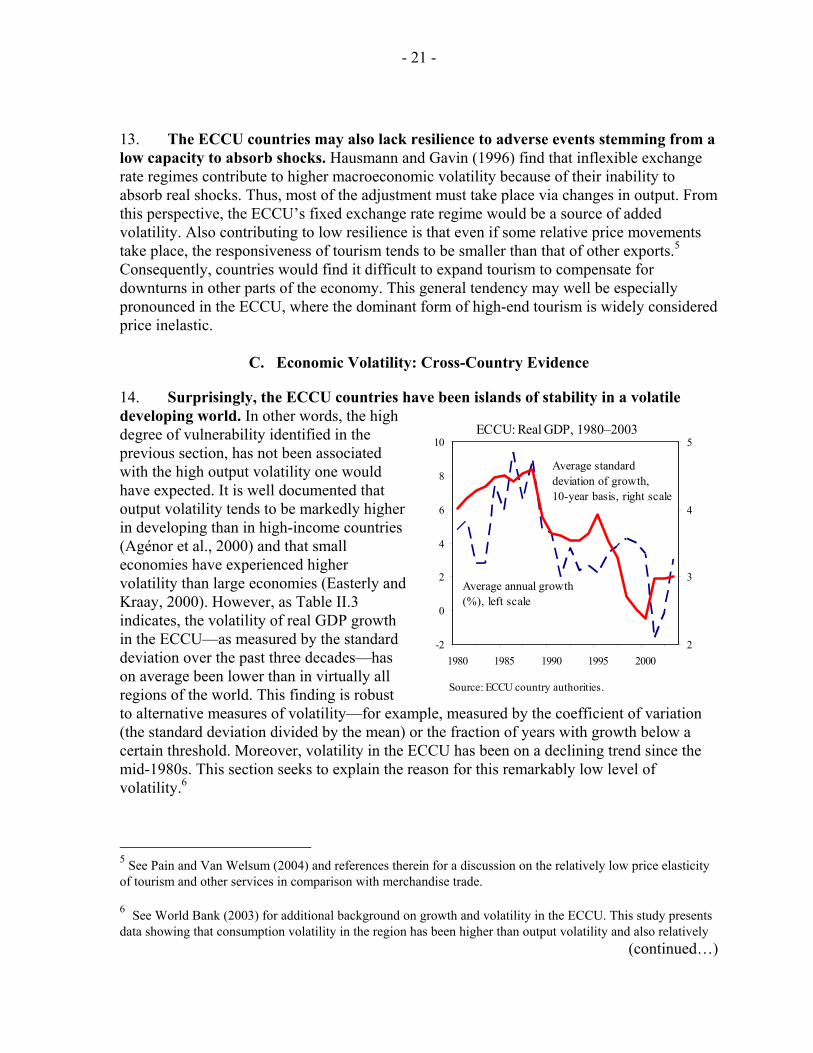
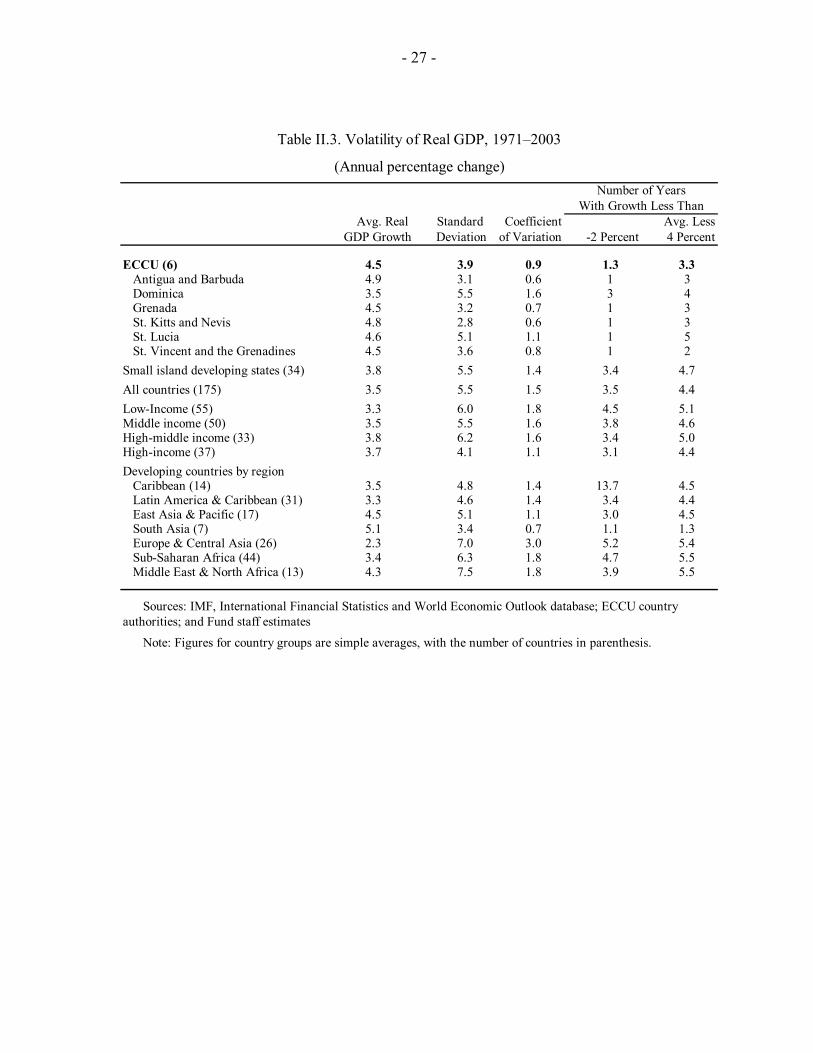
14. Surprisingly, the ECCU countries have been islands of stability in a volatile developing world. In other words, the high degree of vulnerability identified in the previous section, has not been associated with the high output volatility one would have expected. It is well documented that output volatility tends to be markedly higher in developing than in high-income countries (Agénor et al., 2000) and that small economies have experienced higher volatility than large economies (Easterly and Kraay, 2000). However, as Table II.3 indicates, the volatility of real GDP growth in the ECCU—as measured by the standard deviation over the past three decades—has on average been lower than in virtually all regions of the world. This finding is robust to alternative measures of volatility—for example, measured by the coefficient of variation (the standard deviation divided by the mean) or the fraction of years with growth below a certain threshold. Moreover, volatility in the ECCU has been on a declining trend since the mid-1980s. This section seeks to explain the reason for this remarkably low level of volatility.6
5 See Pain and Van Welsum (2004) and references therein for a discussion on the relatively low price elasticity of tourism and other services in comparison with merchandise trade.
6 See World Bank (2003) for additional background on growth and volatility in the ECCU. This study presents data showing that consumption volatility in the region has been higher than output volatility and also relatively
(continued…)
-2
0
2
4
6
8
10
1980 1985 1990 1995 20002
3
4
5
Average annual growth (%), left scale
Average standard deviation of growth, 10-year basis, right scale
ECCU: Real GDP, 1980–2003
Source: ECCU country authorities.
- 22 -
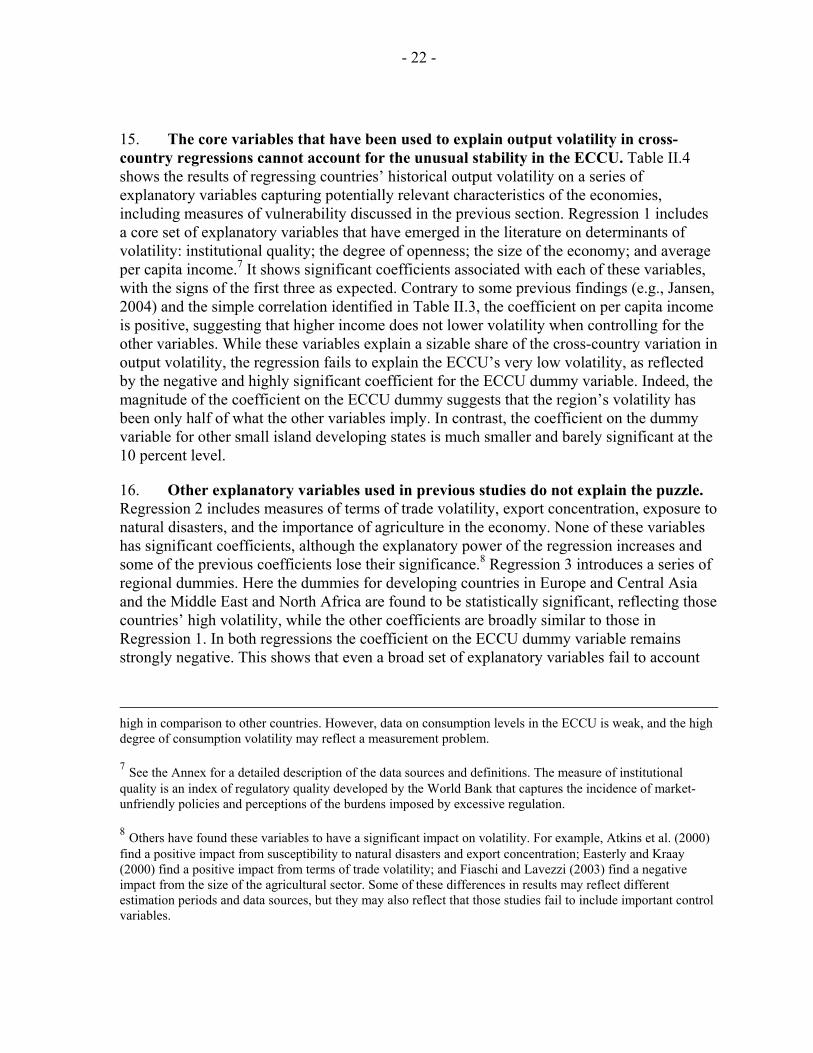
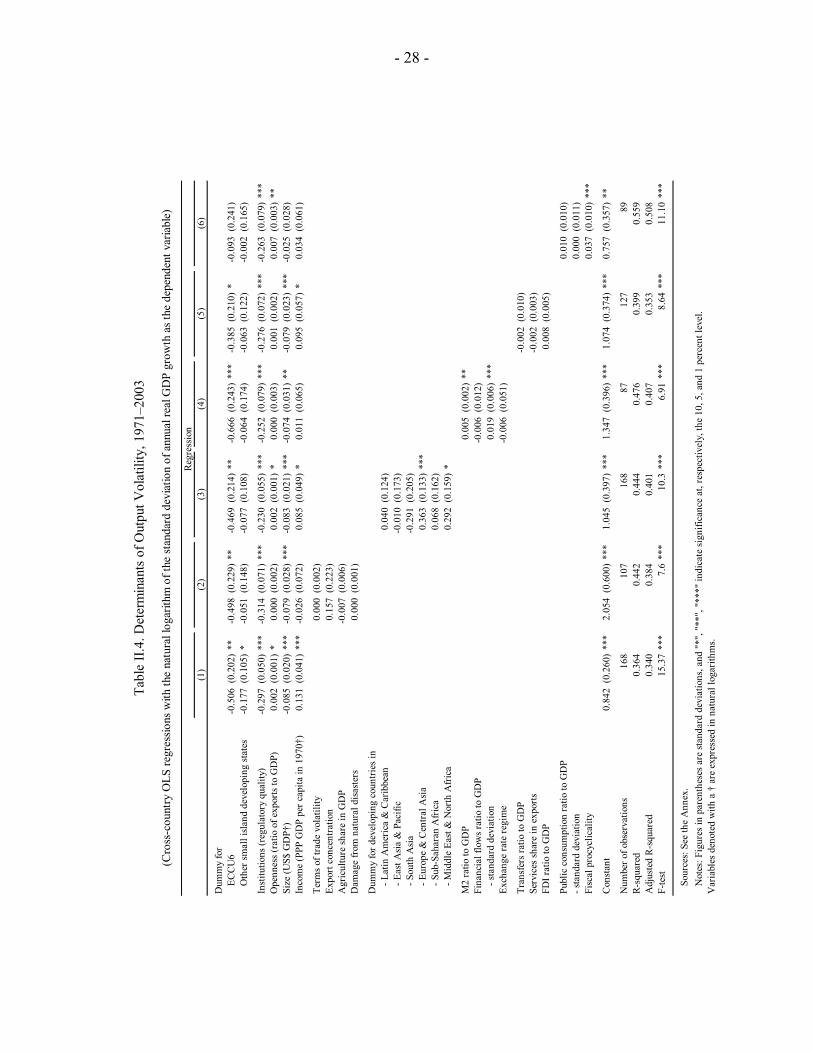
15. The core variables that have been used to explain output volatility in cross-country regressions cannot account for the unusual stability in the ECCU. Table II.4 shows the results of regressing countries’ historical output volatility on a series of explanatory variables capturing potentially relevant characteristics of the economies, including measures of vulnerability discussed in the previous section. Regression 1 includes a core set of explanatory variables that have emerged in the literature on determinants of volatility: institutional quality; the degree of openness; the size of the economy; and average per capita income.7 It shows significant coefficients associated with each of these variables, with the signs of the first three as expected. Contrary to some previous findings (e.g., Jansen, 2004) and the simple correlation identified in Table II.3, the coefficient on per capita income is positive, suggesting that higher income does not lower volatility when controlling for the other variables. While these variables explain a sizable share of the cross-country variation in output volatility, the regression fails to explain the ECCU’s very low volatility, as reflected by the negative and highly significant coefficient for the ECCU dummy variable. Indeed, the magnitude of the coefficient on the ECCU dummy suggests that the region’s volatility has been only half of what the other variables imply. In contrast, the coefficient on the dummy variable for other small island developing states is much smaller and barely significant at the 10 percent level.
16. Other explanatory variables used in previous studies do not explain the puzzle. Regression 2 includes measures of terms of trade volatility, export concentration, exposure to natural disasters, and the importance of agriculture in the economy. None of these variables has significant coefficients, although the explanatory power of the regression increases and some of the previous coefficients lose their significance.8 Regression 3 introduces a series of regional dummies. Here the dummies for developing countries in Europe and Central Asia and the Middle East and North Africa are found to be statistically significant, reflecting those countries’ high volatility, while the other coefficients are broadly similar to those in Regression 1. In both regressions the coefficient on the ECCU dummy variable remains strongly negative. This shows that even a broad set of explanatory variables fail to account
high in comparison to other countries. However, data on consumption levels in the ECCU is weak, and the high degree of consumption volatility may reflect a measurement problem.
7 See the Annex for a detailed description of the data sources and definitions. The measure of institutional quality is an index of regulatory quality developed by the World Bank that captures the incidence of market-unfriendly policies and perceptions of the burdens imposed by excessive regulation.
8 Others have found these variables to have a significant impact on volatility. For example, Atkins et al. (2000) find a positive impact from susceptibility to natural disasters and export concentration; Easterly and Kraay (2000) find a positive impact from terms of trade volatility; and Fiaschi and Lavezzi (2003) find a negative impact from the size of the agricultural sector. Some of these differences in results may reflect different estimation periods and data sources, but they may also reflect that those studies fail to include important control variables.

- 23 -
for the stability of the ECCU output, with Regressions 1–3 all pointing to predicted volatility about double the actual level.
17. Several other factors could explain the relative stability of the ECCU. Part of the explanation may be that the volatility of exports of goods and services has not been particularly high given the lack of diversification (Table II.5). This can be attributed to the relative stability of the large tourism industry and, to a lesser extent, the stable export prices afforded to agricultural exports under preferential trading arrangements. Another possible source of stability is that the ECCU nations have a large diaspora and receive substantial remittances (see Mishra, 2005) that could potentially help offset economic difficulties, although Cashin and Wang (2005) find that such transfers have tended to be procyclical. In addition, the countries receive exceptionally high levels of foreign direct investment, which are relatively stable in comparison to inflows of portfolio investment. Finally, the ECCU countries are highly monetized compared with other developing countries, which may have helped buffer adverse shocks. 18. Accounting for the factors noted in the previous paragraph still leaves unresolved questions. Regression 4 (Table II.4) introduces a series of variables related to the financial sector, and shows the M2-to-GDP ratio and the standard deviation of international financial flows entering with significant positive coefficients. However, after controlling for these factors, the coefficient on the ECCU dummy becomes even more negative. Regression 5 includes measures of the magnitude of service exports, international transfer receipts, and FDI to capture some of the other atypical features of ECCU economies. None of these variables has a significant impact on output volatility, although the coefficient on the ECCU dummy is slightly reduced.
19. The key reason for the relatively low volatility of output in the ECCU appears to have been the counter-cyclical fiscal policy pursued by national governments. Excluding the public sector’s contribution to GDP suggests that private sector output volatility has been relatively high in the ECCU (Table II.6).9 The high level of volatility in the private sector is what one would expect given the high level of vulnerability to external shocks identified in Section B. This suggests that the low level of overall volatility is a result of developments in the public sector.
20. Fiscal policy in the ECCU has been relatively counter-cyclical. Government expenditure in developing countries tends to grow much faster in good times than in bad times (Table II.7). Except for Antigua and Barbuda, this tendency is mostly absent in the ECCU. Indeed, by this measure, fiscal policy in the ECCU has on average been almost as counter-cyclical as in high-income countries.10 The critical importance of fiscal policy is 9 Fiscal data for the ECCU is only available since 1983. However, the pattern of output volatility is broadly the same in the post-1983 period as in the 1971–2003 period considered earlier.
10 The applied measures of cyclicality are from Kaminsky, Reinhart, and Végh (2004).
- 24 -
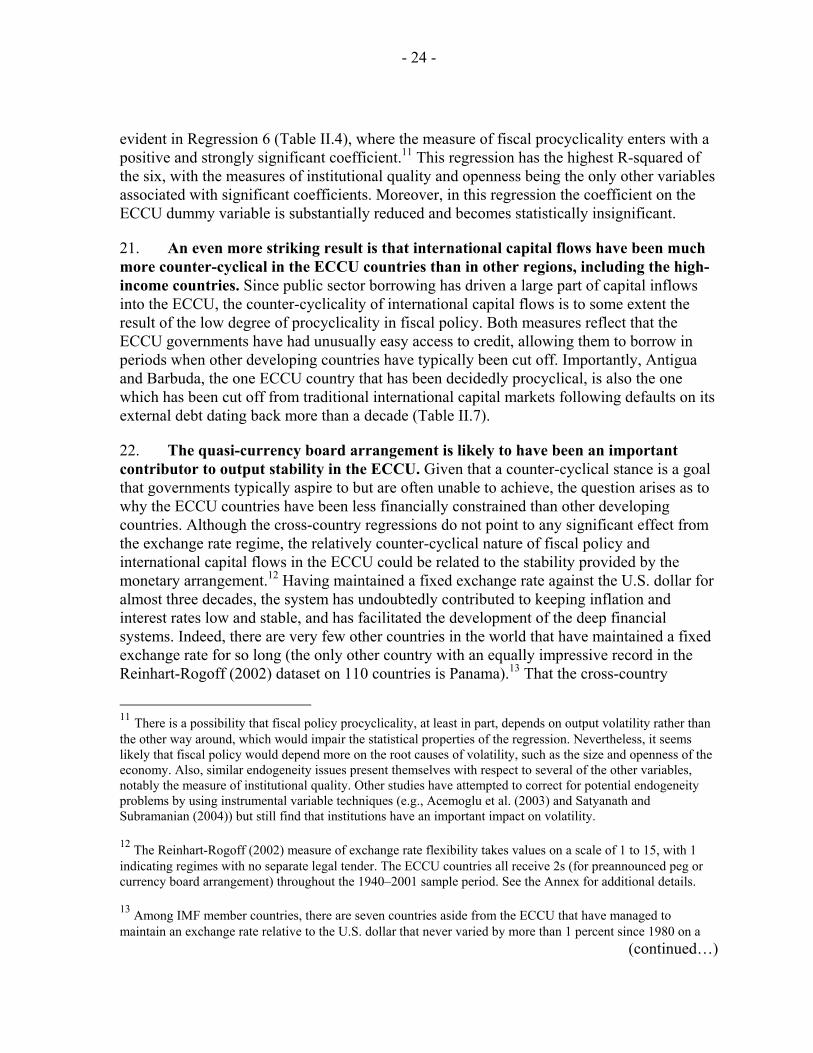
evident in Regression 6 (Table II.4), where the measure of fiscal procyclicality enters with a positive and strongly significant coefficient.11 This regression has the highest R-squared of the six, with the measures of institutional quality and openness being the only other variables associated with significant coefficients. Moreover, in this regression the coefficient on the ECCU dummy variable is substantially reduced and becomes statistically insignificant.
21. An even more striking result is that international capital flows have been much more counter-cyclical in the ECCU countries than in other regions, including the high-income countries. Since public sector borrowing has driven a large part of capital inflows into the ECCU, the counter-cyclicality of international capital flows is to some extent the result of the low degree of procyclicality in fiscal policy. Both measures reflect that the ECCU governments have had unusually easy access to credit, allowing them to borrow in periods when other developing countries have typically been cut off. Importantly, Antigua and Barbuda, the one ECCU country that has been decidedly procyclical, is also the one which has been cut off from traditional international capital markets following defaults on its external debt dating back more than a decade (Table II.7).
22. The quasi-currency board arrangement is likely to have been an important contributor to output stability in the ECCU. Given that a counter-cyclical stance is a goal that governments typically aspire to but are often unable to achieve, the question arises as to why the ECCU countries have been less financially constrained than other developing countries. Although the cross-country regressions do not point to any significant effect from the exchange rate regime, the relatively counter-cyclical nature of fiscal policy and international capital flows in the ECCU could be related to the stability provided by the monetary arrangement.12 Having maintained a fixed exchange rate against the U.S. dollar for almost three decades, the system has undoubtedly contributed to keeping inflation and interest rates low and stable, and has facilitated the development of the deep financial systems. Indeed, there are very few other countries in the world that have maintained a fixed exchange rate for so long (the only other country with an equally impressive record in the Reinhart-Rogoff (2002) dataset on 110 countries is Panama).13 That the cross-country
11 There is a possibility that fiscal policy procyclicality, at least in part, depends on output volatility rather than the other way around, which would impair the statistical properties of the regression. Nevertheless, it seems likely that fiscal policy would depend more on the root causes of volatility, such as the size and openness of the economy. Also, similar endogeneity issues present themselves with respect to several of the other variables, notably the measure of institutional quality. Other studies have attempted to correct for potential endogeneity problems by using instrumental variable techniques (e.g., Acemoglu et al. (2003) and Satyanath and Subramanian (2004)) but still find that institutions have an important impact on volatility.
12 The Reinhart-Rogoff (2002) measure of exchange rate flexibility takes values on a scale of 1 to 15, with 1 indicating regimes with no separate legal tender. The ECCU countries all receive 2s (for preannounced peg or currency board arrangement) throughout the 1940–2001 sample period. See the Annex for additional details.
13 Among IMF member countries, there are seven countries aside from the ECCU that have managed to maintain an exchange rate relative to the U.S. dollar that never varied by more than 1 percent since 1980 on a
(continued…)
- 25 -
regressions do not detect a significant impact of the exchange arrangement may simply reflect that there are very few other countries that have managed to establish such enduring pegs. Also, while a fixed exchange rate may help provide access to credit and thereby facilitate the operation of counter-cyclical forces, the overall impact on output volatility is ambiguous, as the effect of reduced price flexibility identified by Hausmann and Gavin (1996) would work in the opposite direction. Another possible explanation is that, with the exception of Antigua and Barbuda, the countries have (until recently) by and large an excellent record of remaining current on sovereign borrowings, a factor that has been found to be an important determinant of a country’s borrowing capacity (Reinhart et al., 2003).
D. Concluding Remarks
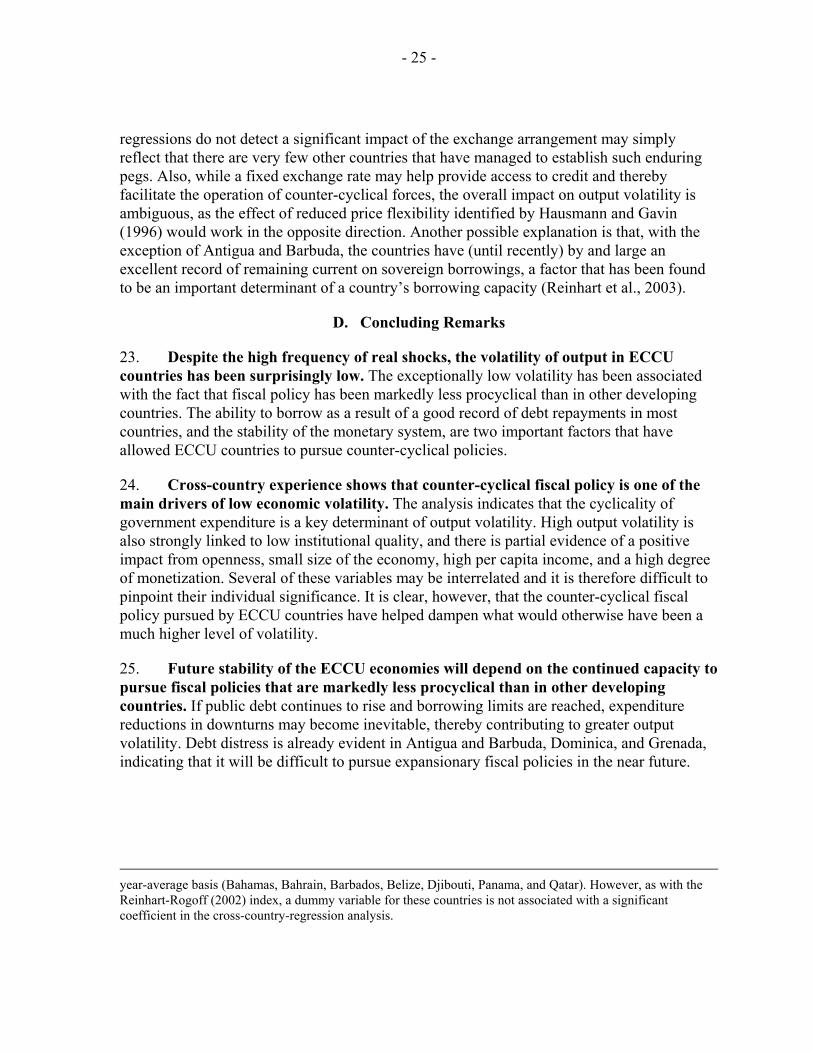
23. Despite the high frequency of real shocks, the volatility of output in ECCU countries has been surprisingly low. The exceptionally low volatility has been associated with the fact that fiscal policy has been markedly less procyclical than in other developing countries. The ability to borrow as a result of a good record of debt repayments in most countries, and the stability of the monetary system, are two important factors that have allowed ECCU countries to pursue counter-cyclical policies.
24. Cross-country experience shows that counter-cyclical fiscal policy is one of the main drivers of low economic volatility. The analysis indicates that the cyclicality of government expenditure is a key determinant of output volatility. High output volatility is also strongly linked to low institutional quality, and there is partial evidence of a positive impact from openness, small size of the economy, high per capita income, and a high degree of monetization. Several of these variables may be interrelated and it is therefore difficult to pinpoint their individual significance. It is clear, however, that the counter-cyclical fiscal policy pursued by ECCU countries have helped dampen what would otherwise have been a much higher level of volatility.
25. Future stability of the ECCU economies will depend on the continued capacity to pursue fiscal policies that are markedly less procyclical than in other developing countries. If public debt continues to rise and borrowing limits are reached, expenditure reductions in downturns may become inevitable, thereby contributing to greater output volatility. Debt distress is already evident in Antigua and Barbuda, Dominica, and Grenada, indicating that it will be difficult to pursue expansionary fiscal policies in the near future.
year-average basis (Bahamas, Bahrain, Barbados, Belize, Djibouti, Panama, and Qatar). However, as with the Reinhart-Rogoff (2002) index, a dummy variable for these countries is not associated with a significant coefficient in the cross-country-regression analysis.
- 26 -
Table II.1. Selected Indicators of Exposure to Exogenous Shocks
Number of Natural Disasters Divided
by Population (Index)
Average Annual Damage from
Natural Disasters (% of GDP)
Imports of Goods and Services
(% of GDP)
Exports of Goods and Services
(% of GDP)
Tourism Receipts
(% of Total Exports)
ECCU6 770 2.0 72 57 48Antigua and Barbuda 883 0.7 84 76 63Dominica 890 3.6 68 53 33Grenada 348 0.7 75 58 39St. Kitts and Nevis 1295 4.0 75 46 39St. Lucia 451 2.0 71 56 74St. Vincent and the Grenadines 755 1.1 61 53 42
Small island developing states 397 1.5 70 57 36All countries 100 0.6 49 44 18Low income 50 0.8 43 33 16Low-middle income 111 0.8 49 40 20High-middle income 213 0.6 53 51 23High income 49 0.1 54 59 14
Sources: IMF, World Economic Outlook database; World Bank, World Development Indicators; EM-DAT;and Fund staff estimates.
Note: The data on natural disasters refer to 1970–2002, all other are for 2000. Figures for countrygroups are unweighted averages.
Table II.2. The Commonwealth Composite Vulnerability Index Rankings
Export Dependence
Export Diversification
Vulnerability to Disasters
Composite Vulnerability Index
Antigua and Barbuda 5 69 7 2Dominica 28 85 13 12Grenada 35 62 17 15St. Kitts and Nevis 16 59 67 29St. Lucia 9 40 37 19St. Vincent and the Grenadines 32 44 43 24
Source: Atkins and others (2000). Note: The composite index is a weighted average of the three variables, where export dependence is measured by exports of goods and services as a fraction of GDP, export diversification is given by the UNCTAD diversification index for merchandise exports, and vulnerability to natural disasters is given by the percent of population affected by disasters. The weights are given by the importance of these variables in determining output volatility. The sample has 111 countries. For each measure, the country deemed the most vulnerable is assigned a ranking of "1".
- 27 -
Table II.3. Volatility of Real GDP, 1971–2003
(Annual percentage change)Number of Years
With Growth Less ThanAvg. Real Standard Coefficient Avg. Less
GDP Growth Deviation of Variation -2 Percent 4 Percent
ECCU (6) 4.5 3.9 0.9 1.3 3.3Antigua and Barbuda 4.9 3.1 0.6 1 3Dominica 3.5 5.5 1.6 3 4Grenada 4.5 3.2 0.7 1 3St. Kitts and Nevis 4.8 2.8 0.6 1 3St. Lucia 4.6 5.1 1.1 1 5St. Vincent and the Grenadines 4.5 3.6 0.8 1 2
Small island developing states (34) 3.8 5.5 1.4 3.4 4.7All countries (175) 3.5 5.5 1.5 3.5 4.4Low-Income (55) 3.3 6.0 1.8 4.5 5.1Middle income (50) 3.5 5.5 1.6 3.8 4.6High-middle income (33) 3.8 6.2 1.6 3.4 5.0High-income (37) 3.7 4.1 1.1 3.1 4.4Developing countries by region
Caribbean (14) 3.5 4.8 1.4 13.7 4.5Latin America & Caribbean (31) 3.3 4.6 1.4 3.4 4.4East Asia & Pacific (17) 4.5 5.1 1.1 3.0 4.5South Asia (7) 5.1 3.4 0.7 1.1 1.3Europe & Central Asia (26) 2.3 7.0 3.0 5.2 5.4Sub-Saharan Africa (44) 3.4 6.3 1.8 4.7 5.5Middle East & North Africa (13) 4.3 7.5 1.8 3.9 5.5
Sources: IMF, International Financial Statistics and World Economic Outlook database; ECCU countryauthorities; and Fund staff estimates
Note: Figures for country groups are simple averages, with the number of countries in parenthesis.
- 28 -
Tabl
e II.
4. D
eter
min
ants
of O
utpu
t Vol
atili
ty, 1
971–
2003
Regr
essi
on(1
)(2
)(3
)(4
)(5
)(6
)
Dum
my
for
ECC
U6
-0.5
06(0
.202
)**
-0.4
98(0
.229
)**
-0.4
69(0
.214
)**
-0.6
66(0
.243
)**
*-0
.385
(0.2
10)
*-0
.093
(0.2
41)
Oth
er sm
all i
slan
d de
velo
ping
stat
es-0
.177
(0.1
05)
*-0
.051
(0.1
48)
-0.0
77(0
.108
)-0
.064
(0.1
74)
-0.0
63(0
.122
)-0
.002
(0.1
65)
Inst
itutio
ns (r
egul
ator
y qu
ality
)-0
.297
(0.0
50)
***
-0.3
14(0
.071
)**
*-0
.230
(0.0
55)
***
-0.2
52(0
.079
)**
*-0
.276
(0.0
72)
***
-0.2
63(0
.079
)**
*O
penn
ess (
ratio
of e
xpor
ts to
GD
P)0.
002
(0.0
01)
*0.
000
(0.0
02)
0.00
2(0
.001
)*
0.00
0(0
.003
)0.
001
(0.0
02)
0.00
7(0
.003
)**
Size
(US$
GD
P†)
-0.0
85(0
.020
)**
*-0
.079
(0.0
28)
***
-0.0
83(0
.021
)**
*-0
.074
(0.0
31)
**-0
.079
(0.0
23)
***
-0.0
25(0
.028
)In
com
e (P
PP G
DP
per c
apita
in 1
970†
)0.
131
(0.0
41)
***
-0.0
26(0
.072
)0.
085
(0.0
49)
*0.
011
(0.0
65)
0.09
5(0
.057
)*
0.03
4(0
.061
)
Term
s of t
rade
vol
atili
ty0.
000
(0.0
02)
Expo
rt co
ncen
tratio
n0.
157
(0.2
23)
Agr
icul
ture
shar
e in
GD
P-0
.007
(0.0
06)
Dam
age
from
nat
ural
dis
aste
rs0.
000
(0.0
01)
Dum
my
for d
evel
opin
g co
untri
es in
- Lat
in A
mer
ica
& C
arib
bean
0.04
0(0
.124
)- E
ast A
sia
& P
acifi
c-0
.010
(0.1
73)
- Sou
th A
sia
-0.2
91(0
.205
)- E
urop
e &
Cen
tral A
sia
0.36
3(0
.133
)**
*- S
ub-S
ahar
an A
fric
a0.
068
(0.1
62)
- Mid
dle
East
& N
orth
Afr
ica
0.29
2(0
.159
)*
M2
ratio
to G
DP
0.00
5(0
.002
)**
Fina
ncia
l flo
ws r
atio
to G
DP
-0.0
06(0
.012
)- s
tand
ard
devi
atio
n0.
019
(0.0
06)
***
Exch
ange
rate
regi
me
-0.0
06(0
.051
)
Tran
sfer
s rat
io to
GD
P-0
.002
(0.0
10)
Serv
ices
shar
e in
exp
orts
-0.0
02(0
.003
)FD
I rat
io to
GD
P0.
008
(0.0
05)
Publ
ic c
onsu
mpt
ion
ratio
to G
DP
0.01
0(0
.010
)- s
tand
ard
devi
atio
n0.
000
(0.0
11)
Fisc
al p
rocy
clic
ality
0.03
7(0
.010
)**
*
Con
stan
t0.
842
(0.2
60)
***
2.05
4(0
.600
)**
*1.
045
(0.3
97)
***
1.34
7(0
.396
)**
*1.
074
(0.3
74)
***
0.75
7(0
.357
)**
Num
ber o
f obs
erva
tions
168
107
168
8712
789
R-sq
uare
d0.
364
0.44
20.
444
0.47
60.
399
0.55
9A
djus
ted
R-sq
uare
d0.
340
0.38
40.
401
0.40
70.
353
0.50
8F-
test
15.3
7**
*7.
6**
*10
.3**
*6.
91**
*8.
64**
*11
.10
***
Sour
ces:
See
the
Ann
ex.
Not
es: F
igur
es in
par
enth
eses
are
stan
dard
dev
iatio
ns, a
nd "
*", "
**",
"**
*" in
dica
te si
gnifi
canc
e at
, res
pect
ivel
y, th
e 10
, 5, a
nd 1
per
cent
leve
l.V
aria
bles
den
oted
with
a †
are
exp
ress
ed in
nat
ural
loga
rithm
s.
(Cro
ss-c
ount
ry O
LS re
gres
sions
with
the
natu
ral l
ogar
ithm
of t
he st
anda
rd d
evia
tion
of a
nnua
l rea
l GD
P gr
owth
as t
he d
epen
dent
var
iabl
e)
- 29 -
Table II.5. Selected Indicators
St. Deviation of US$ Export
GrowthServices Share
in Total Exports
Private Current
Transfers
Foreign Direct
Investment Broad Money
(M2)(% per year) (%) (% of GDP) (% of GDP) (% of GDP)
ECCU6 20 55 4.7 9.9 60Antigua and Barbuda 36 75 3.9 5.3 67Dominica 18 38 4.2 7.2 46Grenada 14 62 5.3 6.9 78St. Kitts and Nevis 21 47 8.1 16.8 65St. Lucia 17 57 2.6 7.5 52St. Vincent and the Grenadines 13 52 4.3 15.4 52
Small island developing states 23 45 3.9 6.2 52All countries 22 26 2.4 4.6 43Low-income 26 22 3.7 5.1 25Low-middle income 21 26 4.2 3.8 44High-middle income 22 32 1.0 5.4 52High-income 17 26 -0.8 4.3 68
Sources: IMF, World Economic Outlook database.Note: The data refer to 1971–2003, except for current transfers and FDI which are averages over
1995–2003.
Table II.6. Indicators of Economic Volatility, 1984–2002 (Standard Deviations)
Real Government "Private" Real GDP Growth Expenditure GDP Growth(% per year) (% of GDP) (% per year) 1/
ECCU6 3.7 4.8 8.0Antigua and Barbuda 3.5 3.4 4.9Dominica 3.3 4.4 8.3Grenada 3.6 7.6 12.0St. Kitts and Nevis 3.0 8.0 9.8St. Lucia 5.0 2.5 6.6St. Vincent and the Grenadines 3.8 2.5 6.3
Small island developing states 4.7 3.9 6.8Low income 5.4 4.0 6.5Low-middle income 5.3 3.2 6.3High-middle income 5.6 4.0 6.7High-income 3.3 2.3 4.2
Sources: IMF, International Financial Statistics and World Economic Outlook database; ECCU country Authorities; and Fund staff estimates.
1/ Defined as the change in y (1-g ), where y is the index of real GDP and g is government expenditure as a share of GDP.
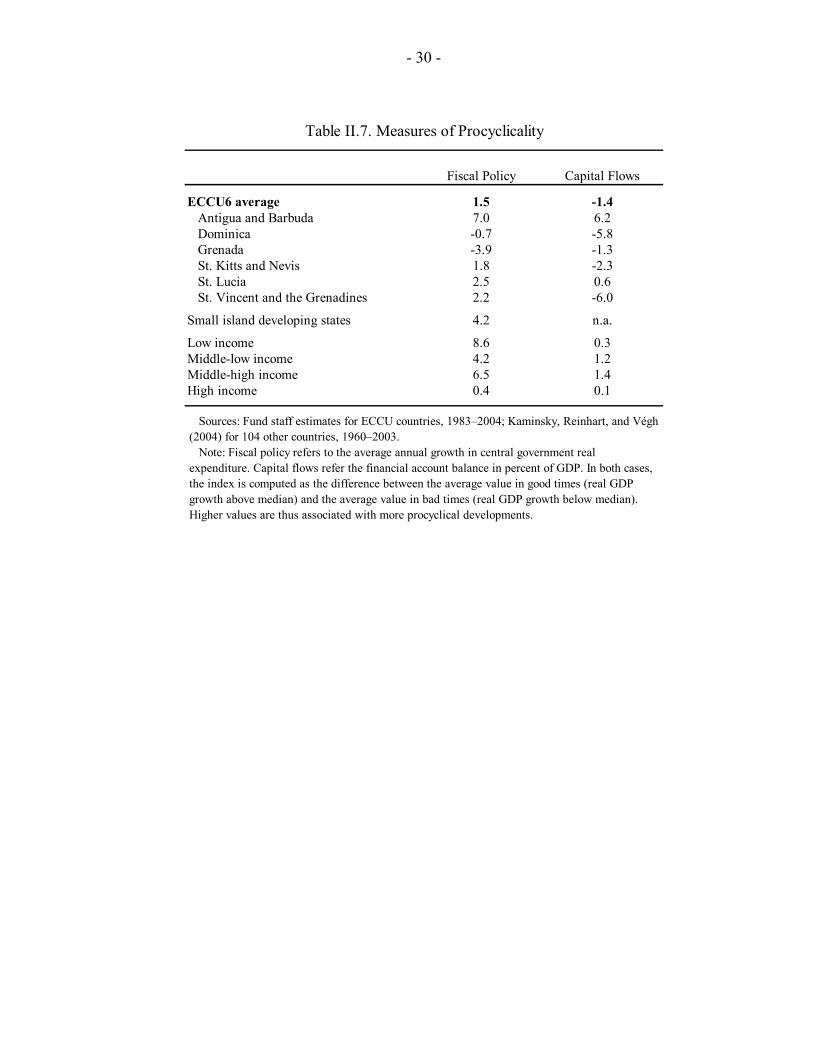
- 30 -
Fiscal Policy Capital Flows
ECCU6 average 1.5 -1.4Antigua and Barbuda 7.0 6.2Dominica -0.7 -5.8Grenada -3.9 -1.3St. Kitts and Nevis 1.8 -2.3St. Lucia 2.5 0.6St. Vincent and the Grenadines 2.2 -6.0
Small island developing states 4.2 n.a.
Low income 8.6 0.3Middle-low income 4.2 1.2Middle-high income 6.5 1.4High income 0.4 0.1
Table II.7. Measures of Procyclicality
Sources: Fund staff estimates for ECCU countries, 1983–2004; Kaminsky, Reinhart, and Végh (2004) for 104 other countries, 1960–2003. Note: Fiscal policy refers to the average annual growth in central government real expenditure. Capital flows refer the financial account balance in percent of GDP. In both cases, the index is computed as the difference between the average value in good times (real GDP growth above median) and the average value in bad times (real GDP growth below median). Higher values are thus associated with more procyclical developments.
- 31 - ANNEX
DATA SOURCES Real GDP Country authorities for data on the ECCU. Otherwise, International Financial Statistics (series
...99BVPZF...) where available, and else World Economic Outlook (WEO) database (series W...NGDP_R).
Size Gross domestic product, current prices, U.S. dollars from WEO (series W...NGDPD). Values used are the average levels over 1971–2003.
Income PPP per capita from WEO (series W...PPPPC). Values used are the levels in 1970. Institutions Regulatory quality from the World Bank’s Worldwide Governance Research Indicators Dataset.
Scores range between -2.5 (worst) and +2.5 (best). Values used are average scores for 1996-2002.
Openness Ratio of exports of goods and services to GDP, both in U.S. dollars, from WEO (series W...TX and W...NGDPD). Values used are the average levels over 1971–2003.
Terms of Trade Volatility
Terms of trade, goods & services index from WEO (series W...TT). Values used are the standard deviations over 1971–2003.
Export Concentration
Concentration of exports (goods only) index from UNCTAD. Values used are the levels in 2000.
Agriculture Share in GDP
Agriculture, value added (% of GDP) from World Development Indicators (series ... NVAGRTOTLZS). Values used are the average levels over 1971–2003, including countries with partial series if there are at least 10 observations.
Damage from Natural Disasters
Cumulative damage in percent of GDP as reported in Rasmussen (2004) based on EM-DAT data.
M2 ratio to GDP
Broad money and GDP, both in national currency, from WEO (series W...FMB and W...NGDP). Values used are the average levels over 1971–2003.
Financial flows ratio to GDP
Financial account balance and GDP, both in US$, from WEO (series W...BF and W...NGDPD). Values used are the average levels over 1971–2003, and the standard deviation over the same period.
Exchange Rate Regime
Coarse annual classification by Reinhart and Rogoff (2002) available at http://www.wam.umd.edu/~creinhar/Links.html. Values used are the average levels over 1970–2002.
Transfers Ratio to GDP
Current private transfers and GDP, both in US$, from WEO (series W...BTRP and W...NGDPD). Values used are the average levels over 1995–2003.
Services Share in Exports
100 minus export of goods in percent of value of exports of goods & services, both in US$, from WEO (series W...BXG and W...TX). Values used are the average levels over 1971–2003.
FDI Ratio to GDP
Direct investment in reporting economy in percent of GDP, both in US$, from WEO (series W...BFDI and W...NGDPD). Values used are the average levels over 1995–2003
Public Consumption Ratio to GDP
Public consumption expenditure in percent of GDP, both in national currency, from WEO (series W...NCG and W...NGDP). Values used are the average levels over 1971–2003, and the standard deviation over the same period.
Fiscal Procyclicality
From Kaminisky, Reinhart, and Végh (2004), augmented with own calculation for the ECCU countries using the same methodology based on data from ECCU country authorities.
Country Classification
Income classification according to World Bank (http://www.worldbank.org/data/countryclass/classgroups.htm), regional classification according to World Bank (http://www.worldbank.org/data/countryclass/classgroups.htm), and small island developing states according to Small Island Developing States Network (http://www.sidsnet.org/docshare/other/20040219161354_sids_statistics.pdf)
- 32 -
REFERENCES Acemoglu, D. and F. Zilbotti, 1997, “Was Prometheus Unbound by Chance? Risk,
Diversification, and Growth,” The Journal of Political Economy, Vol. 105, pp. 709-51.
Acemoglu, D., S. Johnson, J. Robinson, and Y. Thaisharown, 2003, “Institutional Causes,
Macroeconomic Symptoms: Volatility, Crises and Growth,” Journal of Monetary Economics, Vol. 50, pp. 49–123.
Agénor, P., C. J. McDermott, and E. Prasad, 2000, “Macroeconomic Fluctuations in
Developing Countries: Some Stylized Facts,” The World Bank Economic Review, Vol. 14, pp. 251–85.
Atkins, J. P., S. Mazzi, and C. D. Easter, 2000, A Commonwealth Vulnerability Index for
Developing Countries: The Position of Small States (London: Commonwealth Secretariat).
Berezin, P., A. Salehizadeh, and E. Santana, 2002, “The Challenge of Diversification in the
Caribbean,” IMF Working Paper WP/02/196 (Washington, DC: International Monetary Fund).
Briguglio, L., 1992, Preliminary Study on the Construction of an Index for Ranking
Countries According to their Economic Vulnerability (Geneva: UNCTAD). Briguglio, L., 1993, “The Economic Vulnerabilities of Small Island Developing States,”
Study commissioned by CARICOM for the Regional Technical Meeting of the Global Conference on the Sustainable Development of Small Island Developing States, Port of Spain, Trinidad and Tobago, July 1993.
Briguglio, L., 1995, “Small Island States and their Economic Vulnerabilities,” World
Development, Vol. 23, pp. 1615–32. Briguglio, L., 1997, “Alternative Economic Vulnerability Indices for Developing Countries,”
Report prepared for the Expert Group on Vulnerability Index, United Nations Department of Economic and Social Affairs-UN(DESA), December 1997.
Cashin, P. and P. Dyczewski, 2005, “Government Responses to Natural Disasters in the
Caribbean,” in Eastern Caribbean Currency Union—Selected Issues, Chapter III. Cashin, P. and P. Wang, 2005, “Macroeconomic Fluctuations in the ECCU,” in Eastern
Caribbean Currency Union—Selected Issues, Chapter I.
- 33 -
Crowards, T. and W. Coulter, 1998, “Economic Vulnerability in the Developing World with Special Reference to the Caribbean,” Working Paper (Bridgetown, Barbados: Central Bank of Barbados).
Crowards, T., 2000, “An Index of Inherent Economic Vulnerability of Developing
Countries,” Staff Working Paper No. 6/00 (Bridgetown, Barbados: Caribbean Development Bank).
Duttagupta, R. and G. Tolosa, 2005, “Fiscal Policy in a Regional Currency Union,” in
Eastern Caribbean Currency Union—Selected Issues, Chapter IV. Easterly, W., R. Islam, and J. Stiglitz, 2000, “Shaken and Stirred: Explaining Growth
Volatility,” in Annual Bank Conference on Development Economics, ed. by B. Pleskovic and N. Stern (Washington, DC: The World Bank)
Easterly, W. and A. Kraay, 2000, “Small States, Small Problems? Income, Growth, and
Volatility in Small States,” World Development, Vol. 28, pp. 2013–27. Fiaschi, D. and A. Lavezzi, 2003, “On the Determinants of Growth Volatility: a
Nonparametric Approach,” University of Pisa Discussion Paper No. 25 (Pisa, Italy: University of Pisa).
Hausmann, R. and M. Gavin, 1996, “Securing Stability and Growth in a Shock Prone
Region: The Policy Challenge for Latin America,” IADB Working Paper No. 315 (Washington, DC: Inter-American Development Bank).
Jansen, M., 2004, Income Volatility in Small and Developing Economies: Export
Concentration Matters (Geneva, Switzerland: World Trade Organization). Kaminsky G., C. Reinhart, and C. Végh, 2004, “When it Rains, it Pours: Procyclical Capital
Flows and Macroeconomic Policies,” NBER Working Paper No. 10780 (Cambridge, MA: National Bureau of Economic Research).
Mishra, P., 2005, “Emigration and the Brain Drain: Evidence from the Caribbean,” in
Eastern Caribbean Currency Union—Selected Issues, Chapter VI. Mobarak, A., 2004, “Determinants of Volatility and Implications for Economic
Development,” Working Paper (Boulder Colorado, University of Colorado at Boulder).
Pain, N. and D. Van Welsum, 2004, “International Production Relocation and Exports of
Services,” Working Paper (London: The National Institute of Economic and Social Research).
- 34 -
Pallage, S. and M. Robe, 2003, “On the Welfare Cost of Economic Fluctuations in Developing Countries,” International Economic Review, Vol. 44, pp. 677–98.
Pritchett, L., 2000, “Understanding Patterns of Economic Growth: Searching for Hills
Among Plateaus, Mountains, and Plains,” World Bank Economic Review, Vol. 14, pp. 221-50.
Ramey, G. and V. Ramey, 1995, “Cross-Country Evidence on the Link between Volatility
and Growth,” American Economic Review, Vol. 85, pp. 1138–51. Reinhart, C. M., K. Rogoff, and M. Savastano, 2003, “Debt Intolerance,” NBER Working
Paper No. 9908 (Cambridge, MA.: National Bureau for Economic Research). Rasmussen, T., 2004, “Macroeconomic Implications of Natural Disasters in the Caribbean,”
IMF Working Paper WP/04/224 (Washington, DC: International Monetary Fund). Reinhart, C. and K. Rogoff, 2002, “The Modern History of Exchange Rate Arrangements: A
Reinterpretation,” NBER Working Paper 8963 (Cambridge, MA: National Bureau of Economic Research).
Satyanath, S. and A. Subramanian, 2004, “What Determines Long-Run Macroeconomic
Stability? Democratic Institutions,” IMF Working Paper WP/04/215 (Washington, DC: International Monetary Fund).
World Bank, 2003, “Caribbean Economic Overview 2002: Macroeconomic Volatility,
Household Vulnerability, and Institutional Responses,” Report No 24165-LAC (Washington, DC: World Bank).
- 35 -
III. GOVERNMENT RESPONSES TO NATURAL DISASTERS IN THE CARIBBEAN1
A. Introduction 1. Economic vulnerability in the Caribbean region is extremely high. A major driver of the region’s vulnerability has been its exposure to external shocks generated by natural disasters—over the last three decades, all of the six Eastern Caribbean Currency Union countries ranked in the top ten in the world in terms of natural disaster events per square mile (see Table III.1). Despite this demonstrated susceptibility to natural disasters, Caribbean risk mitigation activities have been limited and the region’s risk-transfer markets are generally weak.2 3 As a result, natural disasters have a large negative impact on economic activity and poverty in the Caribbean. This chapter briefly sets out the major channels through which small, disaster-prone countries can respond to the challenges posed by natural disasters, with an emphasis on options for ameliorating disaster risk in the Caribbean.
B. Disaster Risk Mitigation 2. At the government level, there are three main responses to the economic vulnerability induced by natural disasters, and obtaining needed post-reconstruction funds: • Risk identification and risk reduction focus on reducing the effects of a disaster should
one occur. Proper risk identification occurs through hazard data collection and mapping, and vulnerability and risk assessments. Similarly, risk reduction activities can tackle revealed vulnerabilities through broad programs of disaster mitigation and preparedness, such as by strengthening and relocating structures, retrofitting existing structures, and implementing and enforcing land use codes and building standards.4 Such activities are
1 Prepared by Paul Cashin and Pawel Dyczewski.
2 A disaster is the realization of risk (the potential for significant loss), requiring the presence of a hazard, and the vulnerability of physical and human capital to that hazard. While the Caribbean region is the most disaster-prone in the world, there are significant differences in disaster (typically hurricane) exposure within the region (see Rasmussen, 2004). Traditionally, the Leeward Islands (St. Kitts and Nevis, Anguilla, Montserrat, and Antigua and Barbuda) are more exposed to hurricanes than the northern Windward Islands (St. Lucia, Dominica) and Barbados, which in turn are more exposed than the southern Windward Islands (Grenada, St. Vincent and the Grenadines) and Trinidad and Tobago.
3 Cashin (2004) finds that Caribbean output volatility is about twice that of the United States, while Auffret (2003) attributes much of this excessive Caribbean volatility to exogenous natural disaster shocks.
4 Economic diversification and restructuring economies away from disaster-prone activities, while being a traditional means of risk mitigation, is a much more difficult challenge in geographically-small island economies with economic agents subject to covariant disaster risk.
- 36 -
important as they can sharply (and permanently) reduce disaster risk exposure, and assist in lowering the cost of risk transfer mechanisms by reducing the underlying structural risk of physical assets. Organizations such as USAID, the European Union, the Caribbean Development Bank and the World Bank have funded a series of disaster mitigation initiatives in the region in recent decades.
• Self-insurance, which involves the attainment of economy-wide insurance through the intertemporal transfer of national resources. A typical example might involve the accretion of a precautionary saving fund (based on actuarial probabilities) to draw down upon in the event of a disaster.5 For many developing countries, the first response to a natural disaster involves the diversion of revenue sources from development expenditure to disaster relief and reconstruction, as has been the experience in Grenada in 2004 following Hurricane Ivan; other forms of self-insurance involve domestic borrowing and tapping external saving (through borrowing and remittance flows).6
• Risk transfer, which involves the transfer of resources across states of nature. Risk transfer mechanisms can, in principle, provide a valuable channel for the provision of capital for rapid rehabilitation and reconstruction of public and private assets. There are several types of risk transfer mechanisms: external assistance, through sovereign debt relief and official development assistance; market insurance and reinsurance, which can provide replacement coverage for public and private assets beyond the capacity of self-insurance; insurance risk pooling, whereby geographical or cross-industry pooling lowers the high cost of disaster risk insurance emanating from the correlation of disaster risks; capital-market based risk transfer instruments, such as catastrophe bonds, catastrophe options, or weather-related derivatives; contingent lines of credit, whereby large sums of credit are made available to insurers and banks in the event of a large disaster on the basis of the payment of an annual commitment fee; and changes in the composition and structure of public borrowing, which could promote risk-sharing between debtors and creditors.
3. Some developing countries have undertaken ex ante measures, such as the establishment of disaster funds, to draw upon in the event of a natural disaster.7 These 5 However, contingency funds maintained in liquid accounts offer a lower rate of return than that typically earned on alternative investment of such funds, and there may be political difficulties in maintaining annual commitments and protecting accumulated funds (Benson and Clay, 2003).
6 Reconstruction financed by borrowing does increase national public debt, but typically does not increase a country’s ability to service its debt. In addition, the majority of the six Fund members of the ECCU have public debt stocks which are extremely high. Reliance on debt-financed disaster reconstruction is not an optimal policy for highly-indebted, disaster-prone countries.
7 In 1996 Mexico established the Fund for Natural Disasters (FONDEN), which is an annual budgetary allocation designed to meet post-disaster expenditures. The fund is designed to finance the repair of uninsured infrastructure, restore the productivity of affected low-income farmers, and for disaster relief activities
(continued…)
- 37 -
funds are based on the principle that as self-insurers, governments should garner sufficient funds to cope with disasters. As a useful rule of thumb, such calamity funds should concentrate on absorbing catastrophic risks that cannot be readily transferred—in particular, the disaster-related damage caused to farmers, the under- (non-) insured, and the poor. While budgets in Caribbean countries do make provision for disasters, it is typically not to provide resources for disaster funds, but for current expenditure on emergency relief and disaster response activities.
4. As a self-insurance strategy, diversification of labor income through emigration and remittances are useful means to insure against covariant risk arising from natural disasters. The Caribbean region displays the highest emigration rate in the world—about 12 percent of the labor force of the region migrated to OECD countries during the 1970-2000 period (Mishra, 2005). The Caribbean region is also the largest recipient of remittances (in proportion to its GDP) in the world. Remittances to the region were about 10 percent of regional GDP in 2002, an amount much larger than overseas development assistance and foreign direct investment flows. It has been pointed out in the literature that remittances play a critical role in insurance and reducing consumption vulnerability arising from shocks.8
C. Implications and Weaknesses of the Caribbean Natural Disaster Management Approach
5. The catastrophe insurance industry faces higher risks and less developed means of risk assessment than other types of insurance, resulting in higher and more variable premiums. Generally, insurance premiums transfer risk across time and space using well defined techniques for risk assessment. Insurance premiums are calculated based on three main factors: the probability distributions of adverse events, the structural vulnerability of the insured assets, and the value of such assets.9 Unfortunately, because catastrophic events are by definition rather rare and very severe, there is a limited actuarial base available for
(particularly in rural areas). However, FONDEN was insufficiently capitalized to accomplish its multiple obligations, and was recapitalized with the assistance of the World Bank in 2002. In addition, it is important to bear in mind that public commitment to extend disaster coverage to private assets reduces the incentive for economic agents to purchase risk transfer instruments.
8 Evidence from econometric analysis using panel data from 1980–2002 for 13 Caribbean countries indicates that while there is weak support for a contemporaneous insurance motive, the insurance effect does occur with a lag of two years. A 1 percent decrease in real GDP is associated with an increase in remittances of about 3 percent, following a two-year lag. There is also evidence that countries with higher remittances have lower volatility of real private consumption, a result that is consistent with the insurance motive (Mishra, 2005).
9 Typically, only certain public assets are insured in most Caribbean countries: key public buildings, as well as some hospitals and airports. Catastrophe insurance is more common in insuring hotels and private tourism infrastructure. While there is no compulsory insurance coverage in the eastern Caribbean, catastrophe cover (involving all natural hazards) is typically required in securing a mortgage.
- 38 -
calculating probability distributions and intensities of future catastrophic events. As a result, catastrophe insurance must compensate for this uncertainty factor with higher premiums. Hence, the premiums for catastrophe insurance are proportionally higher than the probability of the insured events. When catastrophic events happen with greater than anticipated frequency (such as hurricanes and earthquakes in the mid-1990s), insurance companies (particularly reinsurance companies) respond with increased premiums, especially for vulnerable regions. For instance, Caribbean countries faced 200 to 300 percent higher insurance premiums in 1992 after Hurricane Andrew in Florida and in 1994 after the Northridge earthquake in California. 6. National and regional disaster contingency funds are too small to meet financing needs following a disaster. High reliance on donor emergency assistance throughout the Caribbean region adversely affects the creation of any sizeable contingency funds. In the ECCU, the Eastern Caribbean Central Bank has created a fiscal reserve fund for all member countries in economic difficulties (including those caused by disasters), with contributions sourced from each country’s share of central bank profits. However, the fund’s small size is insufficient for major disaster relief. Another contingency fund for the region is the Disaster Mitigation Facility for the Caribbean (DMFC). In 2001, with support from the USAID Office of Foreign Disaster Assistance, the Caribbean Development Bank (CDB) established the DMFC, marking an important step toward the promotion and coordination of risk management within the region. Activities of the DMFC include support for strengthened building standards and enforcement mechanisms, and assistance to member countries with the development of national-level risk management policies and plans.
7. Traditional insurance markets in the Caribbean are characterized by relatively concentrated coverage, high prices and low risk transfer. According to a World Bank study (Pollner, 2001), the proportion of residential and commercial properties in the Caribbean covered by traditional insurance is significantly higher (at around 2.3 percent of GDP) than in other developing countries. Relative to population size, the Caribbean enjoys one of the highest densities of insurance companies—one company per 14,000 inhabitants versus one per 107,000 inhabitants for the United States. This translates into an overcrowded industry with an average insurance company writing barely over US$1 million in premiums, less than 1 percent of a comparative United States insurance company. In such a market, most Caribbean insurance companies act as mere agencies of large reinsurance companies (transferring some 70 percent of premiums and risks to reinsurers in Europe and the United States), rather than genuine underwriters. The cost of reinsurance in the Caribbean is high, largely due to the small capitalization of local insurers, and the high exposure of the region to disasters. Further complicating this situation is the insurance industry’s almost exclusive focus on medium to large dwellings and private businesses. Most low-income households, small businesses and public infrastructure in the region remain uninsured. It is estimated that
- 39 -
between 25 and 40 percent of the dwellings in the region are uninsured (and largely uninsurable)—the great majority of them belonging to the above groups.10
8. While the regulatory framework for insurers in the Caribbean is generally adequate, the specifics of the Caribbean insurance market necessitate reforms aiding market consolidation. National governments regulate insurance markets in the Caribbean, and most Caribbean countries have adopted European insurance regulations, including registration requirement and capital requirements. However, due to fragmentation of the Caribbean insurance market, the expense ratios of insurance companies are high by international standards. The resulting situation prevents adequate build up of capital, and makes local insurance companies more vulnerable. Furthermore, the tax systems of some Caribbean countries discourage insurers from setting up specific reserve provisions prior to catastrophic events. Another limitation of insurance market fragmentation is the unwillingness of local companies to insure special risk categories, such as power utilities or major hotels and tourist resorts. Regulations increasing minimum capital requirement and tighter solvency ratios could contribute to industry consolidation and wider insurance coverage in the region.
9. Ex-post financing of damage following natural disasters by international financial institutions and bilateral donor assistance has provided the largest pool of funds for rehabilitation and reconstruction in disaster-affected Caribbean countries. The World Bank has supported natural disaster reconstruction projects across the region, and in recent years has expanded its investments in disaster mitigation projects in members of the Organization of Eastern Caribbean States (OECS).11 Similarly, since 1962, the IMF has provided assistance on nonconcessional terms to 26 member countries afflicted by 29 separate natural disasters (Table II.2) through its Emergency Assistance for Natural Disasters (ENDA) policy. Since January 2005, PRGF-eligible Fund members can access this facility at concessional rates (an interest rate of ½ of 1 percent per year), with the interest subsidies financed by grant contributions from bilateral donors.12 A higher amount of resources can be accessed under other IMF facilities, such as the Stand-By and PRGF arrangements, but they
10 Auffret (2003) confirms that Caribbean catastrophe insurance premiums represented about 1.5 percent of GDP over the period 1970–99, while average (insured and uninsured) losses were only about 0.5 percent of GDP. Both would be equal under actuarially-fair pricing, and confirm that the price of catastrophe insurance in the Caribbean is ‘high.’
11 Worldwide, the World Bank has funded post-disaster reconstruction projects in the 1980s and 1990s totaling over US$14 billion, concentrating on repairs to transportation infrastructure, energy systems, and essential social services.
12 As of April 30, 2005, four countries—Grenada, Malawi, Maldives and Sri Lanka—have outstanding purchases under the Fund’s ENDA policy. Both Grenada and Malawi have accessed ENDA at subsidized rates of interest.
- 40 -
are slower to disburse, subject to conditionality, and not geared toward the specific financing problems induced by natural disasters.
10. While most Caribbean countries have looked to international financial institutions and bilateral donor agencies for assistance to recover from disasters, it is rather uncommon for such flows to fully offset the losses incurred. This shortfall has largely arisen due to stagnation in the level of resources available from international donors.13 Overseas development assistance (ODA) flows from developed countries to developing countries have fallen in real terms since the early 1980s, with average ODA flows to ECCU countries having declined from 11 percent of ECCU GDP in the 1980s to less than 5 percent of ECCU GDP in the period 2000–03. Of this shrinking amount, an increasing proportion has been allocated to post-disaster reconstruction.
11. External assistance from the international community has typically been made available without any conditions on undertaking disaster mitigation measures, thereby creating moral hazard problems. As a result, development institutions (both multilateral and bilateral) have served, in effect, as reinsurers of last resort. In addition, given that international financial institutions (IFIs) and bilateral donors find it difficult to commit not to provide such assistance, moral hazard arises as there is then little incentive for disaster-affected countries to undertake disaster mitigation investments, or self-insure against future disasters. A useful option for IFIs would be to provide disaster-related lines of credit, with access contingent on the ex ante undertaking of disaster mitigating activities.
12. In spite of the existence of risk-transfer mechanisms, very few developing country governments use them to reduce the resource gap (defined as the difference between funds available and needed for post-disaster reconstruction expenditure). The size of the resource gap rises with the probability of adverse events—the gap for 1-in-20-year events (5 percent probability of occurrence) is typically smaller than that for 1-in-100-year events (1 percent probability of occurrence). Unfortunately, little reconstruction funding is provided by traditional insurance in Caribbean countries. In addition, sovereigns rarely purchase disaster insurance, and typically do not insure public assets, while catastrophe bonds and weather derivatives issued by developing country sovereigns are nonexistent. At present, the major channels for resource flows for post-disaster expenditure typically involve: external aid flows; reallocation of budget expenditures; increased domestic credit (chiefly through local commercial banks); redirection of existing loans from IFIs; and additional external commercial or IFI credit.
13 A study of Dominica in the year following the 1995 hurricane season (during which it was hit with two hurricanes and a tropical storm) revealed that grants and loans pledged constituted about 40 percent of storm damage. Similarly, pledges received following Hurricane Ivan’s devastation of Grenada in 2004 amounted to about 20 percent of storm damage.
- 41 -
D. Scope for Improved Disaster Management
13. Transferring catastrophic risks to the capital market has been effectively used in some countries as means of spreading risk, stabilizing the insurance market, and increasing insurance coverage. Given the capital constraints of reinsurance companies (and the resulting fluctuations in catastrophe insurance rates), as well as domestic risk aversion of local insurers, there is scope for seeking additional risk bearing capacity in capital markets. Securitization of catastrophe risk into marketable financial securities is one such solution, and several instruments have been actively trading in developed markets (U.S., Europe and Japan) since the mid-1990s. A prime example of such a security is a catastrophe bond. Catastrophe bonds pay investors high yields, but are subject to default on all or part of principal and interest if a catastrophic event occurs during the life of the bond. The insured invests the principal in a risk free asset and is allowed to withdraw only when the specified catastrophic event occurs.14 Other examples of such securities include: exchange traded catastrophe options (the purchaser of such an option can demand payment if an insurance claims index exceeds a prespecified level), catastrophe equity puts (an option which allows the insurer to sell equity shares after a disaster), catastrophe swaps (whereby an insurance portfolio with potential payment liability is swapped for a security with cash-flow payment obligations), or weather derivatives (contracts which provide payments on the occurrence of specified weather events).15
14. Capital market-based instruments are potentially relevant to the Caribbean, but have yet to be used. They could address current market failures—mainly enabling public utilities and the government sector to obtain some form of insurance against catastrophic damages to public infrastructure. However, a major barrier to using these noninsurance hedges is their cost—in particular, the transactions cost of using these instruments (particularly for single transactions) makes catastrophe bonds (for example) significantly more expensive than traditional insurance as a means of transferring risk (Swiss Re, 1999). As such, catastrophe bonds and other securities are likely to find their greatest applicability in relation to large risk-transfer transactions that are beyond the capacity of insurance and reinsurance markets to bear. However, this is not the environment found in the Caribbean, where the demand for insurance has been more than adequately covered by insurers, who then reinsure the bulk of their risk. This state of affairs suggests that traditional insurance
14 In capturing the financial risk of catastrophic events and transferring them to capital markets, catastrophe bonds pay out if a defined event (such as a category four hurricane on the Saffir-Simpson scale) occurs. Catastrophe bonds have traditionally been issued by an insurance or reinsurance company, to assist in transferring underwriting risk. However, while of potential relevance to governments in developing countries, as yet no developing country (including those in the Caribbean) has used such bonds to transfer catastrophe risk.
15 Weather-indexed securities have not been as successful as originally envisaged, even in developed countries. A major stumbling block appears to be that of ‘basis risk’—indexes such as the Saffir-Simpson scale or quantity of rainfall are often poorly correlated with the extent of individual losses.
- 42 -
will continue to be the dominant option for Caribbean countries seeking to undertake additional ex ante transference of disaster risk.
15. Catastrophe insurance pooling might address many problems in the Caribbean insurance market. Instead of transferring insurance risk abroad or to capital markets, Caribbean governments would have the option of insurance pooling for the entire region. Insurance pooling can be much more efficient than individual country insurance. The primary reason is that insurance premiums depend not only on the probability of a given event but also on the uncertainty attached to that probability. Uncertainty of the catastrophic event for a single Caribbean country is much higher than the uncertainty for a group of countries. According to Pollner (2001), “Pooling not only institutionalizes the coverage via insurance of catastrophic risks for both the private and public sectors, but also allows more standardization in the rating and pricing of such risks. Pooling also provides more leverage to cover risks with limited capital available. By retaining some part of the risk that is bearable, this also helps stabilize the availability of such insurance funding and its pricing. This is accomplished via more efficient accumulation of catastrophe reserves which can help buffer some of the global market risks related to natural disasters.” Such pooling of insurance funds has been successfully implemented in several countries, including Turkey, the United States, Japan, and New Zealand (Box III.1).
Box III.1 Turkish Catastrophe Insurance Pool The Turkish Catastrophe Insurance Pool (TCIP) is a recent example of risk pooling for developing countries. The TCIP is relevant to the Caribbean region as it combines risk pooling with the introduction of appropriate incentives for loss mitigation. Specifically, the TCIP is an earthquake risk insurance pooling program which is mandatory for owners of urban residential property in Turkey. The pool provides cover up to approximately US$50,000 for each dwelling, for a premium that varies across the country depending upon seismicity of the area, and the type and quality of housing construction. The government exercises oversight to ensure that insurance pools are managed responsibly. Exposure of the insurance pool is managed by the TCIP’s own reserves, with higher layers of exposure covered by the global reinsurance market and the World Bank. The financial support provided by the World Bank (in the form of liquidity readily available to insured homeowners affected by future events), and the involvement of private insurers and reinsurers have contributed to the success of the TCIP since its creation in 2000—as measured by its high penetration ratios (about 17 percent of households, the highest among similar pooling programs of national catastrophe insurance for homeowners). The TCIP has also produced greater insurance capacity for Turkey and Turkish risk, and has promoted a broader and more efficient (re)insurance market for such risk.
16. Proposals have been made in the recent past that the high cost of insurance in the Caribbean can be reduced through disaster mitigation initiatives and through regional pooling of insurance coverage (designed to diversify risk). The recommendation to establish a regional catastrophe insurance pool came out of a CARICOM Working Party on Insurance in the late 1990s. However, this attempt to establish a regional insurance pool for OECS countries (under the auspices of the World Bank) failed to take root, as several
- 43 -
countries opted out of the discussions (in part due to the lack of grant funds to complete technical work assessing the actuarial viability of the project). In the wake of the disastrous 2004 hurricane season in the Caribbean, a second attempt is currently underway, again under World Bank stewardship, to establish a risk pooling mechanism for CARICOM countries. At the heart of this proposal is the notion that risk pooling across different risk zones in the Caribbean has advantages in that it would lower the minimum net capital requirement and allow for more efficient reinsurance arrangements. Extending such pooling to other small island economies in the world would further diversify the risk, thereby lowering premiums.
17. Changing the composition and structure of public borrowing could also assist in the international transfer of the economic risk of a natural disaster. Compared with advanced countries, developing countries find it difficult to issue long-term debt in their own currencies. Sovereign borrowers also lack equity-like instruments which ensure that investors share in the gains and losses of the sovereign’s economic performance. However, the risk-sharing benefits of equity can be mimicked by the issuance of financial instruments with payment terms indexed to real variables that are either: (i) partly within the control of national authorities, such as national GDP, or (ii) to exogenously-determined variables such as real commodity prices or the occurrence of a natural disaster. Such real indexation would provide insurance-like benefits by reducing both the likelihood of debt crises and (by acting as an automatic fiscal stabilizer) the need for procyclical fiscal policies. There is a role for international financial institutions to play in encouraging the creation of markets for the issuance of such real-indexed bonds, through such activities as the coordination of contacts between debt managers and international investors, and boosting the independence of national statistical agencies (see Borenzstein and Mauro, 2002).
E. Issues of Relevance to Developing Countries
Consequences of post-disaster assistance
18. The provision of post-disaster financial aid has been the traditional strategy for dealing with Caribbean natural disasters, with international donors becoming the de facto insurer of last resort. However, Caribbean governments keen to implement ex-ante disaster prevention and mitigation measures are required to undertake current expenditures to reduce future risk, and as with any expenditures, these have opportunity costs. At present, post-disaster assistance is highly subsidized, yet by purchasing insurance and disaster-risk transfer mechanisms, poor disaster-affected countries will have to bear many of the costs presently borne by international donors. Unless international donors can credibly commit to not provide post-disaster assistance, there is little incentive for countries to undertake risk-transfer strategies or engage in risk-reduction and mitigation efforts. This is the ‘Samaritan’s dilemma’, whereby households, farmers and businesses rationally believe that governments will be under political pressure to recognize uninsured losses; in turn, governments rationally believe that external donors will provide post hoc disaster assistance. In both cases, there is likely to be rational underinvestment in ex ante disaster mitigation activities.
- 44 -
Demand for risk-transfer mechanisms
19. The demand for risk-transfer mechanisms will be determined by a country’s willingness to accept the risk of lower future income due to disasters. This willingness is a function of: (i) the probabilistic size of the risk; (ii) the cost of insurance; and (iii) the cost of other risk-transfer mechanisms (including subsidized post-disaster assistance). The degree of risk aversion in Caribbean countries will be a key determinant of the desirability of risk transfer mechanisms.16 Moreover, the greater the post-disaster access to external savings, the lower will be the demand for risk-transfer mechanisms.
What is government risk from natural hazards?
20. How does one measure government risk from natural hazards? In seeking to identify the risk that is being transferred, the responsibility of a developing-country government for losses from natural disasters is often poorly defined. Is government risk to be limited to the rehabilitation of public assets (risk-shifting of government-owned assets); or is public risk to be extended to losses by householders, farmers and businesses (resolution of market failures in the provision of risk-transfer options to nongovernment),17 or even extended further to work programs and public assistance to the poor? An important barrier to the adoption of risk-transfer mechanisms in developing countries is both the inability to calculate government risk from natural hazards and the tendency of developing-country governments to assume private sector risks (World Bank, 2002).
21. However, for the transfer of catastrophe risks to operate, the risks being hedged against need to be precisely quantified. Typically there is a three-stage process in quantifying the hedging of government risk: first, catastrophe modeling will enable a quantification of the expected annual loss; second, where the provision of government-sponsored insurance is involved, additional ambiguities involving moral hazard and adverse selection need to be taken into account; third, the poor may have claims on public resources in times of crisis, as disasters reduce income and destroy personal assets; and finally, the cost of any risk-transfer mechanism needs to be compared to existing sources of internal and
16 Catastrophe insurance is expensive, with premia several times larger than the actuarially-determined expected loss, chiefly due to a large risk premium arising from the variance of catastrophic losses (Froot, 1999). Over the past two decades, less than 1 percent of losses from catastrophes were insured in poor countries (Rasmussen, 2004).
17 Crop insurance is not typically available in the Caribbean, which makes poor farmers especially vulnerable to natural disasters. An exception exists for banana growers, whereby growers’ cooperatives have banded together to provide crop insurance to farmers in Dominica, St. Lucia, Grenada and St. Vincent and the Grenadines affected by windstorm damage, through the Windward Islands Crop Insurance (WINCROP) scheme. About one-fifth of losses (including those arising from disasters) are covered. The size of the fund has been hampered by limited reserves, traditional adverse selection and moral hazard constraints, costly monitoring of small farmers, and large covariant risk in insuring crop yields.
- 45 -
external financing to cover disaster risk. To properly shift risk, the risk of loss itself needs to be defined. In developing countries, the risk of loss to government assets and activities of government may be so ambiguous that risk-shifting is not a viable option for the components of government risk.
F. Conclusion
22. The Caribbean ranks as one of the most disaster prone regions in the world. The macroeconomic impact of natural disasters often results in severely reduced welfare of these small island economies, with a disproportionate impact on the poorest segments of the populations and the mostly uninsured public infrastructure.
23. Rather than ex ante preparedness for highly-likely disaster events, Caribbean governments have emphasized ex post responses. Given limited coverage for natural disaster risks provided by local insurance markets, and the dearth of incentives for governments and households to undertake risk mitigation investments, Caribbean governments have typically emphasized ex post responses to natural disasters through the receipt of donor-based emergency external assistance and the diversion of expenditures within domestic budgets. However, while the frequency of natural disaster events and the value of assets at risk continue to rise, the capacity of donors to fund disaster assistance continues to remain constrained. The end result is a growing gap between the need for, and availability of, resources for disaster reconstruction and relief.
24. Several tiers of nonmutually exclusive disaster risk management approaches are appropriate for Caribbean countries facing the world’s highest risk of natural disaster. Broadly, Caribbean countries should continue to finance post-disaster expenditures with their traditional financing instruments, supplemented by innovations in insurance and risk-transfer instruments. As always, the appropriate mix of financing options will need to place strong weight on the least-cost financing alternatives.
25. The mix of financing options for post-disaster expenditure can usefully be arrayed as a graduated response to increasing layers (or levels) of natural disaster risk:
a. First, the undertaking of proper vulnerability assessments and fostering of actions designed to mitigate disaster risk and enhance post-disaster response is a key means to reduce immediate catastrophe risk. Indeed, the lack of knowledge by Caribbean governments of the risk of disaster events has hindered the ability of policymakers to plan for such disasters. Mitigation actions would include adopting and enforcing strong building codes, enhancing disaster management agencies, and ensuring effective supervision of national insurance companies.
b. Second, lower level risk layers could be covered by the establishment of ex ante funding
approaches, including the creation of taxpayer-funded national disaster contingency funds, emigration and remittance flows, and intertemporal consumption smoothing through the provision of traditional insurance for key public assets. While self-insurance
- 46 -
will not provide the full cost of disaster reconstruction, it is important that sufficient funds be available to government to meet the immediate (short-term disaster relief and rehabilitation) costs of disaster. Continuation of self-insurance by national governments would also be important, through the exercise of their taxing and borrowing powers to provide finance for disaster reconstruction and relief. However, Caribbean governments would also need to consider the sustainability of public debt stocks in any decision to incur additional domestic and external debt to finance post-disaster expenditures.
c. Third, for higher risk layers, greater recourse could be made to risk transfer mechanisms
such as regional insurance pools for catastrophe insurance of public and private assets. Where insurance markets are underdeveloped (as in the Caribbean), this may involve spreading risk through the establishment of a regional catastrophe insurance pool, potentially supported by reinsurance and catastrophe bonds, and require mandatory insurance policies and stringent risk mitigation initiatives.
d. Fourth, for extremely high risk layers, provision could be made for access to contingent
lines of credit. e. Fifth, funding of post-disaster expenditures would remain important. Such funding would
include the continuing provision by IFIs and bilateral donors of concessional loans and grants designed to finance post-disaster mitigation and reconstruction costs, focusing on disaster relief and the rehabilitation of low-income households. Such funds should be made at least partly contingent on the undertaking of ex ante risk mitigation activities, so as not to encourage excessive moral hazard (Gurenko and Lester, 2004).
26. While international capital market instruments (such as catastrophe bonds and weather derivatives) are promising risk transfer mechanisms, without subsidization from IFIs or donors they are beyond the reach of most developing countries. A more practical approach would be to continue to tap local insurance markets until they are saturated. Indeed, proposals by the World Bank to establish the Caribbean Catastrophe Insurance Pool combine both approaches, involving government-supported regional insurance pools and publicly-issued catastrophe bonds.
27. Importantly, the opportunity cost of greater use by developing countries of risk transfer mechanisms needs to be considered. Indeed, it may be optimal from a developing country government perspective to engage in further borrowing, and seek debt forgiveness and donor flows as the main responses to natural disasters. That is, the public sector in most Caribbean countries does not typically insure its assets against catastrophic events, and this
- 47 -
behavior may well be optimal given the existence of donor support and prevailing conditions in regional insurance markets.18
28. Risk-transfer mechanisms can also play a vital role in promoting risk mitigation. A key objective should be to transform the balance of catastrophe risk management in the Caribbean away from ex post, ad hoc responses and toward ex ante risk mitigation activities. As noted by the Fund,19 the willingness of donors to fund ex post disaster relief and reconstruction is finite. Financing gaps between limited donor resources and growing need for post-disaster funding will continue to rise, unless disaster-prone Caribbean countries undertake more ex ante disaster risk identification and mitigation activities, supplemented by greater recourse to risk transfer mechanisms.
18 From the perspective of Caribbean governments, the opportunity costs of risk transfer mechanisms include: creation of a catastrophic risk insurance program will limit discretion to provide disaster relief subsidies, and will undermine the ability of countries to access post-disaster external assistance; accumulating funds in national disaster funds will divert scarce national savings from other productive uses; and creation of a regional disaster insurance pool may result in the loss of reinsurance commissions to local insurers which have a relationship with international reinsurers.
19 See Fund Assistance for Countries Facing Exogenous Shocks (www.imf.org).
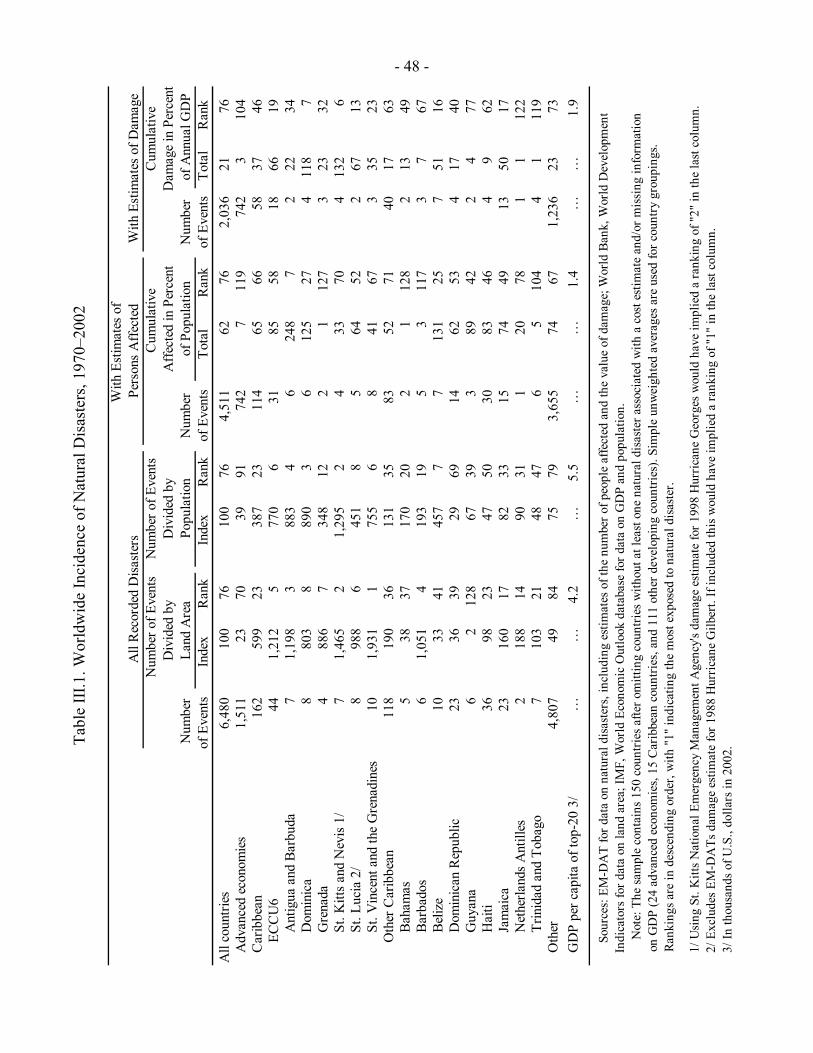
- 48 - Ta
ble
III.1
. Wor
ldw
ide
Inci
denc
e of
Nat
ural
Dis
aste
rs, 1
970–
2002
With
Est
imat
es o
f A
ll R
ecor
ded
Disa
ster
sPe
rson
s Affe
cted
With
Est
imat
es o
f Dam
age
Num
ber o
f Eve
nts
Num
ber o
f Eve
nts
Cum
ulat
ive
Cum
ulat
ive
Div
ided
by
Div
ided
by
Affe
cted
in P
erce
ntD
amag
e in
Per
cent
N
umbe
rLa
nd A
rea
Popu
latio
nN
umbe
rof
Pop
ulat
ion
Num
ber
of A
nnua
l GD
Pof
Eve
nts
Inde
xR
ank
Inde
xR
ank
of E
vent
sTo
tal
Ran
kof
Eve
nts
Tota
lR
ank
All
coun
tries
6,48
010
076
100
764,
511
6276
2,03
621
76A
dvan
ced
econ
omie
s1,
511
2370
3991
742
711
974
23
104
Car
ibbe
an16
259
923
387
2311
465
6658
3746
ECC
U6
441,
212
577
06
3185
5818
6619
Ant
igua
and
Bar
buda
71,
198
388
34
624
87
222
34D
omin
ica
880
38
890
36
125
274
118
7G
rena
da4
886
734
812
21
127
323
32St
. Kitt
s and
Nev
is 1/
71,
465
21,
295
24
3370
413
26
St. L
ucia
2/
898
86
451
85
6452
267
13St
. Vin
cent
and
the
Gre
nadi
nes
101,
931
175
56
841
673
3523
Oth
er C
arib
bean
118
190
3613
135
8352
7140
1763
Baha
mas
538
3717
020
21
128
213
49Ba
rbad
os6
1,05
14
193
195
311
73
767
Beliz
e10
3341
457
77
131
257
5116
Dom
inic
an R
epub
lic23
3639
2969
1462
534
1740
Guy
ana
62
128
6739
389
422
477
Hai
ti36
9823
4750
3083
464
962
Jam
aica
2316
017
8233
1574
4913
5017
Net
herla
nds A
ntill
es2
188
1490
311
2078
11
122
Trin
idad
and
Tob
ago
710
321
4847
65
104
41
119
Oth
er4,
807
4984
7579
3,65
574
671,
236
2373
GD
P pe
r cap
ita o
f top
-20
3 /…
…4.
2…
5.5
……
1.4
……
1.9
1/ U
sing
St.
Kitt
s Nat
iona
l Em
erge
ncy
Man
agem
ent A
genc
y's d
amag
e es
timat
e fo
r 199
8 H
urric
ane
Geo
rges
wou
ld h
ave
impl
ied
a ra
nkin
g of
"2"
in th
e la
st c
olum
n.2/
Exc
lude
s EM
-DA
Ts d
amag
e es
timat
e fo
r 198
8 H
urric
ane
Gilb
ert.
If in
clud
ed th
is w
ould
hav
e im
plie
d a
rank
ing
of "
1" in
the
last
col
umn.
3/ In
thou
sand
s of U
.S.,
dolla
rs in
200
2.
So
urce
s: E
M-D
AT
for d
ata
on n
atur
al d
isas
ters
, inc
ludi
ng e
stim
ates
of t
he n
umbe
r of p
eopl
e af
fect
ed a
nd th
e va
lue
of d
amag
e; W
orld
Ban
k, W
orld
Dev
elop
men
t In
dica
tors
for d
ata
on la
nd a
rea;
IMF,
Wor
ld E
cono
mic
Out
look
dat
abas
e fo
r dat
a on
GD
P an
d po
pula
tion.
Not
e: T
he sa
mpl
e co
ntai
ns 1
50 c
ount
ries a
fter o
mitt
ing
coun
tries
with
out a
t lea
st o
ne n
atur
al d
isas
ter a
ssoc
iate
d w
ith a
cos
t est
imat
e an
d/or
mis
sing
info
rmat
ion
on G
DP
(24
adva
nced
eco
nom
ies,
15 C
arib
bean
cou
ntrie
s, an
d 11
1 ot
her d
evel
opin
g co
untri
es).
Sim
ple
unw
eigh
ted
aver
ages
are
use
d fo
r cou
ntry
gro
upin
gs.
Rank
ings
are
in d
esce
ndin
g or
der,
with
"1"
indi
catin
g th
e m
ost e
xpos
ed to
nat
ural
dis
aste
r.
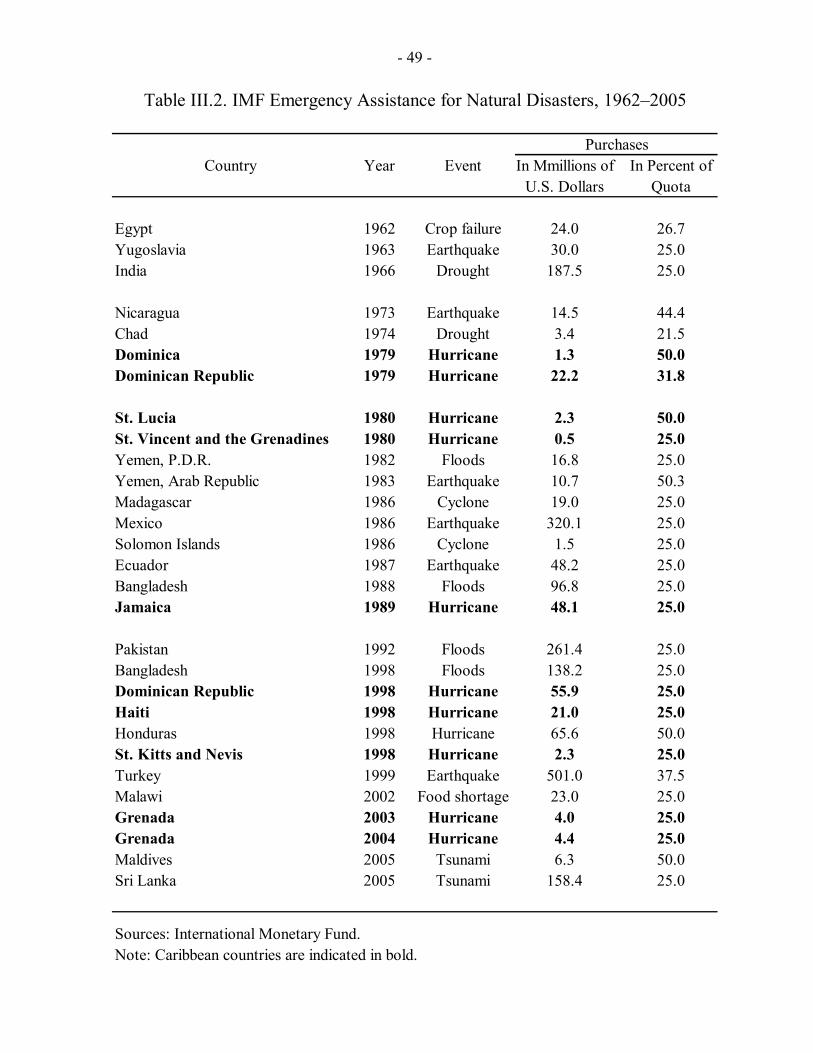
- 49 -
Country Year Event In Mmillions of In Percent ofU.S. Dollars Quota
Egypt 1962 Crop failure 24.0 26.7Yugoslavia 1963 Earthquake 30.0 25.0India 1966 Drought 187.5 25.0
Nicaragua 1973 Earthquake 14.5 44.4Chad 1974 Drought 3.4 21.5Dominica 1979 Hurricane 1.3 50.0Dominican Republic 1979 Hurricane 22.2 31.8
St. Lucia 1980 Hurricane 2.3 50.0St. Vincent and the Grenadines 1980 Hurricane 0.5 25.0Yemen, P.D.R. 1982 Floods 16.8 25.0Yemen, Arab Republic 1983 Earthquake 10.7 50.3Madagascar 1986 Cyclone 19.0 25.0Mexico 1986 Earthquake 320.1 25.0Solomon Islands 1986 Cyclone 1.5 25.0Ecuador 1987 Earthquake 48.2 25.0Bangladesh 1988 Floods 96.8 25.0Jamaica 1989 Hurricane 48.1 25.0
Pakistan 1992 Floods 261.4 25.0Bangladesh 1998 Floods 138.2 25.0Dominican Republic 1998 Hurricane 55.9 25.0Haiti 1998 Hurricane 21.0 25.0Honduras 1998 Hurricane 65.6 50.0St. Kitts and Nevis 1998 Hurricane 2.3 25.0Turkey 1999 Earthquake 501.0 37.5Malawi 2002 Food shortage 23.0 25.0Grenada 2003 Hurricane 4.0 25.0Grenada 2004 Hurricane 4.4 25.0Maldives 2005 Tsunami 6.3 50.0Sri Lanka 2005 Tsunami 158.4 25.0
Sources: International Monetary Fund.Note: Caribbean countries are indicated in bold.
Table III.2. IMF Emergency Assistance for Natural Disasters, 1962–2005
Purchases

- 50 -
REFERENCES
Auffret, P., 2003, “High Consumption Volatility: The Impact of Natural Disasters,” World Bank Policy Research Working Paper 2962 (Washington DC: World Bank).
Benson, C. and E. Clay, 2003, “Economic and Financial Impacts of Natural Disasters: An
Assessment of Their Effects and Options for Mitigation,” (London: Overseas Development Institute).
Borenzstein, E. and P. Mauro, 2002, “Reviving the Case for GDP-Linked Bonds,” IMF
Policy Discussion Paper PDP/02/10 (Washington DC: International Monetary Fund). Cashin, P., 2004, “Key Features of Caribbean Business Cycles,” IMF Working Paper 04/136
(Washington DC: International Monetary Fund). Froot, K., 1999, “The Market for Catastrophic Risk: A Clinical Examination,” NBER
Working Paper 7286 (Cambridge MA: National Bureau of Economic Research). Gurenko, L. and R. Lester, 2004, “Rapid Onset Natural Disasters: The Role of Financing in
Effective Risk Management,” World Bank Policy Research Working Paper 3278 (Washington DC: World Bank).
Mishra, P., 2005, “Emigration and the Brain Drain: Evidence from the Caribbean,” in
Eastern Caribbean Currency Union—Selected Issues, Chapter VI. Pollner, J., 2001, “Managing Catastrophic Disaster Risks Using Alternative Risk Financing
and Pooled Insurance Structures,” World Bank Technical Paper No. 495 (Washington DC: World Bank).
Rasmussen, T., 2004, “Macroeconomic Implications of Natural Disasters in the Caribbean,”
IMF Working Paper 04/224 (Washington DC: International Monetary Fund). Swiss Reinsurance Company, 1999, “Alternative Risk Transfer for Corporations: A Passing
Fashion or Risk Management for the 21st Century?,” Zurich: Swiss Reinsurance Company.
World Bank, 2002, Catastrophes and Development, Disaster Risk Management Working
Papers Series 4 (Washington DC: World Bank).
- 51 -
IV. FISCAL POLICY IN A REGIONAL CURRENCY UNION1
A. Introduction 1. Currency unions with fixed exchange rates can induce mutually conflicting fiscal incentives. On the one hand, fiscal overspending by one country—reflecting countercyclical policies or fiscal slippages—has ramifications on the exchange rate stability for the entire union, thereby requiring utmost fiscal discipline by union members. Conversely, under some conditions, member governments can defer the costs of fiscal slippages to the future or share them with other members, which induces moral hazard behavior. 2. The existing theoretical literature has analyzed both of the above aspects in the relationship between fiscal incentives and exchange rate regimes. Earlier studies supported the traditional view that a fixed exchange rate is an effective policy for fiscal discipline, since fiscal profligacy is deterred by the risk of losses in foreign reserves or build-up of public debt resulting ultimately in a costly abandonment of the peg.2 However, country experiences with changes in fixed exchange rate regimes caused in part by fiscal deterioration (for example, the CFA franc zone in January 1994 and Argentina in December 2001) have questioned the conventional wisdom.3 In this regard, recent studies have shown that the conventional view can be overturned by explicit consideration of fiscal incentives induced by the exchange rate regime (Tornell and Velasco, 2000; Chari and Kehoe, 2004).
3. This chapter explores in detail the factors underlying fiscal policies in the Caribbean in general and the Eastern Caribbean Currency Union (ECCU) in particular. First, it draws on the recent theoretical literature and assesses the combined effect of a regional currency board on fiscal policies. Next, using annual data from 1983 to 2003, it estimates the factors influencing fiscal policies in 15 Caribbean countries, including the ECCU6, by recognizing explicitly the scope for free-riding under the Eastern Caribbean currency board arrangement (CBA).4
1 Prepared by Rupa Duttagupta and Guillermo Tolosa.
2 See Frenkel et al. (1991) and Giavazzi and Pagano (1988). 3 Besides the ECCU, the only other currently operating currency union with a fixed exchange rate regime is the CFA franc zone, which comprises the West African Economic and Monetary Union (WAEMU) and the Central African Economic and Monetary Union (CEMAC). The Euro Area, while also representing a currency union, is different from the ECCU and the CFA zone in that the common currency in the union freely floats against all other major international currencies.
4 The sample comprises the ECCU6—Antigua and Barbuda, Dominica, Grenada, St. Lucia, St. Kitts and Nevis, and St. Vincent and Grenadines—and 9 other Caribbean countries including, The Bahamas, Barbados, Belize, Dominican Republic, Guyana, Haiti, Jamaica, Suriname, and Trinidad and Tobago.
- 52 -
4. The main results of the chapter provide evidence in support of the presence of greater free-riding behavior in the ECCU relative to countries with other exchange rate regimes. The theoretical framework shows that under some conditions fiscal stances under a regional currency board can be associated with greater free-riding opportunities arising from the ability of governments to transfer the inflation costs of fiscal slippages to the future—given the fixed exchange rate—and dilute it across space to other member governments—given the currency union. This opportunity does not arise under a flexible exchange rate regime owing to the immediate inflationary impact of fiscal overspending. Stylized observations on the fiscal stances of 15 Caribbean countries show that the primary balances of the ECCU countries were the worst during 1990–2003, followed by countries with fixed pegs, while countries with flexible regimes were the best fiscal performers. Finally, empirical results confirm that fiscal policies of the ECCU countries during 1983–2003 were indeed characterized by greater free-riding behavior.
5. The rest of the chapter is organized in the following manner. Section B draws on the existing literature and provides insight on the impact of a regional currency-board on fiscal incentives from a political-economy perspective. Section C describes the institutional setup of the Eastern Caribbean Central Bank (ECCB) and the nature of fiscal policies in the ECCU, and Section D presents the empirical analysis. Section E concludes.
B. Fixed Exchange Rates, Currency Unions, and Fiscal Discipline 6. Tornell and Velasco (2000) show that fiscal discipline is not always maintained under a fixed exchange rate. The authors assume that a government can finance fiscal deficits by issuing debt for a temporary period, but eventually has to rely on the inflation tax (in the spirit of Krugman, 1979). Thus, different exchange rate regimes influence fiscal incentives differently, depending on when observable costs start to bite. Under a fixed exchange rate, observable costs will not materialize until inflation takes place at some time in the future. Conversely, under a flexible regime, inflation is observed in the present owing to the consequence of anticipated future inflation (in the spirit of Sargent and Wallace, 1981). If governments are shortsighted and dislike inflation, they spend more under fixed exchange rates, as they can postpone the costs of higher spending. 7. In a similar vein, Chari and Kehoe (2004) show that fiscal discipline is not unambiguously upheld under a currency union arrangement. In their model, the supranational central bank faces a tradeoff between the benefits of greater debt deflation and the output costs of higher inflation, and reneges on its commitment of low inflation when the benefits exceed the costs. Consequently, a government has the incentive to overspend given that the benefits of spending accrue solely to its own country while the inflation cost of higher fiscal deficits can be shared with other members of the union.
8. Thus, the combination of two monetary arrangements—a fixed exchange rate within a currency union—can indeed give rise to perverse fiscal incentives. Under the traditional setup, fixed rates and currency unions reinforce each other, making the monetary
- 53 -
arrangement an ideal environment for fiscal discipline. However, considering also the elements of the alternative view, the scope for free-riding could be strengthened. Following Tornell and Velasco (2000) and Sun (2003), and assuming that: (i) there are no enforceable rules for fiscal deficits and no policy coordination between member governments; (ii) governments eventually rely on inflationary financing of fiscal deficits; (iii) governments are biased toward spending and are shortsighted, i.e., they discount the future more heavily than the present, then fiscal policies under a regional currency board can induce free-riding opportunities by allowing a member government to transmit costs of fiscal slippages to the future and to other member governments.5
9. The critical assumption supporting the above result is that persistent fiscal deficits eventually need to be financed by the inflation tax, possibly in the form of a currency or banking crisis.6 This assumption can be substantiated from both a theoretical and an empirical stand point. Theoretically, inflation is viewed as the outcome of the tradeoffs for the common central bank between benefits to fiscal accounts versus the costs of output decline. The benefits of inflation increase with increases in public debt until a threshold when it is optimal to inflate.7 Empirically, country experiences have proven that a currency crisis can take place even when the central bank had apparently neither the incentive nor the legal capacity to devalue (for example, in Argentina).8 Fears of fiscal insolvency usually spur self-fulfilling mechanisms, resulting in a widespread sudden plunge in the demand for government liabilities, including the currency. 10. Table IV.1 illustrates how fixed exchange rate regimes and currency unions can spread the burden of the inflation tax across time and space, and thereby induce fiscal incentives that are at odds with the conventional wisdom. Four cases are highlighted: • Case I, represented by the upper left panel of Table IV.1, shows the situation when a
country has a flexible exchange rate regime. Fiscal overspending would be translated into depreciation of the exchange rate and inflation in the same period as demand for
5 See Duttagupta and Tolosa (2005) for the detailed algebraic analysis.
6 Abstracting from relative prices, inflation and devaluation are equivalent. In addition, a jump in the price level is also considered inflation for the purposes at hand.
7 The beneficial effects of inflation on public accounts are twofold: Tornell and Velasco (2000) stress the seignorage deriving from the devaluation, while Chari and Kehoe (2004) stress the deflation of debt in domestic currency.
8 Reinhart (2002) finds that 85 percent of all debt crises are accompanied by currency crises.
- 54 -
money decreases in anticipation of future inflation. This is the benchmark case with no free riding in fiscal policy.9
• Under Case II, a country is a member of a currency union that operates a flexible exchange rate. While fiscal overspending would generate costly present inflation, this is now shared with all union members. This case is labeled as “regional free-riding” since the costs of spending are diluted for the country undertaking fiscal expansion.
• Under Case III, a country has a fixed exchange rate. In this case, future inflation does not lead to present inflation as the current exchange rate is fixed. Deferring the costs of the inflation tax amounts to free riding on future governments by spending today, a phenomenon that can be called “intertemporal free riding.”
• Finally, under Case IV, the common currency of the union—adopted by all union members—is fixed vis-à-vis a major international currency. The outcome in this case follows naturally from the other three cases. Actual inflation or even the probability of higher inflation in the future has no consequences for money demand or inflation today, given the fixed exchange rate. Inflation is expected to take place in the future and the cost to be shared by future member governments, given the currency union. Thus, the inflationary costs of fiscal expansion are minimal at present—future governments end up bearing them and member governments end up sharing them. Consequently, incentives for fiscal slippages at present are the highest.
11. The scope for regional free-riding can intensify under certain conditions. The incentive to free-ride would increase with increases in the bailout capacity of the central bank—for example, proxied by the level of foreign reserves at the currency board—as perceived by member governments and/or their creditors. Even if governments do not expect to be directly bailed out by the central bank, the latter’s commitment to bail out the financial system from systemic crises reduces the urgency for governments to prepare for potential liquidity shortages in the banking system, and also benefits governments that have significant ownership in the banking system.
12. The incentive to free-ride intertemporally is related to internal political competition and turnover. The higher the competition for political leadership, the smaller the probability that the same political party will have control in the next term and the higher the incentive to delay the cost of fiscal expansion, in particular when elections are close.10
9 Note that the only type of free riding behavior under consideration is with respect to the burden of the inflation tax. Other forms of free riding, e.g., higher future taxes or lower future social expenditure controls, are not considered here.
10 Intertemporal free-riding is also linked with the cost of realignment of the peg—the higher the cost, the lower the probability of free-riding intertemporally (see Sun, 2003).
- 55 -
13. The operation of both moral hazard channels depends on the structure of capital markets as well. In well-developed markets, high debt would be discouraged by rising interest rates (Bayoumi et al., 1995). Conversely, countries face tight borrowing constraints in poorly developed markets owing to the structural scarcity of funds. Thus, the scope for fiscal overspending increases under some degree of capital market development, i.e., where capital is available and limited information leads to underestimation of sovereign risk.
C. Fiscal Policies in the Eastern Caribbean Currency Union Institutional setup 14. The Eastern Caribbean Currency Bank (ECCB) operates like a currency board arrangement (CBA) at the regional level. It has full central bank functions such as issuing the common currency, managing a common pool of foreign exchange reserves for member countries, and maintaining monetary conditions conducive to growth, economic development, and financial system stability. The reserve pooling agreement implies that no individual country reserves are allocated, and although reserves are imputed to individual members, these are not a measure of the foreign reserves at a country’s disposal. At the same time, each member has unrestricted access to the common pool of reserves as long as it has the domestic currency to make it effective. 15. The ECCB regulations allow some departures from traditional CBAs, and as a result it is actually considered a quasi-CBA.11 The ECCB is required to maintain foreign exchange reserves to cover 60 percent of its demand liabilities, unlike most other currently existing CBAs that require full foreign exchange backing of the domestic currency (e.g., Hong Kong, Djibouti, and Lithuania). The ECCB can support the national fiscal authorities in several ways: by providing temporary advances (up to 5 percent of the government’s average annual revenue during the preceding three financial years); holding treasury bills (up to 10 percent of the government’s estimated revenue of that year); holding other securities (with varying limits according to the security); and servicing governments’ special deposit loans to financial institutions (Hendrickson et al., 2002; van Beek et al., 2003). The ECCB also has autonomy in determining discount and rediscount rates, reserve requirements and interest rate controls, such as the floor on the savings interest rate.
16. The CBA has been very stable so far, reflecting prudent policies by the ECCB. Despite its autonomy, the ECCB has rarely used the monetary policy tools at its disposal. Also, despite a lower requirement, the reserve backing of the CBA has been close to 95 percent, which has helped bolster the fixed exchange rate while giving the ECCB some scope to serve as a lender of last resort—at its discretion—for the banking system.
11 Henceforth, the quasi-currency board arrangement will be referred to as the CBA for the sake of simplicity.
- 56 -
17. However, national fiscal policies in the ECCU have not been conducive to strengthening the CBA. Actual fiscal outcomes have increasingly deviated from the fiscal guidelines established by the ECCB in 1998, reflecting the fact that national fiscal policy decisions have been made independently of the CBA (Figure IV.1).12 Moreover, the rising foreign reserve coverage at the ECCB, combined with the discretion of the ECCB to provide liquidity support, could raise the perception of stronger bailout capability of the ECCB and induce further fiscal overspending by member governments and continued financing by their creditors. Thus, the scope for free-riding is clear, although whether this actually influences fiscal policies in the ECCU is an empirical question. Stylized facts 18. Fiscal positions of the six ECCU countries were the worst among the 15 Caribbean countries in the sample. The ECCU countries had the largest average primary deficits during 1990–2003 (a sufficiently long period over which short-run determinants of fiscal policy can be expected to net out), followed by countries with fixed exchange rates (Figure IV.2).13 The countries with various forms of relatively more flexible regimes—including floats—were the best fiscal performers in the sample. 19. The deterioration of primary balances in the ECCU was mainly due to a worsening in government expenditures, which increased sharply during the 1990s (Figure IV.3, Panel (a)).14 Fiscal expenditure growth generally surpassed GDP growth irrespective of the nature of the business cycle ((Panel (b)), suggesting that fiscal stances were influenced by other factors besides the growth slowdown. The rise in primary expenditure over time characterized every ECCU country, and in each case, exceeded the increase in fiscal revenue during the same period (Panel (c)). Also, the composition of primary spending did not change in a major way, implying that fiscal policies were not driven by a sharp rise in government preference towards a particular item (Panel (d)).
20. The ECCU governments had access to foreign financing even when other emerging market countries faced a turnaround of net capital inflows (Figure IV.4). Also, unlike other developing countries, where capital flows are usually procyclical, non-FDI
12 However, the existence of fiscal rules per se may not be enough to induce fiscal discipline (as confirmed by the recent experience in the Euro Area).
13 In the sample of 15 countries, the ECCU countries maintained a regional currency board, while The Bahamas, Barbados and Belize maintained conventional fixed peg regimes through out the sample period. Other countries maintained a variety of exchange rate regimes during the sample period, including floats and intermediate exchange rate regimes.
14 Sahay (2005) analyzes the public debt dynamics of a sample of 15 Caribbean countries and finds that the ECCU countries are among the highest for emerging market economies. In addition, most of the increase in public debt is accounted for by a deterioration in primary balances.
- 57 -
capital inflows continued to the ECCU countries even during periods of low economic activity.15 Possible reasons for their ability to borrow externally could be their good repayment record, relatively low GDP volatility, the perception that the ECCB would serve as a lender of last resort in the event of potential liquidity shortages faced by member governments, and the gradual elimination of transaction costs with financial innovation in capital markets over time.16
21. In sum, stylized facts underscore the need for a deeper analysis of the factors influencing fiscal policies in the ECCU. Average fiscal balances in the ECCU during the past two decades were much lower than in other Caribbean countries with more flexible exchange rate regimes. The fiscal deterioration was characterized by expenditure expansion across all member countries, with revenue remaining relatively stable. The large fiscal deficits were financed in part by borrowing from abroad during good and bad times, and even when financial flows were retracting from other emerging markets. These peculiarities highlight the importance of studying the nature of fiscal policies in the ECCU, and assessing in particular any evidence of moral hazard behavior under the regional CBA.
D. Empirical Analysis
22. A fixed-effects panel model is used to examine the fiscal policy stance in 15 Caribbean countries during 1983–2003. This model allows one to assess the effect of competing factors—including specific channels of free-riding behavior under various exchange rate regimes—on fiscal policy after controlling for country-specific, time invariant factors (that can proxy for “institutions”).17 This approach reflects a marked difference from past studies, which focus on estimating the relationship between fiscal stance and exchange rate regimes in a cross-section set-up, without attempting to identify the channels through which different regimes can influence fiscal incentives (see Fatas and Rose, 2001; and Tornell and Velasco, 2000). The estimated equation has the following form:
it it it ity x z vα β γ= + + + where:
15 See Kaminsky et al. (2004) and Rasmussen and Tolosa (2005). The higher influx of net capital inflows since the mid-1990s was unrelated to changes in capital account policies, as the region had eliminated most capital controls in the early 1980s (see IMF Annual Report on Exchange Arrangements and Exchange Restrictions, various issues).
16 Reinhart et al. (2003) find evidence that borrowing capacity is significantly related to default histories and the nature of macroeconomic volatilities.
17 Data for institutional variables that are usually cited in the literature—for example, fiscal transparency, characteristics of the budget process, independence of the Ministry of Finance over the Cabinet, the degree of expenditure control by the budget authority (von Hagen and Harden, 1996)—are very poor for the Caribbean.
- 58 -
ity is a measure of fiscal stance of country i at time t, expressed as the primary fiscal balance (as a percent of nominal GDP). Since the primary balance is unaffected by interest payments, it serves as an appropriate indicator of fiscal policy stance;
itx comprises a number of control variables for country i at time t, the description of which (and their expected signs in the regression) is given in Box IV.1;
tv is the error term in the regression; and
itz is a group of three indicators that are used as proxies for moral hazard behavior reflecting regional and inter-temporal free riding behavior. These proxies are described in detail below.18
Box IV.1. Control Variables Used in the Regression
(i) Economic performance, measured by the annual real GDP growth rate. A counter- (pro-) cyclical fiscal policy would imply an increase (decrease) in fiscal deficits during economic slumps and a corresponding decrease (increase) during an economic boom. (ii) Trade openness, expressed as the sum of exports and imports of goods and services as a percentage of GDP, as a proxy for trade policies. (iii) Terms of trade, measured by the ratio of export price to import price, in dollars. Improvement in the terms of trade would improve fiscal revenues, reduce the need for expansionary fiscal policy, and help improve the primary balance. (iv) A dummy for an IMF program controls for the effect of existing IMF programs on the fiscal stance. (v) Time dummies, to control for time specific events and also account for innovations in the financial markets over time that ease borrowing constraints for member governments. 23. Intertemporal free-riding is proxied by the closeness to election under alternative exchange rate regimes. Shortly before elections are held governments’ shortsightedness could increase; that is, the closer are elections, the more governments could spend to improve their chances of winning the elections. A fixed exchange rate regime would conveniently defer the costs of higher fiscal expenditure to the future, while under flexible exchange rates the costs would have to be paid upfront. Table IV.2 shows a negative (non-negative) correlation between primary balances and closeness to election for the regional
18 The data sources of all the indicators are documented in the Annex.
- 59 -
CBA (flexible regimes), although a more formal analysis is needed to establish any causal relationship reflected in the correlations.19
24. Three variables are used to fully explore the impact of all exchange rate regimes on intertemporal free riding: (i) the product of the time remaining to the next election and a dummy for all ECCU countries (to capture the effect under the ECCU); (ii) the product of the time remaining to the next election and a dummy for countries that maintained fixed peg regimes (to capture the effect under these exchange rate regimes); and (iii) the time remaining to the next election in years for all regimes (to assess the effect under flexible regimes).20 In the presence of intertemporal free-riding, there would be a negative relationship between fiscal stance and proximity to election for all countries with fixed exchange rates, including the ECCU, and no such relationship for countries with flexible regimes.
25. Regional free-riding is proxied by the level of official foreign reserves relative to base money under different exchange rate regimes. While countries not belonging to the ECCU have access to external reserves at their central banks only, each ECCU country has access to the entire pool of foreign reserves at the ECCB. Two variables are used in the regression to explore the impact of all exchange rate regimes on regional free-riding: (i) the product of a dummy for all ECCU countries and the level of foreign reserves at the ECCB (as a percent of reserve money) that captures the effect under the CBA; and (ii) the level of foreign reserves under each of the other exchange rate regimes. In the presence of regional free-riding, the increase in foreign reserves at the ECCB would induce fiscal slippages, resulting in a worsening of fiscal balances in ECCU countries. In the non-ECCU countries, foreign reserves are not expected to have a negative bearing on fiscal stances.
26. The relative size of a member country, reflecting its systemic importance in the ECCU, is used as an alternative proxy for regional free-riding. The relationship between this proxy and fiscal stance is ambiguous however. On the one hand, the more systemically important a country becomes, the greater could be the perceived prospects of being bailed out by the ECCB to maintain the stability of the CBA.21 One the other hand, the expectation of being bailed out could be seen to be higher if a country is small, since the associated costs are relatively small.
19 Note however, the correlation between primary balance and proximity to elections for fixed peg regimes, while expected to be negative, is negligible.
20 The group of fixed peg regimes comprises countries which maintained fixed pegs during the entire sample period, with negligible adjustment in the exchange rate level (i.e., less than 1 percent). While it would also be interesting to single out the effect of pure floating regimes on fiscal policy, no country maintained a float during the entire sample period.
21 See Wildasin (1997) for a similar argument. For instance, the countries that violated the Stability and Growth Pact in Europe were its largest members, France and Germany.
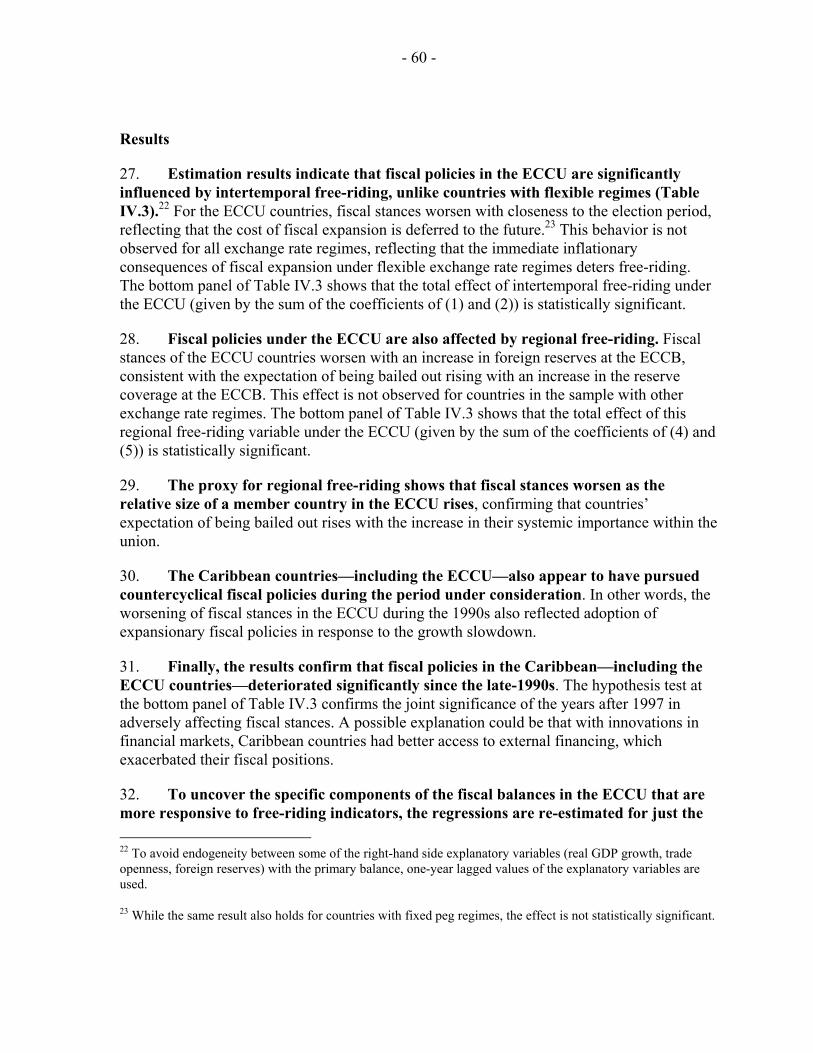
- 60 -
Results
27. Estimation results indicate that fiscal policies in the ECCU are significantly influenced by intertemporal free-riding, unlike countries with flexible regimes (Table IV.3).22 For the ECCU countries, fiscal stances worsen with closeness to the election period, reflecting that the cost of fiscal expansion is deferred to the future.23 This behavior is not observed for all exchange rate regimes, reflecting that the immediate inflationary consequences of fiscal expansion under flexible exchange rate regimes deters free-riding. The bottom panel of Table IV.3 shows that the total effect of intertemporal free-riding under the ECCU (given by the sum of the coefficients of (1) and (2)) is statistically significant.
28. Fiscal policies under the ECCU are also affected by regional free-riding. Fiscal stances of the ECCU countries worsen with an increase in foreign reserves at the ECCB, consistent with the expectation of being bailed out rising with an increase in the reserve coverage at the ECCB. This effect is not observed for countries in the sample with other exchange rate regimes. The bottom panel of Table IV.3 shows that the total effect of this regional free-riding variable under the ECCU (given by the sum of the coefficients of (4) and (5)) is statistically significant.
29. The proxy for regional free-riding shows that fiscal stances worsen as the relative size of a member country in the ECCU rises, confirming that countries’ expectation of being bailed out rises with the increase in their systemic importance within the union.
30. The Caribbean countries—including the ECCU—also appear to have pursued countercyclical fiscal policies during the period under consideration. In other words, the worsening of fiscal stances in the ECCU during the 1990s also reflected adoption of expansionary fiscal policies in response to the growth slowdown.
31. Finally, the results confirm that fiscal policies in the Caribbean—including the ECCU countries—deteriorated significantly since the late-1990s. The hypothesis test at the bottom panel of Table IV.3 confirms the joint significance of the years after 1997 in adversely affecting fiscal stances. A possible explanation could be that with innovations in financial markets, Caribbean countries had better access to external financing, which exacerbated their fiscal positions.
32. To uncover the specific components of the fiscal balances in the ECCU that are more responsive to free-riding indicators, the regressions are re-estimated for just the 22 To avoid endogeneity between some of the right-hand side explanatory variables (real GDP growth, trade openness, foreign reserves) with the primary balance, one-year lagged values of the explanatory variables are used.
23 While the same result also holds for countries with fixed peg regimes, the effect is not statistically significant.
- 61 -
ECCU countries. Table IV.4 reports the regression results using primary fiscal balance, primary spending and fiscal revenue (in percent of GDP) as alternative proxies for fiscal stance. The results indicate that fiscal primary spending increases with proximity to the election year (intertemporal free-riding), increases in relative size of the country in the ECCU (regional free-riding), and increases with the decline in real GDP growth (counter-cyclical fiscal behavior). Fiscal spending in the ECCU also increased with natural disaster shocks in 1992 and 1995.24 However, primary spending is not significantly affected by the increase in reserve coverage at the ECCB. Fiscal revenues fall with the increase in reserve coverage at the ECCB, implying that greater reserve coverage at the ECCB induces regional free-riding through an increase in governments’ laxity in generating fiscal revenues. Fiscal revenue is also negatively related to real GDP growth, possibly reflecting the fact that governments’ efforts to increase fiscal revenues suffer a setback during good growth years.25
Robustness
33. Robustness tests by including additional explanatory variables in the regressions confirm the existence of regional and intertemporal free riding. These included: (i) total private sector capital flows from industrial countries to emerging market economies (to assess whether the evolution of fiscal stances was a mere reflection of greater availability of external financing); (ii) world oil prices (to analyze the impact of oil price shocks on the fiscal stance); (iii) world interest rates (proxied by the three-month U.S. treasury bill rate, to see whether world monetary conditions affected capital flows to the region); and (iv) real GDP per capita (to proxy for the level of institutional development). These variables did not have any systematic or significant influence on fiscal policy, and did not affect the significance of the proxies for free-riding in the original regression. They were eventually dropped from the regression.
34. Finally, the estimation results were also tested for structural breaks and none were found. A Chow (1960) test was performed to identify structural breaks in fiscal policy stance during the mid-1990s and was rejected at the 5 percent level of significance. This result supports the view that moral hazard behavior was always present in the fiscal stances of ECCU countries, and was not a result of any major structural change in fiscal policies in the last decade.
24 The data for natural disasters were taken from Rasmussen (2004). To save degrees of freedom, each dummy was added individually to the regression (in Column II), and accepted only if its coefficient was significant at the 10 percent level.
25 This result also supports the perception that the sectors responsible for high growth in the region (e.g., tourism) are under taxed, resulting in sluggish fiscal revenue growth even in times of robust economic recovery.
- 62 -
E. Conclusion
35. Fiscal policies in ECCU countries became more expansionary over time and in comparison with other Caribbean countries. Primary balances in ECCU countries have been persistently deteriorating since the early 1990s—reflecting rapid expenditure growth and sluggish revenues—and actual fiscal outcomes have progressively diverged from the fiscal guidelines established by the ECCB’s Monetary Council in 1998. In a sample of 15 Caribbean countries during 1990–2003, the fiscal imbalances of ECCU countries were the highest, followed by countries with fixed peg regimes. Countries with more flexible regimes were the best fiscal performers.
36. This chapter found evidence in support of the presence of free-riding fiscal behavior by ECCU member countries. Contrary to the expectation that the regional CBA would restrain fiscal slippages of union members, fiscal discipline appears to have weakened given the scope for free-riding on member countries and over time. Specifically, the costs of fiscal overspending are spread across time (intertemporally) given the fixity of the exchange rate regime, and across space (regionally) to member countries, given the currency union. Expansionary fiscal policies are also reflected in a negative relationship between fiscal revenues-to-GDP and real GDP growth—indicating insufficient efforts to generate revenue in periods of high growth—although fiscal spending is countercyclical.
37. These findings underscore the need to ensure the consistency of fiscal policies with the regional CBA. Possible options include improving the effectiveness of the Monetary Council’s fiscal guidelines by enforcing them at the regional or national levels. Further analysis is needed to find effective incentive mechanisms that discipline individual country behavior and would support the stability of the CBA. Regional free-riding could be discouraged by clearly demonstrating that the ECCB will not bailout members—either directly by financing fiscal deficits, or indirectly by bailing out banking systems in individual countries. In this regard, the current practice by the ECCB of not bailing out governments facing intermittent debt servicing problems (as in Antigua and Barbuda during several years and Dominica in 2002) has helped establish the credibility of the ECCB. Finally, consideration should also be given to whether more fiscal policy coordination at the regional level—for example, by adopting a common approach towards eliminating costly fiscal incentives to investors, or allowing greater transmission of world oil price changes to domestic prices—would help attain greater fiscal discipline in the region.
- 63 -
Sources: Eastern Caribbean Currency Union member country authorities; and Fund staff estimates. 1/ The four fiscal guidelines are: current balance (4-6 percent of GDP); overall balance (greater than -3 percent of GDP); total public sector debt (less than or equal to 60 percent of GDP); and debt service payments (less than 15 percent of current revenue).
Antigua and Barbuda
0
1
2
3
4
1998
1999
2000
2001
2002
2003
Num
ber o
f gui
delin
es m
et
Dominica
0
1
2
3
4
1998
1999
2000
2001
2002
2003
Num
ber o
f gui
delin
es m
etGrenada
0
1
2
3
4
1998
1999
2000
2001
2002
2003
Num
ber o
f gui
delin
es m
et
St. Kitts and Nevis
0
1
2
3
4
1998
1999
2000
2001
2002
2003
Num
ber o
f gui
delin
es m
et
St. Lucia
0
1
2
3
4
1998
1999
2000
2001
2002
2003
Num
ber o
f gui
delin
es m
et
St. Vincent and the Grenadines
0
1
2
3
4
1998
1999
2000
2001
2002
2003
Num
ber o
f gui
delin
es m
et
Figure IV.1. ECCU Countries: Compliance with Fiscal Guidelines, 1998–2003 1/
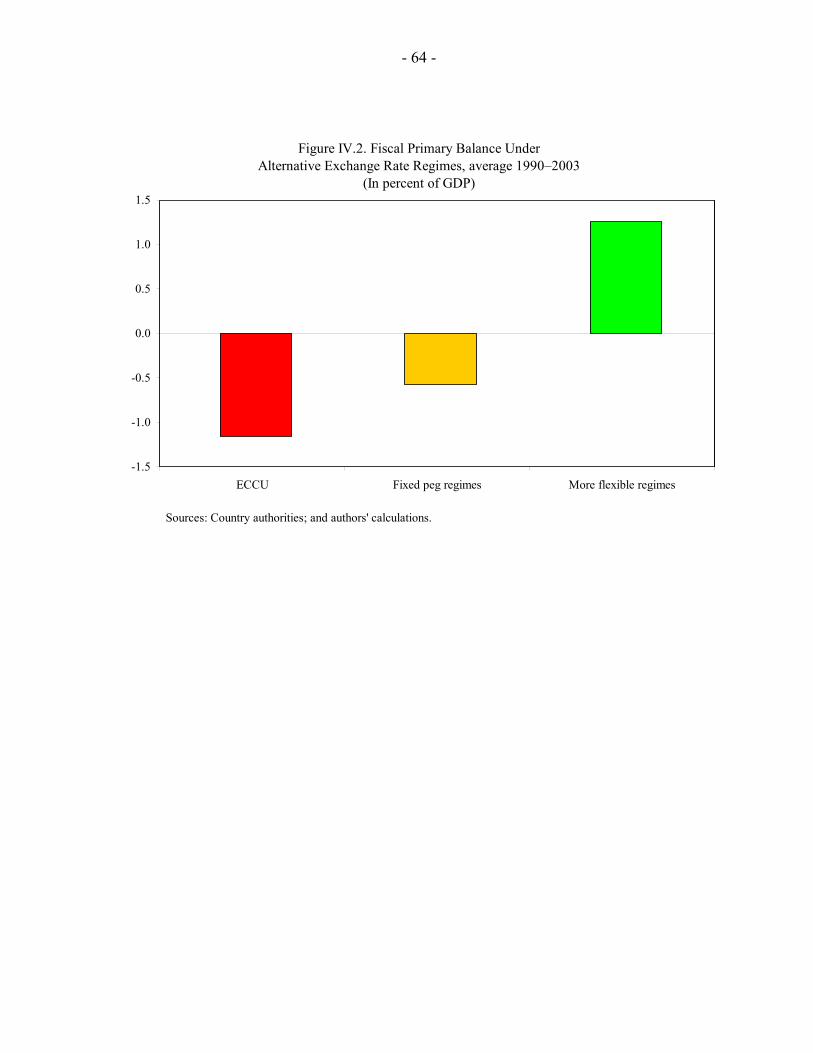
- 64 -
Figure IV.2. Fiscal Primary Balance Under Alternative Exchange Rate Regimes, average 1990–2003
(In percent of GDP)
-1.5
-1.0
-0.5
0.0
0.5
1.0
1.5
ECCU Fixed peg regimes More flexible regimes
Sources: Country authorities; and authors' calculations.
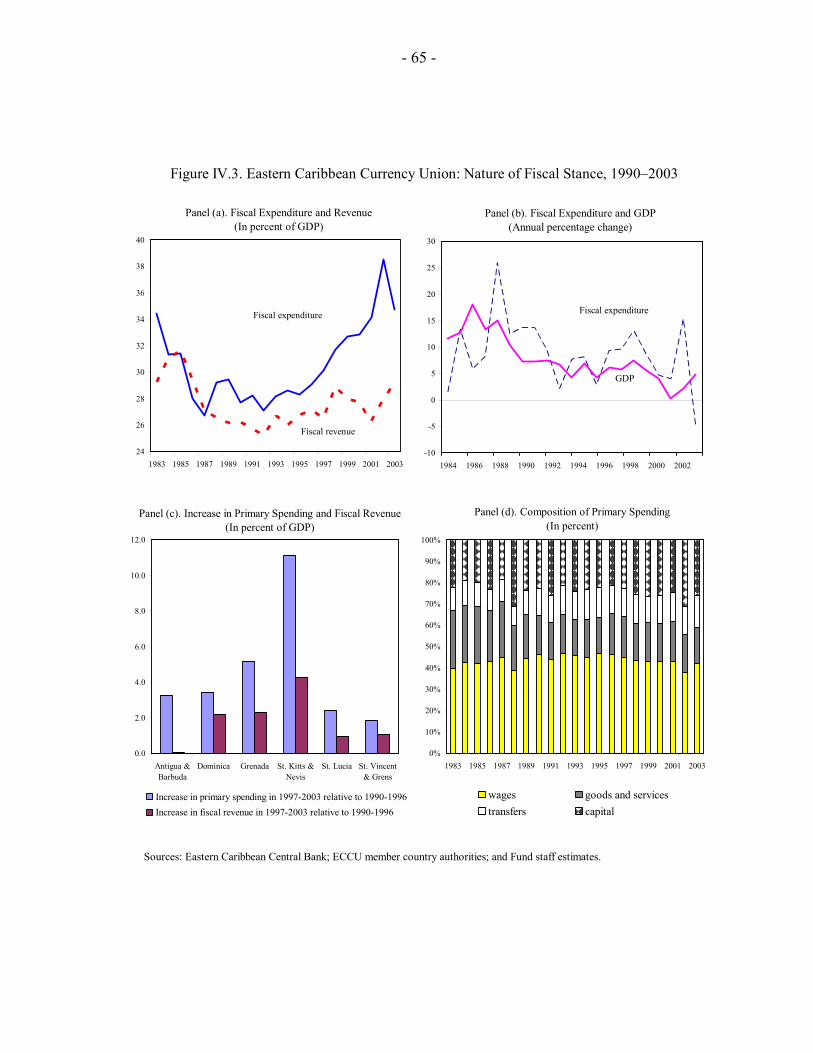
- 65 -
Sources: Eastern Caribbean Central Bank; ECCU member country authorities; and Fund staff estimates.
24
26
28
30
32
34
36
38
40
1983 1985 1987 1989 1991 1993 1995 1997 1999 2001 2003
Fiscal expenditure
Fiscal revenue
-10
-5
0
5
10
15
20
25
30
1984 1986 1988 1990 1992 1994 1996 1998 2000 2002
Fiscal expenditure
GDP
0.0
2.0
4.0
6.0
8.0
10.0
12.0
Antigua &Barbuda
Dominica Grenada St. Kitts &Nevis
St. Lucia St. Vincent& Grens
Increase in primary spending in 1997-2003 relative to 1990-1996Increase in fiscal revenue in 1997-2003 relative to 1990-1996
Panel (c). Increase in Primary Spending and Fiscal Revenue(In percent of GDP)
0%
10%
20%
30%
40%
50%
60%
70%
80%
90%
100%
1983 1985 1987 1989 1991 1993 1995 1997 1999 2001 2003
wages goods and servicestransfers capital
Panel (d). Composition of Primary Spending(In percent)
Panel (a). Fiscal Expenditure and Revenue (In percent of GDP)
Panel (b). Fiscal Expenditure and GDP(Annual percentage change)
Figure IV.3. Eastern Caribbean Currency Union: Nature of Fiscal Stance, 1990–2003
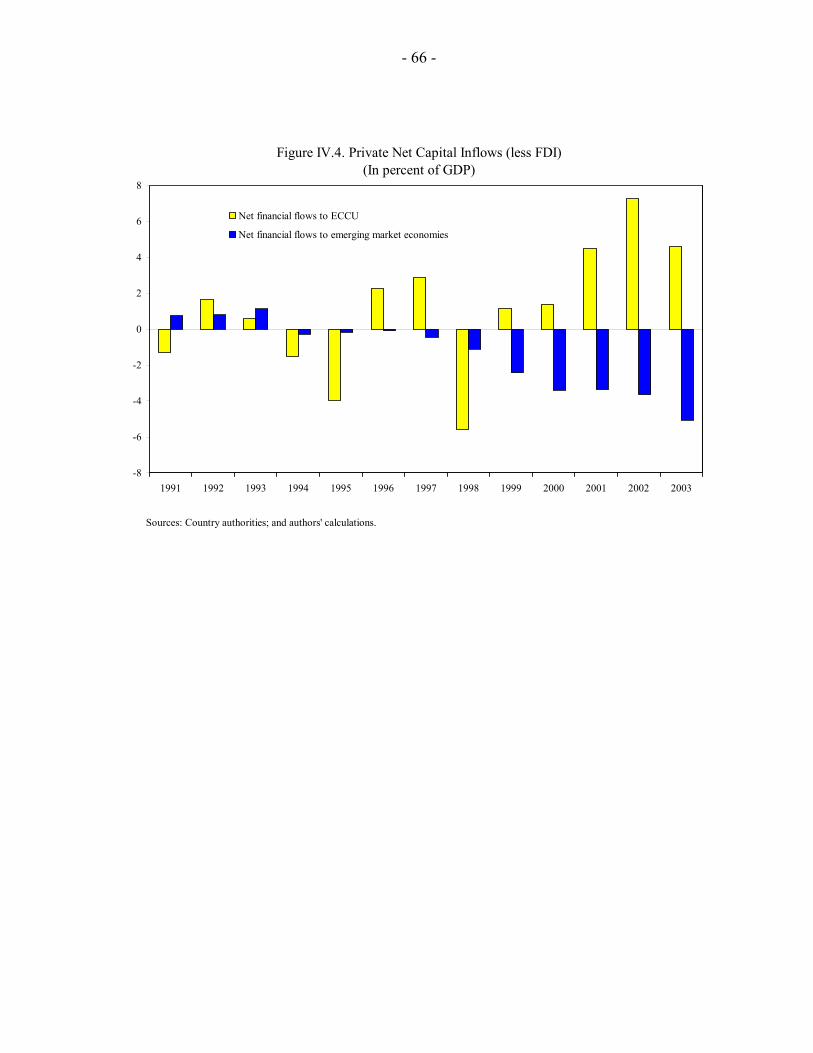
- 66 -
Figure IV.4. Private Net Capital Inflows (less FDI)
(In percent of GDP)
-8
-6
-4
-2
0
2
4
6
8
1991 1992 1993 1994 1995 1996 1997 1998 1999 2000 2001 2002 2003
Net financial flows to ECCU
Net financial flows to emerging market economies
Sources: Country authorities; and authors' calculations.
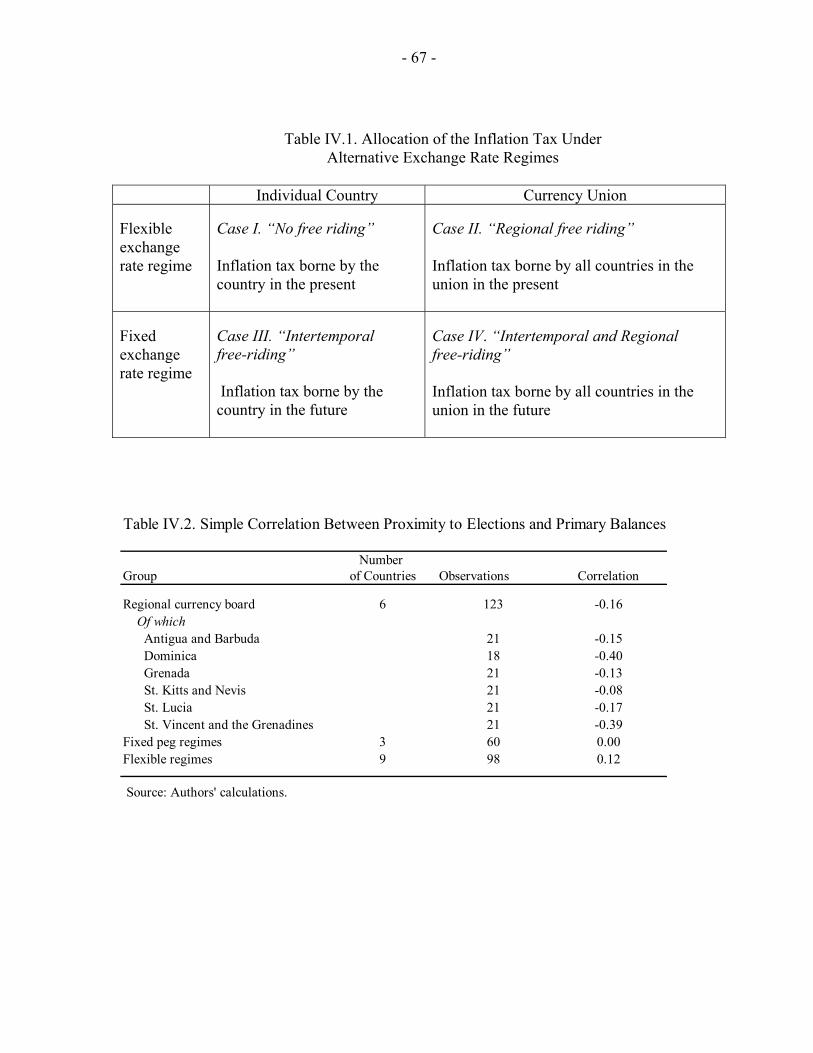
- 67 -
Table IV.1. Allocation of the Inflation Tax Under Alternative Exchange Rate Regimes
Individual Country Currency Union Flexible exchange rate regime
Case I. “No free riding” Inflation tax borne by the country in the present
Case II. “Regional free riding” Inflation tax borne by all countries in the union in the present
Fixed exchange rate regime
Case III. “Intertemporal free-riding” Inflation tax borne by the country in the future
Case IV. “Intertemporal and Regional free-riding” Inflation tax borne by all countries in the union in the future
Table IV.2. Simple Correlation Between Proximity to Elections and Primary Balances
Number Group of Countries Observations Correlation
Regional currency board 6 123 -0.16 Of which Antigua and Barbuda 21 -0.15 Dominica 18 -0.40 Grenada 21 -0.13 St. Kitts and Nevis 21 -0.08 St. Lucia 21 -0.17 St. Vincent and the Grenadines 21 -0.39
Fixed peg regimes 3 60 0.00Flexible regimes 9 98 0.12
Source: Authors' calculations.
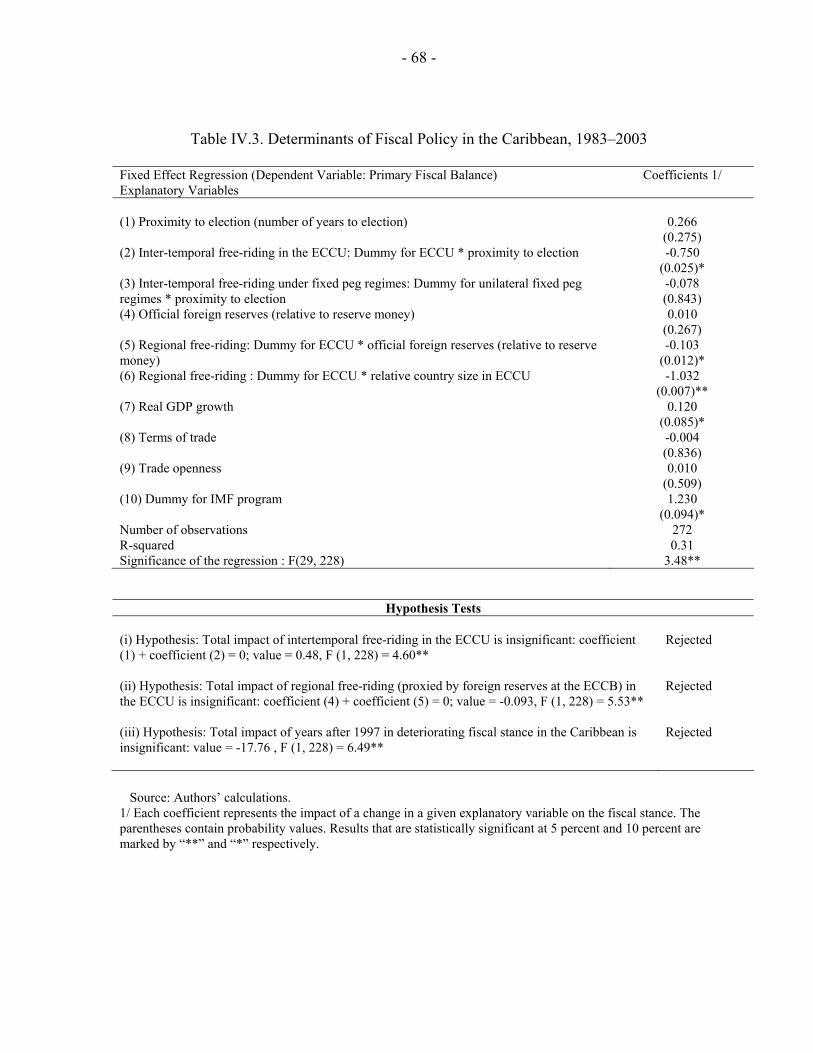
- 68 -
Table IV.3. Determinants of Fiscal Policy in the Caribbean, 1983–2003
Fixed Effect Regression (Dependent Variable: Primary Fiscal Balance) Coefficients 1/ Explanatory Variables (1) Proximity to election (number of years to election)
0.266
(0.275) (2) Inter-temporal free-riding in the ECCU: Dummy for ECCU * proximity to election -0.750
(0.025)* (3) Inter-temporal free-riding under fixed peg regimes: Dummy for unilateral fixed peg regimes * proximity to election
-0.078 (0.843)
(4) Official foreign reserves (relative to reserve money) 0.010 (0.267)
(5) Regional free-riding: Dummy for ECCU * official foreign reserves (relative to reserve money)
-0.103 (0.012)*
(6) Regional free-riding : Dummy for ECCU * relative country size in ECCU -1.032 (0.007)**
(7) Real GDP growth 0.120 (0.085)*
(8) Terms of trade -0.004 (0.836)
(9) Trade openness 0.010 (0.509)
(10) Dummy for IMF program 1.230 (0.094)*
Number of observations 272 R-squared 0.31 Significance of the regression : F(29, 228) 3.48**
Hypothesis Tests (i) Hypothesis: Total impact of intertemporal free-riding in the ECCU is insignificant: coefficient (1) + coefficient (2) = 0; value = 0.48, F (1, 228) = 4.60**
Rejected
(ii) Hypothesis: Total impact of regional free-riding (proxied by foreign reserves at the ECCB) in the ECCU is insignificant: coefficient (4) + coefficient (5) = 0; value = -0.093, F (1, 228) = 5.53**
Rejected
(iii) Hypothesis: Total impact of years after 1997 in deteriorating fiscal stance in the Caribbean is insignificant: value = -17.76 , F (1, 228) = 6.49**
Rejected
Source: Authors’ calculations. 1/ Each coefficient represents the impact of a change in a given explanatory variable on the fiscal stance. The parentheses contain probability values. Results that are statistically significant at 5 percent and 10 percent are marked by “**” and “*” respectively.
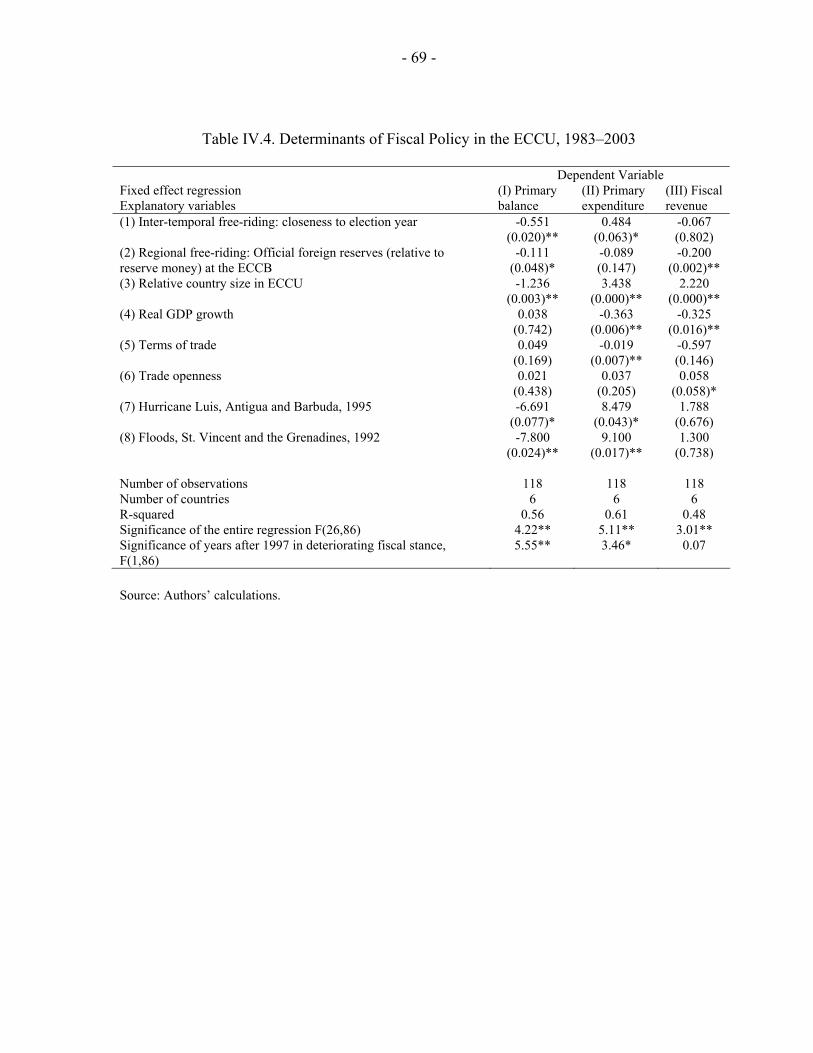
- 69 -
Table IV.4. Determinants of Fiscal Policy in the ECCU, 1983–2003 Dependent Variable Fixed effect regression Explanatory variables
(I) Primary balance
(II) Primary expenditure
(III) Fiscal revenue
(1) Inter-temporal free-riding: closeness to election year -0.551 (0.020)**
0.484 (0.063)*
-0.067 (0.802)
(2) Regional free-riding: Official foreign reserves (relative to reserve money) at the ECCB
-0.111 (0.048)*
-0.089 (0.147)
-0.200 (0.002)**
(3) Relative country size in ECCU -1.236 (0.003)**
3.438 (0.000)**
2.220 (0.000)**
(4) Real GDP growth 0.038 (0.742)
-0.363 (0.006)**
-0.325 (0.016)**
(5) Terms of trade 0.049 (0.169)
-0.019 (0.007)**
-0.597 (0.146)
(6) Trade openness 0.021 (0.438)
0.037 (0.205)
0.058 (0.058)*
(7) Hurricane Luis, Antigua and Barbuda, 1995 -6.691 (0.077)*
8.479 (0.043)*
1.788 (0.676)
(8) Floods, St. Vincent and the Grenadines, 1992 -7.800 (0.024)**
9.100 (0.017)**
1.300 (0.738)
Number of observations
118
118
118
Number of countries 6 6 6 R-squared 0.56 0.61 0.48 Significance of the entire regression F(26,86) 4.22** 5.11** 3.01** Significance of years after 1997 in deteriorating fiscal stance, F(1,86)
5.55**
3.46* 0.07
Source: Authors’ calculations.
- 70 - ANNEX
DATA SOURCES Fiscal stance proxies. (i) Primary balance divided by nominal GDP: For the ECCU countries, data for primary balance and GDP during 1983–1990 was obtained from the Eastern Caribbean Central Bank (ECCB), while data after 1990 was obtained from IMF, Western Hemisphere Department. For the non-ECCU countries data was obtained from the IMF’s World Economic Outlook (WEO) (series GCBXI for primary balance, and series NGDP for nominal GDP). For Haiti, in the absence of data on primary balance, fiscal stance was proxied by overall balance (WEO, series GGB). (ii) Primary expenditure, divided by nominal GDP: For the ECCU countries, the primary expenditure series before 1990 was obtained from the ECCB, while that after 1990 was from the Western Hemisphere Department, desk data. For the non-ECCU countries, the data was obtained from WEO (series GCENL). De facto exchange rate regime. Reinhart-Rogoff (2002) classification of exchange rate regimes and the IMF’s Annual Report on Exchange Arrangements and Exchange Restrictions, various issues. Gross domestic product. For ECCU countries from IMF, Western Hemisphere Department. For the rest of the Caribbean countries from WEO (series W_NGDP_R). Election dates. From Database of Political Institutions, World Bank. ECCB foreign reserves coverage was measured by the ratio of foreign assets at the ECCB in terms of reserve money (lines 1L. DZF and 14...ZF in IMF’s International Financial Statistics, IFS). Nominal exchange rate between EC$ and US$ (series AE.ZF in IFS) was used to convert foreign assets of the ECCB in US$ to that in EC$. Terms of trade. WEO, Series W_TT . Openness. Defined as the sum of exports and imports of goods and services, divided by nominal gross domestic product. For ECCU countries, these series were obtained from the IFS, series codes 90C..ZF… (exports), 98C..ZF… (imports) and 99B..ZF… (nominal GDP). For rest of Caribbean, the series were obtained from WEO: WEO W_NX (exports), W_NM (imports) and W_NGDP (nominal GDP).
- 71 -
REFERENCES Bayoumi, T., M. Goldstein, and G. Wolgrom, 1995, “Do Credit Markets Discipline
Sovereign Borrowers? Evidence from U.S. States,” Journal of Money Credit and Banking, Vol. 27, pp. 1046–1056.
Chari, V.V. and P. Kehoe, 2004, “On the Need for Fiscal Constraints in a Monetary Union,”
Federal Reserve Bank of Minneapolis, NBER Working paper No. 10232 (Cambridge, MA: National Bureau of Economic Research).
Chow, G. C., 1960, “Tests of Equality between Sets of Coefficients in Two Linear
Regressions,” Econometrica, Vol. 28, pp. 591–605. Duttagupta, R. and G. Tolosa, 2005, “Fiscal Policy in a Regional Currency Board: Is the`
ECCU a Free-Riding Paradise?,” forthcoming IMF Working Paper (Washington DC: International Monetary Fund).
Fatas, A. and A. Rose, 2001, “Do Monetary Handcuffs Restrain Leviathan? Fiscal Policies in
Extreme Exchange Rate Regimes,” IMF Staff Papers, Vol. 47, Special Issue, pp. 40–61.
Frenkel, J., M. Goldstein, and P. Masson, 1991, “Characteristics of a Successful Exchange
Rate System,” IMF Occasional Paper No. 82 (Washington DC: International Monetary Fund).
Giavazzi, F. and M. Pagano, 1988, “The Advantage of Tying One’s Hands: EMS Discipline
and Central Bank Credibility,” European Economic Review, Vol. 32, pp. 1055–1075.
Hendrickson, M., K. Katjomuise, H. McBain, and E. Pérez, 2002, “Monetary, Fiscal Policy and Economic Performance in a Monetary Union—The Case of the Eastern Caribbean Currency Union,” mimeo, ECLAC.
International Monetary Fund, Annual Report on Exchange Arrangements and Exchange
Restrictions (Washington DC: International Monetary Fund). Kaminsky, G., C. Reinhart, and C. Végh, 2004, “When it Rains, it Pours: Procyclical Capital
Flows and Macroeconomic Policies,” NBER Working Paper No. 10780 (Cambridge, MA: National Bureau of Economic Research).
Krugman, P. 1979, “A Model of Balance of Payments Crisis,” Journal of Money, Credit and
Banking, Vol. 11, pp. 311–325.
- 72 -
Manasse, P., N. Roubini, and A. Schimmelpfennig, 2003, “Predicting Sovereign Debt Crisis”, IMF Working Paper WP/03/221 (Washington DC: International Monetary Fund).
Rasmussen, T., 2004, “Macroeconomic Implications of Natural Disasters in the Caribbean,” IMF Working Paper WP/04/224 (Washington DC: International Monetary Fund).
Rasmussen, T. and G. Tolosa, 2005, “Islands of Stability? Determinants of Macroeconomic
Volatility in the ECCU,” in Eastern Caribbean Currency Union—Selected Issues, Chapter II.
Reinhart, C., 2002, “Default, Currency Crises and Sovereign Credit Ratings,” NBER Working
Paper No. 8738. Also published in The World Bank Economic Review, Vol. 16, pp. 151–170.
Reinhart, C. and K. Rogoff, 2002, “The Modern History of Exchange Rate Arrangements: A
Reinterpretation,” NBER Working Paper 8963 (Cambridge, MA: National Bureau of Economic Research).
Reinhart, C., K. Rogoff, and M. Savastano, 2003, “Debt Intolerance,” NBER Working Paper
No. 9908 (Cambridge, MA: National Bureau of Economic Research). Sahay, R., 2005, “Stabilization, Debt and Fiscal Policy in the Caribbean” IMF Working
Paper WP/05/26 (Washington DC: International Monetary Fund). Sargent, T. and N. Wallace, 1981, “Some Unpleasant Monetarist Arithmetic,” Federal
Reserve Bank of Minnesota Quarterly Review, Vol. 5 (3). Sun, Y., 2003, “Do Fixed Exchange Rates Induce More Fiscal Discipline?,” IMF Working
Paper WP/03/78 (Washington DC: International Monetary Fund). Tornell, A. and A. Velasco, 2000, “Fixed or Flexible Exchange Rates: Which Provides More
Fiscal Discipline?,” Journal of Monetary Economics, Vol. 45, pp. 399–436. van Beek, F., J.R. Rosales, M. Zermeno, R. Randall, and J. Shepherd, 2000, The Eastern
Caribbean Currency Union, IMF Occasional Paper 195 (Washington DC: International Monetary Fund).
von Hagen, J. and I. Harden, 1996, “Budget Processes and Commitment to Fiscal
Discipline,” IMF Working Paper WP/96/78 (Washington DC: International Monetary Fund).
Wildasin, D. E., 1997, “Hard and Soft Budget Constraints in Intergovernmental Fiscal
Relations,” mimeo, Vanderbilt University.
- 73 -
V. TAX CONCESSIONS AND FOREIGN DIRECT INVESTMENT IN THE ECCU1
A. Introduction
1. Tax concessions―defined as preferential tax treatment for certain types of firms or entities―are commonplace in developed as well as developing countries. Concessions are granted to promote investment, in which case they may be termed tax incentives or investment incentives, or to achieve defined social objectives. For example, corporate income tax (CIT) holidays for five to ten years may be granted to firms that export goods and services or that locate in designated areas or regions. Exemptions from import-related duties and taxes may also be given, which may be on capital imports to promote investment or on a wide range of other imported goods for statutory or civic bodies or nonprofit organizations. 2. Cross-country experience in the use of tax concessions is quite varied. More than 100 countries employ tax concessions to attract foreign direct investment (FDI). Some countries have been granting increasingly generous concessions, for instance, by extending the duration of existing tax holidays (see UNCTAD and DCTI, 1996; Easson, 2004). Realizing that concessions can be very costly as a tool to promote investment, however, many countries have begun taking legal and administrative steps to restrict eligibility criteria and enforce compliance. 3. Meanwhile, several analytical studies, including a recent survey of multinational firms in the Caribbean, raise doubts about the efficacy and cost effectiveness of concessions. In surveys of investors and regression analyses, tax concessions are not among the key determinants of investment. In a recent survey of 159 multinational firms operating in the Caribbean, conducted by the World Bank’s Foreign Investment Advisory Service, tax concessions were not even in the top 15 of the 40 areas that firms considered critical for their investments (see FIAS, 2004; and World Bank, 2005). Instead, the key determinants of investment were telecommunications, power supply, political stability, a favorable attitude towards FDI, and labor productivity.2 Where concessions are granted, the overly generous terms at which they are given often render the investments cost ineffective. 4. This chapter analyzes the costs and benefits of tax concessions in the ECCU region.3 Data on concessions are very sparse, not only in the region but also across the world. The use of concessions in six ECCU member countries is documented, costs are
1 Prepared by Jingqing Chai and Rishi Goyal.
2 However, firms operating in tourism and financial services (including offshore), which were already benefiting from very generous concessions, reported that tax concessions were important.
3 The six member countries of the Eastern Caribbean Currency Union (ECCU) studied in this chapter are Antigua and Barbuda, Dominica, Grenada, St. Kitts and Nevis, St. Lucia, and St. Vincent and the Grenadines.
- 74 -
assessed in terms of revenue forgone, and benefits are evaluated in terms of FDI received. Measures of FDI regimes in a wide sample of countries are developed, building on previous work by Wei (2000). The main finding is that the ECCU countries rely heavily on the use of tax concessions. Moreover, the reliance on these concessions has increased significantly in Antigua and Barbuda and in St. Kitts and Nevis over the past decade. In the region, tax revenues forgone are large, ranging between 9½ and 16 percent of GDP annually, while the benefits appear to be modest. 5. Previous work on tax concessions in the ECCU has analyzed costs in terms of revenues forgone and proposed administrative reforms. Bain (1995) assessed the costs in the early 1990s, while Andrews and Williams (1999) suggested that the regime of administering concessions be streamlined. Lecraw (2003) made the case for a coordinated, harmonized approach to granting concessions. This chapter builds on this work, providing updated and additional calculations of revenue forgone, and analyzing benefits in terms of attracting FDI.
B. Tax Concessions in the ECCU: A Brief Overview
6. Tax concessions have been employed as a central component of the development strategy of the ECCU member countries. Concessions for investment in sectors such as tourism and light manufacturing have generally been provided through the member countries’ Fiscal Incentives and Hotels Aid Acts. Other concessions are provided in the Common External Tariff Act, and in specific legislation covering statutory bodies, state enterprises, large individual institutions (such as utilities companies), and particular sectors (e.g., the Offshore Banking Act and the International Business Companies Act). 7. Concessions are typically granted in the form of import-related tax exemptions and CIT holidays. Exemptions from import-related taxes (import duties and the general consumption tax) on the importation of capital goods (raw materials and equipment) are the most common forms of concessions. Such exemptions may be on 100 percent of taxes and duties owed, or for lesser amounts. They may also be granted for varying lengths of time. Similarly, holidays on CIT may be of varying amounts and lengths of time. 8. Considerable discretion is applied in the granting of concessions. Many concessions are provided on a case-by-case basis. Dominica, St. Lucia, and St. Vincent and the Grenadines have collected data more systematically than the other ECCU countries. Data on Dominica and St. Vincent and the Grenadines show that concessions granted under the Fiscal Incentives and Hotels Aid Acts account for less than 50 percent in value of the total customs duty concessions, whereas concessions granted by special cabinet decisions accounted for about 20 percent. Concessions related to government and statutory bodies (including for public investment) are in the range of 9 to 14 percent of total concessions.
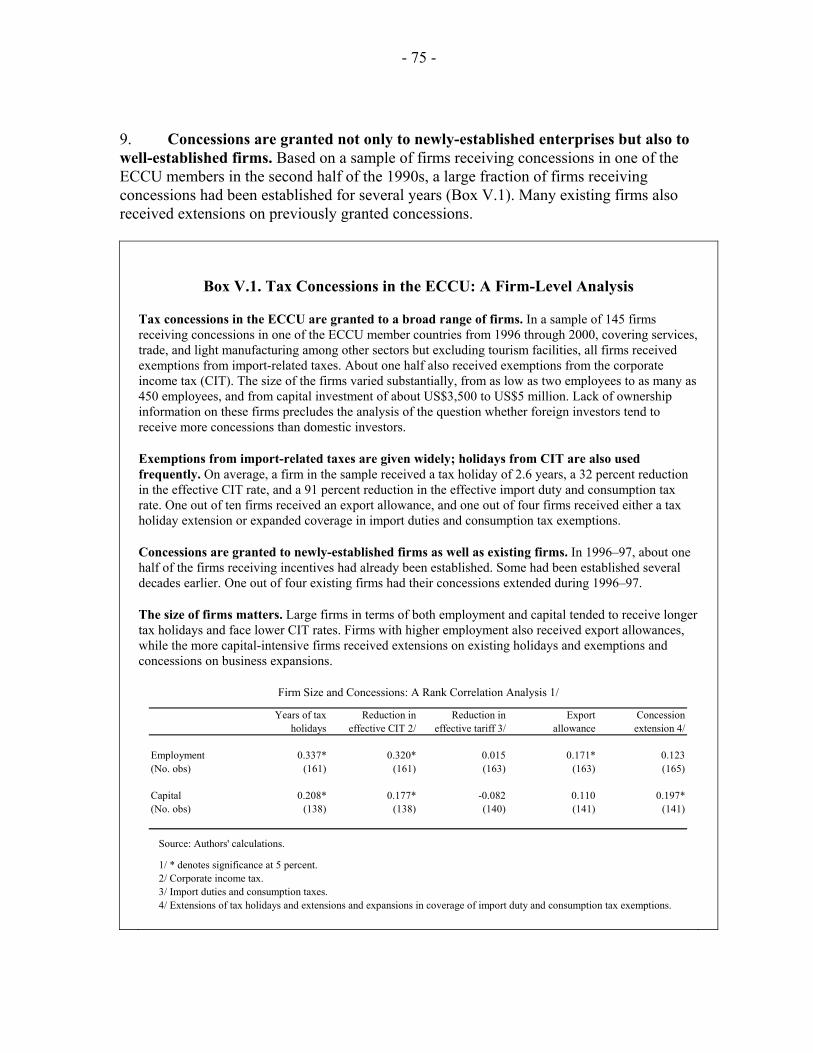
- 75 -
9. Concessions are granted not only to newly-established enterprises but also to well-established firms. Based on a sample of firms receiving concessions in one of the ECCU members in the second half of the 1990s, a large fraction of firms receiving concessions had been established for several years (Box V.1). Many existing firms also received extensions on previously granted concessions.
Box V.1. Tax Concessions in the ECCU: A Firm-Level Analysis
Tax concessions in the ECCU are granted to a broad range of firms. In a sample of 145 firms receiving concessions in one of the ECCU member countries from 1996 through 2000, covering services, trade, and light manufacturing among other sectors but excluding tourism facilities, all firms received exemptions from import-related taxes. About one half also received exemptions from the corporate income tax (CIT). The size of the firms varied substantially, from as low as two employees to as many as 450 employees, and from capital investment of about US$3,500 to US$5 million. Lack of ownership information on these firms precludes the analysis of the question whether foreign investors tend to receive more concessions than domestic investors.
Exemptions from import-related taxes are given widely; holidays from CIT are also used frequently. On average, a firm in the sample received a tax holiday of 2.6 years, a 32 percent reduction in the effective CIT rate, and a 91 percent reduction in the effective import duty and consumption tax rate. One out of ten firms received an export allowance, and one out of four firms received either a tax holiday extension or expanded coverage in import duties and consumption tax exemptions.
Concessions are granted to newly-established firms as well as existing firms. In 1996–97, about one half of the firms receiving incentives had already been established. Some had been established several decades earlier. One out of four existing firms had their concessions extended during 1996–97.
The size of firms matters. Large firms in terms of both employment and capital tended to receive longer tax holidays and face lower CIT rates. Firms with higher employment also received export allowances, while the more capital-intensive firms received extensions on existing holidays and exemptions and concessions on business expansions.
Years of tax Reduction in Reduction in Export Concession
holidays effective CIT 2/ effective tariff 3/ allowance extension 4/
Employment 0.337* 0.320* 0.015 0.171* 0.123(No. obs) (161) (161) (163) (163) (165)
Capital 0.208* 0.177* -0.082 0.110 0.197*(No. obs) (138) (138) (140) (141) (141)
Source: Authors' calculations.
1/ * denotes significance at 5 percent.2/ Corporate income tax.3/ Import duties and consumption taxes.4/ Extensions of tax holidays and extensions and expansions in coverage of import duty and consumption tax exemptions.
Firm Size and Concessions: A Rank Correlation Analysis 1/
- 76 -
10. The widespread use of tax concessions has been justified against the backdrop of increased competition in the tourism market in the wider Caribbean, and the reported threat by firms that they would leave otherwise. The ECCU region has increasingly faced tougher competition from other Caribbean countries (Figure V.1).4 One reaction has been a divergence from the 1973 CARICOM Agreement to harmonize concessions.5,6 Moreover, multinationals and other large regional firms have tended to play one island off another, thereby encouraging a race to the bottom (Box V.2).
Box V.2. Are Incentives Necessary for Attracting FDI?
In the ECCU region, there is a wide perception that incentives are needed to secure investments. The authorities consider that they are competing for similar investments and feel compelled to offer generous incentive packages out of fear that potential investors would locate their investments in neighboring countries. They may also extend incentives on existing investments to keep investors from relocating.
Given the widespread use of incentives, the perceived need for incentives is self perpetuating. Potential investments are at a cost disadvantage vis-à-vis existing investments in similar activities that receive incentives. Potential investors could argue for, and the authorities may feel compelled to offer, incentives to induce the new investment.
One result is investments or firms that remain continually incentives dependent. The investment regime becomes anchored around the granting of incentives not only for new investments but also for existing ones. Such incentives become quasi-permanent subsidies for the operation of firms.
A second result is that excessively generous incentives may be offered. As countries attempt to outbid one another for potential investments, the costs of incentives may outweigh the benefits. Such situations may result especially when there are political pressures to secure investments while the costs are nontransparent or not calculated.
4 Hotel room capacity increased sharply in the wider Caribbean, while hurricane-related damage to capacity in some ECCU countries, such as Antigua and Barbuda, was significant.
5 Lecraw (2003) provides a brief history of the 1973 Agreement.
6 It could also be that concessions are being used increasingly for social, rather than productive, purposes. The absence of data precludes an evaluation of this hypothesis.
- 77 -
C. Revenue Costs of Concessions 11. Overall revenue losses from concessions on import-related taxes and the CIT range between 9½ and 16 percent of GDP per year. As a percent of current revenues, the losses range between 30 and 70 percent. Exemptions from import duties and taxes 12. Revenue forgone from concessions on import duties or taxes has been very large in the ECCU countries, exceeding 8 percent of GDP annually and increasing over the past decade.7 Two complementary methods are used to estimate the revenue forgone in the ECCU. • First, data collected by the Customs and Excise Departments in each country show
that, in the early 2000s, exemptions granted ranged from 4.3 percent of GDP in Dominica to 12.2 percent of GDP in St. Kitts and Nevis (Table V.1). In the early 1990s, exemptions granted were about 6½ percent of GDP in the region, 1½ percent of GDP less than in the early 2000s.8
• Second, the difference between the statutory tax rate on imports (excise and duties)
and the effective tax rate on imports is exploited to estimate revenue losses.9 The difference in rates ranges from over 8 percent in Dominica to over 22 percent in Antigua and Barbuda. This difference in rates yields revenue losses similar to that collected by the Customs and Excise Departments of each country (Figure V.2). Average losses are nearly 8 percent of GDP for the region, ranging from about 4 percent of GDP in Dominica to over 12 percent of GDP in St. Kitts and Nevis.
13. The increase in concessions since the early 1990s has been particularly evident in Antigua and Barbuda and in St. Kitts and Nevis. Customs revenue forgone in these two countries was about 5 percent of GDP per year higher in 2001–2003 compared with the early 1990s. Data are not available to ascertain which types of concessions were expanded. One possibility is that concessions were increased to facilitate reconstruction after the severe natural disasters of the 1990s.
7 Although data on revenue forgone in other countries are generally not known, a recent study on the Philippines estimated revenue forgone at 1–2 percent of GDP annually (see Easson, 2004).
8 Data for the early 1990s are provided in Bain (1995).
9 Note that the revenue losses are due not only to concessions granted but also to leakages from administrative weaknesses.
- 78 -
Corporate income tax (CIT) holidays 14. Revenue forgone from CIT holidays may have exceeded 4 percent of GDP annually. In the absence of data from Inland Revenue Departments, the revenue forgone is estimated from the difference between the statutory and the effective CIT rates. Statutory rates range between 30 and 40 percent in the region, whereas effective rates are between 6 and 20 percent. Given the large differences, estimated revenue forgone is also substantial, ranging from 3 percent of GDP in Grenada to about 6 percent of GDP in Antigua and Barbuda (Figure V.3).10 15. CIT yields have declined since the early 1990s, which could reflect an expansion in concessions granted. The average yield fell moderately from 3.5 percent of GDP in 1990–1994 to 3.0 percent in 1999–2003 (Table V.2). Declines were observed in some countries, particularly Dominica, but increased somewhat in two countries, although from low bases. 16. The decline in yields has come at a time when CIT collections have eroded across many developing countries. With capital market integration appearing to have strengthened, low tax rates could be expected to apply to internationally mobile capital, all else being equal. If low rates are not applied, capital could be moved to other lower tax rate destinations. Revenue collections from removing concessions: An elasticities approach
17. A common perception in the ECCU region is that investment and revenue collection would decline in the absence of concessions. While there is agreement that revenue is forgone due to concessions, some consider that investments would not have taken place without the concessions. Hence, they argue that the employment and revenue resulting from the new investments (that benefit from concessions) are net gains. 18. However, calculations based on plausible demand elasticities suggest that revenue collections could increase substantially by removing concessions. Depending on demand elasticities, higher effective tax rates could offset declines in import volumes and corporate incomes, following the removal of concessions. For instance, if demand were perfectly inelastic, then overall revenue collections would increase. But if demand were elastic, then overall revenue collections would decrease. • Empirical studies have estimated relatively inelastic import price elasticities for
developing countries, ranging between -1.0 and -0.4 (see Khan, 1974; and Khan and 10 National accounts data on the income side are not available for the ECCU member countries. The corporate income tax base is assumed to be 25 percent of GDP, in line with the number for Jamaica.
- 79 -
Knight, 1988). Indeed, in small, highly open economies—such as those in the ECCU—that import the bulk of goods consumed and invested and that depend mainly on high-income, relatively price-inelastic tourist clienteles, import demand is arguably inelastic.
• Assuming a price elasticity of -0.7 both for import volumes and corporate incomes,
the revenue gain from removing concessions is 9 percent of GDP on average, ranging from 7 percent of GDP for Dominica to 12 percent of GDP for St. Kitts and Nevis (Table V.3).
The next section examines the effect of incentives on foreign investment.
D. Benefits of Incentives: FDI Performance in the ECCU 19. Despite the fact that concessions have increased over the past decade, the ECCU’s world ranking of FDI as a share of GDP has fallen. Indeed, the increase in concessions in the region does not seem to be reflected in changes in the FDI-to-GDP ratio (Figure V.4). The average ranking of the ECCU countries fell from fifth out of over 150 on the FDI-to-GDP ratio to twentieth by 2002.11 The ECCU share of Caribbean FDI inflows also declined from 12.3 percent to 3.7 percent over the same period (Table V.4). 20. To analyze the effect of incentives on FDI, a broad cross-country study was conducted. Two indices were constructed—an FDI restrictions index and an FDI incentives index—using the methodology of Wei (2000), to relate differences in incentives regimes with FDI performance. Moreover, Wei’s database was expanded to cover 80 countries (Box V.3). The ECCU countries have a generally pro-FDI policy, with incentives provided for select sectors (notably offshore financial services, tourism, and manufacturing) and exports.
11 See World Bank (2005). Even though the relative ranking of the ECCU region has fallen over time, the share of FDI in GDP has remained high, reflecting its natural endowment as a prime tourist destination and the small size of its economies.
- 80 -
Box V.3. Constructing FDI Regime Indices
The FDI restrictions and incentives indices measure the government’s policies towards FDI and are constructed using the methodology of Wei (2000). Each index is a sum of four variables, each of which takes a value of either 0 or 1. Publicly available sources, including PricewaterhouseCooper’s Investment Guides and various investment agency reports, were used in compiling the indices. The restrictions index measures: (i) whether there are controls on foreign exchange that interfere with foreign firms’ ability to import intermediate inputs or repatriate profits; (ii) whether there is a ban on foreign investments in strategic sectors (in particular, national defense and the mass media); (iii) whether there is a ban on foreign investments in other sectors where their presence would be considered harmless in most developed countries; and (iv) whether there are limits on ownership share. A higher index value indicates a more restrictive FDI policy. The incentives index measures: (i) whether there are special incentives to invest in certain industries or geographical areas; (ii) whether exports are specially promoted, including through export processing zones and special economic zones; (iii) whether there are tax concessions specific to foreign firms excluding those designed specifically for export promotion; and (iv) whether there are cash grants, subsidized loans, reduced rent for land use, or other nontax concessions specific to foreign firms. A higher index value indicates a broader FDI incentives regime.
21. Higher statutory CIT rates and import-related tax rates are negatively related to FDI (Figures V.5 and V.6). Higher CIT and import-related taxes lower the after-tax return to capital and raise production costs, thereby hindering investment. The ECCU average CIT rate is 4 percentage points higher than in small island states, while the average import tariff rate is 2 percentage points higher (Table V.5). Subject to fiscal constraints, there appears to be scope to reduce tax rates and broaden the tax base. 22. A restrictive FDI regime is negatively associated with FDI, but there is little evidence that FDI incentives are associated with higher FDI (Figures V.7 and V.8). These findings are consistent with past empirical studies of other regions, including surveys. The absence of a relationship between incentives and FDI is confirmed in cross-country regression analyses (Tables V.6 and V.7 and Box V.4). The incentives index is insignificant in all econometric specifications. The finding that FDI performance is positively related to a low CIT rate is fairly robust across specifications. There is also evidence that good governance and the lack of FDI restrictions are positively related to FDI.12
12 The statistical significance of the CIT rate is driven by three “tax haven” countries. When these countries are excluded from the estimation, the CIT has the correct sign, but is statistically insignificant. Instead, the FDI restrictions index and the ECCU fixed effect become statistically more significant.
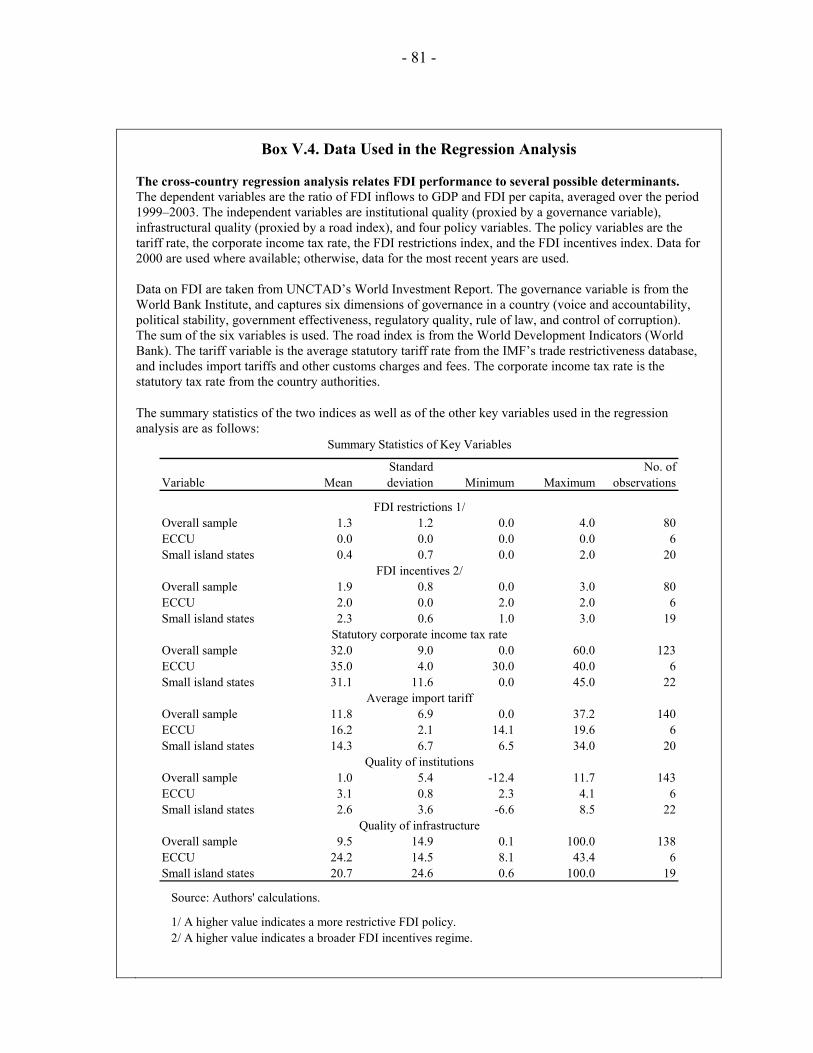
- 81 -
Box V.4. Data Used in the Regression Analysis
The cross-country regression analysis relates FDI performance to several possible determinants. The dependent variables are the ratio of FDI inflows to GDP and FDI per capita, averaged over the period 1999–2003. The independent variables are institutional quality (proxied by a governance variable), infrastructural quality (proxied by a road index), and four policy variables. The policy variables are the tariff rate, the corporate income tax rate, the FDI restrictions index, and the FDI incentives index. Data for2000 are used where available; otherwise, data for the most recent years are used. Data on FDI are taken from UNCTAD’s World Investment Report. The governance variable is from the World Bank Institute, and captures six dimensions of governance in a country (voice and accountability, political stability, government effectiveness, regulatory quality, rule of law, and control of corruption). The sum of the six variables is used. The road index is from the World Development Indicators (World Bank). The tariff variable is the average statutory tariff rate from the IMF’s trade restrictiveness database, and includes import tariffs and other customs charges and fees. The corporate income tax rate is the statutory tax rate from the country authorities.
The summary statistics of the two indices as well as of the other key variables used in the regression analysis are as follows:
Standard No. ofVariable Mean deviation Minimum Maximum observations
Overall sample 1.3 1.2 0.0 4.0 80ECCU 0.0 0.0 0.0 0.0 6Small island states 0.4 0.7 0.0 2.0 20
Overall sample 1.9 0.8 0.0 3.0 80ECCU 2.0 0.0 2.0 2.0 6Small island states 2.3 0.6 1.0 3.0 19
Overall sample 32.0 9.0 0.0 60.0 123ECCU 35.0 4.0 30.0 40.0 6Small island states 31.1 11.6 0.0 45.0 22
Overall sample 11.8 6.9 0.0 37.2 140ECCU 16.2 2.1 14.1 19.6 6Small island states 14.3 6.7 6.5 34.0 20
Overall sample 1.0 5.4 -12.4 11.7 143ECCU 3.1 0.8 2.3 4.1 6Small island states 2.6 3.6 -6.6 8.5 22
Overall sample 9.5 14.9 0.1 100.0 138ECCU 24.2 14.5 8.1 43.4 6Small island states 20.7 24.6 0.6 100.0 19
Source: Authors' calculations.
1/ A higher value indicates a more restrictive FDI policy.2/ A higher value indicates a broader FDI incentives regime.
Quality of infrastructure
FDI incentives 2/
Summary Statistics of Key Variables
Statutory corporate income tax rate
FDI restrictions 1/
Quality of institutions
Average import tariff
- 82 -
E. Summary and Policy Conclusions
23. Tax concessions have been employed as a key component of the investment and development strategy of ECCU member countries. Considerable discretion has been applied in the granting of concessions—mainly import-related tax concessions and corporate income tax holidays—for investment and social purposes. Incentives have been given not only for new investments but also for ones that have been in operation for several years. Larger firms have tended to receive more incentives and for longer periods of time.
24. The benefits in terms of FDI appear to be limited, but the costs in terms of revenue forgone are substantial. A broad cross-country analysis shows that incentives are not related to FDI. Rather, in line with results from investor surveys and regression analyses in the economics literature, lower statutory tax rates, the absence of FDI restrictions, and better institutional and infrastructural quality are related to FDI. Estimates of revenue forgone range between 9½ and 16 percent of GDP annually for the ECCU countries.
25. The strategy of using incentives to promote development should be re-evaluated urgently, possibly within a regional context. A regional approach to harmonizing concessions would help limit each country’s large revenue losses, and avoid the tax competition that has produced a race to the bottom.
26. The development strategy should, therefore, focus on enhancing the investment climate. Some countries, such as Mexico and Hong Kong, have attracted substantial investments without tax incentives. Mexico’s tourism industry attracted more than US$2¼ billion in new investments in 2003, without income tax holidays. In 2004, Mexico received a historic high of over 20 million international visitors and over US$10 billion in tourism receipts. Hong Kong has been a top performer in attracting FDI with a uniform 15 percent income tax rate and no tax incentives. Enhancing the investment climate entails addressing key investor concerns such as improving the regulatory environment, developing infrastructure, and raising labor productivity through skills acquisition and labor market reform.
27. Concessions should be reduced significantly or phased out and the tax base broadened, while statutory tax rates should be lowered. If tax rates are lowered but concessions are not phased out, the fiscal and macroeconomic environment would deteriorate, which would deter investment and lower growth.
28. Meanwhile, concessions should be nondiscretionary, transparent, and limited in size, duration and scope. Discretionary concessions should be eliminated, which would alleviate the administrative burden on the Cabinet and the line ministries and free them up to focus on other pressing matters. In Dominica, no ad hoc import concessions have been granted by the Cabinet since mid-December 2003 following their decision to reduce significantly discretionary tax concessions. Existing concessions should be reviewed, and the cost of all concessions granted should be published in a tax expenditure annex to the budget.
- 83 -
29. When incentives are granted, careful consideration should be given to the choice of instrument. Incentives may be granted in a variety of forms, each with differing characteristics (see Zee, Stotsky, and Ley, 2002). CIT holidays are relatively easy to administer, but have several disadvantages. Since profits are exempted irrespective of amount, they tend to benefit investors with high profits who would likely have undertaken the investment even without the incentive. Moreover, they increase the potential of tax avoidance through transfer pricing. To encourage investment, tax credits for investment, accelerated depreciation, and loss carrying forward provisions could be considered. Indirect tax incentives such as exemptions from import-related taxes are very prone to abuse, including by the diversion of qualified purchases to those not intended to receive the incentives, and should be avoided.
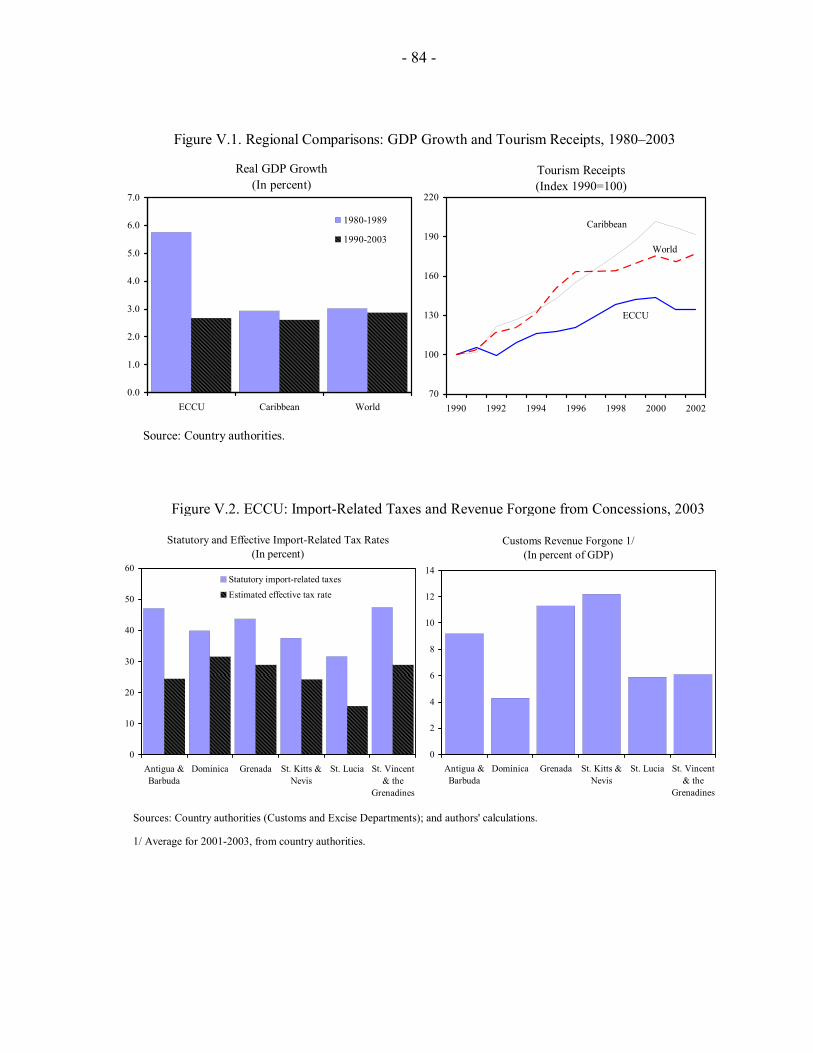
- 84 -
Figure V.1. Regional Comparisons: GDP Growth and Tourism Receipts, 1980–2003
Source: Country authorities.
0.0
1.0
2.0
3.0
4.0
5.0
6.0
7.0
ECCU Caribbean World
1980-1989
1990-2003
ECCU
World
Caribbean
70
100
130
160
190
220
1990 1992 1994 1996 1998 2000 2002
Real GDP Growth(In percent)
Tourism Receipts (Index 1990=100)
Figure V.2. ECCU: Import-Related Taxes and Revenue Forgone from Concessions, 2003
Sources: Country authorities (Customs and Excise Departments); and authors' calculations.
1/ Average for 2001-2003, from country authorities.
0
10
20
30
40
50
60
Antigua &Barbuda
Dominica Grenada St. Kitts &Nevis
St. Lucia St. Vincent& the
Grenadines
Statutory import-related taxes
Estimated effective tax rate
Statutory and Effective Import-Related Tax Rates(In percent)
Customs Revenue Forgone 1/(In percent of GDP)
0
2
4
6
8
10
12
14
Antigua &Barbuda
Dominica Grenada St. Kitts &Nevis
St. Lucia St. Vincent& the
Grenadines
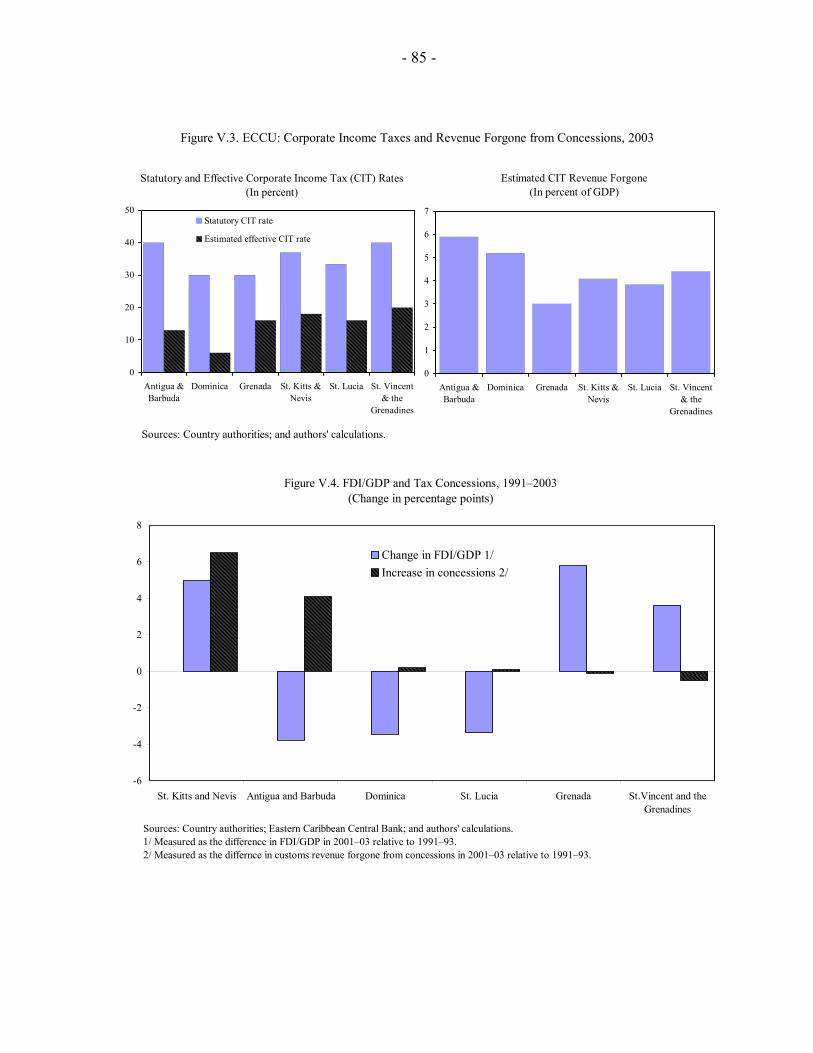
- 85 -
Figure V.3. ECCU: Corporate Income Taxes and Revenue Forgone from Concessions, 2003
Sources: Country authorities; and authors' calculations.
0
10
20
30
40
50
Antigua &Barbuda
Dominica Grenada St. Kitts &Nevis
St. Lucia St. Vincent& the
Grenadines
Statutory CIT rate
Estimated effective CIT rate
Statutory and Effective Corporate Income Tax (CIT) Rates(In percent)
Estimated CIT Revenue Forgone(In percent of GDP)
0
1
2
3
4
5
6
7
Antigua &Barbuda
Dominica Grenada St. Kitts &Nevis
St. Lucia St. Vincent& the
Grenadines
Figure V.4. FDI/GDP and Tax Concessions, 1991–2003(Change in percentage points)
-6
-4
-2
0
2
4
6
8
St. Kitts and Nevis Antigua and Barbuda Dominica St. Lucia Grenada St.Vincent and theGrenadines
Change in FDI/GDP 1/Increase in concessions 2/
Sources: Country authorities; Eastern Caribbean Central Bank; and authors' calculations.1/ Measured as the difference in FDI/GDP in 2001–03 relative to 1991–93.2/ Measured as the differnce in customs revenue forgone from concessions in 2001–03 relative to 1991–93.
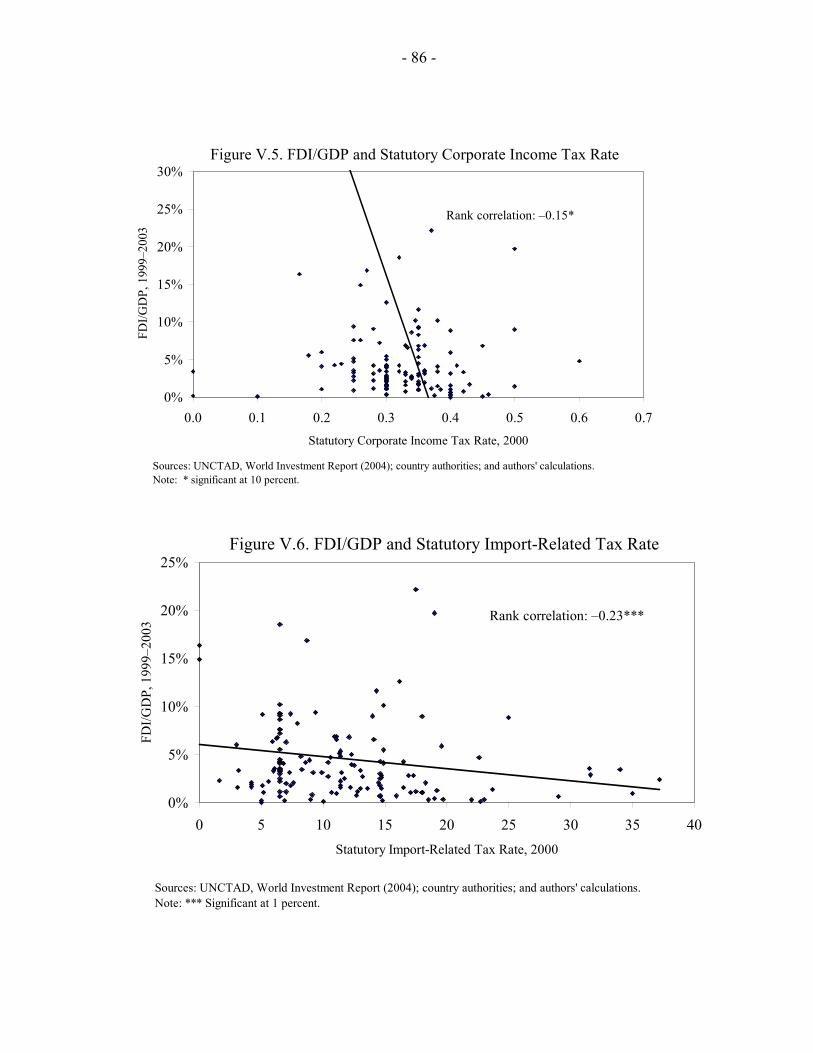
- 86 -
Figure V.5. FDI/GDP and Statutory Corporate Income Tax Rate
0%
5%
10%
15%
20%
25%
30%
0.0 0.1 0.2 0.3 0.4 0.5 0.6 0.7Statutory Corporate Income Tax Rate, 2000
FDI/G
DP,
199
9–20
03
Rank correlation: –0.15*
Sources: UNCTAD, World Investment Report (2004); country authorities; and authors' calculations.Note: * significant at 10 percent.
Figure V.6. FDI/GDP and Statutory Import-Related Tax Rate
0%
5%
10%
15%
20%
25%
0 5 10 15 20 25 30 35 40Statutory Import-Related Tax Rate, 2000
FDI/G
DP,
199
9–20
03
Rank correlation: –0.23***
Sources: UNCTAD, World Investment Report (2004); country authorities; and authors' calculations.Note: *** Significant at 1 percent.
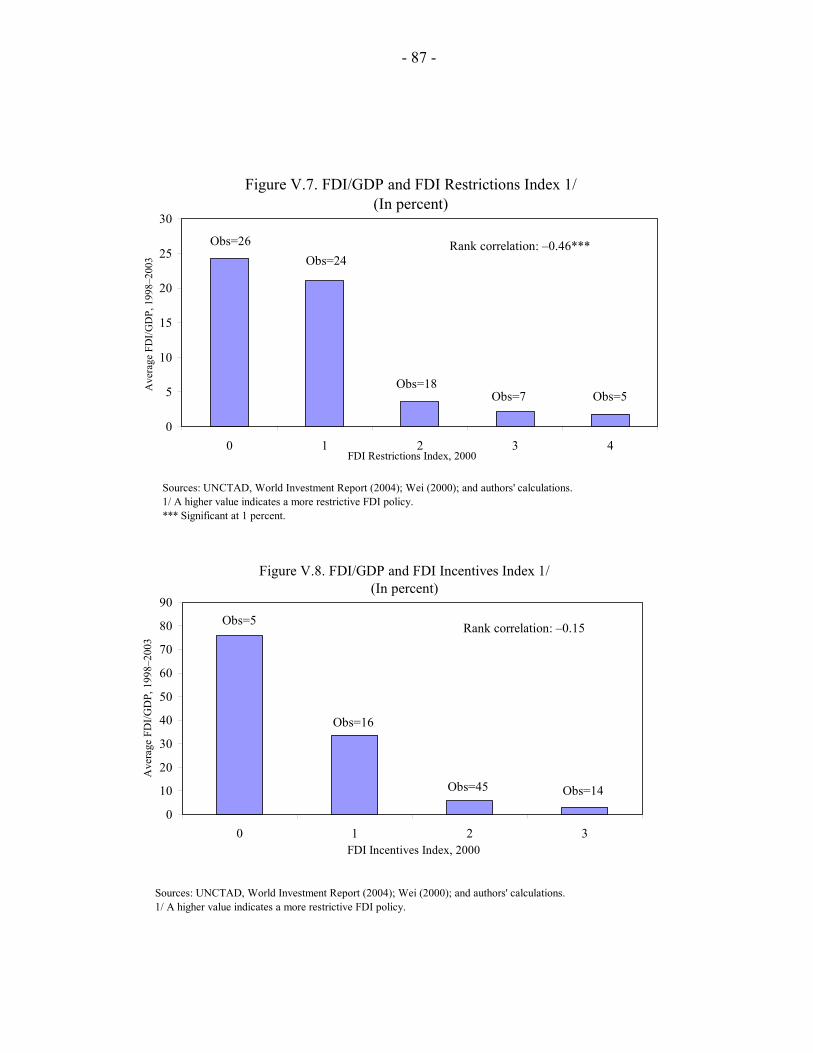
- 87 -
Figure V.7. FDI/GDP and FDI Restrictions Index 1/(In percent)
0
5
10
15
20
25
30
0 1 2 3 4FDI Restrictions Index, 2000
Ave
rage
FD
I/GD
P, 1
998–
2003
Obs=26Obs=24
Obs=7Obs=18
Obs=5
Sources: UNCTAD, World Investment Report (2004); Wei (2000); and authors' calculations. 1/ A higher value indicates a more restrictive FDI policy. *** Significant at 1 percent.
Rank correlation: –0.46***
Figure V.8. FDI/GDP and FDI Incentives Index 1/(In percent)
0
10
20
30
40
50
60
70
80
90
0 1 2 3FDI Incentives Index, 2000
Ave
rage
FD
I/GD
P, 1
998–
2003
Obs=5
Obs=16
Obs=45 Obs=14
Sources: UNCTAD, World Investment Report (2004); Wei (2000); and authors' calculations. 1/ A higher value indicates a more restrictive FDI policy.
Rank correlation: –0.15
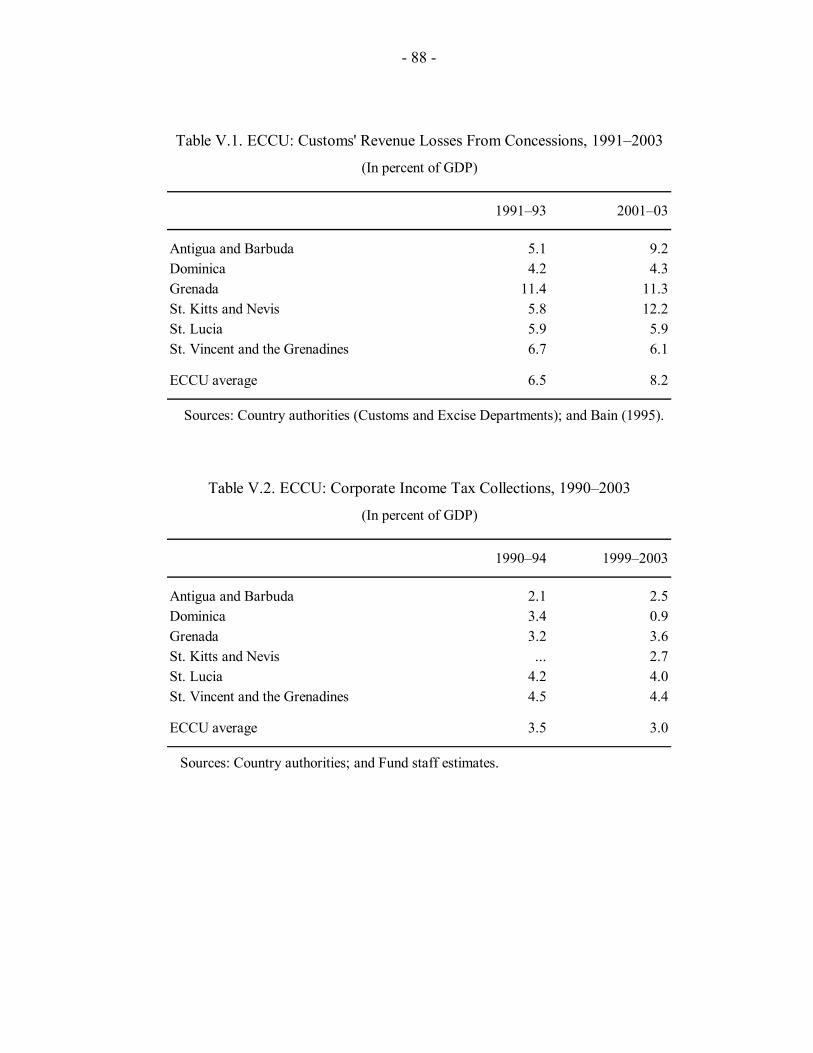
- 88 -
1991–93 2001–03
Antigua and Barbuda 5.1 9.2Dominica 4.2 4.3Grenada 11.4 11.3St. Kitts and Nevis 5.8 12.2St. Lucia 5.9 5.9St. Vincent and the Grenadines 6.7 6.1
ECCU average 6.5 8.2
Sources: Country authorities (Customs and Excise Departments); and Bain (1995).
Table V.1. ECCU: Customs' Revenue Losses From Concessions, 1991–2003
(In percent of GDP)
1990–94 1999–2003
Antigua and Barbuda 2.1 2.5Dominica 3.4 0.9Grenada 3.2 3.6St. Kitts and Nevis ... 2.7St. Lucia 4.2 4.0St. Vincent and the Grenadines 4.5 4.4
ECCU average 3.5 3.0
Sources: Country authorities; and Fund staff estimates.
Table V.2. ECCU: Corporate Income Tax Collections, 1990–2003
(In percent of GDP)

- 89 -
Import-related taxes Corporate income taxes Total
Antigua and Barbuda 6.2 4.2 10.4Dominica 3.1 4.1 7.2Grenada 7.8 2.4 10.2St. Kitts and Nevis 9.0 3.0 12.0St. Lucia 4.6 2.9 7.6St. Vincent and the Grenadines 4.1 3.2 7.3
ECCU average 5.8 3.3 9.1
Source: Authors' calculations.
1/ Assuming a price elasticity of –0.7.
(In percent of GDP)
Table V.3. Revenue Gains from the Removal of Concessions: An Elasticities Approach 1/
1979–83 1984–88 1989–93 1994–98 1999–2003
Antigua and Barbuda 24.1 12.3 11.4 3.5 2.6Dominica 2.5 8.0 10.9 8.8 2.3Grenada 1.8 7.1 8.5 6.2 5.3St. Kitts and Nevis 12.3 16.4 19.2 7.0 8.4St. Lucia 37.4 10.8 12.1 4.9 2.3St. Vincent and the Grenadines 3.0 5.0 7.7 14.5 4.0
ECCU 16.0 11.7 11.7 8.1 4.3Small island economies 2/ 7.0 8.9 7.6 6.7 8.2Latin America and the Caribbean 1.8 1.5 1.4 2.0 1.6Developing countries 1.4 1.2 1.4 1.8 1.2
Sources: UNCTAD, World Investment Report 2004; and authors' calculations.
1/ Performance index is the share of a country's FDI inflow in the world's FDI inflow, divided by the share of the country's GDP in the world's GDP. 2/ Includes the six ECCU member countries of the IMF, The Bahamas, Bermuda, Cayman Islands,Cyprus, Dominican Republic, Guyana, Haiti, Jamaica, Malta, Mauritius, Papua New Guinea, Samoa, Seychelles, and Trinidad and Tobago.
Table V.4. FDI Performance Index 1/
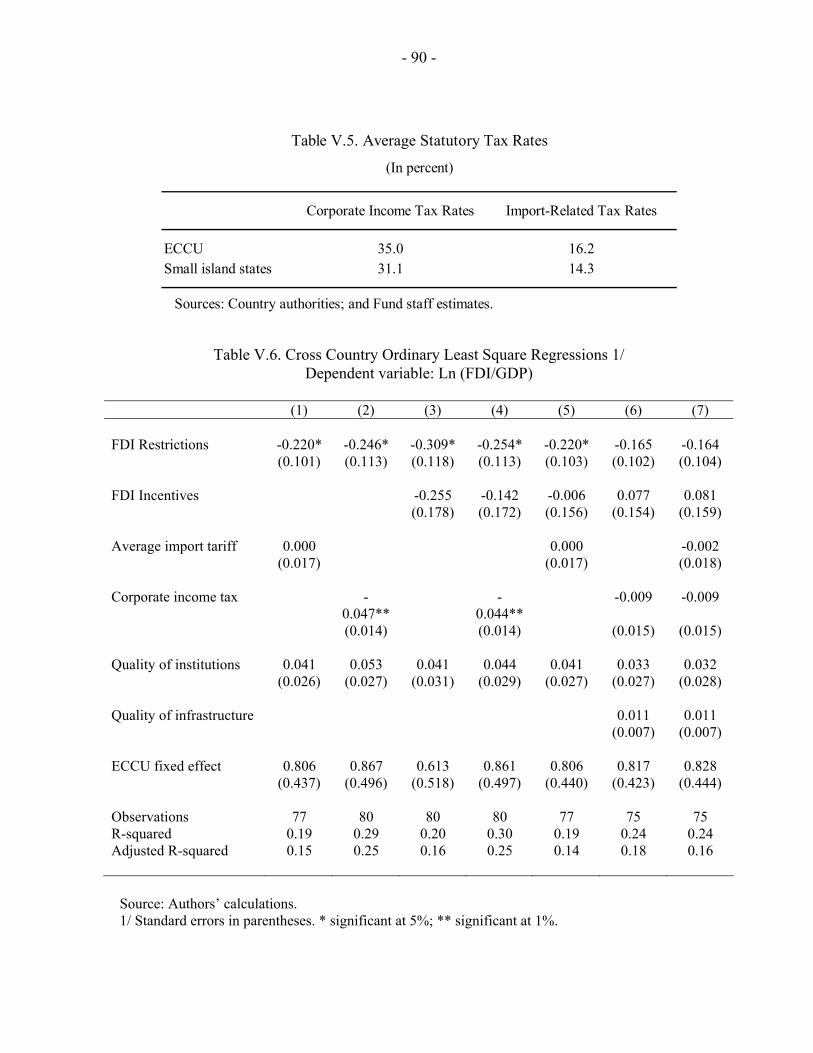
- 90 -
Corporate Income Tax Rates Import-Related Tax Rates
ECCU 35.0 16.2Small island states 31.1 14.3
Sources: Country authorities; and Fund staff estimates.
Table V.5. Average Statutory Tax Rates
(In percent)
Table V.6. Cross Country Ordinary Least Square Regressions 1/ Dependent variable: Ln (FDI/GDP)
(1) (2) (3) (4) (5) (6) (7) FDI Restrictions -0.220* -0.246* -0.309* -0.254* -0.220* -0.165 -0.164 (0.101) (0.113) (0.118) (0.113) (0.103) (0.102) (0.104) FDI Incentives -0.255 -0.142 -0.006 0.077 0.081 (0.178) (0.172) (0.156) (0.154) (0.159) Average import tariff 0.000 0.000 -0.002 (0.017) (0.017) (0.018) Corporate income tax -
0.047** -
0.044** -0.009 -0.009
(0.014) (0.014) (0.015) (0.015) Quality of institutions 0.041 0.053 0.041 0.044 0.041 0.033 0.032 (0.026) (0.027) (0.031) (0.029) (0.027) (0.027) (0.028) Quality of infrastructure 0.011 0.011 (0.007) (0.007) ECCU fixed effect 0.806 0.867 0.613 0.861 0.806 0.817 0.828 (0.437) (0.496) (0.518) (0.497) (0.440) (0.423) (0.444) Observations 77 80 80 80 77 75 75 R-squared 0.19 0.29 0.20 0.30 0.19 0.24 0.24 Adjusted R-squared 0.15 0.25 0.16 0.25 0.14 0.18 0.16
Source: Authors’ calculations. 1/ Standard errors in parentheses. * significant at 5%; ** significant at 1%.
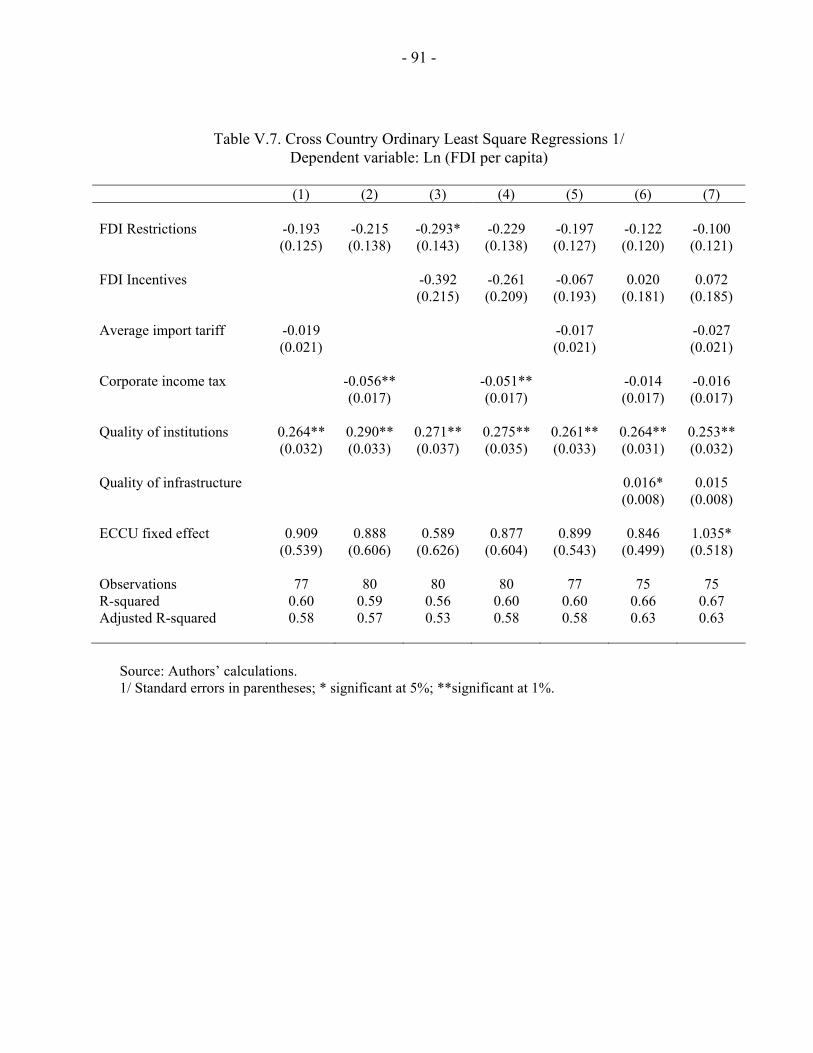
- 91 -
Table V.7. Cross Country Ordinary Least Square Regressions 1/ Dependent variable: Ln (FDI per capita)
(1) (2) (3) (4) (5) (6) (7) FDI Restrictions -0.193 -0.215 -0.293* -0.229 -0.197 -0.122 -0.100 (0.125) (0.138) (0.143) (0.138) (0.127) (0.120) (0.121) FDI Incentives -0.392 -0.261 -0.067 0.020 0.072 (0.215) (0.209) (0.193) (0.181) (0.185) Average import tariff -0.019 -0.017 -0.027 (0.021) (0.021) (0.021) Corporate income tax -0.056** -0.051** -0.014 -0.016 (0.017) (0.017) (0.017) (0.017) Quality of institutions 0.264** 0.290** 0.271** 0.275** 0.261** 0.264** 0.253** (0.032) (0.033) (0.037) (0.035) (0.033) (0.031) (0.032) Quality of infrastructure 0.016* 0.015 (0.008) (0.008) ECCU fixed effect 0.909 0.888 0.589 0.877 0.899 0.846 1.035* (0.539) (0.606) (0.626) (0.604) (0.543) (0.499) (0.518) Observations 77 80 80 80 77 75 75 R-squared 0.60 0.59 0.56 0.60 0.60 0.66 0.67 Adjusted R-squared 0.58 0.57 0.53 0.58 0.58 0.63 0.63
Source: Authors’ calculations. 1/ Standard errors in parentheses; * significant at 5%; **significant at 1%.
- 92 -
REFERENCES Andrews, L. and K. Williams, 1999, “Improving the Administration for Granting Tax
Concessions in the OECS,” mimeo, Eastern Caribbean Central Bank. Bain, L., 1995, “Tax Concessions and their Impact on the Revenue Base of the ECCB
Territories,” mimeo, Eastern Caribbean Central Bank. Easson, A., 2004, Tax Incentives for Foreign Direct Investment (New York: Kluwer Law
International). FIAS, 2004, Caribbean Foreign Investor Perceptions Survey (Washington DC: World
Bank). Khan, M., 1974, “The Structure and Behavior of Imports of Venezuela,” The Review of
Economics and Statistics, Vol. 57, pp. 221–224. —— and M. Knight, 1988, “Important Compression and Export Performance in Developing
Countries,” The Review of Economics and Statistics, Vol. 70, pp. 315–321. Lecraw, D., 2003, Investment Incentives and Harmonization, mimeo. UNCTAD, 2004, World Investment Report (New York: United Nations). —— and DTCI, 1996, Incentives and Foreign Direct Investment (New York: United
Nations). Wei, S. J., 2000, “Local Corruption and Global Capital Flows,” Brookings Papers on
Economic Activities, 2000 (2), pp. 303–354. World Bank, 2005, Towards a New Agenda for Growth: Organization of Eastern Caribbean
States (Washington, DC: World Bank). Zee, H., J. Stotsky, and E. Ley, 2002, “Tax Incentives for Business Investment: A Primer for
Policy Makers in Developing Countries,” World Development, Vol. 30, pp. 1497–1516.
- 93 -
VI. EMIGRATION AND BRAIN-DRAIN: EVIDENCE FROM THE CARIBBEAN1
A. Introduction 1. While a vast theoretical and empirical literature considers the impact of immigration on destination countries, little work has been done on emigration and its impact on source countries.2 This is surprising because the shares of the labor force leaving many individual source countries are considerably higher than the proportionate changes in the labor force of many receiving countries due to immigration. In several source countries, the reduction in the labor force due to emigration to the United States is in the range of 7–27 percent. To cite a few examples, the labor forces in Mexico, El Salvador, and Jamaica have been reduced by more than 10 percent due to emigration to the United States between 1970–2000. Similar rates were observed in Turkey and Algeria, where the labor force has emigrated to Western Europe. In comparison, immigrants constitute about 12 percent of the U.S. labor force (Davis and Weinstein, 2002). Immigration is considered to be a very important issue for the United States, and has attracted a great deal of attention in the literature. 2. The Caribbean region has the highest emigration rates in the world. Docquier and Marfouq (2004) have documented the shares of the labor force in several source countries that have emigrants to the OECD. About 12 percent of the labor force in the Caribbean region has migrated to the OECD—much higher than Central America, which ranks second at 7 percent. In terms of the absolute number of migrants, India and China, for example, are much greater, but their labor force is so large that migrants constitute a very small proportion of their labor force.
3. The aggregate emigration rates, however, understate the loss of the educated population. The literature on immigration to the United States suggests that immigration has increased, by the greatest proportion, the supply of workers with 0–8 years of schooling (Borjas et al., 1997). However, there is a sharp contrast when migration is examined from the perspective of source countries. For most source countries and especially for the Caribbean, the percentage reduction in the labor force is much larger in the higher-schooling categories. A majority of Caribbean countries have lost more than 50 percent of the labor force in the tertiary education segment, and more than 30 percent in the secondary education segment (with 9–12 years of schooling). For example, the tertiary educated labor force (with more than 12 years of schooling) in Jamaica and Guyana has been reduced by 89 percent and 83 percent respectively, due to emigration to the OECD. Haiti has the lowest aggregate
1 Prepared by Prachi Mishra.
2 See Borjas (1994, 1995) and Friedberg and Hunt (1995) for surveys of the empirical literature. The theoretical literature on international movement of factors includes for example, Bhagwati and Hamada (1974), Rivera-Batiz (1989), and Quibria (1989).
- 94 -
emigration rate (10 percent) in the region, but the tertiary educated labor force has been reduced by 82 percent due to emigration to the OECD. In fact, almost all the Caribbean nations are among the top 20 countries in the world with the highest tertiary-educated migration rates (Docquier and Marfouq, 2004).
4. The simple labor demand-supply framework suggests that changes in domestic labor supply and wages due to emigration lead to a net welfare reduction (termed an “emigration loss”) for the producers and workers who have stayed behind (Figure VI.1). The concept is analogous to the idea of immigration surplus that exists in the migration literature (Borjas, 1995). The concept was first given by MacDougall (1960) in the context of capital flows. The magnitude of migration rates from the Caribbean suggests that there can be potentially large impacts of migration on local labor markets and on the welfare of those who remain behind in Caribbean countries.
5. There are several other costs of high-skilled emigration. Highly-skilled workers in any country often confer externalities to other high- and low-skilled workers by affecting their productivity through transfer of know-how and also through better monitoring and motivation. If high-skilled workers confer a positive externality, then the loss due to their migration will be higher than the simple emigration loss. The augmented emigration loss—the emigration loss that takes into account the positive externality from the high-skilled labor force—is estimated in this chapter. Another important consideration in assessing the costs of migration is the subsidies that finance the education of migrants. Governments in countries such as Barbados, Jamaica and Trinidad and Tobago spend much more per capita on tertiary education than they do on primary and secondary education.
6. At the same time, emigration confers many benefits on source countries. One of the most important measurable “benefits” to the source countries are transfers from abroad or remittances. Most Caribbean countries rank among the top thirty countries in the world with the highest remittances as a percent of GDP. The Caribbean region is the world’s largest recipient of remittances, as a share of GDP. Remittances constituted about 13 percent of the region’s GDP in 2002.
7. The main result in the chapter is that the total losses due to skilled migration (which includes the “emigration loss”, externality effects and government expenditure on educating the migrants) outweigh the recorded remittances for almost all the Caribbean countries. The calculations in the chapter are, however, not sufficient to conclude one way or the other about the overall impact of emigration. Migration has many other costs and benefits, such as the promotion of trade and investment networks, the measurement of which is beyond the scope of this chapter.
8. There are broadly three strands of literature that are related to this chapter and only one of these has looked at the Caribbean region. The first strand of literature consists of papers on immigration that quantify the welfare effects of immigration into the United States (Borjas, 1995; Davis and Weinstein, 2002). This chapter uses techniques similar to Borjas’ (1995) study of immigration. In addition to the techniques used in the previous
- 95 -
literature, this chapter also includes the cost of education subsidies to the source countries in calculating the losses. The second strand of literature consists of recent papers that quantify the impact of emigration on source countries. These papers look at the impact on large source countries such as Mexico and India (Chiquiar and Hanson, 2002; Desai et al., forthcoming; Mishra, 2004). One of the important regions that has not been included in these papers is the Caribbean. As argued above, the potential impacts of emigration are likely to be large for the Caribbean countries. The third set of papers focus on migration from the Caribbean. The Caribbean countries have historically experienced large-scale emigration. There are some papers that look at the history of Caribbean migration (Carlson, 1994; Duay, 1994), while others also document the flow of remittances and discuss the potential impact (Wood and McCoy, 1985; Samuel, 2004; and Connell and Conway, 2000).
9. This chapter is the first to quantify the welfare impact of skilled emigration on any source country, taking into account the external effects and the costs of education subsidies. This chapter differs from the existing literature on Caribbean migration by bringing all three strands in the literature together using very detailed datasets. This chapter uses a detailed dataset compiled by Docquier and Marfouq (2004) on emigration rates, which they construct using census data from a number of OECD countries. Since the United States is a major destination for Caribbean migrants, the emigration rate to the United States is also estimated separately in the chapter, using data from the U.S. Census. Also, none of the existing papers on Caribbean migration have looked at the composition of emigration rates by skill level.
10. The rest of the chapter is organized as follows. Section B presents the theoretical framework for the welfare calculations, Section C discusses the data and the evidence on emigration from the Caribbean, and Section D presents the results from the welfare calculations. Section E concludes and provides policy implications. The Appendix discusses the details of the welfare calculations and the measurement of emigration rates.
B. Theory
11. The quantitative estimates of the gains and losses resulting from emigration must rest on prior conceptualization of these gains and losses. There are several costs and benefits of migration that accrue to both the recipient as well as source countries. Losses due to emigration: A simple labor-demand framework 12. The simple economic model of labor demand and supply suggests that emigration leads to a net reduction in the welfare of those who have stayed behind. The labor demand-supply model is an important starting point to quantify the welfare implications, and has been used in the literature in the context of immigration and capital flows (MacDougall, 1960; Borjas, 1995). The aim here is to quantify the welfare loss due to
- 96 -
movement of labor, everything else remaining unchanged.3 Welfare is measured by GDP accruing to those who have stayed behind in the source country. Consider a single numeraire good whose production function is given as:
),( LKFQ = , (1) where K is the fixed factor assumed to be internationally immobile, L is the labor employed in production and Q is the gross domestic product. Figure VI.1 shows the simple model of labor demand and supply. The initial equilibrium wage is 0w . A large emigration flow of a magnitude M of workers reduces the labor force from (N+M) to N. The wage rate as a result increases from 0w to 1w . The workers who have stayed behind gain an area equal to abww 10 (rectangle region A), owners of the fixed factors in the economy lose an area equal to
acww 10 (rectangle region A+ triangle region B) and the country as a whole loses the triangle abc (region B). The triangle abc (region B) can be termed the “emigration loss”.
Measurement of external effects
13. Even if the triangle emigration losses are of second order, the overall emigration loss can be substantial if emigration leads to a decline in the productivity of those who have stayed behind. Qualified doctors, engineers, researchers are not only more productive themselves, but are also expected to make other workers in the economy more productive. External effects have been considered important in the immigration literature. Borjas (1995) calculates the “immigration surplus” in the presence of external effects. Borjas finds that the immigration surplus increases substantially in the presence of external effects. However, unlike Borjas (1995) which looks at overall immigration rate, this chapter focuses on external effects due to high-skilled emigration. The welfare impact of the emigration of skilled labor is analyzed, assuming that only skilled labor moves. If skilled labor is complementary to other factors, then the production function can be expressed as:
γSus Lllfq ),(= (2)
where q is the representative firm’s output, sl and ul are the skilled and unskilled labor employed by the representative firm, SL is the aggregate stock of skilled labor employed in the economy, and γ is the percentage change in marginal product of skilled and unskilled labor due to a one percent change in the aggregate stock of skilled labor. As skilled migrants leave the economy, the marginal product of both skilled and unskilled labor decreases. With this production function that accounts for external effects, emigration reduces the supply of
3 Davis and Weinstein (2002) simulate the welfare impact due to inflow of both labor and capital into the U.S.
- 97 -
labor but also shifts the marginal product of labor curve inwards. The emigration loss is larger than that without incorporating external effects. 14. Figure VI.2 shows the emigration loss in the presence of external effects. Emigration of skilled labor reduces its supply from S to S’. The marginal product of skilled labor also shifts from SMPL to SMPL' . The “emigration loss” is given by area ABCD plus triangle DEF. The area ABCD has been added to the emigration loss from the external effects of labor employment. Emigration of skilled labor would also lead to a decline in productivity of unskilled labor (which is not shown in the figure).
15. The magnitude of the emigration loss depends on the assumption about the elasticities. The formulas used for the welfare calculations are described in the Appendix. The calculations have been made under varying assumptions on the elasticities.
Education cost of the skilled migrants 16. An important cost that emigration imposes on source countries (and estimates of which have largely been ignored in the literature) is the public expenditure on the education of migrants. This cost is particularly high for the tertiary educated migrants in countries such as Barbados, Jamaica, and Trinidad and Tobago (UNESCO, 2004). 17. The subsidy on education is generally rationalized as reflecting the gap between private and social costs of education—that is, educated citizens confer external benefits in the economy. As emigrants do not stay in the economy, the entire subsidy on their education could be treated as a social cost. The public expenditure on education of migrants is a loss to the source country, since there is an opportunity cost to this expenditure in terms of expenditure foregone or higher than necessary tax rates. There are many other costs of emigration which have not been considered in this chapter. For example, emigration can result in a fiscal loss from the forgone tax revenue that would have accrued if the migrants had stayed behind (Desai et al., forthcoming). In order to place the estimated losses due to emigration in perspective, the next subsection discusses the different benefits from emigration to source countries and compares the calculated losses to a quantifiable benefit from migration—that is, remittances. Benefits of emigration 18. The most immediate benefit from emigration is the flow of remittances or transfers by migrants to the country of origin. Latin America and the Caribbean region is the biggest recipient of remittances, and also has the fastest growth in its receipts. In 2003, remittance flows exceeded combined flows of foreign direct investment (FDI) and official development assistance (ODA) to the region (Terry, 2004). 19. Several other channels through which emigration can benefit source countries have been identified in the literature. There are possible network effects of migration.
- 98 -
Rauch and Trindade (2002) have estimated large impacts of the networks in trade and FDI in a cross-section of countries.4 In the long run, benefits from emigration can occur also from its favorable effect on human capital formation. Emigration, if it is biased towards the high skilled, can raise their relative wages and returns to higher education, and induce human capital formation. A positive probability of emigration to a high-wage country can also raise the expected returns from human capital accumulation and thus induce skill formation (Beine et al., 2003).
C. Data and Evidence Magnitude of emigration from the Caribbean 20. Migration has been described as “embedded in the Caribbean psyche” and is a fact of life in the region (Reyes and Stubbs, 2004). Every year a large number of Caribbean nationals emigrate to other countries for work, education or for other reasons. About 12 percent of the labor force from the Caribbean region has migrated to the OECD over the period 1970-2000. As Figure VI.3 shows, the Caribbean region has the highest rates of migration into the OECD. The second highest source of emigrants is Central America which has lost about 7 percent of its labor force due to emigration to the OECD. The figures for individual Caribbean countries are even more striking. The average of 12 percent for the Caribbean as a whole is largely due to the low migration rates of five countries—Haiti, Dominican Republic, Bahamas, Belize, and St. Lucia. As Figure VI.4 shows, the majority of the other Caribbean countries have lost more than a quarter of their labor force due to emigration to the OECD.5 21. The most important destination for migrants from the Caribbean is the United States. Figure VI.5 shows the fraction of the total number of migrants whose destination is the United States. The fraction ranges from about 60 to 90 percent. More than 80 percent of the migrants from The Bahamas, Dominican Republic, and Haiti reside in the United States. Geographical proximity (i.e., low migration cost), higher wage differentials (relative to other destinations), and immigration laws in the United States are the most likely reasons for such a bias. The Immigration and Nationality Act 1965 in the U.S. changed the basis of entry into the United States from country quotas to family-based reunification. This led to a drastic change in the composition of migrants from developed to developing countries. 4 Davis and Weinstein (2002) look at terms of trade effects of immigration into the U.S. If migration from the Caribbean results in relatively greater reduction in factor supplies and output in the export sector, thereby reducing the supply of exports on the world market, then this can result in a terms of trade gain for the region. For the terms of trade gain to be significant in magnitude for individual countries, they should be large in an economic sense i.e. their demand and supplies should affect world prices. To the extent that Caribbean countries lack market power, we can assume this effect to be of a small magnitude for these individual countries.
5 There is anecdotal evidence of a reasonable amount of intra-Caribbean migration, but it has not been systematically documented.
- 99 -
22. The migration rates by level of schooling are even more striking—more than 60 percent of the tertiary-educated labor force has migrated from the Caribbean to the OECD. Table VI.1 shows the breakdown of emigrants from the Caribbean by their skill (education groups). The figures in the secondary and tertiary schooling categories are striking. Suriname, Guyana, Jamaica, and Haiti have the highest tertiary emigration rates in the region, followed by Trinidad, St. Kitts and Nevis, and Antigua and Barbuda. In fact, as Figure VI.6 shows, most Caribbean countries rank in the top 20 in the world in terms of skilled emigration rates (skilled are defined as those with 12 or more years of schooling). Table VI.2 shows the emigration rates to the U.S., by skill categories. The figures are close to the overall emigration rates in Table VI.1. Remittances 23. Worker remittances are becoming increasingly important as a source of external funding for many developing countries. Worker remittances are defined as the value of monetary transfers sent to the source countries from workers who have been abroad for more than one year. These are recorded under “current transfers” in the current account of the IMF’s Balance of Payments statistics. The Caribbean region is the largest recipient of worker remittances in proportion to its GDP (Figure VI.7). The next biggest recipient is South Asia, followed by Middle East and North Africa. 24. A broader measure of remittances includes worker remittances, compensation of employees and migrant transfers. This measure has been used in the literature previously (Ratha, 2003; Kapur, 2004). Compensation of employees is defined as the gross earnings of foreigners residing abroad for less than 12 months, including the value of in-kind benefits such as housing and payroll taxes. Migrant transfers are defined as the net worth of migrants who move from one country to another. For example, the value of IBM stock owned by a migrant who moves from France to Germany gets transferred in international accounting from France to Germany. Compensation of employees are recorded under the "income” sub category of the current account, and migrant transfers are recorded under “capital transfers” in the capital account of the IMF’s Balance of Payments. It is important to note that both the simple worker remittances or the more comprehensive definition of remittances do not include transfers through informal channels such as those carried by hand or by friends or family, or in-kind remittances of jewelry and consumer goods. There are also commercial transfers known as hawala that are unrecorded in the estimated remittances.
25. Remittance flows are the largest source of external funding for the region (Figure VI.8a). In 2002, total remittances (defined as the sum of worker remittances, compensation of employees and migrant transfers) constituted about 13 percent of the region’s GDP. In comparison, foreign direct investment (FDI) was 6 percent and official development flows (ODA) were only 1 percent of GDP.
26. Remittance flows have been rising, while both FDI and ODA have declined. Between 1990 and 2002, ODA declined from 4 percent to 1 percent of GDP. Over recent
- 100 -
years, FDI has also declined from 9 percent in 1999 to about 6 percent in 2002. In contrast, remittances increased from 3 percent to 13 percent of GDP during the same time period. As shown in Figure VI.8b, many Caribbean nations are among the top thirty nations in the world in terms of the remittances received as a proportion of their GDP. Figure VI.9 shows the remittances for the Caribbean countries averaged over 1980–2002. Grenada is the largest recipient in the region, followed by Haiti, Dominica, Jamaica, and St. Vincent and the Grenadines. Migrant transfers to Grenada constitute about half of total remittances. Public expenditure on education 27. Governments in developing countries, including the Caribbean, cover a major portion of the cost of education of their citizens in the form of education subsidies. Table VI.3 shows the estimates of government expenditure on education per student by schooling categories for countries in the Caribbean for which data is available. The figures are averages over the period 1999–2002, and are taken from UNESCO (2004). For Barbados, Jamaica, and Trinidad and Tobago, expenditure on tertiary education is much larger relative to expenditure on primary and secondary education. The total public expenditure on education is defined as the sum of the expenditure on education and education administration made by local, regional and central governments. It includes:
(i) current expenditure on education—expenditure for goods and services consumed within the current year, e.g., staff salaries, pensions and benefits; contracted or purchased services; other resources including books and teaching materials; welfare services and other current expenditure such as subsidies to students and households, furniture and minor equipment, minor repairs, fuel, telecommunication, travel, insurance and rents.
(ii) capital expenditure on education—expenditure for assets that last longer than one year. It includes expenditure for construction, renovation and major repairs of buildings and the purchase of heavy equipment or vehicles.
The expenditure per student on primary and secondary education for those Caribbean countries with missing data is approximated by the data from another country in the Latin America and Caribbean region, that is closest in per capita income. However, the expenditure on tertiary education for countries with missing data is assumed to be zero since the countries with missing data might not be spending significantly on tertiary education. The data on expenditure per student is multiplied by the total number of migrants recorded in the OECD censuses. 28. The estimated government expenditure on the education of individuals who eventually left the Caribbean countries (largely to the U.S., between 1965 and 2000) varies across countries but is higher in the larger countries. Figure VI.10 shows that the estimated government expenditure on education of the emigrants is the highest for Barbados, Jamaica, and Trinidad and Tobago, reflecting primarily the heavy public investment on the tertiary education of migrants in these countries.
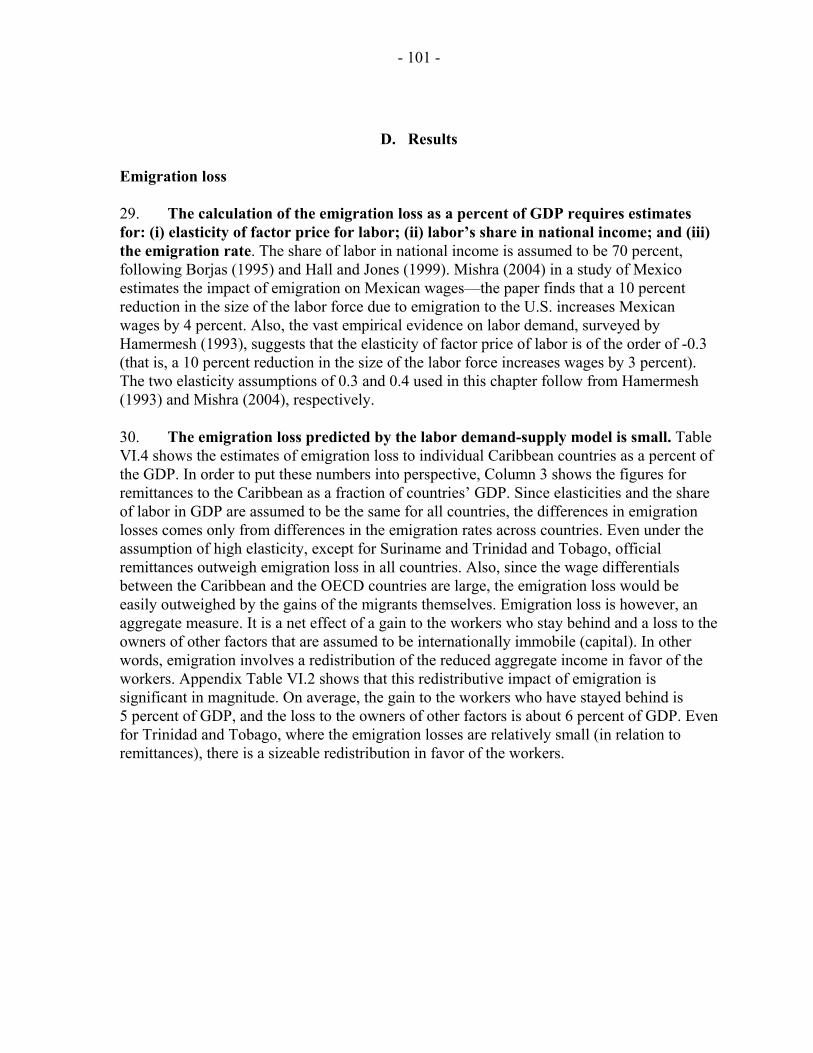
- 101 -
D. Results Emigration loss 29. The calculation of the emigration loss as a percent of GDP requires estimates for: (i) elasticity of factor price for labor; (ii) labor’s share in national income; and (iii) the emigration rate. The share of labor in national income is assumed to be 70 percent, following Borjas (1995) and Hall and Jones (1999). Mishra (2004) in a study of Mexico estimates the impact of emigration on Mexican wages—the paper finds that a 10 percent reduction in the size of the labor force due to emigration to the U.S. increases Mexican wages by 4 percent. Also, the vast empirical evidence on labor demand, surveyed by Hamermesh (1993), suggests that the elasticity of factor price of labor is of the order of -0.3 (that is, a 10 percent reduction in the size of the labor force increases wages by 3 percent). The two elasticity assumptions of 0.3 and 0.4 used in this chapter follow from Hamermesh (1993) and Mishra (2004), respectively. 30. The emigration loss predicted by the labor demand-supply model is small. Table VI.4 shows the estimates of emigration loss to individual Caribbean countries as a percent of the GDP. In order to put these numbers into perspective, Column 3 shows the figures for remittances to the Caribbean as a fraction of countries’ GDP. Since elasticities and the share of labor in GDP are assumed to be the same for all countries, the differences in emigration losses comes only from differences in the emigration rates across countries. Even under the assumption of high elasticity, except for Suriname and Trinidad and Tobago, official remittances outweigh emigration loss in all countries. Also, since the wage differentials between the Caribbean and the OECD countries are large, the emigration loss would be easily outweighed by the gains of the migrants themselves. Emigration loss is however, an aggregate measure. It is a net effect of a gain to the workers who stay behind and a loss to the owners of other factors that are assumed to be internationally immobile (capital). In other words, emigration involves a redistribution of the reduced aggregate income in favor of the workers. Appendix Table VI.2 shows that this redistributive impact of emigration is significant in magnitude. On average, the gain to the workers who have stayed behind is 5 percent of GDP, and the loss to the owners of other factors is about 6 percent of GDP. Even for Trinidad and Tobago, where the emigration losses are relatively small (in relation to remittances), there is a sizeable redistribution in favor of the workers.

- 102 -
Losses due to high-skill migration 31. The emigration loss due to emigration of skilled labor ceteris paribus is significant. One of the most significant characteristics of migration from the Caribbean region, apart from the very high rates of migration, is the loss of the educated population. The estimates in Table VI.5 show that the emigration loss as a fraction of GDP due to emigration of high skilled (everything else remaining unchanged) is much larger. The aggregate emigration rate combines the emigration rates of the high- as well as the low-skilled. As lower-skill groups have smaller emigration rates, their inclusion results in a smaller measure of emigration rate. If instead, only the high-skilled workers are considered, the emigration rates are higher. Consequently the emigration loss is also larger. Still, remittances outweigh or equal the emigration loss due to high-skilled migration for all the countries (except Guyana, Suriname, and Trinidad and Tobago).6 32. The loss due to skilled emigration is amplified if emigrants confer a positive externality on non-emigrants. Two values for the elasticity of the marginal product with respect to aggregate stock of skilled labor (gamma) are assumed, 0.05 and 0.1, respectively (Borjas, 1995, also uses identical values). Appendix Table VI.3 shows the estimates of emigration loss due to high-skilled migration in the presence of external effects. For high values of the elasticities, in the presence of external effects, emigration loss outweighs remittances for many Caribbean countries—Antigua and Barbuda, Barbados, Belize, Guyana, Jamaica, St. Kitts and Nevis, Suriname, and Trinidad and Tobago. The magnitude of the emigration losses are much higher than the estimates of immigration surplus in the presence of external effects in Borjas (1995), which range between 0.3–0.7 percent of GDP. The reason for the larger effect is that the emigration rates from the Caribbean are greater relative to the immigration rate into the United States.
33. The total losses due to high-skilled emigration are significant and outweigh remittances for most countries. Table VI.6 shows the total losses due to skilled emigration. The total losses comprise: (i) emigration loss from the simple labor demand supply framework; (ii) external effects (that is, the impact on productivity of those who have stayed behind); and (iii) government expenditure on the education of migrants. The results shown in Table VI.6 are under the assumption of high elasticities. The first observation from Table VI.6 is that the total losses due to high-skill emigration are indeed significant for most countries. The losses range from 2 percent of GDP in Dominican Republic to 20 percent of GDP in Jamaica. Second, the losses outweigh the official recorded remittances for almost all the countries (except Dominican Republic, Haiti, Grenada and St. Lucia). For Grenada and
6 In the calculations, the assumed skilled labor share of GDP is 0.3. This follows from the assumption that the highly educated belong to the top 20 percent of income earners. The average income share of the top 20 percent is about 0.4, as estimated by Dollar and Kraay (2002). Consequently, the assumed share of skilled labor in GDP is: overall labor share in GDP*0.4 = 0.7*0.4 = 0.28.
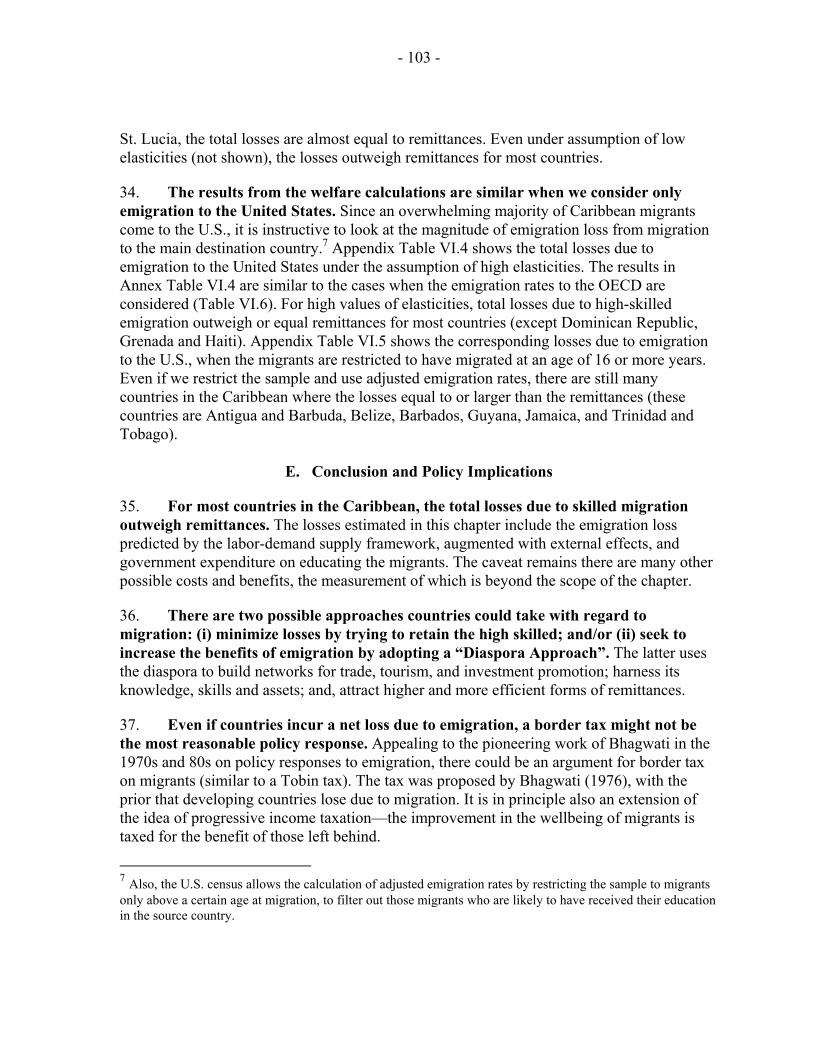
- 103 -
St. Lucia, the total losses are almost equal to remittances. Even under assumption of low elasticities (not shown), the losses outweigh remittances for most countries.
34. The results from the welfare calculations are similar when we consider only emigration to the United States. Since an overwhelming majority of Caribbean migrants come to the U.S., it is instructive to look at the magnitude of emigration loss from migration to the main destination country.7 Appendix Table VI.4 shows the total losses due to emigration to the United States under the assumption of high elasticities. The results in Annex Table VI.4 are similar to the cases when the emigration rates to the OECD are considered (Table VI.6). For high values of elasticities, total losses due to high-skilled emigration outweigh or equal remittances for most countries (except Dominican Republic, Grenada and Haiti). Appendix Table VI.5 shows the corresponding losses due to emigration to the U.S., when the migrants are restricted to have migrated at an age of 16 or more years. Even if we restrict the sample and use adjusted emigration rates, there are still many countries in the Caribbean where the losses equal to or larger than the remittances (these countries are Antigua and Barbuda, Belize, Barbados, Guyana, Jamaica, and Trinidad and Tobago).
E. Conclusion and Policy Implications
35. For most countries in the Caribbean, the total losses due to skilled migration outweigh remittances. The losses estimated in this chapter include the emigration loss predicted by the labor-demand supply framework, augmented with external effects, and government expenditure on educating the migrants. The caveat remains there are many other possible costs and benefits, the measurement of which is beyond the scope of the chapter.
36. There are two possible approaches countries could take with regard to migration: (i) minimize losses by trying to retain the high skilled; and/or (ii) seek to increase the benefits of emigration by adopting a “Diaspora Approach”. The latter uses the diaspora to build networks for trade, tourism, and investment promotion; harness its knowledge, skills and assets; and, attract higher and more efficient forms of remittances.
37. Even if countries incur a net loss due to emigration, a border tax might not be the most reasonable policy response. Appealing to the pioneering work of Bhagwati in the 1970s and 80s on policy responses to emigration, there could be an argument for border tax on migrants (similar to a Tobin tax). The tax was proposed by Bhagwati (1976), with the prior that developing countries lose due to migration. It is in principle also an extension of the idea of progressive income taxation—the improvement in the wellbeing of migrants is taxed for the benefit of those left behind.
7 Also, the U.S. census allows the calculation of adjusted emigration rates by restricting the sample to migrants only above a certain age at migration, to filter out those migrants who are likely to have received their education in the source country.

- 104 -
38. The main reasons for the border tax not being reasonable are the problems in implementing such a tax. Taxes can also have distortionary effects. Since the absolute number of migrants from the Caribbean countries is not very large, the per capita tax rate would have to be very large to raise a sizeable revenue.
39. Retaining the high-skilled without the possibility of taxes would be facilitated by reorienting education. The high rates of emigration from the region are due not only to the “pull factor” i.e., higher wages abroad, but also the limited opportunities for highly, but similarly, educated people in the same small geographical areas (i.e., the push factor). One approach to creating the right incentives is to re-orient the higher education system towards providing skills in demand within the region, in particular the services sector, which dominates these economies. Such reorientation could include, for example, the establishment of hotel management institutes, or specialized banking and finance institutes. It is particularly important for the Caribbean governments to consider the possibilities for re-orienting education, as a major portion of the cost of education of their citizens is covered by education subsidies. Governments might reap higher returns by investing in education infrastructure that leads to more retention of the high-skilled.
40. Since international experience has been that it is difficult to prevent emigration, the real policy challenge is how Caribbean countries can maximize their benefits from the population living and working overseas. Remittances should be the most immediate focus, as they can affect growth through investment, both physical and human. Evidence from micro-level studies suggests that remittances lead to greater human and physical capital investment (Cox et al., 2003 study of El Salvador; Hanson and Woodruff, 2001 and Woodruff and Zenteno, 2001 studies of Mexico; Lucas, 1987 study of Africa).
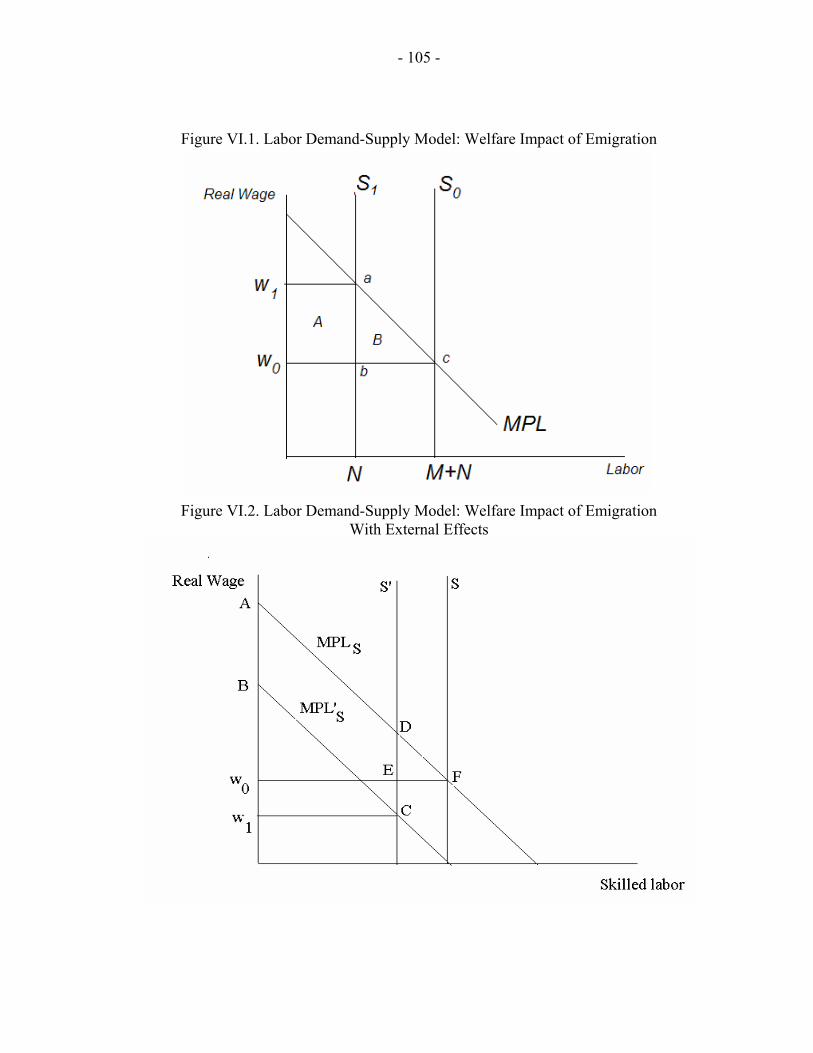
- 105 -
Figure VI.1. Labor Demand-Supply Model: Welfare Impact of Emigration
Figure VI.2. Labor Demand-Supply Model: Welfare Impact of Emigration With External Effects
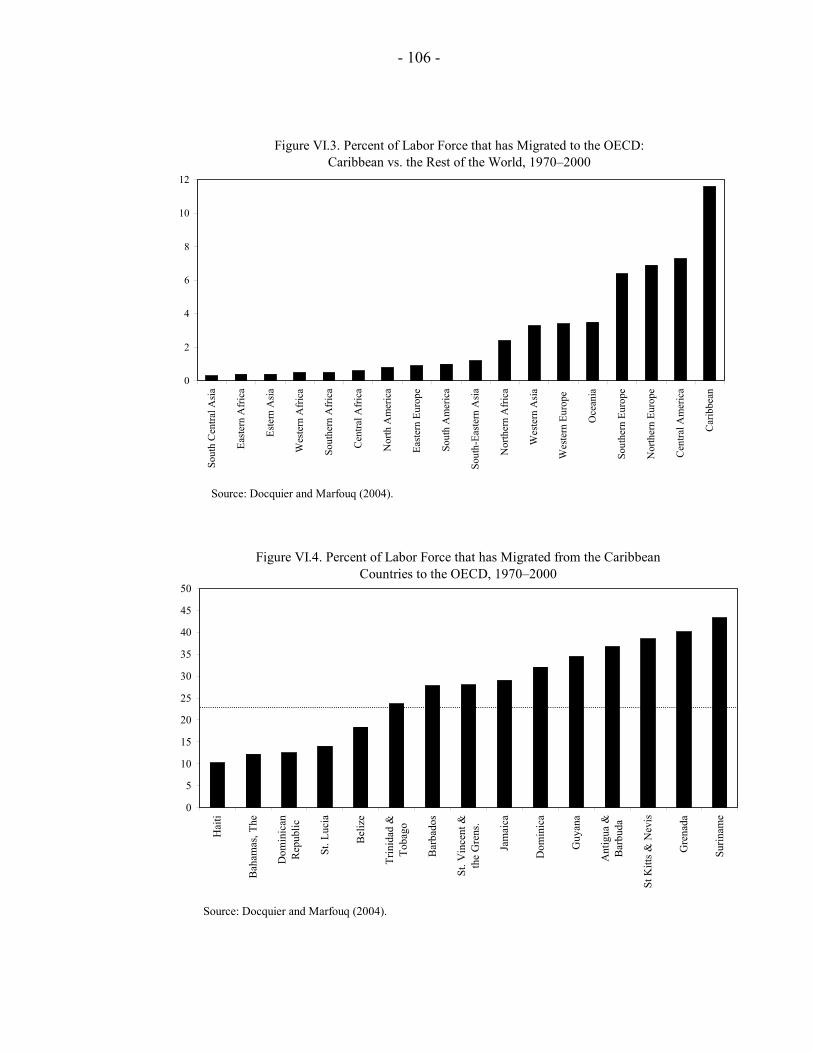
- 106 -
0
2
4
6
8
10
12
Sout
h C
entra
l Asia
Easte
rn A
fric
a
Este
rn A
sia
Wes
tern
Afr
ica
Sout
hern
Afr
ica
Cen
tral A
fric
a
Nor
th A
mer
ica
Easte
rn E
urop
e
Sout
h A
mer
ica
Sout
h-Ea
stern
Asia
Nor
ther
n A
fric
a
Wes
tern
Asia
Wes
tern
Eur
ope
Oce
ania
Sout
hern
Eur
ope
Nor
ther
n Eu
rope
Cen
tral A
mer
ica
Car
ibbe
an
Source: Docquier and Marfouq (2004).
Figure VI.3. Percent of Labor Force that has Migrated to the OECD: Caribbean vs. the Rest of the World, 1970–2000
0
5
10
15
20
25
30
35
40
45
50
Hai
ti
Bah
amas
, The
Dom
inic
anR
epub
lic
St. L
ucia
Bel
ize
Trin
idad
&To
bago
Bar
bado
s
St. V
ince
nt &
the
Gre
ns.
Jam
aica
Dom
inic
a
Guy
ana
Ant
igua
&B
arbu
da
St K
itts &
Nev
is
Gre
nada
Surin
ame
Source: Docquier and Marfouq (2004).
Figure VI.4. Percent of Labor Force that has Migrated from the Caribbean Countries to the OECD, 1970–2000
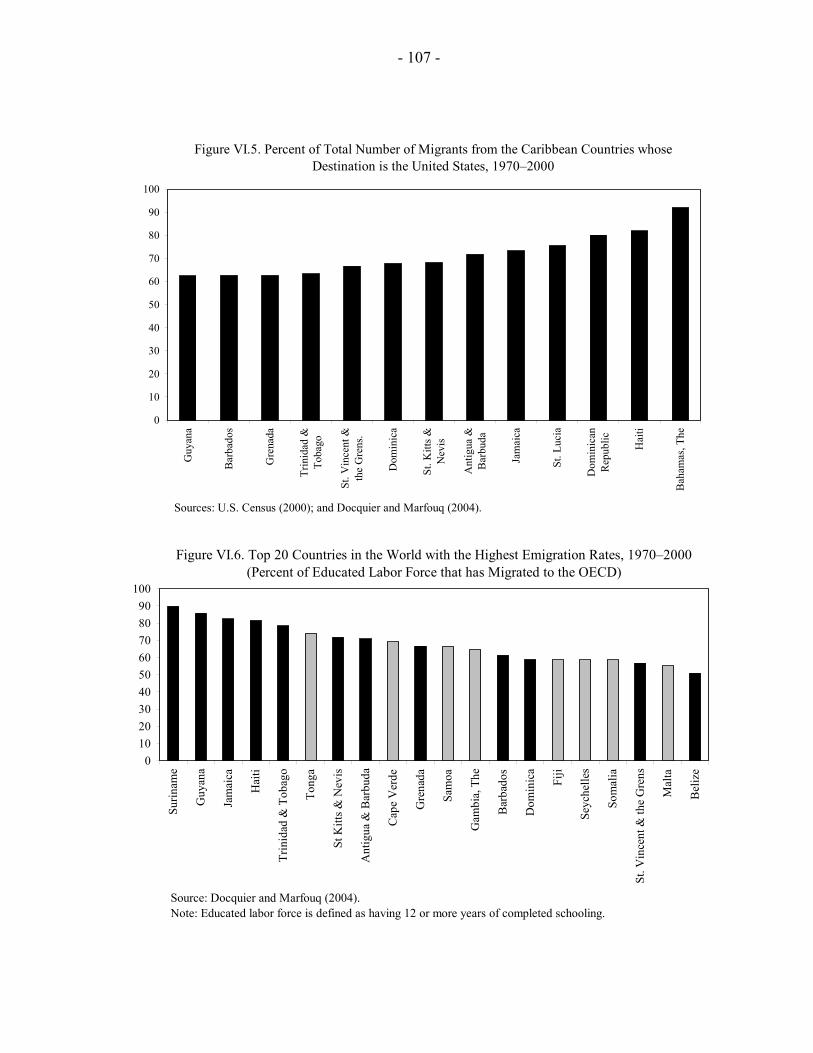
- 107 -
0
10
20
30
40
50
60
70
80
90
100G
uyan
a
Bar
bado
s
Gre
nada
Trin
idad
&To
bago
St. V
ince
nt &
the
Gre
ns.
Dom
inic
a
St. K
itts &
Nev
is
Ant
igua
&B
arbu
da
Jam
aica
St. L
ucia
Dom
inic
anR
epub
lic Hai
ti
Bah
amas
, The
Sources: U.S. Census (2000); and Docquier and Marfouq (2004).
Figure VI.5. Percent of Total Number of Migrants from the Caribbean Countries whose Destination is the United States, 1970–2000
0102030405060708090
100
Surin
ame
Guy
ana
Jam
aica
Hai
ti
Trin
idad
& T
obag
o
Tong
a
St K
itts &
Nev
is
Ant
igua
& B
arbu
da
Cap
e V
erde
Gre
nada
Sam
oa
Gam
bia,
The
Bar
bado
s
Dom
inic
a
Fiji
Seyc
helle
s
Som
alia
St. V
ince
nt &
the
Gre
ns
Mal
ta
Bel
ize
Source: Docquier and Marfouq (2004). Note: Educated labor force is defined as having 12 or more years of completed schooling.
Figure VI.6. Top 20 Countries in the World with the Highest Emigration Rates, 1970–2000(Percent of Educated Labor Force that has Migrated to the OECD)

- 108 -
Figure VI.7. Worker Remittances, 2002(In percent of GDP)
0
2
4
6
8
10
12
14
16
18
20
East Asia andPacific
Europe &Central Asia
Latin America Sub-SaharanAfrica
Middle Eastand Northern
Africa
South Asia Caribbean
Sources: IMF Balance of Payments Statistics; and country authorities.
0
2
4
6
8
10
12
14
1990
1991
1992
1993
1994
1995
1996
1997
1998
1999
2000
2001
2002
FDI
Remittances
Net ODA
Sources: IMF Balance of Payments Statistics; World Bank, WDI; OECD; and country authorities.
Figure VI.8a. Remittances, FDI, and ODA to the Caribbean, 1990–2002(In percent of GDP)
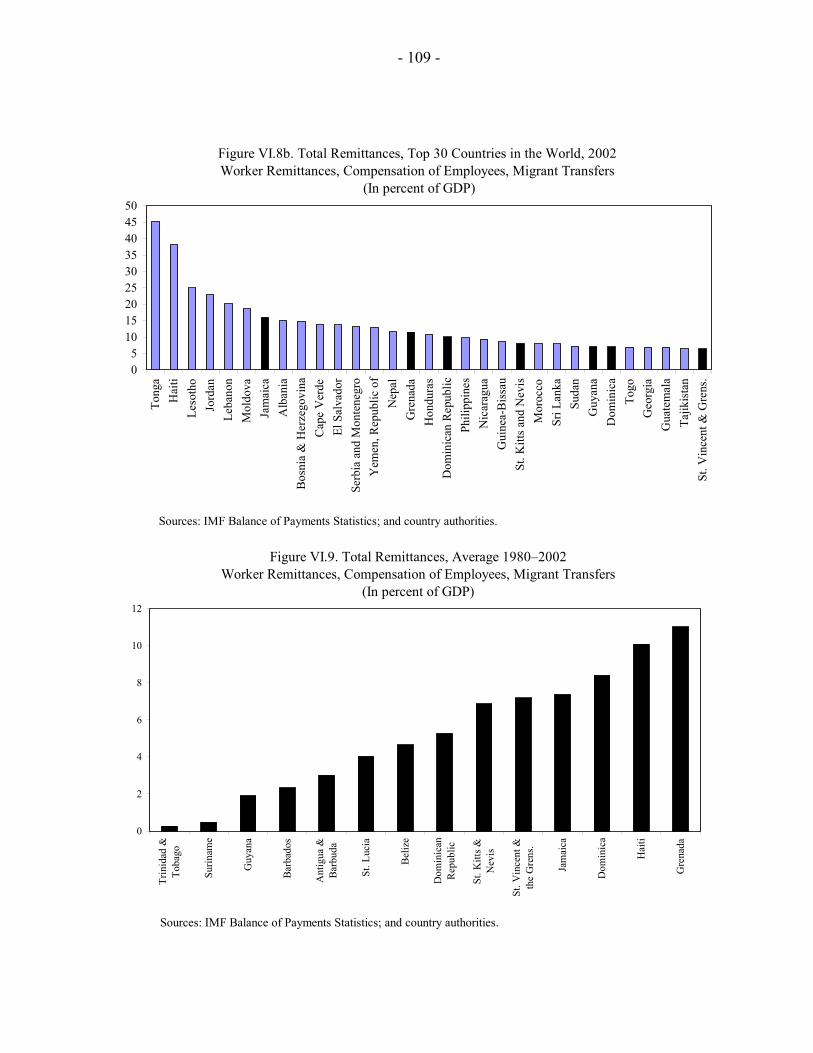
- 109 -
Figure VI.8b. Total Remittances, Top 30 Countries in the World, 2002Worker Remittances, Compensation of Employees, Migrant Transfers
(In percent of GDP)
05
101520253035404550
Tong
aH
aiti
Leso
tho
Jord
anLe
bano
nM
oldo
vaJa
mai
caA
lban
iaB
osni
a &
Her
zego
vina
Cap
e V
erde
El S
alva
dor
Serb
ia a
nd M
onte
negr
oY
emen
, Rep
ublic
of
Nep
alG
rena
daH
ondu
ras
Dom
inic
an R
epub
licPh
ilipp
ines
Nic
arag
uaG
uine
a-B
issa
uSt
. Kitt
s and
Nev
isM
oroc
coSr
i Lan
kaSu
dan
Guy
ana
Dom
inic
aTo
goG
eorg
iaG
uate
mal
aTa
jikis
tan
St. V
ince
nt &
Gre
ns.
Sources: IMF Balance of Payments Statistics; and country authorities.
0
2
4
6
8
10
12
Trin
idad
&To
bago
Surin
ame
Guy
ana
Barb
ados
Ant
igua
&Ba
rbud
a
St. L
ucia
Bel
ize
Dom
inic
anR
epub
lic
St. K
itts &
Nev
is
St. V
ince
nt &
the
Gre
ns.
Jam
aica
Dom
inic
a
Hai
ti
Gre
nada
Sources: IMF Balance of Payments Statistics; and country authorities.
Figure VI.9. Total Remittances, Average 1980–2002 Worker Remittances, Compensation of Employees, Migrant Transfers
(In percent of GDP)
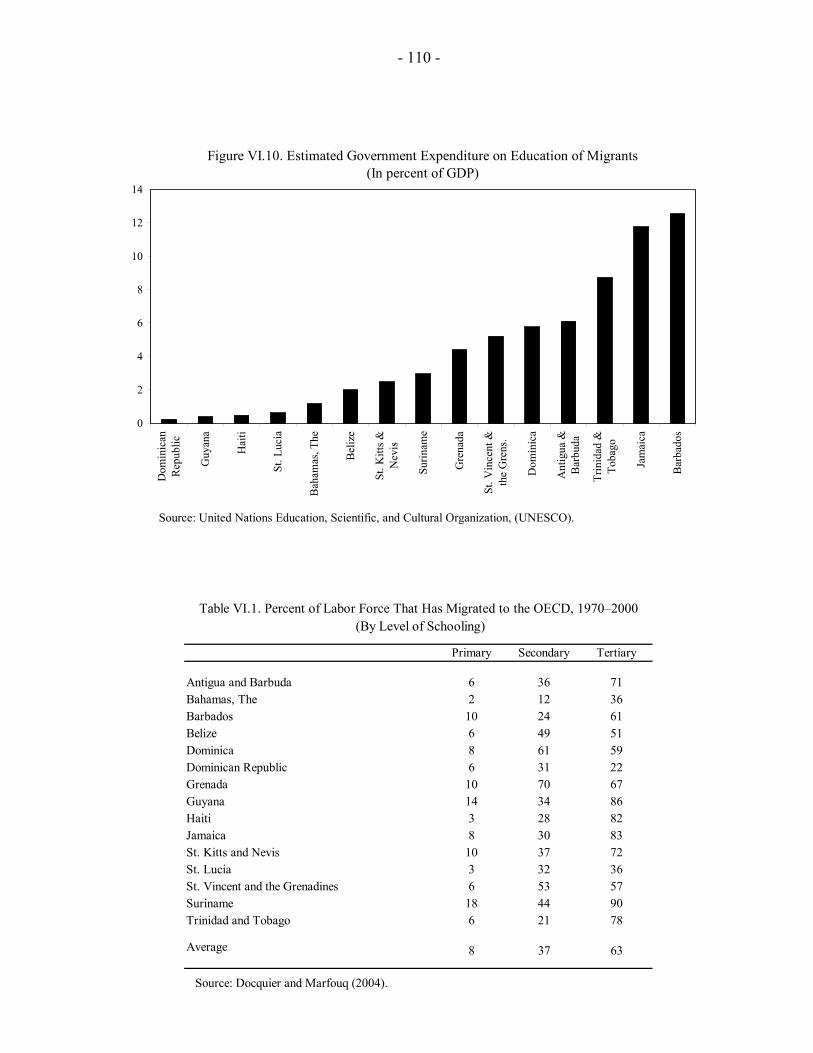
- 110 -
(By Level of Schooling)
Primary Secondary Tertiary
Antigua and Barbuda 6 36 71Bahamas, The 2 12 36Barbados 10 24 61Belize 6 49 51Dominica 8 61 59Dominican Republic 6 31 22Grenada 10 70 67Guyana 14 34 86Haiti 3 28 82Jamaica 8 30 83St. Kitts and Nevis 10 37 72St. Lucia 3 32 36St. Vincent and the Grenadines 6 53 57Suriname 18 44 90Trinidad and Tobago 6 21 78
Average 8 37 63
Source: Docquier and Marfouq (2004).
Table VI.1. Percent of Labor Force That Has Migrated to the OECD, 1970–2000
0
2
4
6
8
10
12
14
Dom
inic
anR
epub
lic
Guy
ana
Hai
ti
St. L
ucia
Bah
amas
, The
Bel
ize
St. K
itts &
Nev
is
Surin
ame
Gre
nada
St. V
ince
nt &
the
Gre
ns.
Dom
inic
a
Ant
igua
&B
arbu
da
Trin
idad
&To
bago
Jam
aica
Bar
bado
s
Source: United Nations Education, Scientific, and Cultural Organization, (UNESCO).
Figure VI.10. Estimated Government Expenditure on Education of Migrants(In percent of GDP)
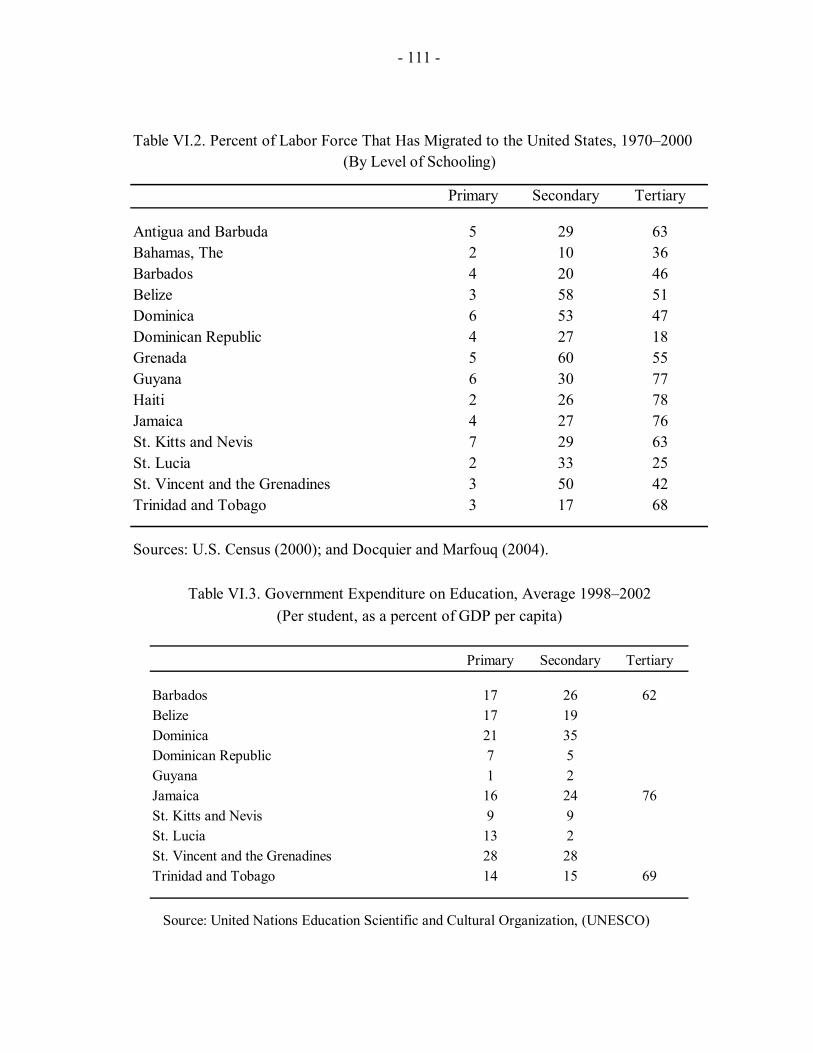
- 111 -
Table VI.2. Percent of Labor Force That Has Migrated to the United States, 1970–2000
Primary Secondary Tertiary
Antigua and Barbuda 5 29 63Bahamas, The 2 10 36Barbados 4 20 46Belize 3 58 51Dominica 6 53 47Dominican Republic 4 27 18Grenada 5 60 55Guyana 6 30 77Haiti 2 26 78Jamaica 4 27 76St. Kitts and Nevis 7 29 63St. Lucia 2 33 25St. Vincent and the Grenadines 3 50 42Trinidad and Tobago 3 17 68
(By Level of Schooling)
Sources: U.S. Census (2000); and Docquier and Marfouq (2004).
Table VI.3. Government Expenditure on Education, Average 1998–2002(Per student, as a percent of GDP per capita)
Primary Secondary Tertiary
Barbados 17 26 62Belize 17 19Dominica 21 35Dominican Republic 7 5Guyana 1 2Jamaica 16 24 76St. Kitts and Nevis 9 9St. Lucia 13 2St. Vincent and the Grenadines 28 28Trinidad and Tobago 14 15 69
Source: United Nations Education Scientific and Cultural Organization, (UNESCO)
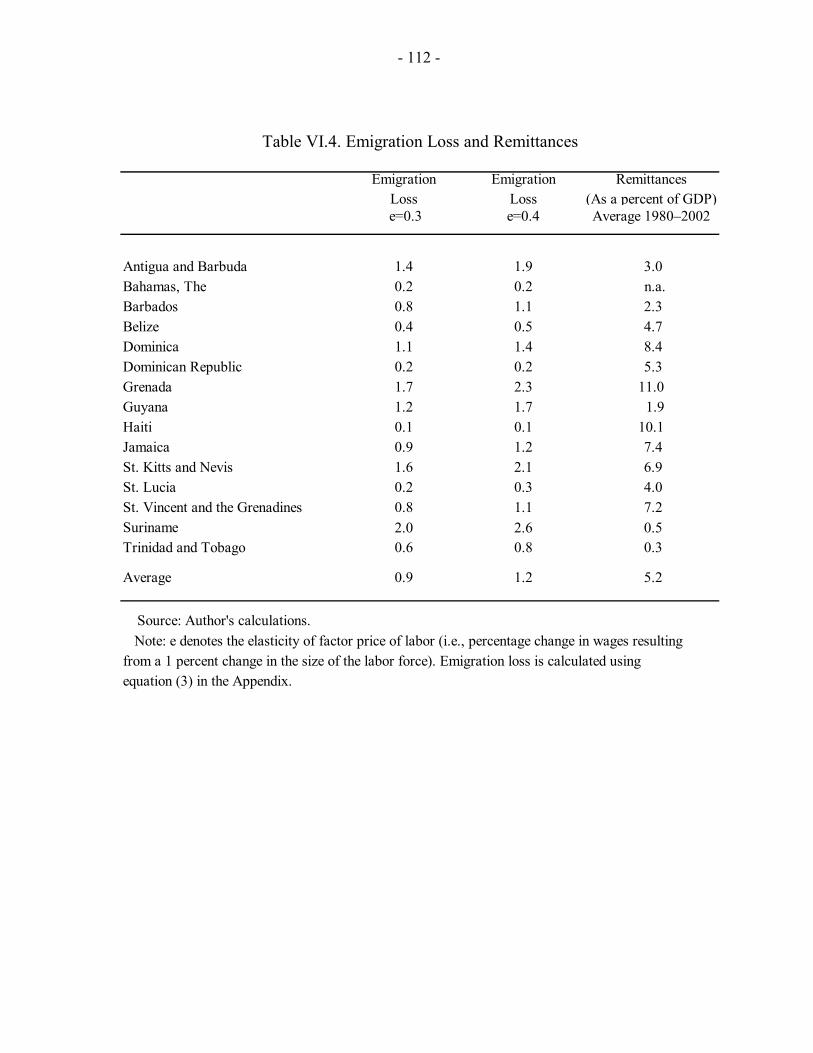
- 112 -
Emigration Emigration RemittancesLoss Loss (As a percent of GDP)
e=0.3 e=0.4 Average 1980–2002
Antigua and Barbuda 1.4 1.9 3.0Bahamas, The 0.2 0.2 n.a.Barbados 0.8 1.1 2.3Belize 0.4 0.5 4.7Dominica 1.1 1.4 8.4Dominican Republic 0.2 0.2 5.3Grenada 1.7 2.3 11.0Guyana 1.2 1.7 1.9Haiti 0.1 0.1 10.1Jamaica 0.9 1.2 7.4St. Kitts and Nevis 1.6 2.1 6.9St. Lucia 0.2 0.3 4.0St. Vincent and the Grenadines 0.8 1.1 7.2Suriname 2.0 2.6 0.5Trinidad and Tobago 0.6 0.8 0.3
Average 0.9 1.2 5.2
Source: Author's calculations. Note: e denotes the elasticity of factor price of labor (i.e., percentage change in wages resultingfrom a 1 percent change in the size of the labor force). Emigration loss is calculated using equation (3) in the Appendix.
Table VI.4. Emigration Loss and Remittances
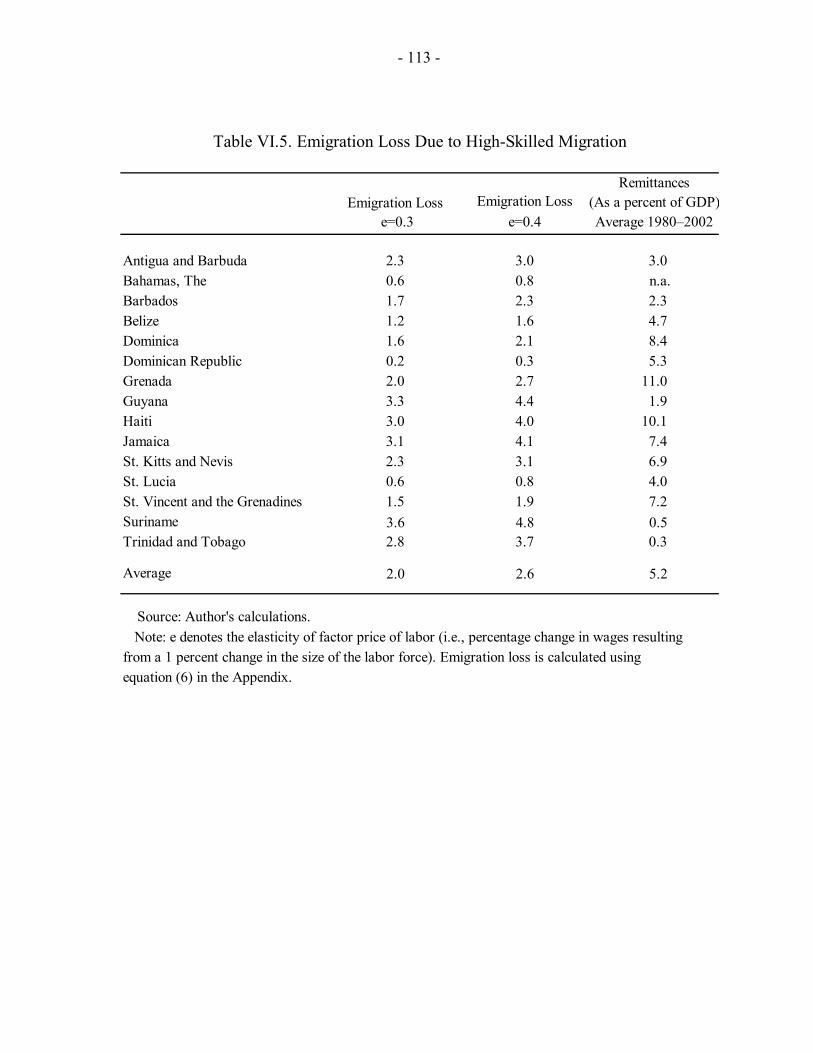
- 113 -
Remittances Emigration Loss Emigration Loss (As a percent of GDP)
e=0.3 e=0.4 Average 1980–2002
Antigua and Barbuda 2.3 3.0 3.0Bahamas, The 0.6 0.8 n.a.Barbados 1.7 2.3 2.3Belize 1.2 1.6 4.7Dominica 1.6 2.1 8.4Dominican Republic 0.2 0.3 5.3Grenada 2.0 2.7 11.0Guyana 3.3 4.4 1.9Haiti 3.0 4.0 10.1Jamaica 3.1 4.1 7.4St. Kitts and Nevis 2.3 3.1 6.9St. Lucia 0.6 0.8 4.0St. Vincent and the Grenadines 1.5 1.9 7.2Suriname 3.6 4.8 0.5Trinidad and Tobago 2.8 3.7 0.3
Average 2.0 2.6 5.2
Source: Author's calculations. Note: e denotes the elasticity of factor price of labor (i.e., percentage change in wages resultingfrom a 1 percent change in the size of the labor force). Emigration loss is calculated using equation (6) in the Appendix.
Table VI.5. Emigration Loss Due to High-Skilled Migration
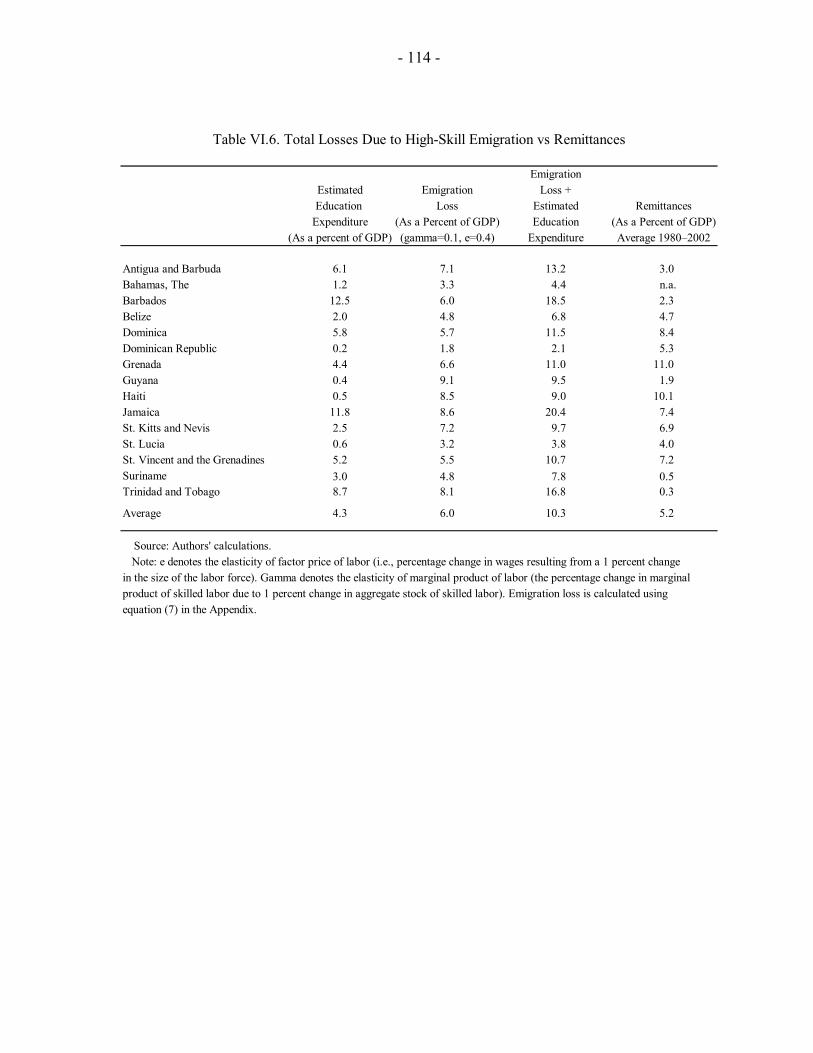
- 114 -
EmigrationEstimated Emigration Loss +Education Loss Estimated Remittances
Expenditure (As a Percent of GDP) Education (As a Percent of GDP)(As a percent of GDP) (gamma=0.1, e=0.4) Expenditure Average 1980–2002
Antigua and Barbuda 6.1 7.1 13.2 3.0Bahamas, The 1.2 3.3 4.4 n.a.Barbados 12.5 6.0 18.5 2.3Belize 2.0 4.8 6.8 4.7Dominica 5.8 5.7 11.5 8.4Dominican Republic 0.2 1.8 2.1 5.3Grenada 4.4 6.6 11.0 11.0Guyana 0.4 9.1 9.5 1.9Haiti 0.5 8.5 9.0 10.1Jamaica 11.8 8.6 20.4 7.4St. Kitts and Nevis 2.5 7.2 9.7 6.9St. Lucia 0.6 3.2 3.8 4.0St. Vincent and the Grenadines 5.2 5.5 10.7 7.2Suriname 3.0 4.8 7.8 0.5Trinidad and Tobago 8.7 8.1 16.8 0.3
Average 4.3 6.0 10.3 5.2
Source: Authors' calculations. Note: e denotes the elasticity of factor price of labor (i.e., percentage change in wages resulting from a 1 percent changein the size of the labor force). Gamma denotes the elasticity of marginal product of labor (the percentage change in marginalproduct of skilled labor due to 1 percent change in aggregate stock of skilled labor). Emigration loss is calculated using equation (7) in the Appendix.
Table VI.6. Total Losses Due to High-Skill Emigration vs Remittances
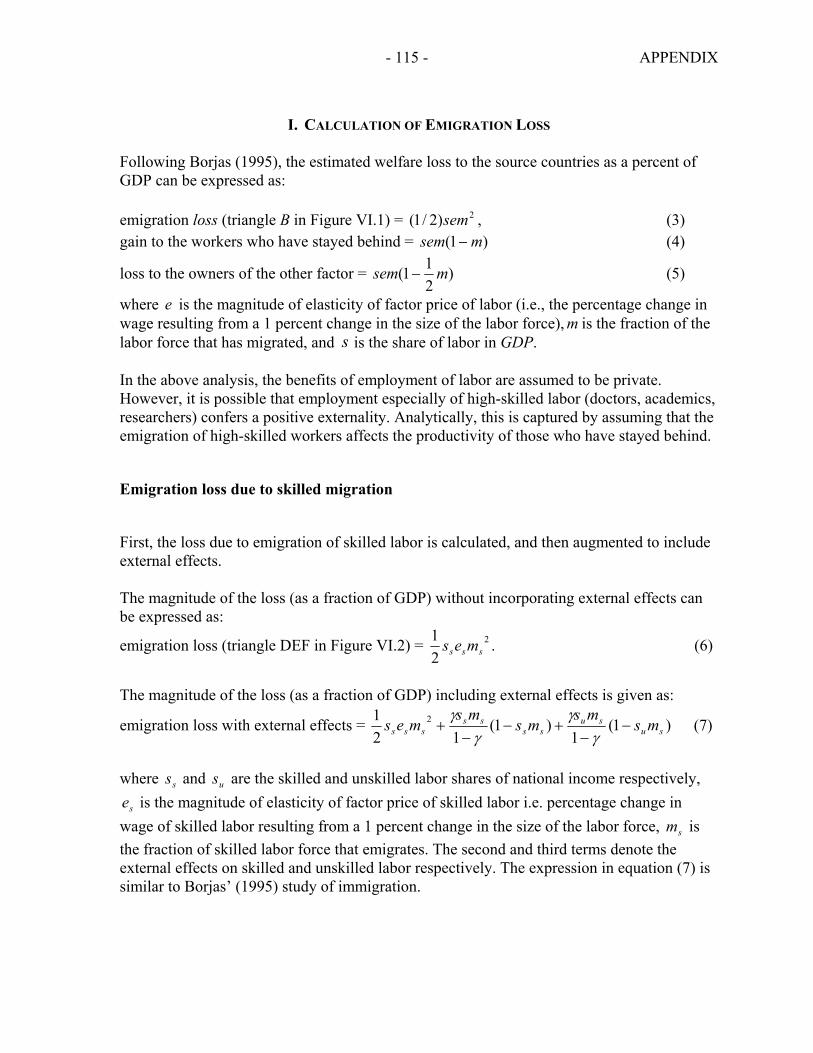
- 115 - APPENDIX
I. CALCULATION OF EMIGRATION LOSS Following Borjas (1995), the estimated welfare loss to the source countries as a percent of GDP can be expressed as: emigration loss (triangle B in Figure VI.1) = 2)2/1( sem , (3) gain to the workers who have stayed behind = )1( msem − (4)
loss to the owners of the other factor = )211( msem − (5)
where e is the magnitude of elasticity of factor price of labor (i.e., the percentage change in wage resulting from a 1 percent change in the size of the labor force), m is the fraction of the labor force that has migrated, and s is the share of labor in GDP. In the above analysis, the benefits of employment of labor are assumed to be private. However, it is possible that employment especially of high-skilled labor (doctors, academics, researchers) confers a positive externality. Analytically, this is captured by assuming that the emigration of high-skilled workers affects the productivity of those who have stayed behind.
Emigration loss due to skilled migration
First, the loss due to emigration of skilled labor is calculated, and then augmented to include external effects. The magnitude of the loss (as a fraction of GDP) without incorporating external effects can be expressed as:
emigration loss (triangle DEF in Figure VI.2) = 2
21
sss mes . (6)
The magnitude of the loss (as a fraction of GDP) including external effects is given as:
emigration loss with external effects = )1(1
)1(12
1 2su
suss
sssss ms
msms
msmes −
−+−
−+
γγ
γγ
(7)
where ss and us are the skilled and unskilled labor shares of national income respectively,
se is the magnitude of elasticity of factor price of skilled labor i.e. percentage change in wage of skilled labor resulting from a 1 percent change in the size of the labor force, sm is the fraction of skilled labor force that emigrates. The second and third terms denote the external effects on skilled and unskilled labor respectively. The expression in equation (7) is similar to Borjas’ (1995) study of immigration.
- 116 - APPENDIX
II. MEASUREMENT OF EMIGRATION RATES It is difficult to quantify the magnitude of emigration because source countries, in general, do not record information on those who leave. Emigration is measured by obtaining information on the migrants from the censuses in recipient countries (see for example, Mishra, 2004; Docquier and Marfouq, 2004; and Carrington and Detragiache, 1998). Two sources of data have been used in this chapter: (i) emigration rates to the OECD from Docquier and Marfouq (2004) who estimate the aggregate migration rates for a number of source countries in the world; (ii) emigration rates to the U.S., using the data on migrants from the U.S. Census. Emigrants to most OECD countries are defined by their country of birth. For example, an emigrant from source country j residing in the U.S., is defined as a person whom the U.S. Census counts as being born in country j. The migrants include naturalized citizens, temporary and permanent residents as well as unauthorized migrants. Migrants to the U.S., also include asylum seekers who sought refuge from political turmoil, oppression and totalitarian governments (e.g., in the case of Haiti).92 The only exceptions are Germany, Greece, Italy, Japan and Korea, where an emigrant is defined by citizenship. About 95 percent of the Caribbean migrants enumerated in the 2000 U.S. Census arrived between 1965–2000. Detailed information on the year of immigration is not available for migrants to the other OECD countries. However, since the United States is the major destination for migrants from the Caribbean, one can argue that the biggest proportion of migrants to the OECD migrated between 1965 and 2000. The emigration rate to the OECD is defined as the fraction of labor force having migrated to OECD countries. It is expressed as: , (8) where is the number of migrants from country j counted in the receiving countries censuses at time t, is the labor force in source country j at time t. Emigration Rate from country j in schooling category S is defined as , (9)
92 The Caribbean is also one of the largest sources of illegal aliens, with the Dominican Republic, Haiti, and Jamaica ranking only behind Mexico (Carlson, 1994)
jt
jt
jtj
t NMMm+
=
jtM
jtN
jst
jst
jstj
st NMM
m,,
,, +=
- 117 - APPENDIX
where jstM , is the number of migrants from source country j with schooling S who are
recorded in the OECD censuses at time t, jstN , is the labor force in source country j with
schooling S. Where did the migrant receive schooling? The migration rates by schooling do not take into account where the migrant received their schooling. The estimates of emigration rates by schooling are based on the assumption that the migrants recorded in the OECD censuses received their schooling in the Caribbean. Alternatively, for those who obtained their schooling in the OECD, the counterfactual assumption is that had they stayed behind, they would have received the same level of schooling. For the migrants who got their schooling in the destination countries, it is not clear that their emigration constitutes shocks to schooling groups in the Caribbean. The censuses in the recipient countries do not record information on where the migrants received their schooling. Hence, given the data, it is not possible to conclude the direction of the bias. However, we can try to adjust for this bias in case of the migrants to the United States. There is strong evidence in the case of migrants from developing countries like Mexico that those who migrate in the late teens or later are much less likely to obtain their schooling in the United States (Grogger and Trejo, 2002; Gonzalez, 2002; Chiquiar and Hanson, 2002; Clark and Jaeger, 2002). The U.S. Census provides information for the foreign-born on the years spent in the United States. Using this information, it is possible to calculate their age at migration. Restricting the sample of migrants to those who emigrated at an age of 16 years or more, it is less likely that these migrants would have received their schooling in the United States. Chiquiar and Hanson (2002), Mishra (2004) use a similar strategy to adjust for the bias. The adjusted emigration rates are shown in Appendix Table VI.1.
The magnitude of the adjusted emigration rates in the secondary and tertiary schooling decreases in absolute terms (as compared to Table VI.2) but is still much larger in relation to the primary schooling category. In both cases (adjusted and unadjusted), Guyana, Jamaica, and Haiti have the highest tertiary emigration rates in the region followed by Trinidad and Tobago, Antigua and Barbuda, and St. Kitts and Nevis. The highly-educated labor force has been reduced by close to or greater than half in these countries, even after adjustment. The estimates of the emigration rates in the secondary and tertiary schooling categories presented in Appendix Table VI.1 are likely to be underestimates because: (i) many of the migrants who migrated at less than 16 years could have received part or all of their education in the Caribbean; or (ii) for those who got their schooling in the U.S., the possible counterfactual is that they could have received the same or possibly more years of schooling, had they not migrated.
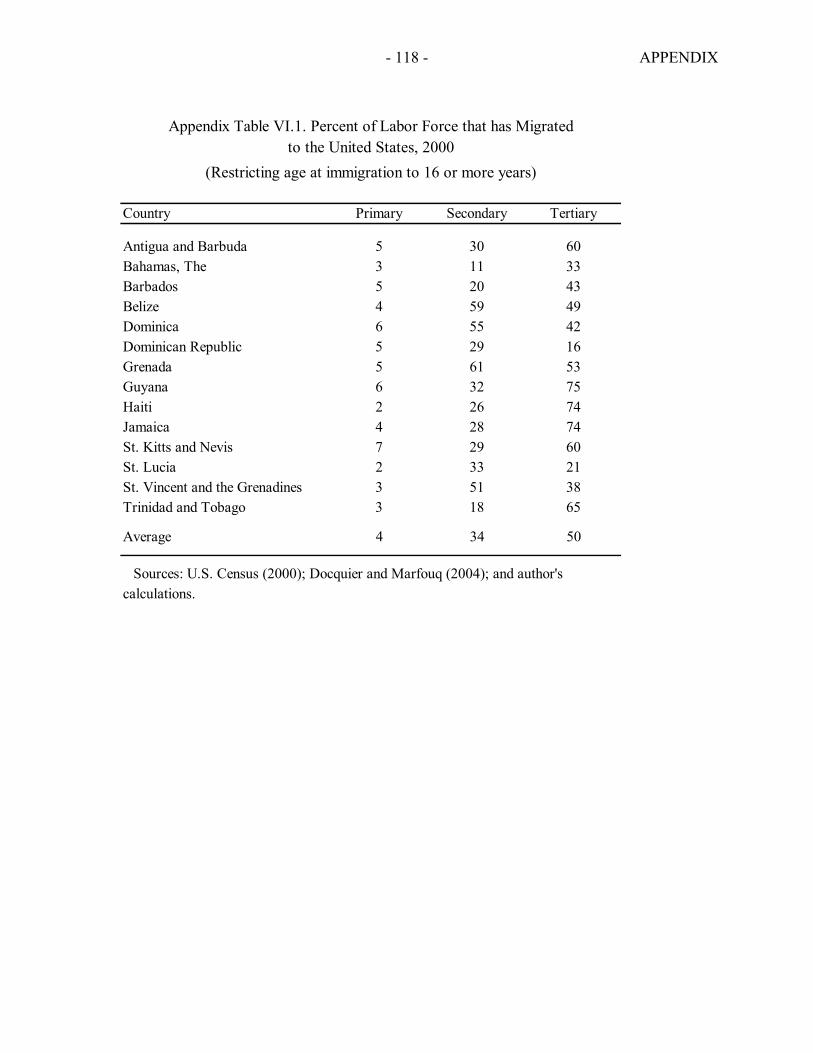
- 118 - APPENDIX
(Restricting age at immigration to 16 or more years)
Country Primary Secondary Tertiary
Antigua and Barbuda 5 30 60Bahamas, The 3 11 33Barbados 5 20 43Belize 4 59 49Dominica 6 55 42Dominican Republic 5 29 16Grenada 5 61 53Guyana 6 32 75Haiti 2 26 74Jamaica 4 28 74St. Kitts and Nevis 7 29 60St. Lucia 2 33 21St. Vincent and the Grenadines 3 51 38Trinidad and Tobago 3 18 65
Average 4 34 50
Sources: U.S. Census (2000); Docquier and Marfouq (2004); and author'scalculations.
to the United States, 2000Appendix Table VI.1. Percent of Labor Force that has Migrated
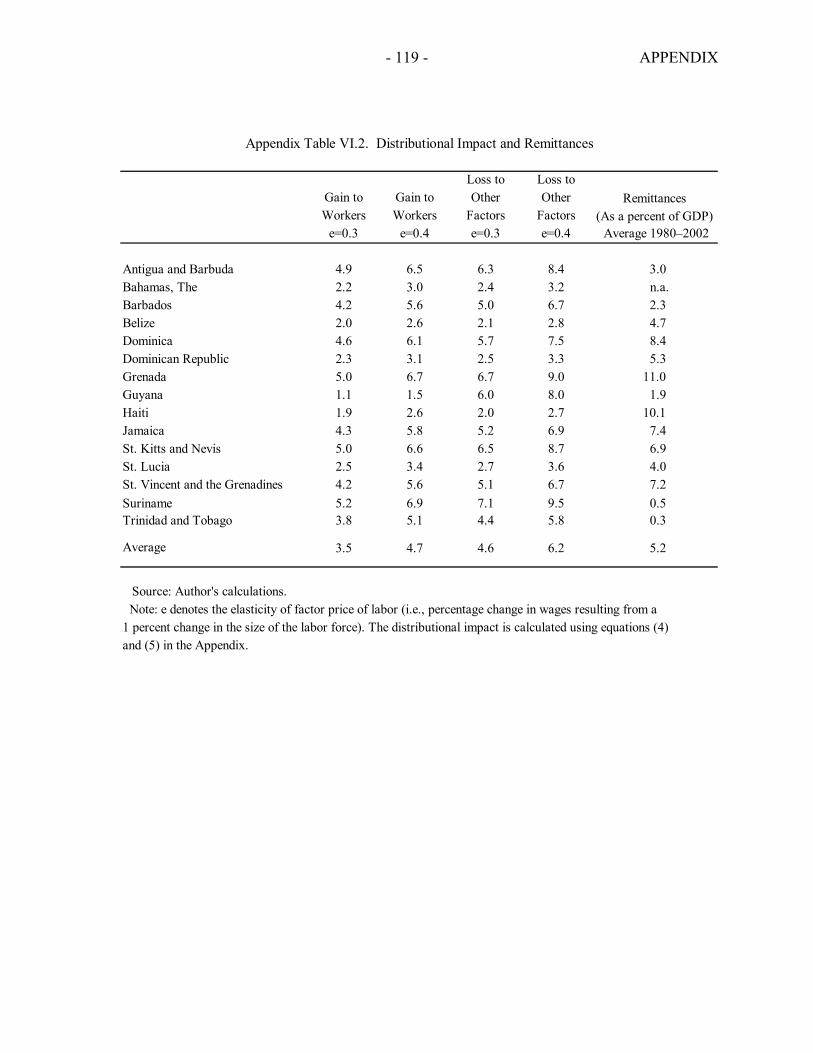
- 119 - APPENDIX
Loss to Loss toGain to Gain to Other Other RemittancesWorkers Workers Factors Factors (As a percent of GDP)
e=0.3 e=0.4 e=0.3 e=0.4 Average 1980–2002
Antigua and Barbuda 4.9 6.5 6.3 8.4 3.0Bahamas, The 2.2 3.0 2.4 3.2 n.a.Barbados 4.2 5.6 5.0 6.7 2.3Belize 2.0 2.6 2.1 2.8 4.7Dominica 4.6 6.1 5.7 7.5 8.4Dominican Republic 2.3 3.1 2.5 3.3 5.3Grenada 5.0 6.7 6.7 9.0 11.0Guyana 1.1 1.5 6.0 8.0 1.9Haiti 1.9 2.6 2.0 2.7 10.1Jamaica 4.3 5.8 5.2 6.9 7.4St. Kitts and Nevis 5.0 6.6 6.5 8.7 6.9St. Lucia 2.5 3.4 2.7 3.6 4.0St. Vincent and the Grenadines 4.2 5.6 5.1 6.7 7.2Suriname 5.2 6.9 7.1 9.5 0.5Trinidad and Tobago 3.8 5.1 4.4 5.8 0.3
Average 3.5 4.7 4.6 6.2 5.2
Source: Author's calculations. Note: e denotes the elasticity of factor price of labor (i.e., percentage change in wages resulting from a 1 percent change in the size of the labor force). The distributional impact is calculated using equations (4)and (5) in the Appendix.
Appendix Table VI.2. Distributional Impact and Remittances
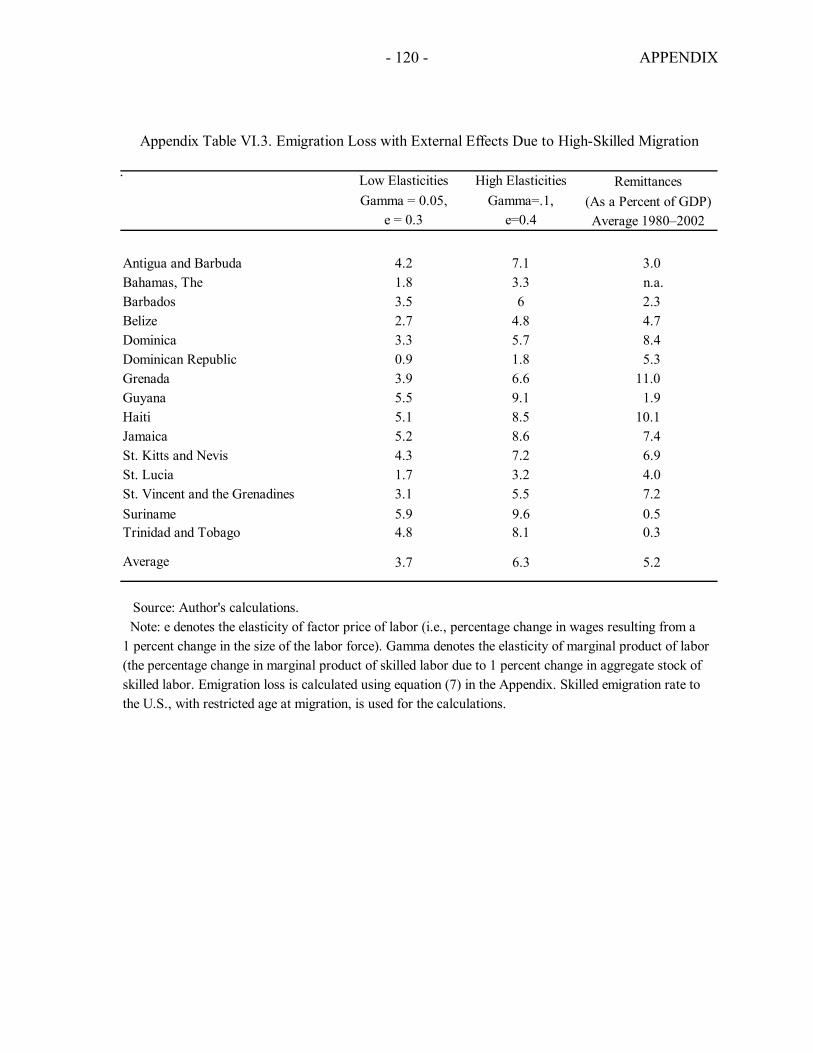
- 120 - APPENDIX
Appendix Table VI.3. Emigration Loss with External Effects Due to High-Skilled Migration
Low Elasticities High Elasticities RemittancesGamma = 0.05, Gamma=.1, (As a Percent of GDP)
e = 0.3 e=0.4 Average 1980–2002
Antigua and Barbuda 4.2 7.1 3.0Bahamas, The 1.8 3.3 n.a.Barbados 3.5 6 2.3Belize 2.7 4.8 4.7Dominica 3.3 5.7 8.4Dominican Republic 0.9 1.8 5.3Grenada 3.9 6.6 11.0Guyana 5.5 9.1 1.9Haiti 5.1 8.5 10.1Jamaica 5.2 8.6 7.4St. Kitts and Nevis 4.3 7.2 6.9St. Lucia 1.7 3.2 4.0St. Vincent and the Grenadines 3.1 5.5 7.2Suriname 5.9 9.6 0.5Trinidad and Tobago 4.8 8.1 0.3
Average 3.7 6.3 5.2
Source: Author's calculations. Note: e denotes the elasticity of factor price of labor (i.e., percentage change in wages resulting from a 1 percent change in the size of the labor force). Gamma denotes the elasticity of marginal product of labor (the percentage change in marginal product of skilled labor due to 1 percent change in aggregate stock of skilled labor. Emigration loss is calculated using equation (7) in the Appendix. Skilled emigration rate to the U.S., with restricted age at migration, is used for the calculations.
.
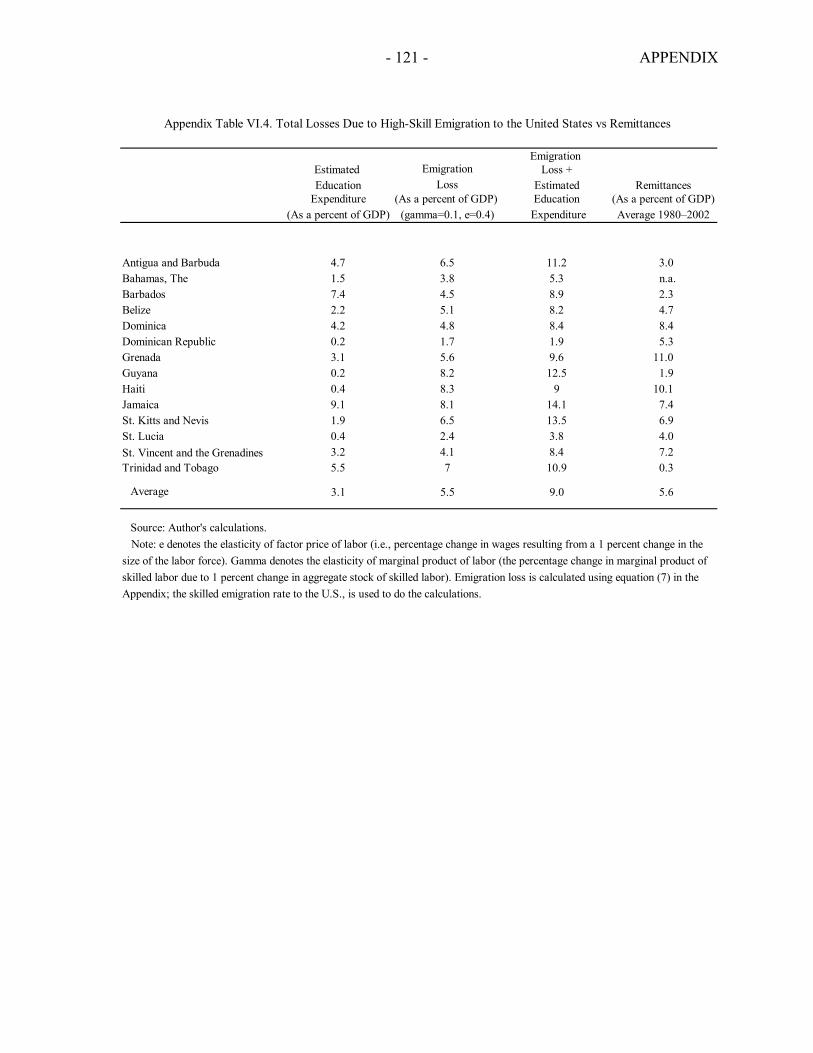
- 121 - APPENDIX
Emigration Estimated Emigration Loss +Education Loss Estimated Remittances
Expenditure (As a percent of GDP) Education (As a percent of GDP)(As a percent of GDP) (gamma=0.1, e=0.4) Expenditure Average 1980–2002
Antigua and Barbuda 4.7 6.5 11.2 3.0Bahamas, The 1.5 3.8 5.3 n.a.Barbados 7.4 4.5 8.9 2.3Belize 2.2 5.1 8.2 4.7Dominica 4.2 4.8 8.4 8.4Dominican Republic 0.2 1.7 1.9 5.3Grenada 3.1 5.6 9.6 11.0Guyana 0.2 8.2 12.5 1.9Haiti 0.4 8.3 9 10.1Jamaica 9.1 8.1 14.1 7.4St. Kitts and Nevis 1.9 6.5 13.5 6.9St. Lucia 0.4 2.4 3.8 4.0St. Vincent and the Grenadines 3.2 4.1 8.4 7.2Trinidad and Tobago 5.5 7 10.9 0.3
Average 3.1 5.5 9.0 5.6
Source: Author's calculations. Note: e denotes the elasticity of factor price of labor (i.e., percentage change in wages resulting from a 1 percent change in thesize of the labor force). Gamma denotes the elasticity of marginal product of labor (the percentage change in marginal product of skilled labor due to 1 percent change in aggregate stock of skilled labor). Emigration loss is calculated using equation (7) in the Appendix; the skilled emigration rate to the U.S., is used to do the calculations.
Appendix Table VI.4. Total Losses Due to High-Skill Emigration to the United States vs Remittances
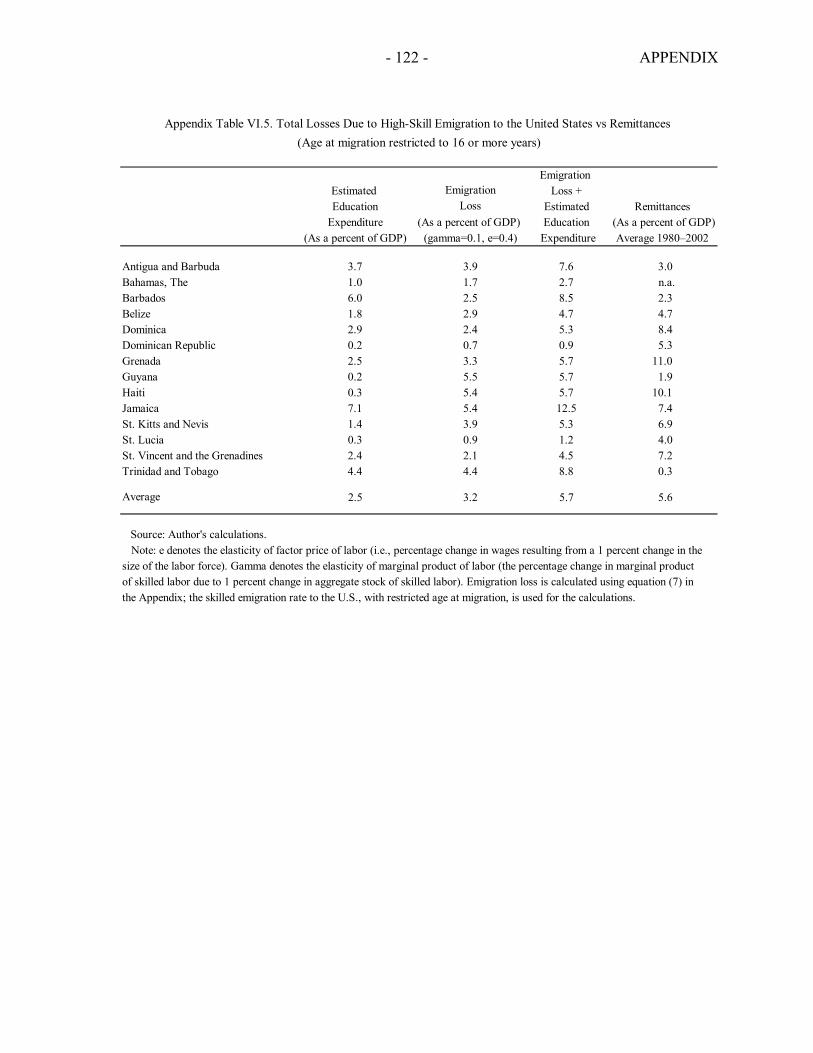
- 122 - APPENDIX
Emigration Estimated Emigration Loss +Education Loss Estimated Remittances
Expenditure (As a percent of GDP) Education (As a percent of GDP)(As a percent of GDP) (gamma=0.1, e=0.4) Expenditure Average 1980–2002
Antigua and Barbuda 3.7 3.9 7.6 3.0Bahamas, The 1.0 1.7 2.7 n.a.Barbados 6.0 2.5 8.5 2.3Belize 1.8 2.9 4.7 4.7Dominica 2.9 2.4 5.3 8.4Dominican Republic 0.2 0.7 0.9 5.3Grenada 2.5 3.3 5.7 11.0Guyana 0.2 5.5 5.7 1.9Haiti 0.3 5.4 5.7 10.1Jamaica 7.1 5.4 12.5 7.4St. Kitts and Nevis 1.4 3.9 5.3 6.9St. Lucia 0.3 0.9 1.2 4.0St. Vincent and the Grenadines 2.4 2.1 4.5 7.2Trinidad and Tobago 4.4 4.4 8.8 0.3
Average 2.5 3.2 5.7 5.6
Source: Author's calculations. Note: e denotes the elasticity of factor price of labor (i.e., percentage change in wages resulting from a 1 percent change in thesize of the labor force). Gamma denotes the elasticity of marginal product of labor (the percentage change in marginal productof skilled labor due to 1 percent change in aggregate stock of skilled labor). Emigration loss is calculated using equation (7) inthe Appendix; the skilled emigration rate to the U.S., with restricted age at migration, is used for the calculations.
(Age at migration restricted to 16 or more years)Appendix Table VI.5. Total Losses Due to High-Skill Emigration to the United States vs Remittances
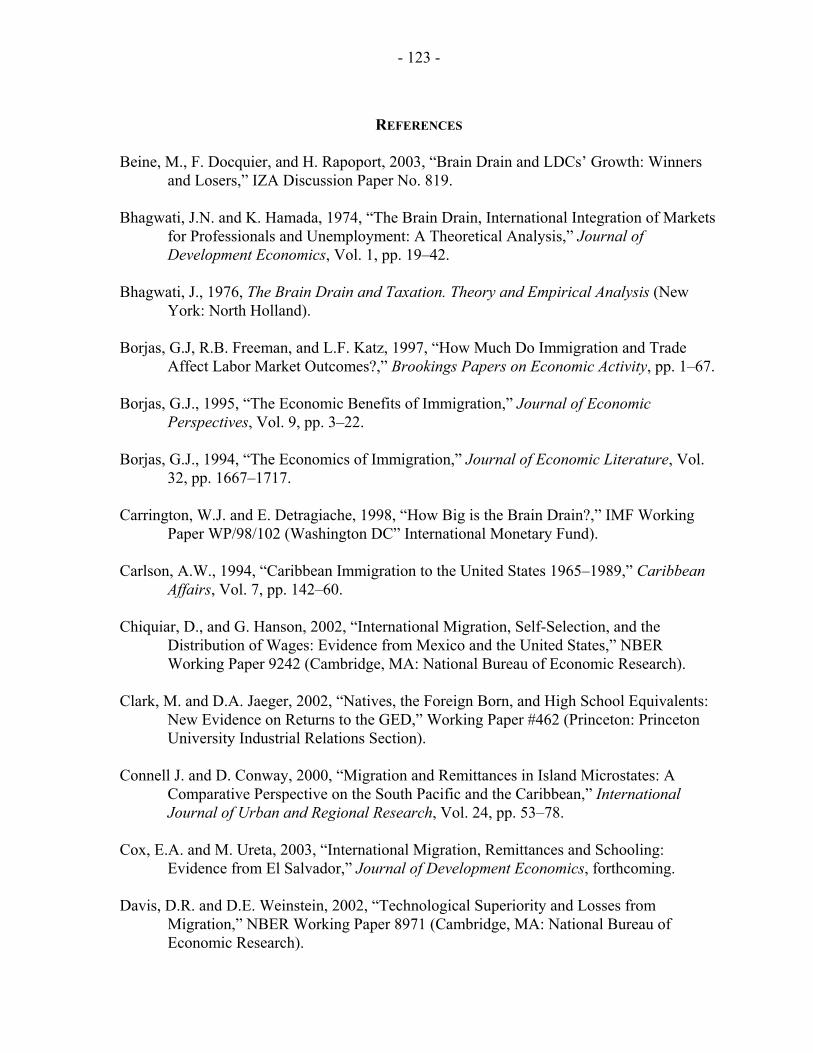
- 123 -
REFERENCES Beine, M., F. Docquier, and H. Rapoport, 2003, “Brain Drain and LDCs’ Growth: Winners
and Losers,” IZA Discussion Paper No. 819. Bhagwati, J.N. and K. Hamada, 1974, “The Brain Drain, International Integration of Markets
for Professionals and Unemployment: A Theoretical Analysis,” Journal of Development Economics, Vol. 1, pp. 19–42.
Bhagwati, J., 1976, The Brain Drain and Taxation. Theory and Empirical Analysis (New
York: North Holland). Borjas, G.J, R.B. Freeman, and L.F. Katz, 1997, “How Much Do Immigration and Trade
Affect Labor Market Outcomes?,” Brookings Papers on Economic Activity, pp. 1–67. Borjas, G.J., 1995, “The Economic Benefits of Immigration,” Journal of Economic
Perspectives, Vol. 9, pp. 3–22. Borjas, G.J., 1994, “The Economics of Immigration,” Journal of Economic Literature, Vol.
32, pp. 1667–1717. Carrington, W.J. and E. Detragiache, 1998, “How Big is the Brain Drain?,” IMF Working
Paper WP/98/102 (Washington DC” International Monetary Fund). Carlson, A.W., 1994, “Caribbean Immigration to the United States 1965–1989,” Caribbean
Affairs, Vol. 7, pp. 142–60. Chiquiar, D., and G. Hanson, 2002, “International Migration, Self-Selection, and the
Distribution of Wages: Evidence from Mexico and the United States,” NBER Working Paper 9242 (Cambridge, MA: National Bureau of Economic Research).
Clark, M. and D.A. Jaeger, 2002, “Natives, the Foreign Born, and High School Equivalents:
New Evidence on Returns to the GED,” Working Paper #462 (Princeton: Princeton University Industrial Relations Section).
Connell J. and D. Conway, 2000, “Migration and Remittances in Island Microstates: A
Comparative Perspective on the South Pacific and the Caribbean,” International Journal of Urban and Regional Research, Vol. 24, pp. 53–78.
Cox, E.A. and M. Ureta, 2003, “International Migration, Remittances and Schooling:
Evidence from El Salvador,” Journal of Development Economics, forthcoming. Davis, D.R. and D.E. Weinstein, 2002, “Technological Superiority and Losses from
Migration,” NBER Working Paper 8971 (Cambridge, MA: National Bureau of Economic Research).
- 124 -
Desai, M., D. Kapur, and J. McHale, forthcoming, “The Fiscal Impact of the Brain Drain: Indian Emigration to the U.S.,” mimeo.
Docquier, F. and A. Marfouq, 2004, “Measuring the International Mobility of Skilled
Workers,” World Bank Policy Research Working Paper No. 3381 (Washington DC: World Bank).
Dollar, D. and A. Kraay, 2002, “Growth is Good for the Poor,” Journal of Economic Growth
Vol. 7, pp. 195–225. Duay, J., 1994, “Beyond the Safety Valve: Recent Trends in Caribbean Migration,” Social
and Economic Studies, Vol. 43. Friedberg, R.M. and J. Hunt, 1995, “The Impact of Immigrants on Host Country Wages,
Employment and Growth,” Journal of Economic Perspectives, Vol. 9, pp. 23–44. Gonzalez, A., 2002, “Is the Education of Child Immigrants Affected by Their Age at
Arrival? Findings and Policy Implications,” mimeo. Grogger, J. and S.J. Trejo, 2002, “Falling Behind or Moving Up? The Intergenerational
Progress of Mexican Americans,” mimeo (San Francisco: Public Institute of California).
Hall, R. and C.I. Jones, 1999, “Why Do Some Countries Produce So Much Output per
Worker Than Others,?” Quarterly Journal of Economics, Vol. 114, pp. 83–116. Hamermesh, D.S., 1993, Labor Demand (Princeton, NJ: Princeton University Press).
Hanson, G.H., 2003, “What Has Happened to Wages in Mexico Since NAFTA?,” NBER Working Paper 9563 (Cambridge, MA: National Bureau of Economic Research).
Hanson, G.H., R. Robertson, and A. Spilimbergo, 2002, “Does Border Enforcement Protect
U.S. Workers From Illegal Immigration?,” The Review of Economics and Statistics. Vol. 84, pp. 74–92.
Hanson, G.H. and C. Woodruff, 2002, “Emigration and Educational Attainment in
Mexico,” mimeo, University of California at San Diego. Kapur, D., 2004, “Remittances: The New Development Mantra?,” G-24 Discussion Paper
Series No. 29. Lucas, R.E.B., 1987, “Emigration to South Africa’s Mines,” American Economic Review,
Vol. 77, pp. 313–330. MacDougall, G.D.A., 1960, “The Benefits and Costs of Private Investment From Abroad,”
Economic Record, Vol. 36, pp. 13–35.
- 125 -
Mishra, P., 2004, “Emigration and Wages in Source Countries: Evidence From Mexico,”
mimeo. Quibria, M.G., 1989, “International Migration and Real Wages: Is There Any Neo-classical
Ambiguity?,” Journal of Development Economics, Vol. 31, pp. 177–83. Ratha, D., 2003, “Workers’ Remittances: An Important and Stable Source of External
Development Finance,” Global Development Finance, (Washington DC: World Bank).
Rauch, J. and V. Trindade, 2002, “Ethnic Chinese Networks in International Trade,” Review
of Economics and Statistics, Vol. 84, pp. 116–130. Reyes, H. and J. Stubbs, 2004, World Bank Newsletter, No. 48, May (Washington DC:
World Bank). Rivera-Batiz, F.L., 1989, “The Impact of International Migration on Real Wages: Another
Look,” Journal of Development Economics, Vol. 31, pp. 185–92. Samuel, W., 2004, “Migration and Remittances: A Case Study of the Caribbean,” mimeo. Terry, D. F., 2004, “Latin America and Caribbean Remittances: The Next Five Years,”
mimeo. UNESCO, 2004, Global Education Digest (New York: United Nations Education, Scientific
and Cultural Organization). Wood, C.H. and T.L. McCoy, 1985, “Migration, Remittances and Development: A Study of
Caribbean Cane Cutters in Florida,” International Migration Review, Vol. 19, Summer, pp. 251–277.
Woodruff, C. and R. Zenteno, 2001, “Remittances and Micro-Enterprises in Mexico,”
mimeo, University of California at San Diego.
- 126 -
VII. INTEGRATION AND GROWTH IN THE EASTERN CARIBBEAN1
A. Introduction 1. This chapter explores the extent and effects of regional and international integration of the ECCU countries.2 It reviews their basic integration strategy, achievements, and shortcomings. It focuses on various aspects of integration to show how, despite being fairly open economies, the ECCU countries are not fully integrated into the global economy. The chapter then explores empirically the contribution of integration to growth in the ECCU. 2. ECCU countries have developed behind a wall of high protection, combined with significant product and factor market rigidities. While this helped increase intra-regional trade to a limited extent, real income growth has significantly slowed in the past six years. The ECCU countries have developed uncompetitive production structures, and real wages have tended to increase more than productivity growth. The chapter draws on various aspects of the literature—with particular emphasis on factor market integration—to address one of the major policy challenges facing ECCU countries. The chapter takes a broad view of integration to encompass many aspects of liberalization of trade in goods and services and of factor markets, through regional and multilateral integration arrangements.
B. The Integration and Growth Literature Traditional approach 3. There is general agreement among mainstream economists that international trade promotes growth and development. The general consensus can be characterized as follows. International trade leads to higher growth by reallocating scarce resources to those sectors in which a country has a comparative advantage, thereby increasing output and income levels through gains from specialization. Measures to improve trade, such as integration at the regional and international level, can, therefore, be expected to raise growth rates. 4. According to Haveman et al. (2001), there are three channels to increase growth through integration and trade. First, integration increases communication, thereby facilitating the transmission of technology. Second, integration leads to an increase in the size of the market, thus increasing gains from economies of scale. Finally, greater competition promotes research and development activities. Moreover, knowledge spillovers,
1 Prepared by Montfort Mlachila and Wendell Samuel. 2 Unless otherwise specified, the ECCU countries referred to in the chapter are the member countries of the IMF: Antigua and Barbuda, Dominica, Grenada, St. Kitts and Nevis, St. Lucia, and St. Vincent and the Grenadines.
- 127 -
which reduce duplication of research and development activities, are an increasing function of the volume of trade between countries. 5. Among others, Sachs and Warner (1995) document that trade and integration are major determinants of growth in poor countries. Using cross-country indicators of trade openness for over 100 developed and developing countries over a long period of time (about 40 years), and controlling for other policy variables, they show that the lack of economic convergence in income levels in most developing countries is explained by a closed trade regime. They also show that open economies usually successfully avoid balance of payments crises. Recent developments and critique of the traditional approach 6. Much of the debate in recent years has been on whether the mere presence of trade, absent other factors, is a key ingredient in promoting growth. Recent literature (Frankel and Romer, 1999; Dollar and Kraay, 2004) focus on problems related to the potential endogeneity of trade and integration with other growth-raising reforms. They note that countries with liberal trade policies are likely to be those with other growth-inducing policies, such as those that promote physical and capital accumulation, as well as technological change. To counter the critique, these authors have attempted to use instrumental variables techniques to test whether trade by itself leads to higher growth or not. 7. The research on liberalization of trade in services has generally been less successful in demonstrating potential benefits of liberalization on growth. In a review of the literature on the subject, Whalley (2003) concludes that the studies are confusing and sometimes contradictory, and often fraught with serious methodological problems. Trade in services is typically subject to greater barriers than trade in goods—these include rights of establishment, rules of conduct, and competition rules. Whalley concludes that studies that typically find a strong impact on income and welfare suffer from biases resulting from misspecification of models. Models that assume no accompanying liberalization of factor markets typically find a weak impact on income and welfare. On the other hand, if liberalization of services extends to removing impediments to factor flows, especially foreign direct investment, then gains are usually large, but also uneven across countries. 8. In a fundamental critique of the trade and growth literature, Rodrik et al. (2004) argue that giving the “integration view” a central role in fostering economic convergence between poor and rich countries is erroneous. They argue that this approach focuses on superficial determinants of growth. In their view, it is necessary to answer the question why some societies manage to accumulate and innovate more rapidly than others. They organize their approach by looking at what they consider to be “deeper” determinants of growth. According to them, the three key ingredients (using various measures) are geography, integration, and institutions. In contrast to most of the prevailing literature, they find that the quality of institutions “trumps everything else.” They show that once institutions are controlled for, integration has no direct effect on incomes, while geography has at best weak direct effects. Their measure of institutional quality—property rights and the rule of
- 128 -
law—is statistically significant, and their results are very robust to various statistical tests, including endogeneity between institutions and integration.3 Application to the ECCU 9. Regional integration, by promoting transparency and nondiscriminatory practices, can promote good institutions. Although Rodrik et al. (2004) are quick to point out that their study does not offer clear policy implications, it can be argued that good institutions, both local and regional, can help foster regional integration and growth. What does the literature tell us about the merits of pursuing regional integration, as a way of promoting trade, investment and growth, and good institution building. Does regional integration indeed lead to more trade in general? What about the evidence for the CARICOM region and the ECCU? 10. From a theoretical perspective, the economic effects of integration in the form of a trading bloc are, in fact, ambiguous, and can lead to trade diversion. Gunning (2002) shows that in a South-South trading bloc, poorer members will typically suffer from the loss of revenue, and may well see a shift in the concentration of production in the richer, more industrialized members. Richer members benefit from protection from imports from the rest of the world through a common external tariff (CET). A simple diagrammatic presentation from Gunning (2002) illustrates this point (see the Appendix). 11. Regional trading arrangements (RTAs) may well be the best way forward in as far as liberalization of services is concerned, according to Stephenson (2002). This has less to do with the intrinsic merits of RTAs, and more to do with the weaknesses of the General Agreement on Trade in Services (GATS). She shows that RTA agreements in services, including those of CARICOM, have surpassed those of the GATS in terms of delivering promotion of transparency and stability of agreements. While the GATS has a positive list approach for services to be liberalized, RTAs typically assume that all services will be liberalized with some exceptions (negative list). RTAs also usually have an explicit clause precluding the introduction of any new restrictions on services trade. She concludes that although in general the optimum level of liberalization is at the multilateral level in order to attract and accommodate investment from the most efficient service operators, the regional level may well be the most appropriate and realistic, given the practical limitations. 12. Most South-South RTAs have been found empirically to promote trade. Using a gravity model, Cernat (2003) shows empirically that RTAs are generally trade creating, with little trade diversion. For CARICOM, Egoumé-Bossogo and Mendis (2002)—also using the gravity model framework for the period 1980–99—find that CARICOM has promoted intra-CARICOM trade, as well as trade with the rest of the world. In other words, they find little evidence of trade diversion within CARICOM.
3 Their approach is to use instrumental variables developed by Frankel and Romer (1999), and Acemoglu et al. (2001).
- 129 -
C. The ECCU Experience with Regional Integration and Growth Objectives of regional integration in the Caribbean4 13. Regional integration in CARICOM was initially viewed as a way to facilitate import substitution and industrialization at the regional level, after national opportunities were exhausted. Since the size of individual domestic markets was a major constraint to production (Demas, 1965, 1974), early efforts at integration focused on market integration—removing impediments to regional trade of manufactured and agricultural goods and widening the protected domestic market. The initially-high common external tariff (70 percent) was a deliberate effort to divert trade from third countries, since none of the CARICOM member countries would have been the least-cost producer of manufactured goods. The high tariffs were expected to have a secondary effect of encouraging FDI flows, as firms from third countries would establish branches behind the tariff walls to try to retain their markets. A second objective of regional integration was to exploit complementarities in the resources of the region through production integration (Brewster and Thomas, 1973; Blake, 1984). 14. Joint trade negotiations aimed at increasing bargaining power and therefore raising the terms of trade, while at the same time, CARICOM intended to pursue the provision of common services to benefit from scale economies (Demas, 1974). Andriamananjara and Schiff (1998), using theoretical analysis of bargaining power and high fixed costs of negotiating, have argued that CARICOM has been exceptionally successful in enhancing its bargaining power beyond its size and economic importance by concluding agreements such as the Lomé Convention, CBI, and CARIBCAN. The Lomé Convention and the successor Cotonou Agreement conferred higher export prices for Caribbean products. Similarly, high fixed costs of production have been used to justify the provision of common social services like tertiary education and some health services in CARICOM. 15. The ECCU countries participate in a series of concentric integration initiatives that cover a variety of areas (Box VII.1). The membership in the ECCU is almost identical to that of the Organization of Eastern Caribbean States (OECS), with the latter including the British Virgin Islands. All of the countries are members of CARICOM, a wider regional integration movement among the former British colonies in the Caribbean, along with Suriname and Haiti. The CARICOM countries are negotiating jointly for entry into the Free Trade of the Americas (FTAA), via the regional negotiating machinery (RNM). Similarly, the RNM is negotiating an economic partnership agreement with the European Union (EU) as part of the broader negotiations with the African, Caribbean, and Pacific countries (ACP) for a successor to the Cotonou Agreement. All of this takes place against the background of global liberalization under the auspices of the WTO.
4 Further details on regional integration in the ECCU can be found in IMF (2004a), Chapter VII.
- 130 -
Recent developments in implementing stated objectives of integration 16. CARICOM does not have a good record of implementing the stated objectives. There has been some success in eliminating tariffs on goods originating within the region, reducing the level of the common external tariff, joint international negotiations, and the provision of common services. However, many of the initiatives remain on the books and are not yet implemented, such as rights of establishment, the free movement of capital, a regime for free trade in services, and a common currency (CARICOM, 2004). Meanwhile, free movement of labor is restricted to some very restrictive categories, such as university graduates, artists, and media workers. This has precluded firms from obtaining factors of production from lower-cost sources, especially in areas where there is a shortage of skills. 17. To address shortcomings, the original CARICOM treaty was amended by a series of protocols starting in the mid-1990s, but key limitations to integration remain. There are nine protocols, of which the most important deal with organizational structure and administration to help speed up implementation of decisions, rights of establishment and free movement of capital, competition policy, industrial policy, and disadvantaged regions. The full implementation of these protocols as well as the completion of the program for reducing the common external tariff from 5–45 percent to a range of 0–20 percent is scheduled for 2005 in the context of introducing the CARICOM Single Market and Economy (CSME) (see Table VII.1). Free movement of labor would still be confined to limited categories of workers, which have been expanded to include service providers who have to relocate to trade their services.
- 131 -
Box VII.1. Preferential Trade Arrangements in Which ECCU Countries Participate
The ECCU countries participate in a series of concentric and sometimes overlapping trading arrangements, which accord them varying degrees of trade preferences (Figure VII.1). These agreements co-exist with the negotiations under the WTO for multilateral trade liberalization. The following is a brief description of the major preferential trading agreements of the ECCU countries. The Organization of Eastern Caribbean States (OECS) is the tightest integration grouping of the ECCU. Created in 1981, it includes all 8 members of the ECCU and the British Virgin Islands. The major goals are promoting economic integration, managing a common currency via the ECCB, setting up a common judicial system via a joint supreme court, coordinating civil aviation activities and telecommunication services, and maintaining joint overseas missions. Discussions are underway for creating an economic union by 2006 with free movement of labor. The Caribbean Community (CARICOM), established in 1973, originally included only English-speaking Caribbean countries, but was recently expanded to include Suriname and Haiti. It is essentially a common market for goods and capital, but without free movement of labor. It also provides a framework for common services in education, health, meteorology, and foreign policy. Goods originating within the region are generally (there are only a few exceptions) traded duty free. Although a common external tariff (CET) was established in 1975 with a maximum rate of 70 percent, it has not been fully harmonized because of delays in implementation. In 1993, the countries agreed on a three-year program to reduce the CET to the range of 0–20 percent, but to date some members have not fully complied. The integration process is marred by slow implementation of decisions, because there is no effective sanctioning mechanism (Girvan, 2004). The 1973 Lomé Convention between the European Union (EU) and the African Caribbean and Pacific (ACP) countries, provided one-sided duty-free access into EU markets for goods which meet the rules of origin. The import of bananas, rice and sugar were governed by protocols, which conferred higher than world market prices for these products in line with the EU’s Common Agricultural Policy. Thus for the ECCU, Dominica, Grenada, St. Lucia, and St. Vincent and the Grenadines benefited from higher banana prices and St. Kitts and Nevis from higher sugar prices. Latin American banana producers successfully challenged the banana regime under the WTO, which has resulted in reforms that reduced the level of protection. A similar challenge to the sugar regime was upheld by the WTO in 2004. The Cotonou Agreement (2000) updated the Lomé Convention to be consistent with WTO policies, but the commodity protocols will continue, subject to periodic review. Negotiations are continuing for the eventual creation of reciprocal economic partnerships, which include reverse reciprocity of any preferences extended to third countries. The Caribbean Basin Initiative (CBI), which began in 1984, also offers nonreciprocal duty-free access of some goods to the United States that meet the rules of origin and some other criteria. The CBI has not been as beneficial as Lomé, because of the initially narrow range of goods and the advent of NAFTA which later eroded the preferences. The list of goods was expanded in 2000 for 8 years, and this has partially reversed the erosion. The benefits of CARIBCAN—which provides nonreciprocal duty-free access into Canada—are also constrained by the range of goods, uncertainty of duration, and NAFTA. The Free Trade Area of the Americas (FTAA) agreement, under negotiation, will allow all countries in the Western Hemisphere (excluding Cuba) to trade freely in goods and services. The ECCU countries have argued for special and differential treatment, in order to reduce the adjustment costs.
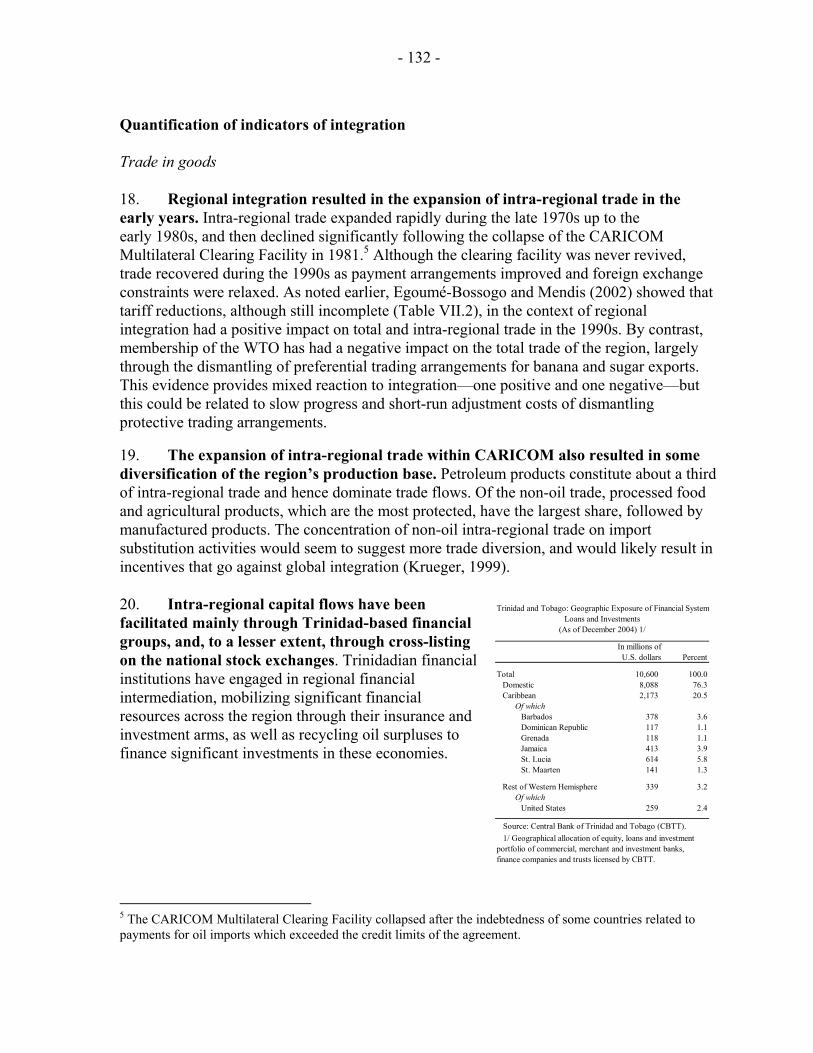
- 132 -
Quantification of indicators of integration Trade in goods 18. Regional integration resulted in the expansion of intra-regional trade in the early years. Intra-regional trade expanded rapidly during the late 1970s up to the early 1980s, and then declined significantly following the collapse of the CARICOM Multilateral Clearing Facility in 1981.5 Although the clearing facility was never revived, trade recovered during the 1990s as payment arrangements improved and foreign exchange constraints were relaxed. As noted earlier, Egoumé-Bossogo and Mendis (2002) showed that tariff reductions, although still incomplete (Table VII.2), in the context of regional integration had a positive impact on total and intra-regional trade in the 1990s. By contrast, membership of the WTO has had a negative impact on the total trade of the region, largely through the dismantling of preferential trading arrangements for banana and sugar exports. This evidence provides mixed reaction to integration—one positive and one negative—but this could be related to slow progress and short-run adjustment costs of dismantling protective trading arrangements. 19. The expansion of intra-regional trade within CARICOM also resulted in some diversification of the region’s production base. Petroleum products constitute about a third of intra-regional trade and hence dominate trade flows. Of the non-oil trade, processed food and agricultural products, which are the most protected, have the largest share, followed by manufactured products. The concentration of non-oil intra-regional trade on import substitution activities would seem to suggest more trade diversion, and would likely result in incentives that go against global integration (Krueger, 1999). 20. Intra-regional capital flows have been facilitated mainly through Trinidad-based financial groups, and, to a lesser extent, through cross-listing on the national stock exchanges. Trinidadian financial institutions have engaged in regional financial intermediation, mobilizing significant financial resources across the region through their insurance and investment arms, as well as recycling oil surpluses to finance significant investments in these economies.
5 The CARICOM Multilateral Clearing Facility collapsed after the indebtedness of some countries related to payments for oil imports which exceeded the credit limits of the agreement.
Trinidad and Tobago: Geographic Exposure of Financial SystemLoans and Investments
(As of December 2004) 1/
In millions ofU.S. dollars Percent
Total 10,600 100.0Domestic 8,088 76.3Caribbean 2,173 20.5
Of which Barbados 378 3.6 Dominican Republic 117 1.1 Grenada 118 1.1 Jamaica 413 3.9 St. Lucia 614 5.8 St. Maarten 141 1.3
Rest of Western Hemisphere 339 3.2 Of which
United States 259 2.4
Source: Central Bank of Trinidad and Tobago (CBTT). 1/ Geographical allocation of equity, loans and investment portfolio of commercial, merchant and investment banks, finance companies and trusts licensed by CBTT.
- 133 -
21. While the CARICOM integration initiative has increased intra-regional trade in goods, its impact on ECCU countries has been disappointing, particularly during the 1990s. During 1991–2003, the level of total exports of goods of ECCU countries remained virtually unchanged in nominal terms (Table VII.3), in part due to the increasing international competition in two key export products, bananas and sugar. At the same time, the available evidence seems to suggest the growth of trade-diverting integration as intra-ECCU exports increased from 9 to 17 percent of total exports. Product market restrictions 22. Apart from the common external tariff (CET), major product market distortions in the ECCU arise from the presence of nontariff barriers, monopolies, and state-owned enterprises. Some nontariff barriers have been retained in an effort to minimize the short-run impact on real income and unemployment, which would otherwise result from the closure of less efficient domestic firms.6 The special regime for the ECCU countries and Belize has also fostered inefficiencies and distortions.7 While most utilities are provided by monopolies, the telecommunications sector is currently being liberalized on a regional basis.8 A number of products, including basic food products and fuel, are imported by state-owned or state-licensed monopolies. The participation of the public sector in the economy varies across the countries and is most widespread in St. Kitts and Nevis where the sugar industry, electricity, and import of some basic foods are controlled by public enterprises, in addition to public sector participation in banking and telecommunications. As a result, there is some evidence that the average level of product mark-up and prices is quite high in the ECCU. While there is no data available for the ECCU countries, given their similarities with Barbados (McLean, 1981), a mark-up of 33–45 percent in the distributive sector seems likely. Financial market segmentation in the ECCU 23. Despite sharing a common currency for most of their recent history, monetary and financial integration is far from complete. Legal and regulatory restrictions that deter the free flow of capital have led to fragmentation of the financial sector, as evidenced by large interest rate differentials between the countries (Table VII.4). Regulatory barriers like
6 Finger, Ng and Sloaga (1998) have compiled a list of trade restrictions practiced by the countries, which include import licenses, quantitative restrictions, and imports by state monopolies.
7 See Commonwealth Secretariat (1999) for a discussion of the effects of the Article 56 of the Treaty of Chaguaramas, which allowed countries to maintain nontariff barriers against specific products from the ‘more developed (CARICOM) countries’ (MDCs). 8 For many years telecommunication services in the ECCU was dominated by a single monopoly service provider under long-term exclusive contracts. Five ECCU countries have jointly negotiated the termination of these contracts and, starting in 2002, competition is being permitted in a number of telecom services, with the sector being jointly regulated by a regional agency, the Eastern Caribbean Telecommunications Authority (ECTEL).
- 134 -
Alien Land Holding licenses and differential tax polices such as withholding taxes on nonresidents, as well as limits to the enforceability of contracts across territories, have essentially created a collection of mini financial systems within the currency union (World Bank, 1998). Prime lending rates can differ by more than 300 basis points, with greater variance between other lending rates. Such differentials in interest rates as well as asymmetric liquidity across countries and institutions imply that financial resources are not efficiently utilized, thereby dampening growth potential. 24. The fragmentation of the financial system results in higher operating costs because of the absence of economies of scale, and it also diminishes the capacity of the financial system to help spread risks. The Eastern Caribbean Central Bank has, in recent years, created a number of regional institutions to reduce the fragmentation of the financial system. A regional government securities market (RGSM) has been established to facilitate the issuance and secondary market trading in government securities, as well as an over-the-counter exchange for equities (Eastern Caribbean Securities Exchange). However, the government securities market still does not cover all territories (Antigua and Barbuda and Dominica have not met the criteria), and only 5 of a possible 30 public companies are listed on the stock exchange. 25. The external capital account has been progressively liberalized. Current transactions were free of restrictions since the 1970s, and an already liberal regime of capital controls was reformed in 1996, requiring authorization only for transactions over US$90,000.9 The limit was progressively raised until it was eliminated in 2003. However, the legal and regulatory barriers identified above also curtail the benefits of a more open capital account, yet also spare the countries some of the negative effects of volatile short-term capital flows. Characteristics of ECCU labor markets 26. There is a relatively high level of wage inflexibility in the ECCU countries for several reasons. First, wages are determined mainly by collective bargaining agreements. With strong unions, wages are determined more by bargaining strength and political pressures, rather than productivity growth. These wage settlements result in relatively higher production costs, which affect the international competitiveness of production (ABT Associates, 1998). The level of unionization ranges from 12 percent in St. Vincent and the Grenadines to 33 percent in St. Kitts and Nevis (Table VII.5). Second, public sector wage agreements exert a very strong influence on wages in the private sector, given the relative size of government employment, which averages about 21 percent of the work force in the ECCU. Thus, in the private sector the wage determination process results in a distribution of rents between employers and workers similar to that described in Blanchard and Giavazzi
9 Although capital outflows required exchange control authorization, the de facto regime was very liberal as registered FDI inflows could be withdrawn without the need for approval, and other applications were routinely approved.
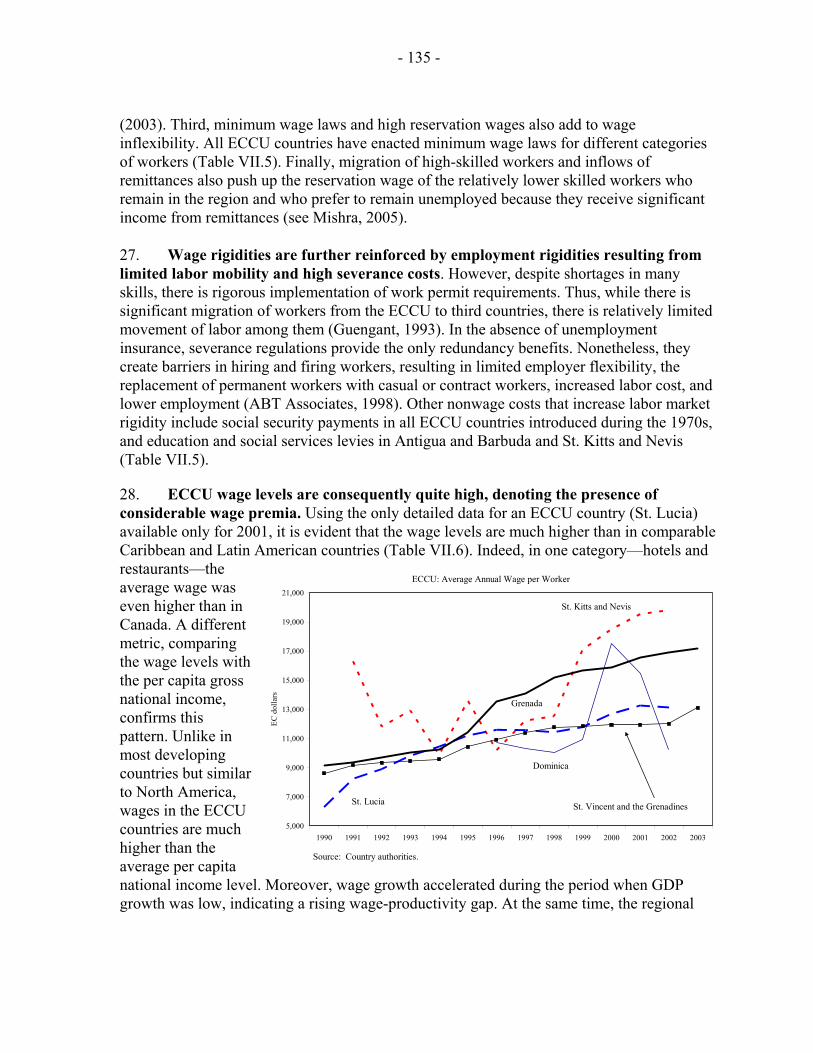
- 135 -
(2003). Third, minimum wage laws and high reservation wages also add to wage inflexibility. All ECCU countries have enacted minimum wage laws for different categories of workers (Table VII.5). Finally, migration of high-skilled workers and inflows of remittances also push up the reservation wage of the relatively lower skilled workers who remain in the region and who prefer to remain unemployed because they receive significant income from remittances (see Mishra, 2005). 27. Wage rigidities are further reinforced by employment rigidities resulting from limited labor mobility and high severance costs. However, despite shortages in many skills, there is rigorous implementation of work permit requirements. Thus, while there is significant migration of workers from the ECCU to third countries, there is relatively limited movement of labor among them (Guengant, 1993). In the absence of unemployment insurance, severance regulations provide the only redundancy benefits. Nonetheless, they create barriers in hiring and firing workers, resulting in limited employer flexibility, the replacement of permanent workers with casual or contract workers, increased labor cost, and lower employment (ABT Associates, 1998). Other nonwage costs that increase labor market rigidity include social security payments in all ECCU countries introduced during the 1970s, and education and social services levies in Antigua and Barbuda and St. Kitts and Nevis (Table VII.5).
28. ECCU wage levels are consequently quite high, denoting the presence of considerable wage premia. Using the only detailed data for an ECCU country (St. Lucia) available only for 2001, it is evident that the wage levels are much higher than in comparable Caribbean and Latin American countries (Table VII.6). Indeed, in one category—hotels and restaurants—the average wage was even higher than in Canada. A different metric, comparing the wage levels with the per capita gross national income, confirms this pattern. Unlike in most developing countries but similar to North America, wages in the ECCU countries are much higher than the average per capita national income level. Moreover, wage growth accelerated during the period when GDP growth was low, indicating a rising wage-productivity gap. At the same time, the regional
ECCU: Average Annual Wage per Worker
5,000
7,000
9,000
11,000
13,000
15,000
17,000
19,000
21,000
1990 1991 1992 1993 1994 1995 1996 1997 1998 1999 2000 2001 2002 2003
EC d
olla
rs
Dominica
St. Kitts and Nevis
St. Lucia St. Vincent and the Grenadines
Grenada
Source: Country authorities.
- 136 -
unemployment rate has remained high, at over 20 percent. The high rate of migration to the U.S., Canada, and the U.K. has somewhat reduced the pressures on the labor market.10
D. Modeling the Contribution of Integration to Growth in the ECCU
Basic model and data
29. The main objective of the model developed here is to analyze the relative contribution of various measures of integration to real GDP growth over time in ECCU countries, as well as in other Caribbean states. The model does not attempt to answer the question whether integration causes growth; to do this a much wider cross-section of data and a robust set of instrumental variables would be required, which have not been possible to construct for this exercise. Given the preponderance of trade in services such as tourism for the countries in our sample (see for example, Table VII.7a&b for the ECCU)—for which there is no direction of trade data—the traditional gravity model can also not be used to analyze this question.11 Even if the direction of trade in services data were available, it is still problematic to use a gravity model for tourism, which is driven more by factors such as “sea, sun, and sand,” and less by distance and relative size.12
30. The aim of this section is, therefore, simply to explore the contribution of integration to growth over time, controlling for exogenous factors and domestic policy changes.13 The following general equation is estimated:
git = α0 + βTit + γEit + θPit + εit (1)
where: git: real GDP growth for country i during time t; Tit: a vector of international integration variables; Eit: a vector of exogenous variables; Pit: a vector of domestic policy variables; and εit: the random disturbance term.
Box VII.2 gives a more detailed description of the model and data used.
10 According to U.S. Census data, about 20 percent of the ECCU labor force emigrated to the U.S. between 1970 and 2000 (Mishra, 2005).
11 The gravity model is usually used to construct a “trade instrument,” i.e., the amount of trade that would be expected between any pair of countries given their relative size and distance (see Anderson (1979) for a detailed exposition on the gravity model).
12 See Egoumé-Bossogo and Mendis (2002) for an elaboration of this point.
13 The methodology is drawn, in part, from Mattoo et al. (2001).
- 137 -
Box VII.2. The Estimated Model and Data
The actual model estimated for the ECCU countries and then for 14 Caribbean countries, Bolivia and Costa Ricais:
git = α0 + β1τit + β2OPENit + β3FDIit + γ1(∆TOT)it + γ2(∆FDEM)it + γ3 XGROit + θ1GCBit + θ2PINVit + εit (2) The data used in the model are annual observations for the 16 countries in our sample for the period 1980–2003. The data are largely derived from the IMF’s World Economic Outlook database and the IFS. In several instances with missing data, secondary sources such as IMF country reports are also used. The following is a description of the various variables: Growth g: the real growth rate of the GDP (in domestic currency terms). International integration variables (T) τ : the effective duty rate, calculated as the ratio between customs duties and surcharges and imports of goods. This variable is a good proxy of what the countries have effectively done to reduce barriers to trade (see Senhadji and Ginting, 2004).1/ It is expected that the sign of the coefficient for this variable would be negative, i.e., the higher the effective trade taxes, the lower will be the growth.
OPEN: the openness index is calculated as the ratio of (exports+imports of goods and services) to current nominal GDP. Openness is expected to have a positive impact on growth.
FDI: the ratio of FDI (in U.S. dollars) to GDP (converted at current exchange rates). FDI is expected to have a positive impact on growth.
Exogenous variables (E) TOT: terms of trade index. Changes in terms of trade could have either a positive or negative impact on growth, depending on whether they are positive or negative.
FDEM: index of final demand in industrial countries. Changes in this variable are expected to be positively correlated with growth in our sample.
XGRO: growth of exports of good and services (in U.S. dollars).
Domestic policy variables (P)
GCB: central government overall balance-to-GDP ratio. The sign of the coefficient is a matter of empirical investigation. In the short run, a deficit may increase if it results from an expansionary fiscal policy; in the long run, deficits probably have a negative impact.
PINV: public investment to GDP ratio. The sign of the coefficient could be positive or negative, i.e., investment in such things as infrastructure can be growth inducing. On the other hand, public investment, to the extent that itleads to crowding out of the private sector or if the quality of the investment is inferior, could also have a negative impact on growth.
1/ A more satisfactory approach would be to construct a trade liberalization index over time, which could also comprise nontariff barriers, and could also cover services. However, it is virtually impossible to construct such an index, as there is a lack of time series data.

- 138 -
Empirical results 31. The basic regression results suggest that while some integration effort variables are important, the international economic environment plays a greater role in explaining growth in the ECCU (Table VII.8).14 The latter is consistent with the findings in Cashin and Wang (2005). The main integration effort variable, the effective tariff rate, is highly significant with the correct sign, but openness is insignificant. Openness is possibly insignificant due to threshold effects, i.e., due to the initial very high level of openness among ECCU countries, the marginal gain from further openness is negligible. Of the three international economic variables, proxied by income in the industrial countries, growth in exports, and changes in the terms of trade, the first two have the strongest effects. Changes in the terms of trade have a negative effect on growth, while foreign direct investment was insignificant. The domestic policy variables were generally insignificant—except in two specifications at the 10 percent significance level; the government capital expenditure variable has a negative sign, suggesting that government expenditure was either counter cyclical or ineffective. 32. When the basic regressions were augmented by including the remaining Caribbean countries in the sample, the results were broadly similar to the ECCU, but, additionally, openness, foreign direct investment and the domestic policy variables become significant in most cases (Table VII.9). Growth in industrial countries, export growth, and changes in the terms of trade remain the most significant variables, while FDI becomes a significant explanatory variable for the region as a whole. Openness and the effective tariff rate are both significant in the random effects model, the relevant model for the Caribbean panel. The domestic policy variables also become significant in the augmented panel. 33. Re-estimating the growth equation to take account of spillover effects of integration yields a dramatically better fit with largely stable coefficients. The panel GLS estimator using cross-section weights along the lines of seemingly unrelated regression (SUR) model takes account of spillovers in the context of an integration movement. The method also corrects for cross-section heteroscedasticity. In the case of the ECCU, the parameter estimates remain largely the same but the adjusted R2 rises from about 0.40 to 0.48. Similarly, for the Caribbean panel, the coefficients of the growth in industrial countries, export growth and terms of trade are very stable but the R2 rises from about 0.30 to about 0.88. The increase in the explanatory power of the equation seems to suggest that there are some contemporaneous spillover effects that may be due to regional integration, and that such effects are larger for the wider Caribbean than for the ECCU.
14 OLS, panel fixed effects, and random effects models were estimated for both groups. In the case of the ECCU the random effects model was rejected by the Hausman (and Breush-Pagan) tests, but the fixed effects model could not be rejected.
- 139 -
E. Concluding Remarks
34. Efforts at regional integration in the ECCU have met with limited success in promoting trade and growth in recent years, but the potential for leveraging regional initiatives to do so remains high. ECCU countries currently face considerable challenges: economic growth since the 1990s has slowed dramatically, and public debt has risen to very high levels in most countries. Unemployment and wage levels are high compared to countries at a similar level of development. Given the currency board arrangement, exchange rate policy cannot be used to increase competitiveness or to respond to real shocks such as natural disasters.15 There have been many regional initiatives, particularly in the provision of common services, which have been relatively successful, including a common judiciary, joint external representation in the OECS, university education, and epidemiological services in CARICOM. However, more can be done even in this area, for example, through better coordination of security and customs services and the granting of tax incentives. 35. The theoretical and empirical work reviewed above suggests that integration has a positive effect on growth. Increases in market size, the transmission of technology and greater competition, all of which raise the efficiency of the economy, are among the key benefits of integration. For trade in services, in which the Caribbean has some competitive advantage, RTAs are more likely facilitate liberalization. In the case of CARICOM, the positive effects of integration may have been limited by the slow progress in implementing the agreements, including the reduction in the common external tariff and the adoption of initiatives to complete the single market and economy, particularly those related to trade in services and free movement of labor.
36. The empirical investigation finds that growth in the Caribbean is strongly influenced by growth in industrial countries, export growth, and changes in the terms of trade. The openness of the economies is also an important factor, but there are probably threshold effects, given the region’s already high level of openness. At the same time there is strong evidence that a reduction in the overall effective tariff (a proxy for trade reforms and international integration) is good for growth.16 Foreign direct investment and domestic policy variables (government capital spending and the central government balance) also appear to be statistically significant determinants of growth in the Caribbean.
37. Given the current trend in dismantling preferential access to the EU markets under the sugar and banana regimes, further integration of the ECCU economies into the global economy is inevitable. The theoretical literature and empirical evidence reviewed suggest that product and labor market deregulation would have a positive impact on
15 According to Rasmussen (2004), ECCU countries are among the top 20 most vulnerable countries in the world, judging by the number of disasters and the cost of damage.
16 Ideally, it would have been interesting to test whether a reduction in intra-CARICOM effective rates has been beneficial for growth. Unfortunately, the relevant data is not available.
- 140 -
employment and growth in the long run. However, there could be short-run costs related to lower nominal wages resulting from the elimination of protection-induced rents, which could be partially mitigated by possible declines in product prices.17 Since net benefits of integration are likely to be positive, particularly if they are implemented effectively, the ECCU countries should move quickly toward implementing the required reforms. Delaying this process would only postpone the benefits and make it harder to achieve a consensus for reform (DeRosa, 2000). The countries should also press forward with liberalization of the regime of trade in services under the CARICOM agreement and the free movement of labor and other labor market reforms under the initiative for economic union among the ECCU countries. They should use integration at the regional level as a stepping stone to greater international integration, with the latter yielding significantly more benefits, given the dependence of the ECCU countries’ growth rates on demand in industrial countries.
17 For example, it has been shown that in the context of the European community the long-run benefits vastly exceed the short-run cost (Bayoumi et al., 2004).
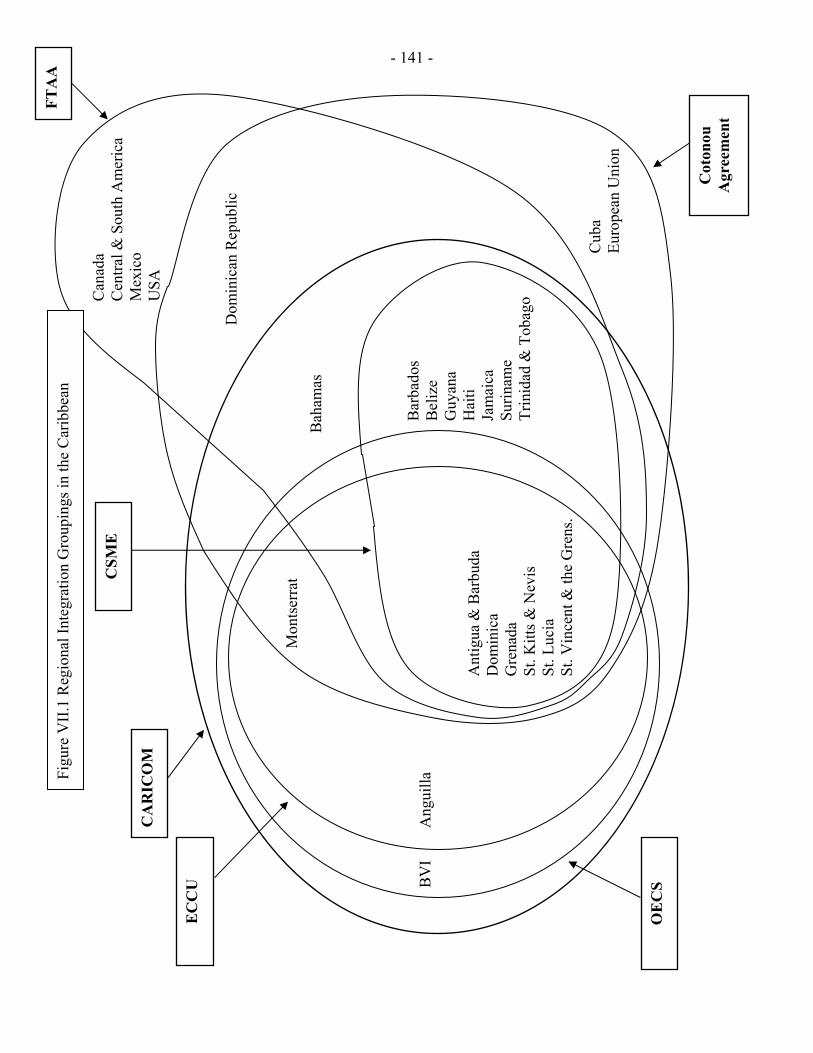
- 141 -
CSM
E
CA
RIC
OM
EC
CU
BV
I A
ngui
lla
Ant
igua
& B
arbu
da
Dom
inic
a G
rena
da
St. K
itts &
Nev
is
St. L
ucia
St
. Vin
cent
& th
e G
rens
.
Bar
bado
s B
eliz
e G
uyan
a H
aiti
Jam
aica
Su
rinam
e Tr
inid
ad &
Tob
ago
Bah
amas
M
onts
erra
t
Cub
a Eu
rope
an U
nion
Dom
inic
an R
epub
lic
Can
ada
Cen
tral &
Sou
th A
mer
ica
Mex
ico
USA
OE
CS
Cot
onou
A
gree
men
t
FTA
A
Figu
re V
II.1
Reg
iona
l Int
egra
tion
Gro
upin
gs in
the
Car
ibbe
an
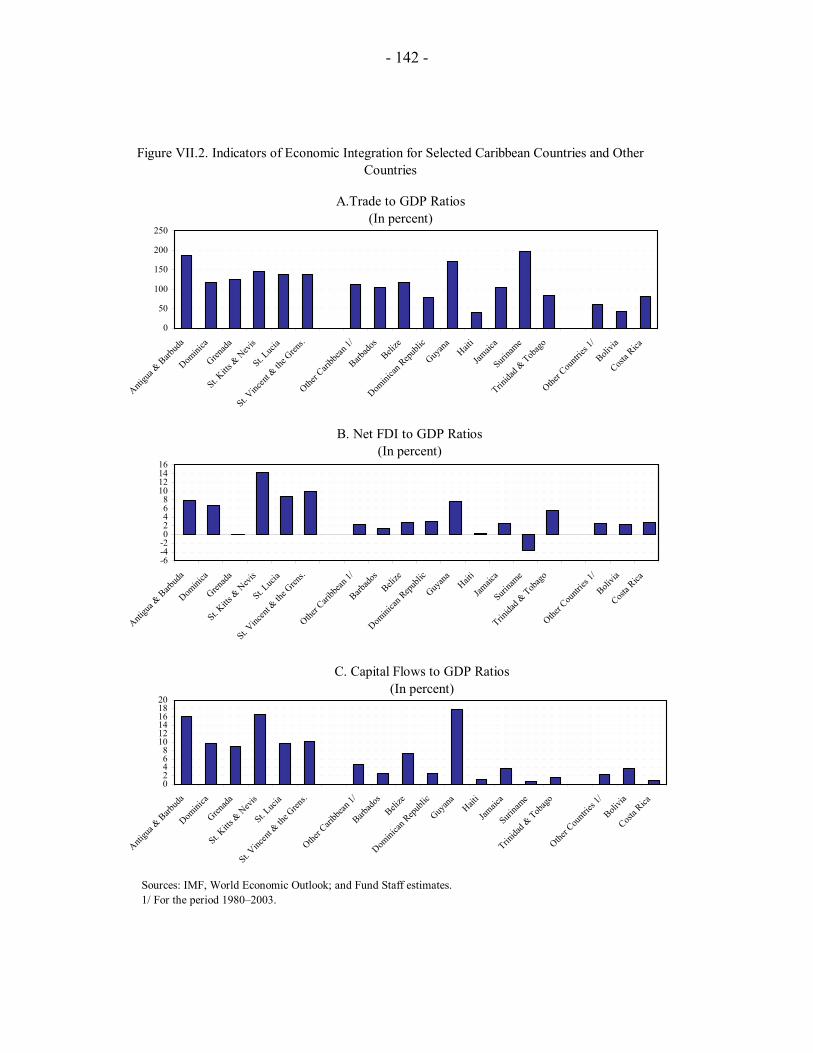
- 142 -
Figure VII.2. Indicators of Economic Integration for Selected Caribbean Countries and Other Countries
Sources: IMF, World Economic Outlook; and Fund Staff estimates.1/ For the period 1980–2003.
A.Trade to GDP Ratios(In percent)
0
50
100
150
200
250
Antigu
a & B
arbud
a
Domini
ca
Grenad
a
St. Kitts
& N
evis
St. Luc
ia
St. Vinc
ent &
the G
rens.
Other C
aribb
ean 1/
Barbad
osBeli
ze
Domini
can Rep
ublic
Guyan
aHait
i
Jamaic
a
Surina
me
Trinida
d & Tob
ago
Other C
ountr
ies 1/
Bolivia
Costa R
ica
-6-4-202468
10121416
Antigu
a & B
arbud
a
Domini
ca
Grenad
a
St. Kitts
& N
evis
St. Luc
ia
St. Vinc
ent &
the G
rens.
Other C
aribb
ean 1/
Barbad
osBeli
ze
Domini
can Rep
ublic
Guyan
aHait
i
Jamaic
a
Surina
me
Trinida
d & Tob
ago
Other C
ountr
ies 1/
Bolivia
Costa R
ica
B. Net FDI to GDP Ratios(In percent)
C. Capital Flows to GDP Ratios(In percent)
02468
101214161820
Antigu
a & B
arbud
a
Domini
ca
Grenad
a
St. Kitts
& N
evis
St. Luc
ia
St. Vinc
ent &
the G
rens.
Other C
aribb
ean 1/
Barbad
osBeli
ze
Domini
can Rep
ublic
Guyan
aHait
i
Jamaic
a
Surina
me
Trinida
d & Tob
ago
Other C
ountr
ies 1/
Bolivia
Costa R
ica
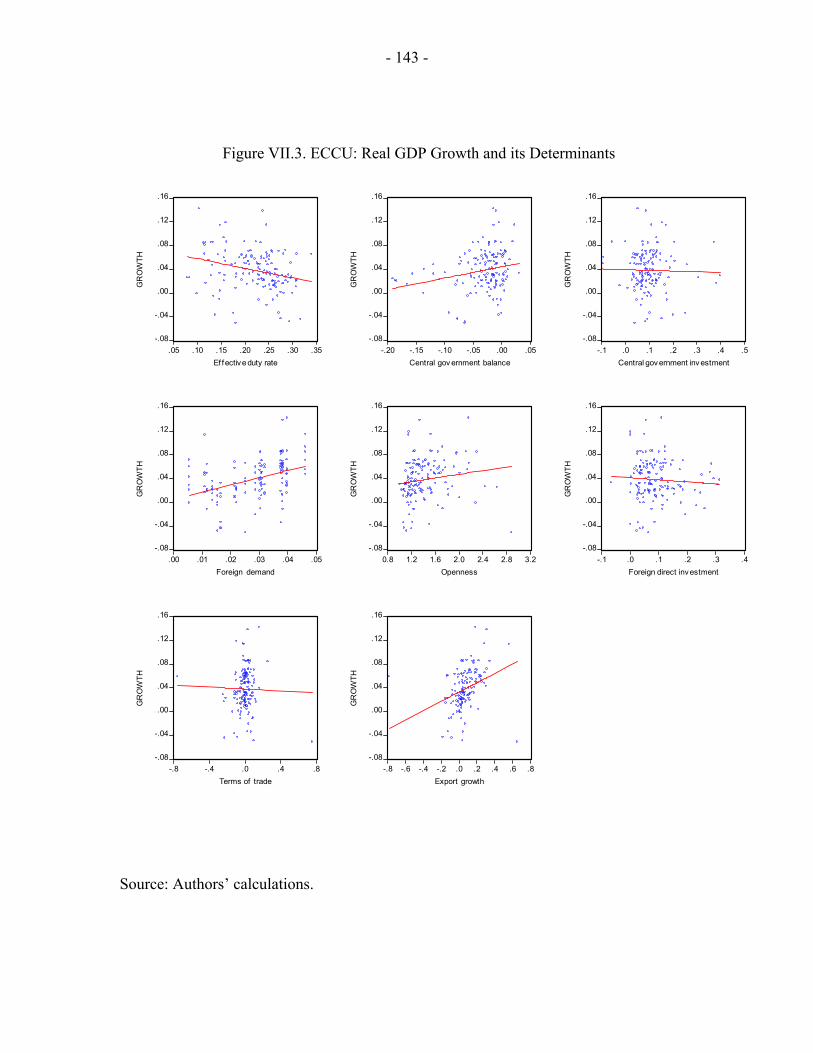
- 143 -
Figure VII.3. ECCU: Real GDP Growth and its Determinants
-.08
-.04
.00
.04
.08
.12
.16
.05 .10 .15 .20 .25 .30 .35Ef fective duty rate
GR
OW
TH
-.08
-.04
.00
.04
.08
.12
.16
-.20 -.15 -.10 -.05 .00 .05Central gov ernment balance
GR
OW
TH
-.08
-.04
.00
.04
.08
.12
.16
-.1 .0 .1 .2 .3 .4 .5Central gov ernment inv estment
GR
OW
TH
-.08
-.04
.00
.04
.08
.12
.16
.00 .01 .02 .03 .04 .05Foreign demand
GR
OW
TH
-.08
-.04
.00
.04
.08
.12
.16
0.8 1.2 1.6 2.0 2.4 2.8 3.2Openness
GR
OW
TH
-.08
-.04
.00
.04
.08
.12
.16
-.1 .0 .1 .2 .3 .4Foreign direct investment
GR
OW
TH
-.08
-.04
.00
.04
.08
.12
.16
-.8 -.4 .0 .4 .8Terms of trade
GR
OW
TH
-.08
-.04
.00
.04
.08
.12
.16
-.8 -.6 -.4 -.2 .0 .2 .4 .6 .8Export growth
GR
OW
TH
Source: Authors’ calculations.
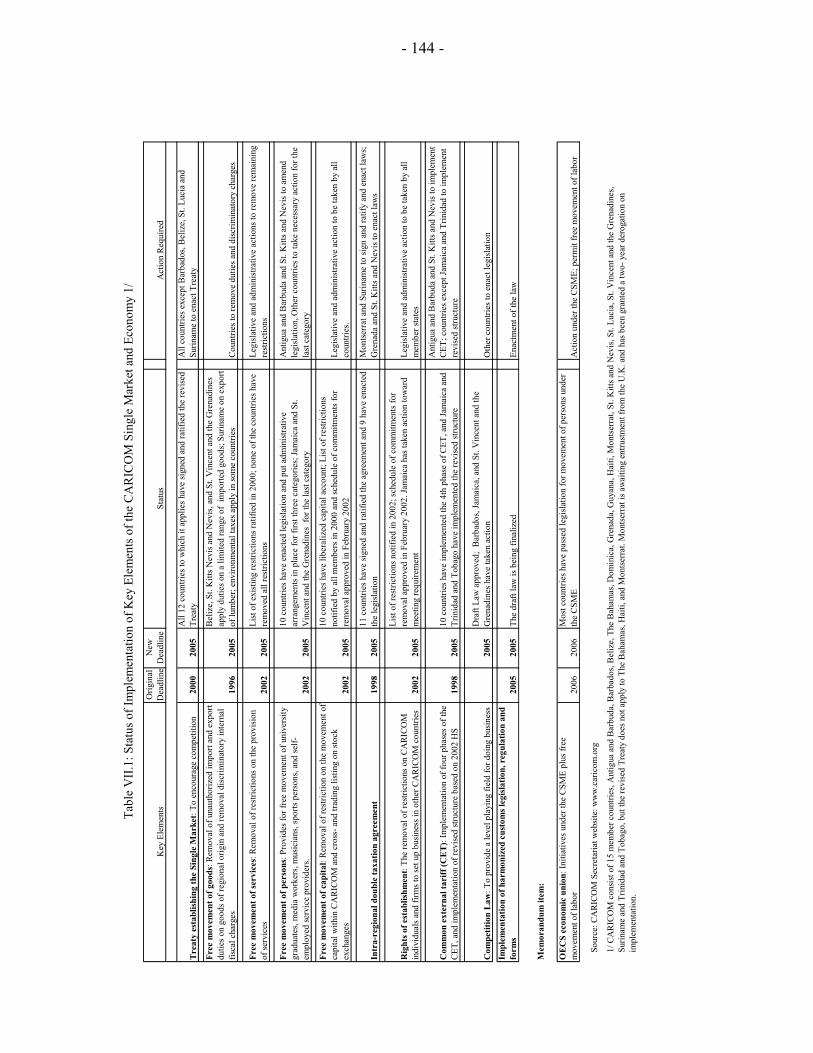
- 144 -
Orig
inal
New
Key
Ele
men
tsD
eadl
ine
Dea
dlin
eSt
atus
Act
ion
Req
uire
d
Tre
aty
esta
blis
hing
the
Sing
le M
arke
t: To
enc
oura
ge c
ompe
titio
n20
0020
05A
ll 12
cou
ntrie
s to
whi
ch it
app
lies h
ave
sign
ed a
nd ra
tifie
d th
e re
vise
d Tr
eaty
A
ll co
untri
es e
xcep
t Bar
bado
s, B
eliz
e, S
t. Lu
cia
and
Surin
ame
to e
nact
Tre
aty
Free
mov
emen
t of g
oods
: Rem
oval
of u
naut
horiz
ed im
port
and
expo
rt du
ties o
n go
ods o
f reg
iona
l orig
in a
nd re
mov
al d
iscr
imin
ator
y in
tern
al
fisca
l cha
rges
1996
2005
Bel
ize,
St.
Kitt
s Nev
is a
nd N
evis
, and
St.
Vin
cent
and
the
Gre
nadi
nes
appl
y du
ties o
n a
limite
d ra
nge
of i
mpo
rted
good
s; S
urin
ame
on e
xpor
t of
lum
ber;
envi
ronm
enta
l tax
es a
pply
in so
me
coun
tries
Cou
ntrie
s to
rem
ove
dutie
s and
dis
crim
inat
ory
char
ges
Free
mov
emen
t of s
ervi
ces:
Rem
oval
of r
estri
ctio
ns o
n th
e pr
ovis
ion
of se
rvic
es20
0220
05Li
st o
f exi
stin
g re
stric
tions
ratif
ied
in 2
000;
non
e of
the
coun
tries
hav
e re
mov
ed a
ll re
stric
tions
Legi
slat
ive
and
adm
inis
trativ
e ac
tions
to re
mov
e re
mai
ning
re
stric
tions
Free
mov
emen
t of p
erso
ns: P
rovi
des f
or fr
ee m
ovem
ent o
f uni
vers
ity
grad
uate
s, m
edia
wor
kers
, mus
icia
ns, s
ports
per
sons
, and
self-
empl
oyed
serv
ice
prov
ider
s.20
0220
05
10 c
ount
ries h
ave
enac
ted
legi
slat
ion
and
put a
dmin
istra
tive
arra
ngem
ents
in p
lace
for f
irst t
hree
cat
egor
ies;
Jam
aica
and
St.
Vin
cent
and
the
Gre
nadi
nes
for t
he la
st c
ateg
ory
Ant
igua
and
Bar
buda
and
St.
Kitt
s and
Nev
is to
am
end
legi
slat
ion,
Oth
er c
ount
ries t
o ta
ke n
eces
sary
act
ion
for t
he
last
cat
egor
y
Free
mov
emen
t of c
apita
l: R
emov
al o
f res
trict
ion
on th
e m
ovem
ent o
f ca
pita
l with
in C
AR
ICO
M a
nd c
ross
- and
trad
ing
listin
g on
stoc
k ex
chan
ges
2002
2005
10 c
ount
ries h
ave
liber
aliz
ed c
apita
l acc
ount
; Lis
t of r
estri
ctio
ns
notif
ied
by a
ll m
embe
rs in
200
0 an
d sc
hedu
le o
f com
mitm
ents
for
rem
oval
app
rove
d in
Feb
ruar
y 20
02Le
gisl
ativ
e an
d ad
min
istra
tive
actio
n to
be
take
n by
all
coun
tries
.
Intr
a-re
gion
al d
oubl
e ta
xatio
n ag
reem
ent
1998
2005
11 c
ount
ries h
ave
sign
ed a
nd ra
tifie
d th
e ag
reem
ent a
nd 9
hav
e en
acte
d th
e le
gisl
atio
nM
onts
erra
t and
Sur
inam
e to
sign
and
ratif
y an
d en
act l
aws;
G
rena
da a
nd S
t. K
itts a
nd N
evis
to e
nact
law
s
Rig
hts o
f est
ablis
hmen
t: Th
e re
mov
al o
f res
trict
ions
on
CA
RIC
OM
in
divi
dual
s and
firm
s to
set u
p bu
sine
ss in
oth
er C
AR
ICO
M c
ount
ries
2002
2005
List
of r
estri
ctio
ns n
otifi
ed in
200
2; sc
hedu
le o
f com
mitm
ents
for
rem
oval
app
rove
d in
Feb
ruar
y 20
02. J
amai
ca h
as ta
ken
actio
n to
war
d m
eetin
g re
quire
men
tLe
gisl
ativ
e an
d ad
min
istra
tive
actio
n to
be
take
n by
all
mem
ber s
tate
s
Com
mon
ext
erna
l tar
iff (C
ET
): Im
plem
enta
tion
of fo
ur p
hase
s of t
he
CET
, and
impl
emen
tatio
n of
revi
sed
stru
ctur
e ba
sed
on 2
002
HS
1998
2005
10 c
ount
ries h
ave
impl
emen
ted
the
4th
phas
e of
CET
, and
Jam
aica
and
Tr
inid
ad a
nd T
obag
o ha
ve im
plem
ente
d th
e re
vise
d st
ruct
ure
Ant
igua
and
Bar
buda
and
St.
Kitt
s and
Nev
is to
impl
emen
t C
ET; c
ount
ries e
xcep
t Jam
aica
and
Trin
idad
to im
plem
ent
revi
sed
struc
ture
Com
petit
ion
Law
: To
prov
ide
a le
vel p
layi
ng fi
eld
for d
oing
bus
ines
s 20
05D
raft
Law
app
rove
d; B
arba
dos,
Jam
aica
, and
St.
Vin
cent
and
the
Gre
nadi
nes h
ave
take
n ac
tion
Oth
er c
ount
ries t
o en
act l
egis
latio
n
Impl
emen
tatio
n of
har
mon
ized
cus
tom
s leg
isla
tion,
reg
ulat
ion
and
form
s20
0520
05Th
e dr
aft l
aw is
bei
ng fi
naliz
edEn
actm
ent o
f the
law
Mem
oran
dum
item
:
OE
CS
econ
omic
uni
on: I
nitia
tives
und
er th
e C
SME
plus
free
m
ovem
ent o
f lab
or20
0620
06M
ost c
ount
ries h
ave
pass
ed le
gisl
atio
n fo
r mov
emen
t of p
erso
ns u
nder
th
e C
SME
Act
ion
unde
r the
CSM
E; p
erm
it fr
ee m
ovem
ent o
f lab
or
Sour
ce: C
AR
ICO
M S
ecre
taria
t web
site
: ww
w.c
aric
om.o
rg
1/ C
AR
ICO
M c
onsi
st o
f 15
mem
ber c
ount
ries,
Ant
igua
and
Bar
buda
, Bar
bado
s, B
eliz
e, T
he B
aham
as, D
omin
ica,
Gre
nada
, Guy
ana,
Hai
ti, M
onts
erra
t, St
. Kitt
s and
Nev
is, S
t. Lu
cia,
St.
Vin
cent
and
the
Gre
nadi
nes,
Surin
ame
and
Trin
idad
and
Tob
ago,
but
the
revi
sed
Trea
ty d
oes n
ot a
pply
to T
he B
aham
as, H
aiti,
and
Mon
tser
rat.
Mon
tser
rat i
s aw
aitin
g en
trust
men
t fro
m th
e U
.K. a
nd h
as b
een
gran
ted
a tw
o- y
ear d
erog
atio
n on
impl
emen
tatio
n.
Tabl
e V
II.1
: Sta
tus o
f Im
plem
enta
tion
of K
ey E
lem
ents
of t
he C
AR
ICO
M S
ingl
e M
arke
t and
Eco
nom
y 1/
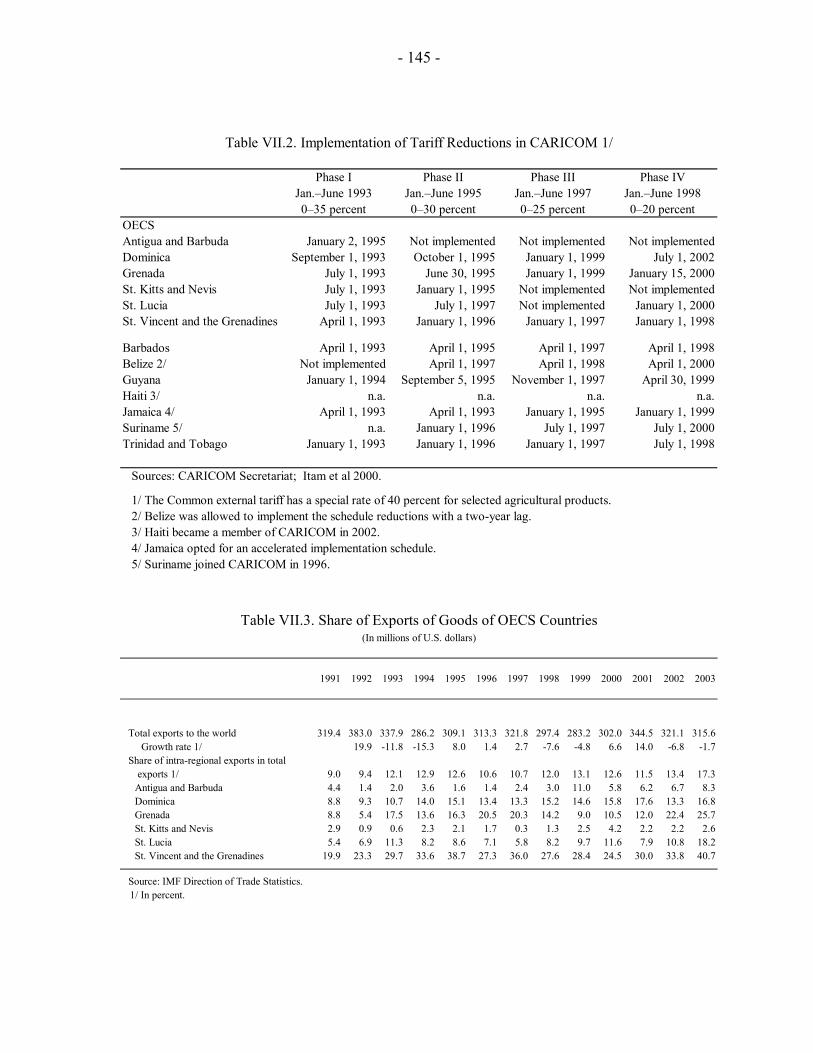
- 145 -
Table VII.2. Implementation of Tariff Reductions in CARICOM 1/
Phase I Phase II Phase III Phase IVJan.–June 1993 Jan.–June 1995 Jan.–June 1997 Jan.–June 19980–35 percent 0–30 percent 0–25 percent 0–20 percent
OECSAntigua and Barbuda January 2, 1995 Not implemented Not implemented Not implementedDominica September 1, 1993 October 1, 1995 January 1, 1999 July 1, 2002Grenada July 1, 1993 June 30, 1995 January 1, 1999 January 15, 2000St. Kitts and Nevis July 1, 1993 January 1, 1995 Not implemented Not implementedSt. Lucia July 1, 1993 July 1, 1997 Not implemented January 1, 2000St. Vincent and the Grenadines April 1, 1993 January 1, 1996 January 1, 1997 January 1, 1998
Barbados April 1, 1993 April 1, 1995 April 1, 1997 April 1, 1998Belize 2/ Not implemented April 1, 1997 April 1, 1998 April 1, 2000Guyana January 1, 1994 September 5, 1995 November 1, 1997 April 30, 1999Haiti 3/ n.a. n.a. n.a. n.a.Jamaica 4/ April 1, 1993 April 1, 1993 January 1, 1995 January 1, 1999Suriname 5/ n.a. January 1, 1996 July 1, 1997 July 1, 2000Trinidad and Tobago January 1, 1993 January 1, 1996 January 1, 1997 July 1, 1998
Sources: CARICOM Secretariat; Itam et al 2000.
1/ The Common external tariff has a special rate of 40 percent for selected agricultural products.2/ Belize was allowed to implement the schedule reductions with a two-year lag.3/ Haiti became a member of CARICOM in 2002.4/ Jamaica opted for an accelerated implementation schedule.5/ Suriname joined CARICOM in 1996.
1991 1992 1993 1994 1995 1996 1997 1998 1999 2000 2001 2002 2003
Total exports to the world 319.4 383.0 337.9 286.2 309.1 313.3 321.8 297.4 283.2 302.0 344.5 321.1 315.6Growth rate 1/ 19.9 -11.8 -15.3 8.0 1.4 2.7 -7.6 -4.8 6.6 14.0 -6.8 -1.7
Share of intra-regional exports in total exports 1/ 9.0 9.4 12.1 12.9 12.6 10.6 10.7 12.0 13.1 12.6 11.5 13.4 17.3Antigua and Barbuda 4.4 1.4 2.0 3.6 1.6 1.4 2.4 3.0 11.0 5.8 6.2 6.7 8.3Dominica 8.8 9.3 10.7 14.0 15.1 13.4 13.3 15.2 14.6 15.8 17.6 13.3 16.8Grenada 8.8 5.4 17.5 13.6 16.3 20.5 20.3 14.2 9.0 10.5 12.0 22.4 25.7St. Kitts and Nevis 2.9 0.9 0.6 2.3 2.1 1.7 0.3 1.3 2.5 4.2 2.2 2.2 2.6St. Lucia 5.4 6.9 11.3 8.2 8.6 7.1 5.8 8.2 9.7 11.6 7.9 10.8 18.2St. Vincent and the Grenadines 19.9 23.3 29.7 33.6 38.7 27.3 36.0 27.6 28.4 24.5 30.0 33.8 40.7
Source: IMF Direction of Trade Statistics. 1/ In percent.
Table VII.3. Share of Exports of Goods of OECS Countries(In millions of U.S. dollars)
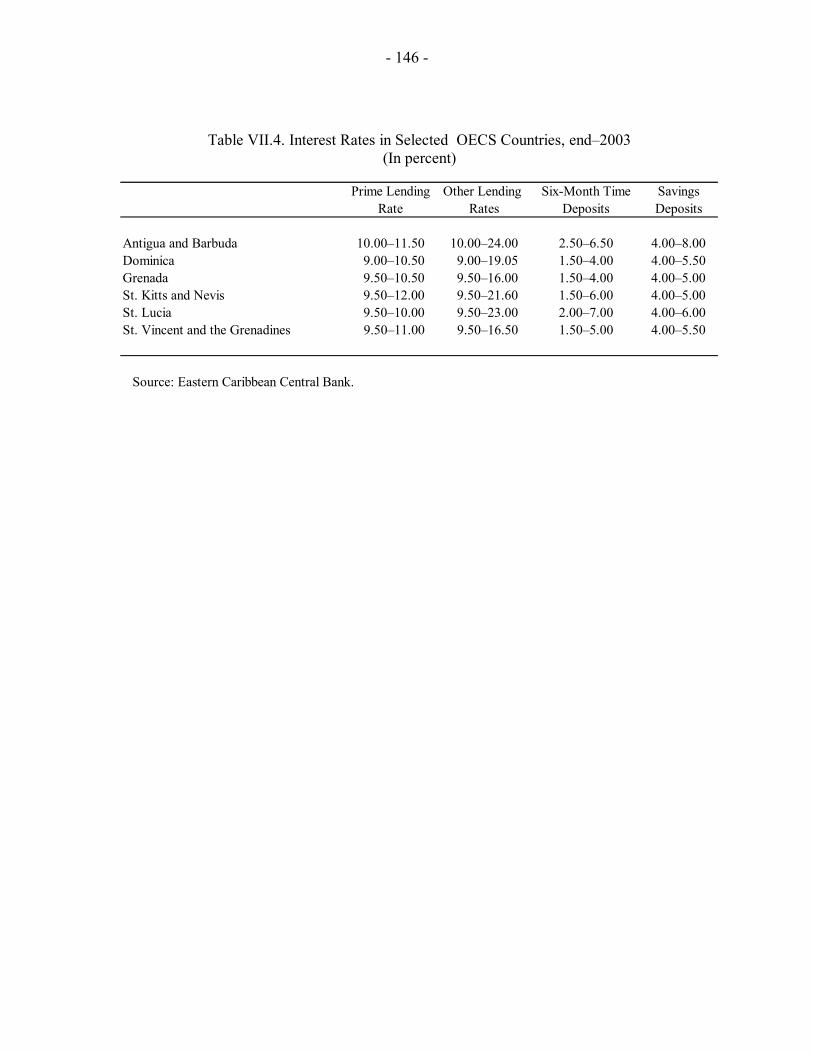
- 146 -
Prime Lending Other Lending Six-Month Time SavingsRate Rates Deposits Deposits
Antigua and Barbuda 10.00–11.50 10.00–24.00 2.50–6.50 4.00–8.00Dominica 9.00–10.50 9.00–19.05 1.50–4.00 4.00–5.50Grenada 9.50–10.50 9.50–16.00 1.50–4.00 4.00–5.00St. Kitts and Nevis 9.50–12.00 9.50–21.60 1.50–6.00 4.00–5.00St. Lucia 9.50–10.00 9.50–23.00 2.00–7.00 4.00–6.00St. Vincent and the Grenadines 9.50–11.00 9.50–16.50 1.50–5.00 4.00–5.50
Source: Eastern Caribbean Central Bank.
(In percent)Table VII.4. Interest Rates in Selected OECS Countries, end–2003
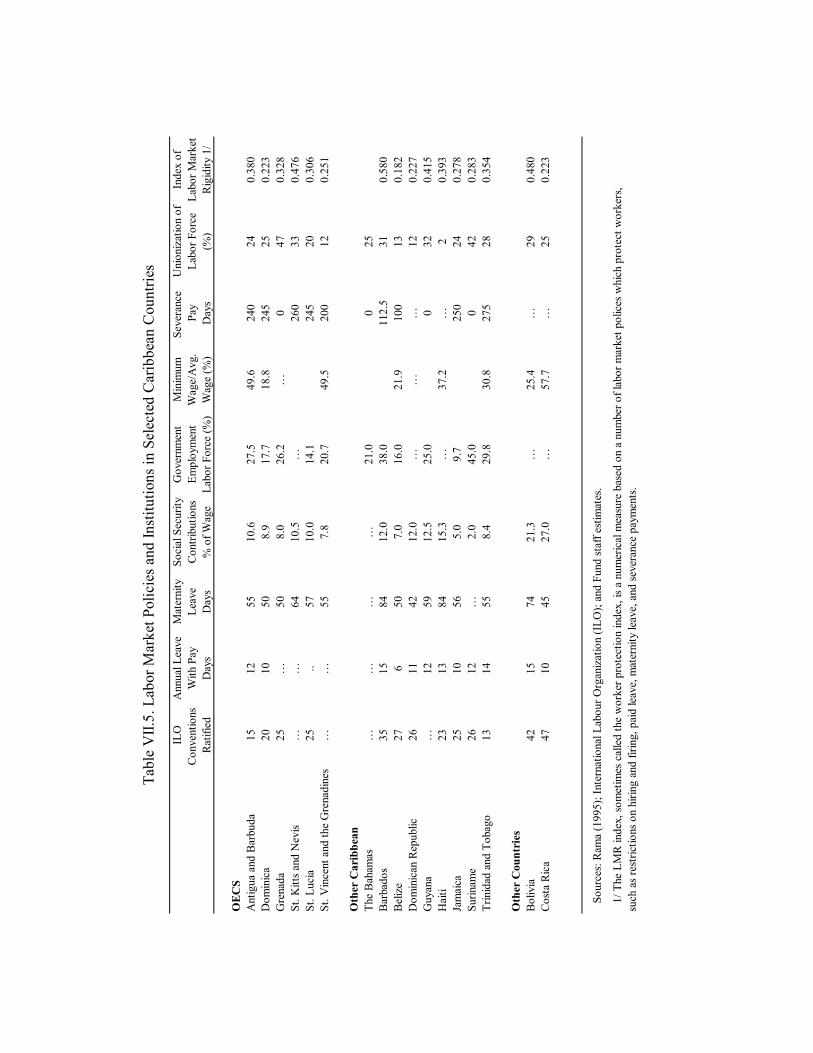
ILO
Ann
ual L
eave
Mat
erni
tySo
cial
Sec
urity
Gov
ernm
ent
Min
imum
Seve
ranc
e U
nion
izat
ion
ofIn
dex
ofC
onve
ntio
ns
With
Pay
Leav
eC
ontri
butio
nsEm
ploy
men
tW
age/
Avg
.Pa
yLa
bor F
orce
Labo
r Mar
ket
Rat
ified
Day
sD
ays
% o
f Wag
eLa
bor F
orce
(%)
Wag
e (%
)D
ays
(%)
Rig
idity
1/
OE
CS
Ant
igua
and
Bar
buda
1512
5510
.627
.549
.624
024
0.38
0D
omin
ica
2010
508.
917
.718
.824
525
0.22
3G
rena
da25
…50
8.0
26.2
…0
470.
328
St. K
itts a
nd N
evis
……
6410
.5…
260
330.
476
St. L
ucia
25..
5710
.014
.124
520
0.30
6St
. Vin
cent
and
the
Gre
nadi
nes
……
557.
820
.749
.520
012
0.25
1
Oth
er C
arib
bean
The
Bah
amas
……
……
21.0
025
Bar
bado
s35
1584
12.0
38.0
112.
531
0.58
0B
eliz
e27
650
7.0
16.0
21.9
100
130.
182
Dom
inic
an R
epub
lic26
1142
12.0
……
…12
0.22
7G
uyan
a…
1259
12.5
25.0
032
0.41
5H
aiti
2313
8415
.3…
37.2
…2
0.39
3Ja
mai
ca25
1056
5.0
9.7
250
240.
278
Surin
ame
2612
…2.
045
.00
420.
283
Trin
idad
and
Tob
ago
1314
558.
429
.830
.827
528
0.35
4
Oth
er C
ount
ries
Bol
ivia
4215
7421
.3…
25.4
…29
0.48
0C
osta
Ric
a47
1045
27.0
…57
.7…
250.
223
Sour
ces:
Ram
a (1
995)
; Int
erna
tiona
l Lab
our O
rgan
izat
ion
(ILO
); an
d Fu
nd st
aff e
stim
ates
.
1/ T
he L
MR
inde
x, so
met
imes
cal
led
the
wor
ker p
rote
ctio
n in
dex,
is a
num
eric
al m
easu
re b
ased
on
a nu
mbe
r of l
abor
mar
ket p
olic
es w
hich
pro
tect
wor
kers
, su
ch a
s res
trict
ions
on
hirin
g an
d fir
ing,
pai
d le
ave,
mat
erni
ty le
ave,
and
seve
ranc
e pa
ymen
ts.
Tabl
e V
II.5.
Lab
or M
arke
t Pol
icie
s and
Inst
itutio
ns in
Sel
ecte
d C
arib
bean
Cou
ntrie
s
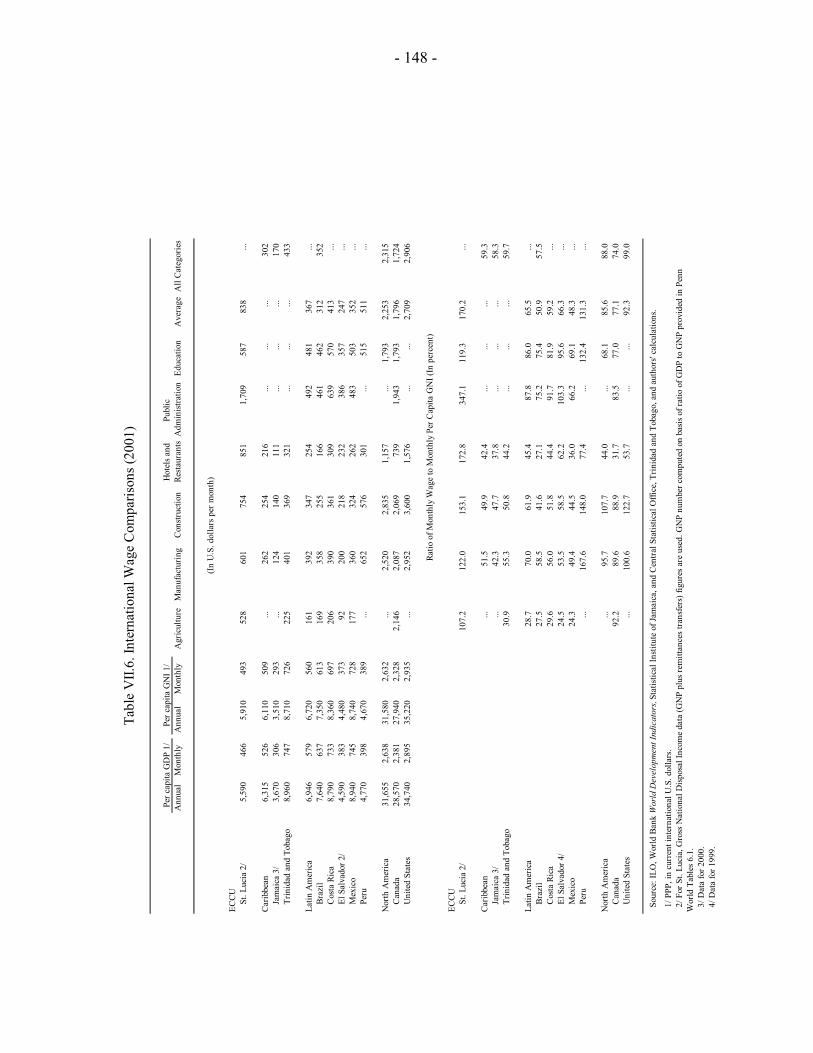
- 148 -
Hot
els a
nd
Publ
ic
Ann
ual
Mon
thly
Ann
ual
Mon
thly
Agr
icul
ture
Man
ufac
turin
gC
onst
ruct
ion
Rest
aura
nts
Adm
inis
tratio
nEd
ucat
ion
Ave
rage
All
Cat
egor
ies
ECC
USt
. Luc
ia 2
/5,
590
46
6
5,91
0
49
3
528
60
1
75
4
851
1,
709
58
7
838
...
Car
ibbe
an6,
315
52
6
6,11
0
50
9
...26
2
25
4
216
...
......
302
Jam
aica
3/
3,67
0
306
3,
510
293
...
124
140
11
1
......
...17
0
Tr
inid
ad a
nd T
obag
o8,
960
74
7
8,71
0
72
6
225
40
1
36
9
321
...
......
433
Latin
Am
eric
a6,
946
57
9
6,72
0
56
0
161
39
2
34
7
254
49
2
48
1
367
...Br
azil
7,64
0
637
7,
350
613
16
9
358
255
16
6
461
462
31
2
35
2
C
osta
Ric
a8,
790
73
3
8,36
0
69
7
206
39
0
36
1
309
63
9
57
0
413
...El
Sal
vado
r 2/
4,59
0
383
4,
480
373
92
20
0
21
8
232
38
6
35
7
247
...M
exic
o8,
940
74
5
8,74
0
72
8
177
36
0
32
4
262
48
3
50
3
352
...Pe
ru4,
770
39
8
4,67
0
38
9
...65
2
57
6
301
...
515
51
1
...
Nor
th A
mer
ica
31,6
55
2,63
8
31
,580
2,
632
...2,
520
2,
835
1,15
7
...
1,79
3
2,
253
2,
315
C
anad
a28
,570
2,
381
27,9
40
2,32
8
2,
146
2,08
7
2,06
9
73
9
1,94
3
1,79
3
1,
796
1,
724
U
nite
d St
ates
34,7
40
2,89
5
35
,220
2,
935
...2,
952
3,
600
1,57
6
...
...2,
709
2,
906
ECC
USt
. Luc
ia 2
/10
7.2
122.
0
153.
1
17
2.8
347.
1
119.
3
17
0.2
...
Car
ibbe
an...
51.5
49.9
42
.4
...
......
59.3
Ja
mai
ca 3
/...
42.3
47.7
37
.8
...
......
58.3
Tr
inid
ad a
nd T
obag
o30
.9
55
.3
50
.8
44.2
......
...59
.7
Latin
Am
eric
a28
.7
70
.0
61
.9
45.4
87.8
86
.0
65.5
...
Braz
il27
.5
58
.5
41
.6
27.1
75.2
75
.4
50.9
57
.5
Cos
ta R
ica
29.6
56.0
51.8
44
.4
91
.7
81.9
59
.2
...El
Sal
vado
r 4/
24.5
53.5
58.5
62
.2
10
3.3
95
.6
66.3
...
Mex
ico
24.3
49.4
44.5
36
.0
66
.2
69.1
48
.3
...Pe
ru...
167.
6
148.
0
77
.4
...
132.
4
13
1.3
...
Nor
th A
mer
ica
...95
.7
10
7.7
44.0
...68
.1
85.6
88
.0
Can
ada
92.2
89.6
88.9
31
.7
83
.5
77.0
77
.1
74.0
U
nite
d St
ates
...10
0.6
12
2.7
53.7
......
92.3
99
.0
Sou
rce:
ILO
, Wor
ld B
ank
Wor
ld D
evel
opm
ent I
ndic
ator
s,St
atis
tical
Inst
itute
of J
amai
ca, a
nd C
entra
l Sta
tistic
al O
ffice
, Trin
idad
and
Tob
ago,
and
aut
hors
' cal
cula
tions
.
1/ P
PP, i
n cu
rren
t int
erna
tiona
l U.S
. dol
lars
. 2
/ For
St.
Luci
a, G
ross
Nat
iona
l Dis
posa
l Inc
ome
data
(GN
P pl
us re
mitt
ance
s tra
nsfe
rs) f
igur
es a
re u
sed.
GN
P nu
mbe
r com
pute
d on
bas
is o
f rat
io o
f GD
P to
GN
P pr
ovid
ed in
Pen
nW
orld
Tab
les 6
.1.
3/ D
ata
for 2
000.
4/ D
ata
for 1
999.
Ratio
of M
onth
ly W
age
to M
onth
ly P
er C
apita
GN
I (In
per
cent
)
Tabl
e V
II.6.
Inte
rnat
iona
l Wag
e C
ompa
rison
s (20
01)
Per c
apita
GD
P 1/
Per c
apita
GN
I 1/
(In
U.S
. dol
lars
per
mon
th)
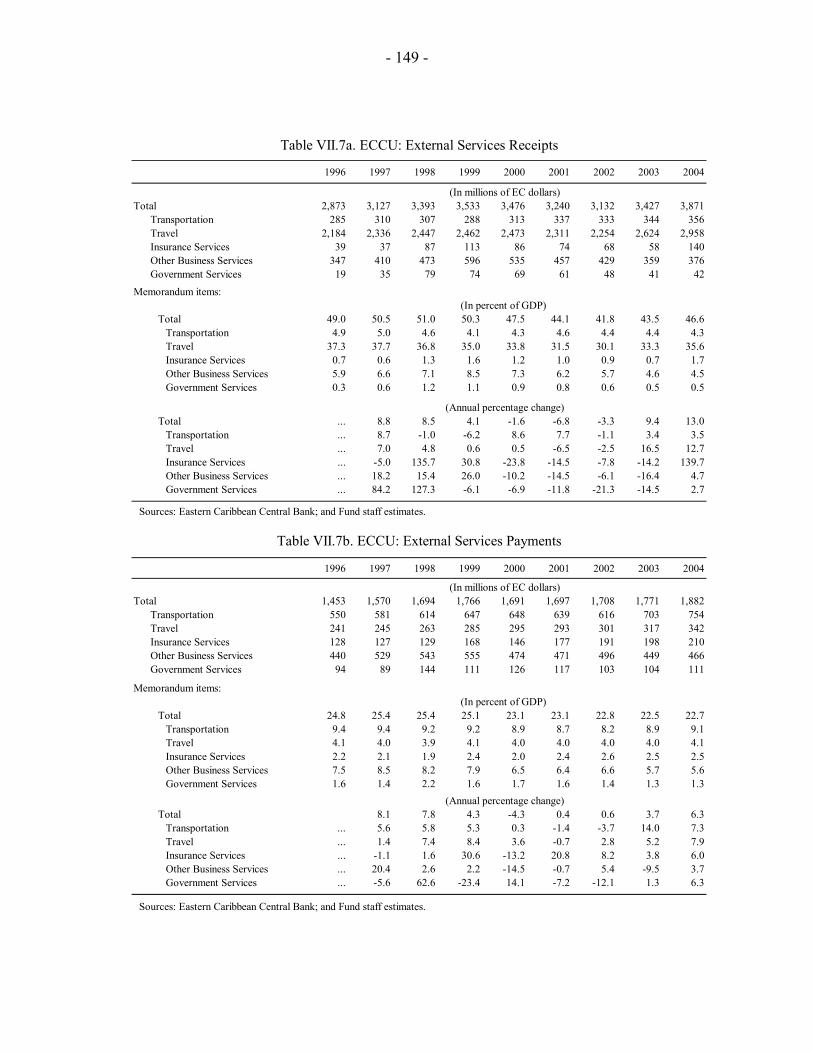
- 149 -
1996 1997 1998 1999 2000 2001 2002 2003 2004
Total 2,873 3,127 3,393 3,533 3,476 3,240 3,132 3,427 3,871Transportation 285 310 307 288 313 337 333 344 356
Travel 2,184 2,336 2,447 2,462 2,473 2,311 2,254 2,624 2,958 Insurance Services 39 37 87 113 86 74 68 58 140 Other Business Services 347 410 473 596 535 457 429 359 376 Government Services 19 35 79 74 69 61 48 41 42
Memorandum items:
Total 49.0 50.5 51.0 50.3 47.5 44.1 41.8 43.5 46.6Transportation 4.9 5.0 4.6 4.1 4.3 4.6 4.4 4.4 4.3Travel 37.3 37.7 36.8 35.0 33.8 31.5 30.1 33.3 35.6Insurance Services 0.7 0.6 1.3 1.6 1.2 1.0 0.9 0.7 1.7Other Business Services 5.9 6.6 7.1 8.5 7.3 6.2 5.7 4.6 4.5Government Services 0.3 0.6 1.2 1.1 0.9 0.8 0.6 0.5 0.5
Total ... 8.8 8.5 4.1 -1.6 -6.8 -3.3 9.4 13.0Transportation ... 8.7 -1.0 -6.2 8.6 7.7 -1.1 3.4 3.5Travel ... 7.0 4.8 0.6 0.5 -6.5 -2.5 16.5 12.7Insurance Services ... -5.0 135.7 30.8 -23.8 -14.5 -7.8 -14.2 139.7Other Business Services ... 18.2 15.4 26.0 -10.2 -14.5 -6.1 -16.4 4.7Government Services ... 84.2 127.3 -6.1 -6.9 -11.8 -21.3 -14.5 2.7
Sources: Eastern Caribbean Central Bank; and Fund staff estimates.
1996 1997 1998 1999 2000 2001 2002 2003 2004
Total 1,453 1,570 1,694 1,766 1,691 1,697 1,708 1,771 1,882Transportation 550 581 614 647 648 639 616 703 754
Travel 241 245 263 285 295 293 301 317 342 Insurance Services 128 127 129 168 146 177 191 198 210 Other Business Services 440 529 543 555 474 471 496 449 466 Government Services 94 89 144 111 126 117 103 104 111
Memorandum items:
Total 24.8 25.4 25.4 25.1 23.1 23.1 22.8 22.5 22.7Transportation 9.4 9.4 9.2 9.2 8.9 8.7 8.2 8.9 9.1Travel 4.1 4.0 3.9 4.1 4.0 4.0 4.0 4.0 4.1Insurance Services 2.2 2.1 1.9 2.4 2.0 2.4 2.6 2.5 2.5Other Business Services 7.5 8.5 8.2 7.9 6.5 6.4 6.6 5.7 5.6Government Services 1.6 1.4 2.2 1.6 1.7 1.6 1.4 1.3 1.3
Total 8.1 7.8 4.3 -4.3 0.4 0.6 3.7 6.3Transportation ... 5.6 5.8 5.3 0.3 -1.4 -3.7 14.0 7.3Travel ... 1.4 7.4 8.4 3.6 -0.7 2.8 5.2 7.9Insurance Services ... -1.1 1.6 30.6 -13.2 20.8 8.2 3.8 6.0Other Business Services ... 20.4 2.6 2.2 -14.5 -0.7 5.4 -9.5 3.7Government Services ... -5.6 62.6 -23.4 14.1 -7.2 -12.1 1.3 6.3
Sources: Eastern Caribbean Central Bank; and Fund staff estimates.
(In millions of EC dollars)
(In percent of GDP)
(Annual percentage change)
Table VII.7a. ECCU: External Services Receipts
Table VII.7b. ECCU: External Services Payments
(In millions of EC dollars)
(In percent of GDP)
(Annual percentage change)
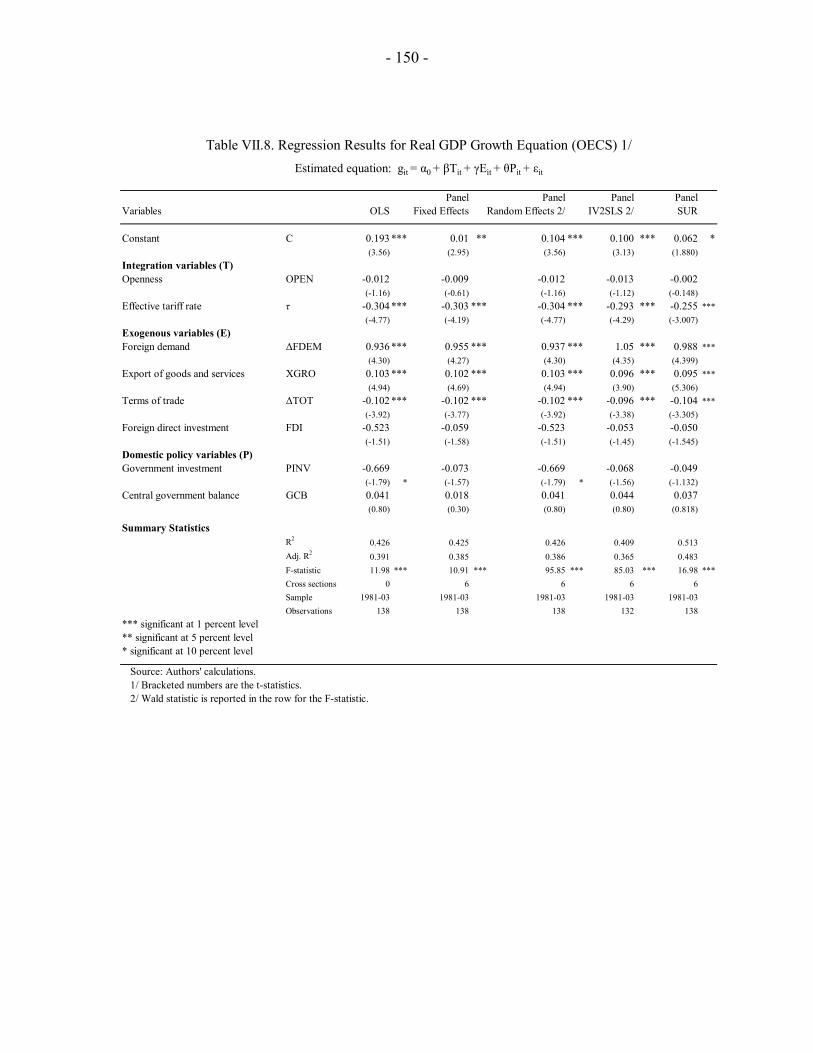
- 150 -
Panel Panel Panel PanelVariables OLS Fixed Effects Random Effects 2/ IV2SLS 2/ SUR
Constant C 0.193 *** 0.01 ** 0.104 *** 0.100 *** 0.062 *(3.56) (2.95) (3.56) (3.13) (1.880)
Integration variables (T)Openness OPEN -0.012 -0.009 -0.012 -0.013 -0.002
(-1.16) (-0.61) (-1.16) (-1.12) (-0.148)Effective tariff rate τ -0.304 *** -0.303 *** -0.304 *** -0.293 *** -0.255 ***
(-4.77) (-4.19) (-4.77) (-4.29) (-3.007)Exogenous variables (E)Foreign demand ∆FDEM 0.936 *** 0.955 *** 0.937 *** 1.05 *** 0.988 ***
(4.30) (4.27) (4.30) (4.35) (4.399)Export of goods and services XGRO 0.103 *** 0.102 *** 0.103 *** 0.096 *** 0.095 ***
(4.94) (4.69) (4.94) (3.90) (5.306)Terms of trade ∆TOT -0.102 *** -0.102 *** -0.102 *** -0.096 *** -0.104 ***
(-3.92) (-3.77) (-3.92) (-3.38) (-3.305)Foreign direct investment FDI -0.523 -0.059 -0.523 -0.053 -0.050
(-1.51) (-1.58) (-1.51) (-1.45) (-1.545)Domestic policy variables (P)Government investment PINV -0.669 -0.073 -0.669 -0.068 -0.049
(-1.79) * (-1.57) (-1.79) * (-1.56) (-1.132)Central government balance GCB 0.041 0.018 0.041 0.044 0.037
(0.80) (0.30) (0.80) (0.80) (0.818)
Summary StatisticsR2 0.426 0.425 0.426 0.409 0.513Adj. R2 0.391 0.385 0.386 0.365 0.483F-statistic 11.98 *** 10.91 *** 95.85 *** 85.03 *** 16.98 ***Cross sections 0 6 6 6 6Sample 1981-03 1981-03 1981-03 1981-03 1981-03Observations 138 138 138 132 138
*** significant at 1 percent level** significant at 5 percent level* significant at 10 percent level
Source: Authors' calculations. 1/ Bracketed numbers are the t-statistics. 2/ Wald statistic is reported in the row for the F-statistic.
Estimated equation: git = α0 + βTit + γEit + θPit + εit
Table VII.8. Regression Results for Real GDP Growth Equation (OECS) 1/
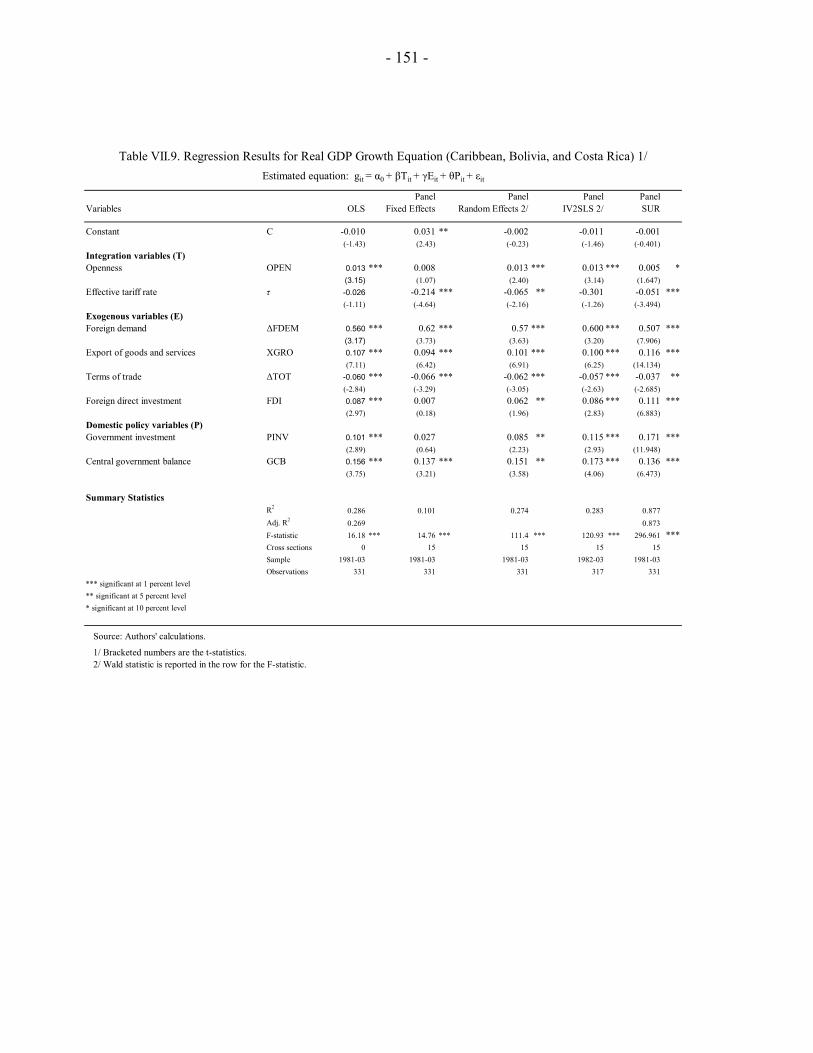
- 151 -
Panel Panel Panel PanelVariables OLS Fixed Effects Random Effects 2/ IV2SLS 2/ SUR
Constant C -0.010 0.031 ** -0.002 -0.011 -0.001(-1.43) (2.43) (-0.23) (-1.46) (-0.401)
Integration variables (T)Openness OPEN 0.013 *** 0.008 0.013 *** 0.013 *** 0.005 *
(3.15) (1.07) (2.40) (3.14) (1.647)Effective tariff rate τ -0.026 -0.214 *** -0.065 ** -0.301 -0.051 ***
(-1.11) (-4.64) (-2.16) (-1.26) (-3.494)Exogenous variables (E)Foreign demand ∆FDEM 0.560 *** 0.62 *** 0.57 *** 0.600 *** 0.507 ***
(3.17) (3.73) (3.63) (3.20) (7.906)Export of goods and services XGRO 0.107 *** 0.094 *** 0.101 *** 0.100 *** 0.116 ***
(7.11) (6.42) (6.91) (6.25) (14.134)Terms of trade ∆TOT -0.060 *** -0.066 *** -0.062 *** -0.057 *** -0.037 **
(-2.84) (-3.29) (-3.05) (-2.63) (-2.685)Foreign direct investment FDI 0.087 *** 0.007 0.062 ** 0.086 *** 0.111 ***
(2.97) (0.18) (1.96) (2.83) (6.883)Domestic policy variables (P)Government investment PINV 0.101 *** 0.027 0.085 ** 0.115 *** 0.171 ***
(2.89) (0.64) (2.23) (2.93) (11.948)Central government balance GCB 0.156 *** 0.137 *** 0.151 ** 0.173 *** 0.136 ***
(3.75) (3.21) (3.58) (4.06) (6.473)
Summary StatisticsR2 0.286 0.101 0.274 0.283 0.877Adj. R2 0.269 0.873F-statistic 16.18 *** 14.76 *** 111.4 *** 120.93 *** 296.961 ***Cross sections 0 15 15 15 15Sample 1981-03 1981-03 1981-03 1982-03 1981-03Observations 331 331 331 317 331
*** significant at 1 percent level** significant at 5 percent level* significant at 10 percent level
Source: Authors' calculations.
1/ Bracketed numbers are the t-statistics. 2/ Wald statistic is reported in the row for the F-statistic.
Estimated equation: git = α0 + βTit + γEit + θPit + εit
Table VII.9. Regression Results for Real GDP Growth Equation (Caribbean, Bolivia, and Costa Rica) 1/
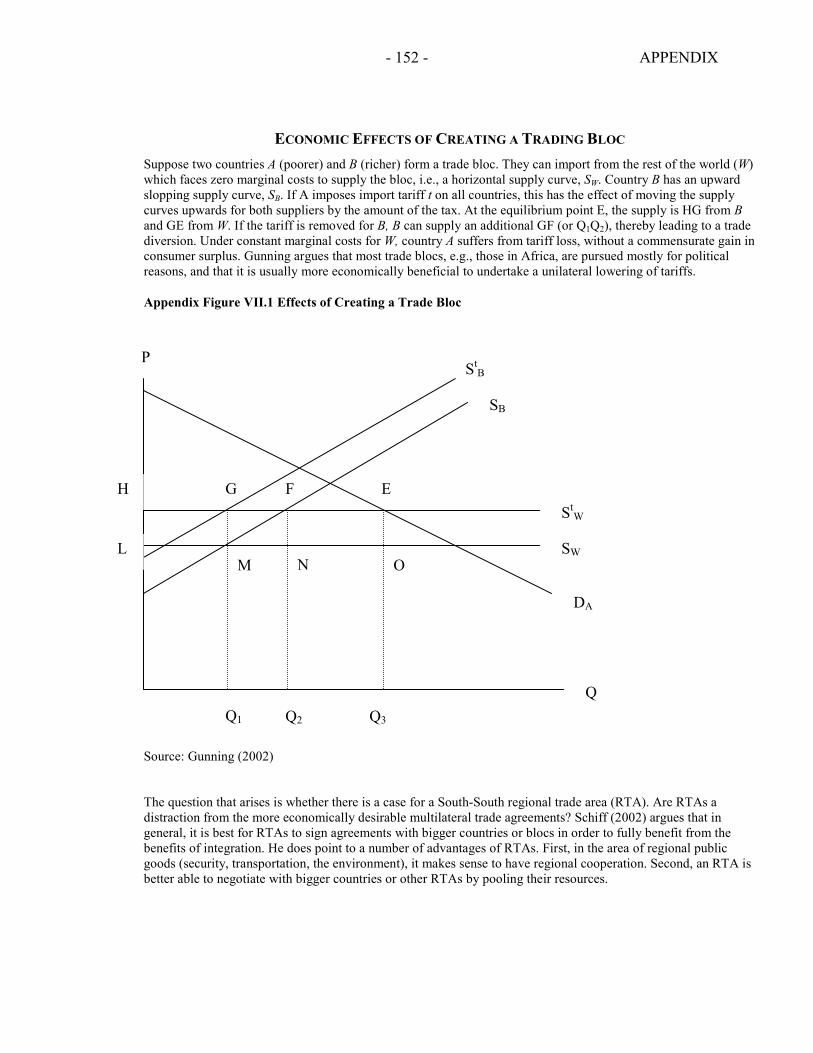
- 152 - APPENDIX
E
O N M
G F
ECONOMIC EFFECTS OF CREATING A TRADING BLOC Suppose two countries A (poorer) and B (richer) form a trade bloc. They can import from the rest of the world (W) which faces zero marginal costs to supply the bloc, i.e., a horizontal supply curve, SW. Country B has an upward slopping supply curve, SB. If A imposes import tariff t on all countries, this has the effect of moving the supply curves upwards for both suppliers by the amount of the tax. At the equilibrium point E, the supply is HG from B and GE from W. If the tariff is removed for B, B can supply an additional GF (or Q1Q2), thereby leading to a trade diversion. Under constant marginal costs for W, country A suffers from tariff loss, without a commensurate gain inconsumer surplus. Gunning argues that most trade blocs, e.g., those in Africa, are pursued mostly for political reasons, and that it is usually more economically beneficial to undertake a unilateral lowering of tariffs. Appendix Figure VII.1 Effects of Creating a Trade Bloc
Source: Gunning (2002)
The question that arises is whether there is a case for a South-South regional trade area (RTA). Are RTAs a distraction from the more economically desirable multilateral trade agreements? Schiff (2002) argues that in general, it is best for RTAs to sign agreements with bigger countries or blocs in order to fully benefit from the benefits of integration. He does point to a number of advantages of RTAs. First, in the area of regional public goods (security, transportation, the environment), it makes sense to have regional cooperation. Second, an RTA is better able to negotiate with bigger countries or other RTAs by pooling their resources.
P
Q1 Q2 Q3 Q
SW
StW
SB
StB
H
L
DA
- 153 -
REFERENCES ABT Associates, 1998, Workers and Labor Markets in the Caribbean, Background
Document, Volume II (Washington DC: Inter-American Development Bank). Acemoglu, D., S. Johnson, and J.A. Robinson, 2001, “The Colonial Origins of Comparative
Development,” American Economic Review, Vol. 91, pp. 1369–401. Anderson, J.E., 1979, “A Theoretical Foundation for the Gravity Equation,” American
Economic Review, Vol. 69, pp. 106–116. Andriamananjara, S. and M. Schiff, 1998, “Regional Groupings Among Micro States,”
Policy Research Working Paper 1992 (Washington DC: World Bank). Bayoumi, T., D. Laxton, and P. Pesenti, 2004, “Benefits and Spillovers of Greater
Competition in Europe: A Macroeconomic Perspective,” CEPR Discussion Paper No. 4481 (London: Centre for Economic Policy Research).
Blake, B., 1984, “Production Integration in CARICOM” in Ten Years of CARICOM,
(Washington DC, Inter American Development Bank), pp. 118–130. Blanchard, O. and F. Giavazzi, 2003, “Macroeconomic Effects of Regulation and
Deregulation in Goods and Labor Markets,” The Quarterly Journal of Economics, August.
Brewster, H. and C. Thomas, 1973, The Dynamics of West Indian Economic Integration,
(Jamaica: ISER). CARICOM, 2004 , “Establishment of the CARICOM Single Market and Economy:
Summary of the Status of Key Elements,” mimeo, July. Cashin, P. and P. Wang, 2005, “Macroeconomic Fluctuations in the ECCU,” in Eastern
Caribbean Currency Union—Selected Issues, Chapter I. Cernat, L., 2003, “Assessing South-South Regional Integration: Same Issues, Many
Metrics,” Policy Issues in International Trade and Commodities Study Series, No. 21 (UNCTAD).
Commonwealth Secretariat, 1999, “Review of the CARICOM Article 56 Arrangement,”
Report prepared for the CARICOM Secretariat. Demas, W., 1968, Essays in Caribbean Integration and Development (Institute of Social and
Economic Research: Jamaica).
- 154 -
Demas, W., 1974, West Indian Nationhood and Caribbean Economic Integration (Barbados: Caribbean Conference of Churches).
DeRosa, D.A., 2003, “Trade Policies and Prospects of the Eastern Caribbean States in the
New World Economy,” ADR International, mimeo. Dollar, D. and A. Kraay, 2004, “Trade, Growth and Poverty,” The Economic Journal, Vol.
114, pp. F22–F49. Downes, A.S., N. Mamingi, and R.M. Belle Antoine, 2003, “Labor Market Regulation and
Employment in the Caribbean,” Report prepared for the Inter-American Development Bank.
Egoumé-Bossogo, P. and C. Mendis, 2002, “Trade and Integration in the Caribbean,” IMF
Working Paper WP/02/148 (Washington DC: International Monetary Fund). Finger J., F. Ng and I. Soloaga, 1998, Trade Policies in the Caribbean Countries: A Look at
the Positive Agenda, Report 17873-LAC (Washington DC: World Bank). Frankel, J.A. and D. Romer, “Does Trade Cause Growth,” American Economic Review, Vol.
89, pp. 379–99. Girvan, N., 2004, “Reflections on the CSME,” Keynote Address to SALISES Conference on
CSME, University of West Indies, St. Augustine. Guengant, J., 1993, “Whither the Caribbean Exodus?: Prospects for the 1990s,” International
Journal XLVIII Spring, pp. 335–353. Gunning, J.W., 2002, “Trade Blocs: Relevant for Africa?,” Journal of African Economies,
Vol. 10, pp. 311–335. Haveman, J., I. Vivian Lei, and J. Netz, “International Integration and Growth: A Survey and
Empirical Investigation,” Review of Development Economics, Vol. 5. International Monetary Fund, 2004a, Eastern Caribbean Currency Union—Selected Issues,
Country Report No. 04/335 (Washington DC: International Monetary Fund). —— 2004b, Eastern Caribbean Currency Union: 2004 Regional Surveillance—Staff Report,
IMF Country Report No. 04/299 (Washington DC: International Monetary Fund). Krueger, A.O., 1999, “Are Preferential Trading Arrangements Trade-Liberalizing or
Protectionist?,” The Journal of Economic Perspectives, Vol. 13, pp. 105–124.
- 155 -
Mattoo, A., R. Rathindran, and A. Subramanian, 2001, “Measuring Services Trade Liberalization and Its Impact on Economic Growth: An Illustration,” World Bank, mimeo.
McLean, W., 1981, “Pricing in the Distributive Sector in Barbados,” Social and Economic
Studies, March. Mishra, P., 2005, “Emigration and Brain Drain: Evidence from the Caribbean,” in Eastern
Caribbean Currency Union—Selected Issues, Chapter VI. Rama, M., 1995, “Do Labor Market Policies and Institutions Matter? The Adjustment
Experience in Latin America and the Caribbean,” Labour, pp. S243–S269. Rasmussen, T., 2004, “Macroeconomic Implications of Natural Disasters,” IMF Working
Paper WP/04/224 (Washington DC: International Monetary Fund). Rodrik, D., A. Subramanian and F. Trebbi, 2004, “Institutions Rule: The Primacy of
Institutions Over Geography and Integration in Economic Development,” Journal of Economic Growth, Vol. 9, pp. 131–165.
Sachs, J.D. and A. Warner, 1995, “Economic Reforms and the Process of Global
Integration,” Brookings Papers on Economic Activity, No. 1, pp. 1–118. Schiff, M., 2002, “Regional Integration and Development in Small States,” World Bank
Working Paper Series No. 2797 (Washington DC: World Bank). Senhadji, A. and E. Ginting, 2004, “Trade Liberalization and Growth: Australia’s
Experience,” Selected Issues, IMF Country Report 04/354 (Washington DC: International Monetary Fund).
Stephenson, S.M., 2002, “Regional versus Multilateral Liberalization of Services,” World
Trade Review, Vol. 1, pp. 187–209. Whalley, J., 2003, “Assessing the Benefits to Developing Countries of Liberalization in
Services Trade,” NBER Working Paper Series No. 10181 (Cambridge, MA: National Bureau of Economic Research).
World Bank, 1998, ECCU Financial Sector Review (Washington DC: World Bank).


![THE CO-OPERATIVE SOCIETIES REGULATIONS No. [ ] of 2016 · The Eastern Caribbean Currency Union Uniform Co-operative Societies Regulations –2016 Harmonised Co-operative Societies](https://static.fdocuments.us/doc/165x107/5f03a0687e708231d409fb52/the-co-operative-societies-regulations-no-of-the-eastern-caribbean-currency.jpg)