Eastern Caribbean Currency Union: 2007 Discussion on - IMF
102
© 2008 International Monetary Fund March 2008 IMF Country Report No. 08/96 Eastern Caribbean Currency Union: Selected Issues This Selected Issues paper for the Eastern Caribbean Currency Union (ECCU) was prepared by a staff team of the International Monetary Fund as background documentation for the periodic regional surveillance of the ECCU. It is based on the information available at the time it was completed on January 9, 2008. The views expressed in this document are those of the staff team and do not necessarily reflect the views of the governments of the ECCU or the Executive Board of the IMF. The policy of publication of staff reports and other documents by the IMF allows for the deletion of market-sensitive information. To assist the IMF in evaluating the publication policy, reader comments are invited and may be sent by e-mail to [email protected] . Copies of this report are available to the public from International Monetary Fund ● Publication Services 700 19th Street, N.W. ● Washington, D.C. 20431 Telephone: (202) 623 7430 ● Telefax: (202) 623 7201 E-mail: [email protected] ● Internet: http://www.imf.org Price: $18.00 a copy International Monetary Fund Washington, D.C.
Transcript of Eastern Caribbean Currency Union: 2007 Discussion on - IMF

© 2008 International Monetary Fund March 2008
IMF Country Report No. 08/96
Eastern Caribbean Currency Union: Selected Issues This Selected Issues paper for the Eastern Caribbean Currency Union (ECCU) was prepared by a staff team of the International Monetary Fund as background documentation for the periodic regional surveillance of the ECCU. It is based on the information available at the time it was completed on January 9, 2008. The views expressed in this document are those of the staff team and do not necessarily reflect the views of the governments of the ECCU or the Executive Board of the IMF. The policy of publication of staff reports and other documents by the IMF allows for the deletion of market-sensitive information.
To assist the IMF in evaluating the publication policy, reader comments are invited and may be sent by e-mail to [email protected].
Copies of this report are available to the public from
International Monetary Fund ● Publication Services 700 19th Street, N.W. ● Washington, D.C. 20431
Telephone: (202) 623 7430 ● Telefax: (202) 623 7201 E-mail: [email protected] ● Internet: http://www.imf.org
Price: $18.00 a copy
International Monetary Fund
Washington, D.C.


INTERNATIONAL MONETARY FUND
EASTERN CARIBBEAN CURRENCY UNION
Selected Issues
Prepared by Paul Cashin, Mario Dehesa, Pablo Druck,
Rupa Duttagupta, Hunter Monroe, Nkunde Mwase, Koffie Nassar, Emilio Pineda, Yan Sun, and Evridiki Tsounta (all WHD)
Approved by the Western Hemisphere Department
January 9, 2008
Contents Page Executive Summary ..............................................................................................................3 I. Assessing Exchange Rate Competitiveness in the Eastern Caribbean Currency Union.......................................................................................................5 A. Introduction.........................................................................................................5 B. Evolution of the Real Exchange Rate in the ECCU............................................5 C. Equilibrium Real Exchange Rate ........................................................................6 D. Macroeconomic Balance Approach ....................................................................9 E. Conclusions .......................................................................................................12 II. Price Dynamics in the Eastern Caribbean Currency Union.....................................21 A. Introduction.......................................................................................................21 B. What is the Composition of CPI Baskets? ........................................................21 C. Impact of U.S. Price Movements ......................................................................22 D. The Real Exchange Rate Within the ECCU .....................................................23
E. Concluding Remarks ........................................................................................24
III. The ECCB: Challenges to an Effective Lender of Last Resort ...............................32 A. Introduction.......................................................................................................32 B. The LOLR Facility and its Monetary Effects....................................................33 C. The ECCB Institutional Architecture................................................................35 D. The Model .........................................................................................................36 E. Conclusions .......................................................................................................41

2
IV. How Vulnerable is the Eastern Caribbean Currency Union to a Banking Crisis?.....................................................................................................43
A. Introduction.......................................................................................................43 B. Empirical Literature and Methodology.............................................................43 C. Data ...................................................................................................................45 D. Empirical Results ..............................................................................................47 E. Conclusion.........................................................................................................48
V. Tourism Demand in Small-Island Economies .........................................................54 A. Introduction.......................................................................................................54 B. Factors Affecting Tourism Flows .....................................................................54 C. Conclusions .......................................................................................................57 VI. Corporate Income Tax Competition in the Caribbean.............................................67 A. Introduction.......................................................................................................67 B. Background and Motivation..............................................................................69 C. Related Literature..............................................................................................69 D. Developments in Statutory Corporate Income Tax Rates and Bases................70 E. Evolution of Effective Tax Rates ......................................................................72 F. Concluding Remarks .........................................................................................74 VII. Can the ECCU Afford to Grow Old?.......................................................................80 A. Introduction.......................................................................................................80 B. Emigration and Sustainability ...........................................................................80 C. Asset Returns and Portfolio Allocation.............................................................81 D. Other Age-Related Spending ............................................................................82 E. Policy Recommendations ..................................................................................83 VIII. Financing Universal Health Care: Lessons for the Eastern Caribbean and Beyond ...........................................................................................................90 A. Introduction.......................................................................................................90 B. Financing Options for Universal Health Care...................................................91 C. General Taxation Versus Wage Contributions..................................................92 D. Preconditions for Successfully Financing Universal Health Care ....................94 E. Conclusions .......................................................................................................95

3
EXECUTIVE SUMMARY
The analytical work associated with the Eastern Caribbean Currency Union (ECCU) 2007 Discussion on Common Policies continues the staff’s work on defining the policy agenda to help the region strengthen macroeconomic stability and reduce vulnerability.
The ECCU countries share a common currency, the EC dollar, which has been pegged to the U.S. dollar at the same rate for more than three decades. 1 The first two chapters examine the impact of the peg on the region’s external competitiveness and price dynamics, respectively. Chapter I: Assessing Exchange Rate Competitiveness in the ECCU finds little evidence of overvaluation of the EC dollar. Real exchange rates appear to be currently close to their equilibrium levels, following a period of overvaluation in the late 1990s and early 2000s. Key determinants of the equilibrium real exchange rate include government consumption, terms of trade, and tourism-driven productivity differentials. Furthermore, despite their apparent high levels, medium-term current account deficits in the region appear sustainable. Chapter II: Price Dynamics in the ECCU shows that U.S. price stability has helped anchor prices in the ECCU. Inflation in the ECCU is not entirely imported from the U.S., and so has some domestic policy content. In addition, purchasing power parity does not hold within the ECCU owing to increasing price dispersion of nontradables, despite a decline in price dispersion of tradables over the last two decades.
Under the present quasi-currency board arrangement, the Eastern Caribbean Central Bank (ECCB) has a very limited role as lender of last resort (LOLR). Chapter III: The ECCB: Challenges to an Effective Lender of Last Resort analyzes the challenges for the ECCB to be an effective LOLR as part of a modern banking crisis resolution framework. The main results from a theoretical model of the ECCB’s institutional arrangement are that the majority of currency union members may veto emergency lending in the case of a member-specific shock, as such lending may endanger the stability of the currency board (by lowering the central bank’s international reserves, thus raising devaluation risk). However, in the presence of contagion across member countries, all currency union members have a vested interest in liquidity supply from the central bank. A key policy recommendation is that currency union members need a stronger fiscal position to continue to access international financial markets and sustain the exchange rate peg.
The ECCU has never experienced a systemic banking crisis, despite being exposed to numerous exogenous shocks. Chapter IV: How Vulnerable is the Eastern Caribbean Currency Union to a Banking Crisis? examines the factors underpinning the resilience of ECCU banks, using a relatively novel statistical technique (binary classification tree). The results indicate that the banking system has been sheltered from major triggers of banking crises—excessive inflation and nominal depreciation—thanks to the stability provided by the 1 The ECCU consists of six Fund-member countries (Antigua and Barbuda, Dominica, Grenada, St. Kitts and Nevis, St. Lucia, and St. Vincent and the Grenadines) and two territories of the United Kingdom (Anguilla and Montserrat).

4
quasi-currency board arrangement. Other precursors to banking crises—poor profitability, highly-dollarized liabilities, and low liquidity—have also not been major concerns in the ECCU thus far. However, rising dollarization and declining liquidity in some ECCU countries imply that bank stability should not be taken for granted, and the banking system should continue to be monitored carefully.
While world tourism has been rising sharply, the ECCU region’s share has declined. Chapter V: Tourism Demand in Small-Island Economies finds that tourism flows in the ECCU are sensitive to real exchange rate movements, hotel capacity, crime, and adverse exogenous shocks, including those emanating from source (tourism-originating) countries. These findings suggest that improved competitiveness, price stability, enhanced law enforcement, and tourism-source diversification could boost tourism flows to the region.
Motivated by the concern that corporate income tax (CIT) competition may have eroded the tax base in the Caribbean, Chapter VI: Corporate Income Tax Competition in the Caribbean calculates average effective tax rates to measure the impact of CIT competition, including the widespread use of tax holidays, on the tax base of 15 countries. The results not only confirm the erosion of the tax base, but also demonstrate the need to remove tax holidays, if recent tax policy initiatives (such as accelerated depreciation, loss carry-forward provisions, and tax harmonization) are to be effective. These findings suggest that the authorities should either avoid granting CIT holidays or rely more on other taxes (including consumption taxes) in order to broaden the tax base in the ECCU.
The demographic transition now underway in the ECCU is rapid compared with international experience, with emigration playing a particularly large role. As a result, ECCU pension funds’ expenditure is projected to exceed contributions by over 6 percent of GDP by 2060, requiring significant reforms to place pension schemes on a sustainable path. Chapter VII: Can the ECCU Afford to Grow Old? describes and quantifies several factors which could magnify the challenge of pension reform. First, for some ECCU countries, continued emigration at historical rates would considerably advance the projected date at which pension scheme assets are depleted. Second, there is a significant risk that assets will underperform, given the large exposures to the highly-leveraged public sector. Third, portfolio diversification away from the public sector could be complicated by age-related pressure for greater central government health spending.
Facing increasing health care costs and related equity concerns, many countries in the Caribbean are considering a move toward universal health care. Chapter VIII: Financing Universal Health Care: Lessons for the Eastern Caribbean and Beyond compares two main financing options (general taxation and payroll contributions) for universal health care in the ECCU, with an emphasis on the need to ensure financial sustainability given emerging demographic pressures and the epidemiological transition for chronic diseases. The study finds there is no “one-size-fits-all” solution to universal health care financing—public policy largely depends on the country’s economic, cultural, institutional, demographic, and epidemiological characteristics, as well as political economy considerations.

5
I. ASSESSING EXCHANGE RATE COMPETITIVENESS IN THE EASTERN CARIBBEAN CURRENCY UNION2
A. Introduction
1. This chapter assesses the evolution of Eastern Caribbean Currency Union (ECCU) real exchange rates over time, and examines whether the region has lost competitiveness. Two approaches are taken to assess the movement of the real exchange rate. First, a fundamentals-based approach is used to estimate the equilibrium real exchange rate in ECCU countries. The real exchange rate is then assessed by comparing the estimated equilibrium values to the actual values. Second, a macroeconomic balance approach is used to estimate the difference between the current account balance projected over the medium term, and an estimated equilibrium current account (or norm)—where a projected current account that exceeds the estimated norm suggests a potential overvaluation of the exchange rate.
2. The main finding is that there is little evidence of overvaluation of the Eastern Caribbean (EC) dollar.3 In all countries, real exchange rates currently appear to be close to their equilibrium levels, following a period of overvaluation in the early 1990s and early 2000s. In addition, while ECCU current account imbalances are projected to remain above estimated equilibrium levels for an extended period, they are expected to decline over the medium term to a sustainable level.
B. Evolution of the Real Exchange Rate in the ECCU
3. At end-2006, the EC dollar real effective exchange (REER) rate was at its most depreciated level in the last 20 years. After periods of significant real appreciation during the early and late 1990s, the EC dollar began depreciating in 2002. This depreciation of the EC dollar has been associated with a sharp nominal and real depreciation of the U.S. dollar against major
2 Prepared by Emilio Pineda and Paul Cashin.
3 The EC dollar has been pegged to the U.S. dollar at a rate of EC$2.7 per US$1 since 1976 in the context of a quasi-currency board arrangement.
ECCU: Real Effective Exchange Rate, 1979-2007 1/(2000=100)
65
75
85
95
105
115
125
135
145
Jan-79 Jan-83 Jan-87 Jan-91 Jan-95 Jan-99 Jan-03 Jan-07
1/ Trade-weighted index of nominal exchange rates deflated by seasonally adjusted relative consumer prices. An increase (decrease) indicates an appreciation (depreciation). Excludes Anguilla and Montserrat in the calculation of the ECCU average. Data up to June 2007 for all countries.
Antigua and Barbuda
St. Vincent and the Grenadines
St. Kitts and Nevis
St. Lucia
Grenada
Dominica
ECCU
Sources: IMF Information Notice System; and Fund staff estimates.

6
currencies. Furthermore, this recent trend of depreciating real exchange rates in the ECCU is expected to continue, since the U.S. dollar is expected to depreciate further.4
4. Real exchange rate measures based on currencies of ECCU tourism-customer and tourism-competitor countries show an even sharper depreciation since 2002.5 The customer-based exchange rate indicates in general that the rate was fairly stable during the 1990s, and has experienced a depreciation of over 15 percent starting in 2002. The competitor-based real exchange rate has depreciated steadily over the last two decades, in excess of 20 percent, with the exception of a brief period in 2002–03 when this trend was reversed because of the large depreciation of the Dominican Republic’s peso.
C. Equilibrium Real Exchange Rate6
5. The fundamentals-based equilibrium real exchange rate (FEER) approach is followed to assess the real exchange rate in the ECCU. Panel regression techniques were used to estimate an equilibrium relationship between real exchange rates and a set of fundamentals, and the estimated relationship was then used to calculate equilibrium real exchange rates. The panel includes six ECCU countries for the period 1979–2006, and 16 other tourism-dependent countries as a robustness check.
4According to staff analysis by the Consultative Group on Exchange Rates (CGER) as of July 2007, further real effective dollar depreciation of 10–30 percent would be required to eliminate the misalignment relative to medium-term macroeconomic fundamentals. See United States—Staff Report for the 2007 Article IV Consultation (IMF Country Report No. 07/264). 5 Since the ECCU economies are dominated by tourism, it is of interest to analyze the evolution of the real exchange rate against some key tourism customers and competitors. These measures are variants of the traditional real effective exchange rate index calculated by the IMF. Customers: Antigua and Barbuda-(Canada, U.K., U.S.), Dominica-(France, U.K., U.S.), Grenada-(Trinidad and Tobago, U.K., U.S.), St. Kitts and Nevis-(Canada, U.K., U.S.), St. Lucia-(Canada, U.K., U.S.), St. Vincent and the Grenadines-(Trinidad and Tobago, U.K., U.S.). Competitors: The Bahamas (23.4 percent), Barbados (8.0 percent), Dominican Republic (43.5 percent), Jamaica (19.4 percent), and Trinidad and Tobago (5.7 percent). The weights, in parentheses, are chosen based on the share of tourism arrivals to the Caribbean in 2001.
6 Estimates of the equilibrium REER are sensitive to the methodology used, and are particularly challenging in developing countries where the data are relatively weak (see Di Bella and others, 2007).
70
80
90
100
110
120
130
Jan-79 Jan-83 Jan-87 Jan-91 Jan-95 Jan-99 Jan-03 Jan-07
ECCU Tourism-competitors
ECCU Tourism-customers
Source: Fund staff estimates.
ECCU: Evolution of Tourism-Based Real Exchange Rates, 1979–2007(Index 2000=100)

7
Fundamentals 6. There is a large empirical literature on the determinants of the long-run real exchange rate. The literature has focused on sectoral productivity differentials, government spending, cumulative current account imbalances, movements in the terms of trade, and interest rate differentials as key drivers of long-run deviations from purchasing power parity (see Froot and Rogoff, 1995; Rogoff, 1996; Edwards, 1989; IMF, 2006). Since only “fundamentals” (real factors) can influence the long-run real exchange rate, the fundamentals-based equilibrium real exchange rate can be used to determine nominal misalignments by separating the factors that can affect the long-run equilibrium real exchange rate from those that may cause short-run misalignments. In the case of the tourism-dominated economies of the ECCU, the real exchange rate is expected to be driven by the following fundamentals (see Appendix I.1):
• Productivity differentials. According to the Balassa-Samuelson effect, higher productivity in tradables will result in a real appreciation of the exchange rate. Per capita tourist arrivals as a share of per capita tourist arrivals in The Bahamas—the country with the highest per capita arrivals in the Caribbean region—are used as a proxy for productivity differentials.7 • Terms of trade. Higher terms of trade may appreciate the real exchange rate through wealth effects. A positive terms of trade shock will induce an increase in domestic demand, hence an increase in the relative price of nontradables, yielding a real exchange rate appreciation. Given the dominance of tourism in the region, we use a proxy for tourism terms of trade—movements in the terms of trade of goods and services not explained by movements in the terms of trade of goods. • Government consumption. Higher government consumption (measured as a share of GDP) is likely to appreciate the real exchange rate to the extent that it falls mostly on nontradables. • Net foreign assets. Macroeconomic models predict that countries with higher net foreign assets can in principle sustain a stronger real exchange rate due to the income flow they receive on their assets. Estimation results 7. The estimated model found a significant long-run relationship between the real exchange rate and most of the identified fundamentals, particularly tourism-driven productivity differentials and the tourism terms of trade. The estimation results proved robust to different specifications and three different sets of samples for the period 7 Other countries—such as Antigua and Barbuda or Barbados—were used as benchmarks with similar results.

8
1979–2006: (i) ECCU countries only; (ii) ECCU countries plus Jamaica, Barbados, The Bahamas, and Belize; and (iii) ECCU countries plus 16 tourism-dependent countries. Estimated coefficients imply that (see Appendix Table I.1): • An increase of 10 percent in per capita tourist arrivals relative to per capita tourist arrivals in The Bahamas is associated with an appreciation of around 2 percent in the equilibrium real exchange rate. This is in line with the findings of IMF (2006) for a panel of developed and developing economies. • A 10 percent increase in the tourism terms of trade is associated with an equilibrium appreciation of the real exchange rate of 2 percent. This elasticity with respect to the tourism terms of trade is similar to that found for commodity-currencies by Cashin and others (2004), which ranged between 0.2 and 0.4. • An increase in the government consumption-to-GDP ratio of 10 percentage points is associated with an appreciation of the equilibrium real exchange rate of around 5 percent. The implied semi-elasticity of 0.5 is lower than the 2.6 value found by IMF (2006). • A deterioration of the ratio of net foreign assets to GDP of 10 percentage points would imply a depreciation of the equilibrium exchange rate by one-fifth of 1 percent. This is in line with that found in IMF (2006). • The half-life of deviations from equilibrium is around 1½ years, some 18 months less than those predicted by the simple purchasing power parity (PPP) model. This is consistent with the findings of Cashin and others (2004) that controlling for the influence of real factors—such as real commodity prices—is an important channel to reduce the persistence of real exchange rate shocks. Equilibrium real exchange rates 8. Equilibrium real exchange rates were computed using the estimated relationship between the real exchange rate and the fundamentals.8 Figures I.1 and I.3 show the evolution of the actual and equilibrium values for the REER in ECCU countries between 1979–2006. In all cases, current values of the real exchange rates are close to their equilibrium level, after experiencing a period of overvaluation in the early 1990s and early 2000s.
8The fundamentals can exhibit a substantial degree of “noise” or fluctuations. To ameliorate the impact of these fluctuations we applied a Hodrick-Prescott filter with a smoothing factor of 10.

9
D. Macroeconomic Balance Approach
9. The macroeconomic balance approach was used to estimate equilibrium current account norms and to assess real exchange rates in the ECCU. Panel regression techniques were used to estimate an equilibrium relationship between current account deficits and a set of macroeconomic fundamentals. The estimated relationship was then used to calculate equilibrium current account balances or “norms.” The difference between the current account balance projected (by staff) over the medium term at the prevailing exchange rate, and an estimated equilibrium current account, was used to assess the level of the real exchange rate (see Appendix I.1). In particular, if the projected current account exceeds the estimated equilibrium current account, this suggests a potential overvaluation of the real exchange rate.
Fundamentals
10. Following the substantial body of literature on the subject, we used the following determinants to estimate equilibrium current account balances (IMF, 2006; Isard and Faruqee, 1998; Isard and others, 2001; and Obstfeld and Rogoff, 1996):
• Fiscal balance. A fiscal surplus raises national saving and thereby increases the equilibrium current account balance. The measure of fiscal balance used in this chapter is the deviation of the central government budget balance (as a ratio of GDP) of each ECCU country from the average budget balance of the U.S. and the U.K., the ECCU’s main trading partners. • Oil balance. Higher oil prices decrease the equilibrium current account balance of oil-importing countries such as those of the ECCU; at the same time it should improve the current account balance of oil-exporting countries. • Relative income. The impact of relative per capita income on the equilibrium current account may differ depending on the level of development. At relatively low stages of development, increases in relative income would tend to improve a country’s access to foreign capital and thus be negatively correlated with the current account balance. The ratio of PPP-based per-capita income to the average of the U.S. and the U.K. levels is taken to measure the relative stage of development. • Relative economic growth. Among countries at a similar stage of development, the stronger is economic growth relative to trading partners, the higher is the equilibrium current account deficit. The deviation of the real per-capita GDP growth rate from the average of the U.S. and the U.K. is the variable used to capture relative economic growth. • Demographics. A higher relative number of young and elderly tends to reduce national saving and thus decrease the equilibrium current account balance. As a proxy for this impact we use population growth, which is expected to capture the share of economically-dependent young people.

10
• Net foreign assets. Economies with high net foreign assets (NFA) benefit from higher net foreign income flows, which tend to create a positive association between NFA and the equilibrium current account balance. Estimation results
11. The estimated model found a significant long-run relationship between the current account deficit and identified fundamentals, with many of the fundamentals possessing the expected signs. As with the earlier analysis of the equilibrium real effective exchange rate, the same three sets of samples were used in the panel estimation for the period 1979–2006. Estimated coefficients imply that for the ECCU countries (see Appendix Table I.2):9
• A 1 percentage point increase in the fiscal balance (relative to trading partners) would lead to around one-third of a percentage point of GDP improvement in the current account balance. This coefficient is consistent with those found by Chinn and Prasad (2003), who estimated a coefficient of 0.39 for a panel of developing countries. • A 1 percentage point increase in the oil balance would be reflected in an increase in the current account balance of about 1.5 percentage points of GDP. This coefficient is significantly larger than that found by IMF (2006) for a panel of industrial countries (0.23), probably reflecting the fact that many ECCU countries have been slow to adjust the price of gasoline and other oil related products, thus reducing the substitution impact produced by a hike in oil prices. • A country whose income is half the average of the U.S. and the U.K. level would have a current account balance 0.35 percentage points of GDP larger than that of the U.K. and the U.S.; this is consistent with the results found by Chinn and Prasad (2003) for African countries. • At similar stages of development, a 1 percentage point increase in real GDP growth reduces the current account balance by about 0.3 percentage points of GDP. This is in line with the results found by the CGER for a panel of industrial countries (IMF, 2006). Current account norms
12. The relationship summarized above permits the calculation of equilibrium current account balances or norms (Figure I.2). In computing the norms, medium-term (2012) values of the fiscal balance, oil balance, economic growth, and relative income are obtained from staff projections.
9 As shown in the Appendix, net foreign assets and population growth were statistically insignificant.

11
13. Using the macroeconomic balance approach, the equilibrium current account deficit (the current account ‘norm’) is estimated at between 9–15 percent of GDP, for sample sets consisting of tourism-based economies. Estimates based only on ECCU countries give a norm of about 20 percent of GDP, though this may overstate the equilibrium level as the estimation covers a period of rapid debt accumulation. Accordingly, the staff’s projected medium-term current account balance for the ECCU is close to the estimated level of the equilibrium current account when using either (i) the ECCU-only sample or (ii) an extended sample of tourism-dependent countries, including a dummy variable for the ECCU. This indicates that there is little evidence of overvaluation of the real exchange rate, as the medium-term current account balance is close to the current account norm. However, when the extended sample is used without a dummy variable for the ECCU, the projected medium-term current balance is significantly above the estimated equilibrium level (Figure I.2 and Appendix Table I.2). In the estimation without the ECCU dummy, biases can arise if there are important factors explaining the cross-country variation in the data that are not captured in the specification but are correlated with the other variables. While the specification with the dummy controls for this possibility, the resulting estimates may be unduly influenced by historical realizations of the dependent variable. For this reason estimation results are presented for both specifications.10
14. The financing of ECCU current account imbalances appears stable. The large projected current account deficits are not expected to be financed by the accumulation of external sovereign debt or by resources intermediated through domestic financial systems, but rather by private capital inflows (particularly FDI). Tourism sector investment, particularly for hotel construction, continues to be overwhelmingly financed by FDI. As tourism-based investment opportunities in the ECCU decline over the medium term, capital inflows and current account imbalances will narrow. As noted by Isard (2007), the macroeconomic balance approach to the assessment of exchange rate competitiveness may not be helpful for countries (like those of the ECCU) that have healthy future growth prospects and are thereby attracting sizeable external capital inflows, which are then mirrored in large current account deficits. In such cases, assessments of the level of the exchange rate would need to take into account, among other things, the extent to which such foreign capital inflows are used for productive investments that engender a reduction in current account imbalances over time.
15. While current account imbalances are projected to remain above estimated equilibrium levels for an extended period, they are expected to decline over the medium term to a sustainable level. The recent increase in current account deficits reflects, in large part, an uptick in imports accompanying preparations for the Cricket World Cup (CWC) and
10 Macroeconomic balance-based estimates of the equilibrium current account position are typically subject to uncertainty, given the large variation in current account balances across countries and over time, and the limits of the common specification imposed across a diverse set of countries.

12
expanding tourism capacity as ECCU countries develop their tourism sectors. The size of future current account imbalances is expected to taper off in line with the decline in the construction of new resort facilities, though much of the decline is likely to occur after the end of the projection period (after 2012). This implies that despite their apparent high levels, medium-term current account imbalances in the ECCU appear sustainable. Nevertheless, the high levels of current account imbalances, public debt and associated financing needs do pose risks that warrant careful monitoring and continued efforts at fiscal consolidation.
E. Conclusions
16. Real exchange rates in the region do not appear to be overvalued. The equilibrium real exchange rate estimation signals that the EC dollar real exchange rate is close to the level indicated by fundamentals. The empirical analysis shows that the depreciation of the EC dollar beginning in 2002 corrected a period of overvaluation, leaving the current real exchange rate closely aligned with fundamentals. Furthermore, while current account imbalances are projected to remain above equilibrium levels for an extended period, as tourism-based investment opportunities in the ECCU decline over the medium term, private capital inflows and current account imbalances will narrow. This implies that despite their current high levels, medium-term current account deficits in the region appear sustainable.
17. This chapter also provides evidence on the distinctive impact that tourism plays in the determination of the real exchange rate in tourism-driven economies. In estimating the equilibrium real exchange rate for a panel of 22 tourism-dependent economies, the analysis demonstrates that the impact of tourism on the real exchange rate is twofold. First, the real exchange rate is affected by the tourism terms of trade, where an increase in the price of the tourism good relative to the price of the imported foreign good induces an appreciation of the real effective exchange rate through wealth effects. Second, the real exchange rate is affected by an increase in the productivity of the tourism sector (associated with a Balassa-Samuelson effect) that increases wages in the nontradable sector, and thereby appreciates the real exchange rate.

13
Figure I.1. ECCU: Actual and Equilibrium REER, 1979–2006
Sources: IMF, Information Notice System; and authors' calculations.1/ The shaded band around the equilibrium exchange rate represents ±1 standard error of the prediction (see Appendix Table I.1).
Actual and Equilibrium REER (Index 2000=100) 1/
85
90
95
100
105
110
1979 1982 1985 1988 1991 1994 1997 2000 2003 2006
Actual
Equilibrium
Deviation from the Equilibrium REER (In percent)
-8
-6
-4
-2
0
2
4
6
8
1979 1982 1985 1988 1991 1994 1997 2000 2003 2006
0
5
10
15
20
25
30
2004 2005 2006 Prel.
2007 Proj.
Medium-Term 2/
NormECCU
NormCARICOM
Norm Fullsample
NormCARICOM
Norm Fullsample
0
5
10
15
20
25
30
Norm Norm includes ECCU dummy
Figure I.2. ECCU: Current Account Deficit, Actual and Estimated Norms 1/(In percent of GDP)
Sources: ECCB; and Fund staff estimates and projections. 1/ In computing the norms, medium-term values of the fiscal balance, oil-balance, output growth, and relative income are drawn from staff projections. Band is ±1 standard error of the prediction. ECCU sample includes only the 6 ECCU countries. CARICOM sample includes ECCU countries and The Bahamas, Barbados, Belize, and Jamaica. Full sample includes 22 tourism-dependent economies as defined by Bayoumi and others (2005). 2/ Based on Fund staff estimates. Medium-term is 2012.

14
Fig
ure
I.3. E
CC
U: A
ctua
l and
Equ
ilibr
ium
RE
ER
, 197
9–20
06 1
/(In
dex
2000
=100
)
S
ourc
es:
IMF
, In
form
atio
n N
otic
e S
yste
m;
and
Fun
d st
aff c
alcu
latio
ns.
1
/ Th
e sh
aded
ban
d ar
ound
the
equ
ilibr
ium
exc
hang
e ra
te r
epre
sent
s ±1
sta
ndar
d er
ror
of t
he p
redi
ctio
n (s
ee A
ppen
dix
Tabl
e I.1
) .
8090100
110
120 19
7919
8819
9720
06
Act
ual
Equ
ilibr
ium
Ant
igua
and
Bar
buda
8090100
110
120 19
7919
8819
9720
06
Act
ual
Equ
ilibr
ium
Dom
inic
a
8090100
110
120 19
7919
8819
9720
06
Act
ual
Equ
ilibr
ium
Gre
nada
8090100
110
120 19
7919
8819
9720
06
Act
ual
Equ
ilibr
ium
St.
Kitt
s an
d N
evis
8090100
110
120 19
7919
8819
9720
06
Act
ual
Equ
ilibr
ium
St.
Luc
ia
8090100
110
120 19
7919
8819
9720
06
Act
ual
Equ
ilibr
ium
St.
Vin
cent
and
the
Gre
nadi
nes
15
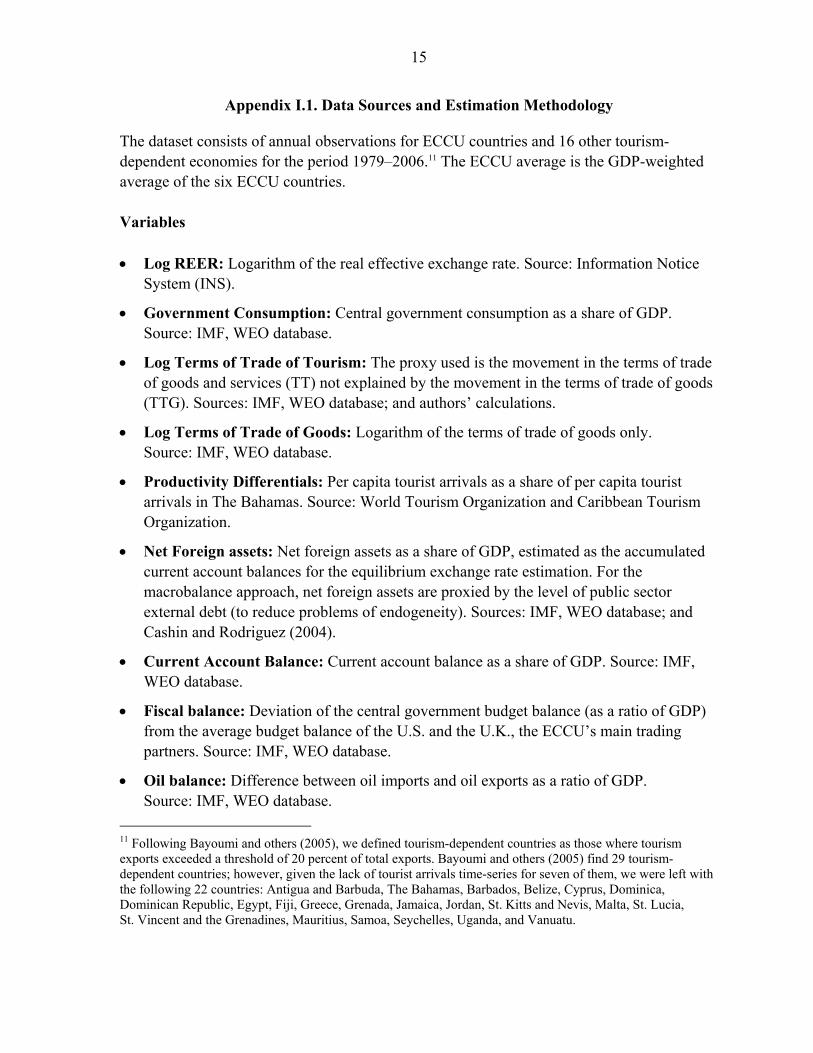
Appendix I.1. Data Sources and Estimation Methodology
The dataset consists of annual observations for ECCU countries and 16 other tourism-dependent economies for the period 1979–2006.11 The ECCU average is the GDP-weighted average of the six ECCU countries. Variables • Log REER: Logarithm of the real effective exchange rate. Source: Information Notice
System (INS).
• Government Consumption: Central government consumption as a share of GDP. Source: IMF, WEO database.
• Log Terms of Trade of Tourism: The proxy used is the movement in the terms of trade of goods and services (TT) not explained by the movement in the terms of trade of goods (TTG). Sources: IMF, WEO database; and authors’ calculations.
• Log Terms of Trade of Goods: Logarithm of the terms of trade of goods only. Source: IMF, WEO database.
• Productivity Differentials: Per capita tourist arrivals as a share of per capita tourist arrivals in The Bahamas. Source: World Tourism Organization and Caribbean Tourism Organization.
• Net Foreign assets: Net foreign assets as a share of GDP, estimated as the accumulated current account balances for the equilibrium exchange rate estimation. For the macrobalance approach, net foreign assets are proxied by the level of public sector external debt (to reduce problems of endogeneity). Sources: IMF, WEO database; and Cashin and Rodriguez (2004).
• Current Account Balance: Current account balance as a share of GDP. Source: IMF, WEO database.
• Fiscal balance: Deviation of the central government budget balance (as a ratio of GDP) from the average budget balance of the U.S. and the U.K., the ECCU’s main trading partners. Source: IMF, WEO database.
• Oil balance: Difference between oil imports and oil exports as a ratio of GDP. Source: IMF, WEO database.
11 Following Bayoumi and others (2005), we defined tourism-dependent countries as those where tourism exports exceeded a threshold of 20 percent of total exports. Bayoumi and others (2005) find 29 tourism-dependent countries; however, given the lack of tourist arrivals time-series for seven of them, we were left with the following 22 countries: Antigua and Barbuda, The Bahamas, Barbados, Belize, Cyprus, Dominica, Dominican Republic, Egypt, Fiji, Greece, Grenada, Jamaica, Jordan, St. Kitts and Nevis, Malta, St. Lucia, St. Vincent and the Grenadines, Mauritius, Samoa, Seychelles, Uganda, and Vanuatu.

16
• Relative income: The ratio of PPP-based per-capita income to the average of the U.S. and the U.K. Source: IMF, WEO database.
• Per capita growth: The deviation of the real per-capita GDP growth rate from the average of the U.S. and the U.K. is the variable used to capture relative economic growth. Source: IMF, WEO database.
• Population growth: Annual population growth. Source: IMF, WEO database.
Estimation of the equilibrium REER
As suggested by Breitung and Pesaran (2005) in panels where N is small (less than 10) and T is relatively large, the standard approach is to treat the equations from the different cross-section units as a system of seemingly unrelated regression equations (SURE) and then estimate the system by generalized least squares (GLS) techniques.12 A main advantage of these type of models is that correlation across units becomes a natural part of the specification, whereas in large N small T panels this type of correlation is always assumed away. Furthermore, the autoregressive distributed lag (ARDL) model specification advanced by Pesaran and Smith (1995) is used. The main advantage of this specification is that valid asymptotic inferences on the short-run and long-run parameters can be made, using the least or generalized squares estimator of the ARDL model, even in the presence of a lagged dependent variable and irrespective of the order of integration. The results are then rewritten in an error-correction formulation, in order to assess the speed of adjustment of the real exchange rate towards its long-run equilibrium. The long-run relationship should be interpreted as an equilibrium relationship rather than a causal one, since the presence of reverse causality is expected, particularly between the real exchange rate and tourism.
As a robustness check, three sets of samples were used: (i) ECCU only; (ii) ECCU countries plus Jamaica, The Bahamas, Barbados, and Belize—the main tourism competitors in the region; and (iii) ECCU countries plus 16 tourism-dependent countries. This was done to account for the possibility that the true FEER could be significantly below (or above) any of the realized REER for individual ECCU countries, but the methodology/sample would not be able to detect it.
As an additional robustness check, the pooled-mean group estimator (PMG) was used with the extended sample. This methodology proposed by Pesaran, Shin and Smith (1999) constrains the long-run coefficients to be identical in an error correction framework, but allows the short-run coefficient and error variances to differ. The main attraction of the GLS-SUR procedure lies in the fact that it allows the contemporaneous error covariances to be freely estimated. However, this is possible only when N is reasonably small relative to T.
12 Our finding that the real exchange rate in the ECCU countries does not exhibit a unit root rules out the possibility of cointegration, and thus standard panel models used in the literature such as dynamic ordinary least squares (DOLS) cannot be used. This strategy is also consistent with that adopted by Chen and Rogoff (2003), who argue that it is plausible to assume that over finite samples real exchange rates are stationary.

17
When N is of the same order of magnitude as T, as is the case in the full sample, GLS-SUR becomes less reliable. The PMG estimator is an alternative way to the panel corrected standard error (PCSE) to account for heterogeneity across the sample when N is relatively large.
Appendix Table I.1 shows the equilibrium relationship found with the different samples and the PMG estimator. The estimation results confirm the significant and positive association between tourism-driven productivity differentials and the REER. Similarly, it confirms the significant and positive association between tourism terms of trade and the REER. The coefficient for terms of trade of goods becomes significant in the extended sample, most likely reflecting the relatively lower reliance on tourism by countries such as Jordan, Uganda or Egypt. Overall, these results confirm the distinct impact of tourism on the real exchange rate in tourism-dominated economies through: (i) Balassa-Samuelson effects driven by increases in productivity in the tourism sector; and (ii) changes in the tourism terms of trade. For additional details on the estimation, see Pineda and Cashin (2008).
Estimation of the current account norms
Similar econometric techniques described in the previous section were used for the ECCU-only panel, and for the CARICOM and tourism-dependent country samples. Appendix Table I.2 reports the results of the estimation, where most coefficients are statistically significant with the expected signs. For additional details on the estimation, see Pineda and Cashin (2008).

18
Specification
Estimates of the long-run relationship Government consumption 0.48 1.40 *** -0.04 -0.29 ***
(1.44) (3.22) (-0.49) (-3.01) Terms of trade of tourism 0.15 ** 0.16 ** 0.09 * 0.54 ***
(2.48) (2.39) (1.87) (5.57) Terms of trade of goods -0.04 -0.01 0.07 *** 0.38 ***
(-1.24) (-0.14) (2.62) (8.45) Productivity 0.15 *** 0.17 *** 0.16 *** 0.58 ***
(3.19) (3.03) (2.86) (4.25) Net foreign assets 0.02 * 0.03 * 0.03 * 0.11 ***
(1.90) (1.91) (1.95) (2.62) Constant 2.16 *** 1.77 *** 1.66 *** 0.66 ***
Half-life of deviation 3/ 1.44 1.65 1.74 3.08
Prob > Χ2 0.00 0.00 0.00 0.00N
Source: Authors' calculations.
2/ Pooled Mean Group Estimator.
Note: Coefficients in parentheses represent the respective z and t values. *,**,*** denote significance at 10, 5, and 1 percent, respectively.
22226 10
All
1/ OLS-based Panel Corrected Standard Errors assuming cross-sectional correlation, panel heteroskedasticity, and AR(1) process.
3/ Half-life of deviation (in years) is estimated as -ln(2)/ln(r) where r is the error correction coefficient.
ECCU AllSUR PCSE 1/
CARICOM
(Dependent variable: Real effective exchange rate)Appendix Table I.1. Results of the Error Correction Specification for Different Samples
PMG 2/
Specification
Fiscal balance 0.34 ** 0.41 *** 0.51 *** 0.42 *** 0.39 ***(3.33) (4.42) (5.95) (14.43) (14.92)
Oil trade balance 1.60 *** 0.13 0.59 *** 0.14 *** 0.22 ***(4.11) (0.86) (4.41) (7.01) (9.75)
Relative income -0.69 ** 0.14 *** -0.10 *** 0.06 *** -0.01 **(-1.99) (4.39) (-2.79) (5.40) (-0.77)
Population growth 0.39 -0.03 -0.51 * 0.25 ** -0.12(0.40) (-0.10) (-1.81) (2.19) (-1.18)
Per capita growth -0.27 ** -0.14 -0.12 -0.04 -0.01(-2.13) (-1.56) (-1.45) (-1.41) (-0.56)
Net foreign assets 3/ 0.06 *(1.83)
ECCU dummy -0.14 *** -0.13 ***(-9.99) (-14.92)
Constant 0.01 -0.17 *** 0.01 -0.09 *** -0.02 **
Prob > Χ2 0.00 0.00 0.00 0.00 0.00
Source: Authors' calculations. 1/ Feasible Generalized Least Squares assuming cross sectional correlation, panel heteroskedasticity, and AR(1) process. 2/ OLS-based Panel Corrected Standard Errors assuming cross-sectional correlation, panel heteroskedasticity, and AR(1) process.
Note: Coefficients in parentheses represent the respective z and t values. *,**,*** denote significance at 10, 5, and 1 percent, respectively.
ECCU
3/ To reduce problems of endogeneity net foreign assets is proxied by the level of public external debt following Cashin and Rodriguez (2004). This proxy was only available for the ECCU countries.
Appendix Table I.2. Estimation Results Macroeconomic Balance Approach(Dependent variable: Current account balance as a share of GDP)
SUR GLS 1/ SUR PCSE 2/
CARICOM All

19
REFERENCES
Bayoumi, T., H. Faruqee, and J. Lee, 2005, “A Fair Exchange? Theory and Practice of Calculating Underlying Exchange Rate Trends,” IMF Working Paper 05/229 (Washington, DC: International Monetary Fund).
Breitung, J., and M. Hashem Pesaran 2005, “Unit Roots and Cointegration in Panels,”
CESIFO Working Paper, No. 1565. Cashin, P., and C.J. McDermott, 2003, “An Unbiased Appraisal of Purchasing Power Parity,”
IMF Staff Papers, Vol. 50, pp. 321–51. Cashin, P., L.F. Céspedes, and R. Sahay, 2004, “Commodity Currencies and the Real
Exchange Rate,” Journal of Development Economics, Vol. 75, pp. 239–68. Cashin, P., and P. Rodriguez, 2004, “Competitiveness in the ECCU: Measures of the Real
Exchange Rate,” Eastern Caribbean Currency Union: Selected Issues, IMF Country Report No. 04/335 (Washington DC: International Monetary Fund), pp. 56–64.
Chen, Y., and K. Rogoff, 2003, “Commodity Currencies and Empirical Exchange Rate
Puzzles,” Journal of International Economics, Vol. 60, pp. 133–60. Chinn, M., and E. Prasad, 2003, “Medium-Term Determinants of Current Accounts in
Industrial and Developing Countries: An Empirical Exploration,” Journal of International Economics, Vol. 59, pp. 47–76.
Di Bella, G., M. Lewis, and A. Martin, 2007, “Assessing Competitiveness and Real
Exchange Rate Misalignment in Low-Income Countries,” IMF Working Paper WP/07/201, (Washington DC: International Monetary Fund:).
Edwards, S., 1989, Real Exchange Rates, Devaluation and Adjustment (Cambridge, MA:
MIT Press). Froot, K., and K. Rogoff, 1995, “Perspectives on PPP and Long-Run Real Exchange Rates,”
in Handbook of International Economics, Vol. 3, ed. by Gene Grossman and Kenneth Rogoff (Amsterdam: Elsevier), pp. 1647–88.
International Monetary Fund, 2006, “Methodology for CGER Exchange Rate Assessments”,
Mimeo. Isard, P., 2007, “Equilibrium Exchange Rates: Assessment Methodologies,” IMF Working
Paper WP/07/296, (Washington DC: International Monetary Fund). Isard, P., and H. Faruqee, 1998, “Exchange Rate Assessment: Extensions of the
Macroeconomic Balance Approach,” Occasional Paper No. 167, International Monetary Fund.

20
Isard, P., H. Faruqee, R. Kincaid, and M. Fetherson, 2001, “Methodology for Current
Account and Exchange Rate Assessment,” Occasional Paper No. 209 (Washington DC: International Monetary Fund).
Montiel, P., and L. Hinkle, 1999, Exchange Rate Misalignment, Concept and Measurement
for Developing Countries (London: Oxford University Press). Obstfeld, M., and K. Rogoff, 1996, Foundations of International Macroeconomics
(Cambridge MA: MIT Press). Pesaran, M.H., and R. Smith, 1995, “Estimating Long-run Relationships from Dynamic
Heterogeneous Panels,” Journal of Econometrics, Vol. 68, pp. 79–113. Pesaran, M.H., Y. Shin and R.P. Smith, 1999, “Pooled Mean Group Estimation of Dynamic
Heterogeneous Panels,” Journal of the American Statistical Association, Vol. 94, pp. 621–34.
Pineda, E., and P. Cashin, 2008, “Is the EC Dollar Overvalued?” IMF Working Paper,
forthcoming. Rogoff, K., 1996, “The Purchasing Power Parity Puzzle,” Journal of Economic Literature,
Vol. 34, pp. 647–68. Williamson, J., 1994, “Estimates of FEERs”, in Estimating Equilibrium Exchange Rates, ed.
by J. Williamson (Washington DC: Institute for International Economics), pp. 177–243.

21
II. PRICE DYNAMICS IN THE EASTERN CARIBBEAN CURRENCY UNION13
A. Introduction
1. ECCU member countries have generally enjoyed low inflation in the context of the regional quasi-currency board exchange rate arrangement, with a fixed peg with the U.S. dollar. The currency union is one of only two currency unions in the world with a fixed exchange rate.14 It is the only one in which member countries pool their foreign reserves; the convertibility of the common currency is fully self-supported; and the parity of the exchange rate has not been changed in more than three decades.
2. This chapter formally examines the influence of the ECCU exchange rate arrangement on price dynamics in the six Fund-member ECCU countries. First, given the longstanding fixed peg with the U.S. dollar, it examines to what extent the U.S. price level has helped anchor price movements in the ECCU countries. Second, it analyzes whether the currency union arrangement has promoted price convergence among the ECCU countries and led to greater real exchange rate stability. Answers to these questions help address whether price movements in ECCU countries are entirely imported or have some domestic policy content, and whether the ongoing process of economic integration within the ECCU would help promote greater price convergence.15
B. What is the Composition of CPI Baskets?
3. The ECCU countries have similar consumption patterns, but the weights of individual components of CPI baskets vary considerably across the countries (Table II.1). For instance, the item “food and beverages” has the largest weight in the relatively less-developed Windward Islands, accounting for 35–55 percent of the total CPI basket. 16 13 Prepared by Yan Sun and Rupa Duttagupta.
14 The other currency union is formed by the CFA franc zone consolidating the two economic unions in Africa—West African Economic and Monetary Union (WAEMU) and the Economic and Monetary Community of Central Africa (CEMAC). While the ECCU fixed exchange rate is supported by a quasi-currency board arrangement—in that the Eastern Caribbean Central Bank needs to cover only 60 percent of its domestic liabilities with foreign reserves—in actuality it operates like a full fledged currency board with almost full coverage of demand liabilities.
15 The ECCU region is moving toward an Organization of Eastern Caribbean States (OECS) Economic Union. A draft Treaty was approved by OECS member countries in May 2007.
16 Windward Island countries are Dominica, Grenada, St. Lucia, and St. Vincent and the Grenadines. Leeward Island countries are Antigua and Barbuda and St. Kitts and Nevis.
05
101520
2530
3540
1985 1988 1991 1994 1997 2000 2003 2006
ECCUOther Caribbean 1/United States
Sources: WEO; and Fund staff estimates. 1/ Simple average of The Bahamas, Barbados, Belize, Dominican Republic, Guyana, Haiti, Jamaica, and Trinidad and Tobago.
Inflation Rates, 1985–2006(In percent)

22
Conversely, the components “housing” and “transportation and communication” carry more weight—in the order of 30–40 percent—in the relatively more-developed Leeward Islands.
4. Despite their small sizes and openness, the ECCU countries have a sizeable share of nontradables in their consumer baskets. While the classification of CPI components into tradables and nontradables is a subjective exercise, as a general rule of thumb all goods (usually imported) are classified as “tradable,” while services (usually domestically produced) are classified as “nontradables.”17 Generally speaking, the higher the income level of a country, the higher is the share of nontradables—with the share of nontradables ranging from over 25 percent in St. Vincent and the Grenadines to close to 50 percent in Antigua and Barbuda.
C. Impact of U.S. Price Movements
5. A close examination of the data—from 1990 to 2006—reveals two stylized facts:
• Price indexes in the ECCU have generally moved closely with the U.S. price index (Figure II.1). Indeed, the ECCU countries have enjoyed remarkable price stability for decades—their average annual rate of inflation was about 3 percent during 1982–2006. Nevertheless, relative price indexes (i.e., bilateral real exchange rates) between individual ECCU countries and the U.S. do not appear to comove, suggesting that inflation in the ECCU is not entirely imported (Figure II.2).
• Inflation volatility in the ECCU countries has been much higher than that of the U.S. (Figure II.3). As ECCU countries face more exogenous shocks in the context of a fixed nominal exchange rate, their domestic prices have to adjust more frequently to absorb the shocks.
6. A formal econometric analysis confirms that while U.S. price stability has helped anchor price stability in the ECCU, inflation in the ECCU is not entirely imported. An error-correction model is used to formally establish the link between the ECCU and U.S. price levels. First, the price level in each ECCU country is found to cointegrate with the U.S. price level, suggesting a country-specific long-run equilibrium between the two series (Table II.2). However, for most countries and the ECCU as a whole, the cointegration coefficients are statistically significantly different from one. Panel unit root tests also confirm that relative price indexes between ECCU countries and the U.S. are nonstationary, suggesting that U.S. inflation does not translate one-to-one into ECCU inflation even in the long run. Second, short-run deviations are stationary in that a positive (negative) deviation from the equilibrium level reduces (increases) the rate of inflation, pushing the domestic price back to its
17 One caveat is that the production of nontradables would include tradable inputs, which we are unable to take into account in the absence of more disaggregated data on the price indexes in ECCU CPI baskets.

23
equilibrium level. The speed of adjustment to equilibrium is quite fast, with an estimated half life of about eight months for the ECCU as a whole.
D. The Real Exchange Rate Within the ECCU18
7. The ECCU provides an interesting case study for analysis of the evolution of the real exchange rate. The literature on the real exchange rate has focused on either countries with different currencies or cities within the same country to which trade barriers or currency fluctuations do not apply. A currency union such as the ECCU is something in between these two polar cases. Nominal exchange rate variation, a standard factor underlying real exchange rate differences across countries, is not applicable in the ECCU countries, which share a common currency. However, many structural policies—related to trade barriers, factor market segmentation, and industry regulations—differ across the ECCU, making these countries less integrated than cities within the same country.
8. Absolute purchasing power parity (PPP) does not appear to hold within the ECCU. Figure II.4 depicts relative price indexes (i.e., the real exchange rate) using Antigua and Barbuda as the benchmark, and they do not appear to be stationary. Also, standard unit root tests confirm the nonstationarity of bilateral real exchange rates, regardless of the choice of benchmark country.
9. To understand the factors underlying the deviation from PPP, the roles of nontradables prices and transportation costs were examined, as suggested in the literature (Engle, 1993; Parsley and Wei, 1996; Engel and Rogers, 2001; and Cecchetti, Mark, and Sonora, 2002). The key results are as follows:
• Deviation from PPP among ECCU countries reflects persistent price differences in nontradables rather than tradables (Figures II.5 and II.6). Relative price indexes are indeed stationary for most tradable goods, except for fuel and light. The latter possibly reflect the fact that, in the sample period under consideration, retail fuel prices were administered in most ECCU countries, except Dominica.19 As for nontradables (housing, transportation and communication, education, and health care), relative price indexes are nonstationary, implying that country-specific structural and policy differences may have resulted in persistent differences in the national price of these nontradables.
18 This chapter uses “real exchange rate stability” and “purchasing power parity (PPP)” interchangeably, as the real exchange rate may be viewed as a measure of the deviation from PPP. See Sarno and Taylor (2002) for a literature survey on the real exchange rate and PPP.
19 Dominica has allowed full pass through from world oil prices to domestic retail fuel prices since late 2003. Grenada and St. Kitts and Nevis liberalized the determination of retail gasoline prices in late 2006.

24
• Barriers to trade such as transportation costs do not explain deviations from PPP. Geographical distance is used as a proxy for transportation costs and there is no evidence that deviation from PPP is larger for countries which are further apart. This result contrasts with other studies in the literature, and likely reflects the low level of intra-country trade within the ECCU.
10. For tradables, the speed of convergence to PPP is faster for those components with a larger composition of perishables. Among the three tradable CPI components, the half life of deviation from price parity is estimated at about 4 quarters for food and beverages, much faster than the 8–9 quarters estimated for household furnishing and clothing and footwear. Parsley and Wei (1996) also found that perishable goods converged to PPP faster than nonperishable goods, using price data for cities in the United States.
11. While price index (i.e., inflation) convergence among ECCU countries has increased for tradables, price indexes for nontradables appear to have become more dispersed (Figures II.7 and II.8). With the exception of fuel and light, price index dispersion of all other tradable CPI components has decreased during 1990–2006, with the decline being very pronounced for food and beverages. As for nontradables, however, the inflation dispersion of the housing and transportation and communication components has increased. Inflation dispersion of the recreation and education and health care components appears to have declined slightly. However, given their very small weights in the CPI basket, it would be safe to conclude that price indexes of nontradables have become more dispersed.
E. Concluding Remarks
12. The findings of this chapter suggest that domestic policies and structural differences could have a persistent impact on prices in the ECCU. First, U.S. price stability has helped anchor price stability in the ECCU. However, inflation in the ECCU is not entirely imported from the U.S. Second, purchasing power parity does not hold within the ECCU due to the persistent price dispersion of nontradables, which has increased despite a decline of price dispersion in tradables in recent decades. Thus, policy differences—related to the labor market and trade barriers—as well as differences in structural characteristics appear to have played a role in maintaining persistent inflation differences across ECCU countries. Looking ahead, these differences should decline over time as labor market segmentation and trade distortions are gradually removed, in the context of greater economic integration among ECCU countries.

25
Figure II.1. ECCU: Consumer Price Index Movement, March 1990–December 2006(Logarithmic scale, index September 1995=100)
U.S.
4.3
4.4
4.5
4.6
4.7
4.8
4.9
5.0
Mar-90 Sep-95 Mar-01 Sep-06
Antigua and Barbuda
U.S.
4.3
4.4
4.5
4.6
4.7
4.8
4.9
5.0
Mar-90 Sep-95 Mar-01 Sep-06
Dominica
U.S.
4.3
4.4
4.5
4.6
4.7
4.8
4.9
5.0
Mar-90 Sep-95 Mar-01 Sep-06
Grenada
U.S.
4.3
4.4
4.5
4.6
4.7
4.8
4.9
5.0
Mar-90 Sep-95 Mar-01 Sep-06
St. Kitts and NevisU.S.
4.3
4.4
4.5
4.6
4.7
4.8
4.9
5.0
Mar-90 Sep-95 Mar-01 Sep-06
St. Lucia
U.S.
4.3
4.4
4.5
4.6
4.7
4.8
4.9
5.0
Mar-90 Sep-95 Mar-01 Sep-06
St. Vincent and the Grens.
Sources: ECCB; and Fund staff estimates.
Figure II.2. ECCU: Relative Price Indexes with the United States, March 1990–December 2006(Logarithmic difference)
Sources: ECCB; and Fund staff estimates.
-0.16
-0.12
-0.08
-0.04
0.00
0.04
0.08
Mar-90 Oct-95 May-01 Dec-06
Antigua and Barbuda
-0.10
-0.06
-0.02
0.02
0.06
0.10
Mar-90 Oct-95 May-01 Dec-06
Dominica
-0.10
-0.06
-0.02
0.02
0.06
0.10
Mar-90 Oct-95 May-01 Dec-06
Grenada
-0.10
-0.06
-0.02
0.02
0.06
0.10
0.14
Mar-90 Oct-95 May-01 Dec-06
St. Kitts and Nevis
-0.10
-0.06
-0.02
0.02
0.06
0.10
Mar-90 Oct-95 May-01 Dec-06
St. Lucia
-0.10
-0.06
-0.02
0.02
0.06
0.10
Mar-90 Oct-95 May-01 Dec-06
St. Vincent and the Grens.

26
Figure II.3. ECCU: Quarterly Inflation, March 1990–December 2006(In percent)
-7
-5
-3
-1
1
3
5
7
Mar-90 Sep-95 Mar-01 Sep-06
Antigua and Barbuda
U.S.
-7
-5
-3
-1
1
3
5
7
Mar-90 Sep-95 Mar-01 Sep-06
DominicaU.S.
-7
-5
-3
-1
1
3
5
7
Mar-90 Sep-95 Mar-01 Sep-06
GrenadaU.S.
-7
-5
-3
-1
1
3
5
7
Mar-90 Sep-95 Mar-01 Sep-06
St. Kitts and NevisU.S.
-7
-5
-3
-1
1
3
5
7
Mar-90 Sep-95 Mar-01 Sep-06
St. LuciaU.S.
-7
-5
-3
-1
1
3
5
7
Mar-90 Sep-95 Mar-01 Sep-06
St. Vincent and the Grens.U.S.
Sources: ECCB; and Fund staff estimates.
Figure II.4. ECCU: Relative Prices with Antigua and Barbuda, March 1994–December 2006(Logarithmic difference)
-0.15
-0.10
-0.05
0.00
0.05
0.10
Mar-94 Jun-98 Sep-02 Dec-06
Dominica
-0.15
-0.10
-0.05
0.00
0.05
0.10
Mar-94 Jun-98 Sep-02 Dec-06
Grenada
-0.30
-0.25
-0.20
-0.15
-0.10
-0.05
0.00
0.05
0.10
Mar-94 Jun-98 Sep-02 Dec-06
St. Kitts and Nevis
-0.15
-0.10
-0.05
0.00
0.05
0.10
Mar-94 Jun-98 Sep-02 Dec-06
St. Lucia
-0.15
-0.10
-0.05
0.00
0.05
0.10
Mar-94 Jun-98 Sep-02 Dec-06
St. Vincent and the Grens.
Sources: ECCB; and Fund staff estimates.

27
Figure II.5. ECCU: Relative Nontradable Prices with Antigua and Barbuda, March 1994–December 2006(Logarithmic difference)
-0.25
-0.20
-0.15
-0.10
-0.05
0.00
0.05
Mar-94 Jun-98 Sep-02 Dec-06
Dominica
-0.25
-0.20
-0.15
-0.10
-0.05
0.00
0.05
Mar-94 Jun-98 Sep-02 Dec-06
Grenada
-0.45
-0.35
-0.25
-0.15
-0.05
0.05
0.15
Mar-94 Jun-98 Sep-02 Dec-06
St. Kitts and Nevis
-0.25
-0.20
-0.15
-0.10
-0.05
0.00
0.05
0.10
Mar-94 Jun-98 Sep-02 Dec-06
St. Lucia
-0.30
-0.25
-0.20
-0.15
-0.10
-0.05
0.00
0.05
Mar-94 Jun-98 Sep-02 Dec-06
St. Vincent and the Grenadines
Sources: ECCB; and Fund staff estimates.
Figure II.6. ECCU: Relative Tradable Prices with Antigua and Barbuda, March 1994–December 2006(Logarithmic difference)
-0.04
-0.02
0.00
0.02
0.04
0.06
0.08
0.10
Mar-94 Jun-98 Sep-02 Dec-06
Dominica
-0.06
-0.04
-0.02
0.00
0.02
0.04
0.06
0.08
0.10
Mar-94 Jun-98 Sep-02 Dec-06
Grenada
-0.15
-0.10
-0.05
0.00
0.05
0.10
Mar-94 Jun-98 Sep-02 Dec-06
St. Kitts and Nevis
-0.10
-0.05
0.00
0.05
0.10
0.15
Mar-94 Jun-98 Sep-02 Dec-06
St. Lucia
-0.05
-0.01
0.03
0.07
0.11
0.15
Mar-94 Jun-98 Sep-02 Dec-06
St. Vincent and the Grenadines
Sources: ECCB; and Fund staff estimates.

28
Figure II.7. ECCU: Inflation Dispersion of Tradables, 1990–2006
Sources: ECCB; and Fund staff calculations.
Note: Inflation dispersion is measured as the standard deviation of inflation across ECCU countries.
Food and Beverage
0
1
2
3
4
5
6
Jun-90 Dec-91 Jun-93 Dec-94 Jun-96 Dec-97 Jun-99 Dec-00 Jun-02 Dec-03 Jun-05 Dec-06
Clothing and Footwear
0
2
4
6
8
10
Jun-90 Dec-91 Jun-93 Dec-94 Jun-96 Dec-97 Jun-99 Dec-00 Jun-02 Dec-03 Jun-05 Dec-06
Household Furnishing
0
1
2
3
4
5
Jun-90 Dec-91 Jun-93 Dec-94 Jun-96 Dec-97 Jun-99 Dec-00 Jun-02 Dec-03 Jun-05 Dec-06
Fuel and Light
012345678
Jun-90 Dec-91 Jun-93 Dec-94 Jun-96 Dec-97 Jun-99 Dec-00 Jun-02 Dec-03 Jun-05 Dec-06

29
Figure II.8. ECCU: Inflation Dispersion of Nontradables, 1990–2006
Housing
02468
1012141618
Jun-90 Dec-91 Jun-93 Dec-94 Jun-96 Dec-97 Jun-99 Dec-00 Jun-02 Dec-03 Jun-05 Dec-06
Transporation and Communication
0
2
4
6
8
10
12
Jun-90 Dec-91 Jun-93 Dec-94 Jun-96 Dec-97 Jun-99 Dec-00 Jun-02 Dec-03 Jun-05 Dec-06
Recreation and Education
0
2
4
6
8
10
12
14
Jun-90 Dec-91 Jun-93 Dec-94 Jun-96 Dec-97 Jun-99 Dec-00 Jun-02 Dec-03 Jun-05 Dec-06
Health Care
02468
10121416
Jun-90 Dec-91 Jun-93 Dec-94 Jun-96 Dec-97 Jun-99 Dec-00 Jun-02 Dec-03 Jun-05 Dec-06
Sources: ECCB; and Fund staff calculations.
Note: Inflation dispersion is measured as the standard deviation of inflation across ECCU countries.

30
Category 1/
Antigua and
Barbuda Dominica GrenadaSt. Kitts
and Nevis St. Lucia
St. Vincent and
Grenadines
All items 1,000 1,000 1,000 1,000 1,000 1,000 Food T 214 329 368 281 468 536 Alcoholic beverages and tobacco T 2 10 9 7 28 10 Clothing and footwear T 111 82 98 93 65 98 Housing N 218 112 102 130 135 30 Fuel and light T 64 59 55 44 45 89 Medical care & health expenses N 28 32 47 37 23 62 Household furnishing T 126 94 95 141 58 69 Transportation and communication N 154 194 157 193 63 10 Education N 23 29 37 21 - 34 Personal services N 43 43 16 20 32 34 Miscellaneous N 18 18 18 34 83 30
Memorandum items:Tradables T 516 573 624 565 663 726 Nontradables N 484 428 376 435 337 274
Sources: ECCU country authorities; and Fund staff estimates.
1/ T = tradables; N = nontradables.
Table II.1: ECCU: Current Composition of CPI Basket
Country Cointegration Equation 2/
ECCU average 0.785
(-0.042)
Antigua and Barbuda 0.326
(-0.089)
Dominica 0.679
(-0.083)
Grenada 0.934
(-0.074)
St. Kitts and Nevis 1.475
(-0.291)
St. Lucia 0.965
(-0.059)
St. Vincent and the Grenadines 0.704
(-0.06)
Source: Authors’ calculations.
1/ All variables are in logarithms.
Table II.2.ECCU: Price Levels—Long-Run Equilibrium Relationships
2/ Coefficient on U.S. price level in cointegrating regression, with standard error in parentheses.
Dependent variable: Domestic price level 1/

31
REFERENCES
Cecchetti, S.G., N.C. Mark, and R.J. Sonora, 2002, “Price Index Convergence Among United
States Cities,” International Economic Review, Vol. 43, pp. 1081–99. Engel, C., and J.H. Rogers, 1996, “How Wide Is the Border?”, American Economic Review,
Vol. 86, pp. 1112–25. Engel, C., and J.H. Rogers, 2001, “Violating the Law of One Price: Should We Make a
Federal Case Out of It?” Journal of Money, Credit and Banking, Vol. 33, pp. 1–15. Engel, C., 1993, “Real Exchange Rates and Relative Prices: An Empirical Investigation,”
Journal of Monetary Economics, Vol. 32, pp. 35–50. Parsley, D.C., and S. Wei, 1996, “Convergence to the Law of One Price Without Trade
Barriers or Currency Fluctuations,” The Quarterly Journal of Economics, Vol. 111, pp. 1211–36.
Sarno, L., and M.P. Taylor, 2002, “Purchasing Power Parity and the Real Exchange Rate,”
IMF Staff Papers, Vol. 49, pp. 65–105. Rogers, J.H., 2007, “Monetary Union, Price Level Convergence, and Inflation: How Close Is
Europe to the USA?” Journal of Monetary Economics, Vol. 54, pp. 785–96.

32
III. THE ECCB: CHALLENGES TO AN EFFECTIVE LENDER OF LAST RESORT20
A. Introduction
1. The impact of a banking crisis on an economy is far reaching. Once a banking crisis starts, its negative effects spread quickly throughout the economy, impairing the payments system, shrinking the credit market, and depressing banking deposits in both solvent and insolvent banks (Hoelscher and Quintyn, 2003). To contain the effects of a banking crisis, governments usually step in with costly support programs to avoid further deterioration of the economy. 2. To protect their economies from a banking crisis, countries have developed tool kits known as “Banking Crisis Resolution Frameworks.” Comprehensive banking crisis resolution frameworks include three main pillars: (i) a legal framework that allows closure of banks in bankruptcy; (ii) an exit strategy for insolvent institutions; and (iii) a lender of last resort (LOLR) facility (Schinasi, 2006). 3. This chapter analyzes the challenges faced by the Eastern Caribbean Central Bank (ECCB) in conducting an effective LOLR role. These challenges are analyzed from two perspectives. The first considers constraints imposed by the limited resources of a central bank under a quasi-currency board arrangement. In this setting, the ECCB’s potential to finance a LOLR facility is constrained by its capacity to access capital markets, or by the trade-off between using its excess international reserve holdings and protecting the fixed exchange rate regime. Second, the ECCB’s ability to act as a LOLR is constrained by its institutional architecture, as its decision-making body in the ECCB (the Monetary Council), formed by one representative from each member country, could block the use of any LOLR facility. For example, suppose that one member needs to use the LOLR facility and that extending the requested liquidity assistance increases pressure on the exchange rate, placing the sustainability of the quasi-currency board at higher risk. What would be the reaction of currency union members? Would they accommodate the currency risk by approving the LOLR facility knowing its potential risks, or might they block emergency lending to help sustain the currency board? 4. A simple model is presented in order to examine the effects of the ECCB’s institutional arrangement on the administration of a potential LOLR facility. The model focuses on a two-country framework, where the countries share a central bank to pool their international reserves and a common currency. The model highlights the incentives for free-rider behavior arising from the specific institutional arrangement underpinning the ECCU. The
20 Prepared by Mario Dehesa and Pablo Druck.

33
sequence for free-rider behavior occurs as follows: (i) the central bank grants credit to the country where banks need liquidity; (ii) the central bank’s international reserves decline as the money market returns to equilibrium; (iii) devaluation risk rises with an increasing probability that the currency board becomes unsustainable; and consequently (iv) interest rates increase in both liquidity-supported and nonliquidity-supported countries. As a result, while one country benefits from emergency lending, domestic interest rates and exchange rate risks increase in both countries. To contain this free-rider behavior, the ECCB’s institutional arrangement allows members to block extensive liquidity assistance, introduced in the model of this chapter as veto power. Later, the model is extended to address the possibility of contagion between the two countries. 5. The results of the model suggest that:
If the ECCB has limited access to foreign currency to maintain adequate levels of international reserves or has a constrained capacity to sterilize additional liquidity, then use of the LOLR facility would increase exchange rate risk. Hence, the ECCB may not have the capacity to act as a LOLR while protecting the fixed exchange rate.
In the case of a country-specific shock, the unaffected country may have an incentive to
use its veto power and block the central bank emergency lending requested by the country where banks need liquidity. In this instance, the ECCB would be prevented from acting as a LOLR.
However, when both countries face an adverse shock, from either a common shock or
contagion, they may weaken their veto power and may agree to extend the LOLR to the currency union’s members. Since increased central bank credit creates pressures on the exchange rate, the ECCB acts as a LOLR but at heightened risk to sustainability of the exchange rate arrangement.
The model implies that countries facing country-specific shocks should strengthen their
fiscal balances so that they can access international capital markets on their own in order to provide liquidity support to banks. However, in the case of a generalized shock, veto power may not be enough to prevent the central bank from extending credit to country members. Currency union members need therefore to improve their creditworthiness to continue to tap international capital markets and sustain the fixed exchange rate arrangement.
B. The LOLR Facility and its Monetary Effects
6. A LOLR plays a crucial role in providing liquidity in times of financial distress. A LOLR can be defined as “the discretionary provision of liquidity to financial institutions by the central bank in reaction to an adverse shock which causes an abnormal increase in demand for

34
liquidity which cannot be met from an alternative source” (Freixas et. al. 1999). Conventional wisdom is that in a banking crisis the central bank should lend freely, at a penalty rate, and on good collateral.21 These rules suggest that an efficient interbank market could be enough to ensure banks’ access to liquidity. However, in a crisis the interbank market may not work adequately, due to asymmetric information about the banks’ actual situation, opening the possibility of a market failure (Freixas et. al., 2003). In this case, a bank supervisory authority could be in a better position relative to other market players to assess each bank’s financial situation, and the merits of requests for liquidity support. In the case of the ECCU, the ECCB is also the regulatory entity and is the only market player that has access to detailed information on the financial position of individual banks. Moreover, in the ECCU area, banks have limited room to meet liquidity needs in times of financial distress because the formal interbank market is small and the securities market is thin. 7. However, the LOLR function is controversial because it creates moral hazard, as with any form of insurance. A LOLR may encourage banks to take additional risks and may reduce the monitoring of banks by creditors (Garcia and Plautz, 1988). This chapter does not assess competing views on the LOLR, and focuses only on understanding the challenges faced by the ECCB in conducting an effective LOLR facility. 8. Liquidity assistance creates an excess supply of money, raising the question of how the money market returns to equilibrium. The adjustment mechanism depends critically on the exchange rate regime, the availability of external financing and the level of securities market development. In a fixed exchange rate regime, excess liquidity provided by the central bank leads to a loss of international reserves and potentially to a currency crisis (Krugman, 1979; Flood and Marion, 1999), unless it is financed by foreign credit (Fischer, 1999) or neutralized through open-market operations. Successful sterilization of liquidity support requires the availability of necessary instruments, and deep and liquid money and securities markets (He, 2000; Laurens, 2005).
9. In a country with a flexible exchange rate regime and well-developed securities markets, the money market could return to equilibrium through a combination of interest rate and exchange rate adjustments. Open-market operations by the central bank may absorb excess liquidity or distribute part of the adjustment to exchange rate variations without loss of international reserves. However, even with adequate monetary instruments and well-developed securities and foreign exchange markets, sterilization of emergency lending support may result in significant volatility of interest rates (He, 2000).
21 In many developing countries additional requirements are needed to reduce moral hazard and protect the LOLR from undue political pressure, including well designed lending procedures, clearly laid out authority and accountability (He, 2000).

35
10. A currency board arrangement imposes tight constraints on liquidity assistance to troubled banks. The sustainability of the exchange rate peg depends on the backing of base money by international reserves. The ECCB oversees a currency board in a multi-country setting. The ECCB-specific institutional arrangement sets tight constraints on the LOLR function. Under the ECCB Act (1983), external reserves must be held at not less than 60 percent of demand liabilities.22 23 Hence, the central bank would need extra resources to finance their LOLR facility without reducing its international reserve holdings below a legal threshold or below a higher threshold set for precautionary reasons. 11. Foreign credit could be used to fund the LOLR facility. Long-term foreign credit lines would allow the ECCB to address the liquidity needs of banks without increasing short-term foreign exchange rate risk, as the gross backing ratio of international reserves to base money would remain unchanged.24
C. The ECCB Institutional Architecture
12. The ECCB’s institutional arrangement has a specific characteristic that constrains its policy-decision process. Eight representatives of the ECCU countries and territories comprise the Monetary Council, the highest decision-making authority in the ECCB. In this setting, any policy decision that could potentially affect regional asset prices could trigger a dispute between winners and losers among the ECCB Council’s members. The Monetary Council has the power to approve most policy decisions by simple majority, given a quorum of at least five members. However, some policies, particularly those that could affect the sustainability of the currency union, require unanimous vote. 13. Given the ECCB’s decision-making structure, a policy that benefits a group of members while harming others could be blocked by the Monetary Council. For example, suppose that one of the members needs ECCB liquidity assistance. If this assistance is large enough to put in danger the sustainability of the currency union, the other members may have strong incentives to vote against the proposed policy. Formally, the theoretical model set out in
22 In practice the ECCB backing ratio expanded from around 83 percent in 1983 to fluctuate at over 95 percent since 1995. Despite the quasi-currency board arrangement, the ECCB is permitted to provide credit to its members under specified limits and within the reserve cover requirement (IMF, 2004).
23 In the early 2000s, out of a group of six modern currency board arrangements (CBAs), only Bosnia and Herzegovina explicitly ruled out a LOLR facility. Hong Kong, Argentina and Bulgaria had provisions that explicitly collateralized emergency lending, up to the excess foreign reserves available. Estonia and Lithuania had no formal provisions, but may provide support on a case by case basis (Ho, 2002).
24 Article 24 of the ECCB Act does not specify if the external reserve to cover demand liabilities refers to a gross or net concept. To compute the backing ratio, some CBAs like Bulgaria and Lithuania use a gross concept of foreign assets that does not take into account the central bank’s long-term external obligations coming, for instance, from the IMF and/or the World Bank.
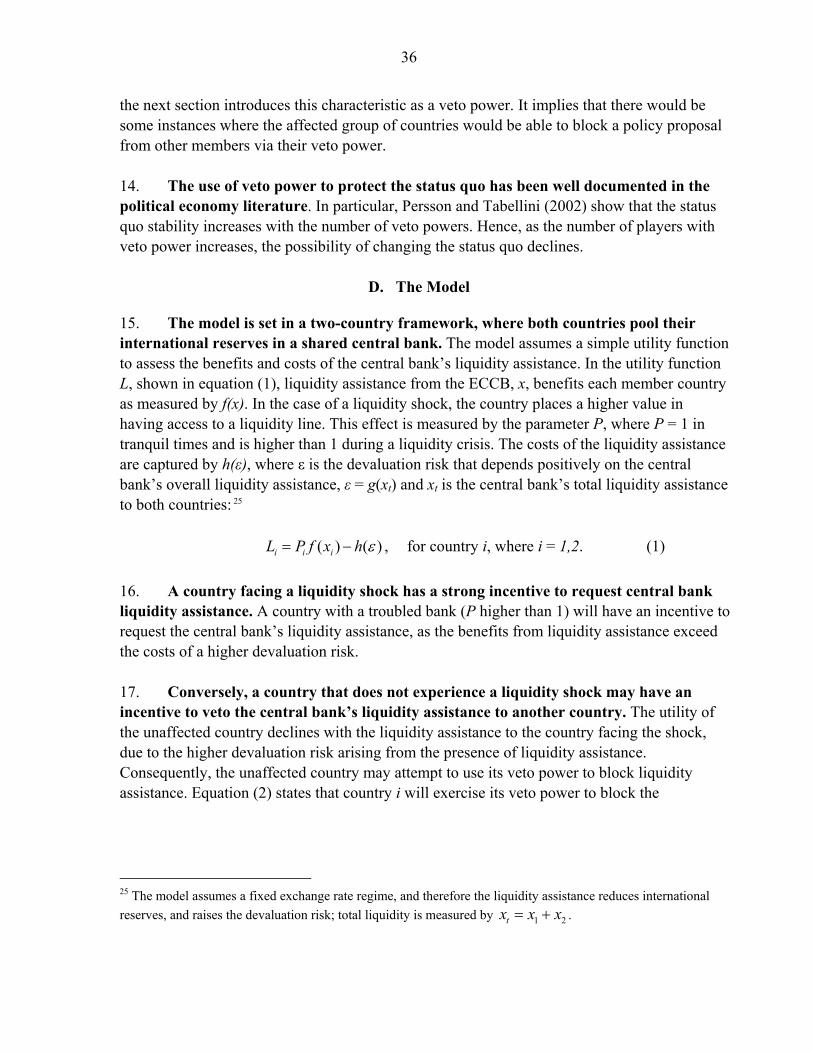
36
the next section introduces this characteristic as a veto power. It implies that there would be some instances where the affected group of countries would be able to block a policy proposal from other members via their veto power. 14. The use of veto power to protect the status quo has been well documented in the political economy literature. In particular, Persson and Tabellini (2002) show that the status quo stability increases with the number of veto powers. Hence, as the number of players with veto power increases, the possibility of changing the status quo declines.
D. The Model
15. The model is set in a two-country framework, where both countries pool their international reserves in a shared central bank. The model assumes a simple utility function to assess the benefits and costs of the central bank’s liquidity assistance. In the utility function L, shown in equation (1), liquidity assistance from the ECCB, x, benefits each member country as measured by f(x). In the case of a liquidity shock, the country places a higher value in having access to a liquidity line. This effect is measured by the parameter P, where P = 1 in tranquil times and is higher than 1 during a liquidity crisis. The costs of the liquidity assistance are captured by h(ε), where ε is the devaluation risk that depends positively on the central bank’s overall liquidity assistance, ε = g(xt) and xt is the central bank’s total liquidity assistance to both countries: 25
( ) ( )i i iL P f x h ε= − , for country i, where i = 1,2. (1) 16. A country facing a liquidity shock has a strong incentive to request central bank liquidity assistance. A country with a troubled bank (P higher than 1) will have an incentive to request the central bank’s liquidity assistance, as the benefits from liquidity assistance exceed the costs of a higher devaluation risk. 17. Conversely, a country that does not experience a liquidity shock may have an incentive to veto the central bank’s liquidity assistance to another country. The utility of the unaffected country declines with the liquidity assistance to the country facing the shock, due to the higher devaluation risk arising from the presence of liquidity assistance. Consequently, the unaffected country may attempt to use its veto power to block liquidity assistance. Equation (2) states that country i will exercise its veto power to block the
25 The model assumes a fixed exchange rate regime, and therefore the liquidity assistance reduces international reserves, and raises the devaluation risk; total liquidity is measured by 1 2tx x x= + .

37
implementation of the policy proposal made by country j when that proposal reduces country i’s utility below a predetermined threshold αi, which is defined as a reservation utility level:
( ) ( )i i i i iP f x h ε α− p , for country i. (2) 18. The complete model is constituted by the following equations:
1 1 1 1 1 2 2 2 2 2 2( ) ( ) [ ( ) ( ) ]L P f x h P f x hε λ ε α= − + − − (3)
2 2 2 2 2 1 1 1 1 1 1( ) ( ) [ ( ) ( ) ]L P f x h P f x hε λ ε α= − + − − , (4) where the goal of each country is to maximize its utility function, ( ) ( )i i i iP f x h ε− , arising from accessing the central bank’s liquidity assistance, subject to the other country’s veto power, defined by ( ) ( )j j j j jP f x h ε α− − . 19. The model is solved as a noncooperative game between two players. The solution is found by both countries simultaneously maximizing the utility function to choose the optimal size of liquidity requested from the central bank. The solution maximizes simultaneously the utility functions (3) and (4) with respect to x1 and x2. To facilitate the interpretation of the model, the results are derived numerically using well-behaved benefit and cost functions to characterize the utility function. Benefits are specified as ( )i if x x= while the cost related to
the exchange rate risk is specified as 2( ) th xε = , where 1 2tx x x= + . 20. Given the structure of the ECCU financial system, the model also introduces the possibility of contagion between the two countries. Several ECCU banks are linked to banks located elsewhere in the region either through business links or by common ownership. Contagion is modeled by making P, the parametric measure of the needed liquidity assistance in one country, a function of the value of liquidity assistance in the other country. Formally, P2 is a function of P1, that is, P2 = z(P1). 21. Table III.1 summarizes the results of the model using the numerical solution. It is assumed that the original shock starts in country 1. To read the table, each scenario includes the following information: (i) if country 1 faces a shock, P1 > 1; (ii) if contagion occurs to country 2, both P1 and P2 are bigger than 1; (iii) if a country exercises its veto power, the heading of the column reads “veto,” and “no veto” otherwise; and (iv) a country defines its reservation utility level as α = 0.10.

38
Table III.1. Numerical Simulation of the Liquidity Assistance Model
Source: Authors’ calculations. 22. Table III.1 evaluates liquidity assistance in the presence of a shock, in the case where the unaffected country exercises its veto power, in the case of contagion, and where there is veto power in the presence of contagion, as follows:
Effect of a shock. Compare columns “no shock/no veto” with “shock/no veto”: Country 1 receives liquidity assistance from the central bank after experiencing a shock (domestic credit x1 increases from 0.25 to 0.96). The exchange rate risk increases (h(ε) rises from 0.25 to 1.04), so country 2 reduces its own use of the domestic credit of the central bank (x2 declines from 0.25 to 0.06) to ameliorate the cost created by the higher exchange rate risk. The utility for country 1, L1, is highly positive due to the high value it gives to credit (P1 rises from 1 to 4) while L2, the utility for country 2, declines from 0.25 to -0.80, due to the higher devaluation risk. Hence, the central bank will honor the request of country 1 for liquidity assistance, but at a cost of higher devaluation risk for both countries.
Effect of veto. Compare columns “shock/no veto” with “shock/veto”: Country 2, using
its veto power, limits the amount of the emergency liquidity that the central bank provides to country 1 despite the shock experienced by this country (central bank credit x to country 1 declines from 0.96 to 0.39). By restricting the access to emergency liquidity, country 2 controls the exchange rate risk (h(ε) declines from 1.04 to 0.33). The key feature is that if country 2 has the possibility of a veto, it will exercise it when its utility reaches its predetermined lower limit. Hence, the central bank may not support the request of country 1 for liquidity assistance.
Two Countries No shock Shock Shock Shock-No Veto Shock-Veto No Veto No Veto Veto Contagion Contagion
Domestic credit country 1, x1 0.25 0.96 0.39 0.86 0.70
Domestic credit country 2, x2 0.25 0.06 0.19 0.22 0.27
Total credit, xt = x1+x2 0.50 1.02 0.58 1.08 0.97
Exchange rate risk, h(ε) 0.25 1.04 0.33 1.16 0.93
Utility country 1, L1 0.25 2.88 2.16 2.55 2.41
Utility country 2, L2 0.25 -0.80 0.10 -0.23 0.10
Shock country 1, P1 1 4 4 4 4 Shock country 2, P2 1 1 1 2 2

39
Effect of contagion. Compare columns “shock/no veto” with “shock/no veto/contagion.” Contagion weakens the veto power because both countries will benefit from the central bank’s liquidity assistance. Now that country 2 is also affected by contagion, it will be willing to bear the costs associated with the devaluation risk in order to have access to the central bank’s credit line. Consequently, the central bank’s total liquidity assistance increases from 1.02 to 1.08. Due to contagion, country 2 is also requesting the central bank’s emergency lending, and as a result ends up with negative utility (L2 = -0.23) that is nonetheless higher than when compared with the “shock/no veto” case (L2 = -0.80). Hence, in the case of contagion, both countries receive more central bank liquidity assistance, but at the cost of a higher devaluation risk.
Effect of a veto in the presence of contagion. Compare columns “ shock/no
veto/contagion ” with “shock/veto/contagion.” Country 1 scales down its access to the central bank’s liquidity assistance because country 2 exercises its veto power to protect its utility level. However, country 2, facing contagion from country 1, softens its constraints relative to the case of no contagion to allow both countries to have greater access to the central bank’s liquidity assistance (xt = 0.97 compared with xt = 0.58 in the case of “shock/veto”). Hence, both countries benefit from the central bank’s liquidity assistance in the presence of contagion, but with some limitation because country 2 exercises its veto power; devaluation risk is higher compared to the case of no contagion.
Access to international capital markets 23. Accessing international capital markets improves the utility of both liquidity-constrained and unconstrained countries. Access to the international capital market is represented by the term c in equation (5), with its respective interest rate i. Accordingly, this amount increases the availability of credit for the country experiencing the shock f (x+c), but does not affect the devaluation risk because it does not create a disequilibrium between central bank international reserves and base money. The extended model is determined by the following equations:
1 1 1 1 1 2 2 2 2 2 3( ) ( ) [ ( ) ( ) ]L P f x c h ic f x h cε λ ε α λ= + − − + − − + (5)
2 2 2 2 2 1 1 1 1 1( ) ( ) [ ( ) ( ) ]L P f x h f x hε λ ε α= − + − − . (6) 24. Table III.2 shows the results of the numerical solution based on the extended model:
Effect of a foreign credit line. This exercise compares the results of columns “no contagion/no veto” with “no contagion/veto/FCL.” In the case of “no contagion/veto/FCL,” country 2 exercises its veto power to protect its utility. Country 1

40
reacts by borrowing from the capital markets (c rises from 0 to 0.44) and simultaneously reduces its borrowing from the central bank (x1 falls from 0.96 to 0.39). Hence, the total amount of credit remains constant at 1.02. The key outcome is that the foreign credit allows a reduction in the exchange rate risk (h(ε) declines from 1.04 to 0.33). As a result, the combined utility level rises (L1+L2 = 2.45) and surpasses the utility level reached when the currency union has to rely exclusively on the veto power of country 2 to control the exchange rate risk (as shown in the column of “no contagion/veto” (L1+L2 = 2.26). This case suggests that countries should have a solid fiscal position. The troubled country knows that the unaffected country may block its request for central bank liquidity assistance and therefore will depend on its own resources to address the liquidity challenge. A solid fiscal position for the troubled country would allow it to access international capital markets to provide liquidity to its financial sector.
Effect of foreign credit line in the presence of contagion. This exercise compares the
results of columns “contagion/veto/FCL” with “no contagion/veto/FCL.” Contagion gives incentives to both countries to request the central bank’s liquidity assistance, and to tolerate a higher devaluation risk (xt = x1+x2+c increases from 1.02 to 1.10 while h(ε) increases from 0.33 to 0.93). However, with easier accessibility to domestic resources countries have less incentive to borrow from international capital markets (c amounts to 0.13 in column “contagion/veto/FCL” which is lower than 0.44 in column “no contagion/veto/FCL”). The higher devaluation risk arises from larger reliance on domestic resources, and the marginal use of foreign credit to address a liquidity shock. The implication is that the currency union’s institutional arrangement of the veto power may not be enough to protect the currency union from exchange rate pressures in the case of a shock with contagion.
Table III.2. Liquidity Assistance Model—Including Foreign Credit Line (FCL)
Source: Authors’ calculations.
Two Countries ________No Contagion ______ ___________Contagion_________ No Veto Veto Veto-FCL No Veto Veto Veto–FCL
Domestic credit country 1, x1 0.96 0.39 0.39 0.86 0.70 0.70 Domestic credit country 2, x2 0.06 0.19 0.19 0.22 0.27 0.27 Foreign credit country 1, c 0 0 0.44 0 0 0.13 Total credit, xt = x1+x2+c 1.02 0.58 1.02 1.08 0.97 1.10 Exchange rate risk, h(ε) 1.04 0.33 0.33 1.16 0.93 0.93 Utility country 1, L1 2.88 2.16 2.35 2.55 2.41 2.72 Utility country 2, L2 -0.80 0.10 0.10 -0.23 0.10 0.10 Total utility, L1+L2 2.08 2.26 2.45 2.32 2.41 2.82 Shock country 1, P1 4 4 4 4 4 4 Shock country 2, P2 1 1 1 2 2 2

41
E. Conclusions
25. Exchange rate risk may prevent liquidity assistance where two countries pool their international reserves in a common central bank. A country that experiences a shock seeks emergency liquidity from the central bank, and in so doing is willing to tolerate higher exchange rate risk. The higher exchange rate risk which arises from liquidity assistance automatically spreads to the other country. However, higher devaluation risk may be unacceptable to the other country, and it vetoes the possibility of granting emergency credit to the troubled country. The veto power is exercised when the utility of the unaffected country falls below the reservation utility level. 26. In the case of contagion, common banking problems weaken the opposition to blocking liquidity assistance. As the unaffected country softens its veto power, the central bank may provide emergency liquidity assistance to both countries, despite the heightened exchange rate risk. 27. A stronger fiscal position enables liquidity assistance in the case of a country-specific shock as well as in the case of contagion. In both cases, access to foreign credit support depends on fiscal sustainability. However the rationale for foreign credit support is different. In a country-specific shock the need for foreign credit arises because the unaffected country in a currency union exercises its veto power and blocks the provision of emergency liquidity by the central bank. The troubled country has to resolve the crisis using its own resources and therefore needs to strengthen its fiscal balances. In the case of contagion the sustainability of the exchange rate of the currency union depends on accessing foreign credit. Accordingly, currency union members have an incentive to increase their creditworthiness by strengthening their fiscal positions.

42
REFERENCES Camilleri, M., 2004, “An Institutional Framework for Comparing Emerging Market Currency
Boards,” IMF Working Paper WP/04/180 (Washington DC: International Monetary Fund).
Financial Stability Assessment, 2004, “Eastern Caribbean Currency Union,” IMF Country
Report No. 04/293, (Washington DC: International Monetary Fund). Fischer, S., 1999, “On the Need of an International Lender of Last Resort”, Journal of
Economic Perspectives, Vol. 13, pp. 85–104. Freixas, X., C. Giannini, G. Hoggarth, and F. Soussa, 1999, “Lender of Last Resort: A Review
of the Literature”, Financial Stability Review, Vol. 7, pp. 151–67. Freixas, X., B. Parigi, and J.C. Rochet, 2003, “The Lender of Last Resort: A 21st Century
Approach,” Working Paper No. 298 (Frankfurt: European Central Bank). Flood, R., and N. Marion, 1999, “Perspectives on the Recent Currency Crisis Literature,”
International Journal of Finance and Economics, Vol. 4, pp. 1–26. Garcia, G., and E. Plautz, 1988, The Federal Reserve. Lender of Last Resort. (Cambridge:
Ballinger Publishing Company). He, D., 2000, “Emergency Liquidity Support Facilities,” IMF Working Paper WP/00/79
(Washington DC: International Monetary Fund). Ho, C., 2002, “A Survey of Institutional and Operational Aspects of Modern-Day Currency
Boards,” Working Paper No. 100 (Basel: Bank of International Settlements). Hoelscher, D., and M. Quintyn, 2003, “Managing Systemic Banking Crises,” Occasional
Paper 224 (Washington DC: International Monetary Fund). Krugman, P., 1979, “A Model of Balance of Payments Crisis”, Journal of Money, Credit and
Banking, Vol. 11, pp. 311–25. Laurens, B.J., 2005, “Monetary Policy Implementation at Different Stages of Market
Development,” Occasional Paper 244 (Washington DC: International Monetary Fund). Persson, T., and G. Tabellini, 2002, Political Economics: Explaining Economic Policy
(Cambridge MA: MIT Press). Schinasi, G.J., 2006, Safeguarding Financial Stability: Theory and Practice. (Washington
DC: International Monetary Fund).

43
IV. HOW VULNERABLE IS THE EASTERN CARIBBEAN CURRENCY UNION TO A BANKING CRISIS? 26
A. Introduction 1. Over recent decades, the ECCU banking system has weathered numerous shocks, including: economic downturns associated with natural disasters, shocks to tourism, and sharp deteriorations in the terms of trade; and significant exposures to their fiscally-weak governments. Despite continuing vulnerability, the ECCU has not experienced a banking crisis—a natural question is from where does the stability of the ECCU banking system arise?
2. This chapter uses a binary classification tree (BCT) technique—a relatively new approach for assessing economic crises—to identify the factors underpinning the stability of the ECCU banking system. The BCT sifts through the database of explanatory variables and identifies the key indicators underlying a banking crisis, the threshold values beyond which these indicators signal a higher probability of crisis, and the sequence of conditions that together increase “crisis proneness” (Brieman and others, 1984). The results of the model provide insight into the stability of the banking system in the ECCU.
B. Empirical Literature and Methodology
3. Two estimation techniques have been predominantly used in the empirical literature to analyze banking crises: the signals approach, and the limited dependent variable approach.27 The signals approach—used by Kaminsky and Reinhart (1999, henceforth KR) to analyze “twin crises” or the occurrence of both currency and banking crises—is a bivariate approach that compares individual economic indicators for periods before and after a crisis, and identifies individual variables that most usefully signal an impending crisis based on crossing certain threshold values. Alternatively, the limited dependent variable model is a multivariate approach that computes the probability of a banking crisis using a logit or probit regression, as undertaken by Demirgüc and Detragiache (1998, henceforth DD).
4. The literature has established some common patterns associated with banking crises. For instance, both DD and KR find that banking crises are caused by: (i) output shocks (growth slowdown, or declining terms of trade); (ii) financial liberalization (proxied by rapid credit growth and rising cost of credit); and (iii) increasing external vulnerability
26 Prepared by Rupa Duttagupta and Paul Cashin.
27 See Gaytan and Johnson (2002), and Demirgüc and Detragiache (2005) for comprehensive overviews of the banking crisis literature.

44
(e.g., decline in export growth, an overvalued exchange rate, or declining foreign currency reserves).
5. However, important differences still exist on the accepted factors underpinning banking crises. For instance, while KR and DD find that banking crises are associated with rising interest rates, Rossi (1999) in his analysis of 15 developing countries during 1990–97 finds the opposite result. Similarly, Gavin and Hausman (1996) in their study of Latin America argue that lending booms are significant in setting the stage for banking crises, while Caprio and Klingebiel (2002) find no evidence to support this thesis.
6. The BCT approach used in this chapter provides a fresh perspective on banking crises, has some distinct advantages over existing estimation techniques, and is able to shed light on the above tensions in the literature.28 One prominent advantage of a BCT is that it does not require any assumptions about the underlying functional form of the model, which all regression models need to assume despite the fact that well-established relationships between explanatory variables are generally absent, particularly during crises. Moreover, the BCT is useful in uncovering nonlinearities, which is generally very difficult to establish with standard regression models. In particular, the BCT recognizes the fact that an indicator may trigger banking crises only after crossing a certain threshold and/or in combination with other vulnerabilities, while it could be relatively harmless in other situations. Thus for instance, as found in this chapter, rapid credit growth by itself may not be harmful for banks unless it reduces bank liquidity, and this occurs in combination with other vulnerabilities, such as high exposure to foreign exchange risk.
7. The BCT technique works in the following manner. Starting with the whole sample or the parent node (see Figure IV.1 which is also discussed in more detail below), the model compares all candidate variables at all possible threshold values and selects an indicator (and a particular threshold) which is best able to split the sample into a “purer” sub-sample or sub-sample where the probability of crises increases significantly compared with the sample average. The process repeats itself at each sub-sample (or child node) until further splitting is stopped or impossible. The latter happens when all the cases in that particular node are of the same outcome or there is only one case in the node. In general however, the tree size is determined in terms of the trade-off between the cost of growing (proportional to the number of nodes) and gains from improving the in-sample fit of the tree (proportional to reducing the rate of misclassification for the outcome). The model also ranks the indicator variables in terms of their ability to distinguish crisis from noncrisis observations. 29
28 The BCT model has been used to analyze: currency crises by Ghosh and Ghosh (2002) and Frankel and Wei (2004); debt crises by Manasse and Roubini (2005); and capital account crises by Chamon, Manasse and Prati (2006). To the authors’ knowledge, this is the first study to use a BCT to analyze banking crises.
29 For more details see Duttagupta and Cashin (2008).

45
8. To summarize, the BCT provides the following key information about the banking crises in the sample: (i) the indicators that are important precursors to banking crises; (ii) the threshold values of the indicators beyond which the probability of a banking crisis increases; and (iii) the complex combination of relationships between the indicators that need to hold for a terminal node of the tree to become “crisis-prone.”
C. Data
9. The sample comprises annual observations from 50 emerging market and developing countries, including the Caribbean, during 1990–2005.30 A banking crisis is defined as an episode involving banking sector problems that causes exhaustion of much of the capital and/or closure, merger, large-scale nationalization of banks; or extensive bank runs; or liquidity support by the central bank to avoid a run on deposits.31 Using these criteria, 127 annual crisis observations are identified, comprising 38 crisis episodes (Table IV.1).
10. The Caribbean region has generally been resilient to banking crises. 19 out of the 50 countries in the sample did not experience any systemic banking crisis during 1990–2005, of which 10 are from the Caribbean (including all six Fund-member ECCU countries). The only Caribbean countries that experienced banking crises were: Dominican Republic (2003–05), Guyana (1993–95), and Jamaica (1994–2000). Hence, identifying the factors underpinning banking system stability is relevant not just for the ECCU, but also the Caribbean as a whole.
11. The explanatory variables used in the analysis proxy for macroeconomic fundamentals (external environment, monetary conditions, and financial sector health), and are drawn largely from the existing crisis literature:
• Macroeconomic fundamentals: (i) Real GDP growth; (ii) inflation; (iii) nominal exchange rate depreciation; and (iv) the overall fiscal balance (ratio to GDP). A slowdown in economic activity could hurt banks by reducing loan quality. High inflation, besides causing macroeconomic instability, could decrease the real return on assets. Nominal depreciation can be debilitating in combination with exposure to foreign exchange risk. Fiscal weakness would generally increase the vulnerability of
30 These countries are Antigua and Barbuda, Argentina, The Bahamas, Barbados, Belize, Bolivia, Brazil, Bulgaria, Chile, China, Colombia, Costa Rica, Croatia, Czech Republic, Dominica, Dominican Republic, Ecuador, Egypt, El Salvador, Grenada, Guatemala, Guyana, India, Indonesia, Israel, Jamaica, Jordan, Kenya, Korea, Lebanon, Malaysia, Mexico, Nicaragua, Nigeria, Papua New Guinea, Paraguay, Peru, Philippines, Poland, South Africa, Sri Lanka, St. Kitts and Nevis, St. Lucia, St. Vincent and the Grenadines, Tanzania, Thailand, Trinidad and Tobago, Turkey, Uruguay, and Venezuela. Haiti and Suriname, two Caribbean countries, could not be included in the analysis due to lack of data.
31 The data for banking crises draws from three sources: Caprio and Klingebiel (2002), Kaminsky and Reinhart (1999), and Carstens, Hardy, and Pazarbasioglu (2004).
46
banks that are exposed to the government, and also limits the fiscal space needed to resolve a relatively nonsystemic banking problem.
• External liquidity: (i) Growth of exports of goods and services; (ii) terms of trade (TOT) growth; and (iii) official reserve cover of broad money. Export and TOT growth influence economic growth and hence banking system performance. Also, if banks intermediate credit to exporters, poor export performance can adversely affect banks even if overall economic growth is unaffected. The level of official foreign reserves measures the extent to which banking crises occur due to the inability of monetary authorities to contain a turnaround of capital inflows.
• Monetary conditions: (i) Real private credit growth; (ii) real domestic interest rate; (iii) foreign interest rate given by U.S. one-month LIBOR; (iv) de facto exchange rate regime; and (v) existence of deposit insurance. Excessive credit growth can trigger bank problems by squeezing bank liquidity (see below) and/or by deterioration of asset quality. Rising interest rates can compress bank profitability. The de facto exchange rate regime controls for whether banking system problems stem from an implicit or explicit exchange rate guarantee provided by the exchange rate regime. The impact of deposit insurance on the probability of crisis is ambiguous (as discussed by DD)—on the one hand, deposit insurance should strengthen the capacity to withstand bank runs; on the other hand it can induce moral hazard problems.
• Financial soundness indicators: (i) Capital adequacy (bank equity over assets); (ii) asset quality (share of nonperforming loans in total loans); (iii) bank liquidity (ratio of private credit to deposits); and (iv) profitability (proxied by interest rate spread and the pre-tax return over average assets). These variables measure the overall health of the banking system. Vulnerability to foreign currency (FC) risk is measured by (v) the ratio of net foreign assets (NFA) to GDP; and (vi) the ratio of FC deposits to official FC reserves. NFA positions have information on whether banking crises are caused by large net open FC positions (i.e., negative NFA). However, even if the banking system is well balanced in its FC operations, FC risk may still materialize owing to maturity mismatches, and hence it might be prudent to also monitor the evolution of FC liabilities in particular. Thus, the ratio of FC deposits to official reserves is used as a proxy for the risks posed by FC liabilities, or the dollarization-induced liquidity risk of monetary authorities.32
32 For ECCU countries, this variable is measured as the ratio of foreign currency deposits in the banking system over the imputed official reserves for each country. However, the results (the baseline tree) are not affected if the indicator is expressed in terms of total pooled official reserves for every ECCU country.

47
D. Empirical Results
12. The baseline BCT model identifies macroeconomic instability, low profitability, and high foreign exchange risk as the most important precursors to banking crisis (Figure IV.1). The model has a good in-sample fit—it is able to correctly signal all but one crisis episode (97 percent), and has false signals for 19 percent of the noncrisis outcomes. The following conditions are identified as crisis prone:
• Macroeconomic instability, given by inflation higher than 19 percent, combined with TOT growth less than 3.3 percent, increases the conditional probability of crisis from 5.3 percent to 21.4 percent (node 1). Two of the three Caribbean countries that experienced banking crises belong to this node (Guyana (1993), and Jamaica (1994)).
• Low interest profitability (interest rate spread less than 3.1 percent) with modest export growth (less than 11.8 percent) increases the conditional probability of crisis from 5.3 percent to 21 percent (node 2).
• High foreign exchange exposure combined with high nominal depreciation (FC deposits to official FC reserves more than 140 percent and nominal depreciation more than 9 percent, as in node 3), has a conditional crisis probability of 25 percent and contains the 2003 banking crisis in the Dominican Republic (2003). Another condition (terminal node 4) that also signals crisis-proneness is the combination of high foreign exchange exposure with low banking system liquidity due to a very high share of private credit to deposits (more than 150 percent). The conditional crisis probability is 100 percent, although now there is only one remaining crisis case in this terminal node. 33
13. The above results stress that exchange rate and inflation stability have been critical to banking system stability in the ECCU and other Caribbean countries. Of the 19 candidate indicator variables, the BCT ranked the following variables as key in terms of their importance as precursors to banking crises: (i) nominal depreciation, (ii) interest profitability, (iii) inflation, (iv) FC exposure, and (v) bank liquidity. It is interesting to note that the 10 Caribbean countries that did not experience banking crises have so far successfully maintained exchange rate pegs (except Trinidad and Tobago), which have helped maintain low or no nominal depreciation and relatively low inflation.
14. While some ECCU countries have experienced periods of bank stress, these vulnerabilities were not intense enough to trigger banking crises. Table IV.2 shows how each of the key banking crisis predictors identified by the BCT model (Figure IV.1) behaved
33 The baseline model is subject to several robustness checks, including an alternative specification in which the BCT model is run on a sample that excludes the Caribbean countries (see Duttagupta and Cashin, 2008 for details). When the results of the alternative model are applied to the Caribbean, the model correctly predicts the banking crisis in all three Caribbean countries.

48
in the ECCU countries since 1990. The region never experienced any exchange rate or inflation-induced instability, thanks to the regional quasi-currency board arrangement. Also, ECCU bank profitability has generally been high (see also Chai, 2006). At the same time, some ECCU countries experienced vulnerabilities in the form of high FC risk (St. Kitts and Nevis), and low bank liquidity (St. Lucia), which did not occur in combination with other vulnerabilities and hence these conditions were not crisis-prone.
15. However, the ECCU banking system should be closely monitored, given increasing foreign currency exposures and declining liquidity levels. In particular, the ECCB should ensure that the explicit exchange rate guarantee provided by the quasi-currency board does not induce an unmanageable build-up of FC risk, which could then undermine the stability of the currency board. The dollarization level in St. Kitts and Nevis has exceeded levels in other emerging market countries that experienced banking crises in recent years (see Table IV.3). Similarly, while rapid credit growth in the ECCU in 2006 has generally mirrored its strong economic growth, it is important to ensure that this does not compromise bank liquidity in a manner similar to the liquidity squeeze experienced in international financial markets in late 2007.
E. Conclusion
16. This chapter corroborates the importance of the quasi-currency board arrangement in upholding the stability of the ECCU banking system. In particular, the ECCU countries have enjoyed exchange rate and price stability—identified as important prerequisites for banking system stability—thanks in large part to the quasi-currency board arrangement.
17. However, the stability of the ECCU banking system to date should not engender any complacency regarding its robustness. Some ECCU countries have experienced bank vulnerabilities—the banking system in St. Kitts and Nevis assumed high foreign currency risk during the sample period, but without any serious repercussions given the stable EC dollar peg. Similarly, liquidity levels in the St. Lucia banking system have declined considerably in recent years. These findings stress that even though the ECCU banking system has been stable, it should continue to be monitored carefully.

49
Sou
rce:
Aut
hors
’ cal
cula
tions
.
Arg
entin
a (9
0), B
razi
l (90
, 94)
, Bul
garia
(96)
, C
olom
bia
(99)
, Ecu
ador
(96)
, Guy
ana
(93)
, Ja
mai
ca (9
4), J
orda
n (9
0), K
enya
(92)
, Leb
anon
(90)
, M
exic
o (9
2), N
icar
agua
(90)
, Nig
eria
(93)
, Per
u (9
3),
Pol
and
(91)
, Tan
zani
a (9
0), T
urke
y (9
1, 9
4, 0
0), a
ndV
enez
uela
(93)
.
Arg
entin
a (9
4, 0
1), C
hina
(99)
, Ind
ones
ia (9
2, 9
7)K
orea
(97)
, Sri
Lank
a (9
0), M
alay
sia
(97)
, and
Thai
land
(97)
.
Bol
ivia
(94)
, Cze
ch R
epub
lic (9
1), T
he D
omin
ican
Rep
ublic
(03)
, Nic
arag
ua (0
0), T
he P
hilip
pine
s (9
8),
and
Uru
guay
(02)
.
Cro
atia
(96)
Figu
re IV
.1. B
inar
y C
lass
ifica
tion
Tree
, Bas
elin
e M
odel
, 199
0–20
05
Tota
l obs
. 711
No.
of c
risis
38
Pro
b. o
f cris
is 5
.3%
Is in
flatio
n ≤
18.7
%
Yes
No
Tota
l obs
. 137
No.
of c
risis
22
Pro
b. o
f cris
is 1
6.1%
Is T
OT
grow
th ≤
3.3
%
Tota
l obs
. 574
No.
of c
risis
16
Pro
b. o
f cris
is 2
.8%
Is in
tere
st ra
te m
argi
n ≤
3.1%
Term
inal
nod
e 1
Tota
l obs
. 98
No.
cris
is 2
1P
rob.
of c
risis
21.
4%
Cris
is-p
rone
Tota
l obs
. 39
No.
of c
risis
1P
rob.
of c
risis
2.6
%
Not
cris
is-p
rone
Yes
No
Yes
No To
tal o
bs. 5
04N
o. o
f cris
is 7
Pro
b. o
f cris
is 1
.4%
Are
FX
depo
sits
≤
140%
of o
ffici
al F
X
Yes
No
Tota
l obs
. 90
No.
of c
risis
7P
rob.
of c
risis
7.8
%Is
nom
inal
de
prec
iatio
n ≤
9.1%
Yes
No Te
rmin
al n
ode
3To
tal o
bs. 2
4N
o. o
f cris
is 6
Pro
b. o
f cris
is 2
5%
Cri
sis-
pron
e
Tota
l obs
. 66
No.
of c
risis
1P
rob.
of c
risis
1.5
%
Is Il
liqui
dity
(cre
dit-t
o-de
posi
ts) ≤
150%
Yes
No
Tota
l obs
. 65
No.
of c
risis
0P
rob.
of c
risis
0%
Not
cris
is-p
rone
Term
inal
nod
e 4
Tota
l obs
. 1N
o. o
f cris
is 1
Pro
b. o
f cris
is 1
00%
Cris
is- p
rone
Tota
l obs
.70
No.
of c
risis
9P
rob.
of c
risis
12.
9%
Is e
xpor
t gro
wth
≤ 1
1.8%
Yes
No
Term
inal
nod
e 2
Tota
l obs
. 43
No.
of c
risis
9P
rob.
of c
risis
20.
9%
Cris
is- p
rone
Tota
l obs
. 27
No.
of c
risis
0P
rob.
of c
risis
0%
Not
cris
is-p
rone
Tota
l obs
. 414
No.
of c
risis
0P
rob.
of c
risis
0%
Not
cris
is-p
rone

50
Country Crisis Episodes Average Years in Crisis
Argentina 1990, 1994–95, 2001–02 1.7Bolivia 1994–95 2Brazil 1990, 1994–99 3.5
Bulgaria 1996–97 2China 1999 1
Colombia 1999–00 2Croatia 1996 1
Czech Republic 1991–95 5Dominican Republic 2003–05 2
Ecuador 1996–02 7Guyana 1993–95 3
Indonesia 1992,1997–02 3.5Jamaica 1994–00 7Jordan 1990 1Kenya 1992–95 4Korea 1997–02 6
Lebanon 1990 1Malaysia 1997–01 5Mexico 1992–97 6
Nicaragua 1990–96, 2000–01 4.5Nigeria 1993–95 2
Paraguay 1995–00 5Peru 1993–94 2
Philippines 1998–03 6Poland 1991–95 5
Sri Lanka 1990–93 1Tanzania 1990–91 2Thailand 1997–02 6Turkey 1991, 1994, 2000–02 1.7
Uruguay 2002–03 2Venezuela 1993–95 3
Sources: Caprio and Klingebiel (2002), Carstens and others (2004); and Kaminsky and Reinhart (1996).
Table IV.1. Banking Crisis Episodes During 1990–2005
Note: Countries with no crisis during the sample period—Antigua and Barbuda, The Bahamas, Barbados, Belize, Chile, Costa Rica, Dominica, Egypt, El Salvador, Grenada, Guatemala, India, Israel, Papua New Guinea, South Africa, St. Kitts and Nevis, St. Lucia, St. Vincent and the Grenadines, Trinidad and Tobago.
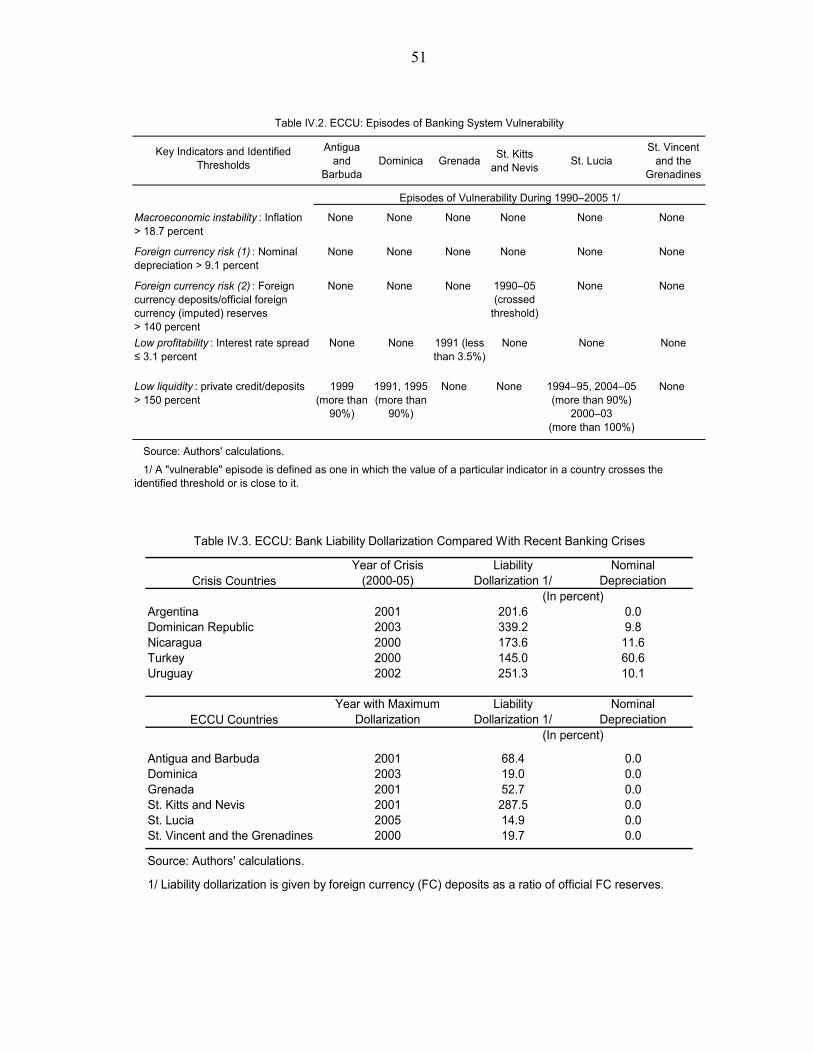
51
Key Indicators and Identified Thresholds
Antigua and
BarbudaDominica Grenada St. Kitts
and Nevis St. LuciaSt. Vincent
and the Grenadines
Macroeconomic instability : Inflation > 18.7 percent
None None None None None None
Foreign currency risk (1) : Nominal depreciation > 9.1 percent
None None None None None None
Foreign currency risk (2) : Foreign currency deposits/official foreign currency (imputed) reserves > 140 percent
None None None 1990–05(crossed
threshold)
None None
Low profitability : Interest rate spread ≤ 3.1 percent
None None 1991 (less than 3.5%)
None None None
Low liquidity : private credit/deposits > 150 percent
1999(more than
90%)
1991, 1995(more than
90%)
None None 1994–95, 2004–05(more than 90%)
2000–03(more than 100%)
None
Source: Authors' calculations.
Episodes of Vulnerability During 1990–2005 1/
Table IV.2. ECCU: Episodes of Banking System Vulnerability
1/ A "vulnerable" episode is defined as one in which the value of a particular indicator in a country crosses the identified threshold or is close to it.
Crisis CountriesYear of Crisis
(2000-05)Liability
Dollarization 1/Nominal
Depreciation
Argentina 2001 201.6 0.0Dominican Republic 2003 339.2 9.8Nicaragua 2000 173.6 11.6Turkey 2000 145.0 60.6Uruguay 2002 251.3 10.1
ECCU CountriesYear with Maximum
DollarizationLiability
Dollarization 1/Nominal
Depreciation
Antigua and Barbuda 2001 68.4 0.0Dominica 2003 19.0 0.0Grenada 2001 52.7 0.0St. Kitts and Nevis 2001 287.5 0.0St. Lucia 2005 14.9 0.0St. Vincent and the Grenadines 2000 19.7 0.0
Source: Authors' calculations.
1/ Liability dollarization is given by foreign currency (FC) deposits as a ratio of official FC reserves.
(In percent)
(In percent)
Table IV.3. ECCU: Bank Liability Dollarization Compared With Recent Banking Crises

52
REFERENCES Breiman, L., J. Friedman, R. Olshen, and C. Stone, 1984, Classification and Regression
Trees (London: Chapman and Hall). Caprio, G., and D. Klingebiel, 2002, “Episodes of Systemic and Borderline Financial
Crises,” working paper and database, World Bank website, periodically updated. Carstens, A.G., D.C. Hardy, and C. Pazarbasioglu, 2004, “Avoiding Banking Crises in Latin
America,” International Monetary Fund, Finance and Development (September). Chai, J., 2006,“The Eastern Caribbean Currency Union Banking System in a Time of Fiscal
Challenge,” in R. Sahay, D.O. Robinson, and P. Cashin (eds). The Caribbean: From Vulnerability to Sustained Growth (Washington DC: International Monetary Fund), pp. 143–80.
Chamon, M., P. Manasse and A. Prati, 2006, “Can We Predict the Next Capital Account
Crisis?” Presented at the 7th Jacques Polak Annual Research Conference at the International Monetary Fund, Washington D.C.
Demirgüc-Kunt, A. and E. Detragiache, 1998, “The Determinants of Banking Crises in
Developing and Developed Countries,” IMF Staff Papers, Vol. 45, pp. 81–109. _____________, 2005, “Cross-Country Empirical Studies of Systemic Bank Distress: A
Survey,” IMF Working Paper WP/05/96 (Washington DC: International Monetary Fund).
Duttagupta, R., and P. Cashin, 2008, “Anatomy of Banking Crises,” International Monetary
Fund, Working Paper (forthcoming). Frankel, J.A., and S. Wei, 2004, “Managing Macroeconomic Crises,” NBER Working Paper
10907 (Cambridge MA: National Bureau of Economic Research). Gavin, M., and R. Hausman, 1996, “The Roots of Banking Crises: the Macroeconomic
Context,” manuscript. Gaytán, A., and C.A. Johnson, 2002, “A Review of the Literature on Early Warning Systems
for Banking Crises,” Working Paper No. 183 (Santiago: Central Bank of Chile). Ghosh, S., and A. Ghosh, 2002, “Structural Vulnerabilities and Currency Crises,” IMF
Working Paper WP/02/9 (Washington DC: International Monetary Fund).

53
Kaminsky, G.L., and C.M. Reinhart, 1999, “The Twin Crises: Causes of Banking and Balance-Of-Payments Problems,” The American Economic Review, Vol. 89, pp. 473−500.
Manasse, P., and N. Roubini, 2005, “Rules of Thumb for Sovereign Debt Crises,” IMF
Working Paper WP/05/42 (Washington DC: International Monetary Fund). Rossi, M., 1999, “Financial Fragility and Economic Performance in Developing Countries:
Do Capital Controls, Prudential Regulation and Supervision Matter?,” IMF Working Paper WP/99/66 (Washington DC: International Monetary Fund).

54
V. TOURISM DEMAND IN SMALL-ISLAND ECONOMIES34
A. Introduction
1. The tourism sector has become an important source of output growth and foreign exchange earnings in the ECCU region. Estimates suggest that a 1 percent increase in tourist arrivals in the ECCU is associated with about ½ of 1 percent increase in real GDP. In addition, tourism receipts represented the equivalent of over 80 percent of GDP during 1996–2005, while about 60 percent of FDI in the region has been concentrated in the tourism sector.
2. While world tourism has been increasing sharply, the ECCU’s share has declined. In particular, the ECCU’s share of the Caribbean market declined by 0.3 percentage points to 5.1 percent between 1996–2005. Given the significance of the sector, it is important to understand the determinants of tourism flows, in particular why some countries are successful tourism destinations, and the challenges of increasing tourism flows.
3. This chapter examines the main factors affecting tourism flows in small-island economies, using an empirical approach that accounts for the inherent heterogeneity of the tourism product and tourism consumers.35 Tourists derive different experiences from various destinations, suggesting that there may be country-specific factors that host islands could leverage to boost tourism (Papatheodorou, 2001; Zhang and Jensen, 2005). The chapter uses cross-sectional least squares analysis to examine the determinants of tourism arrivals, taking into account the country of origin of tourists. Tourism flows are grouped into country pairings—from source (tourism-originating) country to host island—in order to capture the particularities of the tourism products. The chapter then investigates the extent to which country-specific factors in both source and host countries affect tourism flows. Appendix V.1 outlines the model and country pairings.
B. Factors Affecting Tourism Flows
4. Tourism flows are affected, among other things, by real exchange rate (RER) movements, real income in tourism-source countries, and adverse shocks. Other inhibiting factors include limited air access, crime, and small hotel stock capacity. Tourism flows appear to be directly related to greater accessibility but inversely related with crime, with the exception of Grenada and St. Kitts and Nevis (Figures V.1–V.2). In addition, an increase in hotel stock capacity tends to be associated with a decline in occupancy rates, but this could reflect the delayed impact of higher hotel stock capacity on tourism flows 34 Prepared by Nkunde Mwase. 35 This is based on Durbarry (2001) and Zhang and Jensen (2005).

55
(Figure V.3). The ECCU hotel stock is large in view of its land size and the ECCU countries’ objective of becoming/remaining “niche and unique” tourist destinations (Figure V.4). In addition, tourism flows to the ECCU seem to be more volatile than in other Caribbean islands (Figure V.5).
5. The results from the cross-sectional analysis indicate, not surprisingly, that cheaper destinations (i.e., those with more depreciated RERs) and those with larger hotel room capacity tend to receive more tourists (Table V.1). Specifically, the results indicate that:
• Tourist flows in islands with a 1 percent more depreciated bilateral RER tend to be about 0.19 percent higher than in other islands, suggesting in general that tourists consider the islands as substitute destinations.
• Islands that have 1 percent higher number of rooms tend to receive about 0.9 percent more tourists, even after taking into account land size. Since hotel rooms are a proxy for the capacity of the tourism sector, this suggests that islands with more tourism capacity are more competitive.
• Countries with a 1 percent higher GDP per capita tend to have fewer tourist outflows to the Caribbean. These findings probably reflect the fact that the countries with the highest GDP per capita (Japan, Sweden and Switzerland) have typically had the lowest tourist outflows to the Caribbean.
• Country-specific factors also seem to be important, in particular, shared language areas tend to receive higher tourists. The results suggest that the ECCU islands’ smaller land size has not adversely affected tourism flows.
6. To investigate the extent to which country-specific factors affect the results, we consider the significance of these factors in individual ECCU countries. Tourism flows in the ECCU are sensitive to RER movements and increases in hotel capacity, but are generally not affected by increases in real income per capita in the source country (Table V.2). The specific results suggest that:
• A real exchange rate depreciation has a significant positive impact on tourism flows. The price elasticity ranges from 0.39 percent to 1.34 percent, and is more elastic (greater than unity) in the more established ECCU tourist destinations—Antigua and Barbuda and St. Lucia.
• An increase in real income per capita in source markets does not statistically affect tourism flows, with the exception of Grenada, and St. Vincent and the Grenadines. The latter two islands face highly elastic demand―3.82 and 1.82 percent, respectively. The statistical insignificance of tourism flows to real income per capita in some islands is probably driven by the short-run dynamics, in

56
particular, that tourism growth since the early 2000s in these islands coincided with the world recession.36
• An increase in hotel capacity has varying impact on tourism flows across countries. Capacity has a statistically negative impact on tourism flows to Grenada and St. Kitts and Nevis, and no impact on Antigua and Barbuda, Dominica and St. Vincent and the Grenadines. This could reflect lags in the impact of hotel capacity on tourism, since hotel room expansion in the ECCU countries has been supply-driven.37 Hotel capacity tends to be positively associated with tourism flows to St. Lucia.
• An increase in homicides has varying impact on tourism flows across Caribbean countries. Murders have a statistically negative impact on tourism flows to St. Lucia, and no impact on flows to Antigua and Barbuda, Dominica and Grenada. Unusually, higher homicide rates tend to be positively related with tourism flows to St. Vincent and the Grenadines and St. Kitts and Nevis—possibly reflecting the fact that the slump in tourism arrivals in the late 1990s/early 2000s coincided with a drop in homicide rates while the ensuing increase in tourism arrivals coincided with a rise in homicide rates.
7. The U.K. and U.S. are important sources of tourist flows to the ECCU region (Figure V.5). Generally, the flows from source countries differ significantly, exhibiting the following characteristics (Table V.3):
• British tourists tend to be price-insensitive but income elastic, suggesting that an increase in real income per capita has a significant impact on tourism flows but a real exchange rate depreciation does not. These findings could reflect their tendency to use vacation packages—which include hotel and flights—priced in pounds sterling as this insulates them from relative price movements. Tourism flows tend to be significantly lower in islands that have greater airlift to the U.K., probably reflecting the tendency of tour operators to use charter flights.38 An increase in hotel stock capacity does not have a significant impact on tourism flows. Previous tourism flow arrivals seem to have a negative impact on current tourism, suggesting that tourists are sensitive to their past experience on the island or prefer to visit new destinations.
• American tourists tend to be price and income-insensitive, which indicate that neither real exchange rate depreciation nor increases in real income per capita have a
36 Due to limited long-run data, the short-and-long run effects could not be decomposed.
37 Due to data constraints, only a one-year lag is considered.
38 The airlift variable used in the estimation only captures scheduled flights.

57
statistically significant effect on tourism flows. However, an increase in hotel capacity and accessibility tends to be associated with a rise in tourism arrivals from Canada and the U.S.
• The findings underscore the sensitivity of tourism flows to exogenous shocks. Terrorist attacks, such as the 9/11 attacks, and hurricanes tend to result in a decline in British tourists. However, American tourists do not seem to be sensitive to hurricanes.
C. Conclusions
8. In order to boost tourism flows, the ECCU authorities could focus on improving competitiveness, ensuring inflation stability, bolstering law enforcement, and promoting tourism-source diversification. Labor market reforms and improvements in the investment climate could enhance efficiency and help improve price competitiveness. Fiscal consolidation—particularly expenditure restraint—could help bolster inflation stability. Diversifying tourism source markets would help reduce vulnerability to shocks emanating from the source markets themselves. Improving law enforcement is also important, since a highly-publicized crime can significantly affect tourist perceptions of safety.
0
500
1,000
1,500
2,000
2,500
3,000
Puerto
Rico
Baham
as
Domini
can R
epub
lic
Cancu
n (Mex
ico)
US Virg
in Isl
ands
Jamaic
a
Bermud
aArub
a
Cayman
Islan
dsHait
i
Belize
St. Maa
rten
Barbad
os
Trinida
d and
Tobag
o
Curaca
o
St. Luc
ia
Antigu
a and
Bar
buda
Surina
me
St. Vinc
ent a
nd G
renad
ines
St. Kitts
and N
evis
St. Eus
tatius
Saba
Montse
rrat
Martin
ique
Guyan
a
Grena
da
Domini
ca
British
Virg
in Isl
ands
Bonair
e
Anguil
la0
5
10
15
20
25
30
35
40
45
Remote (no direct flight to the USA)Less remote (has direct flights to the USA)
Arrivals to-and-from the USA (left scale)
Figure V.1. Caribbean: Airlift Accessibility and Tourism Flows, 2002 1/(Number of Direct Scheduled Flights and Stay-over Tourist Arrivals to and from the USA)
Sources: Caribbean Tourism Organization; Traffic By Flight stage 2002, No. 518, International Civil Aviation organization; and U.S. Department of Transportation, Bureau of Transportation Statistics (http://www.transtats.bts.gov).
1/ No reliable data are available for the period after 2002.
Number of flights to-and-from the USA (right scale)
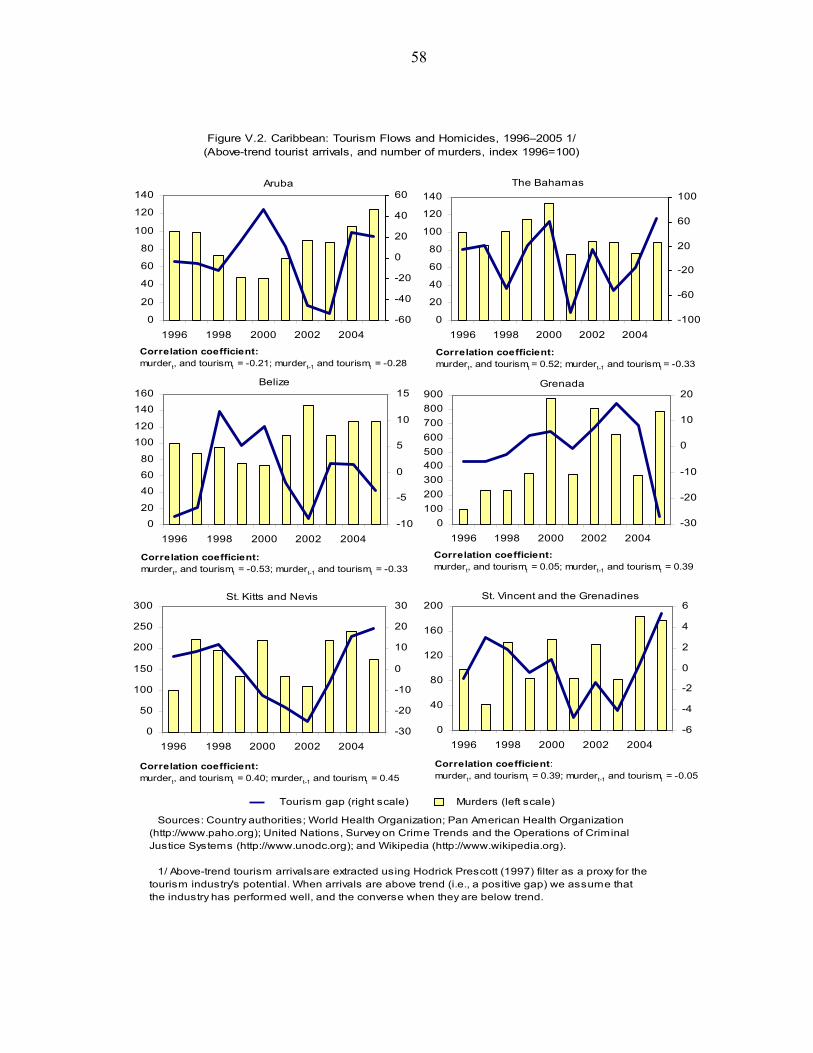
58
Figure V.2. Caribbean: Tourism Flows and Homicides, 1996–2005 1/(Above-trend tourist arrivals, and number of murders, index 1996=100)
Sources: Country authorities; World Health Organization; Pan American Health Organization (http://www.paho.org); United Nations, Survey on Crime Trends and the Operations of Criminal Justice Systems (http://www.unodc.org); and Wikipedia (http://www.wikipedia.org).
1/ Above-trend tourism arrivalsare extracted using Hodrick Prescott (1997) filter as a proxy for the tourism industry's potential. When arrivals are above trend (i.e., a positive gap) we assume that the industry has performed well, and the converse when they are below trend.
0
20
40
60
80
100
120
140
1996 1998 2000 2002 2004-60
-40
-20
0
20
40
60Aruba
Correlation coefficient:murdert, and tourismt = -0.21; murdert-1 and tourismt = -0.28
0
20
40
60
80
100
120
140
1996 1998 2000 2002 2004-100
-60
-20
20
60
100The Bahamas
Correlation coefficient:murdert, and tourismt = 0.52; murdert-1 and tourismt = -0.33
020
40
60
80
100
120
140160
1996 1998 2000 2002 2004-10
-5
0
5
10
15Belize
Correlation coefficient:murdert, and tourismt = -0.53; murdert-1 and tourismt = -0.33
0100200300400500600700800900
1996 1998 2000 2002 2004-30
-20
-10
0
10
20Grenada
Correlation coefficient:murdert, and tourismt = 0.05; murdert-1 and tourismt = 0.39
0
50
100
150
200
250
300
1996 1998 2000 2002 2004-30
-20
-10
0
10
20
30St. Kitts and Nevis
Correlation coefficient:murdert, and tourismt = 0.40; murdert-1 and tourismt = 0.45
0
40
80
120
160
200
1996 1998 2000 2002 2004-6
-4
-2
0
2
4
6St. Vincent and the Grenadines
Correlation coefficient:murdert, and tourismt = 0.39; murdert-1 and tourismt = -0.05
Tourism gap (right scale) Murders (left scale)

59
Figure V.3. Caribbean: Hotel Capacity and Occupancy Rates, 1997–2005 1/(Index 1997=100)
Sources: Country authorities; Caribbean Tourism Organization; and World Tourism Organization. 1/ Occupancy rate is defined as the number of occupied rooms as a percent of total number of rooms available for hire over a specified period. Due to data limitations the regional groups do not capture all the Caribbean islands. The regional groups are as follows: Other Commonwealth captures The Bahamas, Barbados, Belize, Bermuda, Cayman Islands, Jamaica and Trinidad and Tobago; Dutch West Indies refers to Aruba and Curacao; French West Indies refers to Martinique; U.S. Territories reflects Puerto Rico and U.S. Virgin Islands; and Other Countries refers to Cancun and the Dominican Republic.
ECCU (St Lucia)
40
60
80
100
120
140
160
180
1997 1999 2001 2003 2005
Correlation coefficient: roomst and tourismt = -0.11; roomst-1 and tourismt = -0.77
Number of hotel rooms
Hotel occupancy rates
Other Commonwealth
40
60
80
100
120
140
160
180
1997 1999 2001 2003 2005
Correlation coefficient: roomst and tourismt = -0.55; roomst-1 and tourismt = -0.69
Number of hotel rooms
Hotel occupancy rates
Dutch West Indies
40
60
80
100
120
140
160
180
1997 1999 2001 2003 2005
Correlation coefficient: roomst and tourismt = 0.82; roomst-1 and tourismt = -0.09
Number of hotel rooms
Hotel occupancy rates
French West Indies
40
60
80
100
120
140
160
180
1997 1999 2001 2003 2005
Correlation coefficient: roomst and tourismt = -0.38; roomst-1 and tourismt = -0.25
Number of hotel rooms
Hotel occupancy rates
U.S. Territories
40
60
80
100
120
140
160
180
1997 1999 2001 2003 2005
Correlation coefficient: roomst and tourismt = -0.16; roomst-1 and tourismt = -0.40
Number of hotel rooms
Hotel occupancy rates
Other Countries
40
60
80
100
120
140
160
180
1997 1999 2001 2003 2005
Correlation coefficient: roomst and tourismt = -0.51; roomst-1 and tourismt = 0.15
Number of hotel rooms
Hotel occupancy rates

60
0
10
20
30
40
50
60
70
80
90
St. Maa
rten
Bermud
aArub
a
Cayman
Islan
ds
Barbad
os
U.S. Virg
in Isl
ands
British
Virgin
Islan
ds
St. Kitts
& Nev
is
Curaca
o
Martini
que
St. Luc
ia
Antigu
a & Barb
uda
Anguil
laSab
a
St. Vinc
ent &
Gren
adine
s
Guade
loupe
Grenad
a
Bonair
e
Montse
rrat
Jamaic
a
St. Eus
tatius
Baham
as
Puerto
Rico
Domini
can R
epub
lic
Trinida
d & To
bago
Domini
caBeli
ze Haiti
Surina
me
Guyan
a
Figure V.4. Caribbean: Hotel Rooms, 2005 1/(Number of rooms per square kilometer)
Sources: Country authorities; Caribbean Tourism Organization; CIA, Factbook; Institut National de la Statistique et des Études Économiques (INSEE); World Tourism Organization; UN, World Population Prospects 2006; Caribbean Travel (http://www.caribbeantravelmag.com); Wikipedia (http://www.wikipedia.org); and Fund staff estimates.
1/ Where data in 2005 is not available, 2004 data is used.
0
2
4
6
8
10
12
14
16
18
20
0 10 20 30 40 50 60 70 80 90 100Average share of UK and US tourists
Exp
endi
ture
gro
wth
vol
atilit
y (σ
)
Antigua and Barbuda
St. Lucia
Figure V.5. Caribbean: Volatility of Expenditure and Average Share of UK and USA Tourists, 1997–2005(ECCU and five largest Caribbean destinations)
Sources: Country authorities; Caribbean Tourism Organization; and World Tourism Organization.
St. Vincent and the Grenadines
St. Kitts and Nevis
Dominica
Grenada
Dominican Republic
Cancun
The Bahamas
Jamaica
Puerto Rico

61
Dep
ende
nt v
aria
ble:
Tou
rism
arri
vals
Coe
ffici
ent 2
/P-
valu
eP-
valu
eP-
valu
eP-
valu
e
Lagg
ed re
al e
xcha
nge
rate
3/
-0.1
5**
0.01
-0.2
1**
*0.
00-0
.20
***
0.00
-0.2
1**
0.02
Hot
el c
apac
ity0.
99**
*0.
000.
96**
*0.
000.
96**
*0.
000.
88**
*0.
00R
eal G
DP
-0.1
40.
31-0
.10
0.11
-0.1
3**
0.02
-0.1
9**
0.03
Land
siz
e-0
.12
**0.
02-0
.09
**0.
06-0
.04
0.36
-0.1
10.
20D
irect
flig
hts
0.00
***
0.00
0.00
**0.
020.
00**
0.02
0.00
**0.
05D
V_La
ngua
ge2.
12**
*0.
002.
01**
*0.
002.
34**
*0.
002.
09**
*0.
00D
V_C
olon
ial
0.60
*0.
070.
92**
*0.
01-0
.88
0.10
-0.0
40.
94D
V_D
utch
-0.2
70.
390.
400.
160.
69**
0.02
0.12
0.85
DV_
Oth
er c
arib
0.25
0.37
0.55
**0.
030.
350.
160.
570.
22D
V_Fr
ench
-0.5
50.
260.
300.
460.
570.
26D
V_U
.S. t
errit
ory
-0.6
90.
17-0
.33
0.44
-0.1
40.
740.
140.
90D
V_O
ther
0.27
0.57
0.51
0.28
1.36
***
0.00
1.09
0.35
Con
stan
t1.
630.
340.
880.
430.
440.
662.
510.
17
Mem
oran
dum
item
s:N
o. o
f obs
erva
tions
227
289
284
132
R2
0.57
0.59
0.63
0.54
So
urce
: Aut
hor's
cal
cula
tions
.
Tabl
e V.
1. W
hy A
re S
ome
Des
tinat
ions
Mor
e At
tract
ive?
: Cro
ss-S
ectio
nal A
naly
sis
1/
2/
All
varia
bles
are
in lo
garit
hms
with
the
exce
ptio
n of
the
(num
ber o
f) di
rect
flig
hts
and
the
dum
my
varia
bles
(pre
-fix
"DV"
). Th
e la
st fo
ur d
umm
y va
riabl
es a
re re
gion
al d
umm
ies
to c
aptu
re th
e ex
tent
to w
hich
thes
e re
gion
s ha
ve h
ighe
r tou
rism
flow
s th
an th
e EC
CU
cou
ntrie
s.
1/
The
dat
a co
ver c
ount
ry-p
airin
gs fr
om a
bout
12
sour
ce c
ount
ries
for a
max
imum
of 3
1 de
stin
atio
n co
untri
es.
***,
** a
nd *
indi
cate
1 p
erce
nt, 5
pe
rcen
t and
10
perc
ent l
evel
s of
sig
nific
ance
, res
pect
ivel
y. S
elec
ted
year
s ar
e re
porte
d fo
r bre
vity
.
2005
2000
2004
1996
Coe
ffici
ent 2
/C
oeffi
cien
t 2/
Coe
ffici
ent 2
/
3/
Pos
itive
den
otes
an
appr
ecia
tion.

62
Depe
nden
t var
iable:
Cha
nge
in tou
rist a
rriva
ls
Coef
ficien
t 2/
P-va
lueP-
value
P-va
lueP-
value
P-va
lueP-
value
Δ Re
al ex
chan
ge ra
te (1
perio
d lag
) 3/
-1.0
4***
0.00
-0.6
7*
0.10
-0.79
***0.
00-0
.39***
0.00
-1.3
4***
0.00
-0.60
***0.
00Δ
Hotel
capa
city (
1 per
iod la
g)-0
.510.8
1-0
.27
0.58
-0.16
***0.
00-0
.88***
0.00
0.52
***0.0
00.1
10.
40Δ
Real
GDP
0.85
0.28
3.27
0.29
3.82
***0.
001.
310.
56-0
.08
0.95
1.82
***0.
00Δ
Murd
er ra
te (1
perio
d lag
)0.
08*
0.08
-0.7
9***
0.00
0.04
*0.
09DV
_Hur
rican
e-0
.30***
0.00
-0.25
***0.
00DV
_Sep
t. 11
-0.19
***0.0
00.
19***
0.00
-0.22
***0.
00-0
.05
-0.15
0.07
*0.
09Δ
Tour
ism a
rriva
ls (1
perio
d lag
)-0
.41
***0.0
0-0
.57***
0.00
-0.4
0***
0.00
Cons
tant
-0.1
2**
0.07
-0.09
***0.
000.
09**
0.01
Mem
oran
dum
item
s:No
. of o
bser
vatio
ns84
8890
4964
72Cr
oss-s
ectio
ns in
clude
d12
1212
1011
11
Wald
Χ2
66.2
1***
0.00
279.
32***
0.00
39.82
***0.
0020
0.68
***0.
0084
.87***
0.00
27.26
***0.
00
Sou
rce: A
utho
r's ca
lculat
ions.
2/ Δ
deno
tes ch
ange
. All v
ariab
les ar
e in l
ogar
ithm
s with
the e
xcep
tion
of th
e du
mm
y var
iables
(pre
-fix "
DV").
3
/ Pos
itive d
enote
s an a
ppre
ciatio
n.
Coef
ficien
t 2/
Coef
ficien
t 2/
Coef
ficien
t 2/
Coef
ficien
t 2/
Coef
ficien
t 2/
Table
V.2
. Det
erm
inant
s of T
ouris
m Flo
ws to
ECC
U Co
untrie
s: Pa
nel L
east
Squa
res 1
/
1/ T
he da
ta co
ver c
ountr
y-pair
ings f
rom
abo
ut 12
sour
ce co
untrie
s ove
r per
iod 19
96 to
2005
. The
pane
l is un
balan
ced
due t
o som
e miss
ing ob
serva
tions
. ***,
** an
d * i
ndica
te 1
perce
nt, 5
perc
ent a
nd 1
0 per
cent
levels
of si
gnific
ance
, res
pecti
vely.
All t
he re
porte
d find
ings,
with
the e
xcep
tion
of D
omini
ca, a
re b
ased
on c
ross
-sec
tiona
l tim
e se
ries u
sing
feas
ibile
least
squa
res a
llowi
ng fo
r pre
senc
e of
auto
core
lation
with
in pa
nel
and
heter
osce
dasti
city a
cros
s pan
els. D
omini
ca fin
dings
are
base
d on
Pra
is-W
insten
regr
essio
ns, w
here
pan
els ar
e co
rrecte
d fo
r with
in pa
nel A
R(1)
pro
cess
.
St.V
incen
t and
the
Gren
adine
sSt
. Kitts
and N
evis
St. L
ucia
Antig
ua a
nd B
arbu
daDo
mini
caGr
enad
a
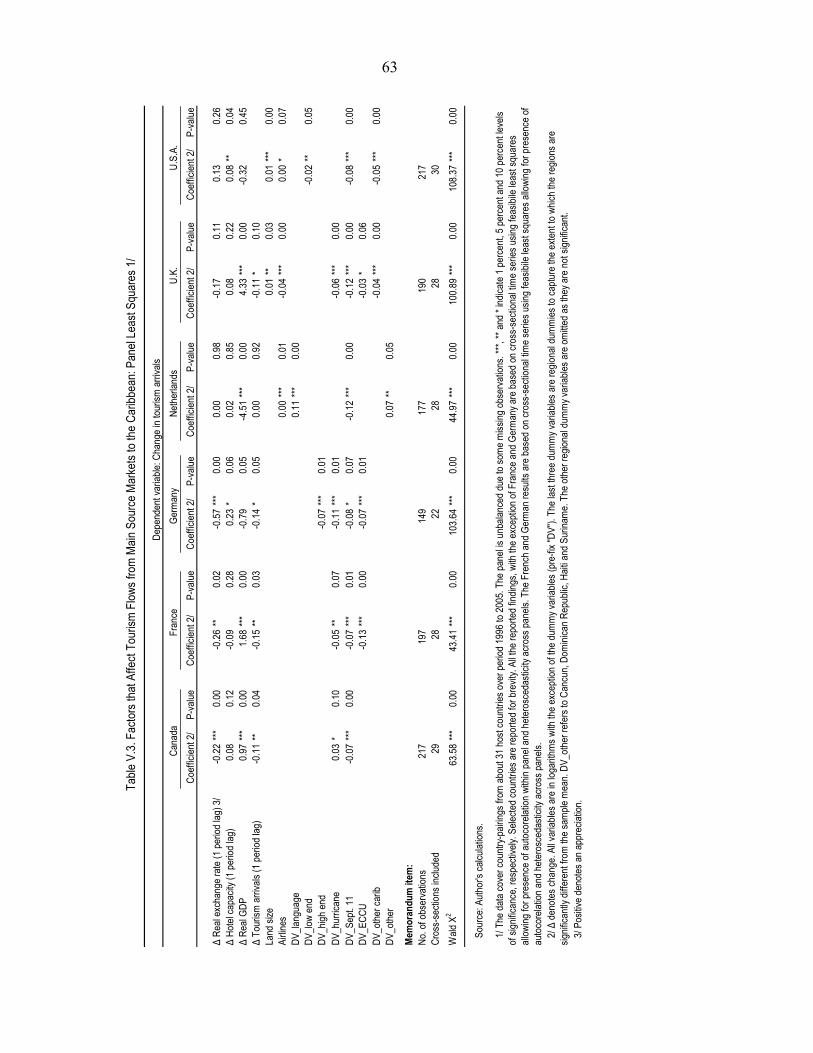
63
P-va
lueP-
value
P-va
lueP-
value
P-va
lueP-
value
Δ Re
al ex
chan
ge ra
te (1
per
iod la
g) 3
/-0
.22
***0.
00-0
.26
**0.
02-0
.57
***0.
000.
000.
98-0
.17
0.11
0.13
0.26
Δ Ho
tel c
apac
ity (1
per
iod la
g)0.
080.
12-0
.09
0.28
0.23
*0.
060.
020.
850.
080.
220.
08**
0.04
Δ Re
al GD
P0.
97***
0.00
1.68
***0.
00-0
.79
0.05
-4.5
1***
0.00
4.33
***0.
00-0
.32
0.45
Δ To
urism
arri
vals
(1 p
eriod
lag)
-0.1
1**
0.04
-0.1
5**
0.03
-0.1
4*
0.05
0.00
0.92
-0.1
1*
0.10
Land
size
0.01
**0.
030.
01***
0.00
Airlin
es0.
00***
0.01
-0.0
4***
0.00
0.00
*0.
07DV
_lang
uage
0.11
***0.
00DV
_low
end
-0.0
2**
0.05
DV_h
igh e
nd-0
.07
***0.
01DV
_hur
rican
e0.
03*
0.10
-0.0
5**
0.07
-0.1
1***
0.01
-0.0
6***
0.00
DV_S
ept.
11-0
.07
***0.
00-0
.07
***0.
01-0
.08
*0.
07-0
.12
***0.
00-0
.12
***0.
00-0
.08
***0.
00DV
_ECC
U-0
.13
***0.
00-0
.07
***0.
01-0
.03
*0.
06DV
_oth
er c
arib
-0.0
4***
0.00
-0.0
5***
0.00
DV_o
ther
0.07
**0.
05
Mem
oran
dum
item
:No
. of o
bser
vatio
ns21
719
714
917
719
021
7Cr
oss-
secti
ons i
nclud
ed29
2822
2828
30
Wald
Χ2
63.5
8***
0.00
43.4
1***
0.00
103.
64***
0.00
44.9
7***
0.00
100.
89***
0.00
108.
37***
0.00
So
urce
: Aut
hor's
calc
ulatio
ns.
3/
Pos
itive
deno
tes a
n ap
prec
iation
.
2/
Δ d
enot
es ch
ange
. All v
ariab
les a
re in
loga
rithm
s wi
th th
e ex
cept
ion o
f the
dum
my v
ariab
les (p
re-fi
x "D
V").
The
last t
hree
dum
my v
ariab
les a
re re
giona
l dum
mies
to c
aptu
re th
e ex
tent
to w
hich
the
regio
ns a
re
signif
icant
ly dif
fere
nt fr
om th
e sa
mple
mea
n. D
V_ot
her r
efer
s to
Canc
un, D
omini
can
Repu
blic,
Haiti
and
Surin
ame.
The
oth
er re
giona
l dum
my v
ariab
les a
re o
mitte
d as
they
are
not
sign
ifican
t.
Fran
ceGe
rman
yNe
ther
lands
1/
The
dat
a co
ver c
ount
ry-p
airing
s fro
m a
bout
31
host
cou
ntrie
s ov
er p
eriod
199
6 to
200
5. T
he p
anel
is un
balan
ced
due
to s
ome
miss
ing o
bser
vatio
ns. *
**, **
and
* ind
icate
1 p
erce
nt, 5
per
cent
and
10
perc
ent le
vels
of si
gnific
ance
, res
pect
ively.
Sele
cted
coun
tries
are
repo
rted
for b
revit
y. Al
l the
repo
rted
findin
gs, w
ith th
e ex
cept
ion o
f Fra
nce
and
Germ
any a
re b
ased
on
cros
s-se
ction
al tim
e se
ries
using
feas
ibile
least
squa
res
allow
ing fo
r pre
senc
e of
aut
ocor
elatio
n wi
thin
pane
l and
het
eros
ceda
stici
ty ac
ross
pan
els. T
he F
renc
h an
d Ge
rman
resu
lts a
re b
ased
on
cros
s-se
ction
al tim
e se
ries
using
feas
ibile
least
squ
ares
allo
wing
for p
rese
nce
of
auto
core
lation
and
het
eros
ceda
stici
ty ac
ross
pan
els.
U.K.
U.S.
A.Ca
nada
Tab
le V.
3. F
acto
rs th
at A
ffect
Tou
rism
Flow
s fro
m M
ain S
ourc
e M
arke
ts to
the
Carib
bean
: Pan
el Le
ast S
quar
es 1
/
Depe
nden
t var
iable:
Cha
nge
in to
urism
arri
vals
Coef
ficien
t 2/
Coef
ficien
t 2/
Coef
ficien
t 2/
Coef
ficien
t 2/
Coef
ficien
t 2/
Coef
ficien
t 2/

64
Appendix V.1: Data and Estimation Methodology 1. Data description:
The dataset includes 31 host countries and 12 source countries between 1996 and 2005. The host countries are: Anguilla, Antigua and Barbuda, Aruba, The Bahamas, Barbados, Belize, Bermuda, Bonaire, British Virgin Islands, Cancun (Mexico), Cayman Islands, Curacao, Dominica, Dominican Republic, Grenada, Guadeloupe, Guyana, Haiti, Jamaica, Martinique, Montserrat, Puerto Rico, St. Kitts and Nevis, St. Lucia, St. Maarten, St. Vincent and the Grenadines, Saba, St. Eustatius, Suriname, Trinidad and Tobago, and U.S. Virgin Islands. The source countries are Belgium, Canada, France, Germany, Japan, Italy, Netherlands, Spain, Sweden, Switzerland, U.K., and the U.S.
2. Data sources:
3. Econometric methodology:
The following models are estimated:
(i) Cross-sectional analysis (Table V.1):
1 2 3 4 5 60ij i j ij ij ij iX H Y D P zα α α α α αα ϑ= This is estimated for each year—1996 through 2005.
Variable Description Source
Tourism arrivals Number of stayover tourist arrivals Country authorities; Caribbean Tourism Organization; and World Tourism Organization.
Real exchange rate Bilateral vis-à-vis U.S dollarCountry authorities; IMF, International Financial Statistics; and authors' calculations
Hotel capacity Number of hotel roomsCountry authorities; Caribbean Tourism Organization; and World Tourism Organization.
Real GDP Real GDP per capita in source countries IMF, International Financial Statistics
Land size Total land surface area Country authorities; CIA Factbook; Institut National de la Statistique et des Études Économiques (INSEE); Caribbean Travel (http://www.caribbeantravelmag.com); Wikipedia (http://www.wikipedia.org); and Fund staff estimates.
Airlines Number of scheduled passenger airlinesTraffic By Flight stage 2002, No. 518, International Civil Aviation organization; and U.S. Department of Transportation, Bureau of Transportation Statistics (http://www.transtats.bts.gov).
Direct flight Number of scheduled direct flightsTraffic By Flight stage 2002, No. 518, International Civil Aviation organization; and U.S. Department of Transportation, Bureau of Transportation Statistics (http://www.transtats.bts.gov).
Murder rate Homicides per 100,000 inhabitants
Country authorities; World Health Organization; Pan American Health Organization (http://www.paho.org); United Nations, Survey on Crime Trends and the Operations of Criminal Justice Systems (http://www.unodc.org); and Wikipedia (http://www.wikipedia.org).
Dummy variablesDV_Low end DV=1 if hotel stock is not highly expensive Fodor's Caribbean 2007DV_High end DV=1 if hotel stock is expensive Fodor's Caribbean 2007DV_Hurricanes DV=1 if hurricane occurred, 0 otherwise. www.storm.carib.comDV_Language DV=1 if common language, 0 otherwise. CIA Factbook (https://www.cia.gov/library/publications/the-world-factbook)DV_Colonial ties DV=1 if shared colonial ties, 0 otherwise. CIA Factbook (https://www.cia.gov/library/publications/the-world-factbook)
Data Description and Sources
65
(ii) Panel analysis for each individual host country (Table V.2):
1 2 3 4 5 60jt t jt j jt j tX H Y D P zα α α α α αα ϑ= This is estimated for each individual host country.
(iii) Panel analysis for each individual source country (Table V.3):
1 2 3 4 5 60it it t i it i itX H Y D P zα α α α α αα ϑ= where:
X denotes tourism arrivals;39 H denotes hotel stock and is a proxy for supply capacity; and Y denotes real GDP and reflects the demand-generating capacity of the source country. D captures airlift accessibility and is defined as the number of direct scheduled flights; P denotes the bilateral real exchange rate (RER) and is a proxy for the relative ‘price’ of tourism. ϑ denotes country-pair specific factors, including colonial ties and z captures other factors relevant to tourism such as crime and exogenous shocks (captured by the September 11 terrorist attacks and hurricanes). Subscripts i , j and t reflect host country, source country and time period, respectively.
To address endogeneity, crime, RER and hotel stock are lagged by one year.
4. Cointegration results:
Tourism arrivals and real GDP in the ECCU are found to be cointegrated and exhibit the following long-run relationship: ln(GDP) = 3.73 + 0.67ln(tourism) + 0.01t, where tourism is the total number of tourists that arrived in the ECCU region, real GDP is the total ECCU real GDP, and t is a linear time trend. The analysis uses annual ECCU data covering the period 1979–2005. In the short run, Δln(GDP) = -0.44(ln(GDPt-1) – 0.67ln(tourism t-1) – 0.01t – 3.73) + 0.44(Δln(GDP t-1) + 0.50Δln(GDP t-2) – 0.19Δln(tourism t-3). Panel analysis—based on Pedroni (2004)— involving the six ECCU countries for the period 1996–2005 also supports these findings.
39 Tourism arrivals data were used due to lack of reliable comprehensive expenditure data.

66
REFERENCES Durbarry, R., 2001, “Tourism Expenditure in the U.K.: Analysis of Competitiveness Using a
Gravity-Based Model,” University of Nottingham Business School, mimeograph. Fodor's, 2006, Fodor's Caribbean 2007, Fodor's Travel Guides (New York City). Hodrick, R.J., and E.C. Prescott, 1997, “Postwar U.S. Business Cycles: An Empirical
Investigation,” Journal of Money, Credit and Banking, Vol. 29, pp. 1–16. Papatheodorou, A., 2001, “Why People Travel to Different Places,” Annals of Tourism
Research, Vol. 28, pp. 164–79. Pedroni, P., 2004, “Panel Cointegration: Asymptotic and Finite Sample Properties of Pooled
Time Series Tests with an Application to the PPP Hypothesis,” Econometric Theory, Vol. 20, pp. 597–625.
Zhang, J., and C. Jensen, 2005, “Comparative Advantage in Tourism: A Supply-Side
Analysis of Tourism Flows” Institute of Local Government Studies (akf) Working Paper, Denmark.

67
VI. CORPORATE INCOME TAX COMPETITION IN THE CARIBBEAN40
A. Introduction
1. Corporate income tax (CIT) competition—commonly referred to as the lowering of a country’s tax burden relative to foreign jurisdictions in order to attract foreign direct investment (FDI)—is a common phenomenon in developed as well as developing countries. As elsewhere in the world, CIT competition has intensified in the Caribbean during the last two decades. In particular, statutory CIT rates have fallen by about 30 percent on average since the mid-1980s. The main wave of reforms occurred in the mid-1990s, but the pace has continued in recent years. These reforms seem consistent with the prediction of economic theory. It has been argued that competition to attract FDI will lead to a “race to the bottom”—a term used to characterize the demise of capital income taxation as a source of government revenue. This chapter calculates average effective tax rates (AETRs) to assess whether CIT competition has eroded the tax base in the Caribbean.
2. The traditional method of measuring the impact of the CIT on firms’ investment decisions in small open economies is through the cost of capital. At the margin, the cost of capital should equal the required post–tax real rate of return on an investment project. Thus, a firm will invest up to the point at which the marginal product of capital is at least equal to the cost of capital—so that, at the margin, the project just breaks even. Typically, firms are assumed to be mobile and able to raise capital on the world market. In this framework, taxes push up the cost of capital and, therefore, act as a disincentive to invest.
3. The average effective tax rate is appropriate for assessing the impact of CIT competition on revenue. Two measures widely used to analyze the impact of taxes on investment decisions are marginal effective tax rates (METRs) and AETRs. Although the METR is widely reported in the literature, it is only appropriate for analyzing whether the threshold for profitability has been shifted by the tax system—i.e., it relates to projects that just break even. The AETR, developed by Devereux and Griffith (2003) and summarized in Box VI.1, is a more relevant measure for assessing the impact of corporate tax reforms on revenue because it is defined for different levels of expected economic profit, allowing an impact analysis varying with the profitability of the investment.
40 Prepared by Koffie Nassar.

68
Box VI.1: The Model1
Equation (1) ,phat
rphatMETR −= and
Equation (2) ;1 Tp
phatMETRp
phatAETR ⎟⎟⎠
⎞⎜⎜⎝
⎛−+⎟⎟
⎠
⎞⎜⎜⎝
⎛= where
Equation (3) ( )( )( ) ( ){ } ,1
111 δππδρ
πτ−−++
+−−
=Aphat
Equation (4) ( ) ,1...11
111
2
φρρτφ
ρφ
ρφτφ
++
=⎪⎭
⎪⎬⎫
⎪⎩
⎪⎨⎧
+⎟⎟⎠
⎞⎜⎜⎝
⎛+−
+⎟⎟⎠
⎞⎜⎜⎝
⎛+−
+=A and
Equation (5) ( ) ( )( ) ,1
1111ρπτγ
+++
−−=rT where
( )( )( ) ,11
1zc
mD
−−−
=γ and ( )( ) .1
1z
im D
−−
=ρ
A is net present value of allowances per unit of investment; δ is the economic rate of depreciation;τ is the statutory CIT rate; T is the statutory CIT tax rate adjusted for personal taxes; r is the real interest rate;γ is a discrimination factor between distributed and retained earnings; ρ is shareholder’s discount
rate;φ is the rate at which capital expenditure can be offset against tax; Dm is the personal income tax rate; z is the capital gains tax; c is the investment tax credit;π is the inflation rate; and i is the nominal interest rate. In addition, p is defined as the pre-tax rate of return on a project, over and above the rate of depreciation; and phat is the minimum acceptable value of p that makes an investment break even.
The two elements of equation (2) reflect the two extremes of the distribution of acceptable investment projects. For a marginal investment, p = phat: hence AETR = METR. At the other extreme, for a very profitable investment, as p→∞ , AETR→T. T differs from the actual statutory tax rate only because of personal taxes. In the absence of personal taxes, ( )( )πρ ++=+=+ 1111 ri and ,1=γ implying that .τ=T The intuition is that for very profitable investment projects, allowances become insignificant and the only relevant factor is the rate at which income is taxed.
1/ See Nassar (2008) for additional details.
4. This chapter analyzes trends in AETRs for 15 countries in the region over the last 20 years. The objective is to answer the following questions: (i) what is the impact of CIT competition on the ability to tax corporate income in the region?; (ii) what impact will recent tax policy proposals (i.e., accelerated depreciation, loss carry forward provisions, and tax harmonization) have on tax revenue?; and (iii) how can the tax base be broadened? The chapter finds evidence suggesting that the use of CIT holidays has eroded the tax base and that they must be removed for recent tax policy initiatives to be effective. These findings

69
suggest that the authorities should either avoid granting CIT holidays or rely more on consumption taxes in order to broaden the tax base.
B. Background and Motivation
5. Tax concessions are a common feature of tax regimes in the Caribbean. Since the early 1980s, governments in the Caribbean have faced the challenge of promoting economic diversification from agriculture (bananas and sugar) to tourism. As a result, many of the countries have run fiscal deficits to provide the supporting infrastructure, contributing to a large debt overhang. However, the use of tax incentives (including the widespread use of tax holidays) continues to limit the ability of governments to raise revenue.41 For example, the corporate tax structure of countries in the region is characterized by base erosion resulting from many special allowances and high standard deductions (allowed for different amounts of investment), and by the failure to tax large enterprises which would have been profitable even without tax incentives. In addition, there is anecdotal evidence suggesting that tax holidays doled out to large domestic and foreign investors led to pressures from small investors for similar treatment. As a result, the corporate tax system has become complex, and its ability to raise revenue in an equitable and a less distorting manner impaired, which further perpetuates tax avoidance and tax evasion.
C. Related Literature
6. The public finance literature is replete with arguments for and against tax competition. According to one school of thought dating back to the classic analysis of Tiebout (1956), tax competition among jurisdictions leads to an efficient provision of public goods and different equilibrium tax rates. A second school of thought that dates back to Oates (1972) touts a contrary view. According to this school, tax competition for mobile capital could lead governments to adopt inefficiently low corporate income taxes and, as a result, provide a sub-optimal level of public goods. Yet others argue that international competition affects investors differently, and that this creates the opportunity for governments to design tax systems that tax relatively immobile capital more than mobile ones.
7. The Caribbean region offers a “natural experiment” for testing the arguments just outlined. First, the 15 countries studied are mainly small islands that promote tourism as a development strategy. Second, with few exceptions, they are all endowed with sand, sea, and sun—i.e., they are close substitutes. Third, they all vie to lure brand products in the hotel
41 Available data show that average corporate tax revenues as a share of GDP for the region have remained stable since 1990. See, for example, Chai and Goyal (2006) for an overview of tax concessions in ECCU.

70
industries in North America and Europe—thus, capital is relatively mobile. It is, therefore, highly likely that the empirical findings in the Caribbean would be stronger than elsewhere.
8. The literature on CIT competition in the Caribbean is relatively new but growing. Bain (1995) analyzes the revenue implications of tax concessions in the ECCU, concluding that considerable revenue is foregone. Chai and Goyal (2006) estimate forgone revenues at about 9 percent of GDP per annum in the ECCU. Alcock (2003) finds that the impact of tax harmonization in CARICOM states is mixed.42 Nallari (1998) and Sosa (2006) adopt the METR approach to the case of Belize and the ECCU, respectively. Sosa shows that with tax holidays the tax burden on investment either disappears or becomes negative.
D. Developments in Statutory Corporate Income Tax Rates and Bases
Corporate income tax rates
9. The data show that CIT competition is indeed a worldwide phenomenon. The sources of the data are Bain (1995), PriceWaterHouse&Coopers (various years), and Worldwide Corporate Tax Guide by Ernst and Young International (various years). Figure VI.1 shows the CIT rates for each country, along with the average for the region, as well as the average for the OECD and Asian countries. Between 1985 and 2005, statutory CIT rates fell in all countries in the Caribbean, except for The Bahamas, which kept its rate unchanged at zero. In 2005, CITs in the Caribbean ranged from a minimum of zero percent in The Bahamas to a maximum of 45 percent in Guyana. The average CIT rate for the region was only marginally higher than the average for the OECD and Asian countries, indicating that there was indeed downward pressure on CIT rates worldwide.
10. In the Caribbean, larger countries are much more aggressive at cutting CIT rates than smaller ones. The time series of the average and the weighted average CIT (weighted by GDP, measured in U.S. dollars) for all countries in the Caribbean show a steady decline in average CIT rates during the period 1985–2005 (Figure VI.2). The weighted average follows a similar pattern, though with a slightly steeper fall during the late 1980s and early 1990s, indicating that the larger countries cut their tax rates by more than the smaller ones. In addition, the dispersion of CIT, measured by the standard deviation, has narrowed since 1994, implying that CIT rates have begun to converge.
42 CARICOM states include Antigua and Barbuda, The Bahamas, Barbados, Belize, Dominica, Grenada, Guyana, Haiti, Jamaica, Montserrat, St. Kitts and Nevis, St. Lucia, St. Vincent and the Grenadines, Suriname and Trinidad and Tobago.

71
The tax base
11. The definition of the corporate tax base in the Caribbean is complex. In line with the empirical literature, this section focuses on depreciation allowances for capital expenditure in analyzing the tax base. The allowed depreciation rate depends on the type of asset; for example it varies between 4 and 10 percent for buildings. In addition, in some cases there are initial allowances ranging from 10 percent to 40 percent, which are not deducted from the initial investment (Table VI.1). Figure VI.3 shows the present discounted values (PDV) of such allowances for investment in buildings, expressed as a percentage of the initial cost of the asset. The PDV would be zero if there were no allowances at all, but would be 100 percent if the total cost of an asset could be deducted from taxable profits in the year in which it is incurred.
12. Surprisingly, most countries have left their tax base unchanged for over 20 years. The PDV of allowances for each country in 1985 and 2005 is based on a single nominal discount rate for all countries and for all years (13½ percent, reflecting 3½ percent inflation, and 10 percent real discount rate). A fixed discount rate for all countries allows one to abstract from changes in the inflation rate and the real interest rate and to focus on changes in the rates of allowance set by governments. While eight countries have left their tax base unchanged, seven have increased their depreciation allowances for investment in buildings—that is, they have narrowed their tax base—notably, Barbados and St. Lucia. This finding is in line with Keen and Simone (2004), who find that industrialized countries have reduced their CIT rates and broadened their tax base, while developing countries reduced their CIT rate but narrowed or left their tax base unchanged.
13. There is no evidence that inflation expectations have played a role in determining the tax base. To examine whether governments have adjusted their depreciation allowances in response to observed or expected changes in inflation (which has generally fallen over the period analyzed),43 we present the time series of the mean PDV of allowances assuming constant and actual inflation (Figure VI.4). Surprisingly, the spread between the two PDVs has remained relatively stable, with both measures rising slightly over time. Lower inflation accounts for the tighter spread observed during the periods 1986–87 and 1997–2002.
43 Note that allowances are based on the nominal cost of an asset. As a result, they are worth less during periods of high inflation.

72
E. Evolution of Effective Tax Rates
Marginal effective tax rates
14. The METRs show that tax reforms have contributed to an investor-friendly environment in the Caribbean. The base case for the effective tax rates is assumed to be an investment in buildings, financed by new equity. Figures VI.5 and VI.7 show the development of METRs over time. Holding annual inflation constant at 3.5 percent and assuming no personal taxes, Figure VI.5 shows that the METR has declined for all countries, except The Bahamas, suggesting that the threshold for investment projects to be profitable has been shifted downward. Furthermore, the effective tax rates remain lower than the CIT rates (Table VI.2), indicating that the tax base favors investment.
Average effective tax rates
15. The emerging trend is that CIT reforms favor investments that break even more than profitable ones (Figures VI.6 and VI.7). In each case, following Devereux et al. (2003; and 2004), the investment project is assumed to have an expected real rate of economic profit of 30 percent (i.e., p-phat = 0.30).44 Figure VI.6 shows that, holding inflation constant, AETRs have declined in all countries, reflecting the pattern observed in the statutory tax rates. The evolution of both the AETRs and METRs in the Caribbean indicate that the latter have declined by more than the former (Figure VI.7), suggesting that the tax burden on less profitable investments has fallen by more than that on profitable investments.
CIT holidays
16. Results show that tax holidays have eroded the tax base. As mentioned earlier, governments in the Caribbean have also resorted to widespread use of CIT holidays, which have been granted, in many cases, for periods exceeding 20 years. To assess the impact of tax holidays, we set the statutory CIT rate ( )τ equal to zero.45 This implies that the net present value of allowances, 0=A (Box VI.1 equation (4)). It can be shown that the minimum acceptable pre-tax rate of return on a project ( )phat equals the real interest rate ( )r (equation (3)); therefore, METR = 0 (equation 1). Similarly, the adjusted statutory tax rate 0=T (equation (5)), because we assume no personal taxes (i.e., the discrimination factor between distributed and retained earnings );1=γ therefore, AETR = 0 (equation (2)). Figure VI.8
44 The same assumption is made in the literature for countries in Europe. See Nassar (2008) for additional details.
45 Note that this assumption is consistent with the anecdotal evidence suggesting that small, domestic and less-profitable investors clamor for similar treatment to large, foreign, and more-profitable investors.

73
confirms this outcome. In other words, tax holidays have eroded the tax base, which suggests that the “race may have already reached the bottom” in the Caribbean.
17. Recognizing that tax holidays are a permanent feature of CIT regimes in the Caribbean, we now analyze recent tax policy proposals in the region (i.e., accelerated depreciation, loss carry forward provisions, and tax harmonization). First, we consider accelerated depreciation. We do so by imposing a higher rate at which capital expenditure can be offset against tax ,φ say ,10.0=φ 46 which allows companies to capture the tax savings on their investment earlier rather than later. The immediate impact of this measure is to increase A (equation (4)); but ,0=A due to CIT holidays. This implies that accelerated depreciation will have no impact on the framework. Second, we consider loss carry forward provisions, which amount to allowing firms to write off their before-tax profits against past losses within a specific period of time. Recall that tax holidays are granted for periods exceeding 20 years, while the economic life of the asset (buildings) is 25 years. This essentially means that companies will pay no taxes during the life of their investment. In other words, CIT holidays must be removed for loss carry forward provisions to have a discernible impact on revenue.
18. Finally, we consider whether convergence in CIT rates (tax harmonization) could prevent a race to the bottom. While the model presented in Box VI.1 suggests that the rate at which corporate income is taxed is relevant for location decisions for very profitable investment projects, Chai and Goyal (2006) show that, even with tax holidays, the Caribbean’s share of worldwide foreign direct investment (FDI) has declined over the last two decades. This suggests that even if tax incentives are effective in attracting investment to individual countries within the region, they are ineffective in attracting investment to the region as a whole, since this may be determined more by nontax characteristics. In this case, total FDI may be considered CIT inelastic, which implies that tax harmonization could lead to higher taxation of corporate income. However, there are several reasons why tax harmonization may not be achieved in the Caribbean. The main drawback is the widespread use of tax holidays. Second, as Klemm (2004) demonstrates, tax harmonization, to be effective, requires convergence in both the CIT rate and the tax base. The sheer administrative burden that this entails makes such an outcome uncertain.
19. The loss of revenue from corporate income tax raises the question of how to broaden the tax base. The foregoing arguments suggest that a policy choice is to avoid granting CIT holidays and broaden the tax base to offset the downward pressure on statutory CIT rates. A second option is to recover the foregone revenue from alternative sources, such as taxes on domestic consumption—i.e., the value-added tax (VAT)—given that many 46 Note, however, that The Bahamas has the lowest depreciation rate, which is zero.

74
countries in the Caribbean have begun to implement a modern VAT regime.47 In this case, it would be important that the integrity of the VAT be preserved through limited exemptions and a single VAT rate, to ensure that the tourism sector does not use highly-taxed inputs to produce lightly-taxed outputs.
F. Concluding Remarks
20. This chapter uses the AETR approach to analyze corporate income taxation in 15 countries in the Caribbean over the period 1985–2005. It finds evidence suggesting that METRs have declined by more than AETRs, suggesting that the tax burden on less profitable investments has fallen by more than that on profitable investments. Although this outcome has made the tax systems as generous as those in industrialized countries, countries in the Caribbean have also resorted to the widespread use of tax holidays, which have eroded the tax base.
21. The chapter also analyzes the impact of recent tax policy proposals for countries in the Caribbean—i.e., accelerated depreciation, loss carry forward provisions, and tax harmonization. It finds that CIT holidays need to be removed for these policy measures to have discernible revenue gains. The authorities are faced with the choice of not granting tax holidays, or relying more on consumption taxes in order to broaden the tax base. Thus, in the presence of CIT holidays, it is important that the integrity of the VAT be preserved through a single rate with limited exemptions.
47 In the ECCU, VATs have recently been introduced in Dominica, Antigua and Barbuda, and St. Vincent and the Grenadines.

75
0
0.1
0.2
0.3
0.4
0.5
0.6
Antigu
a and
Barbud
a
The Baha
masBarb
ados Belize Domini
ca
Domini
can R
epub
lic Guyan
aGren
ada Haiti
Jamaic
a
St. Kitts
and N
evis
St. Luc
ia
St. Vinc
ent a
nd the
Gren
adine
sSuri
name
Trinidad
and T
obag
o
Averag
e (Cari
bbea
n)
Averag
e (OECD)
Averag
e (Eas
t & S
outh
Asia)
1985
2005
Figu
re V
I.1. C
arib
bean
: Sta
tuto
ry C
orpo
rate
Inco
me
Tax
Rt
Figu
re V
I.2. A
vera
ge S
tatu
tory
Cor
pora
te T
ax R
ates
0
0.1
0.2
0.3
0.4
0.5
0.6 19
8519
8719
8919
9119
9319
9519
9719
9920
0120
0320
05
Wei
ghte
d av
erag
e
Ave
rage
Note
: The
sha
ded
band
aro
und
the
aver
age
rate
repr
esen
ts ±
1 st
anda
rd d
evia
tion.
Figu
re V
I.3. P
DV o
f Dep
reci
atio
n A
llow
ance
s
0.0
0.2
0.4
0.6
0.8
1.0
1.2
1.4
Antigu
a and
Barbud
a
The Baha
mas Barbad
os Belize Dom
inica
Domini
can R
epub
lic Grenad
a Guyan
aHait
i Jamaic
a
St. Kitts
and N
evis St. L
ucia
St. Vinc
ent &
the G
ren.
Surina
me
Trinidad
and T
obag
o
1985
2005
Figu
re V
I.4. A
vera
ge P
DV o
f Dep
reci
atio
n A
llow
ance
s
0.0
0.1
0.2
0.3
0.4
0.5
0.6
0.7
0.8 19
8519
8719
8919
9119
9319
9519
9719
9920
0120
0320
05
Act
ual i
nfla
tion
Fixe
d in
flatio
n
Sour
ce: A
utho
r's c
alcu
latio
ns.

76
Figu
re V
I. 5.
Car
ibbe
an: M
argi
nal E
ffec
tive
Tax
Rate
s
-0.4
-0.3
-0.2
-0.10.0
0.1
0.2
0.3
0.4
0.5
0.6
Antigu
a and
Barbud
a
The Baha
mas Barbad
os Belize Dom
inica
Domini
can R
epub
lic Grenad
a Guyan
aHait
i Jamaic
a
St. Kitts
and N
evis St. L
ucia
St. Vinc
ent a
nd the
Gren
adine
sSuri
name
Trinidad
and T
obag
o
1985
2005
Figu
re V
I.6. C
arib
bean
: Ave
rage
Eff
ectiv
e Ta
x Ra
tes
0.0
0.1
0.2
0.3
0.4
0.5
0.6
Antigu
a and
Barbud
a
The Baha
mas Barbad
os Belize Dom
inica
Domini
can R
epub
lic Grenad
a Guyan
aHait
i Jamaic
a
St. Kitts
and N
evis St. L
ucia
St. Vinc
ent a
nd the
Gren
adine
sSuri
name
Trinidad
and T
obag
o
1985
2005
Figu
re V
I.7. E
ffec
tive
Tax
Rate
s fo
r Bui
ldin
gs
0.00
0.05
0.10
0.15
0.20
0.25
0.30
0.35
0.40
1985
1987
1989
1991
1993
1995
1997
1999
2001
2003
2005
MET
RsA
ETR
s
Sour
ces:
Cou
ntry
aut
horit
ies;
and
Fun
d st
aff e
stim
ates
.
05101520253035404550
ECCU The Baha
masBarb
ados
Belize
Domini
can R
epub
licGuy
ana
Haiti
Jamaic
aSuri
name
Trinidad
and T
obag
o
With
out t
ax h
olid
ays
With
tax
holid
ays
Figu
re V
I.8. C
arib
bean
: Ave
rage
Eff
ectiv
e Ta
x Ra
te o
n In
vest
men
t, 20
05(In
per
cent
)

77
Method Economic Depreciationof Depreciation Rate for Tax Initial
Depreciation Rate Purposes Allowance
Antigua and Barbuda Declining-balance 4 4 20The Bahamas none none none noneBarbados Straightline 4 4 40Belize Straightline 4 5 noneDominica Declining-balance 4 4 20Dominican Republic Declining-balance 4 5 noneGrenada Straightline 4 4 noneGuyana Straightline 4 5 noneHaiti Straightline 4 5 noneJamaica Straightline 4 5 noneSt. Kitts and Nevis Declining-balance 4 4 20St. Lucia Declining-balance 4 5 20St. Vincent and the Grenadines Declining-balance 4 4 20Suriname Straightline 4 4 noneTrinidad and Tobago Declining-balance 4 10 10
Sources: Bain (1995); and Worldwide Corporate Tax Guide (various years).
Table VI.1. Caribbean: Depreciation Allowances for Buildings(In percent)
1985 2005 1985 2005 1985 2005
Antigua and Barbuda 0.40 0.30 0.19 0.04 0.31 0.21The Bahamas 0.00 0.00 0.00 0.00 0.00 0.00Barbados 0.45 0.38 -0.10 -0.27 0.28 0.21Belize 0.45 0.25 0.42 0.22 0.43 0.24Dominica 0.35 0.30 0.12 0.04 0.26 0.21Dominican Republic 0.46 0.25 0.45 0.25 0.46 0.25Grenada 0.33 0.30 0.32 0.29 0.33 0.30Guyana 0.55 0.45 0.51 0.42 0.53 0.43Haiti 0.50 0.35 0.46 0.32 0.48 0.33Jamaica 0.45 0.33 0.42 0.30 0.45 0.33St. Kitts and Nevis 0.40 0.35 0.22 0.14 0.32 0.27St. Lucia 0.45 0.30 0.26 0.05 0.37 0.21St. Vincent and the Grenadines 0.40 0.35 0.19 0.12 0.31 0.26Suriname 0.45 0.36 0.49 0.35 0.49 0.35Trinidad and Tobago 0.45 0.35 0.26 0.15 0.36 0.27
Sources: Country authorities; and Fund staff estimates.
CIT METRs AETRs
Table VI.2. Caribbean: Comparison of CITs, METRs, and AETRs(Excluding personal and capital gains taxes)

78
REFERENCES Alcock, O., 2003, “CARICOM Tax Harmonization: Implications of the Effects on
Investment for Regional Integration,” mimeo, Regional Tax Policy and Administrative Unit, CARICOM Secretariat (Georgetown, Guyana: CARICOM).
Bain, L., 1995, “Tax Concessions and Their Impact on the Revenue Base of the
ECCB Territories,” mimeo, Eastern Caribbean Central Bank. Chai, J., and R. Goyal, 2006, “Tax Concessions and Foreign Direct Investment in the
ECCU” in R. Sahay, D. O. Robinson, and P. Cashin (eds.), The Caribbean: From Vulnerability to Sustained Growth, (Washington DC: International Monetary Fund), pp. 258–84.
Corporate Taxes, Worldwide Summaries, (various years), PriceWaterHouse &
Coopers, John Wiley & Sons, Inc. Devereux, M.P., and R. Griffith, 2003, “Evaluating Tax Policy for Location
Decisions,” International Tax and Public Finance, Vol. 10, pp. 107–26.
Devereux, M.P., and A. Klemm, 2004, “Measuring Taxes on Income from Capital: Evidence from the U.K.,” in P. B. Sorensen (ed.): Measuring the Tax Burden on Capital and Labor, (Cambridge MA: MIT Press), pp. 73–98.
Keen, M., and A. Simone, 2004, “Tax Policy in Developing Countries: Some Lessons
from the 1990s and some Challenges Ahead,” in Gupta et al., (eds.) Helping Countries Develop: The Role of Fiscal Policy (Washington DC: International Monetary Fund), pp. 302–52.
Klemm, A., 2004, “A Minimum Rate without a Common Base?” Intereconomics,
Vol. 39, pp. 186–89.
Nallari, R., 1998, “Belize, An Evaluation of Fiscal Incentives,” World Bank Country Policy Notes, (not published).
Nassar, K., 2008, “Corporate Income Tax Competition in the Caribbean,” IMF
Working Paper, forthcoming. Oates, W.E., 1972, Fiscal Federalism, Harcourt-Brace-Jovanovich, New York.

79
Sosa, S., 2006, “Tax Incentives and Investment in the Eastern Caribbean,” IMF Working Paper WP/06/23 (Washington DC: International Monetary Fund).
Tiebout, C.M., 1956, “A Pure Theory of Local Expenditures,” Journal of Political
Economy, Vol. 64, pp. 416–24. Worldwide Corporate Tax Guide, (various years), Ernst and Young International, Ltd.

80
VII. CAN THE ECCU AFFORD TO GROW OLD?48
A. Introduction
1. The demographic transition in the ECCU displays unusual characteristics. The transition now underway is rapid compared with international experience, and emigration is playing a particularly large role (Figure VII.1). Rasmussen and Roache (2007) found that the pension schemes in some ECCU countries are unsustainable, based upon recent actuarial reviews, and require significant reforms to place them on a sustainable path (Figure VII.2). By 2060, ECCU pension funds’ expenditure will exceed contributions by over 6 percent of GDP, based on pension funds’ actuarial projections.49
2. This chapter describes and quantifies several factors which could magnify the challenge of pension reform. First, for some ECCU countries, continued emigration at historical rates would considerably advance the projected date at which pension scheme assets are depleted. Second, there is a significant risk that assets will underperform, given the large exposures to the highly-leveraged public sector and to a lesser extent the record with private sector investments. Third, portfolio diversification away from the public sector could be complicated by age-related pressure for greater central government health spending.
B. Emigration and Sustainability
3. High rates of emigration from the ECCU have significant implications for the sustainability of pension schemes. A large proportion of the labor force emigrated to the OECD during 1970–2000, based on OECD members’ census data (Figure VII.3). ECCU members accounted for five of the top ten countries in the world ranked by this indicator. Dominica’s population actually declined according to its own 1991 and 2001 censuses (ILO, 2003).
4. Large-scale emigration by economically-active workers worsens the dependency ratio.50 In the case of Grenada, the loss of 54 percent of the labor force through emigration to the OECD, as shown in Figure VII.3, implies that the dependency ratio is 35 percent higher than it would have been with no emigration.
48 Prepared by Hunter Monroe.
49 These are International Labor Organization (2005; 2004a; 2004b) for St. Lucia, Grenada, and St. Kitts and Nevis; findings by IMF’s Fiscal Affairs Department for Antigua and Barbuda (and ILO (2004c)), Dominica (and ILO (2003)), and Veira (2005) for St. Vincent and the Grenadines. Pension schemes for civil servants are excluded from the analysis below.
50 Defined as the ratio of economically-inactive population to the economically-active population.

81
5. Actuarial projections in the ECCU are particularly sensitive to the assumed rate of emigration. Actuarial reviews in most ECCU members have calculated the historical rate of net emigration as the residual change in population from 1991 to 2001 after accounting for births and deaths during that period (based on national censuses). In all cases, the baseline actuarial projections assume that the rate of net emigration, which may differ from the calculated historical rate based on the actuary’s judgment, slows moderately over time.
6. Estimating migration as the residual change in population after adjusting for births and deaths is problematic. For instance, the above approach for St. Kitts and Nevis implies annual net in-migration of 90 persons during 1991–2001. The residual by nature captures not only migration but also any weaknesses in census, birth, or death data.
7. OECD census data, which record a foreign-born resident’s country of origin, provide an alternative method of estimating emigration from the ECCU. Below, emigration is estimated as the stock of immigrants in 2000, assumed to have arrived during the previous 30 years, and calculating the average flow of emigration on that basis. Figure VII.4 compares the various approaches.51 The last approach will be referred to below as the “historical OECD rate.”
8. Constant emigration at the historical OECD rate would imply a stronger demographic transition for most ECCU countries than predicted in actuarial reviews. Under this assumption, the ECCU labor force with constant emigration is 15 percent lower by 2050 than under the actuarial projection (Figure VII.5).
9. In a scenario with constant emigration at the historical OECD rate, pension scheme assets are depleted earlier (Figure VII.6). It can be argued that this assumption is pessimistic, to the extent that ECCU emigration rates have historically been so high that they must at some point decline. In another sense, however, the projection can be seen as optimistic, since the ECCU’s emigrants have been disproportionately highly educated, and therefore higher than average contributors to pension schemes (Mishra, 2006).
C. Asset Returns and Portfolio Allocation
10. ECCU pension schemes have unusually large exposures to the public sector (Figure VII.7). Thus, understanding the potential for underperformance of claims on the public sector and its implications is essential. Large public sector exposure is a concern, as public sector debt ratios in the ECCU are among the highest in the world. An implicit assumption of asset depletion projections is that pension funds can draw down claims, including those on the public sector, to zero, and this may not be the case. For example, Antigua and Barbuda’s central government is not paying debt service to the pension scheme, 51 Yet another approach, calculating the change in the stock between 1990 and 2000 OECD censuses, would imply even higher rates of emigration for all ECCU countries but Dominica.

82
and is also in arrears on its contributions as an employer. Grenada’s central government was in arrears on debt service to its pension fund until the 2005 debt restructuring, as part of which the pension fund received a haircut. Grenada’s government is now current on debt service falling due, i.e., with interest on restructured debt at a rate of 1 percent. Dominica’s central government was also in arrears on debt service until a debt restructuring in 2005, as part of which the pension fund also received a haircut. Arrears have not been an issue in other ECCU countries. However, the large share of the public sector in portfolios in St. Kitts and Nevis (87 percent) and St. Vincent and the Grenadines (79 percent) leaves pension schemes exposed if public sector difficulties ever do arise.
11. The performance of some other assets has also been unsatisfactory. These include claims on a housing project and mortgages in Antigua and Barbuda; on the airport and water authorities in Grenada; on a car park, mortgages, and leases on government buildings in St. Lucia; and restructured claims on the government of Belize in St. Vincent and the Grenadines.52
12. A useful indicator is therefore the date by which private, performing assets are depleted, ignoring public or nonperforming assets. Maintaining the previous section’s assumption of constant emigration, Figure VII.6 shows the date by which private performing assets are depleted. This indicator is particularly relevant for Antigua and Barbuda, given the public sector’s arrears to the pension fund; it is projected that by 2011 the pension fund will be unable to cover expenditures without transfers from the central government, whether as debt service or otherwise. This could force a fiscal adjustment if pension arrears are to be avoided.
D. Other Age-Related Spending
13. The impact of demographics on pension spending can be placed in the context of trends in other age-related spending.53 This section assesses the impact of population aging in the ECCU on age-related budgetary expenditures on health and education, which were larger than pension scheme expenditure during 2004–06 (see Figure VII.8 and Chapter VIII of this paper).54
52 Pension fund financial statements do not provide sufficient detail to calculate the rate of return on nonpublic assets based on interest received rather than interest earned.
53 A study of age-related spending in the European Union found that population aging will increase costs on pensions, health care, and long-term care by more than it will reduce spending on education and unemployment benefits. See Economic Policy Committee and European Commission (2006).
54 All spending by Ministries of Health and Education are included, due to data limitations, and includes some spending that is not related to health or education.

83
14. The net budgetary impact of aging during 2006–50 is to increase spending under plausible assumptions on spending trends. The projection below will assume: (i) education spending per youth as a percent of GDP remains constant;55 and (ii) health spending per elderly person as a percent of GDP remains constant.56 A breakdown by age group of the ECCU’s budgetary spending on health care is not available. The projection below will therefore incorporate optimistic and pessimistic scenarios, in which annual health spending per elderly person is twice and five times the spending per working age person respectively, reflecting the observed ratios in the United Kingdom and Germany (see Honjo, 2006; Federal Statistical Office Germany, 2004).
15. Even in the optimistic scenario, the decline in education spending as the population ages (1.4 percent of GDP) is offset by the increase in health spending (1.8 percent of GDP) (Figure VII.9). In the pessimistic scenario, the increase in health spending (3.2 percent of GDP) far exceeds the decline in education spending. The increase in pension spending of 5.6 percent of GDP predominates in either case.
E. Policy Recommendations
16. The factors identified above could magnify the challenge of pension reform and heighten the need for early action to address sustainability issues. Continued emigration at the historical OECD rate would advance the date by which pension fund reserves are depleted, and usable reserves would be depleted even sooner if the public sector has difficulty meeting its large debt service obligations.
17. The pension reforms implemented in St. Lucia in 2003 and Dominica in 2007 indicate that these challenges can be tackled:
• In Dominica, reforms included: increasing the minimum pension age by one year every three years up until 65; increasing the employee and employer contribution rates by 1 percentage point; increasing the contribution ceiling from EC$1,000 to EC$6,000 per month; and increasing the number of highest-earning years used in the calculation of the final insurable wage from three to ten years.
• In St. Lucia, reforms included: increasing the minimum pension age by one year every three years up until 65; increasing the minimum number of years required for a pension from 10 to 12 years; and reducing the maximum pension from 65 percent to 60 percent of the average insurable wage.
55 In the ECCU, primary education to ages 12–14 is compulsory, while entrance to higher grades is selective.
56 In the ECCU, government mandates to provide health care are broadly stated, with an evolving practice as to which treatments and medicines are covered.

84
18. The recommendations of actuarial reviews and the IMF’s Fiscal Affairs Department (FAD) provide a roadmap for other ECCU countries to address these challenges. Parametric reforms could include: gradually raising the retirement age from 60 (62 for St. Vincent and the Grenadines) to 65; increasing contribution rates, which are low by regional standards, as well as contribution ceilings; reducing pension accrual rates; and increasing the number of years over which the insurable wage is determined.
19. However, parametric reforms could fail unless supported by public sector adjustment and portfolio diversification. In the past, pension schemes have provided a captive source of financing for the budget and broader social objectives. This financing has relaxed governments’ budget constraints, and contributed to the ECCU’s unusually high debt levels. Parametric reforms will generate pension scheme surpluses, which should be used not to further relax budget constraints but to diversify social security scheme assets away from the public sector.
20. The concentration of pension scheme assets in the public sector reflects in part the regional perception that public investment should serve as one of the main catalysts of economic growth and development. The weak record of public investment in promoting growth, as described by Roache (2007), strengthens the case for diversification from public to private sector assets, and for limiting investments in the domestic public sector to government bonds. Increasing the share of international assets in scheme portfolios would diversify risk, which is particularly important given the region’s vulnerability to natural disasters.
21. As pension schemes diversify away from public sector assets, problems with the performance of private sector assets could become a greater issue. Pension schemes could take advantage of commercial banks’ comparative advantage in allocating resources by limiting domestic private sector investments to placing deposits through banks, and by no longer limiting deposits to those of locally-owned commercial banks. Less emphasis could be given to mortgage lending and other direct private lending, particularly in competition with the private sector. This would also reduce administrative costs, which are high compared with other countries, at the same time that asset returns are increased.

85
0
100
200
300
400
500
600
700
800 20
0520
1520
2520
3520
4520
55
Sou
rces
: Act
uaria
l rev
iew
s; a
nd F
und
staf
f est
imat
es.
Ret
irem
ent a
ge+
16–R
etire
men
t age
0–15
Figu
re V
II.1.
EC
CU
: Dem
ogra
phic
Pro
file,
200
5–60
(Tho
usan
ds o
f per
sons
)
-20020406080100 20
0520
1520
2520
3520
4520
55
Dom
inic
a
Ant
igua
& B
arbu
da
St.
Vin
cent
&
Gre
ns.
Gre
nada
St.
Kitt
s &
Nev
is
St.
Luci
a
S
ourc
e: F
und
staf
f est
imat
es a
nd p
roje
ctio
ns, a
s sh
own
in
Roa
che
and
Ras
mus
sen
(200
7).
Figu
re V
II.2.
EC
CU
: Soc
ial S
ecur
ity R
eser
ve A
sset
s pe
r Act
uaria
l R
evie
ws
(In p
erce
nt o
f GD
P)
0102030405060 Grenada Samoa
St. Kitts
& N
evis Suri
name Tonga Guyan
a Dominica
Antigua
& Barb
uda
St. Vinc
ent &
Gre
ns. Ja
maica
Barbad
osBeli
zeMalt
a
Trinidad
& Tob
agoCape
VerdeSain
t Luc
ia
S
ourc
e: D
ocqu
ier a
nd M
arfo
uk (2
005)
, bas
ed o
n O
EC
D c
ensu
s da
ta.
Figu
re V
II.3.
Cou
ntrie
s w
ith th
e La
rges
t Em
igra
tion
to O
EC
D, 1
970–
2000
(As
a pe
rcen
t of l
abor
forc
e)
-2000
200
400
600
800
1000
1200
Antigua
& Barb
uda
Dominica
Grena
da St. Kitts
& Nev
is
St. Luc
iaSt. V
incen
t & G
rens.
Nat
iona
l cen
sus
(resi
dual
)A
ctua
rial r
evie
w a
ssum
ptio
nO
EC
D c
ensu
s (c
umul
ative
)
S
ourc
es: N
atio
nal c
ensu
s da
ta p
er a
ctua
rial r
evie
ws;
and
OE
CD
ce
nsus
dat
a pe
r Doc
quie
r and
Mar
fouk
(200
5).
Figu
re V
II.4.
EC
CU
: Est
imat
es o
f Ann
ual E
mig
ratio
n R
ates
, 200
0(P
erso
ns p
er y
ear)

86
0
100
200
300
400
500
600
700
2005 2010 2015 2020 2025 2030 2035 2040 2045 2050 2055 2060
Source: Fund staff estimates.
Retirement age+
16–Retirement age
0–15
Figure VII.5. ECCU: Demographic Profile with Constant Emigration at the Historical OECD Rate, 2005–60
(Thousands of persons)
2007 2015 2023 2031 2039 2047 2055 2063
St. Vincent & Grens.
St. Lucia
St. Kitts & Nevis
Grenada
Dominica
Antigua & Barbuda
Actuarial reviewsScenario with constant emigration 1/Scenario with only private performing assets 2/
Figure VII.6. ECCU: Projected Year of Pension Fund Reserve Asset Depletion
1/ See Section B; assumes constant emigration at historical levels implied by OECD census data. 2/ See Section C; the date by which private performing assets are depleted measures the dependence of pension funds on debt service from the public sector.
Year at which expenses exceed contributions
Sources: Actuarial reviews; financial statements; and Fund staff estimates.

87
Figure VII.7. ECCU: Social Security Reserve Portfolio Asset Allocations(Percent of portfolio)
40
32
8
23
14
30
17
10
31
12
26
15
12
17
67
75
87
79 3
Antigua & Barbuda
Dominica
Grenada
St. Kitts & Nevis
St. Lucia
St. Vincent & Grens.
0 20 40 60 80 100Public sector/ publicly guaranteed Deposits in privately-owned banksOther domestic Foreign
Source: ECCU social security financial statements.
0
1
2
34
5
6
7
8
Antigua &Barbuda
Dominica Grenada St. Kitts &Nevis
St. Lucia St. Vincent &Grens.
Pension SchemeHealthEducation
Figure VII.8. ECCU: Average Age-Related Expenditure, 2004-06(In percent of GDP)
Note: Spending data for Ministries of Health and Education may include some nonhealth, noneducation expenditure.
Sources: Budget submissions to parliaments; and Fund staff calculations.
0.01.02.03.04.05.06.07.08.09.0
Pension scheme Health Education20062050
Figure VII.9. ECCU: Costs of Aging, 2006 vs. 2050(In percent of GDP, at actuarial emigration rates)
Source: Fund staff estimates.
2050 Assumes elderly health costs are twice spending per working age person2050 Assumes elderly health costs are five times spending per working age person

88
REFERENCES
Docquier, F., and A. Marfouk, 2005, “Measuring the International Mobility of Skilled Workers,” World Bank Policy Research Working Paper No. 3381 (Washington DC: World Bank).
Economic Policy Committee and European Commission, 2006, “The Impact of Aging on
Public Expenditure: Projections for the EU25 Member States on Pensions, Health Care, Long-Term Care, Education and Unemployment Transfers (2004–50),” European Economy, Special Report No. 1 (Brussels: European Commission).
Federal Statistical Office Germany, 2004, “Cost of Illness 2004 by Diseases and Age,”
available at: http://www.destatis.de/basis/e/gesu/gesutab23.htm Honjo, K., 2006, “Long Term Health Care Costs: Will They Make the Budget Sick?,” in
United Kingdom: Selected Issues Papers, International Monetary Fund, Country Report No. 06/87 (Washington DC: International Monetary Fund), pp. 66–78.
International Labor Organization, 2003, Dominica: Eighth Actuarial Review of the Social
Security Fund as of 31 December 2002 (Geneva: International Labor Organization). International Labor Organization, 2004a, Grenada: Seventh Actuarial Review of the Social
Security Fund as of 31 December 2002 (Geneva: International Labor Organization). International Labor Organization, 2004b, St. Kitts and Nevis: Seventh Actuarial Review of the
Social Security Fund as of 31 December 2002 (Geneva: International Labor Organization).
International Labor Organization, 2004c, Antigua and Barbuda: Seventh Actuarial Review of
the Social Security Fund as of 31 December 2002 (Geneva: International Labor Organization).
International Labor Organization, 2005, St. Lucia: Eighth Actuarial Review of the National
Insurance Fund as of 30 June 2003 (Geneva: International Labor Organization). Mishra, P., 2006, “Emigration and Brain Drain from the Caribbean,” in R. Sahay,
D. O. Robinson and P. Cashin (eds.) The Caribbean: From Vulnerability to Sustained Growth (Washington DC: International Monetary Fund), pp. 225–57.
Rasmussen, T., and S. Roache, 2007, “Social Security in the Eastern Caribbean Currency
Union” in Eastern Caribbean Currency Union: Selected Issues, International

89
Monetary Fund Country Report No. 07/97 (Washington DC: International Monetary Fund), pp. 67–89.
Roache, S., 2007, “Public Investment and Growth in the Eastern Caribbean” International
Monetary Fund Working Paper No. 07/124 (Washington DC: International Monetary Fund).
Veira, J., 2005, National Insurance Services of St. Vincent and the Grenadines: Actuarial
Valuation as of January 1st 2005 (St. Vincent and the Grenadines: Board of the NIS of St. Vincent and the Grenadines).

90
VIII. FINANCING UNIVERSAL HEALTH CARE: LESSONS FOR THE EASTERN CARIBBEAN AND BEYOND57
A. Introduction
1. Given the special characteristics of health care provision and in response to economic development, an increasing number of Caribbean countries have either introduced or are actively considering the introduction of universal health care, primarily financed by government (Tables VIII.1 and VIII.2). For example, given the high out-of pocket spending and inefficiencies in the current delivery system, St. Lucia has announced its intention to move towards universal health care, following in the footsteps of Antigua and Barbuda, which has had such a health system since the late 1970s. The St. Lucian proposal for universal health care entails the free provision to all residents of health services related to a specified list of common diseases. In the case of Antigua and Barbuda, the spending is financed by payroll contributions, while St. Lucia is considering a financing combination of budgetary support and higher general taxation.
2. The rationales for public intervention in providing health care are related to the issues of public goods, externalities, and insurance failures (Musgrove, 1996). Health financing goals―which include reducing inequality (by lowering out-of-pocket spending); preventing individuals from falling into poverty in the event of catastrophic medical expenses; and improving the health outcomes of the population by ensuring financial access of basic health services to all―are often cited as arguments supporting public intervention.
3. This chapter provides an overview of health financing policy options for universal care in the ECCU and beyond. It is intended to assist ECCU policymakers in the design, implementation, and evaluation of effective health financing reforms, based on the experience of other countries, taking into consideration the region’s emerging demographic and epidemiological transition. The chapter finds that the optimal financing option is country-specific―depending on a country’s economic, cultural, institutional, demographic and epidemiological characteristics, as well as political economy considerations―but there are some basic guidelines that need to be satisfied no matter which financing means is chosen. In particular, the financing option has to be: (i) domestically-based; (ii) sustainable; (iii) efficient; (iv) equitable; and (v) politically acceptable.
4. Exploring appropriate means for the provision of universal health care is beyond the scope of this analysis. However, the typical setting in countries with or considering universal health care involves the provision of services through public hospitals and/or private doctors who voluntarily participate in the universal health care scheme; while
57 Prepared by Evridiki Tsounta.

91
all other services are provided by the private sector using supplemental private health insurance schemes (often co-financed with the employer). The latter services are provided by the public hospital, free of charge, only to the needy and the elderly.
5. The shift in demographics and the trend towards noncommunicable chronic diseases (epidemiological transition) will exacerbate health spending in the Caribbean. The ECCU will face significant aging in the next three decades; the number of people over the age of 60 is projected to almost double by 2035, from 9.5 percent of the population in 2005 to 17 percent in 2035 (see Figure VIII.1 and Chapter VII of this paper).58 In addition, chronic diseases, such as cardiovascular illnesses, cancer and diabetes have become the main causes of death in the region (Figure VIII.2).59 Aging, together with the increasing prevalence of chronic diseases, will have a large impact on health costs and thus implicitly and explicitly affect the appropriateness of the various health financing options.
B. Financing Options for Universal Health Care
6. Health system reforms should be undertaken in the context of a government’s available and projected “fiscal space.” In principle, the fiscal space in any country could increase through tax measures (tax increases or better tax administration), lower government spending, additional borrowing, and external financing (e.g., grants from donors).
7. Health system reforms should be based solely on domestic sources of finance. Disbursements of official development assistance (ODA) to the region have been disappointing in recent years, and ODA on health, in particular, is scarce since it is usually reserved for low-income countries (Figure VIII.3). Donor aid has also been unpredictable due to political and budgetary decisions by donors; administrative delays on the donor’s side; and substantial bureaucratic procurement and reporting requirements that often result in lack of disbursements given noncompliance with agreed conditionalities (World Bank, 2006). Even if donor assistance is provided, the sustainability of the health system might be compromised if the country is not able to sustain the same level of services once donor funding ceases.
8. Lowering other forms of government spending or accumulating debt to accommodate increasing health spending is neither popular nor advisable, given: (i) the recurrent nature of health spending; (ii) the expected increase in health costs amid population aging and the epidemiological transition; and (iii) the already high debt level in many Caribbean islands (IMF, 2007).
58 According to World Bank (2006), over the next 20 years, changes in population size and structure alone will increase total health spending needs by 47 percent in Latin American and the Caribbean. 59 For example, St. Lucia has the highest prevalence of diabetes, in per capita terms, in the world.

92
9. Universal health care is typically financed, at least in part, through taxation (Figure VIII.4). For example, general tax-based funding is used in the United Kingdom, Canada, Sweden, and Brazil, while mandatory income/social security contributions are used in Germany, Japan and Costa Rica. Many countries offer basic health services to a broader population that does not contribute using supplementary budget contributions. In practice a mix of health financing methods is adopted, whereby some basic services are universally provided―financed by general taxation or wage contributions―and the remaining private services are financed using private insurance or out-of-pocket spending. As noted in WHO (2003), the challenge is to develop the mix of financing methods best suited to national macroeconomic conditions, the socio-cultural environment and the disease burden. This requires a financing system that: generates adequate resources to finance the current and projected health needs; is equitable in the sense that resources are raised according to the ability to pay, while access to services is based on need; and is efficient by providing the best value for money.
C. General Taxation Versus Wage Contributions
10. In this section we compare and contrast universal health care financing using general taxation (such as VATs) with financing using payroll/social security contributions. According to IMF and World Bank (2005), taxes should be judged by the following five commonly-accepted criteria:
• Revenue adequacy and stability. The tax should raise a significant amount of revenue, be relatively stable, and be likely to grow over time.
• Efficiency. The tax should minimize economic distortions.
• Equity. The tax should treat different income groups fairly.
• Ease of collection. The tax should be simple to administer to keep costs at a minimum.
• Political acceptability. The tax should be transparent and its uses should be clearly defined so as to promote acceptability.
Revenue adequacy and stability 11. The revenue potential from payroll contributions depends on the country’s labor market conditions, existing payroll tax rates, and the size of the informal economy (Figure VIII.5). While revenues from both general taxation and wage contributions rise with economic growth, evidence from Eastern European and Central Asian countries that have introduced universal health care indicate that growth is not a necessary and sufficient condition for revenue adequacy. These countries, characterized by a large informal sector, many self-employed and under-employed, and already feature high payroll tax rates, have failed to generate sufficient tax revenue (using payroll contributions) to finance universal

93
health care. For example, Kazakhstan abandoned universal coverage financed mostly via social security contributions in 1999, after disappointingly low revenue collections―only 40 percent of the expected revenue was actually collected (Langenbrunner, 2005). Tax avoidance by labor and small businesses and high levels of unemployment and self-employment were also cited for the low revenue generation in Russia, Albania and Romania (Langenbrunner, 2005). In addition, in countries where salaries are already a major source of taxation―in the form of income tax and unemployment insurance contributions—the potential for additional revenue-raising from payroll contributions to finance universal health care is limited (Normand and Weber, 1994).
12. In general, experiences from many countries that rely on payroll contributions as a major source of health financing suggest that numerous conditions are needed for successful revenue generation.60 Strong economic growth is needed to raise sufficient revenues; a large formal economy assists in ensuring a reliable source of payroll contributions (Ensor and Thompson, 1998); strong tax administrative capacity to enforce collection; and reasonable contribution rates to finance health spending while providing incentives for the majority of the population to contribute.
13. General taxation could better secure revenue adequacy. General taxation, in the form of indirect taxes such as VATs and sales taxes, could ensure that a broader base is taxed, including the tourism sector and most of the informal sector.61 VATs, for example, have already been introduced in the ECCU countries of Antigua and Barbuda, Dominica, and St. Vincent and the Grenadines, with tax yields and enforcement rates at higher levels than originally envisioned. Outside the region, some countries (for example, Ghana) have gone a step further and increased the VAT rate to finance universal health care.
Efficiency
14. The broad-based nature of general taxation provides efficiency gains (Coady et al., 2004). In contrast, payroll contributions have been found in the case of Latin American and Caribbean countries to raise tax evasion and reduce the size of the formal labor market (Baeza and Packard, forthcoming). World Bank (2006) also notes that payroll contributions raise labor costs and thus hinder economic growth, employment and competitiveness.
Equity
15. While general taxes rely on a broad revenue base, they could be regressive. For example, a VAT is typically regressive, since low-income people pay a higher percentage of 60 Examples include Estonia, Czech Republic, Hungary, and Slovakia, and to a large extent, Argentina, Chile, and the Republic of Korea.
61 The tourism sector in the ECCU is usually under-taxed, partly reflecting the presence of generous tax holidays.

94
their income in tax than high-income people. However, indirect taxes could be designed to be more progressive; for example, goods that are relatively important in the household budget of the poor (such as basic food and clothing) could be made exempt. In contrast, payroll contributions are at best as progressive as general taxation in financing universal health care (Normand and Busse, 2002).
Ease of collection
16. Tax collection per se is easier using payroll contributions; however, issues related to informality must also be considered. Payroll contributions are automatically deducted from employees’ payrolls, which make their collection an easy proposition. However, in the case of the ECCU, collection could be hindered by the region’s large informal economy, and significant self-employed and agriculture sectors, as evidenced by the case of Antigua and Barbuda (Vuletin, 2007). In addition, since incomes in the informal sector tend to be erratic, assessing them for payroll contributions would be particularly difficult (Normand and Weber, 1994). Spain and Iceland have shifted from social security contributions to general taxation to finance universal health care, in order to avoid these problems.
Political acceptability
17. Payroll contributions are more politically acceptable than general taxation, since the latter is typically regressive. However, the political acceptability of general taxation could be enhanced if there is a specific individual entitlement that accompanies the tax (that is, a benefit tax), such as in the case of Ghana with its higher VAT tax rate.
D. Preconditions for Successfully Financing Universal Health Care
18. No matter the financing option chosen, several conditions are needed to ensure that the financing strategy is appropriate.
• Universal health care plans should be part of the government’s medium- and long-term strategy. The costs of implementing universal health care should be carefully evaluated, taking into account its increasing future needs stemming from population aging and the epidemiological transition. In addition, the health plan’s cost should be incorporated into the medium-term expenditure framework, so as to ensure its current and future financial viability.
• The financing of universal health care should be transparent. This would gather the support of the population, particularly if the advantages of the system are pointed out to build consensus (Normand and Weber, 1994).
• The informal sector should be tackled, so that no matter which financing policy is used, all health beneficiaries pay according to their ability.
95
• Tax administration should be sound, so that the tax effort is translated into strong tax revenues.
E. Conclusions
19. Prior to moving toward universal health care, a country needs to ensure that funding will be sustainable and commensurate with the long-term needs resulting from the epidemiological transition and population aging. Relying on domestic revenues for the bulk of financing is a prerequisite, since most development assistance for health is focused on very low-income countries and even if present, its disbursement is usually erratic and short-lived (i.e., the country would need to sustain spending once aid flows cease).
20. There is no one-size-fits-all solution in deciding the appropriate manner in which to finance universal health care. No matter which financing option is eventually adopted (financing by general taxation or payroll contributions), the system should be able to raise enough revenues to finance the current and long-term spending needs of the country. In addition, the appropriate financing strategy depends on the country’s economic, cultural, institutional, demographic and epidemiological characteristics, as well as political economy considerations.

96
60
80
100
120
140
160
180
200
220
2005 2015 2025 203560
80
100
120
140
160
180
200
220
0–1516–59
60+Total
Sources: International Labor Statistics, Country authorities; and Fund staff calculations.
Figure VIII.1. ECCU: Population by Age Group, 2005–35 (Index 2005=100)
132.7 137.5 152.3
81.7 57.340.2
229.1 232.4 258.2
68.956.034.7
148.1 151.0171.124.2
20.3
0100200300400500600700800900
1,000
2005 2015 2030
Cardiovascular diseases Malignant neoplasmsDiabetes mellitus Other Non-communicable diseasesHIV/AIDS Other Communicable diseases
Source: World Health Organization.
Figure VIII.2. Region of the Americas: Causes of Death, 2005–30(Per 100,000 population)
0
5
10
15
20
25
30
35
40
Antigua &Barbuda
Dominica Grenada St. Kitts &Nevis
St. Lucia St. Vincent &Grens.
DisbursementsPending Commitments
Figure VIII.3. ECCU: Official Development Assistance for Health(In millions of U.S. dollars at 2004 prices, total of 1973-2005)
Source: OECD.

97
0
4
8
12
16
20
24
AN
TIG
UA
& B
AR
BU
DA
The
Bah
amas
Bar
bado
s
Bel
ize
Bra
zil
Can
ada
Cos
ta R
ica
DO
MIN
ICA
Ger
man
y
Gha
na
GR
EN
AD
A
Jam
aica
Japa
n
Rep
ublic
of K
orea
ST.
KIT
TS &
NE
VIS
ST.
LU
CIA
ST.
VIN
CE
NT
& G
RE
NS
.
Sw
eden
Trin
idad
& T
obag
o
Uni
ted
Kin
gdom
Uni
ted
Sta
tes
Private expenditure excl. out-of-pocketOut-of-PocketGeneral Government excl. social securitySocial SecurityExternal Financing
Source: World Health Organization.
Figure VIII.4. Health Financing, 2004 (In Percent of GDP)
0
10
20
30
40
50
60
The
Bah
amas
Gre
nada
St.
Kitt
s &
Nev
is
Trin
idad
& T
obag
o
Bar
bado
s
Ant
igua
& B
arbu
da
Dom
inic
a
Jam
aica
Guy
ana
St.
Luci
a
Dom
inic
an R
epub
lic
Bel
ize
St.
Vin
cent
& G
rens
.
Figure VII.5. Caribbean: Estimated Size of the Informal Economy, Early 2000s(In percent of GDP)
Source: Vuletin (2007).

98
Pac
kage
Con
tribu
tion
Ser
vice
pro
visi
on
Key
Issu
es
Sou
rce:
Lal
ta e
t al.
(200
5) 1
/ Num
bers
in p
aren
thes
es in
dica
te th
e ye
ar o
f int
rodu
ctio
n of
uni
vers
al h
ealth
car
e. N
ote:
IP d
enot
es in
patie
nt c
are,
and
OP
den
otes
out
patie
nt c
are.
Am
bula
tory
car
e, IP
, O
P, o
vers
eas
IP.
Tab
le V
III.1
. Sel
ecte
d C
ount
ries
with
Uni
vers
al H
ealth
Car
e 1/
All
civi
l ser
vant
s an
d de
pend
ents
, and
so
me
volu
ntar
y in
sure
d (3
6 pe
rcen
t of
pop
ulat
ion)
.
Ber
mud
a (1
971)
Cay
man
Isla
nds
(199
7)S
urin
ame
(198
1)A
ntig
ua &
Bar
buda
(197
8)
All
pers
ons
suffe
ring
from
a li
st
of n
ine
chro
nic
dise
ases
.A
ll w
orke
rs a
nd
unem
ploy
ed
spou
ses.
G
over
nmen
t pay
s fo
r in
dige
nt, c
hild
ren,
an
d th
e el
derly
.
All
wor
kers
and
de
pend
ents
. Ind
igen
t co
vere
d by
gov
ernm
ent
thro
ugh
levy
on
wor
ker's
pr
emiu
ms.
Cov
erag
e
Am
bula
tory
car
e, IP
, OP
, ov
erse
as IP
.IP
, OP
, ove
rsea
s IP
. A
mbu
lato
ry c
are,
IP, O
P,
over
seas
IP.
7 pe
rcen
t of w
ages
up
to a
ce
iling
, sha
red
equa
lly
betw
een
empl
oyee
and
em
ploy
er.
Fix
ed p
rice
pack
age
adju
sted
ann
ually
(a
roun
d 3
perc
ent o
f in
com
e); s
hare
d by
em
ploy
ee a
nd
empl
oyer
.
Fix
ed p
rice
set b
y pr
ivat
e co
mpa
nies
afte
r go
vern
men
t's a
ppro
val;
shar
ed b
y em
ploy
ee a
nd
empl
oyer
.
9 pe
rcen
t of w
ages
sh
ared
(4 p
erce
nt
empl
oyee
, 5 p
erce
nt
gove
rnm
ent).
Fix
ed
pric
e fo
r vol
unta
ry
insu
red.
Pub
lic, p
rivat
e an
d ov
erse
as
faci
litie
s.P
ublic
hos
pita
ls a
nd
over
seas
faci
litie
s.P
ublic
, priv
ate
and
over
seas
faci
litie
s.P
ublic
, priv
ate
and
over
seas
faci
litie
s.
No
colle
ctio
n fr
om s
elf-
empl
oyed
.G
row
ing
burd
en o
n go
vern
men
t.G
row
ing
burd
en o
n go
vern
men
t.O
utflo
ws
exce
ed
inflo
ws.
…
Gha
na (2
004)
2.5
perc
ent n
atio
nal
heal
th in
sura
nce
levy
ad
ded
to V
AT
; use
2.5
pe
rcen
t of w
ages
from
N
atio
nal W
orke
r's S
ocia
l S
ecur
ity; $
0.66
mon
thly
m
inim
um s
ubsc
riptio
n.
All
resi
dent
s.
Gov
ernm
ent p
ays
for
the
aged
, poo
r an
d ch
ildre
n of
sub
scrib
ers.
Pub
lic h
ospi
tals
…

99
Pack
age
Con
tribu
tion
Serv
ice
prov
isio
n
Sou
rce:
Lal
ta e
t al.
(200
5)
1/ N
umbe
rs in
par
enth
eses
indi
cate
the
year
of t
he fi
rst p
ropo
sal r
egar
ding
intro
duci
ng u
nive
rsal
hea
lth c
are.
Not
e: IP
den
otes
inpa
tient
car
e, a
nd O
P de
note
s ou
tpat
ient
car
e.
Jam
aica
(199
7)
All r
esid
ents
.
Publ
ic a
nd
priv
ate
hosp
itals
.Pu
blic
and
priv
ate
hosp
itals
.Pu
blic
and
pr
ivat
e ho
spita
ls.
Publ
ic a
nd p
rivat
e ho
spita
ls.
IP, O
P, a
mbu
lato
ry
care
, som
e ov
erse
as
serv
ices
.
IP, O
P, d
rugs
, so
me
over
seas
se
rvic
es.
Perc
enta
ge o
f inc
ome;
go
vern
men
t sub
sidi
es
for i
ndig
ent,
elde
rly,
child
ren.
3.5–
4 pe
rcen
t en
viro
nmen
tal
levy
on
impo
rts
(exc
ludi
ng
clot
hes
and
food
). Es
timat
ed
reve
nue:
US$
13
milli
on.
All r
esid
ents
.Al
l res
iden
ts.
Tabl
e VI
II.2.
Sel
ecte
d C
arib
bean
Cou
ntrie
s Pl
anni
ng U
nive
rsal
Hea
lth C
are
Cov
erag
e 1/
IP, O
P, d
rugs
, so
me
over
seas
se
rvic
es.
All r
esid
ents
.
St. L
ucia
(200
4)St
. Vin
cent
& G
rens
. (19
98)
The
Baha
mas
(200
4)C
over
age
Trin
idad
& T
obag
o (1
995)
All r
esid
ents
.
Publ
ic a
nd p
rivat
e ho
spita
ls.
IP, O
P, a
mbu
lato
ry c
are,
dr
ugs,
test
s.IP
, OP,
am
bula
tory
car
e.
9 pe
rcen
t of w
ages
-sha
red
by
empl
oyee
and
em
ploy
er;
gove
rnm
ent s
ubsi
dies
for
indi
gent
.
Fixe
d pr
ice
prem
ium
-sha
red
by e
mpl
oyee
an
d em
ploy
er;
gove
rnm
ent
subs
idie
s fo
r in
dige
nt.
10.1
per
cent
of e
arni
ngs-
shar
ed b
y em
ploy
ee a
nd
empl
oyer
.
Publ
ic a
nd p
rivat
e ho
spita
ls.
Beliz
e (2
002)
All r
esid
ents
.
IP, O
P, a
mbu
lato
ry
care
, som
e ov
erse
as
serv
ices
.
5 pe
rcen
t of w
orke
rs'
inco
me;
sha
red
by
empl
oyee
and
em
ploy
er; g
over
nmen
t su
bsid
ies
for i
ndig
ent
and
pens
ione
rs.

100
REFERENCES Baeza, C., and T. Packard, forthcoming, “Beyond Survival: Protecting Households from the
Impoverishing Effects of Health Shocks. A Regional Study,” (Washington DC: World Bank).
Coady, D., M. Grosh, and J. Hoddinot, 2004, “Targeting of Transfers in Developing
Countries: Review of Lessons and Experience,” (Washington DC: World Bank). Ensor, T., and R. Thompson, 1998, “Health Insurance as a Catalyst to Change in Former
Communist Countries?” Health Policy, Vol. 43, pp. 203–18. International Monetary Fund and World Bank, 2005, “Financing the Development Agenda,”
(Washington DC: World Bank and International Monetary Fund). International Monetary Fund, 2007, 2006 ECCU Regional Surveillance Staff Report, IMF
Country Report No. 07/96 (Washington DC: International Monetary Fund). Lalta, S., M. Entwistle, R. Suarez, and R. Brohim, 2005, “Situation Analysis: The Economic
Environment and Financing of Health Services in the Caribbean,” Working Paper No. 2 (Caribbean Commission on Health and Development).
Langenbrunner, J. C., 2005, “Health Care Financing and Purchasing in ECA: An Overview
of Issues and Reforms” (Washington D.C: World Bank). Musgrove, P., 1996, “Public and Private Roles in Health: Theory and Financing Patterns,”
World Bank Discussion Paper 339 (Washington D.C: World Bank). Normand, C., and R. Busse, 2002, “Social Health Insurance Financing,” in E. Mossialos, A.
Dixon, J. Figueras, and J. Kutzin (eds.), Funding Health Care: Options for Europe (European Observatory on Health Systems and Policies, Berkshire, U.K: Open University Press).
Normand, C., and C. Weber, 1994, “Social Health Insurance: A Guidebook for Planning,”
(Geneva: World Health Organization and International Labor Office). Vuletin, G., 2007, “The Size of the Informal Economy in the Caribbean,” in Eastern
Caribbean Currency Union—Selected Issues, IMF Country Report No. 07/97 (Washington, DC.: International Monetary Fund).
World Bank, 2006, “Health Financing Revisited: A Practitioner's Guide,” (Washington D.C.:
World Bank). World Health Organization (WHO), 2003, The World Health Report 2003 (Geneva: World
Health Organization).