
Eastern Africa’s Manufacturing Sector - afdb.org · BTVET Business, Technical and ......
54
Eastern Africa’s Manufacturing Sector Promoting Technology, Innovation, Productivity And Linkages UGANDA COUNTRY REPORT November 2014
Transcript of Eastern Africa’s Manufacturing Sector - afdb.org · BTVET Business, Technical and ......

Eastern Africa’sManufacturing Sector
Promoting Technology, Innovation,
Productivity And Linkages
UGANDA COUNTRY REPORTNovember 2014

EASTERN AFRICA’SMANUFACTURING SECTOR
Promoting technology,
innovation, productivity
and linkages
UGANDA COUNTRY REPORTNovember 2014
THE AFRICAN DEVELOPMENT BANK GROUP
The production of this report has been coordinated by the African Development Bank (AfBD). Designations employed in this publication do not imply the expression of any opinion of the institution concerning the legal status of any country, or the limitation of its frontier. While efforts have been made to present reliable information, the AfDB accepts no responsibility whatsoever for any consequences of its use.
Vice President: Zondo SakalaRegional Director (EARC): Gabriel NegatuLead Economists: Stefan Muller, Abraham MwendaChief Regional Economist and Task Manager of the Report: Tilahun Temesgen
Copyright 2014 – AFRICAN DEVELOPMENT BANK GROUPPhoto Credits: AfDB photo �les.
PUBLISHED BYAfrican Development Bank Group – Eastern Africa Regional Resource Centre (EARC)Khushee TowerLongonot Road, Upper HillNairobi, KenyaPhone: (254) 20 2712925/26/28Fax: (254) 202712938Email: [email protected]: www.afdb.org
EASTERN AFRICA’S MANUFACTURING SECTOR - UGANDA COUNTRY REPORT

EXECUTIVE SUMMARY.........................................................................................................................................................ix
INTRODUCTION......................................................................................................................................................................xi
1. THE CURRENT STATUS OF MANUFACTURING IN UGANDA..........................................................................................1
1.1 Overview of the Economy.............................................................................................................................................1
1.2 Description of the Manufacturing Sector in Uganda..................................................................................................2
1.2.1 Size of Uganda's Manufacturing Sector..........................................................................................................2
1.2.2 Structure of the Manufacturing Sector in Uganda ................................................................................5
1.3 Uganda's Manufacturing Competitiveness and Comparative Advantage ........................................................7
1.3.1 Overall Competitiveness of the Manufacturing Sector..........................................................................8
1.3.2 Competitiveness of Uganda's Manufacturing Sub-sectors ..................................................................10
2. EXPLAINING COMPETITIVENESS AND COMPARATIVE ADVANTAGE ......................................................................13
2.1 Enablers for the Manufacturing Industry ......................................................................................................13
2.1.1 Overview .........................................................................................................................................13
2.1.2 Legal and Regulatory Environment .........................................................................................13
2.1.3 Incentives for the Manufacturing Sector ...................................................................................14
2.1.4 Innovations and Manufacturing Sector Policies ...................................................................15
2.1.5 Support Institutions to Manufacturing Sector..............................................................................16
2.1.6 Infrastructure: Energy, Transport, and Communication.............................................................................16
2.1.7 Trade Logistics......................................................................................................................................18
2.1.8 Access to Finance ........................................................................................................................20
2.1.9 Education, Training, and Skills .............................................................................................................20
2.2 Product Diversi�cation and Structural Transformation .................................................................................22
2.2.1 Product Diversi�cation ..........................................................................................................22
2.2.2 Structural Transformation ..................................................................................................24
2.3 SWOT Analysis of the Manufacturing Sector in Uganda ...................................................................26
2.3.1 SWOT Analysis at Sub-sector Level ..................................................................................................26
3. POLICY OPTIONS: HARNESSING OPPORTUNITIES AND EASING THE CONSTRAINTS TO MANUFACTURING
IN UGANDA . . . . . . . . . . . . . . . . . . . . . . . . . . . . . . . . . . . . . . . . . . . . . . . . . . . . . . . . . . . . . . . . . . . . . . . . . . . . . . . . . . . . . . . . . . . . . . . . . . . . . . . . . . . . 2 9
3.1 Long-term Vision . . . . . . . . . . . . . . . . . . . . . . . . . . . . . . . . . . . . . . . . . . . . . . . . . . . . . . . . . . . . . . . . . . . . . . . . . . . . . . . . . . . . . . . . . . . . . . . . . . . . . . .29
TABLE OF CONTENTS
IAfrican Development Bank Group

3.1.1 Structural Transformation . . . . . . . . . . . . . . . . . . . . . . . . . . . . . . . . . . . . . . . . . . . . . . . . . . . . . . . . . . . . . . . . . . . . . . . . . . . . . . . . . . . .29
3.1.2 Harnessing Technology, Innovation, Productivity, and Linkages .......................................................30
3.1.3 Improving the Business Enabling Environment...................................................................30
3.2 Bene�ts to Uganda's Manufacturing Sector from Regional Integration.................................................30
4. CONCLUSIONS, RECOMMENDATIONS, AND ACTION PLAN .................................................................................33
4.1 Conclusions ................................................................................................................................33
4.2 Policy Recommendations .........................................................................................................................33
4.2.1 Incentives for the Manufacturing Sector .................................................................................33
4.2.2 Harnessing Technology, Innovation, Productivity, and Linkages .......................................................33
4.2.3 Support Institutions ...........................................................................................................34
4.2.4 Infrastructure: Energy, Transport, and Communication ...................................................................34
4.2.5 Access to Finance .........................................................................................................34
4.2.6 Education, Training, and Skills Levels........................................................................................34
4.3 Action Plan ................................................................................................................................................34
REFERENCES .....................................................................................................................................................................................38
ii
EASTERN AFRICA’S MANUFACTURING SECTOR - UGANDA COUNTRY REPORT
African Development Bank Group

Table 1: Sectoral Composition of Uganda's GDP, 2000-2011 (%) .............................................................................................................1
Table 2: Industrial GDP Breakdown at Market Prices 2000/01-2010/11 (%) ...............................................................................................2
Table 3: Index of Industrial Production in Uganda, 2000-2009 ..............................................................................................................3
Table 4: Monthly Employment in Selected Manufacturing Firms, 2008 and 2011 .............................................................................3
Table 5: Total Employee Earnings .................................................................................................................................................4
Table 6: Uganda Exports of Manufactured Products, 2001-2012 ...............................................................................................................5
Table 7: Manufacturing Value Added (MVA) in Uganda, 2000-2011 .................................................................................................7
Table 8: Trends in the Labour Cost Index Real Terms for the 121 Manufacturing and Hotel Establishments, 2008-2011 (2008=100) .............8
Table 9: Overall Competitiveness of the Manufacturing Sector in Uganda .........................................................................9
Table 10: Competitiveness of Manufacture Sub-sectors in Uganda ...............................................................................10
Table 11: UNIDO's Competitive Industrial Performance (CIP) Index for Uganda and Benchmark Countries .....................................11
Table 12: Overview of Doing Business Indicators for Uganda .....................................................................................14
Table 13: Effects of Energy Infrastructure De�ciencies in 2006 ...................................................................................17
Table 14: Road Transport Indicators for 20-foot Container .............................................................................................18
Table 15: Logistics Performance Index (LPI) Rankings 2007/10, Uganda ...................................................................19
Table 16: Trade Logistics and Manufacturing in Uganda .............................................................................................19
Table 17: Domestic LPI Performance 2010, Uganda and Benchmark Countries ...................................................................20
Table 18: Graduates by Field and Degree Level, 2007 and 2008 ...................................................................21
Table 19: Workforce Challenges in the Manufacturing Sector in Uganda ...................................................................21
Table 20: Concentration of Uganda's Manufactured Exports, by Product, 2001-2012 ....................................................................22
Table 21: Change in Uganda's Manufacturing Exports by Technology Classi�cation, 2001-2012....................................................25
Table 22: SWOT Analysis of the Manufacturing Sector in Uganda..........................................................................26
Table 23: SWOT Analysis of the Textile and Clothing Manufacturing Sub-sector in Uganda..........................................................27
Table 24: Action Matrix ....................................................................................................................................................35
LIST OF TABLES
iiiAfrican Development Bank Group

Figure 1: Real and Nominal Effective Exchange Rates, Monthly, 2000-2013................................................................................................1
Figure 2: Manufacturing in GDP in Uganda and Selected Countries (% share), 2000-2011..........................................................................5
Figure 3: Manufactured Exports in Total Merchandise Exports (% share), 2001-2012.........................................................................6
Figure 4: MVA per Capita, Uganda and Selected Countries, 2000-2011...........................................................................................7
Figure 5: RCA of Uganda's Manufacturing Sector Relative to World and Comparator Countries, 2012...............................................9
Figure 6: Concentration ratio, by product, for Uganda and comparator countries, 2001/2012....................................................23
Figure 7: HHI, by product, for Uganda and comparator countries, 2001/2012.................................................................................24
Figure 8: Manufactured Exports by Technology Classi�cation for Uganda and Comparator Countries, 2012......................................25
LIST OF FIGURES
iv
EASTERN AFRICA’S MANUFACTURING SECTOR - UGANDA COUNTRY REPORT
African Development Bank Group

AfDB African Development Bank
AGOA African Growth and Opportunity Act
ASYCUDA Automated System for Customs Data
AU African Union
BTVET Business, Technical and Vocational Education Training
CDO Cotton Development Organisation
CET Common External Tariffs
CICS Competitive and Industrial Climate Strategy
CIP Competitive Industrial Performance
COMESA Common Market for Eastern and Southern Africa
EAC East African Community
EBA Everything But Arms
ECA Economic Commission for Africa
ECR Export Concentration Ratio
EPAs Economic Partnership Agreements
EU European Union
FDI Foreign Direct Investment
FTA Free Trade Area
GCR Global Competitiveness Report
GDP Gross Domestic Product
HHI Her�ndahl-Hirschman Index
ICT Information and Communication Technology
IMF International Monetary Fund
ISIC International Standards for Industrial Classi�cation
ITC International Trade Centre
LCI Labour Cost Index
LDCs Least Developed Countries
LPI Logistics Performance Index
MPDI Manufactured Products Diversi�cation Index
MSMEs Micro, Small and Medium Enterprises
MVA Manufacturing Value Added
NCCI National Chamber of Commerce and Industry
vAfrican Development Bank Group
ABBREVIATIONS

NDP National Development Plan
NEER Nominal Effective Exchange Rate
NES National Export Strategy
PSFU Private Sector Foundation Uganda
RCA Revealed Comparative Advantage
REER Real Effective Exchange Rate
ROO Rules of Origin
SADC Southern Africa Development Community
SMEs Small and Medium Enterprises
STI Science, Technology and Innovations
SWOT Strength, Weaknesses, Opportunity and Threats
TAI Technology Achievements Index
UAL Uganda Government Analytical Laboratory
UBOS Uganda Bureau of Statistics
UCDA Uganda Coffee Development Authority
UCPC Uganda Cleaner Production Centre
UEPB Uganda Export Promotion Board
UGX Uganda Shillings
UIA Uganda Investment Authority
UIRI Uganda Industrial Research Institute
UMA Uganda Manufacturers Association
UN United Nations
UNBS Uganda National Bureau of Standards
UNHS Uganda National Household Survey
UNIDO United Nations Industrial Development Organisation
UNSCT Uganda National Council of Science Technology
URA Uganda Revenue Authority
US$ United States of America Dollar
VOC Vehicle Operating Costs
WTO World Trade Organisation
vi
EASTERN AFRICA’S MANUFACTURING SECTOR - UGANDA COUNTRY REPORT
African Development Bank Group

ACKNOWLEDGEMENTS
This country report was prepared as part of a regional assessment of the manufacturing sector in Eastern Africa covering seven countries – Burundi, Ethiopia, Kenya, Rwanda, Seychelles, Tanzania, and Uganda – commissioned by the African Development Bank (AfDB), East African Regional Resource Center (EARC). The report was task managed by Dr. Tilahun Temesgen, Chief Regional Economist, EARC. Overall guidance was received from Mr. Gabriel Negatu, Director, EARC, Nairobi; Messrs. Abraham Mwenda and Stefan Muller, Lead Economists, EARC; and Mr. Medjomo C. Coulibaly, Resident Representative of the AfDB, Uganda. The document was prepared by Dr. Nichodemus Rudaheranwa, consultant and country expert, and reviewed by Dr. Derk Bienen, BKP Development, and Dr. Tilahun Temesgen, AFDB/EARC. Natassia Ciuriak, BKP Development, provided editorial assistance. AfDB staff who provided important inputs and
peer-review comments included Dr. Alexis Rwabizambuga, Dr. Sebastian Okeke, and Ms. Vera Kintu Oling.
This report has also greatly bene�tted from discussions with, and comments and suggestions from, stakeholders who participated at the country level validation workshop in Kampala. In this regard, the facilitation by the Ministry of Trade, Industry and Cooperatives (MTIC), particularly the Permanent Secretary (Ambassador Julius Onen) and Acting Commissioner of Industry and Technology Department (Dr. Joshua Mutambi), is highly acknowledged. Equally, the research assistance provided by Mr. Aaron Ecel of Makerere University Business School is greatly appreciated.
The �nancial contribution from KOAFEC in undertaking the study is acknowledged and greatly appreciated.
viiAfrican Development Bank Group

Uganda's vision 2040 aims to transform Ugandan society from a predominantly peasant and low-income society to a competitive upper-middle –income country within 30 years. The Vision highlights the importance of manufacturing and value addition in enabling the development of export-led and internationally competitive economy, which is able to spur growth and growth and provide better employment opportunities to Ugandans at large. The development of a robust manufacturing sector is expected to propel Uganda to a better resource base with a vibrant mining and oil sub-sectors, its good weather and huge agricultural potential, a young and expanding population, and a strategic location at the heart of regional trading blocs.
Since the 1990s, Uganda has undertaken signi�cantly policy and institutional reforms which have boosted economic growth. The country has also made vast investments in infrastructure development as fundamental priority areas that will spur industrialization and with it, transformation of the Ugandan economy.
Guided by its Ten-Year (2013-2022) and its Private Sector Development Strategy (2013-2017), the Bank has, on its part,
aligned its country assistance strategy to Uganda's development priorities, by focusing its support on infrastructure development and skills and technology development. In particular, the Bank's intervention in Uganda aims to facilitate growth in the Private Sector to enhance economic transformation.
Therefore, the Ugandan Manufacturing Sector Country Report, which is part of a regional study covering seven countries in Eastern Africa, is a timely contribution as it comes a time when the Government of Uganda is completing its second National Development Plan (2013-2022) (NDP II). It identi�es the current opportunities and constraints to a competitive industrial sector in Uganda, and its �ndings and policy recommendations are certainly a valuable source of information to Uganda's industrial policy makers, and their development partners alike.
Jeremiah MUTONGAResident RepresentativeUganda Field Of�ce (UGFO)African Development Bank
FOREWORD
viii
EASTERN AFRICA’S MANUFACTURING SECTOR - UGANDA COUNTRY REPORT
African Development Bank Group

EXECUTIVE SUMMARY
Expanding manufacturing production is recognized as an essential determinant of growth, the world-over. The empirical literature shows that production and export of manufactures have been a leading factor in all successful and catching-up developing countries. The manufacturing sector has a high potential for the following: enhanced economies of scale and factor productivity due to technological upgrading; deeper, more dynamic, and stronger forward and backward linkages not only within the sector itself (upstream and downstream activities), but also with other sectors; and greater diversi�cation into a variety of economic activities. These create opportunities for employment creation and income generation.
Using a comprehensive set of data and indices, this report provides a situational assessment of the manufacturing sector in Uganda by identifying opportunities for, and binding impediments to, the development of the manufacturing sector, and ultimately recommends actions necessary to strengthen and enhance its development.
FindingsUganda, which is rich in natural resources that offer downstream manufacturing opportunities, has undertaken sweeping policy reforms and initiatives since the 1990s. These are spelled out in various government policy documents and strategic plans. Speci�cally, Uganda Vision 2040 (Republic of Uganda 2013) envisages a transformed Ugandan society from a predominantly peasant and a low-income country to a competitive upper-middle-income country within 30 years. In this regard, industrial sector development in Uganda occupies a central position in the government's Vision. Speci�cally, the objective of the National Industrial Policy (Republic of Uganda 2008) is to build a modern, competitive, and dynamic industrial sector that is fully integrated into domestic, regional, and global economies. Key strategic priorities in the 5-year National Industrial Sector Strategic Plan are to exploit and develop natural resource-based industries; promote agro-processing for value addition in niche markets; and support engineering for capital goods, agricultural implements, construction materials, and fabrication operations.
The report shows that policy reforms and other initiatives in Uganda since the 1990s have led to commendable strides in macroeconomic stability and economic growth. The structure of the economy has changed, with agriculture's contribution to gross domestic product (GDP) declining from about 70% in 1980, to 29% in 2000, and 23% in 2011. In contrast, the share of the services sector is large and growing, with its contribution to GDP rising from 48% in 2000 to over 51% in 2011. The contribution of the industrial sector to GDP has �uctuated between 23% and 27% over the last decade, while that of manufacturing averaged only about 7%. Recent studies have attributed such industrial sector performance to foreign direct investment (FDI) in�ows into the sector amounting
to 45% of the FDI that came into Uganda between 1991 and 2009, a third of which (about US$2.9 billion) was absorbed into the country's manufacturing sector. Despite growth and performance experienced in the country's industrial sector, however, the number of people employed in the agricultural sector remains substantial, accounting for about 70% of national employment; the country's exports largely remain unprocessed primary products. This should be a major concern, given that agricultural practices in Uganda remain overwhelmingly subsistence-focused, providing little impetus for stimulating the growth of value added manufacturing. Moreover, manufacturing in Uganda consists predominantly of last-stage (end-product) assembly and raw materials processing, a high share of which is food processing. Both of these are low value added activities. Industrial growth in Uganda has been largely driven by growth in construction services rather than investment in machinery and equipment, which is essential for industrial sector expansion and future economic growth.
The expansion of manufacturing activities in Uganda continues to be hampered by a number of obstacles. These include weak institutional support; limited access to affordable credit, particularly the absence of �nancial infrastructure to support micro, small, and medium enterprises (MSMEs); inadequate entrepreneurship and managerial skills; costly, unreliable, and inadequate physical infrastructure, particularly quality transport, energy, and communication infrastructure; lack of serviced industrial parks across the country; unreliable supply of inputs; low level of technology and a lack of indigenous capability for technology and innovations mastery, which adversely impacts on productivity in manufacturing; and a dearth in technical/technological skills, re�ected in a shortage of scientists, engineers, and mid-level technicians specially trained for adoption, adaptation, and diffusion of innovative technologies in the country.
RecommendationsGiven the current government's targets and the status of the manufacturing sector in Uganda, this report recommends actions in support of increased productivity and competitiveness of the country's manufactured products in domestic, regional, and global markets. Recommendations are made along the major enabling factors impacting the productivity and competitiveness of the manufacturing sector in Uganda.
Incentives for the Manufacturing Sector: A review and redesign of the current investment incentives is urgently needed, particularly regarding the criteria used in selecting bene�ciaries and in establishing a clear and transparent mechanism to ensure the effectiveness and inclusiveness of the country's investment incentive regime. The design and implementation of a performance-based incentive framework will strengthen the monitoring and enforcement to ensure that the incentives serve the objectives for which they were created. Given the unique challenges facing small and medium enterprises (SMEs), their dominance in the manufacturing sector (about 90% of enterprises are SMEs), and
ixAfrican Development Bank Group

their potential role in technology and innovation uptake, an incentive regime purposely designed to support SMEs should be considered and given priority.
Harnessing Technology, Innovation, Productivity, and Linkages: To ensure sustainable industrial transformation, there is a need to strengthen the national capacity in science and technology, incubation, and innovation. This calls for developing, �nancing, and strengthening the linkages and collaboration between industrial research institutions (e.g., UIRI, UDC, and UCPC, etc.) and industrial players. Funding and supporting the implementation and commercialization of outcomes from industrial research institutions is critically needed. In this regard, strengthening and streamlining current initiatives like the Science Fund, Innovative Fund, and Technology Development Fund will go a long way in addressing the current gaps between stages of innovation and the commercialization of the outcomes.
Support Institutions: An Industrial Forum (Council) should be created and supported to strengthen the active involvement of all stakeholders, to enable the coordination and consultations within the government, as well as to promote engagement between the government and the private sector on manufacturing issues of concern. Also, the capacity of institutions responsible for quality assurance needs to be strengthened to ensure that manufacturing products meet the quality and standards demanded by markets. The funding to the Uganda National Bureau of Standards (UNBS) should be increased to enhance its capacity to set standards, offer quality assurance for products, and make weights and measures. Finally, the capacity of SMEs should be promoted, as there is a need to promote business linkages between large enterprises and SMEs to ensure quality compliance. This could, for example, involve the government encouraging large �rms to reserve a certain share (e.g., 15%) of inputs to be sourced from SMEs.
Infrastructure: Initiatives and reforms underway must be built upon, including, for example, transport and energy infrastructure developments. The government needs to prioritize and scale up budgetary resources to infrastructure development, particularly the railway network, to ease transport costs for imports and exports in accessing seaports. Given the nature of such investments (e.g., between states and the shear amount of resources involved), infrastructure of a regional nature (roads, railways, ports, telecommunication, electricity generation, and transmission) is
better designed, funded, and implemented at the regional level.
Access to Finance: The high cost and dif�cult access to �nance remains a challenge to the development of the manufacturing sector, particularly among SMEs. The Uganda Development Bank needs to be recapitalized and strengthened to provide improved access to affordable and long-term credit for the development of the manufacturing sector. In addition, a credit fund and lines (e.g., under the Uganda Development Bank, once recapitalized) should be speci�cally created for manufacturing SMEs, given that the formal banking system in Uganda tends to focus on larger manufacturing �rms. Institutions like the Uganda Development Corporation need to be strengthened and funded to provide support to industrial development with a greater focus on SMEs.
Education, Training, and Skills: Education and training policies need to meet the speci�c human capital needs of labour markets, as well as to support the economy more widely by developing capabilities by increasing the level, diversity, and complexity of the skill needs (e.g., increasing training for multi-skilling, up-skilling, and re-skilling of the workforce) in various manufacturing sub-sectors. Speci�cally, this requires the following:
Ÿ Strengthening and promoting the l inkages and collaboration between the manufacturing industry and training institutions – for example, by reorienting the training curricula to include light and practical mid-level engineering and management skills for industrial development;
Ÿ Developing and strengthening technical training centres to train people who are not planning on receiving university degrees, but who wish to work in technology-based industries to generate educated, trained workers who can practically perform technical tasks, including developing software, �xing computers, managing networks, tracking products, ensuring product quality, performing chemical testing, drilling, etc.; and
Ÿ Supporting the extension and technology transfer services to aid the manufacturing industry with research and development (R&D), testing, and evaluation. This could involve the development of science parks and incubation services to enable interface and collaboration between industry, academia, and technology parks by offering low-cost land and loans, extending tax breaks, and other targeted performance-based incentives to companies that invest in technology upgrading.
x
EASTERN AFRICA’S MANUFACTURING SECTOR - UGANDA COUNTRY REPORT
African Development Bank Group

INTRODUCTION
Expanding manufacturing production is now recognized as essential for economic growth in low-income countries, given that manufacturing has the potential for value-addition on the country's existing resources. Empirical works (e.g., ECA 2012; Maio 2008; Republic of Uganda 2010; UNIDO 2010, 2011b, and 2012a) show that the production and export of manufactures have been a leading factor in all successful and catching-up developing countries. Manufacturing has been a key factor in many emerging Asian and Latin American countries, which have experienced rapid growth in productivity and employment creation, as well as technological upgrading.
The shift of resources towards manufacturing provides at least four linked and mutually reinforcing major bene�ts, namely productivity growth, development of linkages and spillovers, economies of scale, and new export opportunities. The manufacturing sector has the potential to create economies of scale and rapidly increase productivity largely due to a high rate of technical change. Labour productivity in manufacturing activities increases through the adoption, development, and mastery of new technologies (Ocampo and Vos 2008). Manufacturing has considerable potential to develop deeper, more dynamic, and stronger forward and backward linkages not only within the sector itself (upstream and downstream activities), but also with other sectors (UNIDO 2011a). It provides potential for diversi�cation into a variety of economic activities, as well as for employment creation and income generation. The complexity of products tends to be higher in manufacturing than in most agriculture- and resource-based industries. Hence, manufacturing is more dynamic than other sectors and provides opportunities for accumulating technology and innovative capabilities for enhanced productivity, employment, and incomes.
U g a n d a i s r i c h i n n a t u r a l re s o u rc e s . T h e s e o f f e r upstream/downstream manufacturing opportunities, including food and mineral processing; production of beverages; textile, clothing, and leather production; packaging material; metal fabrication; �sh processing; and chemical and pharmaceutical production. Uganda's central location in eastern and southern Africa is an advantage in terms of potential markets in bordering countries for its manufactured products. However, Uganda is a landlocked country and is highly dependent on Kenya and Tanzania in accessing seaports for exporting and importing. Uganda is a small market, but is a party to number of trade, investment, and double taxation treaties. In addition, Uganda is actively engaged in regional economic integration initiatives,
including the East African Community (EAC), the Common Market for Eastern and Southern Africa (COMESA), Economic Partnership Agreements (EPAs), and a Tripartite free trade area (TFTA).
Uganda undertook sweeping policy reforms and initiatives in the 1990s, including stabilisation and structural adjustment programmes starting in the early 1990s, which were aimed at restructuring and transforming the economy through privatisation of state-owned enterprises and liberalisation of the economy. These policy reforms and other government pronouncements are contained in various government policy documents and strategic plans, particularly Uganda Vision 2025, National Development Plan (NDP), Uganda Vision 2040, and sector policies, strategies, and plans. Uganda Vision 2040 notably envisages a transformed Ugandan society from a predominantly peasant and a low-income country to a competitive upper-middle-income country within 30 years (Republic of Uganda 2013). In this regard, industrial sector development in Uganda occupies a central position in the government's Vision geared towards the envisaged economic and social transformation. Speci�cally, the objective of the National Industrial Policy (Republic of Uganda 2008) is to build a modern, competitive, and dynamic industrial sector that is fully integrated into domestic, regional, and global economies. Key strategic priorities in the 5-year National Industrial Sector Strategic Plan (Republic of Uganda 2010) are to exploit and develop natural resource-based industries; promote agro-processing for value addition in niche markets; and support engineering for capital goods, agricultural implements, construction materials, and fabrication operations.
This study provides a situational assessment of the manufacturing 1sector in Uganda . It identi�es opportunities for, and binding
impediments to, the development of the manufacturing sector and, ultimately, recommends actions necessary to strengthen and enhance its development. This report has bene�ted from information mobilized through a review of the literature, policy documents, and other study reports; analysis of relevant data from different (local and international) sources; and consultations with key stakeholders. It uses various indices (e.g., concentration ratios and the Her�ndahl-Hirschman Index, HHI) to assess the nature and extent of diversi�cation of the country's manufactured exports. Furthermore, this study identi�es the strengths, opportunities, constraints, and threats to the manufacturing sector growth in Uganda. Based on key �ndings from the analysis, it recommends policy actions necessary to strengthen and promote the development of the country's manufacturing sector.
1This study focuses on Uganda only and is part of a wider study supported by the AfDB covering seven countries, namely: Burundi, Ethiopia, Kenya, Rwanda, Seychelles, Tanzania, and Uganda.namely: Burundi, Ethiopia, Kenya, Rwanda, Seychelles, Tanzania, and Uganda.
xiAfrican Development Bank Group

xii
EASTERN AFRICA’S MANUFACTURING SECTOR - UGANDA COUNTRY REPORT
African Development Bank Group

1. THE CURRENT STATUS OF MANUFACTURING IN UGANDA
1.1 Overview of the Economy
Policy reforms and other initiatives in Uganda over the last two decades led to commendable strides in macroeconomic stability and economic growth. The annual growth of the economy has been sustained at an impressive average rate of 7% since 2000, while in�ation averaged 8%, despite bouts of double-digit growth in
consumer prices in recent years (IMF 2013). Importantly for the manufacturing sector's international competitiveness, the real effective exchange rate (REER) has been relatively stable, as declines in the nominal value of the currency have compensated for the higher in�ation rates (Figure 1). Fiscal de�cits have been moderate as a share of GDP. However, the current account de�cit has widened sharply in recent years, rising to the 10% range as a share of GDP in 2010. The external de�cit is largely driven by FDI in�ows, based on the prospects for the nascent oil sector and downstream activities (oil re�ning and others).
The structure of Uganda's economy has changed, with agriculture's contribution to GDP declining from about 70% in 1980, to 29% in 2000, and 23% in 2011. In contrast, the share of the services sector is large and growing fast, with its contribution to GDP rising from 48% in 2000 to over 51% in 2011 (Table 1). On the other hand, the contribution of the industrial sector to GDP has �uctuated between 23% and 27% over the last decade, while that
of manufacturing averaged only about 7% (Table 2). A recent study (Obwona et al. 2013) attributes this industrial sector performance to FDI in�ows into the sector amounting to 45% of the FDI that came into Uganda between 1991 and 2009, a third of which (about US$2.9 billion) was absorbed into the country's manufacturing sector.
Sector 2000 2001 2002 2003 2004
2005
2006
2007
2008 2009 2010 2011
Agriculture 29.4 29.7 24.9 26.1 22.9 26.7 25.6 23.6 22.7 24.7 24.2 23.4
Industry 22.9 22.6 24.4 24.2 22.1 25.0 24.2 26.6 27.4 25.8 25.5 25.4
Services
47.7
47.7
50.7
49.7
55.0
48.3
50.2
49.8
49.9
49.5
50.3
51.2
Table 1: Sectoral Composition of Uganda's GDP, 2000-2011 (%)
Source: World Bank/World Development Indicators (August, 2013).
Figure 1: Real and Nominal Effective Exchange Rates, Monthly, 2000-2013
Source: Brueghel Institute (2013).
60.0
70.0
80.0
90.0
100.0
110.0
120.0
130.0
140.0
20
00
M0
1
20
00
M0
5
20
00
M0
9
20
01
M0
1
20
01
M0
5
20
01
M0
9
20
02
M0
1
20
02
M0
5
20
02
M0
9
20
03
M0
1
20
03
M0
5
20
03
M0
9
20
04
M0
1
20
04
M0
5
20
04
M0
9
20
05
M0
1
20
05
M0
5
20
05
M0
9
20
06
M0
1
20
06
M0
5
20
06
M0
9
20
07
M0
1
20
07
M0
5
20
07
M0
9
20
08
M0
1
20
08
M0
5
20
08
M0
9
20
09
M0
1
20
09
M0
5
20
09
M0
9
20
10
M0
1
20
10
M0
5
20
10
M0
9
20
11
M0
1
20
11
M0
5
20
11
M0
9
20
12
M0
1
20
12
M0
5
20
12
M0
9
20
13
M0
1
20
13
M0
5
NEER
REER
1African Development Bank Group
While the industrial sector experienced steady growth at an average annual rate of 7% since 2000, reaching 15% in 2005/06, the number of people employed in the agricultural sector remains substantial, accounting for about 70% of national employment
(Republic of Uganda 2010). In addition, Uganda continues to export largely-unprocessed, primary products. This should be a major concern, given that agricultural practices in Uganda remain overwhelmingly subsistence-focused, providing little impetus for
stimulating the growth of value added manufacturing. Moreover, industrial growth in Uganda has been largely driven by growth in construction services, rather than investment in machinery and equipment (Table 2), which is essential for industrial sector expansion and future economic growth.
1.2 Description of the Manufacturing Sector in
Uganda
Manufacturing (both formal and informal) is one of the sub-sectors of the country's industrial sector. Other sub-sectors are
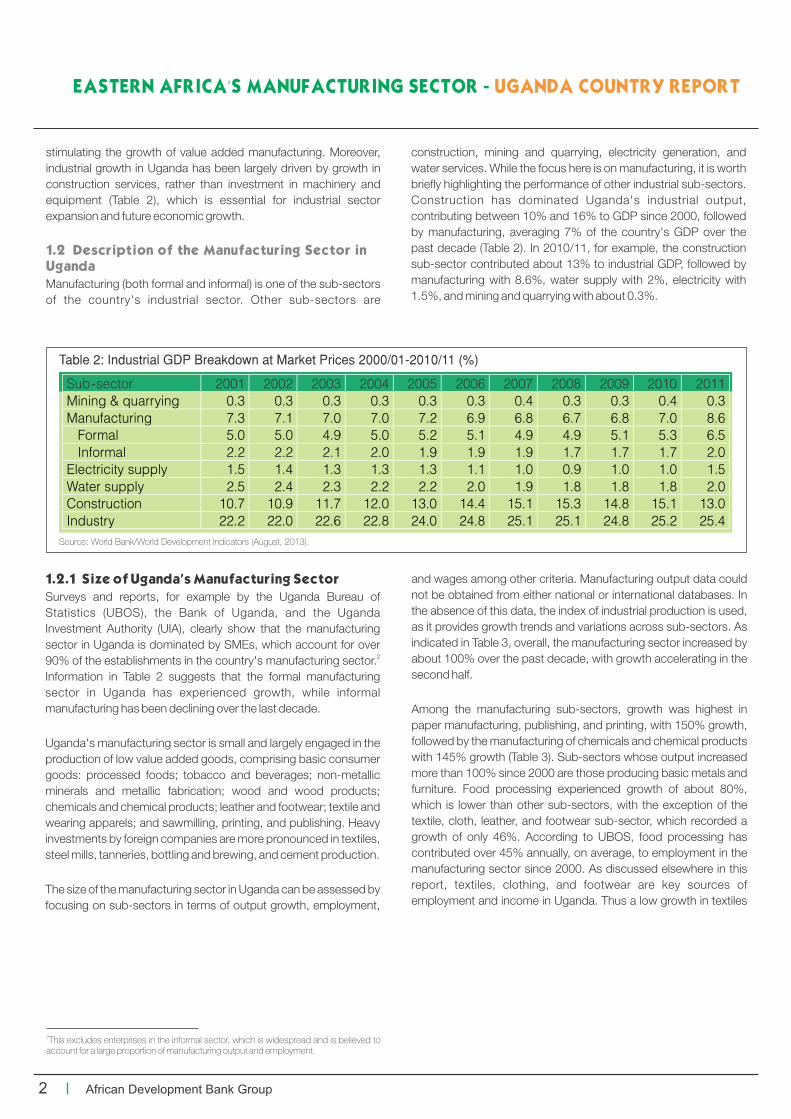
construction, mining and quarrying, electricity generation, and water services. While the focus here is on manufacturing, it is worth brie�y highlighting the performance of other industrial sub-sectors. Construction has dominated Uganda's industrial output, contributing between 10% and 16% to GDP since 2000, followed by manufacturing, averaging 7% of the country's GDP over the past decade (Table 2). In 2010/11, for example, the construction sub-sector contributed about 13% to industrial GDP, followed by manufacturing with 8.6%, water supply with 2%, electricity with 1.5%, and mining and quarrying with about 0.3%.
1.2.1 Size of Uganda's Manufacturing Sector
Surveys and reports, for example by the Uganda Bureau of Statistics (UBOS), the Bank of Uganda, and the Uganda Investment Authority (UIA), clearly show that the manufacturing sector in Uganda is dominated by SMEs, which account for over
290% of the establishments in the country's manufacturing sector. Information in Table 2 suggests that the formal manufacturing sector in Uganda has experienced growth, while informal manufacturing has been declining over the last decade.
Uganda's manufacturing sector is small and largely engaged in the production of low value added goods, comprising basic consumer goods: processed foods; tobacco and beverages; non-metallic minerals and metallic fabrication; wood and wood products; chemicals and chemical products; leather and footwear; textile and wearing apparels; and sawmilling, printing, and publishing. Heavy investments by foreign companies are more pronounced in textiles, steel mills, tanneries, bottling and brewing, and cement production.
The size of the manufacturing sector in Uganda can be assessed by focusing on sub-sectors in terms of output growth, employment,
and wages among other criteria. Manufacturing output data could not be obtained from either national or international databases. In the absence of this data, the index of industrial production is used, as it provides growth trends and variations across sub-sectors. As indicated in Table 3, overall, the manufacturing sector increased by about 100% over the past decade, with growth accelerating in the second half.
Among the manufacturing sub-sectors, growth was highest in paper manufacturing, publishing, and printing, with 150% growth, followed by the manufacturing of chemicals and chemical products with 145% growth (Table 3). Sub-sectors whose output increased more than 100% since 2000 are those producing basic metals and furniture. Food processing experienced growth of about 80%, which is lower than other sub-sectors, with the exception of the textile, cloth, leather, and footwear sub-sector, which recorded a growth of only 46%. According to UBOS, food processing has contributed over 45% annually, on average, to employment in the manufacturing sector since 2000. As discussed elsewhere in this report, textiles, clothing, and footwear are key sources of employment and income in Uganda. Thus a low growth in textiles
2This excludes enterprises in the informal sector, which is widespread and is believed to account for a large proportion of manufacturing output and employment.
Table 2: Industrial GDP Breakdown at Market Prices 2000/01-2010/11 (%)
Source: World Bank/World Development Indicators (August, 2013).
Sub-sector 2001 2002 2003 2004 2005 2006 2007 2008 2009 2010 2011
Mining & quarrying 0.3 0.3 0.3 0.3 0.3 0.3 0.4 0.3 0.3 0.4 0.3
Manufacturing 7.3 7.1 7.0 7.0 7.2 6.9 6.8 6.7 6.8 7.0 8.6
Formal
5.0
5.0
4.9
5.0
5.2
5.1
4.9
4.9
5.1
5.3
6.5
Informal
2.2
2.2
2.1
2.0
1.9
1.9
1.9
1.7
1.7
1.7
2.0
Electricity supply
1.5
1.4
1.3
1.3
1.3
1.1
1.0
0.9
1.0
1.0
1.5
Water supply
2.5
2.4
2.3
2.2
2.2
2.0
1.9
1.8
1.8
1.8
2.0
Construction
10.7
10.9
11.7
12.0
13.0
14.4
15.1
15.3
14.8
15.1
13.0
Industry
22.2
22.0
22.6
22.8
24.0
24.8
25.1
25.1
24.8
25.2
25.4
2
EASTERN AFRICA’S MANUFACTURING SECTOR - UGANDA COUNTRY REPORT
African Development Bank Group

and footwear, as well as in food processing, should be of policy concern in Uganda.
Table 3: Index of Industrial Production in Uganda, 2000-2009 (2000 = 100)
Source: UNIDO's INDSTAT2 ISIC Rev.3.
Manufacturing s ub-sector
2000 2001 2002 2003 2004 2005 2006 2007 2008 2009 Growth (%)
Food and beverages 100 99 108 117 126 129 133 155 166 181 81
Textiles, cloth, leather, and footwear
100
83
103
141
164
107
138
129
140
146
46
Paper, publishing, and printing
100
122
141
155
152
147
156
176
195
250
150
Chemicals and chemical products
100
136
130
139
157
169
170
180
174
245
145
Basic metals
100
107
183
159
200
214
227
242
227
213
113
Furniture manufacturing
100
193
194
137
221
273
181
241
274
222
122
Overall manufacturing
100
119
122
127
141
146
150
166
172
202
102
In terms of employment, the manufacturing sector in the Uganda employs about 630,000 people, representing about 6% of total
3employment, in the most recent data . This takes into account both registered businesses and the informal sector. A total of 139,097 are employed in registered businesses, accounting for about 22% of the total number employed in Uganda's manufacturing sector. The food, beverages, and tobacco sub-sector accounts for a large share of manufacturing employment: within the 458,106 establishments in the 2011 Business Register, which employed about 1,074,000 persons in total, the food processing sub-sector alone contributed 50,745 jobs, or 36% of the 139,097 manufacturing jobs in 31,757 registered manufacturing
4establishments . Meanwhile, textiles, clothing, and footwear are key sources of jobs and incomes worldwide.
Some idea of the distribution of employment across manufacturing sub-sectors can be obtained from a regular survey conducted by UBOS, covering 98 large manufacturing establishments (Table 4). The average number of employees per manufacturing establishment in this group of �rms in 2011 was 182; this is substantially greater than the average of about 4.4 in the set of 139,097 manufacturing �rms in the Business Register, and still larger than in the full population of manufacturing enterprises, which includes informal enterprises. While this group is not representative in any sense of the overall Ugandan manufacturing sector, it is nonetheless an important group, given that the empirical trade literature indicates that larger �rms are most likely to be exporters.
3This estimate is based on a total active labour force of 11,006,000 in 2010 and an unemployment rate of 4.2%, which yields a total employment of 10,544,000, of which 6% – or about 633,000 – is in the manufacturing sector (UBOS, Statistical Abstract, 2012, Table 2.3.1: Selected Labour Force Indicators for persons aged 14-64 years, UNHS).4UBOS Statistical Abstract (2012), Table 3.1.1: Average Employment by sector, Number.
3African Development Bank Group
Table4: Monthly Employment in Selected Manufacturing Firms, 2008 and 2011
* Miscellaneous includes manufacture of cables, furniture, and mattresses, as well as assembling bicycles. Source: UBOS Statistical Abstracts (2012).
Manufacturing sub -sector Empl.
(2008) Empl. (2011)
No. of Firms
Employees per firm (2011)
% of total employment in
sampled firms (2011)
Food processing, beverages, and tobacco
9,787
9,194
32
287
52%
Textiles, cloth, and footwear
751
916
9
102
5%
Paper, publishing, and printing
1,265
1,402
12
117
8%
Chemicals, paint, and soap
2,456
3,270
17
192
18%
Cement, clay, and ceramic products
1,393
1,308
10
131
7%
Metal products
586
617
4
154
4%
Miscellaneous*
1,155
1,140
14
81
6%
Total Employees in Sampled Firms
17,411
17,865
98
182
100%

Three important observations may be made on these data. First, there is a reasonable degree of diversi�cation of manufacturing activity within this group of 98 large �rms. Second, total employment within this group has not grown signi�cantly over the last several years, despite the strong pace of growth in the Ugandan economy. Third, there has been some compositional change with the chemicals and chemical products �rms and, to a lesser degree, the paper, publishing, and printing �rms expanding employment, while the food processing, beverages, and tobacco �rms reduced their employment over this period. Little else can be inferred from these data, given their lack of representativeness of the wider Ugandan manufacturing sector.
The same survey of 98 large manufacturing �rms provides
information on the total wage bill. There are some useful inferences to be drawn from these data, even though they are not necessarily representative of the wider Ugandan manufacturing sector. First, as shown in Table 5, the average wage paid out by the 98 �rms grew by 36% in Ugandan currency terms, but shrank by 8% in USD terms. This re�ects the nominal depreciation of the shilling and suggests that the competitiveness of Ugandan manufacturing was not being undermined, at least over the period covered by data, due to real exchange rate changes. Second, the average wage also declined in USD terms in all the sub-sectors except metal products, where it edged up by 1%. Third, the average wage in the paper and printing sub-sector was more than �ve times greater than the average wage across all other sub-sectors together, a difference that warrants further examination.
Table 5: Total Employee Earnings
Notes: UBOS database reports employee earnings on a monthly average basis; the amounts have been scaled up to annual figures. The wage bill is in UGX millions, the average wage in UGX. The exchange rates (UGX per USD) used to derive the percentage change in the average wage in USD are taken from the Bank of Uganda: UGX 1710 for 2008; and UGX 2515.85 for 2011.Source: computed using data from UBOS Statistical Abstract (2012).
Sector Wage Bill (UGX
mil.) 2008
Wage Bill (UGX
mil.) 2011
Av Wage (UGX '000)
2008
Av Wage (UGX '000)
2011
% change UGX
% change USD
Food processing, beverages & tobacco 1,463 1,810 1,794 2,363 32% -10%
Textiles, cloth, and footwear
192
230
3,067
3,012
-2%
-33%
Paper, publishing, and printing
1,530
2,177
14,517
18,633
28%
-13%
Chemicals, paint, and soap
778
1,401
3,802
5,141
35%
-8%
Cement, clay, and ceramic products
405
467
3,486
4,284
23%
-16%
Metal products
322
503
6,586
9,781
49%
1%
Miscellaneous
337
431
3,503
4,538
30%
-12%
Total 98 manufacturing firms
5,027
7,005
3,464
4,705
36%
-8%
4
EASTERN AFRICA’S MANUFACTURING SECTOR - UGANDA COUNTRY REPORT
African Development Bank Group
The manufacturing sector is confronted by a number of contemporary challenges, which are summarized in Obwona et al. (2013). The manufacturing sector in Uganda constitutes a small share of industrial GDP and of overall GDP. It has been low and static, averaging about 7% over the last decade (Table 2), and is below the average of 11% for least developed countries (LDCs). The contribution of the manufacturing sector to industrial GDP since 2000 has averaged about 31% (Table 7).
In terms of the share of manufacturing in overall GPD, Uganda trails
far behind emerging developing countries, such as China (over 30%, but declining), Korea (over 30% and rising), Vietnam and South Africa (about 20%, but declining), and the Eastern Africa region (an average of just under 10%) (Figure 2). Growth in these and other emerging developing economies has largely been driven by rapid structural economic transformation from primary production, such as mining and agriculture, into manufacturing, and in manufacturing itself from natural-resource-based into more sophisticated, skill- and technology-intensive activities (UNIDO 2010).

5Figure 2: Manufacturing in GDP in Uganda and Selected Countries (% share), 2000-2011
Source: World Bank/World Development Indicators (August 2013).
0.0
5.0
10.0
15.0
20.0
25.0
30.0
35.0
20
00
20
01
20
02
20
03
20
04
20
05
20
06
20
07
20
08
20
09
20
10
20
11
Uganda
East Africa average
China
South Africa
Korea, Rep.
Vietnam
1.2.2 Structure of the Manufacturing Sector in
Uganda
Manufacturing in Uganda consists predominantly of last-stage (end-product) assembly and raw materials processing, a high share of which is food processing. Both of these are low value added activities (Obwona et al. 2013). There are very few capital
goods industries. Agro-processing �rms account for about 39% of manufacturing establishments in Uganda (UBOS 2012). In addition, manufacturing �rms in Uganda are high-cost producers and are characterized by high excess capacity, with capacity utilization of the installed capacity averaging 50%.
5The “East Africa average” is calculated here as the average share of the manufacturing sector in the 7 country studies (Burundi, Ethiopia, Kenya, Rwanda, Seychelles, Tanzania, and Uganda).6Manufactured exports in this Table are based on the ISIC classification (specifically, ISIC Rev. 3), i.e.,
5African Development Bank Group
6Table 6: Uganda Exports of Manufactured Products, 2001-2012
Source: ITC TradeMap (for export data); World Bank/World Development Indicators (for data on GDP) (August 2013).
2001 2002 2003 2004 2005 2006 2007 2008 2009 2010 2011 2012
Total manufactured exports, (million USD) 176 206 266 307 380 453 686 1,093 1,042 1,066 1,397 1,531
Manufactured exports in total merchandise exports (%)
39.1
44.1
50.1
47.0
46.7
47.1
51.3
63.4
66.5
65.8
64.7
64.9
Manufactured exports as % of Industrial GDP
13.4
13.7
17.4
17.5
16.8
18.7
21.7
27.6
25.6
24.3
32.7
n.a.
chapter D – Manufacturing (sections 15–37). Other sources for international trade data – such as the World Development Indicators – apply a more restricted definition of “manufactures”, which comprise “commodities in SITC sections 5 (chemicals), 6 (basic manufactures), 7 (machinery and transport equipment), and 8 (miscellaneous manufactured goods), excluding division 68 (non-ferrous metals)”. In other words, they exclude processed agricultural products, beverages, and others.

The challenge relating to manufacturing being dominated by end-product assembly is underscored by the rising value and share of manufacturing products in total merchandise exports and in industrial GDP. Table 6 clearly suggests that manufactured exports increased more than 7 times between 2001 and 2012, albeit from a low base of US$176 million to US$1,531 million. Both the share of manufactured exports in merchandise exports and the share of manufactured exports as a percentage of industrial GDP almost doubled from 39% and 13% in 2001 to 65% and 33% in 2011, respectively.
Benchmarked against some emerging developing economies, Uganda remains below China, Korea, Vietnam, and South Africa, as regards the trends of shares of manufactured products in total merchandise exports (Figure 3). However, Uganda has experienced rising trends and is performing well compared to Eastern Africa, on average. As impressive as these trends might look, they mask a problem of low value addition in these manufactured products and, thus, give a false picture of a vibrant and growing manufacturing sector.
Figure 3: Manufactured Exports in Total Merchandise Exports (% share), 2001-2012
Source: International Trade Centre's TradeMap (August 2013).
0%
10%
20%
30%
40%
50%
60%
70%
80%
90%
100%
2001 2002 2003 2004 2005 2006 2007 2008 2009 2010 2011 2012
Uganda
East Africa average
China
South Africa
Korea, Rep.
Vietnam
6
EASTERN AFRICA’S MANUFACTURING SECTOR - UGANDA COUNTRY REPORT
African Development Bank Group
A better and more compelling approach to assessing the manufacturing intensity of a country is to use value addition, which is the net output of the manufacturing sector after adding up all outputs and subtracting intermediate inputs. Table 7 suggests that Uganda has been experiencing growth in manufacturing value added (MVA) in both absolute terms and per capita terms, though from low levels. For example, MVA increased from US$439.7
million in 2000 to US$1,270 million in 2011 (more than three-fold). MVA per capita doubled over a ten-year period, from US$18 in 2000 to US$36 in 2011. This is far below the MVA per capita in other countries, particularly the industrialising developing countries in Asia and Latin America. For example, Korea's MVA per capita exceeded US$6,000 in 2011 and is still rising rapidly.

Figure 4 displays value added per capita in Uganda's manufacturing sector in comparison to the MVA in selected countries in the region and in Asia. The value added in the manufacturing sector in Uganda is both very stagnantly low, as well
as below all comparator countries that have been experiencing high and rising MVA, particularly South Korea, China, Vietnam, and South Africa.
Figure 4: MVA per Capita, Uganda and Selected Countries, 2000-2011
Source: World Bank/World Development Indicators (August 2013).
0
1,000
2,000
3,000
4,000
5,000
6,000
2000
2001
2002
2003
2004
2005
2006
2007
2008
2009
2010
2011
Uganda
East Africa average
China
South Africa
Korea, Rep.
Vietnam
Table 7: Manufacturing Value Added (MVA) in Uganda, 2000-2011
Source: World Bank/World Development Indicators (August 2013).
2000 2001 2002 2003 2004 2005 2006 2007 2008 2009 2010 2011
MVA (million current USD) 439.7 412.5 454.4 447.1 505.4 631.8 707.4 849.1 1,055 1,190 1,327 1,271
Contribution of manufacturing to industrial GDP, in %
33.1
33.4
32.1
31.1
30.5
29.8
31.1
28.4
28.4
31.1
32.6
32.4
MVA per capita
18.1
16.4
17.5
16.7
18.2
22.0
23.8
27.6
33.2
36.2
39.0
36.2
7African Development Bank Group
1.3 Uganda's Manufacturing Competitiveness and
Comparative Advantage
Trade expansion has been at the centre of globalization, with manufactures making up the bulk of global trade, consistently accounting for more than 80% of exports since 1990 (UNIDO 2011c). While developed countries have traditionally dominated world manufactures trade, developing countries' share has been steadily rising. National industrial performance in this analysis is
assessed using the Competitive Industrial Performance (CIP) index developed and modi�ed by UNIDO in 2003 and 2011, respectively. It now includes the share of an economy's MVA in world MVA and the share of the country's manufactured exports in world manufactured exports. The composite CIP now comprises eight indicators of the competitiveness of the industrial sector, classi�ed in the following dimensions: (i) industrial capacity, measured by MVA per capita; (ii) manufactured export capacity, measured by

manufactured exports per capita; (iii) impact on world MVA, measured by an economy's share in world manufactured exports; (iv) industrialization intensity, measured by the average of the share of MVA in GDP and of medium and high-technology activities in MVA; and (v) export quality, measured by the average of the share of manufactured exports in total exports and of medium- and high-technology products in manufactured exports.
Intuitively, the CIP assesses the country's industrial performance, using indicators of an economy's ability to produce and export manufactured goods competitively (lower prices in�uenced by low unit costs of production, quality, and delivery timeliness relative to competitors in the same market). The share of a country's MVA in world MVA measures its impact on world manufacturing production; while the share of manufactured exports in world manufactured exports measures the country's impact in manufactures' international trade.
Comparative advantage is often assessed through the movement of relative prices evaluated in the absence of trade. Relative prices are, however, not observable and comparative advantage in this analysis is calculated indirectly, using revealed comparative advantage (RCA) indices. RCA indices use the trade pattern to identify the sectors in which an economy has a comparative advantage by comparing the country of interest's trade pro�le with the world average. In this analysis, the RCA is calculated as the share of the country's manufactured exports in the country's total exports, divided by the share of manufactured world exports in total world exports.
1. .1 Overall Competitiveness of the 3
Manufacturing Sector
The ability of a country to export manufactured goods can be measured on the basis of two distinct concepts: competitive and comparative advantage. Competitive advantage arises when a country's manufactures bene�t from lower overall costs than global competitors. Since capital goods tend to be internationally traded, competitive advantage typically arises from the relatively non-mobile factor of production, namely labour – hence, the focus on unit labour costs as a measure of global competitiveness. Comparative advantage, by contrast, addresses the question of relative ef�ciency within an economy between manufacturing and other activities that generate exports. We look �rst at competitiveness and then at comparative advantage.
Data on production costs in Uganda are rather scant. Based on available information, unit labour costs (labour costs divided by MVA per employee) in the manufacturing sector are about 0.40 (see, e.g., Ishengoma and Kappel 2011, Table 1).Trends of labour costs from the large �rm survey suggest that unit labour costs have not changed much between 2008 and 2011. Indeed, sub-sectors dealing in food processing, tobacco, and beverages; textile, clothing, and footwear; and non-metallic products all experienced declining unit labour costs. However, sub-sectors dealing in publishing and printing, as well as metal products, experienced increased unit labour costs; the latter is probably due to the boom in the construction industry.
8
EASTERN AFRICA’S MANUFACTURING SECTOR - UGANDA COUNTRY REPORT
African Development Bank Group
Table 8: Trends in the Labour Cost Index Real Terms for the 121 Manufacturing and Hotel Establishments,
2008-2011 (2008=100)
Activity 2011
Food processing, beverages, and tobacco 88.5
Textiles, cloth, and footwear 85.4
Paper, publishing, and printing 101.7
Chemicals, paint, soap, and foam
128.7
Bricks, cement
82.6
Metal products
112.3
Miscellaneous
92.2
Total
99.3
Source: UBOS (2012)
The competitive indices for the overall manufacturing sector and its sub-sectors in Uganda have been computed using data from the International Trade Center's TradeMap (Tables 8 and 9). A comparative advantage is revealed or exists if the RCA index is greater than 1; otherwise, the country has a comparative disadvantage. The RCA index for Uganda's manufacturing sector is below 1 throughout the years between 2002 and 2012 (Table 9).
This suggests that the manufacturing sector in Uganda, on the whole, is disadvantaged, relative to other sectors in the economy and to competing producers engaged in similar manufactures elsewhere in the world.
The contradiction in terms of lack of competitiveness illustrated by RCA and very low unit labour costs can be explained by other

factors. Labour productivity in Uganda's manufacturing sector is very low, which is compounded by lack of requisite skills, weak technology mastery, and uptake. Ssemogerere (2005) attributes this low productivity and weak technology uptake to Uganda's low absorption and participation in R&D, lack of protection for
intellectual property rights, absence of incentives and institutional infrastructure to transfer both locally-produced and foreign knowledge, and the scarce stock of skilled labour force. This dilutes the advantage of low unit labour costs, hence the low RCA index values in Table 9.
Table 9: Overall Competitiveness of the Manufacturing Sector in Uganda
Indicator
2002
2003
2004
2005
2006
2007
2008
2009 2010
2011
2012
Labour Productivity:
MVA/ Employment 23,502 n.a. 17,195 17,563 24,348 27,869 60,603 69,024 92,768 71,124 n.a.
Unit Labour Cost: Total Labour Costs / Real Output
n.a.
n.a.
n.a.
n.a.
n.a.
n.a.
0.021
0.022
0.017
0.026
n.a.
RCA, Manufacturing, Uganda/World
0.56
0.64
0.60
0.61
0.62
0.64
0.81
0.83
0.82
0.82
0.83
Source: World Bank/World Development Indicators for MVA data; Uganda Bureau of Statistics for employment and wages data; ITC's TradeMap (August 2013).
The manufacturing sector has a comparative disadvantage, as the RCA Index is below one, compared to such other developing countries as Korea, the Seychelles, and China with RCA indices greater than one and others like India, Turkey, Thailand, Vietnam, the Philippines, and Malaysia with RCA indices between 1 and 1.2 (Figure 5). This should not be a surprise, since Uganda's manufactured exports are largely destined for regional markets, particularly in neighbouring countries like South Sudan, the Democratic Republic of Congo (DRC), and Rwanda. In addition, there have been concerns regarding the stiff competition of
imported manufactured goods (new and second-hand items) to similar manufactures produced locally. In this regard, there have been calls from local manufacturers for a policy to shield them from cheap and (most likely) better imported products, given that they are sti l l infant manufacturing �rms (the infant industry protection/import substitution argument). However, Uganda's manufacturing sector seems to be more competitive relative to other countries in Eastern Africa individually and the region as a whole.
9African Development Bank Group
Figure 5: RCA of Uganda's Manufacturing Sector Relative to World and Comparator Countries, 2012
Source: International Trade Centre's TradeMap (August 2013).
0.00
0.20
0.40
0.60
0.80
1.00
1.20
1.40
Rep.
Kor
ea
Seyc
helle
s
Chin
a
Turk
ey
Thai
land
Indi
a
Mal
aysia
Viet
nam
Phili
ppin
es
Sout
h Af
rica
Chile
Ugan
da
Indo
nesia
Buru
ndi
Keny
a
Rwan
da
Tanz
ania
Ethi
opia

1.3.2 Competitiveness of Uganda's
Manufacturing Sub-sectors
At the sub-sector level, Uganda has had (and continues to have) a comparative advantage in food processing and in the production of beverages since 2001, based on its RCA index that has �uctuated between 3 and 5 (Table 10). On the other hand, the manufacturing of non-metal minerals (i.e., cement, clay, and ceramic production) reversed its comparative disadvantage between 2000 and 2005 into a comparative advantage, as indicated by the increasing value of the RCA index from 1.44 in 2006 to over 7 in 2012. These
comparative advantages should be treated with caution. First, Uganda's processed foods target markets in the region and are characterised by low value addition. Second, non-metal minerals are, by nature, heavy and bulky. Consequently, it is not economical to transport these items to distant markets beyond the region. The comparative advantage in these two manufacturing sub-sectors should not be a cause for celebration, but an opportunity to enhance value addition processes in order to penetrate, and compete in, markets beyond those in the region.
10
EASTERN AFRICA’S MANUFACTURING SECTOR - UGANDA COUNTRY REPORT
African Development Bank Group
RCA indices for Uganda's manufacturing sub-sectors in paper, publishing, and printing; chemicals and chemical products; and textiles, cloth, leather, and footwear are below unity, suggesting that they are at a comparative disadvantage in export markets. The comparative disadvantage, particularly in textiles, clothing, leather, and footwear manufacturing, should be of serious policy concern, as these industries form a major part of manufacturing production chains, and are a key source of employment and trade in many developing countries. Speci�cally, the textile and clothing industry is one of the oldest, largest, and most global industries in the world and is labour-intensive at all stages of the value chain. It offers a range of opportunities, including entry-level jobs for unskilled labour in developing countries.
Beyond the static aspects, textiles and clothing manufacturing has several dynamic effects on economic development. Textiles and clothing production may be considered the �rst step on the industrialization ladder and the wider effects depend on learning by doing and knowledge spillovers, agglomeration effects, local linkages, upgrading, and the role of value chains and FDI. The technological features of the textile and clothing industry makes it
suitable for poor countries' industrialisation, some of which have experienced a very high output growth rate in the sector, such as Bangladesh, Sri Lanka, Vietnam, and Mauritius, and have since become middle income countries, for example, Vietnam and Mauritius.
Using UNIDO's CIP index, computed for a period from 2000 to 2010 for Uganda and selected comparative developing countries with suf�cient recent data in the region and Asia, Uganda's CIP index is close to that of Eastern Africa's average. Going by the CIP �gures in Table 11, Uganda's industrial sector seems to be having a competitive advantage over industrial sectors in Rwanda and Burundi, but a competitive disadvantage over those in Kenya and Tanzania. Clearly, the CIP Index for Uganda's industrial sector has been stagnant between 0.002 and 0.004 and far below those of all the fast-industrializing countries, particularly in Asia and Latin America. This suggests that Uganda needs to make signi�cant effort to raise the production ef�ciency in the manufacturing sector over and above the competitive level attained by both industrialized and industrializing developing countries in global markets.
Table 10: Competitiveness of Manufacture Sub-sectors in Uganda
Manufacturing Sub -sector (share of Uganda/World)
2001 2002 2003 2004 2005 2006 2007 2008 2009 2010 2011 2012
Food and beverages7 3.88 4.02 4.24 3.13 3.20 3.37 4.39 4.76 4.21 5.03 4.38 3.97
Textile, cloth, leather, and footwear 8 0.93 0.34 0.58 1.05 0.89 0.59 0.73 0.50 0.66 0.69 1.23 1.15
Paper, publishing, and printing9 0.10
0.12
1.11
0.16
0.18
0.15
0.27
2.07
0.28
0.38
0.41
0.53
Chemicals and chemical products10
0.14
0.14
0.26
0.22
0.23
0.15
0.28
0.31
0.32
0.28
0.28
0.34
Cement, clay, and ceramic products11
0.15
0.29
0.52
0.45
0.56
1.44
2.56
6.98
7.98
7.20
7.29
7.53
Metal products12, Uganda/World
1.31
2.12
1.30
1.68
1.79
1.97
1.17
1.05
1.05
1.02
0.80
0.82
Source: Own computation using export data from ITC's TradeMap (August 2013).
7ISIC codes used were “15 – Manufacture of food products and beverages” and “16 – Manufacture of tobacco products”.8ISIC codes used were “17 – Manufacture of textiles”, “18 – Manufacture of wearing apparel; dressing and dyeing of fur”, and “19 – Tanning and dressing of leather; manufacture of luggage, handbags, saddlery, harness and footwear”.9ISIC codes used were “21 – Manufacture of paper and paper products” and “22 –
Publishing, printing and reproduction of recorded media”. 10ISIC codes used were “24 – Manufacture of chemicals and chemical products”.11ISIC codes used were “269 – Manufacture of non-metallic mineral products”.12ISIC codes used were “27 – Manufacture of basic metals” and “28 – Manufacture of fabricated metal products, except machinery and equipment”.

11African Development Bank Group
Table 11: UNIDO's Competitive Industrial Performance (CIP) Index for Uganda and Benchmark Countries
Indicator 2000 2005 2006 2007 2008 2009 2010
CIP Ug anda
0.002
0.003
0.004
0.004
0.004
0.004
0.004
CIP Eastern African countries:
Average CIP Eastern Africa
0,002
0,004
0,004
0,004
0,004
0,005
0,005
CIP Burundi
0.000
0.001
0.000
0.001
0.001
0.001
0.001
CIP Ethiopia
0.000
0.001
0.001
0.002
0.002
0.002
0.002
CIP Kenya
0.008
0.010
0.010
0.009
0.009
0.011
0.010
CIP Rwanda
0.001
0.002
0.002
0.002
0.002
0.003
0.002
CIP Tanzania
0.003
0.004
0.005
0.005
0.007
0.008
0.009
CIP Benchmark countries:
CIP Chile
0.060
0.069
0.072
0.071
0.072
0.073
0.072
CIP China
0.162
0.239
0.257
0.274
0.291
0.318
0.329
CIP India
0.045
0.056
0.059
0.060
0.064
0.073
0.075
CIP Indonesia
0.077
0.074
0.074
0.072
0.075
0.082
0.082
CIP Malaysia
0.197
0.190
0.192
0.183
0.169
0.184
0.183
CIP Philippines
0.084
0.075
0.075
0.072
0.070
0.071
0.073
CIP South Africa
0.072
0.076
0.076
0.076
0.080
0.077
0.077
CIP Rep. Korea
0.318
0.356
0.364
0.366
0.373
0.399
0.404
CIP Thailand
0.136
0.151
0.155
0.157
0.160
0.168
0.171
CIP Turkey
0.096
0.121
0.124
0.128
0.132
0.130
0.128
CIP Vietnam
0.025
0.035
0.038
0.041
0.045
0.051
0.054
Source: UNIDO.

12
EASTERN AFRICA’S MANUFACTURING SECTOR - UGANDA COUNTRY REPORT
African Development Bank Group

2. EXPLAINING COMPETITIVENESS AND COMPARATIVE ADVANTAGE
132.1 Enablers for the Manufacturing Industry
2.1.1 Overview
The growth of the manufacturing sector is particularly critical for the development of countries like Uganda, which heavily depend on a handful of unprocessed products for foreign exchange earnings. Hence, increasing manufacturing exports is a direct means of diversifying Uganda's export structure and reducing its vulnerability to global market volatilities. A review of policy documents and other reports, as well as discussions with stakeholders consulted, however, suggests that the expansion of manufacturing activities in Uganda continues to be hampered by a number of obstacles. These include the following: (i) weak institutional support and limited access to affordable credit, particularly the absence of �nancial infrastructure to support MSMEs; (ii) inadequate entrepreneurship and managerial skills; (iii) costly, unreliable, and inadequate physical infrastructure, particularly quality transport, energy, and communications infrastructure; (iv) a lack of serviced industrial parks across the country; (v) an unreliable supply of inputs; (vi) a low level of technology and a lack of indigenous capability for technology and innovations mastery, which adversely impacts productivity in manufacturing; and (vii) a dearth in technical/technological skills, re�ected in a shortage of scientists, engineers, and mid-level technicians specially trained for adoption, adaptation, and diffusion of innovative technologies in the country.
2.1.2 Legal and Regulatory Environment
The 1990s witnessed the development, upgrading, and strengthening of institutions supportive of industry in Uganda.
14These include the Uganda National Bureau of Standards (UNBS), the Uganda Export Promotion Board (UEPB), the Uganda Industrial
15Research Institute (UIRI), the Uganda National Council for Science and Technology (UNCST), the Uganda Investment Authority (UIA), and the Uganda Revenue Authority (URA). They also include sector-speci�c ones like the Uganda Coffee Development Authority (UCDA) and the Cotton Development Organization (CDO). Uganda is a member of a number of international organizations and is a signatory to bilateral trade and investment treaties, as well as double taxation treaties, with a number of countries. The Investment Code of 1991 provides a number of tariff and non-tariff investment incentives and guarantees the protection of investors, thereby attracting an impressive array of private investments in the industrial sector. Since then, the lucrative offers have been replaced with more realistic conditions and the Uganda Investment Authority has transformed itself into an effective investment promotion and facilitation authority. The above-mentioned policy measures and institutional capacity developments have improved the legal and regulatory environment for investment in the manufacturing sector. According to the World Bank's Ease of Doing Business 2013 rankings, Uganda's position out of 185 countries on various criteria is given in Table 12. With the exception of resolving insolvency, paying taxes, and getting credit, Uganda ranks among the bottom 70 countries regarding its regulatory environment. In addition, Uganda's ranking was weaker in 2013 than in 2012, overall and along all indicators, except in getting credit, where Uganda's ranking improved, essentially due to the recently established Credit Reference Center. According to the World Bank's Ease of Doing Business 2012 report on 183 countries, Uganda dropped 4 places.
13Issues discussed here are crosscutting in nature and tend to affect all manufacturing sub-sectors, although not necessarily in equal magnitude. This section, therefore, does not discuss all the enabling factors for manufacturing sub-sectors, but, where there is a specific and significant effect, it will be highlighted.14UNBS is a statutory organization that was established by an Act of Parliament in June 1983 and became operational in 1989. It is mandated to provide standards, measurements, and conformity
assessment services for improved quality of life.15UIRI is a model institution for Uganda's applied research and technology-sourcing as vehicles for the incubation of industry and for pioneer self-financing research and development. It is mandated to undertake applied research and to develop and/or acquire appropriate technology in order to create a strong, effective, and competitive industrial sector in Uganda. Both UNBS and UIRI lack adequate capacity and resources to effectively execute their mandates.
13African Development Bank Group
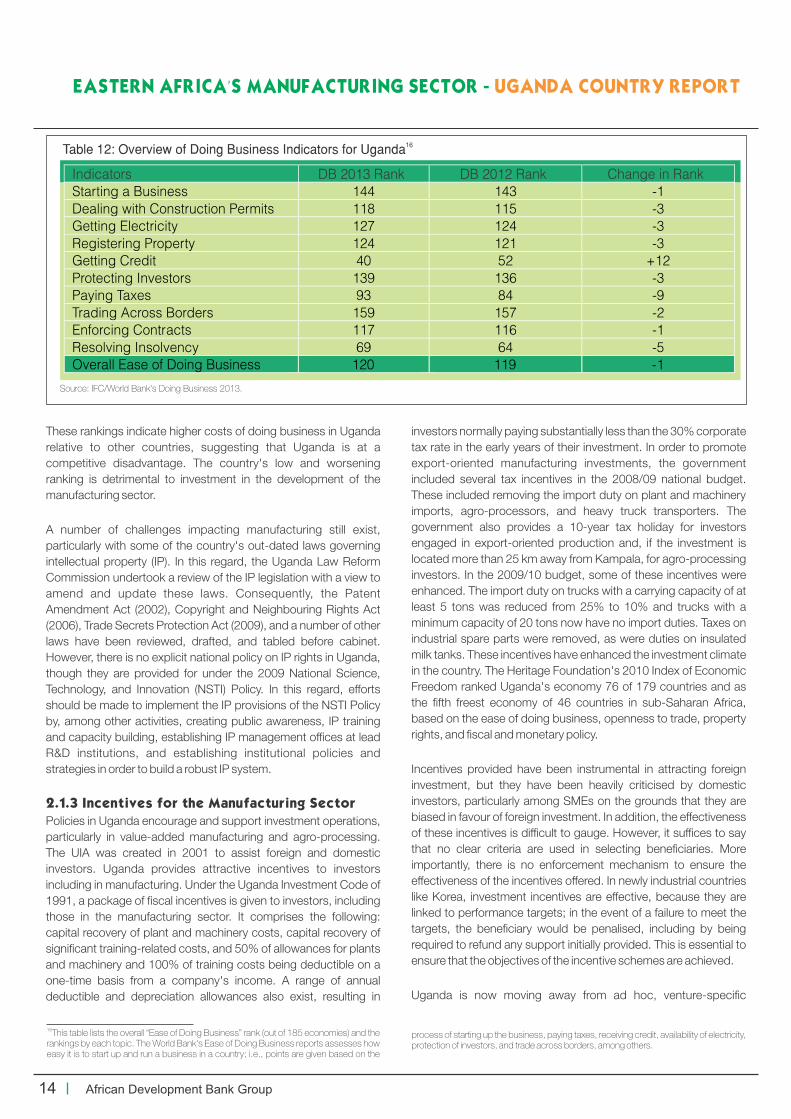
These rankings indicate higher costs of doing business in Uganda relative to other countries, suggesting that Uganda is at a competitive disadvantage. The country's low and worsening ranking is detrimental to investment in the development of the manufacturing sector.
A number of challenges impacting manufacturing still exist, particularly with some of the country's out-dated laws governing intellectual property (IP). In this regard, the Uganda Law Reform Commission undertook a review of the IP legislation with a view to amend and update these laws. Consequently, the Patent Amendment Act (2002), Copyright and Neighbouring Rights Act (2006), Trade Secrets Protection Act (2009), and a number of other laws have been reviewed, drafted, and tabled before cabinet. However, there is no explicit national policy on IP rights in Uganda, though they are provided for under the 2009 National Science, Technology, and Innovation (NSTI) Policy. In this regard, efforts should be made to implement the IP provisions of the NSTI Policy by, among other activities, creating public awareness, IP training and capacity building, establishing IP management of�ces at lead R&D institutions, and establishing institutional policies and strategies in order to build a robust IP system.
2.1.3 Incentives for the Manufacturing Sector
Policies in Uganda encourage and support investment operations, particularly in value-added manufacturing and agro-processing. The UIA was created in 2001 to assist foreign and domestic investors. Uganda provides attractive incentives to investors including in manufacturing. Under the Uganda Investment Code of 1991, a package of �scal incentives is given to investors, including those in the manufacturing sector. It comprises the following: capital recovery of plant and machinery costs, capital recovery of signi�cant training-related costs, and 50% of allowances for plants and machinery and 100% of training costs being deductible on a one-time basis from a company's income. A range of annual deductible and depreciation allowances also exist, resulting in
investors normally paying substantially less than the 30% corporate tax rate in the early years of their investment. In order to promote export-oriented manufacturing investments, the government included several tax incentives in the 2008/09 national budget. These included removing the import duty on plant and machinery imports, agro-processors, and heavy truck transporters. The government also provides a 10-year tax holiday for investors engaged in export-oriented production and, if the investment is located more than 25 km away from Kampala, for agro-processing investors. In the 2009/10 budget, some of these incentives were enhanced. The import duty on trucks with a carrying capacity of at least 5 tons was reduced from 25% to 10% and trucks with a minimum capacity of 20 tons now have no import duties. Taxes on industrial spare parts were removed, as were duties on insulated milk tanks. These incentives have enhanced the investment climate in the country. The Heritage Foundation's 2010 Index of Economic Freedom ranked Uganda's economy 76 of 179 countries and as the �fth freest economy of 46 countries in sub-Saharan Africa, based on the ease of doing business, openness to trade, property rights, and �scal and monetary policy.
Incentives provided have been instrumental in attracting foreign investment, but they have been heavily criticised by domestic investors, particularly among SMEs on the grounds that they are biased in favour of foreign investment. In addition, the effectiveness of these incentives is dif�cult to gauge. However, it suf�ces to say that no clear criteria are used in selecting bene�ciaries. More importantly, there is no enforcement mechanism to ensure the effectiveness of the incentives offered. In newly industrial countries like Korea, investment incentives are effective, because they are linked to performance targets; in the event of a failure to meet the targets, the bene�ciary would be penalised, including by being required to refund any support initially provided. This is essential to ensure that the objectives of the incentive schemes are achieved.
Uganda is now moving away from ad hoc, venture-speci�c
16This table lists the overall “Ease of Doing Business” rank (out of 185 economies) and the rankings by each topic. The World Bank's Ease of Doing Business reports assesses how easy it is to start up and run a business in a country; i.e., points are given based on the
process of starting up the business, paying taxes, receiving credit, availability of electricity, protection of investors, and trade across borders, among others.
14
EASTERN AFRICA’S MANUFACTURING SECTOR - UGANDA COUNTRY REPORT
African Development Bank Group
16Table 12: Overview of Doing Business Indicators for Uganda
Indicators DB 2013 Rank DB 2012 Rank Change in Rank
Starting a Business 144 143 -1
Dealing with Construction Permits 118 115 -3
Getting Electricity 127 124 -3
Registering Property
124
121
-3
Getting Credit
40
52
+12
Protecting Investors
139
136
-3
Paying Taxes
93
84
-9
Trading Across Borders
159
157
-2
Enforcing Contracts
117
116
-1
Resolving Insolvency
69
64
-5
Overall Ease of Doing Business
120
119
-1
Source: IFC/World Bank's Doing Business 2013.

incentives for potential investors in favour of incentives aimed at levelling the playing �eld for all investors. The UIA is implementing reforms to ease business transactions through a plan to construct a number of industrial parks in the country. One of these is located eight miles east of Kampala in Namanve, with electricity, sewage systems, roads, and telecommunications infrastructure jointly funded by the World Bank and the government. While work is still ongoing at the Namanve Industrial Park, it is open for business and companies have started to move in. According to the UIA, land at these sites is available and applications for development are being accepted. The government envisages subsidizing investors' costs based on a formula that calculates the amount to be invested and other factors, such as the number of workers to be employed by the venture. These measures have, and will, further ease the cost of doing business in Uganda.
2.1.4 Innovations and Manufacturing Sector
Policies
Science, technology, and innovation constitute key elements to manufacturing growth and development. The creation, development, and implementation of a new product or process to improve ef�ciency, effectiveness, and competitive advantage are the driving forces of a country's competitiveness in manufacturing. Thus, countries that have invested in science, technology, and innovations have succeeded in improving the quality of their production. In Uganda, the level of innovation among manufacturing �rms is low, with most of the innovating �rms engaged in processing (agro-processing), rather than product innovation. Moreover, most of the �rms that introduce new products commercialize them without IP protection.
In this regard, the commitment to support industrial innovations is recognised in policy and political leadership at the highest level of government in Uganda. The government has established policies and programs to support innovative scientists and to strengthen the national system of innovation through the UNCST, which was established in 1990 to strengthen and accelerate the policy process on science, technology, and innovation in the country. The National Science, Technology, and Innovation Policy adopted in 2009 and the National Science and Technology Plan adopted in 2012 both aim to improve industrial innovation and research capacity in Uganda. The Policy speci�cally articulates the government's commitment to fostering R&D in building the human capital that Uganda requires for a knowledge-based economy.
Other initiatives include the following: the National Innovation Fund
established in 2003/04; the Government Support to Scientists and the Millennium Science Initiative (MSI) that �nances high qualityresearch, undergraduate science, and engineering programmes; academia-private sector partnerships; student internships; science policy; and popularization of science in the communities. These activities focus on providing support and building the country's science, technology, and innovation (STI) capacity. The government's commitment to innovation is further demonstrated in
17budget allocations (about 0.3% of GDP ) to support R&D (UNCST 2010; ECA 2013). Though this amount is short of the government's goal, it is higher than that of many sub-Saharan countries. One of the key objectives of government-funded research is to promote the utilization of high quality research output through technology transfers to the private sector and to promote close working relationships between industry and universities, thereby facilitating the quicker commercialization of new technologies.
According to the Republic of Uganda (2012), Uganda's science and technology infrastructure comprises over 34 universities, 6 of
18which offer science and engineering courses . There are 33 science-related vocational and technical institutes offering training in technical skills needed in industry, plus 20 active R&D institutes. However, research institutions are �nancially weak and have a limited technical capacity to undertake applied research. In addition, the governance and coordination of the STI system in Uganda are complicated by the involvement of several sector ministries and autonomous institutions, at times with overlapping mandates. The linkage between key actors in innovative systems (e.g., research community, universities, industries, and users) is minimal in Uganda.
A World Bank report (2011) on such issues as science and technology in Uganda identi�es further challenges to innovation in the country's industrial sector. First, a number of industry representatives consider Ugandan graduates to lack basic technology skills and professional certi�cations for performing speci�c tasks, such as in chemistry. Second, practical experience is weakly integrated into formal training, with manufacturing workers and several industrial �rms expressing the need to offer training to technology users, particularly on new technology, such as information and communications technologies (ICT). To emphasize the weight of this problem, the World Bank report uses a typical example in which managers at the UNBS are forced to spend up to a year providing hands-on training to recruits, preparing them to use the technology on which the laboratory relies to conduct tests for industry. Third, such hands-on training is predominately offered by companies with a large international
17This is still below the Africa Ministerial Conference on Science and Technology target for African countries to commit and invest at least 1% of their GDP in R&D to advance STI, which are key factors for industrialization and economic transformation.18Universities worldwide are generally regarded as the powerhouses of key scientific discoveries and innovations, mainly due to their high levels of knowledge-generation through research. Over 95% of basic research in Uganda is carried out in institutions of higher learning, with government-aided universities being the largest contributors. However, there is an increasing demand for the country's universities to upgrade their research capabilities and disseminate and avail their research findings for industrial and commercial application.
15African Development Bank Group
outreach, leaving out SMEs, many of which assume that they do not have the resources to integrate industrial attachment opportunities for students into their business models. Fourth, there is no collaboration between training institutions and industrial players to ensure that the skills imparted are in line with the needs of
19the manufacturing sector . This essentially requires developing institutional mechanisms to integrate the needs of industry in curriculum development and reform at all levels of education, from basic to vocational, tertiary, and graduate-level education.
Apart from training in formal academic institutions, there are also business R&D institutions geared to enhance and strengthen industrial development efforts. These include the UIRI, which, as noted previously, is a leader in the application of science to industry by engaging in activities designed to facilitate rapid industrialization through the identi�cation of appropriate and affordable technologies that add value to local products for national, regional, and international markets. UIRI does this through focused R&D and by designing prototypes to help train and develop enterprises. In this regard, UIRI has had a decade of successful research implementation and outreach. Its recent efforts have focused on boosting its capacity and outreach to key industrial sectors, ranging from textiles to food processing and bamboo production. Institutions like UIRI are particularly important as sources of technical assistance, knowledge, funding, and partnership creation for entrepreneurs and manufacturing �rms seeking opportunities to increase the knowledge and technology content of their products and processes.
Harnessing STI opportunities to modernize the manufacturing sector in Uganda faces a number of institutional challenges. First, the ability of Uganda manufacturing �rms to access, adapt to, and absorb imported technology into the industrial sector is hampered by barriers, including those that inhibit its importation, procurement, access, and distribution. Protracted delays due to burdensome customs procedures are some of these institutional constraints impeding access to imported technology. On the other hand, the high cost of capital, in the form of interest rates on loans for capital investment (averaging 20-30%), discourages potential investors from upgrading technology. Second, institutions responsible for aspects of metrology, standards, testing, and
20quality assurance face a number of challenges ranging from a lack of competence and understaf�ng to limited funding and information gaps. Third, few research institutions work on local challenges de�ned by domestic stakeholders, as nearly all research funding comes from donors and is dedicated to work on problems of concern to, and de�ned by, them. Fourth, a lack of science parks and incubators in the country impedes the creation of conditions conducive to research and technology development. Other challenges include the following: a lack of entrepreneurship development for, and institutions supportive of, SME development; inadequate industrial institutional support services for the development of a competitive manufacturing sector; and a lack of
engineering industries, particularly to produce capital and intermediate goods, spare parts, and components, the absence of which adversely affects the country's ability enhance product design, production, and maintenance know-how.
2.1.5 Support Institutions to Manufacturing
Sector
The government in Uganda has in place a number of policies and strategies to improve the business and investment climate. The government's commitment for priority support to STI is re�ected in the NDP 2009/10-2014/15 approved in 2010 and the National Science, Technology, and Innovation Policy of 2009. The NDP has a strong focus on economic growth and employment creation through accelerated national economic development and transformation. Various other sector approaches are outlined in the National Industrial Policy, the National Export Strategy (NES), and the Competitiveness and Investment Climate Strategy (CICS). The goal of CICS is to contribute to the enhancement of productivity, competitiveness, and incomes by identifying constraints to private sector growth in Uganda (Republic of Uganda 2011).
In addition, there are trade and business associations that are supportive of the manufacturing sector in Uganda. These include the Uganda Manufacturer's Association (UMA), The Private Sector Foundation Uganda (PSFU), and the Uganda National Chamber of Commerce and Industry (NCCI). Their respective roles in supporting the manufacturing sector's development in Uganda is analysed in this report. It is important to note that increased commitment to support economic growth, including in the manufacturing sector, has entailed the prioritization of policies and actions to both target improvements in the business environment and to align national resources with proposals for policy reforms recommended by the business community in Uganda. Currently, the PSFU engages the government in policy issues, including those affecting the manufacturing sector, particularly during the preparation of the annual budget. While these institutions have been quite successful in policy advocacy and in collaborating with the government to improve the business environment to attract more domestic and foreign investments, their role in R&D, in forging sub-contracting arrangements for their members, and in securing technology and information on technology and markets has been very limited.
2.1.6 Infrastructure: Energy, Transport, and
Communication
Strong inf rastructure enhances the product iv i ty and competitiveness of an economy, particularly in the manufacturing sector. Ef�cient infrastructure connects manufacturing �rms to their customers and input suppliers; it also enables the use of modern equipment and production technologies. Consequently, infrastructure de�ciencies create barriers and impede the exploitation of productive opportunities, increase costs for
19The exception is petroleum engineering and geology, where Government scientists and engineers work with Makerere University to help develop curricula that teach students the geophysics needed in mineral extraction.20Active institutions in this area are the UNBS, UIRI, Uganda Government Analytic
16
EASTERN AFRICA’S MANUFACTURING SECTOR - UGANDA COUNTRY REPORT
African Development Bank Group
Laboratory (UAL), Chemiphar, and SGS. Except for the Belgian-owned Chemiphar, only the microbiology laboratory of UNBS is accredited, though UIRI has commissioned an investment to establish an accredited microbiology unit.
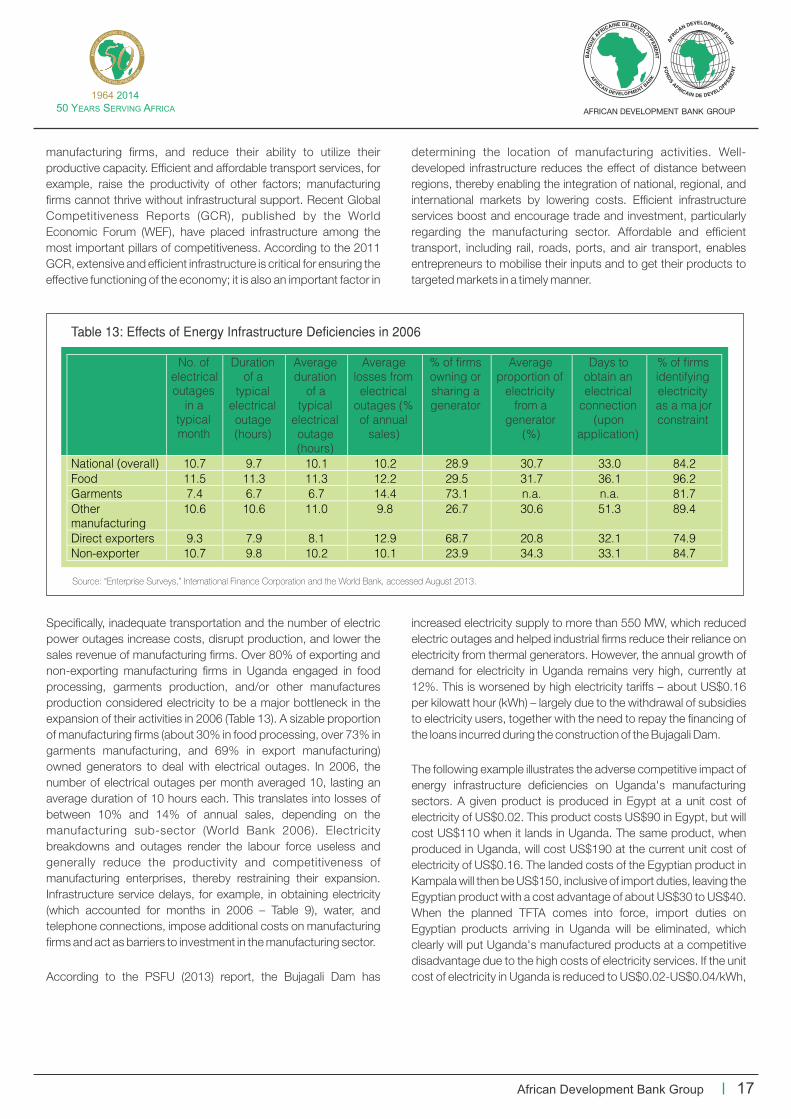
manufacturing �rms, and reduce their ability to utilize their productive capacity. Ef�cient and affordable transport services, for example, raise the productivity of other factors; manufacturing �rms cannot thrive without infrastructural support. Recent Global Competitiveness Reports (GCR), published by the World Economic Forum (WEF), have placed infrastructure among the most important pillars of competitiveness. According to the 2011 GCR, extensive and ef�cient infrastructure is critical for ensuring the effective functioning of the economy; it is also an important factor in
determining the location of manufacturing activities. Well-developed infrastructure reduces the effect of distance between regions, thereby enabling the integration of national, regional, and international markets by lowering costs. Ef�cient infrastructure services boost and encourage trade and investment, particularly regarding the manufacturing sector. Affordable and ef�cient transport, including rail, roads, ports, and air transport, enables entrepreneurs to mobilise their inputs and to get their products to targeted markets in a timely manner.
17African Development Bank Group
Table 13: Effects of Energy Infrastructure Deficiencies in 2006
No. of electricaloutages
in a typical month
Duration of a
typical electrical outage (hours)
Average duration
of a typical
electrical outage (hours)
Average losses from electrical
outages (% of annual
sales)
% of firms owning or sharing a generator
Average proportion of
electricity from a
generator (%)
Days to obtain an electrical
connection (upon
application)
% of firms identifying electricity as a ma jor constraint
National (overall)
10.7
9.7
10.1
10.2
28.9
30.7
33.0
84.2
Food
11.5
11.3
11.3
12.2
29.5
31.7
36.1
96.2
Garments
7.4
6.7
6.7
14.4
73.1
n.a.
n.a.
81.7
Other manufacturing
10.6
10.6
11.0
9.8
26.7
30.6
51.3
89.4
Direct exporters
9.3
7.9
8.1
12.9
68.7
20.8
32.1
74.9
Non-exporter
10.7
9.8
10.2
10.1
23.9
34.3
33.1
84.7
Source: “Enterprise Surveys,” International Finance Corporation and the World Bank, accessed August 2013.
Speci�cally, inadequate transportation and the number of electric power outages increase costs, disrupt production, and lower the sales revenue of manufacturing �rms. Over 80% of exporting and non-exporting manufacturing �rms in Uganda engaged in food processing, garments production, and/or other manufactures production considered electricity to be a major bottleneck in the expansion of their activities in 2006 (Table 13). A sizable proportion of manufacturing �rms (about 30% in food processing, over 73% in garments manufacturing, and 69% in export manufacturing) owned generators to deal with electrical outages. In 2006, the number of electrical outages per month averaged 10, lasting an average duration of 10 hours each. This translates into losses of between 10% and 14% of annual sales, depending on the manufacturing sub-sector (World Bank 2006). Electricity breakdowns and outages render the labour force useless and generally reduce the productivity and competitiveness of manufacturing enterprises, thereby restraining their expansion. Infrastructure service delays, for example, in obtaining electricity (which accounted for months in 2006 – Table 9), water, and telephone connections, impose additional costs on manufacturing �rms and act as barriers to investment in the manufacturing sector.
According to the PSFU (2013) report, the Bujagali Dam has
increased electricity supply to more than 550 MW, which reduced electric outages and helped industrial �rms reduce their reliance on electricity from thermal generators. However, the annual growth of demand for electricity in Uganda remains very high, currently at 12%. This is worsened by high electricity tariffs – about US$0.16 per kilowatt hour (kWh) – largely due to the withdrawal of subsidies to electricity users, together with the need to repay the �nancing of the loans incurred during the construction of the Bujagali Dam.
The following example illustrates the adverse competitive impact of energy infrastructure de�ciencies on Uganda's manufacturing sectors. A given product is produced in Egypt at a unit cost of electricity of US$0.02. This product costs US$90 in Egypt, but will cost US$110 when it lands in Uganda. The same product, when produced in Uganda, will cost US$190 at the current unit cost of electricity of US$0.16. The landed costs of the Egyptian product in Kampala will then be US$150, inclusive of import duties, leaving the Egyptian product with a cost advantage of about US$30 to US$40. When the planned TFTA comes into force, import duties on Egyptian products arriving in Uganda will be eliminated, which clearly will put Uganda's manufactured products at a competitive disadvantage due to the high costs of electricity services. If the unit cost of electricity in Uganda is reduced to US$0.02-US$0.04/kWh,

18
EASTERN AFRICA’S MANUFACTURING SECTOR - UGANDA COUNTRY REPORT
African Development Bank Group
the �nal product will cost about US$80 to US$90, which is fairly competitive relative to similar products of Egyptian origin. Uganda's government has just commissioned the construction of the Karuma Dam, which, once completed, is expected to further reduce �uctuations and costs emanating from weak electricity supply and will bene�t the manufacturing sector in Uganda.
Weak transportation infrastructure and attendant high costs erode Uganda's competitiveness at regional and international levels. Linkages between markets and manufacturing centres are constrained, while Uganda's ability to tap into trade and investment opportunities in regional markets and beyond is hampered. The PSFU (2013) estimates the current transport-related costs to businesses in Uganda to be as high as 40%, which is twice the cost of the same services for similar product in other countries. Speci�cally, it costs about US$4,500 and US$3,400 for 40-foot
and 20-foot containers of imports from Mombasa to Kampala – a distance of about 1,170 km (Table 14). Corresponding costs for shipping exports from Kampala to Mombasa are US$2,300 and US$1,500, partly due to an imbalance between imports and exports, as well as stringent checks on importing to minimise import tariff revenue leakages by revenue authorities in transit and destination countries. Comparatively, 40-foot containers from Antwerp to Mombasa cost only US$2,000. Thus, it is cheaper to ship a product from China to Mombasa, than to transport the same product from Mombasa to Kampala. Given that Uganda is a landlocked country, the most viable transit route for inbound and outbound cargo to Uganda is by rail from Mombasa, but it is very slow, unreliable, and inef�cient. The PSFU (2013) argues that an improved rail transport system has the potential to reduce transport costs from Mombasa to Kampala from US$131 to US$40 per tonne.
Table 14: Road Transport Indicators for 20-foot Container
Route Distance (km)
Average VOC/ Tonne -km (US$)
Average Road Transport
Tariff (US$)
Road Transport (%) of Total Logistics Costs
Mombasa – Nairobi 430 0.129 1,300 14%
Mombasa – Kampala 1,170 0.145 3,400 23%
Mombasa –
Kigali
1,700
0.094
6,500
34%
Mombasa –
Bujumbura
2,000
0.090
8,000
37%
Mombasa –
Goma
1,880
0.094
9,500
37%
Mombasa –
Juba
1,750
0.149
9,800
35%
Source: CPCS (2010).
ICT is essential for the diffusion and application of manufacturing technologies and innovations, including within the manufacturing sector. Increases in infrastructure investments by both the government and the private sector, combined with suitable ICT policies and environment, have led to tremendous growth and development of ICT in Uganda. ICT has been contributing about 3.4% to GDP annually over past few years. The ICT infrastructure in Uganda has been gradually, but steadily, growing over the last decade. Speci�cally, the telephone sector has seen tremendous growth, with the number of subscribers growing from 1,315,300 (mobile) and 87,513 (landline) in 2005, to 9,464,979 (mobile) and 213,820 (landline) in 2009. In 2008, for example, there were 56,918 pay phones, 37 internet service providers (ISPs), 220 private FM radio stations, 50 private television stations, and 22 courier service providers in the country. The number of ISPs has grown rapidly: the total of 37 by December 2008 compares to only 17 in 2007. This ICT growth can be attributed to a number of factors: affordability and ease of use of telephone technology among the population; ease of deployment of mobile technology; instant connectivity (zero waiting time); increased range of value-added services associated with mobile phones; increased network coverage; and promotional campaigns.
2.1.7 Trade LogisticsModern business practices, such as just-in-time delivery systems and global supply chains, underscore the importance of ef�cient logistics systems to ensure not only the timely and predictable supply of inputs for the manufacturing sector, but also the delivery of manufactured goods to markets. Ef�cient logistics are essential to enhance manufacturers' ability to compete in domestic, regional, and global markets by reducing transport delays and risks, thereby lowering the cost of trading. Logistics bottlenecks result in low turnaround times. They include inef�ciencies at loading, delivery, and border-crossing points; traf�c congestion within urban areas, particularly Kampala and along key transport corridors; and roadblocks and checkpoints.
Recent initiatives, like the Automated System for Customs Data (ASYCUDA), have helped to signi�cantly reduce border-crossing times. According to the most recent World Bank enterprise survey
21for Uganda (2013) , the average time for border-crossings was reduced from 27 hours to 3 hours at Malaba border post (Kenya to Uganda) and from about 3 hours to an average of 1 hour at Katuna border post (Uganda to Rwanda). Table 15 shows improvements in overall rankings in 2010 relative to 2007 of 17%; customs and
21The World Bank's enterprise surveys collect information on constraints (average number of days to clear customs for imports and exports facing traders; damaged supplies or merchandise, i.e., loss of sale; and percentage value of exports lost during transport due to theft or merchandise breakage or spoilage).

19African Development Bank Group
Table 15: Logistics Performance Index (LPI) Rankings 2007/10, Uganda
Indicators 2010 Rank
(out of 155 countries) 2007 Rank
(out of 150 countries) Change in Rank
Customs 44 99 +55
Infrastructure
88
99
+11
International shipments
60
98
+28
Logistics Competence
74
77
+3
Tracking & tracing
113
100
-13
Timeliness
64
57
-7
Overall LPI Rank
66
83
+17
Source: World Bank's Logistics Performance Index.
Total trade logistics costs for the movement of a 20-foot container are estimated to represent 5 to 15 times the sea freight charges. As mentioned above, costs associated with direct and indirect delays account for 2% and 42% of total logistics costs, respectively. The second highest component of total logistics costs is overland road freight transport, averaging 35% of these costs, largely due to high vehicle operating costs (VOC) and the high cost of fuel. Shipping-line charges at Mombasa Port account for 9% of total logistics costs, while sea freight shipping charges represent only 8% of total logistics costs, re�ecting the fact that inland costs on the Northern Corridor are much higher than sea. Table 14 summarises the average VOCs and transport tariffs for movement of a 20-foot container from Mombasa to the main destinations along the
Northern Corridor. Overall, road transport costs accounted for between 14% and 37% of total logistics costs for importing goods. As a consequence, manufacturing �rms, particularly in food processing, as well as exporters, maintain an inventory of inputs lasting more than 2 weeks to ensure uninterrupted production. This could be avoided with ef�cient and affordable trade logistics. According to the World Bank's recent enterprises survey (2013), costs of direct and indirect delays (averaging 44% of total logistics
22costs, for which hidden costs account for 42%) account for the largest component of total logistics costs. Table 16 suggests that manufacturing �rms in Uganda (18%) and exporters (14%) consider customs and trade regulations to be major impediments.
22Hidden costs include the costs related to additional cargo dwell time and the opportunity costs of extra inventory held due to unreliability of the transport chain.
infrastructure improving 55% and 28% respectively, and marginal improvements in logistical competences.
Table 16: Trade Logistics and Manufacturing in Uganda
Group Level Days to clear direct
exports through customs
% of total sales
that are domestic
sales
Days to clear
imports from
customs
% of firms using
material inputs from
foreign sources
% of total inputs from
domestic origin
% of total
inputs from
foreign origin
Days of inventory of main input
% of firms identifying
customs and trade
regulations as a major constraint
Overall Manufacturing
3.2
96.4
7.4
41.1
78.3
21.6
16.8
9.8
Food
3.2
85.9
8.4
27.7
87.3
12.7
16.6
4.7
Garments
n.a.
94.5
n.a.
54.9
56.1
43.9
13.2
18.3
Other Manufacturing
3.0
95.4
7.4
46.5
75.3
24.7
17.0
4.1
Exporter
3.2
54.2
5.1
67.6
66.7
33.3
29.3
13.8
Non-exporter
3.3
98.6
8.6
37.7
79.8
20.2
15.2
9.6
Source: “Enterprise Surveys,” International Finance Corporation and the World Bank, accessed August 2013.
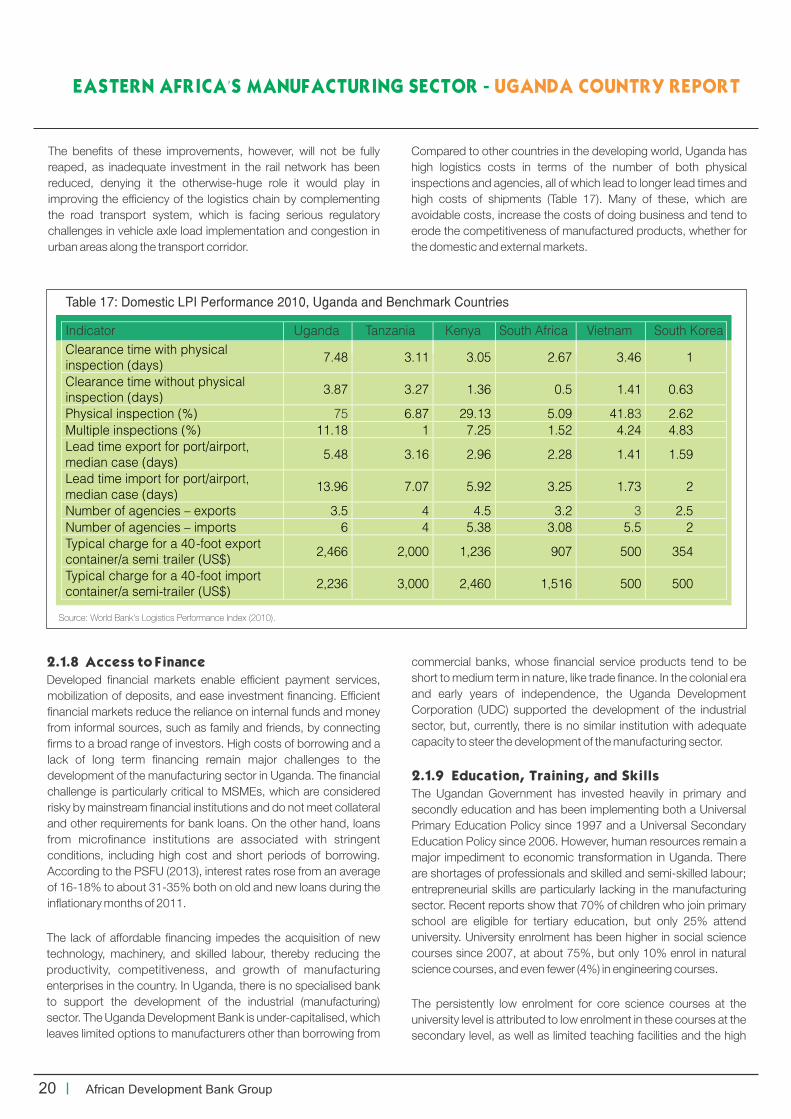
20
EASTERN AFRICA’S MANUFACTURING SECTOR - UGANDA COUNTRY REPORT
African Development Bank Group
The bene�ts of these improvements, however, will not be fully reaped, as inadequate investment in the rail network has been reduced, denying it the otherwise-huge role it would play in improving the ef�ciency of the logistics chain by complementing the road transport system, which is facing serious regulatory challenges in vehicle axle load implementation and congestion in urban areas along the transport corridor.
Compared to other countries in the developing world, Uganda has high logistics costs in terms of the number of both physical inspections and agencies, all of which lead to longer lead times and high costs of shipments (Table 17). Many of these, which are avoidable costs, increase the costs of doing business and tend to erode the competitiveness of manufactured products, whether for the domestic and external markets.
Table 17: Domestic LPI Performance 2010, Uganda and Benchmark Countries
Source: World Bank's Logistics Performance Index (2010).
Indicator Uganda Tanzania Kenya South Africa Vietnam South Korea
Clearance time with physical inspection (days) 7.48 3.11 3.05 2.67 3.46 1
Clearance time without physical inspection (days)
3.87
3.27
1.36
0.5
1.41
0.63
Physical inspection (%)
75
6.87
29.13
5.09
41.83
2.62
Multiple inspections (%)
11.18
1
7.25
1.52
4.24
4.83
Lead time export for port/airport, median case (days)
5.48
3.16
2.96
2.28
1.41
1.59
Lead time import for port/airport, median case (days)
13.96
7.07
5.92
3.25
1.73
2
Number of agencies –
exports
3.5
4
4.5
3.2
3
2.5
Number of agencies –
imports
6
4
5.38
3.08
5.5
2
Typical charge for a 40-foot export container/a semi-trailer (US$)
2,466
2,000
1,236
907
500
354
Typical charge for a 40-foot import container/a semi-trailer (US$)
2,236
3,000
2,460
1,516
500
500
2.1.8 Access to Finance
Developed �nancial markets enable ef�cient payment services, mobilization of deposits, and ease investment �nancing. Ef�cient �nancial markets reduce the reliance on internal funds and money from informal sources, such as family and friends, by connecting �rms to a broad range of investors. High costs of borrowing and a lack of long term �nancing remain major challenges to the development of the manufacturing sector in Uganda. The �nancial challenge is particularly critical to MSMEs, which are considered risky by mainstream �nancial institutions and do not meet collateral and other requirements for bank loans. On the other hand, loans from micro�nance institutions are associated with stringent conditions, including high cost and short periods of borrowing. According to the PSFU (2013), interest rates rose from an average of 16-18% to about 31-35% both on old and new loans during the in�ationary months of 2011.
The lack of affordable �nancing impedes the acquisition of new technology, machinery, and skilled labour, thereby reducing the productivity, competitiveness, and growth of manufacturing enterprises in the country. In Uganda, there is no specialised bank to support the development of the industrial (manufacturing) sector. The Uganda Development Bank is under-capitalised, which leaves limited options to manufacturers other than borrowing from
commercial banks, whose �nancial service products tend to be short to medium term in nature, like trade �nance. In the colonial era and early years of independence, the Uganda Development Corporation (UDC) supported the development of the industrial sector, but, currently, there is no similar institution with adequate capacity to steer the development of the manufacturing sector.
2.1.9 Education, Training, and Skills
The Ugandan Government has invested heavily in primary and secondly education and has been implementing both a Universal Primary Education Policy since 1997 and a Universal Secondary Education Policy since 2006. However, human resources remain a major impediment to economic transformation in Uganda. There are shortages of professionals and skilled and semi-skilled labour; entrepreneurial skills are particularly lacking in the manufacturing sector. Recent reports show that 70% of children who join primary school are eligible for tertiary education, but only 25% attend university. University enrolment has been higher in social science courses since 2007, at about 75%, but only 10% enrol in natural science courses, and even fewer (4%) in engineering courses.
The persistently low enrolment for core science courses at the university level is attributed to low enrolment in these courses at the secondary level, as well as limited teaching facilities and the high

21African Development Bank Group
cost of private sponsorship for science courses. The information in Table 18 shows an increase in the number of social science graduates in both Masters and Bachelors degrees, while the core science courses registered a decline of 79% in PhDs. The relatively
small number of graduates in the core sciences re�ects the critical need for a concerted effort to demystify science subjects at the secondary level and to provide the necessary science infrastructure at all levels of education.
Table 18: Graduates by Field and Degree Level, 2007 and 2008
PhD Masters Bachelors
2007 2008 2007 2008 2007 2008
Social Science 6 5 710 965 14,247 15,940
Humanities
0
0
24
41
881
789
Agricultural Sciences
5
2
17
7
339
230
Medical Sciences
8
0
96
45
331
171
Engineering and technology
3
1
14
8
783
432
Natural Sciences
8
2
118
71
1845
1182
TOTAL
30
10
979
1,137
18,426
18,744
Source: UNCST (2009).
The private sector in Uganda has identi�ed low labour productivity and a lack of innovation and entrepreneurial skills to be major impediments to the expansion of the country's many manufacturing activities (PSFU 2013). Enterprise surveys by the World Bank in 2013 indicate that about 10% of manufacturing �rms in Uganda considered the lack of a skilled labour force to be a major constraint to their activities (Table 19). The garment sub-sector is the most constrained by an inadequately skilled workforce, with over 36% of manufacturing �rms raising this as a major impediment. The PSFU attributes inadequate skills to mismatches
between the current demand and supply of labour, as well as to the education system not being tailored to industrial needs (it trains more people in theoretical, as opposed to hands-on and practical, skills). The weak technical skills among manufacturing workers have been attributed to the inadequate capacity of training institutes. As a result, the labour productivity in the workplace in Uganda is lower than that of other countries in Africa (Republic of Uganda 2012). It is estimated that the country's workforce is 28% less productive than the Tanzanian workforce and 68% less productive than the work force in Kenya.
Table 19: Workforce Challenges in the Manufacturing Sector in Uganda
Sub-group Level
% of firms offering formal
training
% of workers offered formal
training
Years of the top manager's experience
working in the firm's sector
% of unskilled workers (out of all production
workers)
% of firms identifying an inadequately
educated workforce as a major constraint
Overall
35.0
57.3
10.0
46.0
10.2
Food
37.8
56.8
10.1
54.4
5.6
Garments
36.6
n.a.
13.8
16.7
36.6
Other Manufacturing
33.6
56.1
11.3
43.5
8.6
Exporters
57.9
61.2
14.2
63.3
5.5
Non-exporter
32.0
56.7
9.8
43.9
10.4
Source: “Enterprise Surveys,” International Finance Corporation and the World Bank, accessed August 2013.
A high portion of the youth in Uganda is unemployed, over 30% in some sectors, including manufacturing, which is partly due to a lack of requisite skills. The current vocational training system in Uganda is neither delivering the skills and mastery, nor the quality, needed by the labour force to be employed in manufacturing. The challenge of training the workforce in Uganda is further exacerbated by the capacity inadequacies of vocational, science,
and technical training institutions, with a lack of emphasis on hands-on apprenticeships and mastery of tasks. There have been initiatives to reorient their approach to skills development by prioritizing skills supportive of production. This is expected to be guided by the Business, Technical and Vocational Education Training (BTVET) Policy and Strategic Plan, whose implementation has yet to get the �nancial resources from the government. To meet

22
EASTERN AFRICA’S MANUFACTURING SECTOR - UGANDA COUNTRY REPORT
African Development Bank Group
23It has not been possible to compute the concentration indices of manufactured exports by export market of destination, because of data challenges.
Table 20: Concentration of Uganda's Manufactured Exports, by Product, 2001-2012
2001 2002 2003 2004 2005 2006 2007 2008 2009 2010 2011 2012
Concentration ratio24 0.75 0.75 0.68 0.65 0.59 0.61 0.43 0.48 0.49 0.48 0.51 0.47
Herfindahl-Hirschman Index (HHI)25
0.1099 0.1411 0.0750 0.0614 0.0649 0.0841 0.0278 0.0324 0.0334 0.0314 0.0332 0.0320
MPDI Uganda26 0.3998
0.4072
0.3959
0.3913
0.3633
0.3832
0.3570
0.3564
0.3502
0.3308
0.3328
0.3223
Source: ITC's TradeMap (August 2013).
24The concentration ratio is calculated here as the share of the 10 most important manufactured export products (at HS 6-digit level) in total manufactured exports.25 where is the share of export product in total manufactured exports, in %.
26The MPDI is computed by measuring absolute deviation of the country's share from worldstructure, as follows: where is the share of product in total manufactured exports of country and is the share of product i in total world manufactured exports; only those manufactured products whose share in a country's total manufactured exports is 0.5% or above are considered.
the changing needs of manufacturing �rms, the BTVET training curriculum will have to be reviewed, while the public mind-set/perceptions regarding graduates from vocational and technical institutions will have to change. Throughout the consultations, especially with the private sector, there has been an emphasis on the need for increased internships, deeper industrial attachments, and an apprenticeship policy and strategy aimed at both training the labour force for the needs of industrial players, as well as promoting a more positive work culture/ethics.
2.2 Product Diversification and Structural
Transformation
2.2.1 Product Diversification
Export concentration re�ects the degree to which a country's exports are concentrated on a small number of products or a small number of trading partners (markets). A country that exports one
product to only one trading partner has a perfectly concentrated export portfolio. Conversely, a country whose exports comprise a larger number of products and that trades with a larger number of trading partners has a lower export concentration ratio (ECR); that is, it has more diversi�ed exports. This analysis uses ECR, the HHI, and the Manufactured Product Diversi�cation Index (MPDI), in which scores go from 0 (the most diversi�ed) to 1 (the least diversi�ed), to assess the extent to which Uganda's manufactured exports are concentrated. Examining trends in Uganda's ECR indicates that the country's manufactured exports are relatively less diversi�ed with an ECR of about 0.75 and an HHI of 0.11 in the early 2000s (Table 20 and Figure 6). However, this has been declining over time to ECR and HHI values of about 0.5 and 0.03, respectively, through the second half of the 2000s. The MPDI also indicates a decline from 0.3998 in 2001 to 0.3223 in 2012. All these suggest an increasingly diversi�ed basket of manufactured exports from Uganda. This is an encouraging development, which requires policy support to strengthen it
In comparison with other developing countries, Uganda performed relatively well in terms of improving its diversity of manufactured exports. According to a recent UNDP report (2011), the ECR of the LDCs increased from 0.23 in 1998 to 0.55 in 2009, re�ecting an increasing tendency towards export concentration across developing countries. Looking beyond LDCs, Figure 6 and Figure
277 show that Uganda performed better in terms of increasing the
product composition of its manufactured exports relative to some countries in the region, but lags behind industrializing developing countries in Asia. This implies that Uganda needs to step up efforts in increasing the diversity of its manufactured exports if it is to bene�t from a wider range of manufactured export products and avoid the dangers associated with a high dependence on a few products.
27The trend is the same even when one uses the MPDI for Uganda and comparator countries between 2001 and 2012.

23African Development Bank Group
28For Burundi, 2003 data has been used instead of 2001 data.
28Figure 6: Concentration ratio, by product, for Uganda and comparator countries, 2001/2012
Source: International Trade Centre's TradeMap.
0.00
0.10
0.20
0.30
0.40
0.50
0.60
0.70
0.80
0.90
1.00
2001
2012

24
EASTERN AFRICA’S MANUFACTURING SECTOR - UGANDA COUNTRY REPORT
African Development Bank Group
302.2.2 Structural Transformation
Overall, Uganda has made considerable progress in diversifying its export product composition. The shift towards more diversi�ed export products was particularly pronounced in the late 1990s and throughout the 2000s, during which Uganda's exports went beyond the traditional exports, namely coffee, tea, tobacco, and cotton, to the non-traditional exports of �sh, �owers, fruits, etc. Within the manufacturing sector, all the indicators in the foregoing analysis show some degree of modest diversi�cation in the product composition of manufactured exports. As discussed previously, the manufacturing sector in Uganda is largely dominated by food processing and is characterised by last-stage fabrication with high-import content.
Notwithstanding such an encouraging diversi�cation trend, there has been little progress with regards to value addition, that is, the
export of manufactured products with a high level of processing and sophistication. Uganda's exports are largely low-value products and resource-based manufactures, which have a very
31,low technology content yet high-technology content exports remain the largest earners of foreign exchange in other developing economies. Information in Table 21 shows that over 43% of Uganda's manufactured exports were resource-based in 2001; this share rose to 47% in 2012. Only about 21% of its manufactured
32exports were high- and medium-technology products in 2001, though this increased to 33%, in 2012. This re�ects weak skills and low technology uptake, which points to the critical need for technology-intensive and value-added products and processes. However, such manufacturing technologies may not be easily available through the usual technology transfer modes. Therefore, innovative mechanisms for attracting FDI with high-technical content are needed.
29For Burundi, 2003 data has been used instead of 2001 data.30It has not been possible to analyse the diversification in terms of market destination, due to data problems; however, most manufactured exports from Uganda are mainly exported to regional markets in neighbouring countries like South Sudan, the DRC, Rwanda, and Burundi.
31These largely comprise food processing, tobacco and beverages, paper printing, textile and clothing, and wood and furniture.32In this case, high-technology products include the following: computers and office machinery, transport equipment, electronics communications, non-electric machinery, and pharmaceuticals and chemicals. Medium-technology products largely comprise the following: rubber and plastic products, ferrous and non-ferrous metals, non-metallic mineral products, fabricated metal products, and other manufacturing.
29Figure 7: HHI, by product, for Uganda and comparator countries, 2001/2012
Source: International Trade Centre's TradeMap.
0.0000
0.1000
0.2000
0.3000
0.4000
0.5000
0.6000
0.7000
0.8000
2001
2012

25African Development Bank Group
33The figures for this table were calculated following UNIDO's technological classification of manufactured exports according to SITC revision 3 (for the detailed classification of SITC sections per category, please see Annex 1 of UNIDO's Tanzania Industrial
Competitiveness report, 2012, 104). Please note that the definition of “manufactured export” according to this classification is narrower than the definition we used elsewhere in the report.
33Table 21: Change in Uganda's Manufacturing Exports by Technology Classification, 2001-2012
2001 2002 2003
2004 2005
2006 2007
2008 2009
2010 2011
2012
Resource-based exports (%) 43.1 53.5 52.1 43.1 46.7 53.2 50.8 46.6 50.1 48.5 48.3 47.0
Low-technology exports (%) 35.2 20.2 19.4 26.8 27.1 23.0 25.0 21.6 18.5 19.2 19.6 19.9
Medium-technology exports (%)
17.6 21.0 22.0 22.5 19.6 19.4 20.8 19.4 19.8 18.5 16.6 16.6
High-technology exports (%)
4.0
5.2
6.5
7.6
6.6
4.4
3.4
12.4
11.6
13.8
15.5
16.4
Source: International Trade Centre's TradeMap (August 2013).
As noted elsewhere in this report, many manufacturing �rms in Uganda continue to operate below their installed capacity. This is due to either importing obsolete and inappropriate technologies, a lack of or poor maintenance of machinery, high power outages and load shedding, and a lack of or inadequate level of technical know-how and personnel. Thus, it is essential to strengthen the institutions mandated to oversee technology transfers, assessment, and forecasting technology needs of the country, such as UNBS, UIRI, UNCST, URSB, UIA, and UEPB.
The information in Figure 8 further suggests that Uganda's export of manufactures is dominated by resource-based products (about 47%), compared to some industrializing developing countries like
China, Vietnam, and South Korea. However, Uganda is closer to South Africa, though relatively better than the Eastern Africa region (with an average of 60%). The continued concentration of the country's manufactured exports in resource-based products re�ects the dominance of food processing manufacturing activities and should be of serious concern for policy makers. Historically, countries aim to move towards products of high value and with high technology content. However, constraints in terms of skills, technology uptake, and institutional and infrastructure capacity will have to be addressed to support the manufacturing sector in graduating to producing more diversi�ed products and high-value export products.
Figure 8: Manufactured Exports by Technology Classification for Uganda and Comparator Countries, 2012
Source: International Trade Centre's TradeMap (August 2013).
47.0%
60.1%
45.2%
7.7%
8.4%
25.0%
19.9%
21.7%
9.1%
45.0%
33.3%
15.4%
16.6%
13.4%
41.8%
16.2%
30.1%
45.2%
16.4%
4.9%
3.9%
31.1%
28.2%
14.4%
0% 10% 20% 30% 40% 50% 60% 70% 80% 90% 100%
Uganda
East Africa(average)
South Africa
Vietnam
China
Rep.Korea
Resource-based Low-technology Medium-technology High-technology

26
EASTERN AFRICA’S MANUFACTURING SECTOR - UGANDA COUNTRY REPORT
African Development Bank Group
2.3 SWOT Analysis of the Manufacturing Sector
in Uganda
The objective here is to highlight the strengths of, opportunities for, weaknesses of, and threats to (SWOT) Uganda's manufacturing. The major focus is to highlight and summarise challenges and weakness that must be addressed, building mainly on the sector's strengths and exploiting the opportunities available. As discussed earlier, there are a number opportunities for, and strengths of, the manufacturing sector in Uganda, including the commitment of the government at the highest level, wide regional markets and those beyond, active engagements in investment and trade agreements,
a trainable and adaptable labour, and a diverse natural resource base to support vertical and horizontal diversi�cation (including into value addition) (Table 22). There are, however, binding constraints on the country's ability to exploit such opportunities. As noted earlier, these include institutional, capacity, legal/regulatory, and developmental constraints (such as a lack of infrastructure, costly and inaccessible development �nancing, and lacking technology). Left unaddressed and with increasingly stiff competition from imported products under the current liberal and globalised trade regime, these weaknesses pose a threat to the development of a vibrant manufacturing sector in Uganda.
Table 22: SWOT Analysis of the Manufacturing Sector in Uganda
Strengths · Strong government commitment to sustain
macroeconomic stability; creating and supporting conducive investment;
· Consistent economic growth rate of about 7% over the last two decades;
·
Central location in east and south Africa, enabling tapping into markets in bordering countries;
·
Membership in COMESA, EAC, and Tripartite FTA offers access to potentially significant regional market;
·
Party to various bilateral and multilateral trade/investment agreements
·
Preferential trade schemes like AGOA, EPA GSPs, etc.
·
Trainable low-cost labour (training and skill-increasing potential); and
·
Conducive aspects of business environment, policies regulations, etc.
Weaknesses · Cost disadvantages;
· Lack of requisite skills;
· Constraints set by business environment, policies, regulations, etc.; and
·
The country's landlocked position and defective infrastructure (e.g., transport and energy) increase production costs.
Opportunities
·
Remarkably plenty of natural resource (e.g., agriculture, fisheries, and minerals including oil) to support vertical
manufacturing along the value chain (downstream/upstream) and horizontal diversification;
·
Domestic market demand; and
·
Regional and international export market demand.
Threats
·
Factors adversely affecting the sector and future development; and
·
Stiff competition from better quality and cheaper imported goods pose a threat to domestic manufacturing.
2.3.1 SWOT Analysis at Sub-sector Level
Due to limited resources, this analysis was not in a position to conduct �rm level or manufacturing sub-sector assessments of development, opportunities, and challenges in each of the sub-sectors discussed in this report. Additionally, there are few studies with detailed analysis at �rm or manufacturing sub-sector levels in Uganda to inform our discussion. However, this discussion will focuses on the leather industry, which heavily depends on hides, skins, textiles, and clothing, to shed light on some of the issues pertaining to Uganda's manufacturing's sub-sectors.
2.3.1.1 Leather and footwear industry in Uganda
The leather and footwear industry in Uganda has tremendous opportunities in terms of input supply and market access for its output. The total amount of hides and skins produced in the country cannot be calculated with certainty, but can be estimated using the number of livestock available in the country. According to the UIA, the cattle population in Uganda increased by about 75%, from 6.5 million heads of cattle in 2004 to 11.4 million in 2008; goats and sheep increased by 40% and 120%, respectively, over the same period. The phenomenal increase in the livestock

27African Development Bank Group
population has been attributed to the general improvement in animal health services, improved breeding programmes, and better management practices. These indicate the potential opportunities of the country's leather industry in terms of inputs.
Ugandan hides produce high quality-grade leather for shoe uppers, with some hides suitable for furniture leather when processed. According to the UIA, preservation of hides in Uganda is accomplished through suspension drying (10%) and wet salting (90%), while sun drying (70%) is the major method of preservation
34of skins. Hides and skins are the only products from Ugandan livestock that have been able to break into the global export market, annually earning about US$6 million.
Uganda currently exports close to 90% of its hides and skins in an unprocessed form. Most of the tanneries in Uganda process hides and skins to the stage of wet blue for export, which is a small percentage of overall processing of raw materials, standing at about 10% for hides and 40% for skins. The Leather Industries of Uganda is the only �rm currently processing leather to �nished stage, ready for use in the local market. Today's total market size in Uganda for leather shoes is 15 million pairs per year, and another 10 million pairs for synthetic shoes. However, less than 4 million pairs of shoes are produced in Uganda. Importation of shoes, whether new or second-hand, indicates the market potential for the leather industry domestically, but also presents a threat from imported and probably better quality shoes.
34Milk has begun to penetrate the regional market, but on a much smaller scale.
2.3.1.2 Textiles and clothing industry in Uganda
Table 23: SWOT Analysis of the Textile and Clothing Manufacturing Sub-sector in Uganda
Strengths · Conducive climate and soil conditions supportive
of cotton growing provides for a wider scope for improvement in cotton production;
· Government commitment to promoting and revitalizing the growth of the textile and garment sector;
· Adequate ginning capacity;
· High-quality cotton fibre fetching a premium on
the world market; and
·
Cheap labour.
Weakness · Low cotton yields per acreage; · Lack of latest machinery and technology; · Lack of skill development and training programs;
· Absence of vertically-integrated supply chains;
· Limited value addition in terms of manufacturing of finished goods/garments;
· High cost of capital/finance and utilities;
· Inadequate funding for research;
·
Under-developed domestic market; and
·
Low labour productivity.
Opportunities
·
Huge regional and domestic demand potential for cotton fabric and textiles;
·
Uganda has preferential market access under agreements like AGOA, SADC, EBA and EPA with EU, COMESA, EAC, and the planned Tripartite FTA;
·
Tariff safeguards for cotton yarn and fabric under CET with EAC/COMESA;
·
Scope of converting raw cotton into value added products (spinning, weaving, cloth making);
·
High investment potential in areas where cotton is available; and
·
Increasing costs in emerging developing countries, notably China.
Threats
·
Threats from import of new and second-hand articles;
·
Lack of sector specific
incentives/policy framework to promote cotton and textile sub-sector;
·
Limited focus on education and training in textile and fashion;
·
Farmers shifting to other cash crops, which fetch better returns than cotton;
·
Competition from global textile manufacturers; and
·
Porous borders.
28
EASTERN AFRICA’S MANUFACTURING SECTOR - UGANDA COUNTRY REPORT
African Development Bank Group

3. POLICY OPTIONS: HARNESSING OPPORTUNITIES AND EASING THE CONSTRAINTS TO MANUFACTURING IN UGANDA
3.1 Long-term Vision
Developing countries like Uganda strive to transform their economies into modern ones, with their manufacturing sectors contributing a signi�cant share to their GDP. Economic development patterns show the signi�cant role played by industrial (manufacturing) development in promoting growth and generating structural change and transformation. In this regard, it is important to situate manufacturing both in the changing global environment and overall economic setting. Speci�cally, manufacturing contributes to investment, employment creation, skil ls development, and investments in research and technological development, thus providing an impetus for innovations and for diffusing technology. The manufacturing sector has strong linkages with the services sector and agricultural inputs supplies, while agro-processing forms a key market for agricultural output. Additionally, demand for, and prices of, manufactured exports are less volatile and less susceptible to long-term deterioration than those of primary goods. This makes manufacturing particularly strategic for economic transformation, job creation, and income generation.
Changes in the global environment that affect the performance of manufacturing around the world include technological progress, improved transportation and communication infrastructure, declining barriers to trade and investment, and the rise of developing countries as major players in the area of manufacturing. Low wage, low skills, low technology, and labour-intensive manufacturing have shifted their operations from Europe to Asia, with China as the last major bene�ciary to raise its status as a major manufacturing economy. Rising average wages are expected to see further shifts in manufacturing out of China to lower wage production locations, like Uganda. Industrial production has witnessed the fragmentation of the traditional vertically-integrated production frameworks and has led to the development of global production networks, thus increasing the number of players on the scene in different parts of the world. The increased liberalisation of trade worldwide and improved logistics have enhanced trade in intermediate products, which has fostered the development of global value/supply chains championed by multinational corporations. Trade has been signi�cantly liberalised, tariffs have been reduced, and there are now more restrictions on the use of export subsidies and quantitative restrictions, as well as other investment measures occasioned by the WTO trade rules, although LDCs are exempt.
In order to accelerate inclusive growth in Uganda, there is a need to support and strengthen industrial development, including agro-processing and manufacturing in other promising sectors. This approach would create more opportunities for enhanced growth, employment, and income-generation along entire value chains in
agriculture, industry, and services. The value chain approach to industrial growth and development is becoming a critical tool to increase value and to improve competitiveness. Serious attention needs to be paid to cross-border value/supply chains, given different capacities in manufacturing across Eastern Africa. Consequently, ROOs and other issues negotiated in various regional trade and investment agreements must be designed to enhance inter-regional trade in intermediate and semi-processed inputs that will be critical in linking up production �rms in different geographical locations of the region. In this regard, a forward-looking vision with ambitious transformation targets is essential. Such a plan has to highlight the challenges, as well as how it could be accomplished, and provide a framework of reference for public sector and corporate planning. The incorporation of a scene-setting global outlook helps position the domestic economic vision/plan against the rapidly evolving global environment, again highlighting challenges to, and opportunities for, industrial development drawing on experience and best practices elsewhere. It is important to note that the growth of industry worldwide depended on state intervention. Based on �ndings from this analysis, this section outlines recommendations for policy interventions over time, as Uganda implements its National Industrial Policy and the associated strategic plan. The recommended actions are aimed at strengthening the productivity, performance, and competitiveness of Uganda's manufacturing sector.
3.1.1 Structural Transformation
The growth of the manufacturing sector is critical in generating value addition, spurring growth in employment and productivity, developing and deepening linkages with upstream and downstream activities along the value chain, and upgrading technology. The manufacturing sector's trends portrayed above clearly point to a critical need for a transformation of the Ugandan economy aiming at increasing the share of manufacturing in GDP if the country is to catch up and become a competitive upper middle-income country in the next three decades, in line with the country's development goal as articulated in the Uganda Vision 2040 (Republic of Uganda 2013).
This policy need is already recognized at the highest level of government in Uganda. For example, over a ten-year period, the Uganda National Industrial Sector Strategic Plan aims to do the following: increase the share of manufacturing in GDP from the current 7% to 25%; boost the contribution of manufactured products in total exports by 30%; and reach 30% of GDP as value added in industry. Uganda Vision 2040 plans to increase the following: the share of the industrial sector in GDP between 2010 and 2040 from 25% to 31%; manufactures in total exports from 24.1% to 50% in 2040; labour productivity in the industrial sector from US$3,550 to US$24,820 in 2040; the labour force in the industrial sector from 7.6% to 26%; manufactured exports as a share of total exports from 4.2% to 50%; the technology up-take and diffusion, as measured by the technology achievement index (TAI), from 0.24 to 0.5; public expenditure on R&D as share of GDP
29African Development Bank Group

from 0.1% to 2.5%; and innovations, as measured by patents registered, from 3 to 6,000 (Republic of Uganda 2013).
The need for, and nature of, structural transformation in African countries is further emphasized in the UNECA Economic Report on Africa 2012. According to ECA (2012), for Uganda to achieve necessary structural economic transformation it will have to reduce the share of agriculture in the GDP by 36% (from 24.2% in 2010), increase the share of industry in GDP by 48.3% (from 25.5% in 2010), increase the share of manufacturing by 188% (from 8.3% in 2010), reduce the share of food (agricultural) exports in total merchandise exports by 91% (from 66.8% in 2010), and increase the share of export manufactures as a share of merchandise exports by 257% (from about 23% in 2010).
Given these targets and the current status of Uganda's manufacturing sector, recommendations for actions are made in support of increased productivity and competitiveness of the country's manufactured products in domestic, regional, and global markets. Recommendations are made on each of the major enabling factors impacting the productivity and competitiveness of the manufacturing sector in Uganda.
3.1.2 Harnessing Technology, Innovation,
Productivity, and Linkages
Efforts to boost Uganda's investments in the manufacturing sector must go together with strategies to enhance total factor productivity and investment ef�ciency through, for example, innovation and R&D. In this regard, it is worth noting that the quality and size of investment for innovation is important to propel manufacturing productivity, permit value addition, and generate more and better employment. Productivity can be increased by policies and institutions that stimulate technological upgrading and adoption of new work procedures through increased investment in research and innovation, transfer of technologies, close collaboration between research institutes and industrial players (to support the adaptation of technologies to local needs and conditions), and skills development through investment in education and training, including in mid-level skills.
The government needs to increase investments in employment-intensive activities like textiles, clothing, and footwear that have strong backward and forward linkages to the rest of the economy. Education and training policies need to meet the speci�c human capital needs of industrial labour markets, as well as to support the economy more widely, by developing capabilities, which may be done by increasing the level, diversity, and complexity of training and education programs.
3.1.3 Improving the Business Enabling
Environment
A successful manufacturing sector requires a business-enabling environment that strengthens domestic capacity and capability in areas relating to institutional and physical infrastructure, human capital and �nancial systems, technology and innovations, etc. There is also a need for effective regulatory frameworks to tackle
market failures and address coordination failures within the government, as well as between the government and other actors. Equally important is the need to put in place a commitment to implement industrial, trade and macroeconomic policies based on sound technical decisions. To address challenges, such as low productivity and competitiveness, in a more liberal and globalised environment, Uganda must endeavour to pursue manufacturing that is characterised by high productivity performance and innovation-led productivity growth.
Infrastructure de�ciencies generally lead to disconnections between producer processing �rms and input sources, as well as markets for manufactured goods. Infrastructure development helps to ease these bottlenecks and has spin-off bene�ts for jobs for unskilled and semi-skilled workers, as well as for training for those with basic skills. The governments should increase budgetary resources to support manufacturing sector growth, secure favourable �nancing (of infrastructure in bilateral and other investment agreements), and leverage publ ic–private partnerships.
3.2 Benefits to Uganda's Manufacturing Sector
from Regional Integration Uganda is member of a number of regional integration agreements, notably the EAC and COMESA, as well as being a signatory to other bilateral trade and investment agreements. Uganda's membership in these regional groupings poses both opportunities and threats to its manufacturing sector. Opportunities include increased market size, marketing the region as single investment destination area, exploiting cross-border value chains, reduced tariffs, and dealing with non-tariff barriers (NTBs). Real bene�ts from such opportunities, however, are dependent on Uganda's comparative advantage. The in�ux of manufactured imports from more ef�cient producing partner states could pose a real threat to the fragile and young manufacturing sector in Uganda. Two recent papers from the EPRC (Shinyekwa 2011; Shinyekwa and Othieno 2013) show that the number of Ugandan products exported into EAC partner states has been rapidly growing. The study also shows that the RCA increased for only a few products (i.e., 234 of the 4,401 product lines) during the implementation of the Customs Union, which involved the removal of internal tariffs along Uganda's borders with EAC partner countries and the adoption of a CET. Thus, only 5.3% of products with an RCA would be of strategic signi�cance for Uganda's industrialization in the context of further EAC integration. More generally, there are opportunities relating to manufacturing that could be bene�cial to Uganda:
Ÿ Increased market size, both for sourcing intermediate inputs and for marketing output from the manufacturing sector;
Ÿ A joint and coordinated incentive regime for attracting investment, particularly into manufacturing, as well as promoting manufactured exports (this reduces the potential of competing for FDI);
Ÿ A potential mechanism for cross-border production chains given the forward and backward linkages or synergies for manufacturing sectors across member countries;
30
EASTERN AFRICA’S MANUFACTURING SECTOR - UGANDA COUNTRY REPORT
African Development Bank Group

Ÿ A potential mechanism for Uganda to promote cooperation on innovation, technology transfer, and R&D;
Ÿ Joint design and implementation of mega projects that are ef�cient and economical when their provision takes a regional approach (these include major infrastructure developments like ports, railways, road network, power generation, and transmission);
Ÿ The establishment of mechanisms to mobilise and improve
access to �nance for manufacturing and related sectors; and
Ÿ The establishment of quality infrastructure through increased cooperation with countries in the region, i.e., in improving standards, technical regulations, and quality infrastructure, which reduces NTBs to trade in manufactured products.
31African Development Bank Group

32
EASTERN AFRICA’S MANUFACTURING SECTOR - UGANDA COUNTRY REPORT
African Development Bank Group

4. CONCLUSIONS, RECOMMENDATIONS, AND ACTION PLAN
4.1 Conclusions
Uganda's manufacturing sector is small, but diverse in character. It is dominated by the processing of agricultural products, which makes up about 7% of GDP. The capacity utilization of manufacturing industries remains low, with less than 50% of installed capacity for the majority of operations. The manufacturing sector is dominated by small-scale operators with some medium-sized �rms, all catering mainly to the local and regional markets. Most manufactured goods have a high content of imported inputs (suggesting last-stage processing and low value addition) and export low technical-content products.
There are a number of potential opportunities to expand the manufacturing sector in more value-added activities, given the following conditions: a diversity of natural resources; strong policy and political commitment at the highest level of government to support the development of the manufacturing sector; a low-cost, abundant, and trainable young workforce; rapidly expanding domestic and regional markets; etc. The exploitation of these potential opportunities, however, faces a number of challenges: a low-skilled workforce and weak institutions must provide market demanded skills; a low level of labour productivity; low level of technology penetration and usage (uptake); stiff competition from imports of legitimate, counterfeit, and second-hand products, particularly from Asia; and an erratic power supply and the high cost of energy, which affects many manufacturing activities. In addition, the manufacturing sector in Uganda is affected by a poor supply of industrial inputs, given the inef�cient and costly trade logistics system and the inadequate infrastructure in Uganda and the transiting countries, all leading to the high cost of imported items and long lead times. Limited access to medium-long development �nance (due to high cost of credit) remains a serious challenge to the manufacturing sector's development in Uganda, particularly among SMEs, which make up the majority of manufacturing �rms. Addressing these challenges is key to the development of a vibrant manufacturing sector in Uganda and requires bold and actionable policy measures by the government and other key stakeholder institutions in the country.
4.2 Policy Recommendations
Macroeconomic stability is a critical pre-requisite for manufacturing growth, as it creates predictable conditions, which are essential for enhanced investment. Overall there is a need to maintain a macroeconomic environment that supports and promotes investment, but limits and eliminates the use of costly �scal incentives in favour of those offering a better business environment. To ensure informed policy and production decisions, the information systems in Uganda, especially at the manufacturing sub-sector level, need to be strengthened for better-updated and more accurate industrial data. In line with this, a national repository of industrial information needs to be established to support the
analysis, evaluation, monitoring, and planning of industrialisation.
Manufacturing in Uganda is largely engaged in agro-processing and the manufacturing of chemical products, wood products, footwear, tents, ceramics, plastic products, electrical energy, aluminium products, non-mineral products, and metal and non-metal products. However, these are low-technology and low-value products. Uganda, therefore, needs to both strengthen and diversify manufacturing activities by increasing the productivity and competitiveness of manufactured products in domestic, regional, and global markets. Based on the analysis in this report, a few recommendations are made for possible action.
4.2.1 Incentives for the Manufacturing Sector
The design and implementation of a performance-based incentive framework will strengthen monitoring and enforcement to ensure that the incentives serve the objectives for which they were created. Thus, a review of the current investment incentives, particularly regarding the criteria used in selecting bene�ciaries, must be completed and a clear and transparent mechanism established to ensure the effectiveness and inclusiveness of the country's incentive regime.
Given the unique challenges facing SMEs, their dominance in the manufacturing sector (about 90%), and their role in technology and innovation uptake, an incentive regime purposely designed to support SMEs should be considered and given priority.
4.2.2 Harnessing Technology, Innovation,
Productivity, and Linkages
To ensure sustainable industrial transformation, there is a need to develop and nurture a national capacity in science and technology, incubation, and innovation. This calls for developing, �nancing, and strengthening the working linkages and collaborations between industrial research institutions (e.g., UIRI, UDC, and UCPC) and industrial players to nurture and develop a vibrant manufacturing sector. Strengthening this collaboration will also ensure the commercialization of research output, which requires additional funding and support. Furthermore, by strengthening and streamlining such current initiatives as the Science Fund, Innovative Fund, and Technology Development Fund, the current gaps between innovation and the commercialization of industrial research outcomes will be addressed. Additionally, supporting technology and innovation institutions will generate funds by commercialising their services and products and utilising the funds to promote and expand STI activities.
Alliances, joint ventures, and partnerships must be promoted, particularly with the Uganda Small Scale Industries' Association (USSIA), which has over 1,200 members countrywide; the Uganda Manufacturers Association (UMA), which brings together manufacturers; the Uganda Industrial Research Institute (UIRI) for technology incubation; the Private Sector Foundation for technology acquisition support; and the Uganda Registration Services Bureau (URSB).
33African Development Bank Group

4.2.3 Support Institutions
An Industrial Forum (Council) must be created and supported to strengthen interactive and active involvement of all stakeholders in order to enable coordination and consultations within the government, as well as to promote engagement between the government and the private sector on manufacturing issues of concern.
The capacity of institutions responsible for quality assurance must be strengthened to enable manufacturing �rms to assure clients that their products meet the quality and standards demanded by markets. The National Bureau of Standards should be given increased funding to enhance its capacity to set standards, offer quality assurance for products, and make weights and measures for research and trade. The testing of traded products (both imports and exports) is a function usually provided by government, in partnership with industry. Metrology, standards, testing, and quality assurance are extremely important to any export-oriented economy. The scope and extent of these activities is vast and the bene�ts that accrue to economies are wide-ranging.
The capacity of SMEs should be promoted, as quality compliance may be ensured through stronger business linkages between large enterprises and SMEs. This could, for example, involve the government conditioning large �rms to reserve a certain share (e.g., 15%) of inputs to be sourced from SMEs.
4.2.4 Infrastructure: Energy, Transport, and
Communication
Initiatives and reforms underway must be built upon, including, for example, transport and energy infrastructure developments. The government needs to prioritize and scale up budgetary resources to infrastructure development, particularly the railway network, to ease transport costs for imports and exports in accessing seaports. Given the nature of such investments (e.g., between states and the shear amount of resources involved), infrastructure of a regional nature (roads, railways, ports, telecommunication, electricity generation, and transmission) are better designed and implemented at the regional level.
4.2.5 Access to Finance
The cost and lack of access to development �nance remains a challenge to the development of the manufacturing sector, particularly among SMEs. The Uganda Development Bank must be recapitalized and strengthened to provide improved access to affordable and long-term credit for the development of the manufacturing sector.
A credit fund must be speci�cally created for SMEs to support and strengthen the capacity of manufacturing SMEs. Given that the formal banking system in Uganda tends to focus on larger
manufacturing �rms and the government and given that banks are reluctant to lend to SMEs, which are perceived to be highly risky and administratively costly, there is a need to create a Special Fund or Credit Line in the Uganda Development Bank (once recapitalized) purposely to support and strengthen the capacity of manufacturing SMEs.
4 2 . .6 Education, Training, and Skills Levels
Investments in employment-intensive activities like textiles, clothing, and footwear that have strong backward and forward linkages to the rest of the economy must be increased. Education and training policies need to meet the speci�c human capital needs of labour markets, as well as to support the economy more widely by developing capabilities by increasing the level, diversity, and complexity of the skills needed (e.g., increasing training for multiple skills in the workforce) in various manufacturing sub-sectors. Achievement of such manufacturing growth requires the following:
Ÿ Strengthening and promoting the l inkages and collaboration between the manufacturing industry and training institutions, for example, by reorienting the training curriculum to include light and practical mid-level engineering and management skil ls for industrial development.
Ÿ Developing technical training centres to train people who are not planning on receiving a university degree, but who wish to work in technology-based industries. Such training, which is short of a full university education, is lacking and would generate educated, trained workers who can perform technical tasks, including writing software, �xing computers, managing networks, tracking products, ensuring product quality, performing chemical testing, drilling, etc.
Ÿ Limited technological capabilities for innovation and upgrading industries in Uganda adversely impact the competitiveness of the country's manufactured products. As part of energizing manufacturing development in Uganda, the government needs to support extensions and technology transfer services to aid the manufacturing industry with R&D, testing, and evaluation. This could involve the development of science parks and incubation services to enable collaboration between industry, academia, and technology by offering low-cost land and loans, extending tax breaks, and other targeted performance-based incentives for companies that invest in technology upgrading.
4.3 Action Plan
The action plan presented in Table 24 constitutes a nucleus for further development by the government and was adjusted and completed based on comments received during the national workshop.
34
EASTERN AFRICA’S MANUFACTURING SECTOR - UGANDA COUNTRY REPORT
African Development Bank Group

Table 24: Action Matrix
Action Expected outcome
Responsibility Timing (phas es)
Pre-conditions
Ensuring stable macroeconomic conditions supportive of investment in the manufacturing sector
More investment inflows into the manufacturing sector
Bank of Uganda, MFPED, URA, UIA
Short, medium, and long terms
Low and manageable fiscal and trade deficits
1.
Incentives for the manufacturing sector
1.1.
Action 1: Review and reform the current incentive regime to design more transparent criteria for selecting beneficiary manufacturing activities
A clear mechanism established to ensure a transparent and more inclusive incentive regime
UIA, NPA, URA, MTIC, PSFU, UMA
Medium term
Legal provisions for an incentive regime for the manufacturing sector
35African Development Bank Group
1.2. Action 2: Design and implement a performance-based incentive regime
An effective and enforceable incentive system tailored and targeted to the manufacturing sector
UIA, NPA, URA, MTIC, PSFU, UMA, USSIA
Medium term Buy-in of different groups, like manufacturing firms and institutions, such as URA.
1.3.
Action 3: Create an incentive framework for manufacturing SMEs
Support to manufacturing SMEs strengthened
MITC UIA, NPA, URA, PSFU, UMA, USSIA
Medium and long term
2.
Support institutions
2.1.
Action 4: Establish an Industrial Forum
2.2.
Action 5: Develop the capacity of the quality assurance infrastructure
2.3.
Action 6: Strengthen quality assurance institutions
2.4.
Action 7: Increase the funding of institutions supportive of manufacturing in Uganda
2.5.
Action 8: Strengthen the collaboration among institutions supporting the manufacturing sector
Strong institutional capacity to support and development the manufacturing sector in Uganda
UNBS, UIRI, MTIC, URA, EAC, Private Sector
Medium and long term
Availability of funds
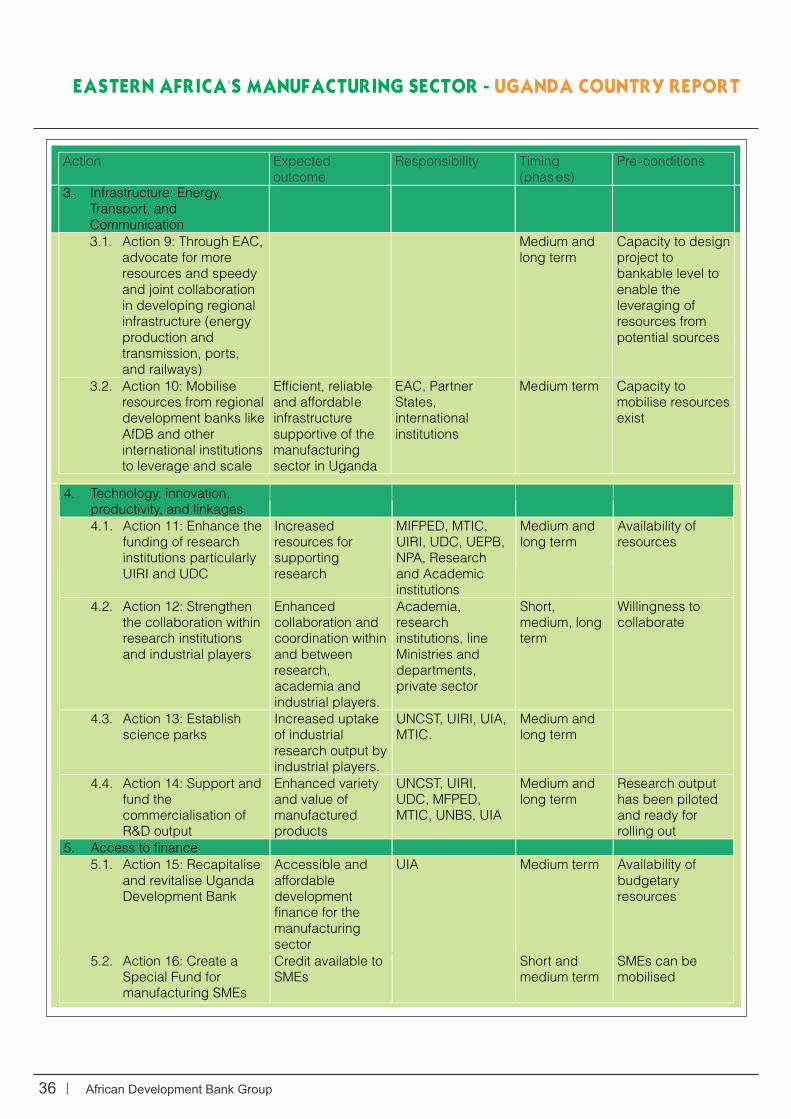
36
EASTERN AFRICA’S MANUFACTURING SECTOR - UGANDA COUNTRY REPORT
African Development Bank Group
3. Infrastructure: Energy, Transport, and Communication3.1. Action 9: Through EAC,
advocate for more resources and speedy and joint collaboration in developing regional infrastructure (energy production and transmission, ports, and railways)
Medium and long term
Capacity to design project to bankable level to enable the leveraging of resources from potential sources
3.2.
Action 10: Mobilise resources from regional development banks like AfDB and other international institutions to leverage and scale
Efficient, reliable and affordable infrastructure supportive of the manufacturing sector in Uganda
EAC, Partner States, international institutions
Medium term
Capacity to mobilise resources exist
Action Expected outcome
Responsibility Timing (phas es)
Pre-conditions
4. Technology, innovation, productivity, and linkages
4.1. Action 11: Enhance the funding of research institutions particularly UIRI and UDC
Increased resources for supporting research
MIFPED, MTIC, UIRI, UDC, UEPB, NPA, Research and Academic institutions
Medium and long term
Availability of resources
4.2.
Action 12: Strengthen the collaboration within research institutions and industrial players
Enhanced collaboration and coordination within and between research, academia and industrial players.
Academia, research institutions, line Ministries and departments, private sector
Short, medium, long term
Willingness to collaborate
4.3.
Action 13: Establish science parks
Increased uptake of industrial research output by industrial players.
UNCST, UIRI, UIA, MTIC.
Medium and long term
4.4.
Action 14: Support and fund the commercialisation of R&D output
Enhanced variety and value of manufactured products
UNCST, UIRI, UDC, MFPED, MTIC, UNBS, UIA
Medium and long term
Research output has been piloted and ready for rolling out
5.
Access to finance
5.1.
Action 15: Recapitalise and revitalise Uganda Development Bank
Accessible
and affordable development finance for the manufacturing sector
UIA
Medium term
Availability of budgetary resources
5.2.
Action 16: Create a Special Fund for manufacturing SMEs
Credit available to SMEs
Short and medium term
SMEs can be mobilised

37African Development Bank Group
6. Education, training, and skills level6.1. Action 17: Reorient the
training curriculum in training institutions
More practical skills of relevance to manufacturing sector developed
Line Ministries and Departments, Universities and other tertiary institutions, private sector including associations
Medium and long term
Willingness and capacity to collaborate among training institutions and industrial players
6.2.
Action 18: Promote mid-level skills
Experienced workforce and hands-on skills for manufacturing developed
Line ministries and departments, USSIA, UMA, PSFU
Medium and long term
Action Expected outcome
Responsibility Timing (phas es)
Pre-conditions

REFERENCES
CPCS (2010), Analytical Comparative Transport Cost Study Along the Northern Corridor Region, A �nal report prepared for Northern Corridor Transit Transport Coordination Authority (NCTTCA), www.competeafrica.org
ECA (2012), Unleashing Africa's potential as a pole of global growth, Economic Report on Africa 2012, Addis Ababa, Ethiopia.
ECA (2013), Industrialisation for an Emerging Africa: Issues Paper presented at Sixth Joint Annual Meeting of the ECA Conference of African Ministers of Finance, Planning and Economic Development and AU Conference of Ministers of Economy and Finance.
Kabeba (2007), Strengthening Institutional Capacity for Science, Technology and innovation in Uganda, in Theoretical and Methodological Approaches to Social Sciences and Knowledge Management, Chapter 17: 332-340. Maio M. D. (2008), Industrial policies in developing countries: History and perspectives, Quaderno di Dipartmento N. 48.Mugabe J. O. (2011), Science, Technology and Innovation in Africa's Regional Integration: From Rhetoric to practice, ACODE Policy Research Series No. 44,
Ishengoma E. K. and Kappel R. (2011), Business Environment and Growth Potential of Micro and Small Manufacturing Enterprises in Uganda, African Development Review, Vol. 23(3):352-365
PSFU (2013), An Analysis of Uganda Private Sector Growth Challenges and Recommendations for Policy Reforms, Private Sector Platform for Action, Kampala, Uganda.
Ocampo, Jose-Antonio and Rob Vos (2008), Structural Change and economic Growth, in J. A. Ocampo and R. Vos (Eds): Uneven Economic Development, (London: Zed Books).
Republic of Uganda (2008), National Industrial Policy: A Framework for Uganda's Transformation, Competitiveness and Prosperity, Ministry of Tourism, Trade and Industry, Kampala- Uganda.
Republic of Uganda (2010a), National Industrial Sector Strategic Plan 2010/11-2014/15, Ministry of Tourism, Trade and Industry, Kampala-Uganda
Republic of Uganda (2011), Uganda Competitiveness & Investment Climate Strategy (CICS II) 2011-2015: Fostering Uganda's Competitiveness, Ministry of Finance, Planning & Economic Development, Kampala-Uganda.
Republic of Uganda (2012), National Science, technology and innovation Plan 2012/2013-2017/2018, Ministry of Finance, Planning and Economic Development, Kampala-Uganda
Republic of Uganda (2013), Uganda Vision 2040, National Planning Authority.
Shinyekwa (2011), Uganda's Comparative Advantage: The Evidence with the EAC and China, Economic Policy Research Centre Publication.
Sginyekwa I. And Othieno L. (2013), Comparing Uganda's Intra-EAC Trade and Other Trading Blocks: A gravity Model Analysis, EPRC Research Series, 100.
Ssemogerere G (2005), Productivity Performance in Developing Countries: Country Case studies – Uganda, UNIDO, Vienna.UBOS (2004), Report on the Business Enquiry, 2000/2001, Entebbe, Uganda.
UBOS (2012), The 2012 Statistical Abstract, Kampala-Uganda.UNBS (2010), Science, Technology and Innovation Uganda's Status Report 2008/2009, Kampala-Uganda.
UNBS (2011), Five Year Strategic Plan (2012-2017) for Uganda National Bureau of Standards, Kampala-Uganda.UNBS (2012), Uganda National Bureau of Standards, Annual Report 2011/2012.
UNCST (2010), S&T Statistical Abstract 2010, Kampala-Uganda. UNCST (various years), Science and technology statistics and reports, http://www.uncst.go.ug/publications/cat_view/35-sti-statistics-and-reports.html
UNIDO (2010a), Structural Change in the World Economy: Main Features and Trends, Working Paper 24/2009.
UNIDO (2011b), Industrial Policy for Prosperity: Reasoning and Approach, Working Paper 02/2011.
UNIDO (2011c), Industrial energy ef�ciency for sustainable wealth creation: Capturing environmental, economic and social dividends, Industrial Development Report 2011, Vienna.
UNIDO (2012), Economic Diversi�cation Strategies: A Key Driver in Africa New Industrial Revolution, Working Paper 2/2012.
United Nations (2004), An Investment Guide to Uganda: opportunities and Conditions, UNCTAD/ITE/IIA/2004/3 World Bank (2006), Enterprise Surveys: Country Pro�le Uganda, www.enterprisesurveys.org
World Bank (2011), Doing Business in the East African Community 2011, Washington DC.
World Bank (2011), Science, technology and innovation in Uganda: Recommendations for Policy and Action, Washington, DC: World Bank.
38
EASTERN AFRICA’S MANUFACTURING SECTOR - UGANDA COUNTRY REPORT
African Development Bank Group

ContactsAvenue du GhanaAngle des Rues Pierre de Coubertinet Hedi NouiraBP 323Tunis Belvedere 1002TunisieTel: (216) 71 10 20 05Fax: (216) 71 103 751Email: [email protected]: www.afdb.org