
East Hants, Nova Scotia RETAIL MARKET ANALYSIS€¦ · The patterns of population growth over the...
76
Prepared for the Municipality of East Hants, Nova Scotia Prepared by Cushing Terrell Architecture Inc. In collaboration with Key Planning Strategies April 2018 East Hants, Nova Scotia RETAIL MARKET ANALYSIS
Transcript of East Hants, Nova Scotia RETAIL MARKET ANALYSIS€¦ · The patterns of population growth over the...

Prepared for the Municipality of East Hants, Nova Scotia
Prepared by Cushing Terrell Architecture Inc.In collaboration with Key Planning Strategies
April 2018
East Hants, Nova ScotiaRETAIL MARKET ANALYSIS

Suite 216, 9525 201 Street | Langley, B.C. Canada | V1M 2M3 | 604.888.6680 p | www.CushingTerrell.com
RETAILMarket Analysis

This page left intentionally blank(for double-sided printing)

PREFACE .....................................................................................................................................................................i
EXECUTIVE SUMMARY .......................................................................................................................................ii
1.0 INTRODUCTION ..........................................................................................................................................1 1.1 Scope of Study & Project Background ......................................................................................................................11.2 Report Structure ................................................................................................................................................................11.3 Sources of Information ....................................................................................................................................................1
2.0 LOCATION CONTEXT ..................................................................................................................................2 2.1 Introduction .........................................................................................................................................................................22.2 Local & Regional Context ...............................................................................................................................................22.3 Transportation Context ...................................................................................................................................................42.4 Growth Management Areas ..........................................................................................................................................6
3.0 RETAIL TRADE AREA ................................................................................................................................ 11 3.1 Introduction .......................................................................................................................................................................113.2 Population Projections ..................................................................................................................................................153.3 Age Profile ..........................................................................................................................................................................193.4 Household Income Profile ............................................................................................................................................193.5 Retail Spending Profile ..................................................................................................................................................23
4.0 RETAIL SUPPLY ......................................................................................................................................... 33 4.1 Introduction .......................................................................................................................................................................334.2 East Hants Retail Market ...............................................................................................................................................334.3 Retail Vacancy ...................................................................................................................................................................334.4 Retail Inventory by Category .......................................................................................................................................374.5 Retail Inventory by NAICS .............................................................................................................................................394.6 Retail Space Per Capita ..................................................................................................................................................39
5.0 RETAIL DEMAND ...................................................................................................................................... 455.1 Introduction .......................................................................................................................................................................455.2 Retail Floor Space Demand ..........................................................................................................................................45
6.0 CONCLUSIONS .......................................................................................................................................... 536.1 Key Findings & Directions .............................................................................................................................................536.2 Retail Tenant Targets ......................................................................................................................................................54
CONTENTSTable of

APPENDICESA Detailed Retail Inventory for Municipality of East Hants ..................................................................................55
TABLES .....................................................................................................................................................................3.1 Trade Area Demographic Summary .........................................................................................................................143.2 Trade Area Population Projections Summary 2017 - 2027 ...............................................................................173.3 Trade Area Population Age Breakdown ..................................................................................................................183.4 Trade Area Household Income Breakdown ...........................................................................................................213.5 Trade Area Retail Spending 2017, 2022 & 2027 .....................................................................................................24
4.1 Retail Market Snapshot ..................................................................................................................................................334.2 Municipality of East Hants Retail Inventory Summary By Category .............................................................344.3 Municipality of East Hants Retail Inventory Summary By Community .......................................................354.4 Municipality of East Hants Retail Businesses Inventory by NAICS .................................................................36
5.1 East Hants 2017 Estimated Retail Market Share & Sales Productivity ......................................................... 465.2 East Hants Targeted Retail Market Share & Resulting Demand Forecast 2017 to 2022 .......................495.3 East Hants Targeted Retail Market Share & Resulting Demand Forecast 2022 to 2027 ......................51
6.1 East Hants Target Retail Prospects ............................................................................................................................55
FIGURES ....................................................................................................................................................... ............ 2.1 10-20-30 Minute Drive Time from Junction of Hwy 102 & Rte 214 (Elmsdale) ............................................32.2 East Hants AADT Traffic Counts - Highway 102 Corridor ....................................................................................52.3 East Hants Land Use Bylaw Map ..................................................................................................................................82.4 East Hants South Corridor and Commercial Growth Management Area .....................................................9
3.1 East Hants Retail Trade Area ........................................................................................................................................123.2 East Hants Retail Trade Area with Population Density & Growth Forecasts 2017 - 2022 ......................133.3 East Hants Retail Trade Area with Population Growth Foreasts 2017 - 2022 .............................................163.4 Trade Area Population Age Breakdown ..................................................................................................................183.5 Trade Area Household Income Breakdown Map .................................................................................................203.6 Trade Area Household Income by Income Segment .........................................................................................223.7 Trade Area Retail Spending Summary .....................................................................................................................243.8 Trade Area Retail Spending By General Category ...............................................................................................253.9 Trade Area Average Annual Household Spending 2017 - Grocery & Specialty Foods ..........................263.10 Trade Area Average Annual Household Spending 2017 - Personal Services ............................................27
CONTENTSTable of

Retail Market Analysis - Municipality of East Hants, Nova Scotia |
3.11 Trade Area Average Annual Household Spending 2017 - Clothing & Apparel .........................................283.12 Trade Area Average Annual Household Spending 2017 - Home Furnishings & Accessories ..............293.13 Trade Area Average Annual Household Spending 2017 - Home Improvement & Garden ..................303.14 Trade Area Average Annual Household Spending 2017 - Restaurants ........................................................313.15 Trade Area Average Annual Household Spending 2017 - Auto/RV/Motorsports ....................................32
4.1 Representative East Hants Retail Imagery - Hwy 102 Corridor .......................................................................384.2 Retail Space Per Capita Growth Continuum ......................................................................................................... 404.3 Provincial Major Retail Chain Sq. Ft. by Retail Sector .........................................................................................424.4 Shopping Centre Sq. Ft. Per Capita By Province ..................................................................................................43
5.1 East Hants 2022 Net Potential Demand by Category ....................................................................................... 485.2 East Hants 2027 Net Potential Demand by Category .........................................................................................50

| Key Planning Strategies & Cushing Terrell Architecture Inc.i
Cushing Terrell Architecture Inc. (“Cushing Terrell”), in collaboration with Key Planning Strategies (“Key Planning”) was commissioned by the Municipality of East Hants (“East Hants”) in November 2017 to conduct a Retail Market Analysis for East Hants, particularly the areas of Enfield, Elmsdale and Lantz.
The study was carried out over the period of December 2017 - April 2018.
The objective of this study is to thoroughly document East Hants’ current retail inventory. It also estimates the realistic “Retail Trade Area” for which East Hants serves and the retail expenditure profile across various retail categories/store types as an indication of retail inflow/outflow and opportunities that East Hants could potentially pursue. The information will be used to fill gaps and bolster the local retail market by retaining or attracting greater market share of resident and passing motorists’ spending in the community.
Retail spending (i.e. demand), East Hants’ retail inventory, and its corresponding productivity (i.e. supply) was estimated to identify gaps in the current provision of shops and services.
This document is intended to assist East Hants in promoting the community, working with developers and investors, particularly in the areas of future growth along the Hwy 102 corridor (Enfield/Elmsdale/Lantz) as well as attracting new retail or business opportunities. It further aims to support and retain existing retailers as part of a wider Economic Development Strategy for business retention and attraction and succession planning.
Reference material for this report was obtained from, but not limited to: the Municipality of East Hants, Commercial Real Estate Brokerage Firms, Land Owners, Property Developers, International Council of Shopping Centers (ICSC), Cushing Terrell Architecture Inc. and Key Planning Strategies.
Cushing Terrell does not warrant that any estimates contained within the study will be achieved over the identified time horizons, but that they have been prepared conscientiously and objectively on the basis of information obtained during the course of this study.
Also, any tenant references made in the report are for illustrative purposes only and should not be taken as guarantees that they will locate in East Hants, but rather that they could represent compatible “target” category types to pursue either for local businesses or external regional businesses.
This analysis was conducted by Cushing Terrell as an objective and independent party, and is not an agent of the Municipality of East Hants.
As is customary in an assignment of this type, neither our name nor the material submitted may be included in a prospectus, or part of any printed material, or used in offerings or representations in connection with the sale of securities or participation interest to the public, without the expressed permission of the Municipality of East Hants, Cushing Terrell Architecture Inc. or Key Planning Strategies.
Cushing Terrell Architecture Inc.Key Planning Strategies2018
iPREFACE

Retail Market Analysis - Municipality of East Hants, Nova Scotia | ii
i iEXECUTIVE SUMMARY
INTRODUCTIONThis document is intended to assist East Hants in promoting the community, working with developers and investors, particularly in the areas of future growth along the Hwy 102 corridor (Enfield/Elmsdale/Lantz) as well as attracting new retail or business opportunities. It further aims to support and retain existing retailers as part of a wider Economic Development Strategy for business retention, attraction and succession planning.
LOCATION CONTEXT SUMMARY Retail shops and services of a larger scale including larger format and junior box retailers are congregating in Elmsdale at the interchange of Hwy 102 and Rte 214 and include Grocery, Pharmacy, Home Improvement, Quick Service Food & Beverage (F&B) and Personal Services such as banks and Financial Services.
Until recently, Elmsdale has been sandwiched between, or at the periphery of two (2) existing and strong “Retail Trade Areas”; one servicing Truro and one servicing Halifax, Dartmouth and Lower Sackville. The drive times of around 30-minutes to each have made this possible. As will be seen in this study however, there is a valid market-driven opportunity towards the end of the next decade for Elmsdale to become a self-sufficient retail trade area of its own, that will create a more powerful presence for residents and businesses within a 20-minute drive time.
Over the past decade traffic counts throughout the Hwy 102 corridor have steadily increased whereby volumes now consistently and easily surpass 10,000 Average Annual Daily Traffic (AADT) and these counts continue to migrate
higher north in-step with regional demand and growth, driven in large part to the employment activity spurred by the nearby presence of the Halifax International Airport. In particular, the interchange at Elmsdale is now averaging just under 15,000 AADT.
In addition to traffic counts it is also worth noting that the Province and Municipality are finalizing plans for a new Hwy interchange and overpass to be located at Lantz. This future Exit 8A will provide additional access and egress to future residential and businesses on both sides of Hwy 102.
From a retail perspective, these traffic volumes are considered attractive for prospective retailers for whom benchmarks of consistent volumes of daily traffic are a requirement, particularly given the continued pattern of growth along this corridor for residents and visitor flow.
In the near term and for the next 10+ years, this particular study realizes the more nascent status of the corridor whereby rooftops and residential development may not yet exist in a format that necessarily will usurp the dominance of the automobile. As a bedroom community, the role of the automobile, in the absence of transit, will still be dominant and form the foundation for most retail and commercial developments.
Therefore, opportunities in the near term for retail, given the nature of the commuting patterns and regional nodes (i.e. larger retail destinations like Dartmouth Crossing) suggests an auto-oriented environment for retail will follow a path of specifically desired businesses the developers and brokers can secure.

| Key Planning Strategies & Cushing Terrell Architecture Inc.iii
i iEXECUTIVE SUMMARY
An opportunity for East Hants, in advance of the next evolution of retail demand over the next 5 to 10 years would be to improve the wayfinding and a streetscape improvement program in the Village Cores, and in particular the Elmsdale Village Core to make the building frontages and streetscape more inviting and pedestrian-friendly. Decisions like this will make the Village Core a more attractive and compact locale as well as making it competitive to other alternatives that will choose to locate at or near the Hwy 102/Rte 214 interchange.
RETAIL TRADE AREA SUMMARYIn order to create a framework for evaluating retail demand and subsequent gaps in the provision of shops and services, it is necessary to define and identify the Trade Area from which East Hants’ retail sales are most frequently and likely to be sourced and generated. This is referred to as the “Retail Trade Area”. The resulting Trade Area for East Hants, which focuses on the Hwy 102 corridor in and around Elmsdale comprises a singular trade area, rather than having multiple trade areas as would be common for a larger market. The rationale behind this is influenced by the fact that East Hants and Elmsdale in particular is currently located at overlap of two larger trade areas (Truro and Lower Sackville), which limits the extent of the resident market, though it does not discount the nature of passing motorists traveling along Hwy 102.
As observed previously and given the growth forecasts for the Elmsdale/Enfield/Lantz/Milford corridor, it is not inconceivable to see the Retail Trade Area evolve into a much more self sufficient prominent trade area of its own that has fewer competitive limitations and greater resident retail spending capture/market share.
The patterns of population growth over the period 2017 to 2022 along with current density centroids as shown in Figures 3.2 and 3.3 reveals that growth is expected to continue migrating north from the City and Halifax Regional Municipality (HRM) towards the Hwy 102 corridor and the communities of Enfield, Elmsdale and Lantz, which bodes well for future residential and retail prospects in the region over the next decade.
The Total Trade Area population is estimated for 2017 to be almost 26,670. This population is forecast to grow at moderate rates over the next decade and conservatively surpass 29,000 by 2027. This pace of population growth is considered conservative as it doesn’t take into account potential economic-driven interventions at the local and provincial level.
As the Trade Area evolves, the aspirational nature of the market will become increasingly more evident as the market attracts younger working families with a higher income and capacity/propensity for more spending on categories other than conveniences.
RETAIL MARKET SNAPSHOTRetail Business Name Community General Retail Category Est. Area (SF) NAICS Sector # NAICS Sector Name NAICS Industry
# NAICS Industry Name
TOTAL 452,931 sq.ft.
TOTALRETAIL(ExcludingNon-RetailStreetfront) 444,931 sq.ft.
VACANT 15,068 sq.ft. VACANT
%VACANT(ofALLstreetfrontcommercialspace)
3.3% %VACANT
RetailSpacePerCapita(againstEastHantsPopulation22,4532016)
19.8 sq.ft./capita

Retail Market Analysis - Municipality of East Hants, Nova Scotia | iv
i iEXECUTIVE SUMMARY
RETAIL TRADE AREA
East Hants Retail Trade AreaEast Hants Retail Trade Area
Residential Population Density1 dot = 100
2017 to 2022 Pop Growth %< 0%0% to 5%5% to 10%10% to 15%
0 5 10
kilometers

| Key Planning Strategies & Cushing Terrell Architecture Inc.v
Overall, the Municipality of East Hants has an estimated streetfront floor space in the range of 453,000 sf. This floor space is comprised of business types that range from Grocery to Home Improvement, Restaurants, Personal Services such as Salons as well as Professional Services.
The overall vacancy rate for the retail area inventoried and documented is estimated at just over 3% which is below the industry standard for a healthy retail market that should be in the 4% to 5% level and thus suggests that there could be demand and opportunity for compatible retailers. Overall, the market would seem to be in balance with the magnitude of spending and demand. Well-located spaces along the east and west sides of the Hwy 102 corridor at Elmsdale with high visibility and as such have the potential to tap into not just the expected growing local market, but passing motorists and an evolving captive workforce in time. Elmsdale’s retail vacancy sits at 2.5% which is indicative of latent demand, particularly given that Elmsdale has approximately 67% of the Municipality’s retail inventory.
Consistent with an evolving retail community, the Top 5 retail categories in terms of overall retail floor space in East Hants are:
1. Grocery & Specialty Foods 130,040 sf2. Home Improvement & Gardening 58,423 sf3. Restaurant F&B 41,991sf4. Specialty Retail 27,454 sf5. Pharmacy 22,493 sf
The Halifax and wider region’s future growth is being predicated on attracting young families and retaining an educated youthful workforce for whom other areas in the country may not offer the quality of life and affordability attributes.
Average Household Income in the Trade Area is forecast to grow over the 5-year period 2017 to 2022, to an estimated $93,000, in conjunction with an improving provincial economy. Approximately 25% of households have an average Household Income of between $60,000 and $100,000. Although the dominant income brackets are as noted, there is a relatively large component of the Total Trade Area (16%) that have an average Household Income over $125,000. Thus, the overall income profile represents overall economic health and stability for retail opportunities.
East Hants’ retail trade area has a spending profile of almost $300 M in 2017 and is forecast to surpass $350 M by 2027.
The most consistent finding in Trade Area spending is a noticeable northward migrating trend of increasing spending that is soon to fall within the core area of the East Hants’ Hwy 102 corridor Retail Trade Area.
RETAIL SUPPLY SUMMARY
The East Hants retail market comprises the current streetfront retail businesses within the jurisdictional boundary of the Municipality of East Hants (as distinct from the delineated retail trade area). Retail floorspace is documented for each of the respective communities that comprise the Municipality - Enfield, Elmsdale, Milford, Lantz, Shubenecadie, Mt Uniacke and Kennetcook.
i iEXECUTIVE SUMMARY
Retail Market Analysis - Municipality of East Hants, Nova Scotia | vi
East Hants is starting to slowly increase its offerings within the Comparison or Department Store Type Merchandise Categories (DSTM), though it is still expected that a further concentration or attraction of more notable brands is approximately 5 years away from gaining traction. While certain merchandise categories may be worth pursuing in certain circumstances, the majority of residents nonetheless will continue to be drawn to the Lower Sackville, Dartmouth Crossing or Truro retail destinations.
The estimated retail space per capita ratio for the East Hants’ retail trade area is in the range of 20 sf/capita which includes all retail space.
If the industry standard space per capita of 20 sf were to be applied to population growth in the Trade Area, the future additional retail space supportable by new population growth by 2027 could be approximately 50,000 sf. This is a conservative figure that considers no economic development or developer-driven interventions, but nonetheless would be an indicator at the lower end of the spectrum whereby if population growth were to exceed current forecasted levels, the resultant demand would increase accordingly.
RETAIL DEMAND SUMMARY
East Hants currently garners only 34% market share of the total trade area retail spending, suggesting retail leakage of 66%.
The key to East Hants’ future retail opportunity lies in incrementally and slowly increasing the overall market share of sales, realizing that the Trade Area for the Hwy 102 corridor is rapidly evolving into its own self-serving Retail Trade Area.
If East Hants were to increase its current market share penetration by 7% from an estimated 34% to 41%, then the total demand by the year 2022, without new population growth could be approximately 99,000 sf.
If East Hants were to continue to increase its market share penetration from 2022 to 2027 by 10% from an estimated 41% to 51%, then the incremental new demand by the year 2027, without new population growth could be an additional 129,000 sf.
Therefore, the cumulative impact of increasing market share from the current levels today of 34% to 50% 2027 could result in new demand for approximately 227,000 sf of retail space.
In combination with increased market shares of retail spending and natural demand attributed to population growth, East Hants’ Retail Trade Area could add in the range of 225,000 to 275,000 sf of new retail space by 2027.
CONCLUSIONOn the basis of the retail market analysis, the East Hants market is most accurately characterized with cautious optimism as it pertains to its retail growth outlook.
Overall the retail market is in already positioning itself as a strong local convenience destination, but it is soon to reach the tipping point to becoming a more self-sufficient retail market for the gradual introduction of more general merchandise and food & beverage offerings as well as specifically targeted comparison or DSTM type categories/stores.
i iEXECUTIVE SUMMARY

| Key Planning Strategies & Cushing Terrell Architecture Inc.vii
EXECUTIVE SUMMARY i iEXECUTIVE SUMMARY
2022 TARGETED RETAIL MARKET SHARE AND RESULTING DEMAND FORECAST
2027 TARGETED RETAIL MARKET SHARE AND RESULTING DEMAND FORECAST
2022Total Trade Area Retail Spending
(with Misc Inflow)
2022 Target Market Share of Retail
Spending
2022 Estimated
Retail Sales $(Inflow) 2
2022 Potential Retail
Inventory
2022 Potential Net Future Retail Floorspace
Demand
5% Grocery & Specialty Foods $78,933,618 75% $59,200,214 148,001 17,9615% Pharmacy $9,234,146 85% $7,849,024 26,163 3,6705% Alcohol & Tobacco $19,485,111 55% $10,716,811 23,815 4,8155% Personal Services $14,495,599 20% $2,899,120 16,566 6,4830% Clothing & Apparel $24,502,775 5% $1,225,139 6,126 4,3660% Footwear $5,832,922 5% $291,646 1,458 1,2560% Jewelry & Accessories $3,817,298 5% $190,865 1,527 1,5270% Health & Beauty $7,060,312 5% $353,016 2,017 2,0175% Home Furnishings & Accessories $20,951,224 10% $2,095,122 11,972 8,3310% Home Electronics & Appliances $16,260,114 25% $4,134,966 27,566 2,54710% Home Improvement & Gardening 4 $11,853,893 95% $11,264,932 64,371 5,9480% Books & Multimedia $5,100,991 5% $255,050 1,700 1,7000% Sporting Goods & Recreation $3,366,879 20% $673,376 5,387 1,0680% Toys & Hobbies $3,862,340 10% $386,234 3,090 1,0715% Miscellaneous Specialty $10,652,964 45% $4,793,834 38,351 10,89710% Restaurant F&B $20,289,109 50% $10,144,554 50,723 8,7325% Drinking Establishments $3,227,813 60% $1,936,688 15,494 3,4940% Entertainment & Leisure $10,798,787 15% $1,597,620 15,976 1,4765% Auto Parts & Accessories $6,266,450 55% $3,446,547 22,977 4,68810% Auto/RV/Motorsports Dealership $63,233,150 5% $3,161,657 10,539 6,839
$339,225,495 41% $126,616,414 493,819 98,887
2022
Merchandise CategoryMiscellaneous
SpendingInflow Factor 1
2027Total Trade Area Retail Spending
(with Misc Inflow)
2027 Target Market Share of Retail
Spending
2027Estimated
Retail Sales $(Inflow) 2
2027 Potential Retail
Inventory
2027Potential
Incremental Net Future Retail Floorspace
Demand
2027Potential
Cumulative Net Future Retail Floorspace Demand 5
5% Grocery & Specialty Foods $86,301,096 80% $69,040,877 172,602 24,602 42,5625% Pharmacy $10,096,039 85% $8,581,633 28,605 2,442 6,1125% Alcohol & Tobacco $21,303,806 65% $13,847,474 30,772 6,957 11,7725% Personal Services $15,848,584 25% $3,962,146 22,641 6,074 12,5580% Clothing & Apparel $26,789,807 15% $4,018,471 20,092 13,967 18,3330% Footwear $6,377,353 10% $637,735 3,189 1,730 2,9870% Jewelry & Accessories $4,173,596 10% $417,360 3,339 1,812 3,3390% Health & Beauty $7,719,305 10% $771,931 4,411 2,394 4,4115% Home Furnishings & Accessories $22,906,762 15% $3,436,014 19,634 7,662 15,9940% Home Electronics & Appliances $17,777,794 30% $5,333,338 35,556 7,989 10,53610% Home Improvement & Gardening 4 $12,960,308 95% $12,316,374 70,379 6,008 11,9560% Books & Multimedia $5,577,106 10% $557,711 3,718 2,018 3,7180% Sporting Goods & Recreation $3,681,136 25% $920,284 7,362 1,975 3,0430% Toys & Hobbies $4,222,842 15% $633,426 5,067 1,978 3,0485% Miscellaneous Specialty $11,647,287 50% $5,823,643 46,589 8,238 19,13510% Restaurant F&B $22,182,846 55% $12,200,565 61,003 10,280 19,0125% Drinking Establishments $3,529,089 70% $2,470,362 19,763 4,269 7,7630% Entertainment & Leisure $11,806,721 15% $1,746,738 17,467 1,491 2,9675% Auto Parts & Accessories $6,851,345 60% $4,110,807 27,405 4,428 9,11710% Auto/RV/Motorsports Dealership $69,135,183 10% $6,913,518 23,045 12,506 19,345
$370,888,005 51% $157,740,409 622,641 128,822 227,709
2027
Merchandise CategoryMiscellaneous
SpendingInflow Factor 1

The retail market analysis for the Municipality of East Hants recognizes the importance that economic-development driven, market-driven and developer-driven dynamics can have on a market’s respective opportunity. This study reflects cautious optimism whereby projections are premised without economic-development interventions, which can often stimulate even further opportunities.

| Key Planning Strategies & Cushing Terrell Architecture Inc.1
1.1 SCOPE OF STUDY & PROJECT BACKGROUNDCushing Terrell was commissioned by the Municipality of East Hants (“East Hants”) to conduct a Retail Market Analysis for the Municipality, with a focus on the Hwy 102 Corridor. The objective of this study is to thoroughly document East Hant’s current retail inventory and define the realistic retail Trade Area area for which it serves today and is likely to serve over the next decade. The end result is to fill gaps and bolster the local retail market by retaining or attracting greater market share of resident and passing motorists’ spending in the community.
1.2 REPORT STRUCTURECushing Terrell conducted on-the-ground research in December 2017 to gain a firm understanding of existing and future retail prospects in East Hants. The purpose of this research was to establish a solid foundation and baseline for determining the depth of retail opportunity, associated gaps in the market provision of shops and services. The document is presented in the following sections:
Section 1 - Introduction: Introduces the study process and structure.
Section 2 - Location Context: Lays out the important regional and local context of the Municipality of East Hants and the Hwy 102 Corridor in terms of geographic location, traffic counts and future growth plans.
Section 3 - Retail Trade Area Profile: Identifies and defines the Retail Trade Area and documents the population and expenditure profiles generated from within these respective trade areas, against which estimates of floor space demand can be attributed.
Section 4 - Retail Supply: Assesses the location and characteristics of East Hants’ current nodes of retail activity (“supply”), including developing or future planned retail sites. Fieldwork assessments included identifying and quantifying the entire East Hants retail inventory by retailer, merchandise category and NAICS industry classification.
Section 5 – Retail Demand: Quantifies the Trade Area spending and sales productivities, resulting in “demand” associated with each retail category over the next 5 and 10 year increments for East Hants, with a focus on the Hwy 102 Corridor (Enfield/Elmsdale/Milford).
1.3 SOURCES OF INFORMATIONDuring the course of this study, a number of resources were used to quantify retail market supply and demand conditions largely comprising primary and secondary research.
The following primary sources of information were used in this Retail Market Analysis: • Province of Nova Scotia Traffic Volume History • Cushing Terrell/Key Planning Retail Inventory
Fieldwork, December 2017. • SitewisePro - Utilizing Pitney Bowes
Demographics & Spending Data, 2017• Statistics Canada• Municipality of East Hants• Ryerson University Centre of Study for
Commercial Activity• International Council of Shopping Centers
The consulting team would also like to thank the following for their valuable input on the East Hants retail market and opportunities:• Ryan Barkhouse - Director of Development
Armco Capital• Laura Masching - Planner Armco Capital• Angela Cormier - Leasing Mgr Crombie REIT• Kevin Neatt - Director Planning &
Development, Shaw/Clayton Developments.
introduction1.0

Retail Market Analysis - Municipality of East Hants, Nova Scotia | 2
2.1 INTRODUCTIONLocation factors are an essential foundation to retail success, and an understanding of these factors can help create the necessary conditions for attracting and retaining retail businesses in a community. This section identifies East Hants’ regional and local characteristics as they relate to the attraction and retention of retail businesses and merchandise categories, with an eye to future growth opportunities.
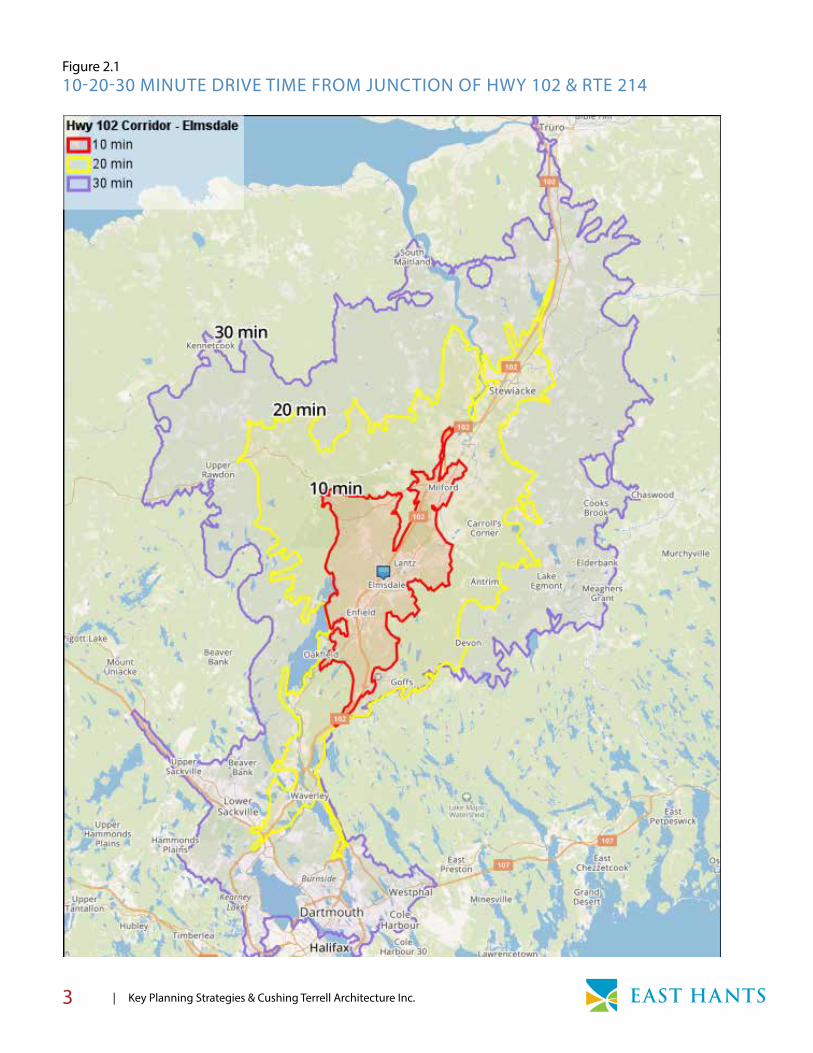
2.2 LOCAL & REGIONAL CONTEXT The Municipality of East Hants consists of 466,426 acres of land, and includes 11 districts. The most prominent of the districts are along Hwy 102, which is often referred to as “the corridor” and is the rapidly evolving nexus from which the 10, 20 and 30-minute drive times emanate and more importantly the epicentre of future retail.
East Hants, and in particular the districts of Elmsdale, Enfield, Lantz, Milford and Shubenecadie, along the Hwy 102 corridor are traditional bedroom communities.
The Municipality of East Hants is encouraging commercial development along the highway where appropriate, and locally where commercial areas are already established, unless otherwise approved. Although not in the Municipality, the proximity of the Halifax International Airport (HIAA) is a significant asset that provides a closer employment centre for residents of the municipality.
The Airport has been very proactive in preparing for and setting the stage for future groundside commercial development. Presently, the Airport is actively marketing the Stanfield Landing retail development in the core of the airport near the terminal. This development is likely to provide shops and services for the on-site and adjacent Aerotech Business Park workforce as well as airport travelers. The Airport has also been investigating the prospects of providing larger scale regional retail on its lands fronting Hwy 102. This could be a competitive threat to retail along the Hwy 102 corridor in East Hants. However, this remains a longer term play for HIAA and may not be in the most optimal location considering trade area overlap and future growth along the corridor.
Retail shops and services of a larger scale including larger format and junior box retailers are congregating in Elmsdale at the interchange of Hwy 102 and Rte 214 and include Grocery, Pharmacy, Home Improvement, Quick Service Food & Beverage (F&B) and Personal Services such as banks and Financial Services.
Elsewhere in the East Hants, smaller communities such as Kennetcook, Enfield, Milford and Shubenecadie play an important role in providing local “village” scale shops and services set in the framework of a traditional main street culture.
It is essential that these nodes be maintained and enhanced where possible at a scale that is not too large, but rather concentrated and walkable, thereby providing a viable alternative to larger retail that is likely to be more expensive.
location context2.0
| Key Planning Strategies & Cushing Terrell Architecture Inc.3
Figure 2.110-20-30 MINUTE DRIVE TIME FROM JUNCTION OF HWY 102 & RTE 214
location context

Retail Market Analysis - Municipality of East Hants, Nova Scotia | 4
Local village nodes should focus on providing a mix of 80% local to 20% branded, whereas the larger Hwy 102 corridor should represent a mix of 80% branded to 20% local.
Until recently, Elmsdale has been sandwiched between, or at the periphery of two (2) existing and strong retail trade area; one servicing Truro and one servicing Halifax, Darmouth and Lower Sackville. The drive times of around 30-minutes to each have made this possible. As will be seen in this study however, there is a valid market-driven opportunity towards the end of the next decade for Elmsdale to become a self-sufficient retail trade area of its own, that will create a more powerful presence for residents within a 20-minute drive time.
2.3 TRANSPORTATION CONTEXTOne of the most significant aspects to successful commercial development relates to patterns of transportation. The ability to be accessible as well as visible to high volumes of traffic are among the most influential considerations for retail businesses. For a suburban or smaller secondary market such as East Hants, a retail location relative to strong and accessible transportation patterns remains an important component. This may be slightly less essential for a local independent business.
However, it is paramount for some of the more recognized brand that it have access to as much customer base as necessary, largely because the cost overhead of either acquiring a Franchise License or operating as a corporate entity has a bottom line that must be adhered to.The Province of Nova Scotia through its OpenData website (data.novascotia.ca) provides detailed traffic counts on provincial highways and interchanges.
The most recent 2016 data documented in the form of Average Annual Daily Traffic (AADT) from this Provincial source is shown in Figure 2.2 and summarized as follows:
1) Hwy 102 Exit 5 Interchange to Exit 5A Aerotech Park Interchange (2016)
Northbound = 21,500 AADT Southbound = 22,700 AADT
2) Hwy 102 Exit 5A Aerotech Interchange to Exit 6 Halifax Int’l Airport Interchange (2016)
Northbound = 23,400 AADT
3) Hwy 102 Exit 6 HIAA Interchange to Exit 7 Enfield Interchange (2014)
Northbound = 16,000 AADT Southbound = 16,300 AADT
4) Hwy 102 Exit 7 Enfield Interchange to Exit 8 Rte 214 Elmsdale Interchange (2016)
Northbound = 14,200 AADT Southbound = 14,040 AADT
5) Rte 214 Elmsdale to Lantz (2016)
5,040 AADT
6) Hwy 102 Exit 8 Rte 214 Elmsdale Interchange to Exit 9 Milford (2016)
Northbound = 11,060 AADT Southbound = 11,600 AADT
7) Hwy 102 Exit 9 Milford to Exit 10 Rte 215 Shubenecadie (2016)
Northbound = 11,900 AADT Southbound = 11,900 AADT
Traffic counts are important considerations for retailers and in particular branded or chain retailers.
The Hwy 102 corridor benefits from significant traffic counts that continue to trend upwards and beyond 15,000 vehicles per day in the vicinity of the emerging Elmsdale retail cluster.

| Key Planning Strategies & Cushing Terrell Architecture Inc.5
Figure 2.2EAST HANTS AADT TRAFFIC COUNTS - HWY 102 CORRIDOR(Source: data.novascotia.ca - Traffic Volumes - Provincial Highway System 2016)
4
6
5
7
3
1
2

Retail Market Analysis - Municipality of East Hants, Nova Scotia | 6
Over the past decade traffic counts throughout the Hwy 102 corridor have steadily increased whereby volumes now consistently and easily surpass 10,000 AADT and these counts continue to migrate higher north in-step with regional demand and growth, driven in large part to the employment activity spurred by the nearby presence of the Halifax International Airport. In particular, the interchange at Elmsdale is now averaging just under 15,000 AADT.
In addition to traffic counts it is also worth noting that the Province and Municipality are finalizing plans for a new Hwy interchange and overpass to be located at Lantz. This future Exit 8A will provide additional access and egress to future residential on both sides of Hwy 102.
From a retail perspective, these traffic volumes are considered attractive for prospective retailers for whom benchmarks of consistent volumes of daily traffic are a requirement, particularly given the continued pattern of growth along this corridor for residents and visitor flow.
2.4 GROWTH MANAGEMENT AREASReferring to Figures 2.3 and 2.4, East Hants’ Municipal Planning Strategy identifies a number of Growth Management Areas (GMAs), most of which are positioned strategically along the Hwy 102 corridor. There is one Land Use Bylaw (LUB) adopted in July 2016 that controls land uses in the GMAs. It is clear from the LUB and the GMAs that Hwy 102 is a core focus for future residential and commercial growth as well as for the creation of a regional employment centre.
The anticipated concentration of new residential formats and commercial activity in and around the Enfield/Elmsdale/Lantz/Milford corridor provides an optimal foundation for which an employment centre can succeed. In fact, all these components have the great potential to work together in creating a diverse and self-sustaining retail market that will be attractive for retail tenants; both recognized chains and local independents.
The Municipality of East Hants has in its LUB established commercial designations for:
GC - General CommercialHC - Highway CommercialRC - Regional CommercialBP - Business ParkIC - Industrial Commercial
Further, East Hants recognizes an important role that mixed-use will play in the longer term vision by allocating for MC - Mixed Use Centre, VC - Village Core and WCDD - Walkable Comprehensive Development District land uses.The WCDD Land Use Designation is aspirational whereby the current status of East Hants’ development evolution suggests that achieving WCDD in the near term (i.e. next 5 years) will be challenging, but over the next 5 and more likely 10-20 years this form of land use will become increasingly more attractive for mixed commercial and residential formats laid out in a pedestrian-oriented environment.
While other similar Halifax region communities may continue with a traditional model of suburban growth, East Hants is at the forefront
The anticipated concentration of new residential formats and commercial activity in and around the Enfield/Elmsdale/Lantz/Milford corridor provides a foundation for which an employment centre can succeed.

| Key Planning Strategies & Cushing Terrell Architecture Inc.7
2of progressive thinking that encourages an option for walkable, pedestrian oriented neighbourhoods that would also be marketable to a wide array of demographics including young families, millennials, baby boomers, retirees and seniors.
There is a reality of the East Hants region, from a market-driven and developer-driven perspective that over the next 5-10 years single family housing will still be sought after, but the rise of duplex or townhome/rowhousing is on the horizon. These latter formats are all likely to gain favour in conjunction with medium density or low-rise multi-family which would be the basis for MC and WCDD areas. Multi-family residential will become more popular in the market over time, particularly if options are made available.
In the near term and for the next 10+ years, this particular study realizes the more nascent status of the Hwy 102 corridor whereby rooftops and residential development may not yet exist in a format that necessarily will usurp the dominance of the automobile. As a bedroom community, the role of the automobile, in the absence of transit, will still be dominant and form the foundation for most retail and commercial developments. This doesn’t preclude the need to ensure compatibility for walkability and mobility.
Therefore, opportunities in the near term for retail, given the nature of the commuting patterns and regional nodes, suggests an auto-oriented environment for retail will follow a path of specifically desired businesses the developers and brokers can secure.
Village Cores like Elmsdale and Enfield represent a link to the past and are essential for providing the place-making necessities of a community.
The Village Cores, most notably those in Elmsdale, Enfield and Milford and to a lesser degree in Shubenecadie and Kennetcook will be at the greatest risk as desired commercial growth occurs in Elmsdale. Therefore, a strategy should be employed, as envisioned in the LUB for Mixed-Use, that promotes more compact, walkable Village Cores, using the buildings and historic attributes where possible to provide viable venues for local businesses that won’t be able to afford the lease rates at new nodes or even new mixed-use in future WCDDs.
The existing Village Cores represent a connection to the past for local shops and services that cannot be overlooked for the role they play in often providing the place-making necessities of a community. Every effort should be made to ensure these valuable assets are maintained, even if at smaller scales where true pedestrian mobility can be prioritized and local businesses can be incubated.
An opportunity for East Hants, in advance of the next evolution of retail demand over the next 5 to 10 years would be to improve the wayfinding and a streetscape improvement program in the Village Cores, and in particular the Elmsdale Village Core to make the building frontages and streetscape more inviting and pedestrian-friendly. Decisions like this will make the Village Core a more attractive and compact locale as well as making it competitive to other alternatives that will choose to locate at or near the Hwy 102/Rte 214 interchange.

Retail Market Analysis - Municipality of East Hants, Nova Scotia | 8
Figure 2.3EAST HANTS LAND USE BYLAW MAP

| Key Planning Strategies & Cushing Terrell Architecture Inc.9
2Figure 2.4EAST HANTS SOUTH CORRIDOR AND COMMERCIAL GROWTH MANAGEMENT AREA

Retail Market Analysis - Municipality of East Hants, Nova Scotia | 10
Photo courtesy of Cushing Terrell Architecture Inc.

| Key Planning Strategies & Cushing Terrell Architecture Inc.11
3.1 INTRODUCTIONIn order to create a framework for evaluating retail demand and subsequent gaps in the provision of shops and services, it is necessary to define and identify the Trade Area from which East Hants’ retail sales are most frequently and likely to be sourced and generated.
The Trade Area recognizes drive times, demographics, spending attributes and competition, which collectively portray the market to prospective tenants, developers and investors.
Identifying the Trade Area is important for understanding the total market potential available to current and future retailers. The local and regional residential base has particular demographic and spending habits that provide insight as to the type of compatible retail tenants, the amount of retail floor space supportable in the market, and the current inflow or outflow of retail sales, and for which categories such inflow or outflow exists.
As a first step, a Trade Area was delineated to identify the geographic region from which regular patronage could be expected, based on a series of boundary determinants. This Trade Area is shown in Figure 3.1 and also provides a visual representation in a general sense of how the Trade Area itself represents a centrality for residents to the north, south, east and west. In particular it shows the proximity of population and resulting spending along the Hwy 102 corridor.
Major considerations in defining a Retail Trade Area were applied to the Municipality of East Hants, as the retail centrality to determine its most realistic Trade Area, as well as to help sensitize potential market share inputs of corresponding Trade Area retail spending.
Retail Trade Area Determinants
i. Transportation networks, including streets and highways, which affect access, drive times (Figure 3.1), commuting and employment distribution patterns;
ii. Major infrastructure projects both planned or under development which could affect future travel patterns;
iii. Overall Community development vision, including an understanding of key nodes’ characteristics;
iv. Local and regional competitive environment, present and future;
v. Proposed generative uses (retail, cultural, civic, etc.) and their relationship within the wider market;
vi. Significant natural and constructed barriers (e.g. water features, highways and industrial areas);
vii. De facto barriers resulting from notable socioeconomic differentiation;
viii. Patterns of existing and future residential and commercial development; and
ix. Economic realities, such as provincial retail sales taxes, if and where applicable.
retail trade area3.0

Retail Market Analysis - Municipality of East Hants, Nova Scotia | 12
Figure 3.1EAST HANTS RETAIL TRADE AREA(Emphasis on the Hwy 102 Corridor comprising Enfield/Elmsdale/Lantz/Milford)
HOUSEHOLDS: 1,749POPULATION: 4,417
RETAIL SPENDING: $44.9 M
HOUSEHOLDS: 2,349POPULATION: 5,794
RETAIL SPENDING: $63.1 M
HOUSEHOLDS: 1,049POPULATION: 2,732RETAIL SPENDING: $29.6 M
HOUSEHOLDS: 5,256POPULATION: 14,119
RETAIL SPENDING: $156.1 M

| Key Planning Strategies & Cushing Terrell Architecture Inc.13
Figure 3.2EAST HANTS RETAIL TRADE AREA WITH POPULATION DENSITY & GROWTH FORECASTS FOR 2017 TO 2022
East Hants Retail Trade AreaEast Hants Retail Trade Area
Residential Population Density1 dot = 100
2017 to 2022 Pop Growth %< 0%0% to 5%5% to 10%10% to 15%
0 5 10
kilometers

Retail Market Analysis - Municipality of East Hants, Nova Scotia | 14
Table 3.1TRADE AREA DEMOGRAPHIC SUMMARY (Source: Pitney Bowes 2017 and Cushing Terrell Architecture Inc.)
2017 Demographic Snapshot
% % % %2011 Census* 26,206 22,611 402,440 944,4642017 Population estimate 26,670 22,707 426,842 951,9702020 Population projection 27,444 23,253 446,268 977,3642022 Population projection 27,959 23,614 459,171 994,2612027 Population projection 29,085 24,381 490,629 1,032,435
Total % Population Change (2011-17) 1.8% 0.4% 6.1% 0.8%Total % Population Change (2017-27) 9.1% 7.4% 14.9% 8.5%
2017 Population by Age 26,670 22,707 426,842 951,9700 to 4 years 1,496 6% 1,239 5% 20,601 5% 44,162 5%5 to 19 years 4,884 18% 4,022 18% 61,420 14% 140,260 15%20 to 24 years 1,514 6% 1,306 6% 30,117 7% 59,742 6%25 to 34 years 2,982 11% 2,445 11% 69,210 16% 119,088 13%35 to 44 years 3,503 13% 2,903 13% 59,956 14% 114,957 12%45 to 54 years 4,296 16% 3,665 16% 60,096 14% 135,996 14%55 to 64 years 3,959 15% 3,686 16% 59,088 14% 148,649 16%65 to 74 years 2,555 10% 2,188 10% 40,206 9% 112,244 12%75 to 84 years 1,151 4% 996 4% 18,280 4% 54,451 6%85 years and over 330 1% 257 1% 7,868 2% 22,421 2%
Median Age 42.2 43.3 40.2 44.8
2017 Families 8,308 7,116 126,446 291,888Married couples 5,797 70% 5,181 73% 84,478 67% 197,528 68%Without children at home 2,667 32% 2,522 35% 39,886 32% 103,732 36%With children at home 3,130 38% 2,659 37% 44,592 35% 93,796 32%Common-law couples 1,153 14% 1,033 15% 18,818 15% 40,550 14%Without children at home 658 8% 611 9% 12,667 10% 24,837 9%With children at home 495 6% 422 6% 6,151 5% 15,713 5%Lone-parent families 1,358 16% 902 13% 23,150 18% 53,810 18%
Average Persons Per Family 2.8 2.8 2.7 2.7Average Children Per Family 1.0 0.9 0.9 0.8
2017 Households 10,220 8,781 183,088 409,846Persons per household 2.6 2.6 2.3 2.3
Average household income 83,872$ 83,980$ 90,673$ 78,359$ Median Estimated Household Income 59,827$ 59,706$ 63,578$ 53,230$
East Hants Retail Trade Area
East Hants (MD), NS Halifax, NS Nova Scotia
Inter-provincial migration should be pro-actively targeted to achieving strong population growth.

| Key Planning Strategies & Cushing Terrell Architecture Inc.15
3For this particular study, the Retail Trade Area shown in Figures 3.1 and 3.2 utilized a combination of drive times and competitive forces (e.g. Truro to the north and Lower Sackville to the south). Because of the competitive influences to the north and south, the Retail Trade Area takes and east-west orientation, whereby communities more remote in the Municipality of East Hants and neighbouring Halifax Regional Municipality are included since their access to the north and south is not as easy as it is to the Hwy 102 corridor at Elmsdale.
The resulting Trade Area for East Hants, which focuses on the Hwy 102 corridor in and around Elmsdale comprises a singular trade area, rather than having multiple trade areas as would be common for a larger market. The rationale behind this is influenced by the fact that East Hants and Elmsdale in particular is currently located at overlap of two larger trade areas (Truro and Halifax, Dartmouth, Lower Sackville), which limits the extent of the resident trade area, though it does not discount the nature of passing motorists traveling along Hwy 102.
As observed previously and given the growth forecasts for the Elmsdale/Enfield/Lantz/Milford corridor, it is not inconceivable to see the Retail Trade Area evolve into a much more self sufficient prominent trade area of its own that has fewer competitive limitations and greater resident retail spending capture/market share.
3.2 POPULATION PROJECTIONSUsing data sources that include the most recent Statistics Canada Census release as well as Pitney Bowes (2017), population estimates and growth forecasts were tabulated for each of the identified Trade Area.
The Municipality of Hants’ most recent census data from the February 2017 Statistics Canada release revealed an increasing population from 22,111 in 2011 to 22,453 (not including Indian Brook) for 2017, representing an increase of 1.2%.
The patterns of population growth over the period 2017 to 2022 along with current density centroids as shown in Figures 3.2 and 3.3 reveals that growth is expected to continue migrating north from the City and Halifax Regional Municipality (HRM) towards the Hwy 102 corridor and the communities of Enfield, Elmsdale and Lantz, which bodes well for future residential and retail prospects in the region over the next decade.
Utilizing a trade area approach as shown in Figures 3.1 and 3.2 and documented in Tables 3.1 to 3.4 provides a more accurate depiction of the Total Trade Area for East Hants’ retail environment rather than being solely dependent upon the smaller localized population base.
To that end, Tables 3.1 & 3.2 provide a breakdown of the Retail Trade Area population and one that is much more appealing to the business community. The Retail Trade Area population estimates and forecasts are benchmarked against the Municipality of East Hants, City of Halifax and Provincial characteristics.
The Total Trade Area population is estimated for 2017 to be almost 26,670. This population is forecast to grow at moderate rates over the next decade and conservatively surpass 29,000 by 2027. This pace of population growth is considered conservative as it doesn’t take into account potential economic-driven interventions at the provincial or municipal level.
Elmsdale is well-positioned to become a self-sustaining retail trade area as growth continues north along the Hwy 102 corridor.

Retail Market Analysis - Municipality of East Hants, Nova Scotia | 16
Figure 3.3EAST HANTS RETAIL TRADE AREA POPULATION GROWTH 2017 - 2022

| Key Planning Strategies & Cushing Terrell Architecture Inc.17
Table 3.2 TRADE AREA POPULATION PROJECTIONS SUMMARY 2011 TO 2027(Source: Pitney Bowes 2017 and Cushing Terrell Architecture Inc.)
32017 Estimates and Projections
Population Trends
Total Population2011 Census* 26,206 22,611 402,440 944,4642017 estimated 26,670 22,707 426,842 951,9702020 projected 27,444 23,253 446,268 977,3642022 projected 27,959 23,614 459,171 994,2612027 projected 29,085 24,381 490,629 1,032,435
Change in Population (persons)2011 to 2017 464 96 24,402 7,5062017 to 2020 774 546 19,426 25,3942020 to 2022 515 361 12,903 16,8972022 to 2027 1,126 767 31,458 38,174
Change in Population (percent)2011 to 2017 1.8% 0.4% 6.1% 0.8%2017 to 2020 2.9% 2.4% 4.6% 2.7%2020 to 2022 1.9% 1.6% 2.9% 1.7%2022 to 2027 4.0% 3.2% 6.9% 3.8%
Rate of Change in Population (percent per year)
2011 to 2017 0.3% 0.1% 1.0% 0.1%2017 to 2020 1.0% 0.8% 1.5% 0.9%2020 to 2022 0.9% 0.8% 1.4% 0.9%2022 to 2027 0.8% 0.6% 1.4% 0.8%
* Population counts have been adjusted by MapInfo for census undercounts.
East Hants Retail Trade Area
East Hants (MD), NS
Halifax, NS Nova Scotia
For those very specific niche store types or merchandise categories that could be most compatible, East Hants has locations well suited to accommodate them that could be in regional or highway commercial or village commercial nodes.
The strategic Hwy 102 corridor retail frontage that exists today is strong and well positioned to be expanded as one of the key differentiators in the region capable of not just slowing motorists, but stopping them. Highway motorists are creatures of habit who tend to stay in their vehicles unless the environment is convenient for them to stop.
As will be documented in the Demand Section, even if some small component of demand could be warranted, the alternative to demand is that individual businesses could garner higher market share resulting in greater sales and thus business viability, rather than simply adding more space. This doesn’t necessarily mean more demand, but rather a stronger market penetration of the existing resident spending.
East Hants’ retail trade area population will conservatively reach ~30,000 by 2027, without any economic development- driven interventions.

Retail Market Analysis - Municipality of East Hants, Nova Scotia | 18
Table 3.3 TRADE AREA POPULATION AGE BREAKDOWN(Source: Pitney Bowes 2017 and Cushing Terrell Architecture Inc.)
Figure 3.4 TRADE AREA POPULATION AGE BREAKDOWN(Source: Pitney Bowes 2017 and Cushing Terrell Architecture Inc.)
2017 Estimates and Projections Population by Age and Sex
% % % %2017 Estimated Population 26,670 % base 22,707 % base 426,842 % base 951,970 % base
0 to 4 years 1,496 6% 1,239 5% 20,601 5% 44,162 5%5 to 9 years 1,610 6% 1,354 6% 20,298 5% 45,130 5%10 to 14 years 1,601 6% 1,297 6% 19,344 5% 44,834 5%15 to 19 years 1,673 6% 1,371 6% 21,778 5% 50,296 5%20 to 24 years 1,514 6% 1,306 6% 30,117 7% 59,742 6%
25 to 29 years 1,470 6% 1,273 6% 36,112 8% 61,269 6%30 to 34 years 1,512 6% 1,172 5% 33,098 8% 57,819 6%35 to 39 years 1,612 6% 1,278 6% 31,161 7% 57,264 6%40 to 44 years 1,891 7% 1,625 7% 28,795 7% 57,693 6%45 to 49 years 2,034 8% 1,708 8% 28,698 7% 62,913 7%
50 to 54 years 2,262 8% 1,957 9% 31,398 7% 73,083 8%55 to 59 years 2,159 8% 1,932 9% 31,567 7% 77,309 8%60 to 64 years 1,801 7% 1,754 8% 27,521 6% 71,340 7%65 to 69 years 1,496 6% 1,293 6% 22,852 5% 63,060 7%70 to 74 years 1,059 4% 895 4% 17,354 4% 49,184 5%
75 to 79 years 709 3% 627 3% 10,865 3% 32,670 3%80 to 84 years 442 2% 369 2% 7,415 2% 21,781 2%85 years and over 330 1% 257 1% 7,868 2% 22,421 2%
Median Age 42.2 43.3 40.2 44.8Dominant Age Group 50 to 54 50 to 54 25 to 29 55 to 59
East Hants Retail Trade Area
East Hants (MD), NS
Halifax, NS Nova Scotia

| Key Planning Strategies & Cushing Terrell Architecture Inc.19
One challenge that East Hants has to overcome is the commuter nature of the traffic and limited employment base in proximity of East Hants’ retail.
For categories such as restaurants this can represent a challenge as it limits the opportunities daytime lunch patronage during the course of the week. Commuter volumes are very strong however for the establishment and entrenchment of convenience goods and services, which are the foundation of the areas current success and still represent the “low hanging fruit”. These are necessary to create the baseline upon which more traditional comparison or Department Store Type Merchandise (DSTM) categories will follow.
3.3 AGE PROFILEA summary of the current age profile, as documented in Table 3.3 and Figure 3.4 reveal a slightly older family profile. In total, the median age is 42.2 years of age, with a dominant age group of 50 to 54 years.
Table 3.2 reveals that 31% of the Trade Area’s population is currently over the age of 55 years. This age cohort is valuable because they are supportive of local businesses and local spending.
As the Trade Area evolves, East Hants will attract aspirational, younger working families with a higher income and capacity/propensity for spending on categories other than conveniences, such as restaurants and leisure.
In general, Nova Scotia is represented by an older than average demographic (44.8 years with a dominant age group of 44 to 59 years). However, the Halifax and wider region’s future growth is being predicated on attracting young families and retaining an educated youthful workforce for whom other areas in the country may not offer the quality of life and affordability attributes.
3.4 HOUSEHOLD INCOME PROFILEHousehold incomes are among the most poignant and immediate determinants in identifying patterns of spending and potential thereof for retail, food & beverage, entertainment and services.
A summary of the current average Household Income in the Retail Trade Area as documented in Table 3.4 and Figure 3.5, reveals an average Household Income in 2017 estimated at almost $84,000 in the East Hants Trade Area. These incomes are lower than the City of Halifax average of just over $90,000 (2017), yet above the provincial average of $78,000 (2017). What is most opportunistic for the East Hants Trade area is the cost of living which is lower thus presenting higher levels of disposable income that would be supportive of retail and leisure pursuits.
Table 3.4 reveals that Average Household Income in the Trade Area is forecast to grow over the 5-year period 2017 to 2022, to an estimated $93,000, in conjunction with an improving provincial economy. Figure 3.6 illustrates that approximately 25% of households have an average Household Income of between $60,000 and $100,000.
Although the dominant income brackets are as noted, there is a relatively large component of the Total Trade Area (16%) that have an average Household Income over $125,000. Thus, the overall income profile represents overall economic health and stability for retail opportunities.
The higher ratio of incomes in the $20,000 to $60,000 are likely a combination of the more blue collar work composition as well as the older demographic who may either be retired or semi-retired and thus earning less income.
3East Hants is well-positioned to attract the aspirational cohorts represented by young families in their higher income earning years.

Retail Market Analysis - Municipality of East Hants, Nova Scotia | 20
Figure 3.5 TRADE AREA HOUSEHOLD INCOME BREAKDOWN MAP(Source: Pitney Bowes 2017 and Cushing Terrell Architecture Inc.)

| Key Planning Strategies & Cushing Terrell Architecture Inc.21
3Table 3.4 TRADE AREA HOUSEHOLD INCOME BREAKDOWN(Source: Pitney Bowes 2017 and Cushing Terrell Architecture Inc.)
2017 Estimates and Projections Income Trends
Average household income2017 estimated 83,872$ 83,980$ 90,673$ 78,359$ 2020 projected 90,613$ 90,340$ 98,861$ 85,049$ 2022 projected 95,110$ 94,577$ 104,310$ 89,526$
Aggregate household income ($000)2017 estimated 857,176$ 737,426$ 16,601,088$ 32,115,216$ 2020 projected 963,006$ 821,917$ 19,083,131$ 36,061,847$ 2022 projected 1,036,067$ 880,040$ 20,827,726$ 38,802,224$
Change in average household income2017 to 2020 6,740$ 6,361$ 8,188$ 6,689$ 2020 to 2022 4,497$ 4,237$ 5,449$ 4,477$
Change in aggregate household income ($000)
2017 to 2020 105,830$ 84,491$ 2,482,043$ 3,946,631$ 2020 to 2022 73,061$ 58,123$ 1,744,596$ 2,740,378$
2017 Estimated Households by Income 10,220%
base 8,781%
base 183,088%
base 409,846%
base
Under $5,000 218 2% 178 2% 4,499 2% 12,297 3%$5,000 to 9,999 246 2% 204 2% 4,560 2% 12,014 3%$10,000 to 14,999 379 4% 310 4% 6,912 4% 18,262 4%$15,000 to 19,999 585 6% 476 5% 10,565 6% 28,274 7%$20,000 to 29,999 900 9% 755 9% 15,127 8% 40,047 10%$30,000 - 39,999 935 9% 812 9% 15,710 9% 41,594 10%$40,000 - 49,999 944 9% 847 10% 15,548 8% 40,286 10%$50,000 to 59,999 920 9% 833 9% 14,848 8% 37,610 9%$60,000 - 79,999 1,330 13% 1,173 13% 21,101 12% 48,392 12%$80,000 - 99,999 1,204 12% 1,022 12% 20,111 11% 38,223 9%$100,000 - 124,999 909 9% 766 9% 17,057 9% 29,568 7%$125,000 - 149,999 586 6% 486 6% 12,713 7% 20,944 5%$150,000 - 174,999 356 3% 295 3% 8,486 5% 13,848 3%$175,000 - 199,999 237 2% 203 2% 5,678 3% 9,861 2%$200,000 - 249,999 174 2% 159 2% 4,117 2% 7,924 2%$250,000 and over 298 3% 262 3% 6,056 3% 10,702 3%
Median Estimated Household Income 59,827$ 59,706$ 63,578$ 53,230$
East Hants Retail Trade Area
East Hants (MD), NS Halifax, NS Nova Scotia
The retail trade area reveals a healthy level of average household income at ~$84,000.

Retail Market Analysis - Municipality of East Hants, Nova Scotia | 22
Figure 3.6 TRADE AREA HOUSEHOLD INCOME BREAKDOWN BY INCOME SEGMENTS(Source: Pitney Bowes 2017 and Cushing Terrell Architecture Inc.)

| Key Planning Strategies & Cushing Terrell Architecture Inc.23
3.5RETAIL SPENDING PROFILE
Building upon the Trade Area demographic profile analysis, an assessment was made of the Trade Area’s retail spending profile. This provides a more refined understanding of the opportunity for retail within East Hants.
The key questions it seeks to answer are:
• How much do Trade Area residents spend on Convenience retail (such as Grocery and Pharmacy), on Comparison retail1 (such as Fashion and Home Furnishings), and Leisure (Food & Beverage and Entertainment)?
• What spending patterns or trends does the Trade Area expenditure profile demonstrate? And how is spending forecast to change over the next 5 and 10 years to 2022 and 2027 respectively?
• What types of retail goods and services are garnering inflow of sales dollars and which categories are exhibiting outflow of sales (or leakage)?
Detailed information of retail spending within the Trade Area was collected from Pitney Bowes, a leading supplier of demographic and consumer expenditure information, using 2017 data. The data was compiled into groups according to where the respondent was from in order to build a spending profile for each respective Trade Area.
Each of the major three categories of spending (Convenience, Comparison and Leisure) was assessed at a detailed category-by-category level then aggregated into major categories.
Having established the Retail Trade Area population and demographic profile, the size of the retail market and growth was projected using retail spending data from Pitney Bowes.
As illustrated in Table 3.5, the Total Trade Area is estimated at $293 Million (2017 year-end est.). East Hants’ current retail core is supported by a strong market for conveniences for which drive times and proximity are driving factors.
The spending profile is considered healthy, though current opportunities beyond conveniences and services are somewhat limited because of slower new residential development, requiring an approach in the near term that should entail stronger penetration of the existing market rather than focusing on new growth, just for growth’s sake. Over the next 5 and 10 years though as the pricing gap between existing home resales and the sale price for new home construction narrows, retail opportunities will see an influx. Currently, the gap between existing single family residential sales and new single family construction is in the range of $100,000. In order to provide a more ideal pricing for new residential to start ramping up, this gap should fall in the $30,000 range.
The motto that retail follows rooftops is very appropriate for the market. As new residential development slowly begins to establish a foothold in communities like Elmsdale and Lantz the retailers will take notice and begin to see a market threshold that becomes more viable for the natural progression towards comparison or DSTM type merchandise segments and retailers.
Figures 3.7 and 3.8 illustrate the retail spending as summarized by the larger categorizations of Grocery & Conveniences, Comparison Merchandise (also know as Department Store Type Merchandise), Restaurants & Entertainment and Auto/RV/Motorsports Parts and Sales.
Figure 3.6 TRADE AREA HOUSEHOLD INCOME BREAKDOWN BY INCOME SEGMENTS(Source: Pitney Bowes 2017 and Cushing Terrell Architecture Inc.)
3The northward migration of population, spending, income and traffic bodes well for Elmsdale as an important retail centrality.

Retail Market Analysis - Municipality of East Hants, Nova Scotia | 24
Table 3.5 TRADE AREA RETAIL SPENDING 2017, 2022 & 2027(Source: Pitney Bowes 2017 and Cushing Terrell Architecture Inc.)
2022 (estimate) 2027 (estimate)
Municipality of East Hants
Aggregate Retail Spending
RETAIL TRADE AREA(including
Municipality of East Hants)
AggregateRetail Spending
RETAIL TRADE AREA(including
Municipality of East Hants)
AggregateRetail Spending
RETAIL TRADE AREA(including
Municipality of East Hants)
AggregateRetail Spending
Grocery & Specialty Foods $57,945,819 $68,228,720 $75,174,874 $82,191,520Pharmacy $6,752,589 $7,981,820 $8,794,424 $9,615,275Alcohol & Tobacco $14,409,621 $16,842,560 $18,557,249 $20,289,339Personal Services $10,853,316 $12,529,720 $13,805,332 $15,093,889Clothing & Apparel $18,685,968 $22,238,720 $24,502,775 $26,789,807Footwear $4,443,186 $5,293,960 $5,832,922 $6,377,353Jewelry & Accessories $2,941,635 $3,464,580 $3,817,298 $4,173,596Health & Beauty $5,435,439 $6,407,940 $7,060,312 $7,719,305Home Furnishings & Accessories $15,638,961 $18,109,840 $19,953,547 $21,815,964Home Electronics & Appliances $12,363,648 $14,757,680 $16,260,114 $17,777,794Home Improvement & Gardening $8,438,541 $9,780,540 $10,776,266 $11,782,098Books & Multimedia $3,907,545 $4,629,660 $5,100,991 $5,577,106Sporting Goods & Recreation $2,660,643 $3,055,780 $3,366,879 $3,681,136Toys & Hobbies $3,038,226 $3,505,460 $3,862,340 $4,222,842Miscellaneous Specialty $8,043,396 $9,208,220 $10,145,680 $11,092,654Restaurant F&B $14,471,088 $16,740,360 $18,444,644 $20,166,224Drinking Establishment $2,414,775 $2,790,060 $3,074,107 $3,361,037Entertainment & Leisure $8,728,314 $9,800,980 $10,798,787 $11,806,721Auto Parts & Accessories $4,794,426 $5,416,600 $5,968,047 $6,525,091Auto/RV/Motorsports Dealership $46,504,176 $52,173,100 $57,484,682 $62,850,166
TOTAL RETAIL CATEGORIES ONLY $252,471,312 $292,956,300 $322,781,272 $352,908,917
Retail Spending by Merchandise Category
2017 ( estimate)
Figure 3.7 TRADE AREA RETAIL SPENDING SUMMARY 2017
(Source: Pitney Bowes 2017 and Cushing Terrell Architecture Inc.)

| Key Planning Strategies & Cushing Terrell Architecture Inc.25
As shown in Figure 3.8 and as is more common in rural or secondary markets, the share of spending on Grocery and Conveniences (36%) is high when compared to other segments,while the spending on Comparison Merchandise (34%) is slightly less than that found in comparable markets, likely because of previously limited regional opportunities, which have been addressed since Dartmouth Crossing came on stream and since development in Lower Sackville introduced some more prominent brands.
Regardless of where residents spend their money, realizing that spending will occur in City of Halifax at Dartmouth Crossing, in Lower Sackville and to a lesser degree in Truro, the Top 5 retail spending categories for the Retail Trade Area are:
1. Grocery & Specialty Foods - $68.2 Million
2. Auto/RV/Motorsport - $52.1 Million
3. Clothing & Apparel - $31.0 Million (including Footwear and Jewelry)
4. Home Furnishings, Electronics and Appliances - $18.1 Million
5. Restaurant F&B - $16.7 Million (Full & Quick Service)
Average Annual Household Spending Patterns
Figures 3.9 to 3.14 provide a visual depiction of the average annual household spending on a select categories as follows:
• Grocery & Specialty Foods
• Personal Services
• Clothing & Apparel
• Home Furnishings & Accessories
• Home Improvement
• Restaurants
• Auto/RV/Motorsports
Each of the diagrams illustrates a consistent finding that reveals a northward migrating pattern of increasing spending that is soon to fall within the core area of the East Hants Hwy 102 corridor Retail Trade Area. While this cluster is currently emanating towards Enfield, it is expected that over the next decade this pattern of increased spending and corresponding increases in residential development and incomes will stimulate strong retail opportunities in and around Elmsdale.
3
Figure 3.8 TRADE AREA RETAIL SPENDING BY GENERAL CATEGORY
(Source: Pitney Bowes 2017 and Cushing Terrell Architecture Inc.)
East Hants’ retail trade area has a spending profile of almost $300 M in 2017 and is forecast to surpass $350 M by 2027.

Retail Market Analysis - Municipality of East Hants, Nova Scotia | 26
Table 3.9 TRADE AREA ANNUAL AVERAGE HOUSEHOLD SPENDING 2017 MAP - GROCERY & SPECIALTY FOODS(Source: Pitney Bowes 2017 and Cushing Terrell Architecture Inc.)
There are pockets of strong spending growth in excess of $8k and $10k respectively along the Hwy 102 corridor north and south of Elmsdale

| Key Planning Strategies & Cushing Terrell Architecture Inc.27
Table 3.10 TRADE AREA AVERAGE ANNUAL HOUSEHOLD SPENDING 2017 MAP - PERSONAL SERVICES(Source: Pitney Bowes 2017 and Cushing Terrell Architecture Inc.)
Spending on Personal Services is not as prominent in the Trade Area as it is in areas to the south. Current spending is less than $1.5K per household per year.

Retail Market Analysis - Municipality of East Hants, Nova Scotia | 28
Table 3.11 TRADE AREA AVERAGE ANNUAL HOUSEHOLD SPENDING 2017 MAP - CLOTHING & APPAREL(Source: Pitney Bowes 2017 and Cushing Terrell Architecture Inc.)
Spending on Clothing & Apparel is among the strongest in terms of growth in the southern area of the Hwy 102 corridor and will soon become an opportunity for Elmsdale.

| Key Planning Strategies & Cushing Terrell Architecture Inc.29
Table 3.12 TRADE AREA AVERAGE ANNUAL HOUSEHOLD SPENDING 2017 MAP - HOME FURNISHINGS & ACCESSORIES(Source: Pitney Bowes 2017 and Cushing Terrell Architecture Inc.)
Home Furnishings illustrate a longer term opportunity for the East Hants Trade Area. Spending will increase with new residential development as that occurs over the next decade. The existing Berry’s home store is well-positioned to maintain current sales.

Retail Market Analysis - Municipality of East Hants, Nova Scotia | 30
Table 3.13 TRADE AREA √SPENDING 2017 MAP - HOME IMPROVEMENT & GARDENING(Source: Pitney Bowes 2017 and Cushing Terrell Architecture Inc.)
Home Improvement illustrates a longer term opportunity for the East Hants Trade Area. Beyond the existing Rona and local Home Hardwares, spending will increase with new residential development.

| Key Planning Strategies & Cushing Terrell Architecture Inc.31
Table 3.14 TRADE AREA AVERAGE ANNUAL HOUSEHOLD SPENDING 2017 MAP - RESTAURANTS(Source: Pitney Bowes 2017 and Cushing Terrell Architecture Inc.)
Restaurant spending is an area of future growth, but is closely tied to having a consistent daily patron base, which will occur in step with residential development and the evolution of the area as an employment centre.

Retail Market Analysis - Municipality of East Hants, Nova Scotia | 32
Table 3.15 TRADE AREA AVERAGE ANNUAL HOUSEHOLD SPENDING 2017 MAP - AUTO/RV/MOTORSPORTS(Source: Pitney Bowes 2017 and Cushing Terrell Architecture Inc.)
Auto/RV/Motorsports has a relatively consistent spending pattern throughout the region, but the Hwy 102 corridor exhibits a pattern of strong, as yet untapped opportunity.

| Key Planning Strategies & Cushing Terrell Architecture Inc.33
retail supply4.0
4.1 INTRODUCTIONThe dynamics of the overall retail market provide critical indicators as to the performance of the retail and moreover the magnitude of demand and resulting opportunity for which certain market segments can be filled.
This section provides a detailed inventory of the tenants that comprise the current retail market for the jurisdictional boundary of the Municipality of East Hants (as distinct from the previously delineated retail trade area) for each of the respective communities that comprise the Municipality - Enfield, Elmsdale, Milford, Lantz, Shubenecadie, Mt Uniacke and Kennetcook.
The purpose of the inventory evaluation is to identify a foundation for demand and current retail performance (also known as retail sales productivity) followed by identifying the potential types of tenants and/or merchandise categories for whom East Hants could be compatible.
4.2EAST HANTS RETAIL MARKETTo document the retail inventory, on-the-ground fieldwork was undertaken in which street front retail premises were documented in terms of the retail store, merchandise category, estimated unit size, vacancy as well as North American Industry Classification System (NAICS) code.
The inventory was categorized into the same merchandise categories that were profiled in the retail spending so that a direct comparison could be taken. In some cases where retail data was not available, store sizes were estimated using leasing plans, brokerage websites and satellite mapping measurements.
As documented in Tables 4.1 and 4.2 and Figure 4.1 the East Hants retail market has an estimated streetfront floor space in the range of 453,000 sf.
This floor space is comprised of business types that range from Grocery to Home Improvement, Restaurants, Personal Services such as Salons as well as Professional Services. When excluding businesses that are not retail related but do occupy retail street front spaces, the total inventory is an estimated 445,000 sf.
The inventory also distinguishes between Professional Medical, Finance/Insurance/Real Estate Services or other Non-Retail that may occupy traditional street front spaces, but typically do not have a retail productivity. Regardless, many of these uses even if not traditional retail are essential to the lifeblood of retail and are part of the overall market demand analysis.
4.3 RETAIL VACANCYA review of the current vacancy and nature of the vacancies provides additional cues for prospective business interests in the community.
Table 4.1RETAIL MARKET SNAPSHOTRetail Business Name Community General Retail Category Est. Area
(SF) NAICS Sector # NAICS Sector Name NAICS Industry # NAICS Industry Name
TOTAL 452,931 sq.ft.
TOTALRETAIL(ExcludingNon-RetailStreetfront) 444,931 sq.ft.
VACANT 15,068 sq.ft. VACANT
%VACANT(ofALLstreetfrontcommercialspace)
3.3% %VACANT
RetailSpacePerCapita(againstEastHantsPopulation22,4532016)
19.8 sq.ft./capita

Retail Market Analysis - Municipality of East Hants, Nova Scotia | 34
Table 4.2 MUNICIPALITY OF EAST HANTS RETAIL INVENTORY BY CATEGORY(Source: Cushing Terrell Architecture Inc.)MUNICIPALITYOFEASTHANTS
MerchandiseCategoryExisting
Inventory(SF)Existing
Inventory(%)
Grocery&SpecialtyFoods 130,040 29.0%Alcohol&Tobacco 19,000 4.2%Pharmacy 22,493 5.0%PersonalServices 10,083 2.3%Clothing&Apparel 1,760 0.4%Footwear 202 0.0%Jewelry&Accessories - 0.0%Health&Beauty - 0.0%HomeElectronics&Appliances 3,641 0.8%HomeFurnishings&Accessories 25,019 5.6%HomeImprovement&Gardening 58,423 13.0%Books&Multi-Media - 0.0%SportingGoods&OutdoorRecreation 4,319 1.0%Toys&Hobbies 2,019 0.5%SpecialtyRetail 27,454 6.1%RestaurantF&B 41,991 9.4%DrinkingEstablishments 12,000 2.7%Entertainment&Leisure 14,500 3.2%AutoParts&Accessories 18,289 4.1%Auto/RV/MotorsportsDealership 3,700 0.8%Finance/Insurance/RealEstateServices 21,875 4.9%ProfessionalServices 8,007 1.8%NON-RETAILStreetfront 8,000 1.8%VACANT 15,068 3.4%
TOTAL 447,883 100.0%TotalabovedoesnotincludetheAutoServiceatCanadianTireatElmsdaleShoppingCentre
Note: There are certain retail tenants in East Hants that encompass more than one particular merchandise category. Most notable is Home Hardware, which beyond hardware and home improvement, often provides home furnishings & decor, sporting goods and small home appliances etc in its smaller market locations (e.g. Enfield, Shubenecadie). In many respects, Home Hardware could be classified as a General Merchandiser. However, for the purposes of this retail market analysis and since there is not an inventory or NAICS category for General Merchandise, the Home Hardware stores’ inventory are classified as “Home Improvement & Gardening.

| Key Planning Strategies & Cushing Terrell Architecture Inc.35
Table 4.3MUNICIPALITY OF EAST HANTS RETAIL INVENTORY SUMMARY BY COMMUNITY
4Community/Neighbourhood Existing
Inventory (SF)Existing
Inventory (%)Vacant (SF) Vacant (%)
Elmsdale 305,531 67% 7,568 2%Enfield 46,500 10% 1,500 3%Kennetcook 34,500 8% 0 0%Lantz 4,850 1% 0 0%Milford 18,500 4% 0 0%Mt Uniacke 13,750 3% 1,500 11%Shubenacadie 29,300 6% 4,500 15%
TOTAL 452,931 100% 15,068 3%
Elmsdale
Lantz
Shubenecadie
Enfield
Milford
Kennetcook
Mt. Uniacke

Retail Market Analysis - Municipality of East Hants, Nova Scotia | 36
Table 4.4 MUNICIPALITY OF EAST HANTS RETAIL BUSINESSES INVENTORY BY NAICS CODES (Source: Statistics Canada and Cushing Terrell Architecture Inc.)
NAICSCLASSIFICATIONNumberofBusinesses
BusinessBreakdown
Accommodation&foodservices 32 21.2%Arts,entertainment&recreation 3 2.0%EducationalServices 4 2.6%Finance&Insurance 7 4.6%HealthCare&SocialAssistance 12 7.9%Information&CulturalIndustries - 0.0%Manufacturing 1 0.7%Otherservices(exceptpublicadministration) 13 8.6%Professional,scientificandtechnicalservices 2 1.3%PublicAdministration - 0.0%RealEstate&rental&leasing - 0.0%RetailTrade 63 41.7%Transportationandwarehousing - 0.0%WholesaleTrade - 0.0%VACANT 14 9.3%
TOTAL 151 100.0%

| Key Planning Strategies & Cushing Terrell Architecture Inc.37
4In particular, the overall vacancy rate is estimated at just over 3% which is below the industry standard for a healthy retail market that should be in the 4% to 5% level and thus suggests that there could be demand and opportunity for compatible retailers. Overall, the market would seem to be in balance with the magnitude of spending and demand. Well-located spaces along the east and west sides of the Hwy 102 corridor at Elmsdale with high visibility and as such have the potential tap into not just the expected growing local market, but passing motorists and an evolving captive workforce in time.
Current vacancy at the Elmsdale Plaza comprises only 2 units with rental rates in the $20 - $25 psf range and CAM rates in the range of $3.50 to $5.50 psf.
The highest vacancy of consequence is in the Village Cores of Mt. Uniacke, Enfield and Shubenecadie, although the overall amounts of vacant space are relative to a smaller total inventory base. Regardless, caution should be exercised for the village cores as they are more susceptible to competitive pressures elsewhere. Vacancy in Shubenecadie is largely attributable to the former Shubenecadie Trading Post hunting & fishing retailer, which struggled to gain traction in its almost 5,000 sf space relative to the trade area it was trying or needed to access.
An opportunity for East Hants, in advance of the next evolution of retail demand over the next 5 to 10 years would be to improve the wayfinding and a streetscape improvement program in the key Village Core area of Elmsdale to make the building frontages more inviting and pedestrian-friendly. Decisions like this will make the Village Core a more attractive and compact locale as well as making it competitive to other alternatives that will choose to locate at or near the Hwy 102/Rte 214 interchange.
The implications of vacancy (buildings and land) are two-fold. Firstly, the opportunity may exist to attract businesses into existing vacant spaces or land that could have lower rent costs applied and as a result may be more attractive to local businesses who may not have the sales productivity to justify higher rents. Secondly, any new development should be targeted for uses that have the ability to be in-step with the expanding market with caution for its impact on existing businesses in smaller nodes. The reality of retail expansion in a community is many branded tenants will often seek out and have the capacity to pay for newer, more expensive spaces and typically do not locate in Village Core type spaces. This speaks to engaging the community for using Village Cores as essential spaces for incubating entrepreneurial growth.
This study has not included vacant, developable lands available for retail development located at the Elmsdale Plaza (Crombie REIT property) and Atlantic Superstore (Choice Properties Development). That said, it is understood from conversations that interest has been expressed in both areas, but the market is currently at the stage where new residential population growth is desired to further validate the opportunity for a respective target tenant to locate a new location.
It is expected, as will be documented in Section 5 that future demand for the year 2022 and 2027 will provide valuable benchmarks that retailers could use to evaluate and prepare for their expansion and new store strategy.
4.4 RETAIL INVENTORY BY CATEGORYTable 4.2 (and Appendix A) provides a breakdown of East Hants’ retail inventory by category.
Retail vacancy in the Municipality is less than 4%, while the Elmsdale Node retail vacancy is only 2.5%.(Industry standard for a healthy retail
environment is 4%-5%)

Retail Market Analysis - Municipality of East Hants, Nova Scotia | 38Photos courtesy of Cushing Terrell Architecture Inc.
Figure 4.1 REPRESENTATIVE EAST HANTS RETAIL IMAGERY - HWY 102 CORRIDOR Source: Photos by Cushing Terrell Architecture Inc.)

| Key Planning Strategies & Cushing Terrell Architecture Inc.39
4Consistent with an evolving retail community, the Top 5 retail categories in terms of overall retail floor space in East Hants are:
1. Grocery & Specialty Foods 130,040 sf2. Home Improvement & Gardening 58,423 sf3. Restaurant F&B 41,991sf4. Specialty Retail 27,454 sf5. Pharmacy 22,493 sf
The Home Improvement category in East Hants is somewhat misleading. While there are multiple Home Hardware franchises as well as a RONA, each of these particular retailers actually comprise a selection of home goods and other general merchandise. Therefore, it could be opined that the while the Home Improvement inventory by single category classification is higher than the norm, it actually represents a local general merchandise type of retailers.
East Hants is starting to slowly increase its offerings within the Comparison or Department Store Type Merchandise Categories (DSTM), though it is still expected that a further concentration or attraction of more notable brands is approximately 5 years away from gaining traction. While certain merchandise categories may be worth pursuing in certain circumstances, the majority of residents nonetheless will continue to be drawn to Lower Sackville, Dartmouth Crossing or Truro for retail in the near term.
4.5 RETAIL INVENTORY BY NAICSTable 4.4 provides a breakdown of the North American Industry Classification System (NAICS) for East Hants’ street front businesses.
East Hants’ retail inventory is comprised of almost 41.7% of businesses that are traditional Retail in their classification, followed by almost 21.2% in the Accommodations & Food Services classification.
Rounding out the top 3 industries are Other Services which in East Hants comprise hair salons and other personal service type businesses. Along with Health Care & Social Assistance, combined these classifications account for 16.4% of East Hants businesses that occupy traditional retail spaces in the community.
4.6 RETAIL SPACE PER CAPITAUtilizing data from Cushing Terrell’s/Key Planning’s extensive retail inventory tabulation in conjunction with Demographic Data provided by Statistics Canada and Pitney Bowes, the approximate retail space per capita ratio has been estimated for the East Hants retail market.
As a starting point, Figure 4.2 depicts the Target Retail Space Per Capita, which provides a baseline for determining how much retail per capita is best suited to a community, according to its population size.
How much retail a community is able to support is crucial for determining future land use plans: a local government wants to have as much evidence as possible to demonstrate to potential retailers the opportunity and untapped potential in their community. Per Capita ratios can also be used as a methodology to gauge future demand, if and as population growth occurs.
Many communities with retail services and high commuting flows like Elmsdale evolve to serve as shopping locales for not only the residents of that respective community, but more prominently serve a larger Trade Area.
Elmsdale is an established convenience & services cluster, setting the stage for the evolution to provide a more diverse retail and F&B offering.

Retail Market Analysis - Municipality of East Hants, Nova Scotia | 40
Figure 4.2 RETAIL SPACE PER CAPITA GROWTH CONTINUUM Source: Cushing Terrell Architecture Inc.)
EAST HANTS’ PER CAPITA
RETAIL RATIO IS 19.8
East Hants’ retail space per capita is under 20 sq. ft., which is ideal for future retail growth.

| Key Planning Strategies & Cushing Terrell Architecture Inc.41
4The current retail space per capita, as calculated by Cushing Terrell takes into account the inventory of East Hants, but acknowledges that retail is not isolated to municipal boundaries and is more fluid. That said, per capita retail space is a good guideline or check and balance for a community and can easily be updated if inventory and population growth is tracked.
Figure 4.2 is meant to illustrate a general indication of retail opportunity and representation for communities.
Many location specific factors contribute to an areas overall retail market, and cannot be addressed in a general chart or graph. Such locational factors can include specialized demands of a community, or unique characteristics that warrant certain retail traits. Aside from unique locational factors that each retail trade area has, Figure 4.2 provides beneficial direction and insight for communities to consider when trying to understand the opportunities of their retail market.
Retail space per capita is an industry measure of the ratio of retail space against a city’s population. An examination of retail space per capita provides a general indication of whether a market is under-retailed or over-retailed.
In most urban markets in Canada and the United States, a typical benchmark for ALL retail space per capita is in the range of 20 sf to 30 sf (Source: International Council of Shopping Centers).
This figure can be misleading however as this accounts for organized shopping center space only in centers larger than 10,000 sf. Therefore, when factoring in all retail including street front retail, urban markets can be higher than this figure.
Referring to Figures 4.3 and 4.4, Ryerson University’s Centre for the Study of Commercial Activity has produced recent statistics that suggest the per capita retail space for the Province of Nova Scotia is 20.32, while the City of Halifax is estimated at 26.18. This figure too is based predominantly on organized shopping centre space and does not include streetfront retail such as that which would exist today in East Hants’ Village Cores.
Using Figure 4.2 as a benchmark for retail space in communities and for a comparable market like East Hants which is more suburban and reaches a wider area given the more remote nature, this figure should fall in the 25 to 35 sf per capita range for ALL retail space.
Currently, the estimated retail space per capita ratio for the East Hants’ Retail Trade Area is in the range of 20 sf/capita which includes all retail space.
At a per capita level of 20 sf, East Hants would seem to be at a point of balance relative to its supported retail trade area.
However, if the industry standard space per capita of 20 sf were to be applied to new population growth in the Trade Area for new retail in an ‘organized format’ (meaning at Elmsdale Plaza or Atlantic Superstore lands), the future additional space supportable by new population growth by 2027 could be approximately 50,000 sf. This figure would be seen to be conservative, but nonetheless would be an indicator at the lower end of the spectrum whereby if population growth were to exceed current forecasted levels, the resultant demand would increase accordingly. In short, based on the current rate of conservative population growth, with no other interventions, the Municipality should expect future demand for a minimum of 50,000 sf of new retail space by 2027.
Based on conservative forecasts, the Municipality should expect a minimum demand for 50,000 sf of new retail space by 2027.

Retail Market Analysis - Municipality of East Hants, Nova Scotia | 42
TOTAL MRC SQ.FTBY SELECTED CHAIN
WalmartSupercentre
Canadian Tire
Home Depot
Shop
per
s D
rug
Mar
t
Hudsons Bay
Rea
l Can
adia
nSu
per
stor
e
Sear
s
Costco
IKEA
Win
ner
s
MAJOR MARKET MRC SQ.FT. PER CAPITA
ON QC
MBSKABBCNF
NB PEINS
PROVINCIAL MAJOR RETAIL CHAIN (MRC) SQ.FT BY RETAIL SECTOR ACROSS CANADA
Furniture Home Furnishings
Home Improvement
Grocery
Electronics Appliances
Health
Fashion
General Merchandise
Other
TOTAL NATIONAL SQ.FT. BY RETAIL SECTOR
TOP 3 RETAIL SECTORS IN CANADA
BY SQUARE FOOTAGE
CSCA2017
MAJOR RETAIL CHAIN RELEASE
BestBuy
Rona
1.6%
10%
6.4%
26.7%
27%
7.8%
12.8%
7.7%
Montreal
Vancouver
10.28
9.99
Calgary Edmonton
15.62 19.26
Toronto
11.11
Regina
23.26
Winnipeg
18.29
Saint John
29.78
Halifax
20.10
St John’s
28.78
© 2017 CENTRE FOR THE STUDY OF COMMERCIAL ACTIVITY
Figure 4.3 PROVINCIAL MAJOR RETAIL CHAIN SQ. FT. BY RETAIL SECTOR Source: Ryerson University Centre for Study of Commercial Activity

| Key Planning Strategies & Cushing Terrell Architecture Inc.43
SHOPPING CENTRE SQUARE FOOTAGE PER CAPITA BY PROVINCE
NB NS
PEI
ON QC
MBSKABBC NF
CSCA2017
SHOPPING CENTRE DATA RELEASE
16.2521.50
14.89 14.44
20.4514.23
14.54
17.3320.32
16.31
Neighbourhood
Community
Power Centre
Factory Outlet
Hybrid
Mixed Use
SHOPPING CENTRE SQ.FT. PER CAPITA
NS
15.79
Vancouver
TOTAL SQ.FT. BY SHOPPING CENTRE TYPE
1%
West Edmonton Mall5.3 million sq.ft.
South Edmonton Commons2.4 million sq.ft.
Square One Shopping Centre1.8 million sq.ft.
TOP 3 LARGEST SHOPPING CENTRES BY SQ.FT.
22.7%
Super Regional8%
Regional13.3%
18%
5.4%
28.6%
0.5%
Lifestyle0.2%
2.3%
Convenience
SK
20.66
Regina
26.18
Halifax
Calgary
23.79 18.40
Winnipeg Toronto
22.04
16.24
Montreal
26.63
Saint John
PEI
25.96
Charlottetown
21.70
St. John’s
© 2017 CENTRE FOR THE STUDY OF COMMERCIAL ACTIVITY
Figure 4.4 SHOPPING CENTRE SQ. FT. PER CAPITA BY PROVINCE Source: Ryerson University Centre for Study of Commercial Activity

Retail Market Analysis - Municipality of East Hants, Nova Scotia | 44

| Key Planning Strategies & Cushing Terrell Architecture Inc.45
5.1 INTRODUCTIONThe following section will assess the amount of supportable floor space in East Hants justified by the Trade Area it serves. This is achieved by quantifying the current estimated retail sales based on the current inventory and applying this against the trade area retail expenditure to determine the current market share. Next is to quantify the expenditure growth and set benchmarks and targets for market share growth on a category-by-category basis to determine the amount of future floorspace that could be added by 2022 and 2027.
5.2 RETAIL FLOOR SPACE DEMAND In most typical urban market scenarios, forecasting retail demand would largely be predicated and have a close correlation with population growth and the inherent opportunities that would naturally come from a growing trade area. However in secondary or rural markets where population growth forecasts have not historically been significant enough to provide this requisite increase, an additional approach to demand is applied.
The overall retail market in East Hants seems to exhibit some small-scale opportunities in the near term predicated on conveniences and services within the existing retail inventory to accommodate new business opportunities.
With this understanding of East Hants’ evolving market dynamic and population growth, the key to forecasting new floorspace demand must look at the notion of increasing the achievable market share of the trade area spending as well as taking into account demand that could be attributable to more rooftops entering the market.
From the extensive analysis of the current retail inventory, retail sales productivity estimates were applied to each of the respective categories to provide an indication of the current estimated retail sales that the community’s businesses are generating.
A sounding board for retail productivities are the lease rates which are estimated to be in the range of $8 - $12 per sf in the Village Core and rural areas like Kennetcook, Elmsdale, Milford etc, though most available properties are for sale and not leased. On this basis, it is estimated that retail sales productivities in the community would average in the $125 to $200 per sq. ft. range with the possible exception of conveniences which could be in the range of $250 to $275 per sf. The Highway Commercial area in and around Rte 214 and Hwy 102 are estimated to have lease rates in the range of $20 to $25 per sf and resulting productivities of around $200 to $250 per sf.
In applying sales productivities as shown in Table 5.1 against East Hants’ current retail inventory of occupied space only suggests that East Hants currently garners only 34% market share of the total trade area retail spending, which also factors in a “miscellaneous inflow” component to account for passing ‘pit-stop’ motorists. Of note is that East Hants has strong retention of spending in convenience categories, and for home improvement, which supports the current inventory levels.
The key to East Hants’ retail opportunity lies in incrementally and slowly increasing the overall market share of sales, realizing that the Trade Area for the Hwy 102 corridor is rapidly evolving into its own self-serving Retail Trade Area.
retail demand5.0

Retail Market Analysis - Municipality of East Hants, Nova Scotia | 46
TABLE 5.1EAST HANTS ESTIMATED RETAIL MARKET SHARE AND PRODUCTIVITY
NOTES & ASSUMPTIONS1 Miscellaneous Inflow accounts for residents falling outside of the Primary Trade Area as well as Hotel Visitors & Passing Motorists not accounted for in residential base 2 Retail inventory includes inventory includes Enfield, Elmsdale, Lantz, Milford, Shubenecadie, Kennetcook & Mt. Uniacke3 2022 and 2027 Estimated Retail Sales reflect an inflationary increase in spending at 1.0% per annum. 4 Home Improvement can be a misleading category as a share of the sales in this market would come from contractors etc. and not necessarily “resident spending” upon which demand is based in this case.
2017Total Trade Area Retail Spending
(with Misc Inflow)
2017Estimated
Retail Sales Productivity
($psf)
2017Estimated
MarketShare
2017Estimated Retail Sales $ (Inflow)
2017Current
Town/County Retail Inventory
(sq. ft.) 2
5% Grocery & Specialty Foods $71,640,156 $400 73% $52,016,000 130,0405% Pharmacy $8,380,911 $300 81% $6,747,900 22,4935% Alcohol & Tobacco $17,684,688 $450 48% $8,550,000 19,0005% Personal Services $13,156,206 $175 13% $1,764,525 10,0830% Clothing & Apparel $22,238,720 $200 2% $351,930 1,7600% Footwear $5,293,960 $200 1% $40,386 2020% Jewelry & Accessories $3,464,580 $125 0% $0 00% Health & Beauty $6,407,940 $175 0% $0 05% Home Furnishings & Accessories $19,015,332 $175 3% $637,114 3,6410% Home Electronics & Appliances $14,757,680 $150 25% $3,752,895 25,01910% Home Improvement & Gardening 4 $10,758,594 $175 95% $10,224,053 58,4230% Books & Multimedia $4,629,660 $150 0% $0 00% Sporting Goods & Recreation $3,055,780 $125 18% $539,913 4,3190% Toys & Hobbies $3,505,460 $125 7% $252,413 2,0195% Miscellaneous Specialty $9,668,631 $125 35% $3,431,733 27,45410% Restaurant F&B $18,414,396 $200 46% $8,398,200 41,9915% Drinking Establishments $2,929,563 $125 51% $1,500,000 12,0000% Entertainment & Leisure $9,800,980 $100 15% $1,450,000 14,5005% Auto Parts & Accessories $5,687,430 $150 48% $2,743,290 18,28910% Auto/RV/Motorsports Dealership $57,390,410 $300 2% $1,110,000 3,700
$307,881,077 $262 34% $103,510,350 394,933
2017
Merchandise CategoryMiscellaneous
SpendingInflow Factor 1
Current market share of retail spending is estimated at 34% suggesting significant retail sales leakage by trade area residents of 66%.

| Key Planning Strategies & Cushing Terrell Architecture Inc.47
As observed previously, the historic pattern of retail trade has placed the Hwy 102 corridor and in particular Elmsdale at the periphery of two existing Trade Areas (Truro, and Halifax, Dartmouth and Lower Sackville). This is changing however whereby Elmsdale and the shifting of demand north for future new residential is creating a more viable opportunity for retail in Elmsdale.
The analysis of market shares as shown in Table 5.2 and Figure 5.1 further illustrate that in particular, merchandise categories that include Grocery & Conveniences, Personal Services, and Restaurants (most likely limited) could boost their market share to provide sufficient demand to warrant additional businesses in the community by 2022. This opportunity is summarized as follows:
Grocery & Convenience new demand 18,000 sfmarket share increase from 73% to 75%
Restaurant F&B new demand 8,700 sfmarket share increase from 46% to 50%
Personal Services new demand 6,500 sfmarket share increase from 13% to 20%
While these numbers on the surface may seem low, they are in step with the size of the trade area as well as in step with the likely demand from potential businesses over the next 5 years.
If East Hants were to increase its current market share penetration by 7% from an estimated 34% to 41%, then the total demand by the year 2022, without new population growth could be approximately 99,000 sf.
The reality is that this space may only result in a few specifically targeted new businesses, but rather the goal should also be to ensure that existing businesses can increase their market share and resulting sales and profitability rather than adding new space to further dilute the existing market.
Retail growth need not always be about adding new retail, but creating an environment for stronger retention and performance of existing businesses, particularly where there may be a sensitivity for retail in Village Core areas and where the drive times to larger retail nodes is still considered relatively convenient at 30-minutes or less.
Because East Hants’ Retail Trade Area represents a notable opportunity for future growth, the forecasted market share approach was further extended to the year 2027, which is considered a reasonable timeline for when the new residential market will likely be ramping up in and around the Elmsdale/Lantz communities.
Using the same approach as applied for determining 2022 demand, the demand for 2027, as shown in Table 5.3 and Figure 5.2 reveals the following key findings, which could either be viewed as incremental (meaning additional new if the figures in 2022 were achieved) or cumulative (meaning that the total new demand by 2027:
Incremental Demand 2022 to 2027
Grocery & Convenience new demand 24,000 sfmarket share increase from 75% to 80%
Clothing & Apparel new demand 14,000 sfmarket share increase from 5% to 15%(excluding Footwear)
Restaurant F&B new demand 10,280 sfmarket share increase from 50% to 55%
5An increase in market share of 7% over 2017 - 2022 could result in almost 100,000 sf of either new retail or simply higher performing businesses.

Retail Market Analysis - Municipality of East Hants, Nova Scotia | 48
FIGURE 5.1 EAST HANTS 2022 NET POTENTIAL DEMAND BY CATEGORY
Convenience Categories
Comparison or DSTM Categories
Leisure Categories
Automotive Categories

| Key Planning Strategies & Cushing Terrell Architecture Inc.49
5TABLE 5.2EAST HANTS TARGETED RETAIL MARKET SHARE AND RESULTING DEMAND FORECAST- 2017 TO 2022Convenience Categories
Comparison or DSTM Categories
Leisure Categories
Automotive Categories
2022Total Trade Area Retail Spending
(with Misc Inflow)
2022 Target Market Share of Retail
Spending
2022 Estimated
Retail Sales $(Inflow) 2
2022 Potential Retail
Inventory
2022 Potential Net Future Retail Floorspace
Demand
5% Grocery & Specialty Foods $78,933,618 75% $59,200,214 148,001 17,9615% Pharmacy $9,234,146 85% $7,849,024 26,163 3,6705% Alcohol & Tobacco $19,485,111 55% $10,716,811 23,815 4,8155% Personal Services $14,495,599 20% $2,899,120 16,566 6,4830% Clothing & Apparel $24,502,775 5% $1,225,139 6,126 4,3660% Footwear $5,832,922 5% $291,646 1,458 1,2560% Jewelry & Accessories $3,817,298 5% $190,865 1,527 1,5270% Health & Beauty $7,060,312 5% $353,016 2,017 2,0175% Home Furnishings & Accessories $20,951,224 10% $2,095,122 11,972 8,3310% Home Electronics & Appliances $16,260,114 25% $4,134,966 27,566 2,54710% Home Improvement & Gardening 4 $11,853,893 95% $11,264,932 64,371 5,9480% Books & Multimedia $5,100,991 5% $255,050 1,700 1,7000% Sporting Goods & Recreation $3,366,879 20% $673,376 5,387 1,0680% Toys & Hobbies $3,862,340 10% $386,234 3,090 1,0715% Miscellaneous Specialty $10,652,964 45% $4,793,834 38,351 10,89710% Restaurant F&B $20,289,109 50% $10,144,554 50,723 8,7325% Drinking Establishments $3,227,813 60% $1,936,688 15,494 3,4940% Entertainment & Leisure $10,798,787 15% $1,597,620 15,976 1,4765% Auto Parts & Accessories $6,266,450 55% $3,446,547 22,977 4,68810% Auto/RV/Motorsports Dealership $63,233,150 5% $3,161,657 10,539 6,839
$339,225,495 41% $126,616,414 493,819 98,887
2022
Merchandise CategoryMiscellaneous
SpendingInflow Factor 1
NOTES & ASSUMPTIONS1 Miscellaneous Inflow accounts for residents falling outside of the Primary Trade Area as well as Hotel Visitors & Passing Motorists not accounted for in residential base 2 Retail inventory includes inventory includes Enfield, Elmsdale, Lantz, Milford, Shubenecadie, Kennetcook & Mt. Uniacke3 2022 and 2027 Estimated Retail Sales reflect an inflationary increase in spending at 1.0% per annum. 4 Home Improvement can be a misleading category as a share of the sales in this market would come from contractors etc. and not necessarily from “resident spending” upon which demand is based in this case.

Retail Market Analysis - Municipality of East Hants, Nova Scotia | 50
FIGURE 5.2EAST HANTS 2027 NET POTENTIAL DEMAND BY CATEGORY
Convenience Categories
Comparison or DSTM Categories
Leisure Categories
Automotive Categories

| Key Planning Strategies & Cushing Terrell Architecture Inc.51
5TABLE 5.3EAST HANTS TARGETED RETAIL MARKET SHARE AND RESULTING DEMAND FORECAST- 2022 TO 2027Convenience Categories
Comparison or DSTM Categories
Leisure Categories
Automotive Categories
2027Total Trade Area Retail Spending
(with Misc Inflow)
2027 Target Market Share of Retail
Spending
2027Estimated
Retail Sales $(Inflow) 2
2027 Potential Retail
Inventory
2027Potential
Incremental Net Future Retail Floorspace
Demand
2027Potential
Cumulative Net Future Retail Floorspace Demand 5
5% Grocery & Specialty Foods $86,301,096 80% $69,040,877 172,602 24,602 42,5625% Pharmacy $10,096,039 85% $8,581,633 28,605 2,442 6,1125% Alcohol & Tobacco $21,303,806 65% $13,847,474 30,772 6,957 11,7725% Personal Services $15,848,584 25% $3,962,146 22,641 6,074 12,5580% Clothing & Apparel $26,789,807 15% $4,018,471 20,092 13,967 18,3330% Footwear $6,377,353 10% $637,735 3,189 1,730 2,9870% Jewelry & Accessories $4,173,596 10% $417,360 3,339 1,812 3,3390% Health & Beauty $7,719,305 10% $771,931 4,411 2,394 4,4115% Home Furnishings & Accessories $22,906,762 15% $3,436,014 19,634 7,662 15,9940% Home Electronics & Appliances $17,777,794 30% $5,333,338 35,556 7,989 10,53610% Home Improvement & Gardening 4 $12,960,308 95% $12,316,374 70,379 6,008 11,9560% Books & Multimedia $5,577,106 10% $557,711 3,718 2,018 3,7180% Sporting Goods & Recreation $3,681,136 25% $920,284 7,362 1,975 3,0430% Toys & Hobbies $4,222,842 15% $633,426 5,067 1,978 3,0485% Miscellaneous Specialty $11,647,287 50% $5,823,643 46,589 8,238 19,13510% Restaurant F&B $22,182,846 55% $12,200,565 61,003 10,280 19,0125% Drinking Establishments $3,529,089 70% $2,470,362 19,763 4,269 7,7630% Entertainment & Leisure $11,806,721 15% $1,746,738 17,467 1,491 2,9675% Auto Parts & Accessories $6,851,345 60% $4,110,807 27,405 4,428 9,11710% Auto/RV/Motorsports Dealership $69,135,183 10% $6,913,518 23,045 12,506 19,345
$370,888,005 51% $157,740,409 622,641 128,822 227,709
2027
Merchandise CategoryMiscellaneous
SpendingInflow Factor 1
NOTES & ASSUMPTIONS1 Miscellaneous Inflow accounts for residents falling outside of the Primary Trade Area as well as Hotel Visitors & Passing Motorists not accounted for in residential base 2 Retail inventory includes inventory includes Enfield, Elmsdale, Lantz, Milford, Shubenecadie, Kennetcook & Mt. Uniacke3 2022 and 2027 Estimated Retail Sales reflect an inflationary increase in spending at 1.0% per annum. 4 Home Improvement can be a misleading category as a share of the sales in this market would come from contractors etc. and not necessarily from “resident spending” upon which demand is based in this case.
Cumulative retail demand over the next decade could result in just under 230,000 sf premised on increasing the market share of retail spending from 34% to 51%.

Retail Market Analysis - Municipality of East Hants, Nova Scotia | 52
If East Hants were to continue to increase its market share penetration from 2022 to 2027 by 10% from an estimated 41% to 51%, then the incremental new demand by the year 2027, without new population growth could be an additional 129,000 sf.
Therefore, the cumulative impact of increasing market share from the current levels today of 34% to 50% 2027 could result in new demand for approximately 227,000 sf of retail space.
This approach is predicated on businesses and marketing of the respective retail in the area so that the existing Trade Area residents spend more of their retail dollars in the community. It is not inconceivable that over the next decade the market share of retail spending could set a goal of increasing from 34% to 50%. This still means that half of resident spending for many larger or destination-oriented items would continue to take place at locations such as Dartmouth Crossing or other enclosed malls in the City of Halifax.
In combination with the above market share figures, the previously documented estimate of 50,000 sf of new demand that could be attributed to forecasted population growth in the Trade Area over the period 2017 to 2027 at a per capita rate of 20 sf could also be applied.
Consequently, East Hants’ Retail Trade Area could add in the range of 225,000 to 275,000 sf of new retail space by 2027.

| Key Planning Strategies & Cushing Terrell Architecture Inc.53
conclusions6.0
6.1 KEY FINDINGS & DIRECTIONSOn the basis of the retail market analysis, the East Hants market is most accurately characterized with cautious optimism as it pertains to its retail growth outlook.
Overall the retail market is already positioning itself as a strong local convenience destination, but it is soon to reach the ‘tipping point’ to becoming a more self-sufficient retail market for the gradual introduction of more general merchandise and food & beverage offerings as well as specifically targeted comparison or DSTM type categories/stores.
The following presents some key findings and directions for the Municipality of East Hants and its retail market:
• At an absolute minimum the Municipality of East Hants should expect to have demand for 50,000 sf of new retail space by 2027.
• The Municipality should set a goal and strive to retain a minimum 50% market share of total trade area spending by 2027; an increase of 16% from 2017.
• On an incremental basis, and with increasing market penetration, new retail demand could be 100,000 sf over the period 2017 to 2022 with an additional 130,000 sf over the period 2022 to 2027.
• In combination with increasing market share of retail spending and forecasted conservative population growth, the Municipality could expect to plan for cumulatively 275,000 sf of new retail space by 2027.
• The Municipality’s current retail inventory is highlighted by low vacancy and a strong provision of conveniences and personal services.
• The majority of future retail opportunities will gravitate to the Elmsdale/Hwy 2 area.
• Attention should be paid to existing Village Cores to ensure they are not impacted by new retail growth. A focus on pedestrian-realm and streetscape improvements should be undertaken, particularly in the Village Core areas of Elmsdale and Enfield.
• East Hants’ Retail Trade Area is forecast to conservatively approach 30,000 residents by the year 2027.
• Demographic and demand forecasts in this Retail Market Analysis are based on conservative estimates with limited interventions by way of economic-development or developer-driven initiatives at the provincial or municipal level.
• Trade Area demographics portray a market that has the potential to attract young families entering their higher income years.
• East Hants’ current Retail Trade Area spending potential is estimated at $293 million and is forecast to surpass $352 million by 2027.
• Elmsdale is poised to become a major retail centrality along the Hwy 102 corridor over the next decade and beyond.
• Though currently set between 2 existing trade areas (Truro and Halifax, Dartmouth and Lower Sackville), Elmsdale will soon be its own self-sufficient trade area for not just conveniences, but a more diverse retail merchandise offering.

Retail Market Analysis - Municipality of East Hants, Nova Scotia | 54
6.2 POTENTIAL TENANT PROSPECTSOn the basis of the retail demand and in recognition of how the market is likely to grow over the period 2017 to 2022 to 2027, Table 6.1 provides a list of tenants that are identified as compatible with the trade area spending and demographic profile.
Some retailers may represent the low-hanging fruit and be near term targets, while others may be targets for 2022 or 2027.
The only certain thing about retail is its uncertainty and thus retail is constantly changing and evolving with new brands or even modified expansion strategies. For example, the recent announcement of Cabelas closing after only 3 years in Moncton represents a shift in their corporate policy under new global ownership (Bass Pro Shops). Therefore, any tenants identified in the following are subject to change and should be further vetted with their tenant representatives, development leasing or brokerage community.
The following retailers are shown to represent either a near term (2017 to 2022) or longer term (2022 to 2027) prospect opportunity.
From this list it can be seen that the near term prospects will likely continue to be in the convenience or casual food & beverage segments or for a single general merchandiser.
Those tenants that require a larger market penetration and sizable trade area in excess of 30,000 largely represent the comparison or Department Store Type Merchandise (DSTM) type categories or upper casual restaurant establishments.
6

| Key Planning Strategies & Cushing Terrell Architecture Inc.55
Retailer Merchandise Category SegmentTime Horizon
Near Term2017 to 2022
Time HorizonLong Term
2022 to 2027
Alia n Tanjay Clothing & Accessories ✓
Ardene Clothing & Accessories ✓
Marks Work Wearhouse Clothing & Accessories ✓
Ricki's/Cleo's Clothing & Accessories ✓
Winners Clothing & Accessories ✓
Marshall's Clothing & Accessories ✓
Children's Place Clothing & Accessories ✓
Old Navy Clothing & Accessories ✓
Jack Astor's F&B Restaurant - Fast Casual ✓
Guy Frenchy's F&B Restaurant - Fast Casual ✓
Cora's F&B Restaurant - Fast Casual ✓
Five Guys Burger & Fries F&B Restaurant - Fast Casual ✓
Boston Pizza F&B Restaurant - Full Service ✓
East Side Marios F&B Restaurant - Full Service ✓
Moxie's Classic Grill F&B Restaurant - Full Service ✓
Swiss Chalet F&B Restaurant - Full Service ✓
Montana's BBQ & Bar F&B Restaurant - Full Service ✓
Smitty's F&B Restaurant - Full Service ✓
Starbucks F&B Restaurant - Quick Service ✓
Second Cup F&B Restaurant - Quick Service ✓
Dairy Queen F&B Restaurant - Quick Service ✓
Burger King F&B Restaurant - Quick Service ✓
Opa F&B Restaurant - Quick Service ✓
Mucho Burrito F&B Restaurant - Quick Service ✓
Shopper's Drug Mart General Merchandise ✓
Great Canadian Dollar General Merchandise ✓
Dollar Tree General Merchandise ✓
Wal-Mart General Merchandise ✓
Giant Tiger General Merchandise ✓
Value Village General Merchandise ✓
M&M Meat Shops Grocery & Specialty Foods ✓
Bouclair Home Furnishings & Décor ✓
Home Outfitters Home Furnishings & Décor ✓
Paderno Home Furnishings & Décor ✓
Bed Bath & Beyond Home Furnishings & Décor ✓
Ashley Home Home Furnishings & Décor ✓
Home Sense Home Furnishings & Décor ✓
Structube Home Furnishings & Décor ✓
Sally Beauty Personal Services ✓
Hakim Optical Personal Services ✓
Global Pet Foods Specialty Retail ✓
Bulk Barn Specialty Retail ✓
Michael's Crafts Specialty Retail ✓
Hockey Life Sporting Goods & Recreation ✓
Sport Chek Sporting Goods & Recreation ✓
Mastermind Toys Toys, Games & Hobbies ✓
EB Games Toys, Games & Hobbies ✓
TABLE 6.1EAST HANTS’ POTENTIAL TENANT PROSPECTS

This page left intentionally blank(for double-sided printing)

RETAIL MARKET ANALYSIS
APPENDICES

Retail Market Analysis - Municipality of East Hants, Nova Scotia | 58
Retail Business Name Community General Retail Category Est. Area (SF) NAICS Sector # NAICS Sector Name NAICS Industry
# NAICS Industry Name
Hops n Grapes Wine Making Elmsdale Alcohol & Tobacco 1,000 44-45 Retail Trade 445310 Beer, wine and liquor stores
Chill Stret Beer & Cider Market - Elmsdale Shopping Centre Elmsdale Alcohol & Tobacco 3,000 44-45 Retail Trade 445310 Beer, wine and liquor stores
NSLC (Nova Scotia Liquor Company) Elmsdale Alcohol & Tobacco 7,500 44-45 Retail Trade 445310 Beer, wine and liquor stores
Quality Auto Parts Elmsdale Auto Parts & Accessories 1,000 44-45 Retail Trade 441310 Automotive parts, accessories and tire stores
NAPA Auto Parts Elmsdale Auto Parts & Accessories 1,000 44-45 Retail Trade 441310 Automotive parts, accessories and tire stores
Sangster's Auto Supply Elmsdale Auto Parts & Accessories 1,750 44-45 Retail Trade 441310 Automotive parts, accessories and tire stores
Car Quest Auto Parts - East Hants Industrial Elmsdale Auto Parts & Accessories 4,000 44-45 Retail Trade 441310 Automotive parts, accessories and tire stores
OK Tire - East Hants Industrial Elmsdale Auto Parts & Accessories 4,000 44-45 Retail Trade 441310 Automotive parts, accessories and tire stores
CanMac Watercraft - East Hants Industrial Elmsdale Auto/RV/Motorsports Dealership 3,700 44-45 Retail Trade 441220 Motorcycle, boat and other motor vehicle dealers
Jax in the Box Elmsdale Clothing & Apparel 750 44-45 Retail Trade 448140 Family clothing storesStrides Health & Fitness Centre - Macmillan Centre Elmsdale Entertainment & Leisure 3,000 71 Arts, entertainment & recreation 713940 Fitness and recreational sports centres
Gym Nation - East Hants Industrial Elmsdale Entertainment & Leisure 2,000 71 Arts, entertainment & recreation 713940 Fitness and recreational sports centres
The Barn by Emmett Fitness - East Hants Industrial Elmsdale Entertainment & Leisure 3,000 71 Arts, entertainment & recreation 713940 Fitness and recreational sports centres
Mambel Martial Arts Elmsdale Entertainment & Leisure 1,000 61 Educational Services 611620 Athletic instruction
Dance Zone Performing Arts Centre - East Hants Industrial Elmsdale Entertainment & Leisure 2,000 61 Educational Services 611620 Athletic instruction
PT Health - East Hants Industrial Elmsdale Entertainment & Leisure 2,000 62 Health Care & Social Assistance 621340 Offices of physical, occupational, and speech therapists and audiologists
The Cooperators - Macmillan Centre Elmsdale Finance/Insurance/Real Estate Services 750 52 Finance & Insurance 525210 Insurance agencies and brokerages
RBC - Village Core Elmsdale Finance/Insurance/Real Estate Services 4,000 52 Finance & Insurance 522111 Personal & commercial banking industryScotiabank - Elmsdale Shopping Centre Elmsdale FInance/Insurance/Real Estate Services 5,375 52 Finance & Insurance 522111 Personal & commercial banking industryCredit Union East Coast Elmsdale Finance/Insurance/Real Estate Services 2,500 52 Finance & Insurance 522111 Personal & commercial banking industryH&R Block Elmsdale Finance/Insurance/Real Estate Services 1,000 54 Professional, scientific and technical services 541213 Tax preparation services
Canadian Tire - Elmsdale Shopping Centre Elmsdale General Merchandise 20,193 44-45 Retail Trade 452999 All other miscellaneous general merchandise stores
Shell Select Elmsdale Grocery & Specialty Foods 1,000 44-45 Retail Trade 447110 Gas Stations with convenience stores
Leno's Stop Shop- Village Core Elmsdale Grocery & Specialty Foods 2,000 44-45 Retail Trade 445120 Convenience stores
Circle K & Irving Gas Elmsdale Grocery & Specialty Foods 1,000 44-45 Retail Trade 447110 Gas Stations with convenience stores
Go Convenience / Esso - Elmsdale Shopping Centre Elmsdale Grocery & Specialty Foods 1,200 44-45 Retail Trade 447110 Gas Stations with convenience stores
Sobey's - Elmsdale Shopping Centre Elmsdale Grocery & Specialty Foods 47,390 44-45 Retail Trade 445110 Supermarkets & other grocery (except convenience) stores
Atlantic Superstore Elmsdale Grocery & Specialty Foods 50,000 44-45 Retail Trade 445110 Supermarkets & other grocery (except convenience) stores
Petro Canada & Neighbours Convenience Elmsdale Grocery & Specialty Foods 1,000 44-45 Retail Trade 447110 Gas Stations with convenience stores
Snidey's Computer Elmsdale Home Electronics & Appliances 750 44-45 Retail Trade 443144 Computer and software stores
The Source - Elmsdale Shopping Centre Elmsdale Home Electronics & Appliances 1,881 44-45 Retail Trade 443146 Audio and video recordings stores
Berry's Furniture - East Hants Industrial Elmsdale Home Furnishings & Accessories 23,000 44-45 Retail Trade 442110 Furniture stores
RONA - Elmsdale Shopping Centre Elmsdale Home Improvement & Gardening 24,000 44-45 Retail Trade 444120 Building materials & supplies dealers
The Hearing Specialists - Macmillan Centre Elmsdale NON-RETAIL Streetfront 62 Health Care & Social Assistance 621340 Offices of physical, occupational, and speech therapists and audiologists
Classic Physio Therapy - Macmillan Centre Elmsdale NON-RETAIL Streetfront 62 Health Care & Social Assistance 621340 Offices of physical, occupational, and speech therapists and audiologists
Life Care Sleep Clinic - Macmillan Centre Elmsdale NON-RETAIL Streetfront 62 Health Care & Social Assistance 621340 Offices of physical, occupational, and speech therapists and audiologists
Canna + Care Inc Elmsdale NON-RETAIL Streetfront 1,000 62 Health Care & Social Assistance 621340 Offices of physical, occupational, and speech therapists and audiologists
Elmsdale Design & Print Elmsdale NON-RETAIL Streetfront 2,000 31-33 Manufacturing 323113 Commercial screen printing
Appendix A: Detailed Retail Inventory for Municipality of East Hants

| Key Planning Strategies & Cushing Terrell Architecture Inc. 59
Retail Business Name Community General Retail Category Est. Area (SF) NAICS Sector # NAICS Sector Name NAICS Industry
# NAICS Industry Name
Elsmdale Vision Centre Elmsdale Personal Services 2,500 62 Health Care & Social Assistance 621320 Offices of optometrists
Strides Spa & Wellness Centre - Macmillan Centre Elmsdale Personal Services 81 Other services (except public administration) 812190 Other personal care services
Geri's Hair Design - Macmillan Centre Elmsdale Personal Services 500 81 Other services (except public administration) 812115 Beauty salons
The Old General Barbershop Elmsdale Personal Services 500 81 Other services (except public administration) 812115 Beauty salons
Silver City Tattoos Elmsdale Personal Services 1,000 81 Other services (except public administration) 812190 Other personal care services
Elsmdale Hair Company - Elmsdale Shopping Centre Elmsdale Personal Services 935 81 Other services (except public administration) 812115 Beauty salons
Shears Salon Spa Elmsdale Personal Services 1,148 81 Other services (except public administration) 812115 Beauty salons
Guardian Elmsdale Pharmacy - Elmsdale Shoppping Centre Elmsdale Pharmacy 12,993 44-45 Retail Trade 447110 Gas Stations with convenience stores
Elmsdale Community Chiropractic Elmsdale Professional Services 1,000 62 Health Care & Social Assistance 621310 Offices of chiropractors
Eyes on Elmsdale - Village Core Tolson Centre Building Elmsdale Professional Services 1,000 62 Health Care & Social Assistance 621320 Offices of optometrists
Pro Tx Physio - Village Core Tolson Centre Building Elmsdale Professional Services 3,000 62 Health Care & Social Assistance 621340 Offices of physical, occupational, and speech therapists and audiologists
Elmsdale Dental Clinic- Elmsdale Shopping Centre Elmsdale Professional Services 3,007 62 Health Care & Social Assistance 621210 Offices of dentists
Burchall McDougall Law - Macmillan Centre Elmsdale Professional Services 54 Professional, scientific and technical services 541111 Offices of lawyersLin Garden Restaurant Elmsdale Restaurant F&B 1,500 72 Accommodation & food services 722511 Full-service restaurants
Elmsdale Pizzeria Elmsdale Restaurant F&B 1,000 72 Accommodation & food services 722512 Limited service eating places
Rob Bitar's Ristorante Elmsdale Restaurant F&B 2,000 72 Accommodation & food services 722511 Full-service restaurants
Cup of Soul Café - Village Core Elmsdale Restaurant F&B 1,000 72 Accommodation & food services 722512 Limited service eating places
Pete'za Perfect - Village Core (Moving beside NAPA soon) Elmsdale Restaurant F&B 1,000 72 Accommodation & food services 722512 Limited service eating places
A&W Elmsdale Restaurant F&B 2,500 72 Accommodation & food services 722512 Limited service eating places
McDonalds Elmsdale Restaurant F&B 3,000 72 Accommodation & food services 722512 Limited service eating places
Tim Hortons - Elmsdale Shopping Centre Elmsdale Restaurant F&B 2,650 72 Accommodation & food services 722512 Limited service eating places
Pita Pit- Elmsdale Shopping Centre Elmsdale Restaurant F&B 1,282 72 Accommodation & food services 722512 Limited service eating places
Pizza Delight - Elmsdale Shopping Centre Elmsdale Restaurant F&B 1,814 72 Accommodation & food services 722512 Limited service eating places
Wing Fu Restaurant - Elmsdale Shopping Centre Elmsdale Restaurant F&B 1,564 72 Accommodation & food services 722511 Full-service restaurants
Subway - Elmsdale Shopping Centre Elmsdale Restaurant F&B 1,881 72 Accommodation & food services 722512 Limited service eating places
Vogue Optical - Elmsdale Shopping Centre Elmsdale Specialty Retail 1,586 62 Health Care & Social Assistance 621320 Offices of optometrists
Sweet Spot Chocolate Elmsdale Specialty Retail 750 44-45 Retail Trade
Burgundy Boutique & Gifts - Village Core Elmsdale Specialty Retail 1,000 44-45 Retail Trade 453310 Used merchandise stores
Branching Out - Village Core Elmsdale Specialty Retail 750 44-45 Retail Trade 452999 All other miscellaneous general merchandise stores
Lily Pond - Village Core Elmsdale Specialty Retail 750 44-45 Retail Trade 452999 All other miscellaneous general merchandise stores
Dollarama - Elmsdale Shopping Centre Elmsdale Specialty Retail 10,294 44-45 Retail Trade 452999 All other miscellaneous general merchandise stores
Pet Valu - Elmsdale Shopping Centre Elmsdale Specialty Retail 3,320 44-45 Retail Trade 453910 Pet and pet supplies stores
VACANT Elmsdale VACANT VACANT
VACANT (end cap) Elmsdale VACANT 1,000 VACANT
VACANT (end cap) Elmsdale VACANT 1,000 VACANT
VACANT - Rob Bitar's (other half of building) Elmsdale VACANT 2,000 VACANT
VACANT (beside Burgundy Boutiques & Gifts) - Village Core Elmsdale VACANT 500 VACANT
VACANT - Elmsdale Shopping Centre (beside Pizza Delight) Elmsdale VACANT 1,068 VACANT
Appendix A: Detailed Retail Inventory for Municipality of East Hants

Retail Market Analysis - Municipality of East Hants, Nova Scotia | 60
Retail Business Name Community General Retail Category Est. Area (SF) NAICS Sector # NAICS Sector Name NAICS Industry
# NAICS Industry Name
VACANT - Elmsdale Shopping Centre (beside Subway) Elmsdale VACANT 2,000 VACANT
Steamie's Vape Shop - Parker Place Enfield Alcohol & Tobacco 500 44-45 Retail Trade 453999 All other miscellaneous store retailers (except beer & wine-making supplies)
Tirecraft - Ribahi Cetre Enfield Auto Parts & Accessories 2,500 44-45 Retail Trade 441310 Automotive parts, accessories and tire stores
Shooters Bar & Grill Enfield Drinking Establishments 3,000 72 Accommodation & food services 722410 Drinking places
Curly Portables Pub & Grub Enfield Drinking Establishments 4,500 72 Accommodation & food services 722410 Drinking places
R.S. Dance Works Enfield Entertainment & Leisure 500 61 Educational Services 611620 Athletic instruction
East Hants Childcare Centre - Parker Place Enfield Entertainment & Leisure 1,000 61 Educational Services 611620 Athletic instruction
Munro Insurance - Parker Place Enfield Finance/Insurance/Real Estate Services 750 52 Finance & Insurance 525210 Insurance agencies and brokerages
Irving Big Stop Convenience Store Enfield Grocery & Specialty Foods 2,500 44-45 Retail Trade 447110 Gas Stations with convenience stores
Robins Donuts / Esso Go Store Enfield Grocery & Specialty Foods 750 44-45 Retail Trade 447110 Gas Stations with convenience stores
Enfield Deli & Variety Enfield Grocery & Specialty Foods 750 44-45 Retail Trade 445120 Convenience stores
Avery's Farm Market Enfield Grocery & Specialty Foods 3,000 44-45 Retail Trade 445120 Convenience stores
Home Hardware Enfield Home Improvement & Gardening 7,000 44-45 Retail Trade 444120 Building materials & supplies dealers
East Hants Chamber of Commerce - Parker Place Enfield NON-RETAIL Streetfront 250
United Steelworkers Enfield NON-RETAIL Streetfront 750
Red Seal Welding - Ribahi Centre Enfield NON-RETAIL Streetfront 1,000
Rustblock - Ribahi Centre Enfield NON-RETAIL Streetfront 1,000
Enfield Tailor Shop - Parker Place Enfield Personal Services 500 81 Other services (except public administration) 811490 Other personal and household goods repair and maintenance
Down Home Hair & Design Enfield Personal Services 750 81 Other services (except public administration) 812115 Beauty salons
Enfield Pharmachoice Enfield Pharmacy 1,000 44-45 Retail Trade 447110 Gas Stations with convenience stores
Irving Big Stop Crossings Restaurant Enfield Restaurant F&B 4,000 72 Accommodation & food services 722511 Full-service restaurants
Tim Hortons Enfield Restaurant F&B 2,000 72 Accommodation & food services 722512 Limited service eating places
Burger King Enfield Restaurant F&B 2,000 72 Accommodation & food services 722512 Limited service eating places
Enfield Pizza & Grocery Enfield Restaurant F&B 1,000 72 Accommodation & food services 722512 Limited service eating places
Main Town Pizza Enfield Restaurant F&B 750 72 Accommodation & food services 722512 Limited service eating places
Doggy Styles Pet Grooming & Supplies Enfield Specialty Retail 750 81 Other services (except public administration) 812910 Pet care (except veterinary) services
Timeless & Twist (home business) Enfield Specialty Retail 500 44-45 Retail Trade 453310 Used merchandise stores
Rick's Riches Thrift Store (E.H. Horne School) Enfield Specialty Retail 500 44-45 Retail Trade 453310 Used merchandise stores
Enfield Buy Sell Trade Enfield Specialty Retail 750 44-45 Retail Trade 453310 Used merchandise stores
Crabapple Cottage Enfield Specialty Retail 750 44-45 Retail Trade 453999 All other miscellaneous store retailers (except beer & wine-making supplies)
VACANT - Parker Place Enfield VACANT 500 VACANT
Appendix A: Detailed Retail Inventory for Municipality of East Hants

| Key Planning Strategies & Cushing Terrell Architecture Inc. 61
Retail Business Name Community General Retail Category Est. Area (SF) NAICS Sector # NAICS Sector Name NAICS Industry
# NAICS Industry Name
VACANT - Ribahi Centre Enfield VACANT 1,000 VACANT
Snappers Bar & Grill Kennetcook Drinking Establishments 2,500 72 Accommodation & food services 722410 Drinking places
Victory Credit Union Kennetcook Finance/Insurance/Real Estate Services 3,500 52 Finance & Insurance 522111 Personal & commercial banking industryFreshmart Grocery Kennetcook Grocery & Specialty Foods 10,000 44-45 Retail Trade 445110 Supermarkets & other grocery (except convenience) stores
Home Hardware Kennetcook Home Improvement & Gardening 10,000 44-45 Retail Trade 444120 Building materials & supplies dealers
Kennetcook Pharmacy Kennetcook Pharmacy 3,000 44-45 Retail Trade 447110 Gas Stations with convenience stores
Robbins Donuts Kennetcook Restaurant F&B 1,500 72 Accommodation & food services 722512 Limited service eating places
Summertime Treats Kennetcook Restaurant F&B 1,500 72 Accommodation & food services 722512 Limited service eating places
Kenetcook Café & Grill Kennetcook Restaurant F&B 1,500 72 Accommodation & food services 722511 Full-service restaurants
Pics n Flics Gift Shop Kennetcook Specialty Retail 1,000 44-45 Retail Trade 453999 All other miscellaneous store retailers (except beer & wine-making supplies)
Leo's Supermarket Lantz Grocery & Specialty Foods 1,500 44-45 Retail Trade 445120 Convenience stores
Roxie's Café Lantz Restaurant F&B 300 72 Accommodation & food services 722512 Limited service eating places
Daddy Green's Pizza Lantz Restaurant F&B 750 72 Accommodation & food services 722512 Limited service eating places
Igloo Sports Lantz Sporting Goods & Outdoor Recreation 300 44-45 Retail Trade 451119 All other sporting goods stores
Hnatiuk's Hunting & Fishing Lantz Sporting Goods & Outdoor Recreation 2,000 44-45 Retail Trade 451119 All other sporting goods stores
Foodland Milford Grocery & Specialty Foods 9,000 44-45 Retail Trade 445110 Supermarkets & other grocery (except convenience) stores
Go Convenience / Tim's Milford Grocery & Specialty Foods 1,750 44-45 Retail Trade 447110 Gas Stations with convenience stores
COOP Country Store Milford Home Improvement & Gardening 5,000 44-45 Retail Trade 444120 Building materials & supplies dealers
Emmy Lou's Pizza & Variety Milford Restaurant F&B 750 72 Accommodation & food services 722512 Limited service eating places
Thrift Shop Milford Specialty Retail 2,000 44-45 Retail Trade 453310 Used merchandise stores
Mt Uniacke Pub & Eatery Mt Uniacke Drinking Establishments 2,000 72 Accommodation & food services 722410 Drinking places
Go Convenience / Tim's /Esso Mt Uniacke Grocery & Specialty Foods 2,000 44-45 Retail Trade 447110 Gas Stations with convenience stores
Circle K Mt Uniacke Grocery & Specialty Foods 1,000 44-45 Retail Trade 447110 Gas Stations with convenience stores
Withrow's Farm Centre Mt Uniacke Home Improvement & Gardening 2,000 44-45 Retail Trade 444220 Nursery stores and garden centres
Hair Shed (new multi-tenant CRU) Mt Uniacke Personal Services 500 81 Other services (except public administration) 812115 Beauty salons
Salon Seven Mt Uniacke Personal Services 750 81 Other services (except public administration) 812115 Beauty salons
Guardian Pharmacy Mt Uniacke Pharmacy 500 44-45 Retail Trade 447110 Gas Stations with convenience stores
Uniqcke Pizza & Family Restaurant Mt Uniacke Restaurant F&B 2,000 72 Accommodation & food services 722511 Full-service restaurants
Pizza Delic Mt Uniacke Restaurant F&B 750 72 Accommodation & food services 722512 Limited service eating places
Eddy's Variety Mt Uniacke Specialty Retail 750 44-45 Retail Trade 452999 All other miscellaneous general merchandise stores
VACANT (unit 3 at multi-teant CRU) Mt Uniacke VACANT 1,000 VACANT
VACANT (at multi-tenant CRU) Mt Uniacke VACANT 500 VACANT
RBC Shubenacadie Finance/Insurance/Real Estate Services 4,000 52 Finance & Insurance 522111 Personal & commercial banking industryGolden Star Groceries Convenience Shubenacadie Grocery & Specialty Foods 1,200 44-45 Retail Trade 445120 Convenience stores
Ettingers Home Hardware Shubenacadie Home Improvement & Gardening 8,000 44-45 Retail Trade 444120 Building materials & supplies dealers
Just Like Home Daycare Shubenacadie NON-RETAIL Streetfront 2,000 62 Health Care & Social Assistance 624410 Child day-care services
Shubie Laundromat Shubenacadie Personal Services 500 81 Other services (except public administration) 812310 Drycleaning & laundry servicesBarber Shop Shubenacadie Personal Services 500 81 Other services (except public administration) 812115 Beauty salons
Guardian Pharmacy Shubenacadie Pharmacy 5,000 44-45 Retail Trade 447110 Gas Stations with convenience stores
JAS Diner Shubenacadie Restaurant F&B 1,000 72 Accommodation & food services 722511 Full-service restaurants
Shubie Pizza Shubenacadie Restaurant F&B 500 72 Accommodation & food services 722512 Limited service eating places
Papa K's Pizza Shubenacadie Restaurant F&B 500 72 Accommodation & food services 722512 Limited service eating places
Regained Relics Antiques Shubenacadie Specialty Retail 750 44-45 Retail Trade 453310 Used merchandise stores
Tin Shop Museum & Toys Shubenacadie Specialty Retail 750 44-45 Retail Trade 451120 Hobby, toy and game stores
Martin's Rite Stop Shubenacadie Specialty Retail 100 44-45 Retail Trade 445120 Convenience stores
VACANT - former Deal Zone Shubenacadie VACANT 750 VACANT
VACANT - former Health & Beauty Shubenacadie VACANT 750 VACANT
VACANT - former Shubenecadie Trading Post Shubenacadie VACANT 3,000 VACANT
Appendix A: Detailed Retail Inventory for Municipality of East Hants

Suite 216, 9525 201 Street | Langley, B.C. Canada | V1M 2M3 | 604.888.6680 p | www.CushingTerrell.com
RETAILMarket Analysis


![The Jewish Legion at Fort Edward, Nova Scotia - rusi-ns.ca · [Army Museum, Halifax Citadel] Major W.F.D. Bremner. Joseph Bernbaum, Toronto Harry Brookman, Winnipeg ... The Hants](https://static.fdocuments.us/doc/165x107/5b1ac5a77f8b9a19258e199f/the-jewish-legion-at-fort-edward-nova-scotia-rusi-nsca-army-museum-halifax.jpg)


