East African Journal of Science and Technology, 2013, 2(2 ...eajournal.unilak.ac.rw/Vol 2...
27
East African Journal of Science and Technology, 2013, 2(2):97-123 www.eajst.inilak.ac.rw 97 www.eajst.inilak.ac.rw ISSN 2227-1902 (Online version) [email protected] Application of SWAT model to assess erosion hotspot for sub-catchment management at Mai-Negus catchment in northern Ethiopia Gebreyesus Brhane Tesfahunegn a, b,* , Paul L.G. Vlek a , Lulseged Tamene c a Center for Development Research (ZEF), University of Bonn, Walter-Flex-Str. 3, 53113 Bonn, Germany b Aksum University, College of Agriculture, P.O. Box 287, Aksum, Ethiopia, Tel: +251 (0)34 7753549; Fax: +251(0) 34775 1931 c International Center for Tropical Agriculture (CIAT), Chitedze Agricultural Research Station, P.O. Box 158, Lilongwe, Malawi *Corresponding author. E-mail: [email protected] Abstract Estimation of soil erosion and other hydrological components is often difficult due to the complex interplay of many factors at catchment-scale. Despite this fact, studies aimed at identifying and prioritized erosion hotspots in northern Ethiopia are based on qualitative or empirical models or runoff plots. Modeling soil erosion using physical models provides an alternative tool for investigating soil erosion, but such models are rarely applied in Ethiopia for many reasons. This study aimed at: (1) apply the Soil and Water Assessment Tool (SWAT) model to identify and prioritize hotspot soil degradation sub-catchments on the basis of estimated runoff, sediment yield and nutrient losses in the Mai-Negus catchment, northern Ethiopia, and (2) suggest suitable land management options that can help tackle the observed problem. Results from the SWAT model reveals that over 45% of the catchment is affected by high (30-50 t ha -1 y -1 ) and very high (> 50 t ha -1 y -1 ) soil erosion rates. These high soil erosion areas can be considered critical hotspot sub- catchments that require intervention priorities. This study also identified and ranked six sub-catchments that require appropriate management interventions due to excessive runoff, sediment and soil nutrients losses. Such prioritization of erosion hotspot areas can be helpful for efficient planning and implementation of anti- erosion measures, especially for local government and other stakeholders in the study catchment. However, it is recognized that a wider validation effort is needed before adopting the model for operational purpose throughout northern Ethiopia due to its diverse environment. Keywords: Runoff, sediment yield, soil erosion rate, soil nutrient, SWAT model 1. Introduction Soil erosion is one of the most serious land degradation problems all over the world. At the global scale, soil erosion is the dominant agent of soil degradation (Scherr, 1999; Lal, 2001; Morgan, 2005), accounting for between 70 and 90 percent of total soil degradation (Lal, 2001; Zoebisch and DePauw, 2002). Total land area affected by soil
Transcript of East African Journal of Science and Technology, 2013, 2(2 ...eajournal.unilak.ac.rw/Vol 2...
East African Journal of Science and Technology, 2013, 2(2):97-123 www.eajst.inilak.ac.rw
97 www.eajst.inilak.ac.rw ISSN 2227-1902 (Online version) [email protected]
Application of SWAT model to assess erosion hotspot for sub-catchment management at Mai-Negus
catchment in northern Ethiopia
Gebreyesus Brhane Tesfahunegna, b,*, Paul L.G. Vlek a, Lulseged Tamenec
a Center for Development Research (ZEF), University of Bonn, Walter-Flex-Str. 3,
53113 Bonn, GermanybAksum University, College of Agriculture, P.O. Box 287, Aksum, Ethiopia,
Tel: +251 (0)34 7753549; Fax: +251(0) 34775 1931c International Center for Tropical Agriculture (CIAT), Chitedze Agricultural Research
Station, P.O. Box 158, Lilongwe, Malawi
*Corresponding author. E-mail: [email protected]
Abstract
Estimation of soil erosion and other hydrological components is often difficult due to the complex interplay
of many factors at catchment-scale. Despite this fact, studies aimed at identifying and prioritized erosion
hotspots in northern Ethiopia are based on qualitative or empirical models or runoff plots. Modeling soil
erosion using physical models provides an alternative tool for investigating soil erosion, but such models are
rarely applied in Ethiopia for many reasons. This study aimed at: (1) apply the Soil and Water Assessment
Tool (SWAT) model to identify and prioritize hotspot soil degradation sub-catchments on the basis of
estimated runoff, sediment yield and nutrient losses in the Mai-Negus catchment, northern Ethiopia, and (2)
suggest suitable land management options that can help tackle the observed problem. Results from the
SWAT model reveals that over 45% of the catchment is affected by high (30-50 t ha-1 y-1) and very high (>
50 t ha-1 y-1) soil erosion rates. These high soil erosion areas can be considered critical hotspot sub-
catchments that require intervention priorities. This study also identified and ranked six sub-catchments that
require appropriate management interventions due to excessive runoff, sediment and soil nutrients losses.
Such prioritization of erosion hotspot areas can be helpful for efficient planning and implementation of anti-
erosion measures, especially for local government and other stakeholders in the study catchment. However, it
is recognized that a wider validation effort is needed before adopting the model for operational purpose
throughout northern Ethiopia due to its diverse environment.
Keywords: Runoff, sediment yield, soil erosion rate, soil nutrient, SWAT model
1. Introduction
Soil erosion is one of the most serious land
degradation problems all over the world. At the
global scale, soil erosion is the dominant agent of
soil degradation (Scherr, 1999; Lal, 2001; Morgan,
2005), accounting for between 70 and 90 percent
of total soil degradation (Lal, 2001; Zoebisch and
DePauw, 2002). Total land area affected by soil
East African Journal of Science and Technology, 2013, 2(2):97-123 www.eajst.inilak.ac.rw
98 www.eajst.inilak.ac.rw ISSN 2227-1902 (Online version) [email protected]
erosion all over the world is 1,094 Mha of which
43% suffer from deforestation and the removal of
natural vegetation, 29% from overgrazing, 24%
from improper management of the agricultural
land and 4% from over-exploitation of natural
vegetation (Walling and Fang, 2003). Erosion has
long-term impacts on soil quality, agricultural
productivity, movement of pollutants and
ecological degradation. Erosion reduces not only
topsoil but also organic matter, nutrient and
available soil moisture (Lal, 1999). Moreover,
sedimentation due to erosion reduces the capacity
of reservoirs and drainage ditches and also leads to
the risk of flooding and blocking irrigation canals
which are frequently noted in the Ethiopia
highlands (Oldeman, 1994; Tamene, 2005).
Dejene (1990) and Admassie (1995) argued that
there is nowhere in the world where erosion is
destructive to the environment compared to the
highlands in northern Ethiopia.
The adverse influences of widespread soil
erosion on soil degradation have long been
recognized as severe problem for development to
be sustained (Lal, 1998). However, estimation of
soil erosion is often difficult due to the complex
interplay of many factors such as climate, land
cover, soil, topography, lithology and human
activities. In addition to social, economic, and
political factors, study scales and methodological
components also influence the estimated soil
erosion rate (Ananda and Herath, 2003). Reports
on soil quality (SQ) degradation are generalized
for the whole country though derived from sources
with different environmental settings, and have
limitations in scope. It is problematic to
extrapolate results from such case studies to other
areas, and the resulting reports are inadequate to
guide policy action. In support of the above facts,
previous studies in Tigray region, northern
Ethiopia indicate that the rate of soil erosion varies
from 7 t ha-1 y-1 (Nyssen, 2001) to more than 24 t
ha-1 y-1 (Tamene, 2005) and 80 t ha-1 y-1 (Tekeste
and Paul, 1989). Erosion rates are also estimated
at 130 t ha-1 y-1 from cropland but 35 t ha-1 y-1
averaged across all the land use types in the
highlands of Ethiopia (FAO, 1986). The
discrepancies in the results of the above studies
are mainly caused by the differences in
methodology and their respective scale of analysis.
Some of the soil loss estimates are derived from
empirical models or erosion plots while others
employed reservoir surveys (e.g., Haregeweyn et
al., 2006; Tamene et at., 2006).
Predominantly, past erosion estimates and
extrapolation in Ethiopia are mainly based on
runoff plot studies (Hurni, 1985; 1993; Nyssen,
2001). Although runoff plots provide good
experimental insight into the relationships between
soil loss and nutrient losses under different cover,
soils and slopes, results cannot be extrapolated to
represent an entire catchment (Haregeweyn et al.,
2006; Tamene et at., 2006). It also poses many
limitations in terms of cost, representation, and
reliability of the resulting data (Lal, 1998).

East African Journal of Science and Technology, 2013, 2(2):97-123 www.eajst.inilak.ac.rw
99 www.eajst.inilak.ac.rw ISSN 2227-1902 (Online version) [email protected]
Modeling soil erosion using distributed physical
models thus provides a sophisticated alternative
tool for investigating the processes and
mechanisms governing soil erosion at catchment
or larger scales (Boggs et al., 2001).
To estimate soil erosion and develop optimal
soil erosion management plans, many erosion
models such as Universal Soil Loss Equation
(USLE) (Wischmeier and Smith, 1978), Water
Erosion Prediction Project (WEPP) (Flanagan and
Nearing, 1995), Soil and Water Assessment Tool
(SWAT) (Arnold et al., 1998), European Soil
Erosion Model (EUROSEM) (Morgan et al.,
1998), and AnnAGNPS (Bingner and Theurer,
2001) have been developed and used over many
years. Among these models, the USLE has
remained the most practical method of estimating
soil erosion potential and to estimate the effects of
different erosion factors on soil erosion. USLE has
been used for more than 40 years (Dennis and
Rorke, 1999; Kinnell, 2000) whereas other
process-based erosion models developed afterward
have limitations in applicability due to intensive
data and computation requirements (Lim et al.,
2005). However, studies using the USLE do not
consider the sediment delivery ratio to estimate the
sediment delivered to the downstream point of
interest (Lim et al., 2005). As a result, more recent
physical-models for soil erosion estimation have
been developed that consider the sediment
delivery process.
The application of these models is not
always an easy task since they require large
amounts of information which often is not
available. However, models are the only current
tools that enable an approximate quantification of
soil erosion processes, facilitating the recognition
of high-risk areas and consequently the
development of efficient planning to prevent soil
degradation at catchment scale (Santhi et al.,
2001) though such models are rarely applied in
Ethiopia for reasons such as their intensive data
requirements which are not available for most
sites, and most models are not user friendly for
operation. In this study, following a literature
review of different types of erosion models, the
physical-based Soil and Water Analysis Tool
(SWAT) model was selected to be applied in a
northern Ethiopian catchment to assess soil quality
(SQ) degradation management. The SWAT model
is based on extensive modelling experience and
also incorporates the features of several other
models (Neitsch et al., 2005). Identification of
erosion-prone areas using a distributed physical
model that estimates soil erosion rates with
sufficient accuracy will have great importance for
implementing appropriate erosion control
practices (Shi et al., 2004).
While the study area lacks some of the data
needed for most physically distributed models, it
is possible to accommodate the requirements of
SWAT by integrating field and literature survey.
Despite this fact, limited information is available

East African Journal of Science and Technology, 2013, 2(2):97-123 www.eajst.inilak.ac.rw
100 www.eajst.inilak.ac.rw ISSN 2227-1902 (Online version) [email protected]
in Ethiopia that shows the application of SWAT
model for catchment-scale management planning
(e.g., Tesfahunegn et al., 2012) and for sub-
catchment planning (e.g., Chekol, 2006; Ashagre,
2006; Setegn et al., 2009). The objectives of this
study are to (1) apply the SWAT model in the
identification and prioritization of hotspot soil-
degradation sub-catchments on the basis of
estimated runoff, sediment yield and nutrient
losses in the Mai-Negus catchment, northern
Ethiopia, and (2) suggest suitable land
management options for alleviating soil
degradation problems.
2. Materials and methods
2.1. Study area
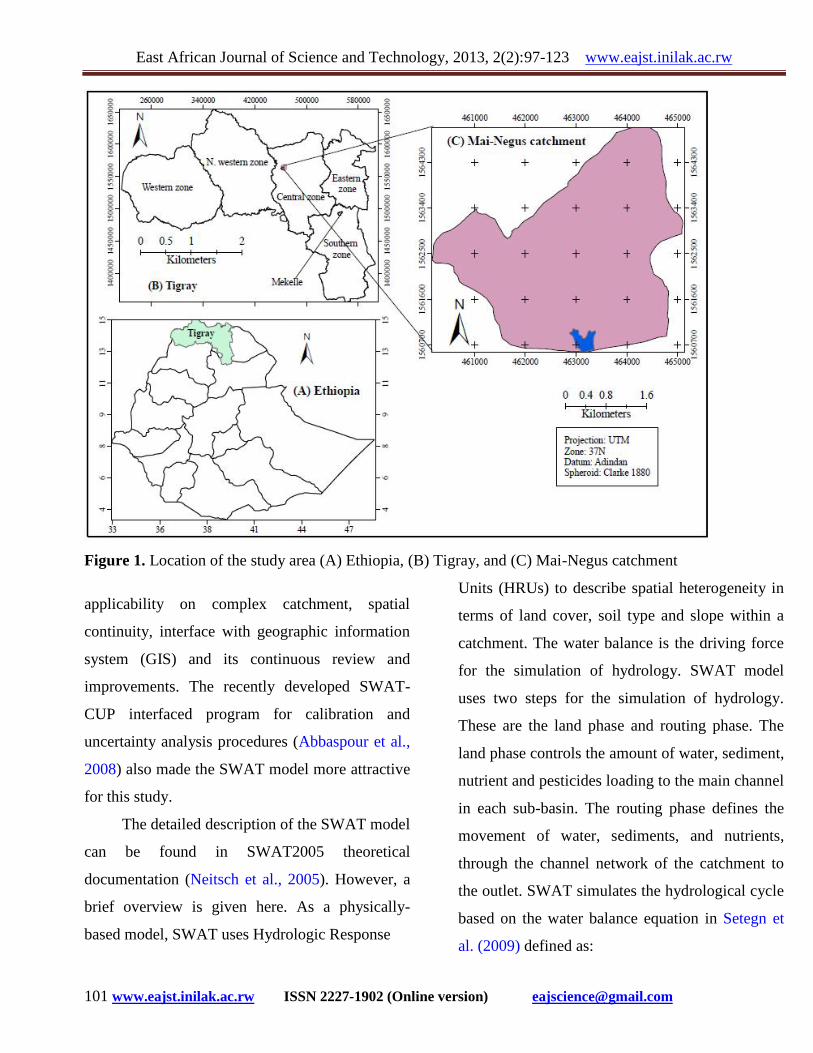
This study was conducted in the Mai-Negus
catchment in Tigray region, northern Ethiopia
(Figure 1). The study catchment is located in
Central Zone of Tigray at 245 Km west of
Mekelle, the capital of Tigray region. The
catchment area is about 1240 ha. Altitude varies
over the range of 2060 to 2650 m above sea level.
The catchment is part of the northern highlands of
Ethiopia comprising of high and low mountains,
hilly-lands, and Valleys. The study catchment has
a mean annual temperature of 22ºC and
precipitation of 700 mm, with distinct rainy season
from July-September. The dominant soil type
within the catchment is Cambisols (FAO soil
group). Soils in the mountains, hilly-land and
piedmont areas are generally shallow and are
normally deep in the valleys. The farming system
is principally crop oriented with supplement from
livestock. Natural vegetation has been almost
cleared due to deforestation. Forest covers small
area in the catchment and classified as deciduous
and dry forest with medium and small trees
including bushes, and some scattered trees
showing evidence of former natural forest. Trees
such as Eucalyptus globulus and acacia species
have been planted on protected areas. Apart from
forest, other land use types include rainfed annual
crops (Zea mays, Eragrostis tef, pulses /e.g., Vicia
faba, etc.). However, Eragrostis tef covered larger
(> 80%) proportion of the cultivated land in the
study catchment.
2.2. SWAT model description
The Soil and Water Assessment Tool (SWAT) is a
river-basin scale, continuous time and spatially
distributed physically based model developed by
United States Department of Agriculture (USDA)
to predict the impact of land management
practices on water, sediment and agricultural
chemical yields in complex catchments with
varying soils, land use and management conditions
over long periods of time (Arnold et al., 1998;
Neitsch et al., 2005; Setegn et al., 2009). In this
study, the ArcSWAT 2009 version of the SWAT
model was applied to predict runoff,
sediment/nutrient yield. The model was selected
after hydrological models were reviewed using
predefined criteria like meeting the objectives of
the study, data availability (DEM, land use-cover,
soil, weather), model sensitivity and uncertainty,
East African Journal of Science and Technology, 2013, 2(2):97-123 www.eajst.inilak.ac.rw
101 www.eajst.inilak.ac.rw ISSN 2227-1902 (Online version) [email protected]
Figure 1. Location of the study area (A) Ethiopia, (B) Tigray, and (C) Mai-Negus catchment
applicability on complex catchment, spatial
continuity, interface with geographic information
system (GIS) and its continuous review and
improvements. The recently developed SWAT-
CUP interfaced program for calibration and
uncertainty analysis procedures (Abbaspour et al.,
2008) also made the SWAT model more attractive
for this study.
The detailed description of the SWAT model
can be found in SWAT2005 theoretical
documentation (Neitsch et al., 2005). However, a
brief overview is given here. As a physically-
based model, SWAT uses Hydrologic Response
Units (HRUs) to describe spatial heterogeneity in
terms of land cover, soil type and slope within a
catchment. The water balance is the driving force
for the simulation of hydrology. SWAT model
uses two steps for the simulation of hydrology.
These are the land phase and routing phase. The
land phase controls the amount of water, sediment,
nutrient and pesticides loading to the main channel
in each sub-basin. The routing phase defines the
movement of water, sediments, and nutrients,
through the channel network of the catchment to
the outlet. SWAT simulates the hydrological cycle
based on the water balance equation in Setegn et
al. (2009) defined as:
East African Journal of Science and Technology, 2013, 2(2):97-123 www.eajst.inilak.ac.rw
102 www.eajst.inilak.ac.rw ISSN 2227-1902 (Online version) [email protected]
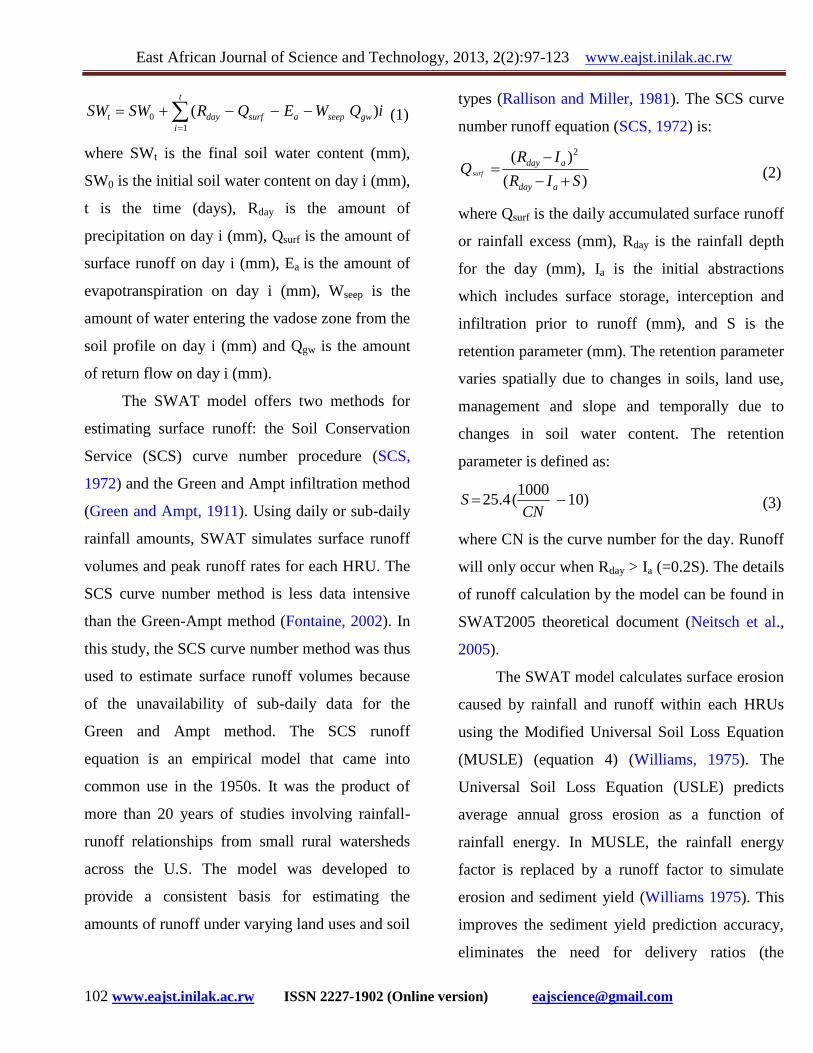
t
igwseepasurfdayt iQWEQRSWSW
10 )( (1)
where SWt is the final soil water content (mm),
SW0 is the initial soil water content on day i (mm),
t is the time (days), Rday is the amount of
precipitation on day i (mm), Qsurf is the amount of
surface runoff on day i (mm), Ea is the amount of
evapotranspiration on day i (mm), Wseep is the
amount of water entering the vadose zone from the
soil profile on day i (mm) and Qgw is the amount
of return flow on day i (mm).
The SWAT model offers two methods for
estimating surface runoff: the Soil Conservation
Service (SCS) curve number procedure (SCS,
1972) and the Green and Ampt infiltration method
(Green and Ampt, 1911). Using daily or sub-daily
rainfall amounts, SWAT simulates surface runoff
volumes and peak runoff rates for each HRU. The
SCS curve number method is less data intensive
than the Green-Ampt method (Fontaine, 2002). In
this study, the SCS curve number method was thus
used to estimate surface runoff volumes because
of the unavailability of sub-daily data for the
Green and Ampt method. The SCS runoff
equation is an empirical model that came into
common use in the 1950s. It was the product of
more than 20 years of studies involving rainfall-
runoff relationships from small rural watersheds
across the U.S. The model was developed to
provide a consistent basis for estimating the
amounts of runoff under varying land uses and soil
types (Rallison and Miller, 1981). The SCS curve
number runoff equation (SCS, 1972) is:
)(
)( 2
SIR
IRQ
aday
adaysurf
(2)
where Qsurf is the daily accumulated surface runoff
or rainfall excess (mm), Rday is the rainfall depth
for the day (mm), Ia is the initial abstractions
which includes surface storage, interception and
infiltration prior to runoff (mm), and S is the
retention parameter (mm). The retention parameter
varies spatially due to changes in soils, land use,
management and slope and temporally due to
changes in soil water content. The retention
parameter is defined as:
)101000
(4.25 CN
S (3)
where CN is the curve number for the day. Runoff
will only occur when Rday > Ia (=0.2S). The details
of runoff calculation by the model can be found in
SWAT2005 theoretical document (Neitsch et al.,
2005).
The SWAT model calculates surface erosion
caused by rainfall and runoff within each HRUs
using the Modified Universal Soil Loss Equation
(MUSLE) (equation 4) (Williams, 1975). The
Universal Soil Loss Equation (USLE) predicts
average annual gross erosion as a function of
rainfall energy. In MUSLE, the rainfall energy
factor is replaced by a runoff factor to simulate
erosion and sediment yield (Williams 1975). This
improves the sediment yield prediction accuracy,
eliminates the need for delivery ratios (the

East African Journal of Science and Technology, 2013, 2(2):97-123 www.eajst.inilak.ac.rw
103 www.eajst.inilak.ac.rw ISSN 2227-1902 (Online version) [email protected]
sediment yield at any point along the channel
divided by the source erosion above that point)
and single storm estimates of sediment yields can
be calculated. Sediment yield prediction is
improved because runoff is a function of
antecedent moisture condition and rainfall energy.
In MUSLE, the crop management factor is
recalculated every day that runoff occurs. It is a
function of above ground biomass, residue on the
soil surface and the minimum C factor for the
plant (Arnold and Williams, 1995).
The modified universal soil loss equation
(Williams, 1995) is:
CFRGUSLELS
USLEPUSLECUSLEKhruareapeakqsurfQSed
.
....56.0
)..(.8.11
(4)
where sed is the sediment yield on a given day
(metric tons), Qsurf is the surface runoff volume
(mm ha-1), qpeak is the peak runoff rate (m3 s-1),
areahru is the area of the HRU (ha), KUSLE is the
USLE soil erodibility factor (metric ton m2 hr (m3-
metric ton cm)-1), CUSLE is the USLE cover and
management factor, PUSLE is the USLE support
practice factor, LSUSLE is the USLE topographic
factor and CFRG is the coarse fragment factor.
The hydrological model component estimates the
runoff volume and peak runoff rate that are in turn
used to calculate the runoff erosive energy
variable. SWAT calculates the peak runoff rate
using a modified rational method. The model also
tracks the movement of nitrogen and phosphorus
soil
nutrients in a catchment through runoff flows and
attached to sediment. The details of the USLE
factors and the descriptions of different model
components, and soil nutrients and sediment
routing simulation modelling by SWAT model can
be found in SWAT theoretical documentation
(Neitsch et al., 2005).
2.3. Model input
GIS input files needed for the SWAT model
include the digital elevation model (DEM), land
use-cover, soils and daily observed weather data.
The weather generator was used to generate
missed weather data.
Digital Elevation Model (DEM):- A 10 m by 10 m
cell size DEM was developed from the
topographic map of scale 1:50,000 of the area.
After DEM was created, pits/sinks were filled
using GIS software before any processing was
undertaken in order to “route” runoff to the
catchment outlet. The DEM was used to delineate
the catchment and analyze the drainage patterns of
the land surface as well as estimate slope
parameters. The clipped DEM for the study
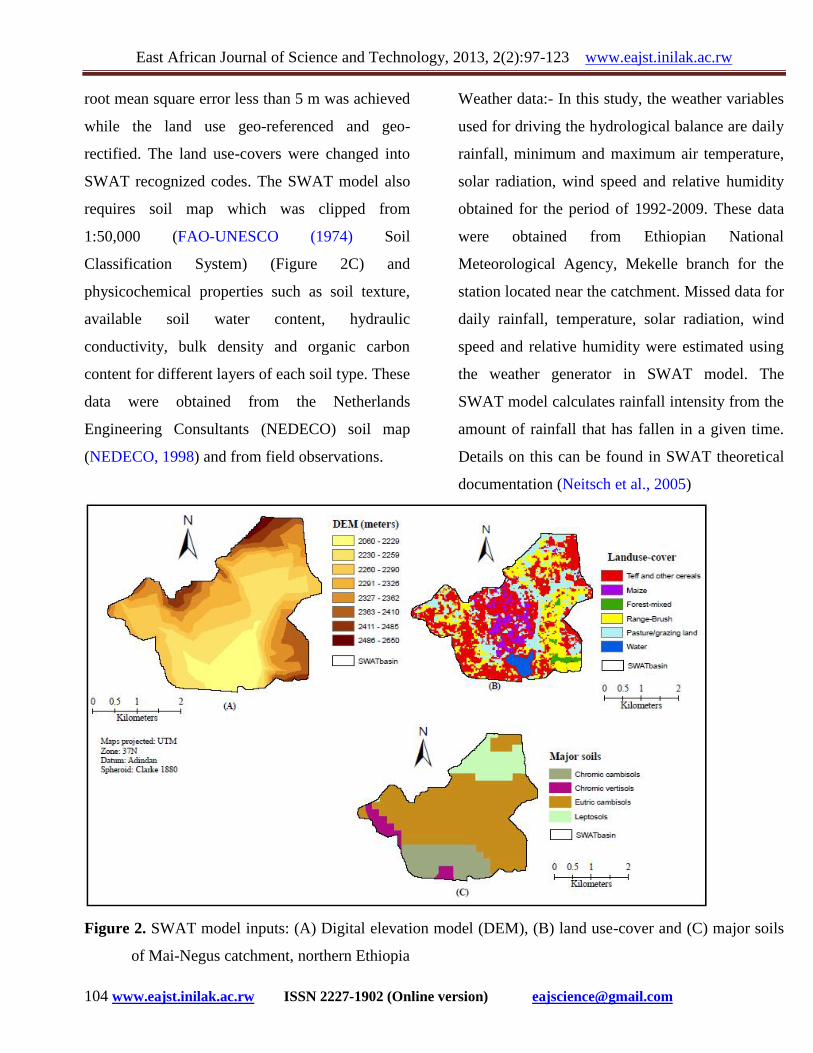
catchment is shown in Figure 2A.
Land use-cover and soil data:- Land use is one of
the most important factors that affect runoff,
evapo-transpiration and surface erosion in a
catchment. SWAT model is capable to split the
land use-cover into different proportions based on
the information from the user. The land use-cover
derived from Landsat image of November 2007
for the study catchment is shown in Figure 2B. A
East African Journal of Science and Technology, 2013, 2(2):97-123 www.eajst.inilak.ac.rw
104 www.eajst.inilak.ac.rw ISSN 2227-1902 (Online version) [email protected]
root mean square error less than 5 m was achieved
while the land use geo-referenced and geo-
rectified. The land use-covers were changed into
SWAT recognized codes. The SWAT model also
requires soil map which was clipped from
1:50,000 (FAO-UNESCO (1974) Soil
Classification System) (Figure 2C) and
physicochemical properties such as soil texture,
available soil water content, hydraulic
conductivity, bulk density and organic carbon
content for different layers of each soil type. These
data were obtained from the Netherlands
Engineering Consultants (NEDECO) soil map
(NEDECO, 1998) and from field observations.
Weather data:- In this study, the weather variables
used for driving the hydrological balance are daily
rainfall, minimum and maximum air temperature,
solar radiation, wind speed and relative humidity
obtained for the period of 1992-2009. These data
were obtained from Ethiopian National
Meteorological Agency, Mekelle branch for the
station located near the catchment. Missed data for
daily rainfall, temperature, solar radiation, wind
speed and relative humidity were estimated using
the weather generator in SWAT model. The
SWAT model calculates rainfall intensity from the
amount of rainfall that has fallen in a given time.
Details on this can be found in SWAT theoretical
documentation (Neitsch et al., 2005)
Figure 2. SWAT model inputs: (A) Digital elevation model (DEM), (B) land use-cover and (C) major soils
of Mai-Negus catchment, northern Ethiopia

East African Journal of Science and Technology, 2013, 2(2):97-123 www.eajst.inilak.ac.rw
105 www.eajst.inilak.ac.rw ISSN 2227-1902 (Online version) [email protected]
2.4. Model setup
The SWAT model system embedded within GIS
integrates the spatial environmental data inputs of
soil, land cover, topography and weather. The
DEM was utilized by ArcSWAT to automatically
delineate the basin (or catchment) into 16 sub-
basins boundaries, calculate sub-basin average
slopes and delineate the stream network. By
overlaying the slope map along with the
reclassified land use and soil datasets, all those
three map inputs were used to determine
hydrologic Response Units (HRUs) combinations
that define the level of spatial detail to include in
the model. The land use, soils and slope threshold
values used in this application were 4%, 4% and
2%, respectively. These were selected in order to
keep the number of HRUs to a reasonable number
of 369. The model calculates unique runoff and
sediment transport to each HRU.
2.5. Model evaluation
In order to utilize any predictive model output that
estimates the effectiveness of the existing
practices and other catchment factors, the model
must be first calibrated to measured data and
should then be tested (without further parameter
adjustment) against an independent set of
measured data (model validation). Model
calibration determines the best or at least a
reasonable parameter set while validation ensures
that the calibrated parameters set performs
reasonably well under an independent data set.
Provided the model predictive capability is
demonstrated as being reasonable in the
calibration and validation phase using model
evaluation statistics, the model can be used with
confidence for prediction of erosion hotspot sub-
catchments for management planning.
To do so, SWAT model was calibrated and
validated at the catchment outlet based on daily,
monthly and yearly basis for flow, whereas
sediment and soil nutrients yields were calibrated
on an annual basis. The constraint to calibrate and
validate sediment and soil nutrients on daily and
monthly basis was that no measured data existed
for the catchment or other similar areas. The
annual data used for calibration and validation of
sediment were determined using the reservoir
sedimentation survey of pit-based approach.
Similarly, soil nutrients were analyzed from the
sediment deposited in the reservoir from the entire
study catchment and similar areas. Such reservoir
survey method is more useful and representative
and seems to be appropriate in terms of cost, speed
and applicability, because measurements of
sediment deposits do not involve generalized
statistical models of sediment erosion and
transport or spatial extrapolation of point and plot
measurements (personal observation; Tamene,
2005). It is also shown that data derived from
simple studies of reservoirs can provide a more
reliable indication of sediment loss and nutrient
export from a catchment than may be obtained
from gauging stations and rating curves (Tamene,
2005; Haregeweyn et al., 2006). Considering the
East African Journal of Science and Technology, 2013, 2(2):97-123 www.eajst.inilak.ac.rw
106 www.eajst.inilak.ac.rw ISSN 2227-1902 (Online version) [email protected]
above advantages, data generated on the basis of
reservoir survey for sediment yield and nutrient
export to the reservoir in the study catchment and
similar catchments were used for model
calibration and validation on an annual basis.
Flow data from 1992 to 2000 were used for
calibration using the 1992 data as 'warm-up'
period for the model. The 2001 to 2009 data was
used for model validation using the 2000 year as
'warm-up' period for the model. The model was
next calibrated for sediment and then for soil
nutrient after flow calibration. Observed sediment
and nutrient data from 2001 to 2004 were used for
sediment and soil nutrient calibration. The period
2001 was used for model 'warm-up' during
calibration. For model validation of sediment and
soil nutrients, the observed data from 2005 to 2009
were used, with the 2005 year as 'warm-up' period
for the model. Generally, SWAT model efficiency
values > 0.50 Nash-Sutcliff coefficient (NSE) and
> 0.60 coefficient of determination (R2) were
found during calibration and validation in the
study catchment, which are considered adequate
for SWAT model applications in management
planning as it captures the variability of simulated
and observed values reasonable well (Santhi et al.,
2001). Considering such model statistics for flow,
sediment and soil nutrient calibration and
validation, SWAT model can then be applied in
identification and prioritization of erosion hotspot
areas for Mai-Negus catchment, northern Ethiopia.
2.6. SWAT model for identification and
prioritization of critical sub-catchments
The evaluated model was applied for identifying
and prioritising critical hot-spots of runoff, soil
and soil nutrient losses in the catchment. The
ranges of erosion rates and their classes suggested
by Tamene (2005) were set as thresholds for
identification of critical soil loss sub-catchments.
The critical sub-catchments were identified on the
basis of average annual sediment and nutrient
losses from the sub-catchments using the
simulated period of 1992-2009. The sub-
catchments were then prioritized for the
implementation of best management practices that
reduce the runoff, sediment yield and nutrient
losses. Priorities were fixed on the basis of rank
assigned to each critical sub-catchment according
to ranges of soil erosion classes described by
Tamene (2005) (Table 1). For nutrient losses a
threshold value of 10 mg l-1 for nitrate nitrogen
and 0.5 mg l-1 for dissolved phosphorous as
described by Environmental Protection Agency
(EPA) were adopted as criterion for identifying the
critical sub-catchments (EPA, 1976).
2.7. Data analysis and interpretation
In this study, descriptive, correlation and
regression analysis were used to analyze SWAT
model outputs (runoff, sediment yield and soil
nutrients losses). In addition, data were interpreted
in relation to standards (soil loss severity classes,
tolerance) for the study catchment condition. GIS
maps in ArcGIS 9.2 were also developed to

East African Journal of Science and Technology, 2013, 2(2):97-123 www.eajst.inilak.ac.rw
107 www.eajst.inilak.ac.rw ISSN 2227-1902 (Online version) [email protected]
Table 1. Classification of soil erosion into different categories based on the soil loss rate
Soil loss range (t ha-1 y-1) Category
0-5 Very low
5-15 Low
15-30 Medium
30-50 High
> 50 Very high
Source: Tamene (2005)
display the magnitude and spatial variability of
model outputs across the sub-catchments in the
Mai-Negus catchment.
3. Results and discussion
3.1. Estimated soil loss and associated soil
nutrient losses at catchment level
The estimated average annual runoff, sediment
yield, total nitrogen and phosphorus for the entire
catchment were 168.0 mm, 34 t ha-1 y-1, 18.1 kg
ha-1 y-1 and 1.1 kg ha-1 y-1, respectively. The
sediment yield estimated by SWAT indicates that
soil loss at catchment level is high and above the
soil loss tolerance level. The proportion of each
soil loss category in the study catchment is
presented in Table 2. The spatial pattern of
simulated rate of sediment yield, runoff and
selected soil nutrient losses for the study
catchment are shown in Figure 3. On the basis of
the erosion categories assigned to the annual
sediment yield, the sediment spatial pattern map
was reclassified into five major categories of soil
erosion hazard zones, namely, very low, low,
medium, high and very high erosion severity
(Table 2; Figure 3A). The estimated soil loss rate
and the spatial patterns are generally reasonable
when compared to what has been observed such as
the presence or absence of A-horizon (horizon
truncation) in the catchment landscapes.
The predicted sediment yield by the SWAT
model has shown that 13.1 and 32.3% of the
catchment area shows high and very high potential
of soil-loss rate, equivalent to average sediment
yield of 30 to 50 and > 50 t ha-1y-1, respectively. It
was estimated that 2% of the catchment
experienced very low erosion rates, whereas 7%
and 46% were categorized as low and medium
rates of soil erosion, respectively. In total, over
45% of the catchment was considered to be
affected by both high and very high soil erosion
rates. The catchment areas accounted for the
highest and lowest runoff losses were 39.5 and
8.3%, respectively (Table 2). Generally, sediment
yield was high in parts of the catchment where
runoff was high. The spatial patterns of the
nutrient losses as total nitrogen (TN) and total
phosphorus (TP) due to runoff and sediment in the
catchment are shown in Figures 3C and 3D.
Despite the fact that our findings were below the

East African Journal of Science and Technology, 2013, 2(2):97-123 www.eajst.inilak.ac.rw
108 www.eajst.inilak.ac.rw ISSN 2227-1902 (Online version) [email protected]
Table 2. Percentage of areas of the study catchment under each erosion categories and the
corresponding runoff ranges in Mai-Negus catchment, northern Ethiopia
Sediment yield aRunoff, mm
Category t ha-1 yr-1 Area (%) Range Area (%)
Very low 0-5 1.70 109-130 8.30
Low 5-15 6.60 130-150 23.1
Medium 15-30 46.3 150-180 11.2
High 30-50 13.1 180-210 18.0
Very high > 50 32.3 210-234 39.5a the sum of surface and base flows
Figure 3. Variability in spatial pattern of annual losses as: sediment yield (A), runoff (B), total nitrogen (TN)
(C) and total phosphorus (TP) (D) in Mai-Negus catchment, northern Ethiopia. The sub-catchments
are coded as 1 to 16

East African Journal of Science and Technology, 2013, 2(2):97-123 www.eajst.inilak.ac.rw
109 www.eajst.inilak.ac.rw ISSN 2227-1902 (Online version) [email protected]
threshold set by EPA (1976), this study indicates
that areas with high runoff are susceptible to high
soil nutrient losses. Such below-threshold losses of
soil nutrients may be attributed to the low soil
nutrient levels in the catchment soils (EPA, 1976).
Field observation indicated that the parts of
the catchment that produce high and very high
sediment yields as indicated by the SWAT model
output are dominated by cultivated land, steep
slope and active gully erosion. Erosion on
cultivated fields planted with small seed cereals
such as tef (Eragrostis tef) in the study catchment
was found to be high due to a high cover factor
(C) value. A comparison of the slopes and the
spatial distribution of soil erosion rates and the
associated soil nutrient losses across the catchment
indicated that areas on the steepest slopes were
more at risk than gentle to flat landscape provided
that they had the same land cover, management
(P) and erodibility factors. Severity of erosion was
also relatively lower in the areas where natural
vegetation cover is high, which agrees with plot
level erosion study that showed annual soil loss
rates in forested areas rarely exceeded 1 t ha-1 y-1
(Hurni, 1985). The C-factor values for Ethiopia
were defined by Hurni (1985) for different cover
types in Ethiopian as Tef = 0.25; cereals/pulses =
0.15, sorghum/maize = 0.10; bush/shrub = 0.02;
dense grass = 0.01; degraded grass = 0.05; dense
forest = 0.001. Based on Hurni (1985) and Eweg
and Lammeren (1996), the important P factor
values adopted comprised plowing up and down =
1.0; plowing on contour = 0.9; strip cultivation =
0.80; terraces = 0.6; protected areas = 0.50; stone
cover (80%) = 0.5; and stone cover (40%) = 0.8.
3.2. Identification and prioritization of critical
hotspot erosion areas using SWAT model
After applying the SWAT model results to assess
the catchments’ erosion severity classes, the model
was also used to identify and prioritize the critical
erosion hotspot sub-catchments. This is because
studies have shown that for many catchments, a
few critical areas are responsible for a
disproportionate amount of sediment yields (Mati
et al., 2000; Tripathi et al., 2003; Tamene, 2005).
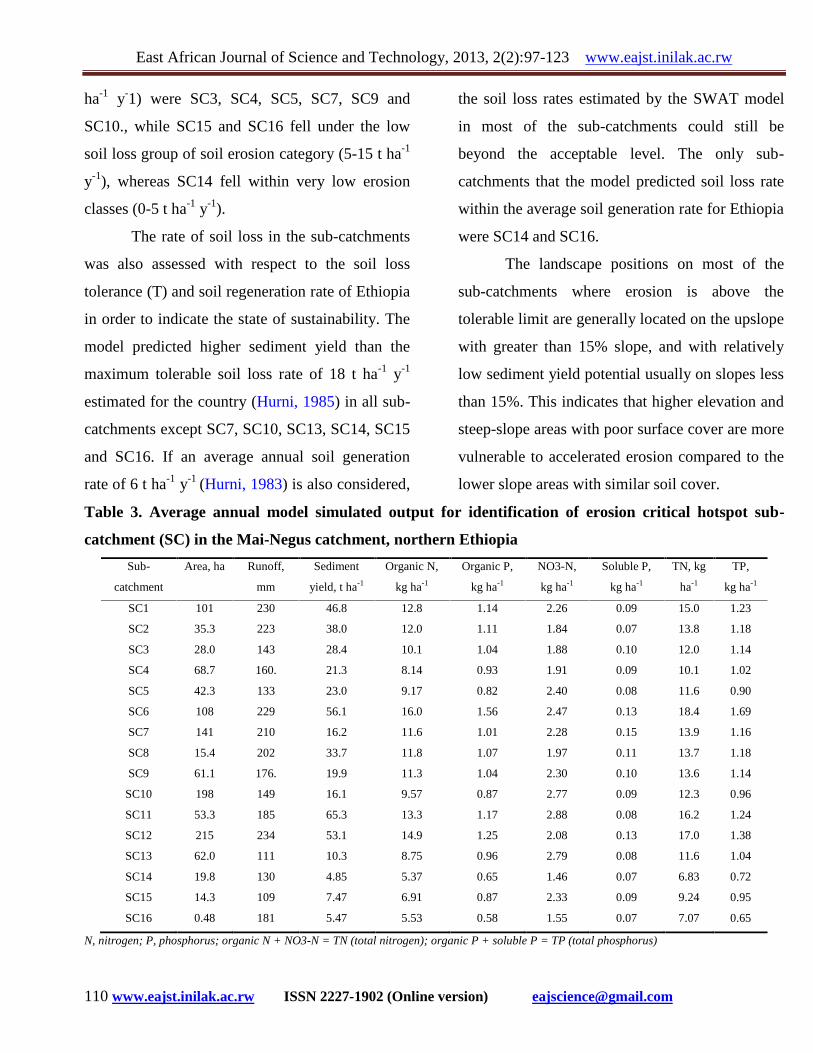
The mean annual runoff, sediment and nutrient
losses simulated for each sub-catchment in Mai-
Negus catchment using SWAT model are
presented in Table 3. According to this study
results, priorities can be fixed to critical hotspot
sub-catchments based on the severity in the rate of
erosion losses while planning anti-erosion
management. In this study, a total of 16 sub-
catchments were delineated by SWAT model
based on the flow pattern and coded as SC1 to
SC16. The erosion spatial pattern map was
reclassified accordingly to the degree of soil loss
categories to show the prioritized sub-catchments
(Figure 3). The results show that 3 out of the 16
sub-catchments, i.e., SC6, SC11 and SC12 fell
under very high soil loss category (> 50 t ha-1 y-1).
The sub-catchments represented as SC1, SC2 and
SC8 fell under the high soil loss category (30-50 t
ha-1 y-1). Medium soil erosion category (15-30 t
East African Journal of Science and Technology, 2013, 2(2):97-123 www.eajst.inilak.ac.rw
110 www.eajst.inilak.ac.rw ISSN 2227-1902 (Online version) [email protected]
ha-1 y-1) were SC3, SC4, SC5, SC7, SC9 and
SC10., while SC15 and SC16 fell under the low
soil loss group of soil erosion category (5-15 t ha-1
y-1), whereas SC14 fell within very low erosion
classes (0-5 t ha-1 y-1).
The rate of soil loss in the sub-catchments
was also assessed with respect to the soil loss
tolerance (T) and soil regeneration rate of Ethiopia
in order to indicate the state of sustainability. The
model predicted higher sediment yield than the
maximum tolerable soil loss rate of 18 t ha-1 y-1
estimated for the country (Hurni, 1985) in all sub-
catchments except SC7, SC10, SC13, SC14, SC15
and SC16. If an average annual soil generation
rate of 6 t ha-1 y-1 (Hurni, 1983) is also considered,
the soil loss rates estimated by the SWAT model
in most of the sub-catchments could still be
beyond the acceptable level. The only sub-
catchments that the model predicted soil loss rate
within the average soil generation rate for Ethiopia
were SC14 and SC16.
The landscape positions on most of the
sub-catchments where erosion is above the
tolerable limit are generally located on the upslope
with greater than 15% slope, and with relatively
low sediment yield potential usually on slopes less
than 15%. This indicates that higher elevation and
steep-slope areas with poor surface cover are more
vulnerable to accelerated erosion compared to the
lower slope areas with similar soil cover.
Table 3. Average annual model simulated output for identification of erosion critical hotspot sub-
catchment (SC) in the Mai-Negus catchment, northern Ethiopia
Sub-
catchment
Area, ha Runoff,
mm
Sediment
yield, t ha-1
Organic N,
kg ha-1
Organic P,
kg ha-1
NO3-N,
kg ha-1
Soluble P,
kg ha-1
TN, kg
ha-1
TP,
kg ha-1
SC1 101 230 46.8 12.8 1.14 2.26 0.09 15.0 1.23
SC2 35.3 223 38.0 12.0 1.11 1.84 0.07 13.8 1.18
SC3 28.0 143 28.4 10.1 1.04 1.88 0.10 12.0 1.14
SC4 68.7 160. 21.3 8.14 0.93 1.91 0.09 10.1 1.02
SC5 42.3 133 23.0 9.17 0.82 2.40 0.08 11.6 0.90
SC6 108 229 56.1 16.0 1.56 2.47 0.13 18.4 1.69
SC7 141 210 16.2 11.6 1.01 2.28 0.15 13.9 1.16
SC8 15.4 202 33.7 11.8 1.07 1.97 0.11 13.7 1.18
SC9 61.1 176. 19.9 11.3 1.04 2.30 0.10 13.6 1.14
SC10 198 149 16.1 9.57 0.87 2.77 0.09 12.3 0.96
SC11 53.3 185 65.3 13.3 1.17 2.88 0.08 16.2 1.24
SC12 215 234 53.1 14.9 1.25 2.08 0.13 17.0 1.38
SC13 62.0 111 10.3 8.75 0.96 2.79 0.08 11.6 1.04
SC14 19.8 130 4.85 5.37 0.65 1.46 0.07 6.83 0.72
SC15 14.3 109 7.47 6.91 0.87 2.33 0.09 9.24 0.95
SC16 0.48 181 5.47 5.53 0.58 1.55 0.07 7.07 0.65
N, nitrogen; P, phosphorus; organic N + NO3-N = TN (total nitrogen); organic P + soluble P = TP (total phosphorus)
East African Journal of Science and Technology, 2013, 2(2):97-123 www.eajst.inilak.ac.rw
111 www.eajst.inilak.ac.rw ISSN 2227-1902 (Online version) [email protected]
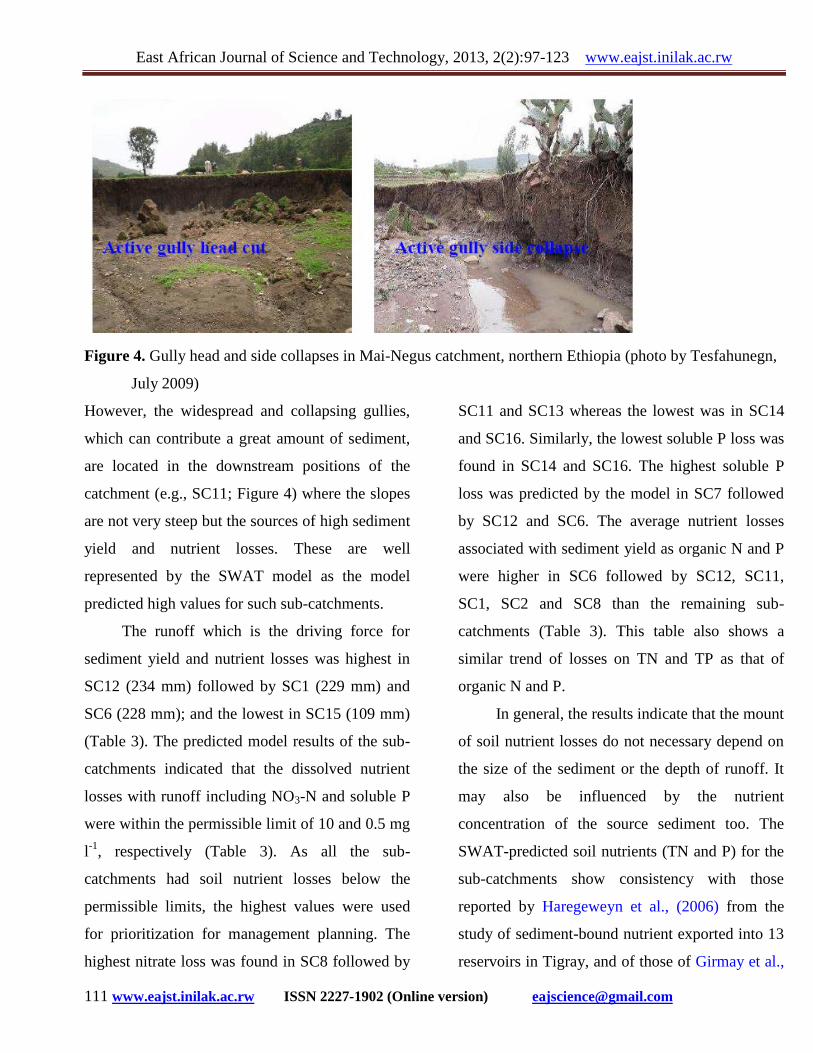
Figure 4. Gully head and side collapses in Mai-Negus catchment, northern Ethiopia (photo by Tesfahunegn,
July 2009)
However, the widespread and collapsing gullies,
which can contribute a great amount of sediment,
are located in the downstream positions of the
catchment (e.g., SC11; Figure 4) where the slopes
are not very steep but the sources of high sediment
yield and nutrient losses. These are well
represented by the SWAT model as the model
predicted high values for such sub-catchments.
The runoff which is the driving force for
sediment yield and nutrient losses was highest in
SC12 (234 mm) followed by SC1 (229 mm) and
SC6 (228 mm); and the lowest in SC15 (109 mm)
(Table 3). The predicted model results of the sub-
catchments indicated that the dissolved nutrient
losses with runoff including NO3-N and soluble P
were within the permissible limit of 10 and 0.5 mg
l-1, respectively (Table 3). As all the sub-
catchments had soil nutrient losses below the
permissible limits, the highest values were used
for prioritization for management planning. The
highest nitrate loss was found in SC8 followed by
SC11 and SC13 whereas the lowest was in SC14
and SC16. Similarly, the lowest soluble P loss was
found in SC14 and SC16. The highest soluble P
loss was predicted by the model in SC7 followed
by SC12 and SC6. The average nutrient losses
associated with sediment yield as organic N and P
were higher in SC6 followed by SC12, SC11,
SC1, SC2 and SC8 than the remaining sub-
catchments (Table 3). This table also shows a
similar trend of losses on TN and TP as that of
organic N and P.
In general, the results indicate that the mount
of soil nutrient losses do not necessary depend on
the size of the sediment or the depth of runoff. It
may also be influenced by the nutrient
concentration of the source sediment too. The
SWAT-predicted soil nutrients (TN and P) for the
sub-catchments show consistency with those
reported by Haregeweyn et al., (2006) from the
study of sediment-bound nutrient exported into 13
reservoirs in Tigray, and of those of Girmay et al.,
East African Journal of Science and Technology, 2013, 2(2):97-123 www.eajst.inilak.ac.rw
112 www.eajst.inilak.ac.rw ISSN 2227-1902 (Online version) [email protected]
(2009) from research at plot level of different land
uses types in the region. However, as reservoirs
are sinks of sediment coming from all parts of the
catchment, reservoir sediment analysis does not
show the contribution of the various upland sub-
catchments. Besides, plot level erosion may not be
representative if extrapolated to larger scale areas.
This study has thus contributed to filling such
study gaps by showing the source areas and the
rate of nutrient losses.
On the basis of annual sediment yield and
nutrient losses, sub-catchments SC1, SC2, SC6,
SC12, SC11, and SC8 were found to be critical
hotspots of soil degradation as they are the sources
of high runoff, sediment and soil nutrients losses.
These sub-catchments were ranked as SC6, SC12,
SC11, SC1, SC2 and SC8 in descending order for
introducing appropriate land use, management and
conservation measures that reduce these losses.
The other sub-catchments to be considered while
designing best management practices in the study
catchment next to the above prioritized areas are
in the order of SC3, SC4, SC5 and SC9. This is
because those sub-catchments show sediment
yields higher than the maximum tolerable soil loss
rate. Such identification and prioritization of
erosion hotspot areas will help the local
government and other stakeholders to successfully
plan and implement appropriate interventions with
the available resources and capital. This study also
confirms the applicability of SWAT model for
decision making processes concerning
management of small catchments using available
data for the northern Ethiopia conditions. The
management options that can be suggested to
reduce soil degradation in the study catchment
conditions include: change in the land use type
(for instance, degraded cultivated and grazing
lands to afforestation) and the integration of
appropriate conservation measures across the steep
terrain.
3.3. Relationship of runoff, sediment yield and
soil nutrients in the sub-catchments
Assessing the relationship among the SWAT
output variables that were used to prioritize the
erosion hotspot sub-catchments for management
planning is crucial in order to target the nutrient
losses due to either runoff or sediment transport,
or their combinations. Even though the hotspot
erosion sub-catchments in the catchment are
presented in section 3.1 and 3.2, further discussion
is merited on the relationship of the soil nutrient
losses with sediment and runoff to get a clear
image of their significant role to soil nutrient
degradation. The correlation, regression and trend
analysis results are presented in Table 4, Figures 5
and 6, respectively, to show the magnitude of the
relationships. Strong positive correlation (P =
0.001, 2-tailed) between sediment yield with
organic nitrogen (ON), TN, organic phosphorus
(OP) and TP at r = 0.88, 0.87, 0.84 and 0.81,
respectively was observed in the sub-catchments.
East African Journal of Science and Technology, 2013, 2(2):97-123 www.eajst.inilak.ac.rw
113 www.eajst.inilak.ac.rw ISSN 2227-1902 (Online version) [email protected]
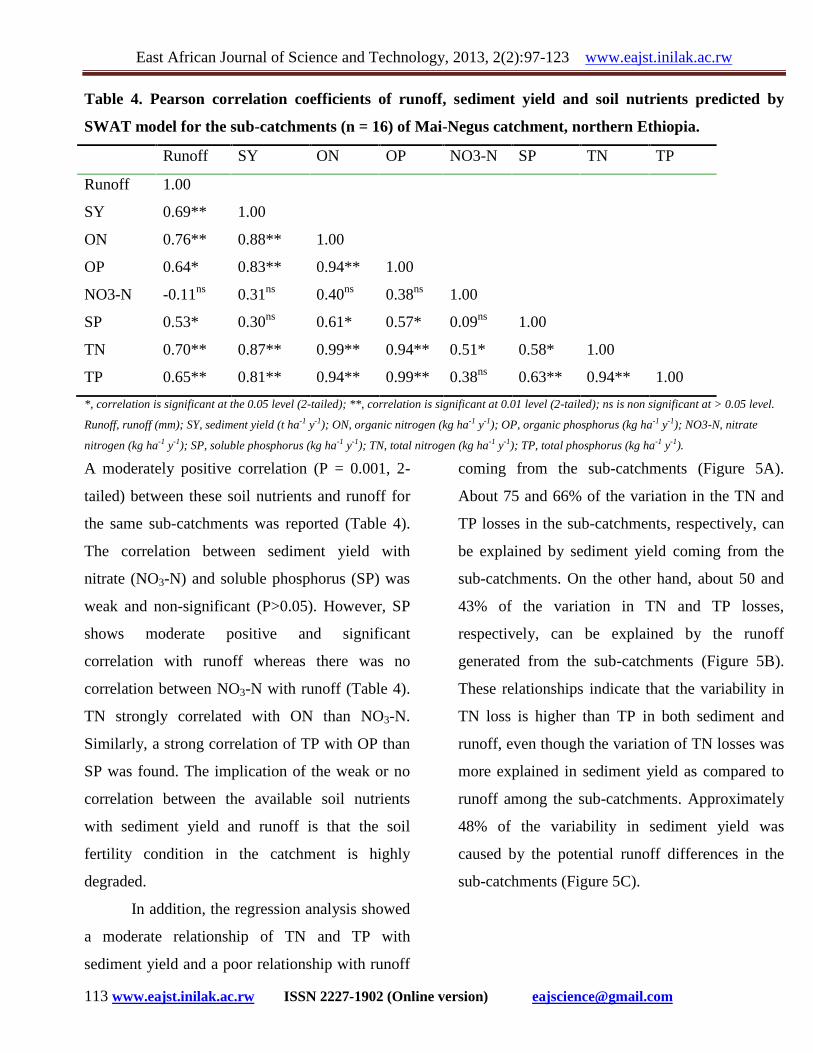
Table 4. Pearson correlation coefficients of runoff, sediment yield and soil nutrients predicted by
SWAT model for the sub-catchments (n = 16) of Mai-Negus catchment, northern Ethiopia.
Runoff SY ON OP NO3-N SP TN TP
Runoff 1.00
SY 0.69** 1.00
ON 0.76** 0.88** 1.00
OP 0.64* 0.83** 0.94** 1.00
NO3-N -0.11ns 0.31ns 0.40ns 0.38ns 1.00
SP 0.53* 0.30ns 0.61* 0.57* 0.09ns 1.00
TN 0.70** 0.87** 0.99** 0.94** 0.51* 0.58* 1.00
TP 0.65** 0.81** 0.94** 0.99** 0.38ns 0.63** 0.94** 1.00
*, correlation is significant at the 0.05 level (2-tailed); **, correlation is significant at 0.01 level (2-tailed); ns is non significant at > 0.05 level.
Runoff, runoff (mm); SY, sediment yield (t ha-1 y-1); ON, organic nitrogen (kg ha-1 y-1); OP, organic phosphorus (kg ha-1 y-1); NO3-N, nitrate
nitrogen (kg ha-1 y-1); SP, soluble phosphorus (kg ha-1 y-1); TN, total nitrogen (kg ha-1 y-1); TP, total phosphorus (kg ha-1 y-1).
A moderately positive correlation (P = 0.001, 2-
tailed) between these soil nutrients and runoff for
the same sub-catchments was reported (Table 4).
The correlation between sediment yield with
nitrate (NO3-N) and soluble phosphorus (SP) was
weak and non-significant (P>0.05). However, SP
shows moderate positive and significant
correlation with runoff whereas there was no
correlation between NO3-N with runoff (Table 4).
TN strongly correlated with ON than NO3-N.
Similarly, a strong correlation of TP with OP than
SP was found. The implication of the weak or no
correlation between the available soil nutrients
with sediment yield and runoff is that the soil
fertility condition in the catchment is highly
degraded.
In addition, the regression analysis showed
a moderate relationship of TN and TP with
sediment yield and a poor relationship with runoff
coming from the sub-catchments (Figure 5A).
About 75 and 66% of the variation in the TN and
TP losses in the sub-catchments, respectively, can
be explained by sediment yield coming from the
sub-catchments. On the other hand, about 50 and
43% of the variation in TN and TP losses,
respectively, can be explained by the runoff
generated from the sub-catchments (Figure 5B).
These relationships indicate that the variability in
TN loss is higher than TP in both sediment and
runoff, even though the variation of TN losses was
more explained in sediment yield as compared to
runoff among the sub-catchments. Approximately
48% of the variability in sediment yield was
caused by the potential runoff differences in the
sub-catchments (Figure 5C).

East African Journal of Science and Technology, 2013, 2(2):97-123 www.eajst.inilak.ac.rw
114 www.eajst.inilak.ac.rw ISSN 2227-1902 (Online version) [email protected]
YTP = 0.0106XSY + 0.8054RTP
2 = 0.6625, P = 0.000
YTN = 0.1491XSY + 8.4924RTN
2 = 0.7549, P = 0.000
02468
101214161820
0 10 20 30 40 50 60 70
Sediment yield, SY (t ha -1 y-1)
soil
nutri
ent l
osse
s (k
g ha
-1 y
-1)
TNTP
(A)
YTP = 0.0038XR + 0.4383RTP
2 = 0.4288, P = 0.006
YTN = 0.0537XR + 3.2362RTN
2 = 0.4963, P = 0.002
02468
101214161820
0 50 100 150 200 250
Runoff, R (mm)
Soil
nutri
ent l
osse
s (k
g ha
-1 y
-1)
TNTP
(B)
YSY = 0.3083XR - 26.162RSY
2 = 0.4816, P = 0.003
0
10
20
30
40
50
60
70
0 50 100 150 200 250
Runoff, R (mm)
Sedi
men
t yie
ld,S
Y (t
ha-1
y-1
)
(C)
Figure 5. Scatter plot and best fitting regression lines that relating sediment yield with soil nutrients (A),
runoff with soil nutrients (B) and runoff with sediment yield (C) for the sub-catchments of Mai-Negus
catchment, northern Ethiopia. TN is total nitrogen; TP is total phosphorus; R2 is coefficient of
determination

East African Journal of Science and Technology, 2013, 2(2):97-123 www.eajst.inilak.ac.rw
115 www.eajst.inilak.ac.rw ISSN 2227-1902 (Online version) [email protected]
0.1
1
10
100
1000
1992 1994 1996 1998 2000 2002 2004 2006 2008
Year SWAT model simulated
Run
off (
mm
), SY
(t h
a-1 y
-1) a
ndso
il nu
trie
nt (k
g ha
-1 y
-1)
runoffSYTNTP
Figure 6. The trend of runoff, sediment yield (SY), total nitrogen (TN) and total phosphorus (TP) during the
simulated periods for the study catchment
The remaining 52% of sediment yield variability
in the sub-catchments could be explained by
unknown and inherent catchment factors such as
slope and land cover. Besides, the trends in annual
runoff and sediment yield variability showed
similarity with the trends of soil nutrient losses in
the sub-catchments across the periods 1992-2008
(Figure 6). This indicates that as sediment yield or
runoff increases, the loss of soil nutrients becomes
high and vice-versa. The rate of soil nutrient losses
across the simulation periods showed a slight
decrease (but irregularly) with time, which may be
attributed to the effect of the intermittently
introduced conservation measures, change in
climate, and/or sub-soil with low soil fertility
mixed up with top soil that reduce the overall soil
nutrient concentration in the eroded sediment
(Palis et al., 1994). However, the causes for the
decreasing trend in the rate of nutrient losses
require further investigations in the context of
northern Ethiopia catchment conditions.
Generally, the strong positive correlation
and positive linear relationship (best fitting
regression function) between sediment yield and
the soil nutrient losses from the sub-catchments
reflected a strong link between nutrient losses and
sediments compared to runoff. This implied that
runoff transported soil nutrients losses were
smaller as compared to sediment bounded. This
may be due to the low solubility of the nutrients
and strongly bounded within soil particles when
sediments were transported by runoff force.
Therefore, careful management planning and
designing appropriate measures should target to
reduce the sediment yield coming from the source
sub-catchments, so as to decrease the nutrient
losses. Decreasing sediment yield from the erosion
hotspot areas also increase the lifespan of the
reservoir in the catchment (Tamene, 2005). Under

East African Journal of Science and Technology, 2013, 2(2):97-123 www.eajst.inilak.ac.rw
116 www.eajst.inilak.ac.rw ISSN 2227-1902 (Online version) [email protected]
the study catchment condition (e.g., no other
source of water point is available for different
services), measures aimed at reducing the runoff
may pose several disadvantages such as reducing
surface flow to the reservoir, which could affect
irrigation and domestic water supply”
3.4. Possible management options in reducing
soil degradation
The SWAT model is a complex catchment model
relying on numerous parameters. This creates
problems when attempting to access data for
modeling in a specific study area due to the high
number of parameters and their possible
correlations between each other (Vandenberghe et
al., 2001). In line with this, the SWAT model
application for management planning on large
catchment for conditions in Ethiopia is difficult
due to data scarcity or not getting data at all for
model evaluation. This indicates that model
application in the context of small catchment,
which has relatively sufficient data, is very crucial
in order to extrapolate parameter values to similar
catchments with data scarcity for SWAT model
simulation and evaluation. In addition, knowledge
on the parameters that influence model outputs
alone is not enough for suggestion of management
options in a catchment. Simulations and possible
management options that mainly influence the
sensitive model parameters and thereby model
results of the prioritized sub-catchments based on
this study results are thus needed for decision
making and planning processes.
Given the spatial variability, the extent, the
intensity of erosion and delivery processes, land
use redesigning, conservation or management
measures across a catchment should be applied at
appropriate sites of the catchment so as to use
resources efficiently while reducing soil
degradation. Before suggesting the management
options for reducing soil degradation, the severity
of the erosion and sediment yield, runoff and soil
nutrient losses in the sub-catchments (hotspot
areas), and the most strongly influencing
(sensitive) factors for model simulation were
considered. Afforesting all fields in the study
catchment is impractical for many reasons.
Instead, afforesting degradation hotspot sub-
catchments due to erosion is feasible. On the basis
of the results from the baseline condition, > 18 t
ha-1 y-1 sub-catchments with erosion severity were
accounted for and that covered about 57% of the
total catchment area and hence the afforestation
management option. This threshold was based on
the maximum tolerable soil loss of 18 t ha-1 y-1 for
soils in Ethiopia as determined by Hurni (1985).
The management option termed as afforestation
can change the C-factor from 0.25 for tef crop
dominated land to 0.001 in the long-term and to
0.01 (dense grass) when simulated as pasture area
in the short-term. The curve-number (CN) values
for this management option also ranged from 40 -
60 on the basis of the hydrological soil groups,
and were lower than the CN in the existing
situation which is 70 - 90 (EPA, 2004). Besides,

East African Journal of Science and Technology, 2013, 2(2):97-123 www.eajst.inilak.ac.rw
117 www.eajst.inilak.ac.rw ISSN 2227-1902 (Online version) [email protected]
the afforestation management option increases the
roughness coefficient that decreases water runoff.
Such changes in these parameters values were
essential for reducing soil degradation rate in the
study catchment.
Parallel terraces act as a barrier to run-off,
increasing infiltration and decreasing flow
volumes and speed, and ultimately reducing the
transport capacity and encouraging sediment
deposition (Tamene and Vlek, 2007). Wherever
soil loss rates exceed 16-18 t ha-1 y-1 in Ethiopia,
soil conservation measures should be
recommended (Water and Power Consultancy
Services, WAPCOS, 1990). This is therefore, the
reason for the suggestion of parallel terraces as a
management strategy to the prioritized sub-
catchments identified based on SWAT model
simulation. Erosion computation of the SWAT
model is most sensitive to the curve-number (CN)
and slope, as these influences the rate of runoff,
sediment and soil nutrient losses. The CN and
consequent simulated surface runoff volume can
decrease significantly for terraced conditions (EPA,
2004) as the expected slope length and steepness
reduced as compared to in the existing condition.
The USLE_P will also be altered to 0.6 for the
targeted sub-catchments as a result of the
introduction of parallel terraces when compared to
0.9 in the existing condition.
The management option such as grassed
waterways can be used to cover a stream or gully
channels, and act as a barrier for sediment and also
filter part of the nutrient loadings carried in the
surface runoff (Borin et al. 2005). The
introduction of such management in the sub-
catchments which has widespread streams and
channels can be carried by modifying three
parameters in the SWAT model; the channel cover
factor (Ch_Cov), the channel erodibility factor
(Ch_Erod), and the channel Manning’s roughness
coefficient (n) value (Ch_N2). Runoff (flow)
velocity decreases with an increase in Ch_N2. The
default value for Ch_N2 in SWAT is 0.014
whereas during calibration it was 0.030. These
values can be modified to 0.24 for the channel
segment with grassed waterways (EPA, 2004).
Such channel segments are considered fully
protected by the vegetation cover (Ch_Cov = 0)
and thus to be non-erosive (Ch_Erod = 0) during
the simulation of this scenario. In addition, gully/
grade stabilization structure can be suggested on
the basis that it can stabilize the channel grade so
as to control erosion and prevent the formation or
advance of big channels such as gullies. The
structures can be vertical drop structures, concrete,
earth or riprap chutes, gabions, or pipe drop
structures, which are physical conservation
measures. In the study catchment condition, areas
along the streams/gullies with degraded grass,
steep land slope and high C-factor in the Modified
Universal Soil Loss Equation in the SWAT model
accounted for bank sloughing and channel erosion.
The suggested gully/ grade stabilization structure
as management option can reduce gully (channel)
erodibility to 0.0 (non-erosive), reduce channel

East African Journal of Science and Technology, 2013, 2(2):97-123 www.eajst.inilak.ac.rw
118 www.eajst.inilak.ac.rw ISSN 2227-1902 (Online version) [email protected]
slope steepness by at least 50%, and reduce rill-
sheet erosion of the channel as USLE_P changed
to 0.6 in the SWAT model. Such modification of
parameter values can reduce the overall losses by
erosion from the catchment. However, catchment
management option may not be focused only on
single soil conservation or sediment control
measures or land-use redesign. In this study, the
application of a combination of the different
management options suggested indicated that it is
possible for more parameters in the SWAT model
to be modified at the same time so as to reduce
significantly the sediment yield, runoff and
nutrient losses from the entire catchment and the
targeted sub-catchments. However, evaluating the
cost-benefit of the suggested management options
is important before their implementation. In
addition, evaluating the effectiveness of these
management options in reducing soil degradation
in terms of the soil loss, runoff and nutrient losses,
considering the resource available within the local
community is needed for their practical
application in the study area conditions.
4. Conclusion
The SWAT model is a very useful tool for
planning alternative catchment management
options to tackle soil degradation due to soil
erosion. The model revealed that all the sub-
catchments within a catchment could not
contribute equally to stream flow, sediment yield
and soil nutrient losses. This study demonstrates
that sub-catchments having areas of land such as
gullies, steep slopes and poor soil cover within a
catchment, tends to be the source of
disproportionately large amount of erosion. The
SWAT model predicted the rate of sediment yield
of each sub-catchment that ranged from 0-5 t ha y-
1 to more than 50 t ha y-1. The results of model in
this study identified and ranked six sub-
catchments that require high priority for
management interventions due to excessive runoff,
sediment and soil nutrients losses. This indicates
that the model is effective for identification and
prioritization of critical erosion hotspot sub-
catchments in order to design management plan
that reduce these losses at catchment scale.
Therefore, the model supports for mitigation
sediment source areas (confined area), which costs
less than targeting wider areas. The output from
this study is vital for planners and decision makers
to prioritize erosion hotspot sub-catchments by
answering where proper land management
measures to be implemented to bring the best
benefit through reducing soil degradation problem.
However, it is recognized that a wider validation
effort is needed before adopting the model for
decision making purpose throughout the northern
Ethiopia catchments, which have diverse
environmental settings.
Acknowledgements
The authors sincerely acknowledge the financial
support by DAAD/ GTZ (Germany) through the
Centre for Development Research (ZEF),

East African Journal of Science and Technology, 2013, 2(2):97-123 www.eajst.inilak.ac.rw
119 www.eajst.inilak.ac.rw ISSN 2227-1902 (Online version) [email protected]
University of Bonn (Germany), and the first
author’s field work supported by Aksum
University (Ethiopia). The authors also highly
appreciate the assistance offered by the local
administration and extension agents during the
field study.
References
Admassie, Y., (1995). Twenty Years to Nowhere.
Property Rights, Land Management and
Conservation in Ethiopia. unpubl. PhD thesis,
Uppsala University, Sweden.
Ananda, J., Herath, G., (2003). Soil erosion in
developing countries: a socio-economic
appraisal. Journal of Environmental
Management, 68, 343-353.
Arnold, J.G., Williams, J.R., Maidment, D.R.,
(1995). Continuous-time water and sediment
routing model for large basins. Journal of
Hydraulic Engineering, 12, 1171-183.
Arnold, J.G., Sirinivasan, R., Muttiah, R.S.,
Williams, J.R., (1998). Large area hydrologic
modelling and assessment. Part 1: Model
development. Journal of the American Water
Resources Association, 34, 73-89.
Ashagre, B.B., (2009). SWAT to identify
watershed management options: (Anjeni
watershed, Blue Nile basin, Ethiopia). MSc
Thesis, Cornell University.
Bingner, R.L., Theurer, F.D., (2001). AnnAGNPS:
estimating sediment yield by particle size for
sheet & rill erosion, in: Proceedings of the
Sedimentation: Monitoring, Modeling, and
Managing, 7th Federal Interagency
Sedimentation Conference, Reno, NV. pp, 1-7.
Boggs, G., Devonport, C., Evans, K., Puig, P.
(2001). GIS-based rapid assessment of erosion
risk in a small catchment in a wet/dry tropics
of Australia. Land Degradation &
Development, 12, 417- 434.
Chekol, A.D., (2006). Modeling of hydrology and
soil erosion of upper Awash river basin,
Ethiopia. Pub. PhD Thesis, University Bonn
Borin, M., Vianello, M., Morari, F., Zanin, G.,
(2005). Effectiveness of buffer strips in
removing pollutants in runoff from cultivated
field in North-East Italy. Agriculture,
Ecosystems & Environment, 105, 101-114.
Dejene, A., (1990). Environment, Famine, and
Politics in Ethiopia: A view from the village.
Lynne Rienner Publishers, Inc.
Dennis, M.F., Rorke, M.F., (1999). The
relationship of soil loss by interill erosion to
slope gradient. Catena, 38, 211-222.
Environmental Protection Agency, EPA., (1976).
Quality Criteria for Water. Washington, DC.
Environmental Protection Agency, EPA., (2004).
Impact of best management practices on water
quality of two small watersheds in Indiana:
role of spatial scale. United States
Environmental Protection Agency. Available
from: http://www.epa.gov/nrmrl/pubs/600r050
80/600r05080.pdf [Cited 14 March 2011].
Eweg, H., Van Lammeren., R (1996). The
application of a Geographical Information
East African Journal of Science and Technology, 2013, 2(2):97-123 www.eajst.inilak.ac.rw
120 www.eajst.inilak.ac.rw ISSN 2227-1902 (Online version) [email protected]
System to the rehabilitation of degraded and
degrading areas. A case study in the Highlands
of Tigray, Ethiopia. Centre for Geographical
Information Processing, Agricultural
University of Wageningen, Wageningen.
Flanagan, D.C., Nearing, M.A., (1995). USDA-
Water Erosion Prediction Project (WEPP) -
Technical Documentation, National Soil
Erosion Research Laboratory, Report No. 10,
USDA-ARS-MWA, West Lafayette, IN.
FAO., (1986). Ethiopian highland reclamation study.
Final report, FAO, Rome, Italy.
FAO – UNESCO., (1974). Soil map of the world.
Vol 1, Legend, FAO, Rome, Italy.
Fontaine, T.A., Cruickshank, T.S., Arnold, J.G.,
Hotchkiss, R.H., (2002). Development of a
snowfall-snowmelt routine for mountainous
terrain for the soil water assessment tool
(SWAT). Journal of Hydrology, 262, 209-223.
Girmay, G., Singh, B.R., Nyssen, J., Borrosen, T.,
(2009). Runoff and sediment-associated
nutrient losses under different land uses in
Tigray, Northern Ethiopia. Journal of
Hydrology, 376, 70-80.
Green, W.H., Ampt, G.A., (1911). Studies on soil
physics, 1. The flow of air and water through
soils. Journal of Agricultural Sciences, 4, 11-
24.
Haregeweyn, N., Poesen, J., Nyssen, J., Wit, J.D.,
Haile, M., Govers, G., Deckers, S., (2006).
Reservoirs in Tigray (Northern Ethiopia):
Characteristics and Sediment Deposition
Problems. Land Degradation & Development,
17, 211-230.
Hurni, H., (1983). Soil formation rates in Ethiopia.
Working paper 2, Ethiopian Highlands
Reclamation Studies, Addis Ababa, Ethiopia.
Hurni, H., (1985). Erosion - productivity -
conservation systems in Ethiopia. In: Sentis,
I.P. (ed.), Soil Conservation and Productivity,
Proceedings the 4th International Conference
on Soil Conservation, Maracay, Venezuela. 3-
9 November 1985, pp. 654-674.
Hurni, H., (1993). Land degradation, famine, and
land resource scenarios in Ethiopia, In:
Pimentel D, ed. World Soil Erosion and
Conservation, Cambridge University Press:
Cambridge, pp. 27-62.
Kinnell, P.I.A., (2000). AGNPS–UM: applying the
USLE–M within the agricultural nonpoint
source pollution model. Environmental
Modelling and Software, 15, 331-341.
Lal, R., (1998). Soil quality and sustainability. In:
Lal, R., Blum, W.H., Valentine, C., Stewart,
B.A. (eds.), Methods for Assessment of Soil
Degradation, Boca Raton, FL: CRC Press,
pp.17-30.
Lal, R., (1999). Erosion impact on soil quality in
the Tropics. In: Lal, R. (ed.), Soil Quality and
Soil Erosion, Boca Raton, FL, CRC press, pp.
285-317.
Lal, R., (2001). Soil degradation by erosion. Land
Degradation & Development, 12, 519 -539.
East African Journal of Science and Technology, 2013, 2(2):97-123 www.eajst.inilak.ac.rw
121 www.eajst.inilak.ac.rw ISSN 2227-1902 (Online version) [email protected]
Lim, K.J., Sagong, M., Engel, B.A., Tang, Z.,
Choi, J., Kim, K., (2005). GIS-based sediment
assessment tool. Catena, 64, 61-80.
Mati, B.M., Morgan, R.P.C., Gichuki, F.N.,
Quinton, J.N., Brewer, T.R., Liniger, H.P.,
(2000). Assessment of erosion hazard with the
USLE and GIS: a case study of the upper
Ewaso Ng’iro north basin of Kenya.
International Journal of Applied Earth
Observation and Geoinformation, 2, 1-9.
Morgan, R.P.C., Quinton, J.N., Smith, R.E.,
Govers, G., Poesen, J.W.A., Auerswald, K.,
Chisci, G., Torri, D., Styczen, M.E., (1998).
The European Soil Erosion Model
(EUROSEM): a dynamic approach for
predicting sediment transport from fields and
small catchments. Earth Surface Processes and
Landforms, 23, 527-544.
Morgan, R.P.C., (2005). Soil Erosion and
Conservation, 3rd edition. Blackwell: Malden.
Neitsch, S.L., Arnold, J.G., Kiniry, J.R., Williams,
J.R., (2005). Soil and Water Assessment Tool,
Theoretical Documentation: Version 2005.
Temple, TX. USDA Agricultural Research
Service and Texas A & M Blackland Research
Center.
Netherlands Engineering Consultants, NEDECO.,
(1998). Tekeze River Basin Integrated Master
Plan Development Project. Natural Resource,
Soils and Terrain, Addis Ababa, Ethiopia.
Nyssen, J., (2001). Erosion processes and soil
conservation in a tropical mountain catchment
under threat of anthropogenic desertification -
a case study from Northern Ethiopia. unpubl.
PhD Thesis, Katholieke University Leuven,
Belgium.
Oldeman, L.R., (1994). The global extent of land
degradation. In: Greenland, D.J., Szabolcs, I.
(eds.), Land Resilience and Sustainable Land
Use, Wallingford: CABI, pp. 99-118.
Palis, R.G., Ueno, Y., Reyes, E.R., Rojales, J.B.,
(1994). Soil and nutrient loss from small
catchment under various land uses in the
Ultisol. In: Bhusan, L.S., Abrol, I.P.,
Ramamohan, Rao, M.S. (eds.), Soil and Water
Conservation Challenges and Opportunities,
8th ISCO Conference, New delhi, India, pp.
1450-1457.
Rallison, R.E., Miller, N., (1981). Past, present,
and future SCS runoff procedure. In: Singh,
V.P. (ed.) Rainfall-Runoff Relationship,
Proceedings of the International Symposium
on Rainfall-Runoff Modelling, Water
Resources Publications, Mississippi, USA, pp.
353-364.
Santhi, C., Arnold, J.G., Williams, J.R., Dugas,
W.A., Srinivasan, R., Hauck, L.M., (2001).
Validation of the SWAT model on a large
river basin with point and nonpoint sources.
Journal of the American Water Resources
Association, 37, 1169-1188.
Scherr, S.J., (1999). Soil Degradation: A Threat to
Developing-Country Food Security by 2020?
Food, Agriculture, and Environment
East African Journal of Science and Technology, 2013, 2(2):97-123 www.eajst.inilak.ac.rw
122 www.eajst.inilak.ac.rw ISSN 2227-1902 (Online version) [email protected]
Discussion Paper 27, International Food Policy
Research Institute, Washington, DC.
Setegn, S.G., Srinivasan, R., Dargahi, B., Melesse,
A.M., (2009). Spatial delineation of soil
erosion vulnerability in the Lake Tana Basin,
Ethiopia. Hydrological Processes, 23, 3738-
3750.
Shi, Z.H., Cai, S.F., Ding, S.W., Wang, T.W.,
Chow, T.L., (2004). Soil conservation
planning at the small watershed level using
RUSLE with GIS: a case study in the Three
Gorge area of China. Catena, 55, 33-48.
Soil Conservation Service, SCS., (1972). National
Engineering Handbook. Section 4. USDA,
Washington, D.C.
Tamene, L., (2005). Reservoir siltation in the drylands
of northern Ethiopia: causes, source areas and
management options. Publ. PhD Thesis, Center for
Development Research, University of Bonn,
Germany.
Tamene, L., Park, S.J., Dikau, R., Vlek, P.L.G.,
(2006). Reservoir siltation in the semi-arid
highlands of northern Ethiopia: sediment
yield-catchment area relationship and a semi-
quantitative approach for predicting sediment
yield. Earth Surface Processes and Landforms,
31, 1364-1383.
Tamene, L., Vlek, P.L.G., (2008). Soil erosion
studies in northern Ethiopia. In: Braimoh,
A.K., Vlek, P.L.G. (eds), Land Use and Soil
Resources, Springer Science 7 Business Media
B.V. Dordrecht, The Netherlands, pp. 73-100.
Tekeste, G., Paul, D.S., (1989). Soil and water
conservation in Tigray, Ethiopia. Report of a
consultancy visit to Tigray, University of
Wageningen.
Tesfahunegn, G.B., Vlek, P.L.G., Tamene, L.,
(2012). Management strategies for reducing
soil degradation through modeling in a GIS
environment in northern Ethiopia catchment.
Nutrient Cycling in Agroecosystems, 92, 255-
272.
Tripathi, M.P., Panda, R.K., Raghuwanshi, N.S.,
(2003). Identification and prioritization of
critical sub-watersheds for soil conservation
management using the SWAT model.
Biosystems Engineering, 85, 365-379.
Vandenberghe, V., Van Griensven, A., Bauwens,
W., (2001). Sensitivity analysis and calibration
of the parameters of ESWAT: application to
the river Dender, Water Science and
Technology, 43, 295-301.
Walling, D.E., Fang, D., (2003). Recent trends in
the suspended sediment loads of the world's
rivers. Global Planet Change, 39, 111-126.
Water and Power Consultancy Services,
WAPCOS., (1990). Water resources
development master plan for Ethiopia.
WAPCOS Ltd, India.
Williams, J.R., (1975). Sediment-yield prediction
with universal equation using runoff energy
factor. In: Present and Prospective Technology
for Predicting Sediment Yield and Sources,
Proceedings of the Sediment Yield Workshop,

East African Journal of Science and Technology, 2013, 2(2):97-123 www.eajst.inilak.ac.rw
123 www.eajst.inilak.ac.rw ISSN 2227-1902 (Online version) [email protected]
USDA Sedimentation Lab., Oxford, MS, ARS-
S-40, 28-30 Nov. 1972, pp. 244-252.
Wischmeier, W.H., Smith, D.D., (1978).
Predicting rainfall erosion losses-a guide to
conservation. Agricultural Handbook no. 537.
US Department of Agriculture, Washington,
DC.
Zoebisch, M.A., DePauw, E., (2002). Degradation
and food security on a global scale. In: Lal, R.
(ed.), Encyclopedia of Soil Science, Marcel
Dekker Inc. 281-286.