East Africa Air Transport Survey Iches 2005 - World...
69
March 2005 East Africa Air Transport Survey
Transcript of East Africa Air Transport Survey Iches 2005 - World...

March 2005
East Africa Air Transport Survey

East Africa Air Transport Survey – March 2005 Page 1
East Africa Air Transport Survey
This report is prepared for the World Bank by Michel Iches, Air Transport Specialist, with the support and funding of France’s Civil Aviation Department (Direction Générale de l’Aviation Civile) and Ministry of Foreign Affairs (Direction Générale de la Coopération Internationale et du Développement).
Table of contents
Page 1- Region Overview 2- The air transport market 2-1 General considerations on the air transport market 2-2 Domestic air transport markets 2-3 Regional (inter-state) market 2-4 Continental long - and medium haul markets 2-5 Intercontinental market 2-6 Consolidated traffic results 2-7 Fare structures 2-8 Government interference 2-9 The regulatory context 3- The Region’s air transport industry 4- Prospect and issues

East Africa Air Transport Survey – March 2005 Page 2
1- Region Overview
Population Economy and income Regional and sub-regional organizations

East Africa Air Transport Survey – March 2005 Page 3
2- The air transport market 2-1 General considerations on the air transport market Compared to other regions in Africa, East Africa forms a relatively homogeneous group of countries in many aspects. This homogeneity creates a favourable environment towards the emergence of an integrated air transport market. Geography: The four countries belong to the highlands region of the eastern part of the African continent with some very high summits (Mt. Kilimanjaro is the highest peak on the continent; Mt. Kenya, Mt. Elgon and Mt. Ruwenzori are the next highest mountains in Africa) and vast plateau regions lying at elevations over 800 metres on both sides the famed Rift Valley with several active volcanoes. Several great lakes (Lake Victoria, one of the world’s largest tracts of freshwater; Lake Tanganika, one of the world’s deepest) also are a feature of the Region, although some of the lakes in the Rift Valley are unsuitable for use as resources of freshwater because of their high alkaline content. Kenya and Tanzania also have a long stretch of low lands extending on the coast of the Indian Ocean. Two of the countries, Rwanda and Uganda, are landlocked; as Kenya’s capital and major economic centre, as well as some Tanzania’s major economic production areas are inland, both countries share some common problems with the other two, such as the high cost of the haulage of fuel from the sea ports. Climate The four countries belong to the Equatorial zone. However, due to the topography and the system of winds in the Indian Ocean, their climate is more of the tropical type than the classical equatorial climate. Rainfall varies considerably and is maximum on the coast and in the mountain areas. Large parts of the plateau region are semi-arid with long dry seasons. Temperatures can be quite low during the night in the plateau region, and the region’s highest mountains have the only permanent snows in the continent. History and culture The four countries became independent in the early sixties. Since then, Kenya and Tanzania have enjoyed political stability, whereas Uganda and Rwanda have had a more chaotic history. Kenya has adhered to the principles of market-oriented economy ever since independence. Tanzania followed the course of a centrally-planned economy for about 25 years, before shifting peacefully to a market-oriented model, but has not yet completely overcome the sequels of the centrally-planned model. The heritage of the Swahili culture originating from the coastal region and the widespread use of the Swahili language are strong factors of the region’s homogeneity. The region’s countries have also, except Rwanda, been under British colonial rule for three-quarters of a century (40 years for Tanzania mainland, after the British took over from Germany following World War I). Use of the English language and the common heritage of the British system of administration facilitate regional integration. During the sixties and early seventies, Kenya, Uganda and Tanzania have formed a regional body, the East African Community to promote coordination and integration. However, the differences in economic policies pursued by Tanzania and Kenya made integration slower

East Africa Air Transport Survey – March 2005 Page 4
than expected, whereas the political problems in Uganda led to the community’s collapse in the late seventies. The East African Community has been revived since …. and now provides an effective framework for regional integration. All four countries are also members of Comesa, a body covering Eastern and Southern Africa and promoting harmonization of economic regulations and policies. 2-2 Domestic air transport markets Unsurprisingly, domestic air transport markets are most important in the two largest countries, Kenya and Tanzania, whereas it is virtually non existent in Rwanda. However, patterns and volumes are different between Kenya and Tanzania. 2-2-1 Kenya domestic market No global domestic traffic data are available for Kenya. However, it is possible to infer the global volume from the airport data of Nairobi and Mombasa: NBO 1999-2000 533 468 2000-2001 499 689 2001-2002 480 445 2002-2003 (10 months) 469 448 2003-2004 (not available) 2004-2005 (5 months) 317 710 MBA 1999-2000 479 450 2000-2001 435 619 2001-2002 408 905 2002-2003 (11 months) 406 935 2003-2004 (not available) 2004-2005 (not available) In spite of the incomplete data for 2002-2003 and the non availability of 2003-2004 data (due to a disruption in the activity of the statistical department of the Kenya Airports Authority), it is still possible to identify some key features of the domestic traffic over the last six years:
• a negative trend during the period 2000-2003, followed by a marked recovery starting in 2004; if compared with the trends observed in international traffic, the parallel changes in domestic and international traffics suggests that some of the domestic traffic is driven by the international markets. This link between domestic and international markets is confirmed by the information collected with tourism authorities and industry stakeholders, who mentioned the importance of combined tours in the tourism market (typical combination of beach in Mombassa and sightseeing and wildlife tours centred on Nairobi).
East Africa Air Transport Survey – March 2005 Page 5
• volumes recorded in Nairobi and Mombassa are very close to each other, which is not surprising as the Nairobi-Mombassa route represents the largest part of the domestic market.
• the recovery of traffic as of 2004 is probably linked to the combination of two factors:
one is the recovery of tourism after the downturn caused by the terrorist attacks on Nairobi (bombing of the US Embassy) and Mombassa (attack of a resort hotel and firing of a missile on a flight taking off from MBA airport); the second factor is the liberalization policy which led to the introduction of competition on domestic routes which resulted in the increase of services (elimination of supply-side bottlenecks) and reduced airfares. Most industry spokespersons mentioned fares as a key factor.
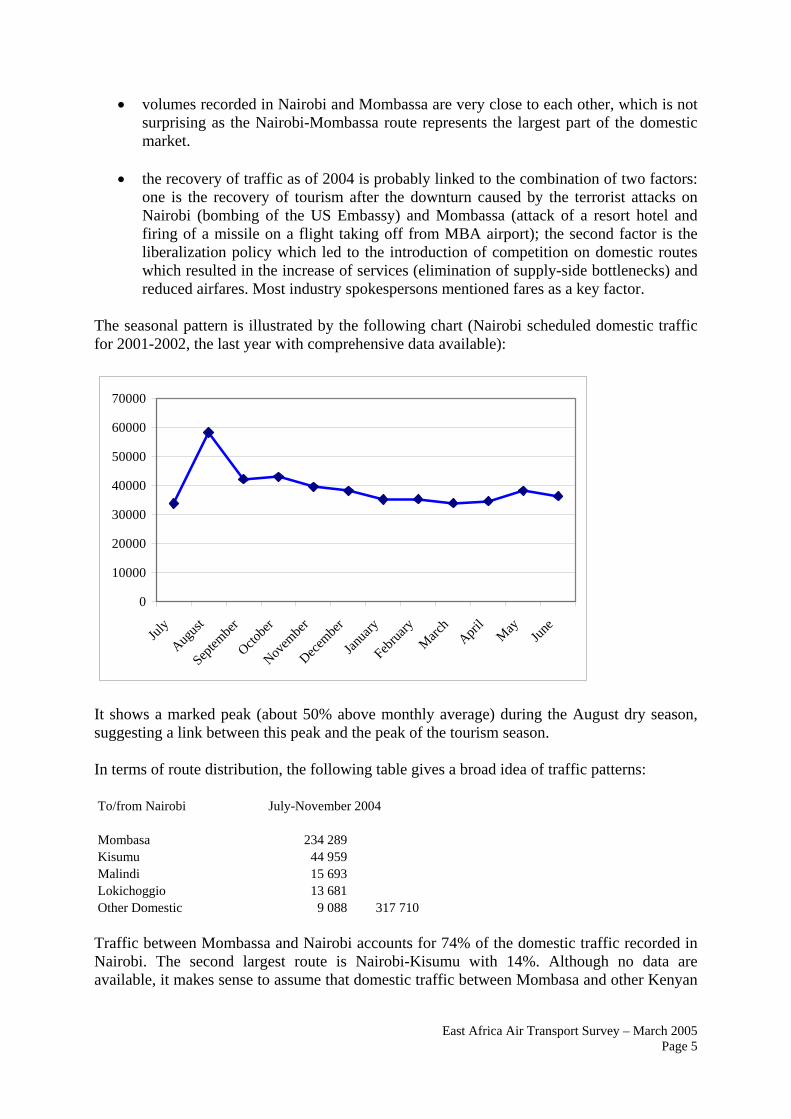
The seasonal pattern is illustrated by the following chart (Nairobi scheduled domestic traffic for 2001-2002, the last year with comprehensive data available):
0
10000
20000
30000
40000
50000
60000
70000
July
August
Septem
ber
Octobe
r
Novem
ber
Decembe
r
Janua
ry
Februa
ryMarc
hApri
lMay Jun
e
It shows a marked peak (about 50% above monthly average) during the August dry season, suggesting a link between this peak and the peak of the tourism season. In terms of route distribution, the following table gives a broad idea of traffic patterns: To/from Nairobi July-November 2004 Mombasa 234 289 Kisumu 44 959 Malindi 15 693 Lokichoggio 13 681 Other Domestic 9 088 317 710 Traffic between Mombassa and Nairobi accounts for 74% of the domestic traffic recorded in Nairobi. The second largest route is Nairobi-Kisumu with 14%. Although no data are available, it makes sense to assume that domestic traffic between Mombasa and other Kenyan
East Africa Air Transport Survey – March 2005 Page 6
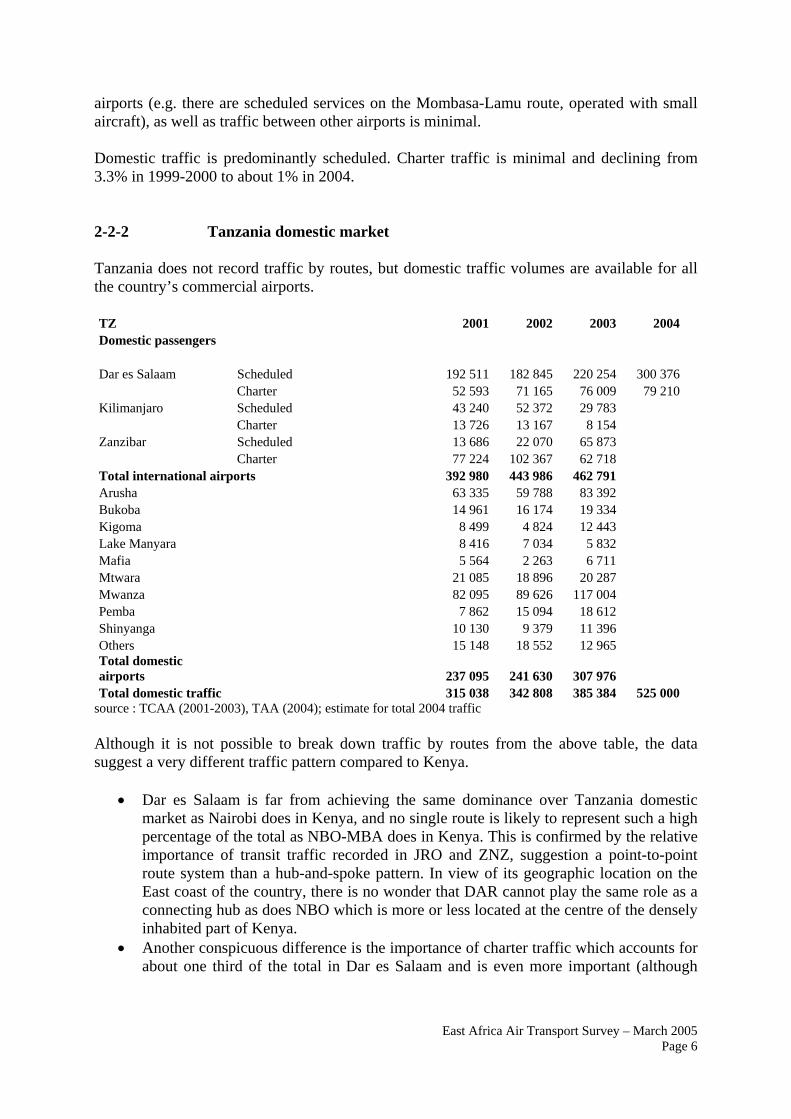
airports (e.g. there are scheduled services on the Mombasa-Lamu route, operated with small aircraft), as well as traffic between other airports is minimal. Domestic traffic is predominantly scheduled. Charter traffic is minimal and declining from 3.3% in 1999-2000 to about 1% in 2004. 2-2-2 Tanzania domestic market Tanzania does not record traffic by routes, but domestic traffic volumes are available for all the country’s commercial airports. TZ 2001 2002 2003 2004Domestic passengers Dar es Salaam Scheduled 192 511 182 845 220 254 300 376 Charter 52 593 71 165 76 009 79 210Kilimanjaro Scheduled 43 240 52 372 29 783 Charter 13 726 13 167 8 154 Zanzibar Scheduled 13 686 22 070 65 873 Charter 77 224 102 367 62 718 Total international airports 392 980 443 986 462 791 Arusha 63 335 59 788 83 392 Bukoba 14 961 16 174 19 334 Kigoma 8 499 4 824 12 443 Lake Manyara 8 416 7 034 5 832 Mafia 5 564 2 263 6 711 Mtwara 21 085 18 896 20 287 Mwanza 82 095 89 626 117 004 Pemba 7 862 15 094 18 612 Shinyanga 10 130 9 379 11 396 Others 15 148 18 552 12 965 Total domestic airports 237 095 241 630 307 976 Total domestic traffic 315 038 342 808 385 384 525 000
source : TCAA (2001-2003), TAA (2004); estimate for total 2004 traffic Although it is not possible to break down traffic by routes from the above table, the data suggest a very different traffic pattern compared to Kenya.
• Dar es Salaam is far from achieving the same dominance over Tanzania domestic market as Nairobi does in Kenya, and no single route is likely to represent such a high percentage of the total as NBO-MBA does in Kenya. This is confirmed by the relative importance of transit traffic recorded in JRO and ZNZ, suggestion a point-to-point route system than a hub-and-spoke pattern. In view of its geographic location on the East coast of the country, there is no wonder that DAR cannot play the same role as a connecting hub as does NBO which is more or less located at the centre of the densely inhabited part of Kenya.
• Another conspicuous difference is the importance of charter traffic which accounts for about one third of the total in Dar es Salaam and is even more important (although

East Africa Air Transport Survey – March 2005 Page 7
declining) in Zanzibar. However, this finding is to be handled cautiously as it may just be related to a lower degree of liberalization which results in the fact that some domestic carriers may operate on a regular basis under a “charter” licence. There may also be some inconsistency in the recording of data: for 2001, Zanzibar records a volume of domestic charter traffic of 77,000, in excess of the combined volumes of DAR and JRO, thus suggesting that a sizeable number of charter passengers in ZNZ travel to/from other points than DAR and JRO (presumably to/from Pemba).
• Apart from Dar es Salaam, four domestic airports have large volumes of domestic traffic: Zanzibar, Kilimanjaro, Arusha and Mwanza.
All in all, Tanzania domestic market represents a lower volume than Kenya’s (about 30% less) but the trend seems more steadily on the increase. Regarding seasonal patterns at the country’s three main airports, it appears that there is a marked peak for the July to October period and another for December, whereas the low is observed in May, which corresponds to the rainy season.
0
5000
10000
15000
20000
25000
30000
35000
Jan Feb Mar AprMay Jun Jul Aug Sep Oct
Nov Dec
Dar es SalaamKilimanjaroZanzibar
This indeed suggests that the peaks are tourism-driven. Compared to Kenya, it seems that the peak tourism season is spread over a longer period, and the peak is more conspicuous although the ratios of highest month to lowest are in the same range (1.7 in DAR and 2.8 in ZNZ compared to 1.7 in NBO). This may mean that the traffic on these airports is more dependent on the tourism market or in other words that business-driven traffic is relatively lower in Tanzania. 2-3 Regional market 2-3-1 Interstate routes There is no simple way of determining interstate traffic volumes in the East Africa region, as three of the four countries do not record traffics by routes. Such data are available only for Kenya, and just on a part basis. Tanzania records traffics by carrier for Dar es Salaam Airport.

East Africa Air Transport Survey – March 2005 Page 8
Nairobi data The following table provides traffics to/from Nairobi for FY 1999-2000 and 2000-2001 and five months of 2004: NBO to/from 1999-2000 2000-2001 Jul-Nov 04Entebbe 109 672 399 632 141 907Dar es Salam 163 013 389 108 124 867Kigali 60 335 104 301 37 776Zanzibar 24 639 51 395 29 056Bujumbura 21 254 35 124 22 279Other E&C Afr 45 516
However, these figures are deceptive and not much can be inferred from them. If we analyse the data in terms or departures/arrivals, especially for the Dar es Salam and Entebbe routes, it appears that there is a huge imbalance, suggesting that transit passengers are not properly accounted for: 2000-2001 1999-2000 arr dep arr depEntebbe 169 290 230 342 98 323 11 349Dar es Salam 131 972 257 136 73 989 89 024
Directional imbalance is not usually expected to be in excess of a few percentage points. If we look at the NBO-EBB data for 1999-2000, it is very unlikely that the number of arrivals from Entebbe can be 9 times higher than the number of departures to Entebbe. It may be that passengers travelling on multistage flights operating with a stopover in NBO are accounted as arrivals whereas they continue on the same flights to a final destination, and should have more properly be accounted as “transits”. It might be assumed that departure data are more reliable since declared or manifested numbers are easier to reconcile with the number of boarding passes issued or the numbers of passenger airport charges invoiced by the Airport Authority, but there is no positive indication that such reconciliation is carried out and; moreover, the next year the difference is opposite. Therefore, these data have to be considered as grossly unreliable. In addition, the heading “other East and Central Africa” comprises routes that are internal to the region (e.g. NBO-Kilimanjaro) as well as routes to airports situated in the DRC, Ethiopia or Sudan which we have to consider differently from an analytical standpoint. Assuming that, after KAA’s statistical department was revived, data collection and processing has been carried out more properly, we may find a more or less acceptable solution with an estimate based on 2004 data for which five months are available. As these five months comprise the period where we have observed a peak in domestic traffic, it is not unreasonable to assume that the estimated full year traffic is the double of these volumes. NBO to/from 2004 est.Entebbe 280 000

East Africa Air Transport Survey – March 2005 Page 9
Dar es Salam 250 000Kigali 75 000Zanzibar 60 000Bujumbura 45 000Other E&C Afr 90 000
This does not yet provide us with a comprehensive picture of the interstate traffic, but it is still possible to estimate traffic volumes on some other routes on the basis of the supply and estimated load factors. This provides the following results: weekly supply
weekly freq.
a/c seat nb one-way both ways
annual supply
est. load factor est. traffic
MBA JRO 5 18 90 180 9 360 0,6 5 616 2 46 92 184 9 568 0,6 5 741 NBO JRO 21 18 378 756 39 312 0,6 23 587 MBA ZNZ 5 18 90 180 9 360 0,6 5 616 2 46 92 184 9 568 0,6 5 741 EBB JRO DAR 7 120 840 1 680 87 360 0,5 43 680 KGL JRO 2 105 210 420 21 840 0,6 13 104
Assuming that 1/3 of the EBB-JRO-DAR international traffic travels on EBB-JRO and 2/3 on EBB-DAR, we come to the following rounded figures: MBA JRO 11 000 NBO JRO 23 000 MBA ZNZ 11 000 EBB JRO 14 000 EBB DAR 29 000 KGL JRO 13 000
It is now possible to establish the regional interstate estimated traffic matrix as follows: 2004 estimates EBB KGL JRO ZNZ DAR
Nairobi 280 000 75 000 23 000 60 000 250 000
Mombasa 11 000 11 000
Entebbe 14 000 29 000
Kigali 13 000 This suggests the following comments:
• Total interstate traffic in East Africa is about 766 000 passengers, that is less than the total aggregated domestic traffic of Kenya and Tanzania, demonstrating a relatively weak level of regional integration.
• The two major regional (interstate) routes in East Africa are Nairobi-Entebbe and Nairobi-Dar es Salaam with traffics in the 250 000 – 300 000 bracket, followed by Nairobi-Kigali and Nairobi-Zanzibar, with volumes in the 60 000 – 75 000 bracket. All other routes have modest volumes below 30 000 passengers.

East Africa Air Transport Survey – March 2005 Page 10
• If we rank the region’s airports by order of decreasing volume of regional traffic, Nairobi comes first, followed by Entebbe and Dar es Salaam:
Nairobi 688 000Entebbe 323 000Dar es Salaam 279 000Kigali 88 000Zanzibar 71 000Kilimanjaro 61 000Mombasa 22 000
The dominance of Nairobi on the interstate market is not just illustrated by the fact that Nairobi ranks first with twice as much as the number two, but also by the fact that, out a regional total of 766 000, 688 000 or almost 90% have an origin or destination in Nairobi.
Dar es Salaam data If we extract from Dar es Salaam airport data those pertaining to African carriers (those likely to carry traffic within the Region in pursuance of the Yamoussoukro Decision), we find the following: DAR - 2004 Departures Arrivals Transit Total Air Tanzania 50 664 47 121 281 98 066 Kenya Airways 47 688 49 698 221 97 607 South African Airways 21 017 24 612 45 629 Ethiopian 14 420 12 717 453 27 590 Precision Air 10 286 13 243 23 529 Air Malawi 5 532 4 585 11 036 21 153 Air Mozambique 4 258 3 765 1 8 024 Departures + Arrivals 309 606 321 598
Kenya Airways traffic can be assumed to be fully with Nairobi. Air Tanzania’s traffic with South Africa can be assumed to be of the same order of magnitude as SA’s, i.e. about 45 000. Air Tanzania then cannot carry more than 40 000 passengers to Nairobi. South African and Air Mozambique do not record transit traffic and are therefore unlikely to have flights continuing to Nairobi. Precision Air operates flights from DAR to NBO via JRO and some of its traffic may be through traffic DAR-NBO. Ethiopian and Air Malawi are the only foreign airlines likely to carry fifth freedom traffic between DAR and NBO. Even assuming that half of the aggregated traffic of Precision Air, Ethiopian and Air Malawi is with Nairobi, it would come to a total of 35 000 passengers. According to these data, traffic between Dar es Salaam and Nairobi should not be in excess of 175 000, compared to 250 000 from Kenyan sources. There can be two interpretations to this apparent discrepancy: either there are 75 000 passengers travelling on charter services (the above table is for scheduled flights only) which would not be consistent with the total number of international non scheduled passengers recorded at DAR (397 arrivals and 394 departures); or the data recorded in Nairobi include a very large number of transit passengers (e.g. Emirates and Swiss record respectively about 80 000 and 25 000 passengers at DAR, who all transit via Nairobi and none of them has, in principle, fifth-freedom rights on the NBO-DAR sector, according to information obtained

East Africa Air Transport Survey – March 2005 Page 11
during the interviews). As there is no conclusive evidence to find out the appropriate solution we shall take an intermediate figure for DAR-NBO traffic at 200 000. 2-3-2 Consolidated regional market (interstate + domestic) Consolidating regional traffic data with those of major domestic routes, results in the matrix table of next page. In the case of Tanzania, as only airport traffics have been provided, traffic on the domestic routes have been reconstructed by “educated guess”, taking into account the supply (obtained from airline schedules) and subject to the condition that the sum of traffics on routes originating or terminating at any given airport be less than or equal to the traffic recorded at that airport. This method of estimate and reconstruction provides an acceptable order of magnitude for the overall interstate plus domestic traffic (i.e. all air traffic carried inside the East Africa region) at about 1 700 000 passengers. Out of this total, about 1 200 000 originate or terminate at Nairobi airport, i.e. close to 75% of the total; Mombasa and Dar es Salaam follow with half a million each and Entebbe ranks third with a little over 300 000. The most heavily trafficked route is NBO-MBA; it also is the route where competition is strongest. The diagram below shows the main interstate routes with their respective traffics, as well as the major domestic routes. The EBB-JRO-DAR and MBA-JRO routes do not appear for the sake of clarity.
NBO
MBA
ZNZ
JRO+ARK
EBB
KGL
470,000
280,000
200,000
75,000
KIS
DAR
90,000
60,000
95,000
MWZ 85,000
45,000
11,000
23,000

East Africa Air Transport Survey – March 2005 Page 12
Domestic and regional traffic matrix (estimates 2004) NBO MBA KIS EBB KGL JRO ZNZ DAR ARK BKZ MYW MWZ
Nairobi 470 000 90 000 280 000 75 000 23 000 60 000 200 000
Mombasa 470 000 11 000 11 000
Kisumu 90 000
Entebbe 280 000 14 000 29 000
Kigali 75 000 13 000
Kilimanjaro 23 000 23 000 14 000 13 000 11 000 35 000 5 000
Zanzibar 60 000 60 000 8 000 130 000 5 000
Dar es Salaam 200 000 29 000 35 000 135 000 25 000 21 000 25 000 85 000
Arusha 7 000 25 000 40 000
Bukoba 21 000 5 000
Mtwara 25 000 5 000
Mwanza 5 000 85 000 40 000 5 000 5 000
Total by airport 1 198 000 553 000 90 000 323 000 88 000 109 000 224 000 550 000 70 000 26 000 30 000 140 000

East Africa Air Transport Survey – March 2005 Page 13
2-4 Continental long and medium-haul markets The continental market comprises four segments:
• North-eastern Africa (mainly Ethiopia and Egypt); • Central and Western Africa; • Southern Africa (all countries south of Tanzania); • Indian Ocean island countries (Seychelles, Comoro and Mauritius).
As for regional traffic, route by route data are available only in Kenya, whereas data by carrier are available for Dar es Salaam and Kigali. This makes it difficult to have a comprehensive view of this market. However, with regards to the importance of Nairobi and Dar es Salaam on the region’s air transport market, it is likely that the available data represent a sizeable proportion of this market. Nairobi data NBO to/from 1999-2000 2000-2001 Jul-Nov 04North-eastern Africa
Addis Ababa 80 414 115 006 62 240Khartoum 22 309Cairo 30 791 52 723 11 974
Central and Western Lagos 44 905 81 936 26 356Kinshasa 17 156Accra 15 041Douala 13 232Other W Afr 6 846
Southern Africa Johannesburg 113 606 196 996 97 739Lusaka 17 838 31 504 32 680Lilongwe 12 552Harare 37 663 59 417 12 034Other S Afr 6 951
Indian Ocean Seychelles 43 836 100 714 7 964Other Indian Ocean 7 167Mauritius 43 482 83 774 6 514
Two routes have traffic in excess of 100 000 passengers, Addis with about 140 000 and Johannesburg with about 220 000 (full year estimates based on 1994 data). Some of the routes show rather erratic data (e.g. Lagos: growing from 45 000 in 1999-2000 to over 80 000 the following year and coming down to 60 000 in 1994). In some cases the explanation may be linked to the fluctuations of the economy in some countries (e.g; Zimbabwe). However, in most cases, it is rather suggested that traffic fluctuations may be linked to supply-side changes (e.g. in the case of Lagos, the collapse of Nigeria Airways, in addition to the opening of direct services to Nigeria by Emirates that challenged Nairobi’s

East Africa Air Transport Survey – March 2005 Page 14
role as a connecting hub between Nigeria and Southern Asia) or to changes in the competitive context (the fall in traffic to Seychelles may be linked to more attractive fares offered between Europe and Seychelles via Dubai which attracted tour-operators who previously used a routing via Nairobi). This is a general consideration in air transport that “sixth freedom” traffic is usually much more sensitive to fare differentials (and changes in scheduling of connections) than “natural” third and fourth freedom traffic. “Sixth freedom” traffic are all the more vulnerable to competition when they are not supported by a high level of third and fourth freedom traffics (and subsequent high level of service) on both sectors. On sectors where two “sixth freedom” carriers compete it may even be more volatile. An example is given by the Nairobi-Addis route where Kenya Airways carried West African and European traffic to Ethiopia as well as Ethiopian Airlines carries West African, European and North American traffic to Kenya. In terms of global geographic distribution, Southern Africa represents nearly half of the continental traffic with a 2004 estimate of 375 000, compared to 220 000 for North-eastern Africa and 180 000 for Central and Western Africa. The strong growth recorded on Lusaka, Lilongwe and “Other Southern Africa” may be linked to the stronger competitive position achieved by the Kenyan carrier on these markets for traffics to and from Europe and Asia. Paradoxically, the economic difficulties experienced in 2002 by Zambia may have helped the Kenyan carrier to achieve a better performance on the route to Lusaka as it had a weakening effect on the Zambian carrier thus improving the competitive position of the routing via Nairobi for long-haul services to Zambia. In other words, if the traffic to a given country falls down below the level that can support competitive direct services, this may benefit indirectly to “sixth-freedom” carriers serving that country. Dar es Salaam data The data for the carriers participating in this category of traffic are as follows: DAR - 2004 Departures Arrivals Transit Total Air Tanzania 50 664 47 121 281 98 066South African Airways 21 017 24 612 45 629Ethiopian 14 420 12 717 453 27 590Air Malawi 5 532 4 585 11 036 21 153Air Mozambique 4 258 3 765 1 8 024 188 691 200 462
Assuming Air Tanzania carried about the same number of passengers as South African on the Johannesburg route, and that 25% of Ethiopian and Air Malawi’s figures are fifth freedom to Nairobi, it comes to the following : South Africa 90 000 Malawi 7 500 Mozambique 8 000 Ethiopia 21 000

East Africa Air Transport Survey – March 2005 Page 15
Kigali Data Assuming (1) the Rwandan carrier has approximately the same traffic as its Burundian and South African counterparts and (2) Ethiopian carries some fifth freedom traffic between KGL and EBB, traffic with the rest of Africa can be estimated at: Burundi 7 500 South Africa 10 000 Ethiopia 7 500 2-5 Intercontinental market East Africa has direct air routes with Europe and Asia. Important changes have affected these two segments over the past few years but they consistently represent altogether higher volumes than regional and domestic traffics. Tanzania and Rwanda do not record traffics route by route, Kenya did not for two years and Uganda does not supply any data. However, it is possible to reconstruct some estimates from diverse sources. This will help grasp a view of the key long-haul traffic patterns of Eastern Africa. 2-5-1 Traffic with Europe Different methods have to be used for each country. Kenya Kenya has two international airports with intercontinental services. In the past, when air transport was heavily regulated, the Government of Kenya had a policy of authorising scheduled services only at NBO and charter services at MBA. This policy has been liberalized but the actual pattern has not changed: scheduled carriers continue to operate to NBO and MBA has mainly charter traffic. Most charter traffic in Mombasa originates from Europe. It is therefore possible to assume that traffic between MBA and Europe is provided by the international charter data. Combining the partial data for Nairobi and Mombasa makes it possible to establish the following table:
1999-2000 2000-2001 2001-2002 2002-2003 Jul-Nov
2004
Nairobi London 298 815 390 856 n.a. n.a. 201 053 Nairobi Amsterdam 228 966 390 590 n.a. n.a. 150 072 Nairobi Bruxelles n.a. n.a. 36 191 Nairobi Zurich 60 780 70 178 n.a. n.a. 25 927
Nairobi Other Europe n.a. n.a. 17 546
Mombasa Europe 360 893 421 973 333 485 400 028 n.a. Total 949 454 1 273 597 333 485 400 028 430 789 MBA only MBA only NBO only

East Africa Air Transport Survey – March 2005 Page 16
Unfortunately, these data are not only incomplete; they may as well be unreliable. The problems met with regional traffic in relation with directional imbalance also exist for intercontinental traffic. In 2000-2001, 49 000 arrival are recorded from Zurich against 20 000 departures; 247 000 arrivals from London against 142 000 departures. Chances are that transit traffic has been included in the arrivals/departures data. The above are then probably overestimated. This may be one of the reasons why NBO airport has not yet reached full saturation whereas recorded traffic is now in excess of design capacity. Traffic growth has been adversely affected by two factors in the past few years:
• the terrorist attacks and the September-11 effect has resulted in a drop of about 25% in tourist traffic to Mombasa, but recovery is underway;
• some of the major international airlines serving Nairobi have suspended their
passenger flights; it was the case in particular with Lufthansa, Alitalia, Austrian Airlines and Air France. According to industry sources, this was not especially linked to the security situation but more to the competitive pressures on airfares which were driven down by the large number of charter flights operating to Mombasa. It may also be, according to the same sources, that internal accounting methods of some airlines for cost allocations may have played a role: the Kenyan market being a destination market, local sales were low, and local offices were not covering their costs. This in turned benefited Kenya Airways and helped the national carrier to strengthen its market penetration. With the Air France-KLM merger (and Alitalia belonging to the same global alliance) it is most likely that the new group will rather rely on the strong competitive position achieved by their partner KLM than come back individually to the Kenyan market. It is assumed that the same will apply with Lufthansa further to its take-over of Swiss International.
British statistics provide the following data: 2002 2003
Heathrow-Nairobi 314 786 283 890
Gatwick-Mombasa 48 306 35 887
Manchester-Mombasa 14 092 5 284
Total Kenya (including other minor routes) 378 941 326 334
(These data are not directly comparable to KAA’s, as the British CAA uses calendar years, as most CAAs do, whereas KAA uses a July-June FY). Rwanda Rwanda does not collect route by route statistics but data by carrier provide a reasonable assessment of the volumes on different routes.

East Africa Air Transport Survey – March 2005 Page 17
KGL 2000 2001 2002 2003 2004 Jan-MarAlliance Express (Rwandair Express as of 2003) 30 799 27 796 22 130 27 360 10 564Sabena (SN Brussels as of 2002) 21 495 19 497 14 066 23 334 5 260Ethiopian 8 145 9 989 12 738 9 378 2 480Kenya Airways 21 939 27 722 42 458 42 587 9 126Uganda Airlines 1 049 Cameroon Airlines 1 784 Air Tanzania 3 079 3 025 417 Air Burundi 5 477 8 019 8 878 9 416 1 860Rwanda Airlines 1 272 4 201 417 Congocom 207 South African Airways 2 331 4 284 4 384 1 330
Total 95 246 102 580 105 388 116 459 30 620
Only one carrier serves Kigali airport from Europe, SN-Brussels with a stop-over in Nairobi (no traffic rights on NBO-KGL, then all SN traffic is with BRU). Traffic between Nairobi and Brussels is recorded at 36 000 passengers over the July-November 2004 period, i.e. about 75 000 to 80 000 for the full year. It is unclear whether this figure is for NBO-BRU point to point traffic alone or includes some of the transit on BRU-KGL. The traffic recorded at Kigali (i.e. about 20 000 with fluctuations from year to year and no clear trend) then represents about 25% of the volume recorded for SN-Brussels at NBO. Uganda Uganda did not provide traffic data. However, traffic to Europe can easily be determined. The only European destination served from Entebbe is the UK, and we can get it from British sources as follows: 2000 43 767 2001 44 701 2002 45 234 2003 52 336 In addition to these volumes of direct traffic, large numbers are carried by the three “sixth-freedom” carriers operating at Entebbe, i.e. Ethiopian, Kenya Airways and Emirates. But this is also the case everywhere. Tanzania The Tanzania Civil Aviation Authority does not collect route by route data and only publishes aggregated data of international traffic, but the Airport Authority collects data by carrier for

East Africa Air Transport Survey – March 2005 Page 18
Dar es Salaam which are very helpful to assess traffic on some routes. It is also possible to give some indications on traffic volumes by reconciling several sources and introducing some assumptions. Let’s start with the easiest case, Zanzibar. Zanzibar Zanzibar is served from Europe by charter flights only. However all international charter flights calling at Zanzibar are not from Europe, as there are some flights from South Africa. We can assume that 80% of non scheduled traffic recorded at ZNZ is with Europe, the remaining 20% being with South Africa and Kenya. This provides the following: ZNZ 2001 2002 2003
Recorded International Non Scheduled 42 633 58 403 44 743 Estimated traffic with Europe 34 100 46 700 35 700
One interesting feature of Zanzibar’s charter traffic is the seasonal distribution, with two clear peaks, one corresponding to the dry season (August-October) and one to the Christmas period (December-January), which also is South Africa’s main school holidays period, with five months (February-June) with no traffic at all: Dar es Salaam Data for international traffic at Dar es Salaam Airport are as follows: DAR 2001 2002 2003
Scheduled 357 320 394 727 459 018Non scheduled 881 878 856Transit 47 108 52 670 52 001
0
1000
2000
3000
4000
5000
6000
7000
8000
9000
Jan Feb Mar Apr May Jun Jul Aug Sep Oct Nov Dec

East Africa Air Transport Survey – March 2005 Page 19
For 2004, we have the detail by carrier as follows: DAR - 2004 Departures Arrivals Transit Total Air Tanzania 50 664 47 121 281 98 066 Kenya Airways 47 688 49 698 221 97 607 KLM 34 666 20 515 29 092 84 273 Emirates 41 052 40 829 114 81 995 South African Airways 21 017 24 612 45 629 British Airways 22 459 22 810 45 269 Oman Air 12 472 12 369 10 892 35 733 Ethiopian 14 420 12 717 453 27 590 Precision Air 10 286 13 243 23 529 Swiss 12 495 10 754 23 249 Air Malawi 5 532 4 585 11 036 21 153 Air India 6 738 6 508 71 13 317 Yemen Air 2 735 2 448 4 278 9 461 Air Mozambique 4 258 3 765 1 8 024 Arrivals + Departures 558 456 614 895
Data for the traffic with the UK are provided by the British CAA as: DAR 2001 2002 2003London 34 014 38 359 40 983
and they reconcile adequately with the TAA source. DAR 2001 2002 2003 2004Total international (Sched+non sched) 358 201 395 605 459 874 558 456Amsterdam 55 181London 45 269Zurich 23 249Total Europe 123 699 It is considered difficult for Dar es Salaam to compete with Nairobi as a connection hub to/from other regional destinations. More South, the major competitor is Johannesburg. DAR’s connection potential for intercontinental destinations is limited to Malawi and, possibly, Mozambique whose international traffic now depends on connections at Johannesburg (with the JNB-MPM route as a bottleneck because of the limited capacities offered by South African Airways and LAM) or Lisbon (MPM-LIS route jointly operated by LAM and TAP-Air Portugal under a code-share agreement, a routing which is not very attractive to traffic with Central and Eastern Europe and the Middle-East, due to the location of Lisbon at the extreme West of Europe). The planned upgrade of air services between Tanzania and Mozambique (now limited to small capacity aircraft) might bring additional business to DAR (especially with the North of Mozambique, where Nampula is a dynamic place of business, at over 2 hours of flight from Maputo). Members of the airline industry also have observed a steady growth of local sales, on line with the country’s economic development and the increase of disposable income among the resident population. They consider this fact a encouraging, as this market is less volatile as the foreign tourist market.
East Africa Air Transport Survey – March 2005 Page 20
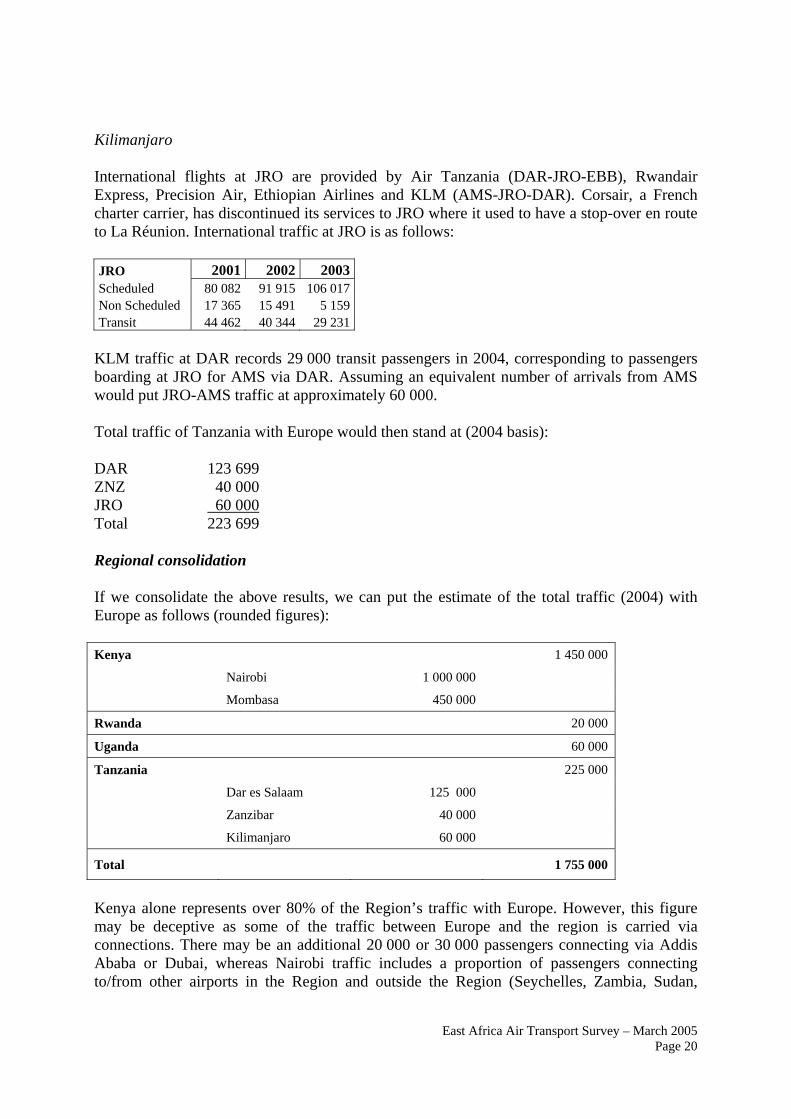
Kilimanjaro International flights at JRO are provided by Air Tanzania (DAR-JRO-EBB), Rwandair Express, Precision Air, Ethiopian Airlines and KLM (AMS-JRO-DAR). Corsair, a French charter carrier, has discontinued its services to JRO where it used to have a stop-over en route to La Réunion. International traffic at JRO is as follows: JRO 2001 2002 2003Scheduled 80 082 91 915 106 017Non Scheduled 17 365 15 491 5 159Transit 44 462 40 344 29 231
KLM traffic at DAR records 29 000 transit passengers in 2004, corresponding to passengers boarding at JRO for AMS via DAR. Assuming an equivalent number of arrivals from AMS would put JRO-AMS traffic at approximately 60 000. Total traffic of Tanzania with Europe would then stand at (2004 basis): DAR 123 699 ZNZ 40 000 JRO 60 000 Total 223 699 Regional consolidation If we consolidate the above results, we can put the estimate of the total traffic (2004) with Europe as follows (rounded figures): Kenya 1 450 000
Nairobi 1 000 000
Mombasa 450 000
Rwanda 20 000
Uganda 60 000
Tanzania 225 000
Dar es Salaam 125 000
Zanzibar 40 000
Kilimanjaro 60 000
Total 1 755 000
Kenya alone represents over 80% of the Region’s traffic with Europe. However, this figure may be deceptive as some of the traffic between Europe and the region is carried via connections. There may be an additional 20 000 or 30 000 passengers connecting via Addis Ababa or Dubai, whereas Nairobi traffic includes a proportion of passengers connecting to/from other airports in the Region and outside the Region (Seychelles, Zambia, Sudan,

East Africa Air Transport Survey – March 2005 Page 21
Malawi). Problems met with the statistics from Kenyan sources also suggest that some transit traffic may be included in the departure/arrival figures and Nairobi traffic may have been overstated. 2-5-3 Traffic with Asia The growth of the traffic with Asia is one of the most remarkable features of the development of air transport in East Africa in the past few years. Kenya statistics provide the following: Nairobi Airport 1999-2000 2000-2001 2004
arr dep arr dep July-
November full year estimate
Bangkok 19 280 46 000
Hong Kong 5 938 15 000
Other East Asia 102
Total East Asia 25 320 61 000
Dubai 80 043 143 393 195 190 101 073 177 077 425 000
Bombay 44 527 48 981 77 150 58 268 85 601 205 000
Jeddah 10 332 17 190 22 862 17 386 14 725 35 000
Abu Dhabi 8 108 19 738 26 182 18 650 13 092 30 000
Other ME 719
Total Middle East 291 214 695 000
Total Asia 756 000
Once again the discrepancy between departure and arrival data, especially for Dubai and Bombay, suggests that transit traffic has been improperly included either in the departure or arrival figures. However, assuming this is the source of the discrepancy, it will help us assess traffic between Dubai and Entebbe as we have no data from Uganda. Based on this assumption, we can estimate that 25% of the recorded traffic on the DXB route is transit to DAR or EBB. Therefore local traffic (NBO-DXB) would stand at about 300 000, whereas 125 000 passengers would be transit en-route to/from EBB or DAR. If we reconcile this with the Dar es Salaam data of 80 000, this volume would leave about 45 000 passengers for EBB. For Dar es Salaam, we have the following data: DAR - 2004 Departures Arrivals Transit Total Emirates 41 052 40 829 114 81 995 Oman Air 12 472 12 369 10 892 35 733 Air India 6 738 6 508 71 13 317 Yemen Air 2 735 2 448 4 278 9 461 arrivals+departures 125 151 140 506
The Region’s traffic with Asia can therefore be reconstructed as:

East Africa Air Transport Survey – March 2005 Page 22
2004 Nairobi Entebbe Dar es Salaam Total Bangkok 46 000 46 000 Hong Kong 15 000 15 000 Other East Asia Total East Asia 61 000 61 000 Dubai 300 000 45 000 82 000 427 000 Bombay 205 000 13 000 218 000 Jeddah 35 000 35 000 Abu Dhabi 30 000 30 000 Oman 25000 25 000 Other ME 5 000 5 000 Total Middle East 570 000 45 000 125 000 740 000 Total Asia 631 000 45 000 125 000 801 000
Once again, Nairobi assumes a dominant position on this market with over 75% of the total. 2-6 Consolidated traffic results The following table shows a consolidation of estimated traffics by country and category. In view of the method used to reconstruct missing data, they should only be considered as orders of magnitude, but as such they are helpful to have a global view of the air transport activity in the Region.
2003/2004 estimates Kenya Rwanda Uganda Tanzania Total by category
Domestic 690 000 525 000 1 215 000 Regional (Interstate) 771 000 88 000 323 000 419 000 800 500 Continental Southern Africa & Indian Ocean islands 420 000 17 500 10 000 106 500 554 000 West & Central Africa 180 000 180 000 North-east Africa 220 000 7 500 15 000 21 000 263 500 Long haul Europe 1 450 000 20 000 60 000 225 000 1 755 000 Middle East & Western Asia 570 000 45 000 125 000 740 000 East Asia 60 000 60 000
Total by country 4 361 000 133 000 453 000 1 421 500 5 568 000
Notes:

East Africa Air Transport Survey – March 2005 Page 23
• total “regional interstate traffic” as shown in the last column is equal to the sum of the
interstate traffics of each country divided by two in order to eliminate double counts (a passenger travelling from country A to country B is recorded twice : once as a departure from A and once as an arrival in B). Therefore the grand total appearing in the last column of the last line is the sum of the column, not the sum of the “totals by country”.
• to obtain more accurate data for continental and long-haul traffics, it is possible to
reconcile the figures obtained with three categories of sources: (1) with data provided by the countries at the other end (as we did for traffics with UK); few countries actually publish detailed route-by-route data and even fewer make them available on line; data published by ICAO can also be helpful for reconciliation, but they are far from comprehensive (countries that do not publish detailed data are usually the same which do not report detailed data to ICAO); (2) for scheduled traffic, it is possible to reconcile traffic estimates with information on the supply as they are provided by OAG, and check whether they correspond to realistic or plausible load factors; (3) the big CRS (Computerised reservation Systems such as Sabre or Galileo) can provide detailed data on scheduled traffic, not just point-to-point traffic but also origin-destination traffic (with follow up of connecting passengers); however this may not be very practical as these data are very expensive to purchase.
In general terms, passenger air traffic in the East Africa Region can be seen as comprising three parts of roughly equivalent volumes:
• traffic inside the Region (domestic + interstate) : 2 015 500 • traffic with Europe: 1 755 000 • and traffic with the rest of the world : 1 797 500, equally divided in two halves: one
half with Asia and the Middle-East and one half with the rest of the African continent. 2-7 Cargo traffic Cargo traffic is an important aspect of air transport in East Africa and has major economic implications in some areas. Cargo traffic is chiefly long-haul. Kenya Nairobi is the main cargo hub in Kenya. A record of all-cargo flights at NBO is as follows: 2001-2002 Arrivals DeparturesMartinair Holland 597 599Lufthansa Cargo 480 481MK Airline Freight 340 347DAS Air Cargo 328 330Air France 235 235Cargolux 129 129Ethiopian Airlines 108 108

East Africa Air Transport Survey – March 2005 Page 24
British Airways 68 68El Al 28 28Others 25 25Total movements 2338 2350 In addition to these all-cargo movements, large volumes are carried in the holds of passenger flights. Although no detailed data by route are available, the two major cargo routes are with Europe and the Gulf. Import freight consists of spare parts and high value manufactured items (especially from Dubai which acts as the major distribution hub for imports from East Asia). Export freight is vital for Kenya’s agriculture, which is one of the world’s major exporters of fresh produce (vegetables to Europe and the Gulf, cut flowers to Europe). Uganda Although no data were obtained from Uganda, cargo traffic also plays an important role in Uganda. Export freight consists of cut flowers (a sizeable greenhouse production takes place in the Entebbe peninsula, taking advantage of the mild climate of Lake Victoria shores and vicinity of the airport). Import cargo consists as usual of high-value manufactured items but the major part of the import cargo is linked with the UN relief operations to Southern Sudan and the eastern provinces of the DRC, for which Entebbe is the main operational hub. This freight consists of logistic equipment (vehicles) and relief supplies (food, medical supplies). This traffic is mostly carried out by Russian and Ukrainian companies contracted by the UN and operating Antonov 124 aircraft. Rwanda Airfreight data for Rwanda are as follows: KGL 2000 2001 2002 2003Cargo flights 127 191 112 111Cargo tons 5 073 6 533 5 561 7 011 Rwanda has an airfreight carrier, Silverback, owning a DC-8 all-cargo aircraft which does not seem to have much activity. Tanzania Airfreight data for Tanzania are as follows: DAR 2001 2002 2003International Loaded 2 178 1 624 1 938Unloaded 8 836 6 309 6 655International all-freight services Loaded 11 4 73Unloaded 2 116 1 832 1 502Domestic Loaded 886 633 547Unloaded 842 825 328Total

East Africa Air Transport Survey – March 2005 Page 25
as computed from above data 14 868 11 227 11 042as per TAA Statistical report 10 615 11 227 11 043 International airfreight at Dar es Salaam is chiefly import and volumes are more or less steady (subject to some discrepancy in 2001). JRO 1999 2000 2001 2002 2003Source : Civil Aviation Authority Loaded 1 498 1 936 1 868Unloaded 962 1 094 917Total 2 460 3 030 2 785Source : KADC Loaded 800 830 1 450 2 000 2 550Unloaded 900 950 1 000 1 050 1 150Total 1 700 1 780 2 450 3 050 3 700 Data from Kilimanjaro Airport Development Company show that export traffic started to grow from 2001 and is now 2.5 times larger than import traffic. Export business is based on fresh produce, some vegetables and mainly cut flowers bound to Europe (especially Amsterdam). However this traffic remains modest compared to the existing potential, due to the fact that direct airfreight from JRO faces a strong competition from Nairobi as most fresh flowers exports are carried by truck to Nairobi airport to take advantage of the lower airfreight rates offered at Nairobi and cheap trucking (agricultural inputs are trucked from Nairobi and large capacity is therefore offered on the return trips). Airfreight at Zanzibar airport is marginal (about 800 tons p.a. mostly import). Mwanza 2001 2002 2003Loaded 613 225 42Unloaded 486 631 494Total 1 099 856 536 Mwanza is the main airfreight hub for the export of fish from Lake Victoria (Nile perch and tilapia). Apparently the above data are not consistent with the size of this business and the large movement of cargo flights that takes place at Mwanza airport. No traffic of all-freight flights is recorded by TCAA and it can be assumed that this category of traffic is either unreported or not properly recorded.

East Africa Air Transport Survey – March 2005 Page 26
2-7 Fare structures Published fares The following tables show a comparison of flight times and airfares on routes from selected international hubs to East Africa destinations and competing destinations: Flight hours (direct flights or fastest connections) US$ LHR AMS JFK HKG DXB JNB SYD NBO DAR JRO EBB JNB BKK DKR Economy lowest published return fares US$ LHR AMS JFK HKG DXB JNB SYD NBO DAR JRO EBB JNB BKK DKR Business class return fares US$ LHR AMS JFK HKG DXB JNB SYD NBO DAR JRO EBB JNB BKK DKR

East Africa Air Transport Survey – March 2005 Page 27
The following table show a sample of published domestic and regional airfares: One-way economy fares MBA EBB KGL JRO DAR ZNZ NBO MBA EBB KGL JRO DAR ZNZ Fare structure and the competitive context Compared to other Regions in the African continent, fares in East Africa appear more moderate, for intra-regional services as well as for long-haul. Two reasons may be mentioned:
• competition is more open on the long haul-market; • traffic is more concentrated (especially on the Nairobi hub) thus generating more
economies of scale. The competitive context deserves more comments. On the long-haul market, especially with Europe, three carriers only can be seen as major competitors: Kenya Airways, KLM and British Airways. However, in view of the strategic partnership between KLM and Kenya Airways, the competitive context can be seen as a duopoly. In the past, several other international airlines used to serve the East Africa region from Europe, namely Lufthansa, Air France and Alitalia. They have discontinued their services, blaming competition on the tourist market for low fares that made their operation unprofitable. Remaining carriers have decided not to try to compete with fares offered by charter flights (especially for tourists travelling to seaside destinations such as Mombasa and Zanzibar) and to concentrate on high contribution traffic (business class and full fare economy). The rationale invoked by some of the local stakeholders in the tourist industry is that, in the competition for tourism traffic, airfare as such is not the full story. Receptive services such as wildlife tours, mountain climbing and safari accommodations at the inland destinations (mostly NBO and JRO) are expensive. Lower airfares alone would not make these tourist products affordable for medium to low income customers as they would only have a marginal impact on the price of comprehensive packages. Medium to high income customers who have a special interest in wildlife, climbing, etc. are less sensitive to prices. In this context, yield maximization is seen by airline executives as a more sensible strategy than fighting for volumes or market shares. However, competition is stronger than it seems at first sight, especially in view of the dynamic offers proposed by the two major “sixth freedom” carriers, Ethiopian and Emirates. Ethiopian is especially strong on the routes to/from North America, with its direct flights to the USA from Addis Ababa. However Emirates increasingly appears as the major challenger to the BA / KQ-KL duopoly, as it has established a strong

East Africa Air Transport Survey – March 2005 Page 28
presence on the European and Asian markets, making Dubai one of the world’s major and fastest growing intercontinental hubs and largest duty-free shopping emporiums. On the domestic markets, both Tanzania and Kenya have experienced a marked strengthening of the competition. In Kenya, British Airways (a Kenyan private company operating under a franchise agreement with British Airways plc) is now a major challenger to Kenya Airways on the NBO-Mombasa route (as well as on some international routes such as to the Sudan, Ethiopia and Djibouti1). Fares have gone down on NBO-MBA, stimulating traffic growth. However, members of the tourist industry still view domestic fares as a hindrance to the development of “combined packages” (seaside stays on the Mombasa coast combined with wildlife tours in the uplands region around Nairobi), as such combined attractions are key to the comparative advantage of Kenya over competing destinations such as the Caribbean. High fares are also an obstacle to the development of domestic tourism, especially to attract members of Nairobi’s affluent communities to coastal resorts for short breaks. In Tanzania, Precision Air, a local carrier operating small aircraft is now serving most domestic destinations and is reported to record more domestic traffic than Air Tanzania. However, the current problems of Air Tanzania which had to scale down its operations do not contribute to a strong competitive context. Freight rates No data are published on freight rates. Any assessment has then to be based on informed opinions collected from industry stakeholders. Freight forwarders and cargo agents in the Region agree that freight rates are relatively high and blame this fact on the lack of competition. This may however be not quite true everywhere (especially in Nairobi) as cargo flights statistics provided by KCAA show a rather large number of cargo operators operating on the market. Five carriers operate on a more or less daily basis and three more have over one service per week. In addition to the all-cargo flights cargo capacity is also offered by scheduled passenger flights. According to freight forwarders, the service on scheduled passenger flights is not as reliable as on all-cargo flights, since airlines must give priority to passengers in case of excessive load, which is not compatible with the requirements of perishable freight. Factors behind East Africa’s fare structure Market size usually is a key factor in the level of fares. Large market volumes are inductive to economies of scale and competition. In the Region, traffic volumes are relatively small except on the international routes to Europe and Dubai and on the domestic MBA-NBO route. On the three major interstate routes, the situation is contrasted:
• on NBO-DAR, the level of competition was suddenly reduced when Air Tanzania withdrew from the route as it could not cope with Kenya Airways in terms of costs and service and Kenya Airways is now in dominant position;
1 British Airways also has flights between JNB and NBO but it is not clear whether they are actually operated by BA’s Kenyan franchisee or by the South African franchisee.

East Africa Air Transport Survey – March 2005 Page 29
• on NBO-EBB, fifth-freedom rights granted to Ethiopian have caused fares to go down; some complaints were even herd that Ethiopian offers “dumping” fares that are causing some damage to Kenya Airways. Whether these complaints are justified or not, this is a good example of the effect on fares and competition of the liberalisation brought by the Yamoussoukro system, and eventually benefiting to consumers;
• on NBO-KGL, Rwandair Express and Kenya Airways operate some flights jointly; it
can be assumed that this cooperation results in some “coordination” of fares and the route cannot therefore be considered as a competitive market.
Other interstate routes such as MBA-ZNZ, NBO-JRO and EBB-JRO-DAR have low traffic volumes and are not likely to be able to support several carriers competing with each other. However, on JRO-NBO, the flights operated by Precision Air (in cooperation with Kenya Airways, their major shareholder), have to face the competition of land transport. Good bus services take about five hours to cover the distance (compared to at least three and a half hours door to door time by air, with check-in terminal transport, not including possible delays); they offer much lower fares (actually the Arusha-Nairobi bus fare is lower than the cost of terminal transport from Arusha to JRO airport, 50 km away). Therefore, bus traffic is many times bigger than air traffic. In a similar manner, ferry services from Dar es Salaam to Zanzibar, although considered to be of poor quality (two to three sailings a day), cost a small fraction of the DAR-ZNZ airfare. Another factor that reflects on fares is the cost of inputs. Fuel is an important component of the cost of air transport. At inland airports, fuel price is increased by the cost of trucking from the refineries situated in the sea ports. This is the case in Nairobi and even more in locations such as Kigali, Entebbe and Kilimanjaro which are situated more inland, with added time for border crossing and smaller volumes handled. In Tanzania, the cost of fuel is also subject to high taxes. In principle, according to the Chicago convention, contracting states are not supposed to levy customs or excise duties as well as VAT on fuel for international aviation. The Government of Tanzania is reported to have circumvented these provisions by imposing high company taxes on fuel distributors. During the 1970-1980, Dar es Salaam used to be a refuelling stop for international carriers; it has now become too expensive and airlines rather refuel elsewhere when they have the option to do it. Infrastructure charges are also said to be high, according to airlines. Kenya Airport Authority dismisses these claims by saying that its charges are comparable to those of other international airports and lower than those charged in neighbouring countries, especially Tanzania. Obviously, on airports with low traffic, fixed costs are spread over low volumes and have to be reflected on the charges. However there may also be “institutional” factors that contribute to increase charges on some airports:
• in Kenya, a single authority is responsible for the country’s main airports. The KAA has to bear the costs of the Eldoret international airport whereas this airport has a limited domestic traffic and no international traffic at all. Supposedly this airport was aimed at serving an agricultural area for the export of fresh produce. It appears that the cost of low-volume airfreight operations at Eldoret would be higher than trucking to Nairobi and taking advantage of the available services at lower cost. In addition, the runway at Eldoret would not allow full load operations because of the altitude. But even though the runway would be extended, it is doubtful that operations there could be competitive. The costs of maintaining and operating Eldoret Airport are then

East Africa Air Transport Survey – March 2005 Page 30
supported by the users of Nairobi and Mombasa airports, which is not in compliance with the recommendations of ICAO regarding the adequacy between the fees collected and the service provided;
• in Zanzibar, the passenger fee collected is paid in to the local government Treasury
and does not accrue to the income of the airport; this is then a “tax”, not a “service charge” (and in any case the service provided can be regarded as being of a very poor quality) and as such, conflicts with the provisions of the Chicago Convention. Understandably, it may be difficult for Tanzania’s central Government to impose obligations resulting from international instruments to the autonomous Zanzibar “Revolutionary Government”. In view of the World Bank’s financing of the extension of the runway at ZNZ, it would be desirable that this issue be addressed.
• in Tanzania, foreign airlines are subject to a “licensing fee” to be authorized to operate
international flights; the fee is paid once a year by scheduled carriers when they submit their annual programmes to CAA, and it can be viewed as just a nominal filing fee; but charter operators who, in principle, do not have a fixed programme, submit applications for each flight and are therefore subject to the “licensing fee” on a repetitive basis, which therefore represents a sizeable cost item.
Load factors on domestic and interstate flights seem to be low on some routes. This is obviously due to the need to provide minimum frequencies on routes where traffic is low. In a liberalised context however, this is a matter in which it is left to each airline to determine its scheduling and pricing policy. 2-8 The regulatory context 2-8-1 Regulatory institutions All four states have enacted legislation aiming at liberalising air transport and setting up a two-level regulatory system. Basically such a system consists of an independent Civil Aviation Authority in charge of regulating air transport (granting of licences, enforcement of technical regulations and monitoring of competition practices) whereas the Government structure retains the formulating of policies through legislation and the negotiation of international agreements, especially BASAs (Bilateral Air Services Agreements). In principle, such structure is aimed at complying with ICAO recommendations towards making Civil Aviation Authorities independent from political interference (especially in the field of the enforcement of technical rules) and separating operators from regulatory bodies. Ideally, this should lead to:
• privatising airlines, to avoid bias in favour of state-owned companies and unfair treatment of others;
• separating airport and ATM operators from Civil Aviation, so as to enable CAAs to exercise their licensing and rule enforcement role without conflicts of interest.
Actually, this separation is not fully achieved in the four countries, but some common observations apply.

East Africa Air Transport Survey – March 2005 Page 31
One of the effects of the separation between regulation and policy-making level is that bodies in charge of policy-making have little contact with practical realities of the air transport sector. Generally speaking, policy-making functions have been vested in air transport units at Transport Ministries. This enabled to appoint officials with little (or sometimes no) aviation experience, who have demonstrated little knowledge of what is going on in their countries’ aviation industry. Discussions at these levels have brought very little useful information, with a few exceptions, and the approach in aviation policy matters appears purely theoretical. There is nothing to blame on individuals who generally do their best, but lack the instruments to be fully informed of the issues at stake. Just to give one example, the negotiation of bilaterals (either new bilaterals or amendments to existing ones) is not just a political or diplomatic exercise, but negotiators should give due regards to the practical interests of their countries’ carriers. Exchanging fifth freedoms is not a formal exercise, as they may not have the same economic value.
In the above diagram, state A grants traffic rights to “B” carriers on AC sector in exchange for obtaining traffic rights on BD for its own carriers. As long as rights are not also obtained on BD from “D” state, the rights obtained from “B” state have no value. If BD is a sector on which strong market dominance is already achieved by “B” and “D” carriers, there are little chances that “A” carriers would be able to make much of their traffic rights. Operating ABD services may also not make much sense for a carrier based in “A” in terms of scheduling, fleet rotation, etc. Assessing all these elements requires a day to day familiarity with air transport issues and a good coordination with the airline industry. All this is more difficult to achieve when the body in charge is disconnected from routine regulatory matters. It appeared in one case that the person met in the Ministry of Transport refused to provide a list of existing BASAs entered by his country, arguing that it was “confidential” (in principle, BASAs must be declared to ICAO, and the ICAO BASA record is open for public consultation). Of course, there is nothing wrong in a Government official withholding information classified as confidential by his Government, but this suggests that, either the official was unaware of the public character of BASAs, or did not want to provide information that could trigger an exchange of views on a matter which he did not feel comfortable to discuss. In another country, it appeared that the person in charge of aviation matters in the Ministry was unaware about the existence or non existence of air carriers in the country, suggesting
A
B
C
D
East Africa Air Transport Survey – March 2005 Page 32
that the CAA does not report much information about its regulatory activity to its supervising authorities. Kenya In Kenya, the flag airline has been privatised years ago, with the Government retaining minority shareholding. The management of the country’s main airports has been entrusted to the Kenya Airport Authority, a statutory body responsible for supporting its operations from its own revenues. KAA is also in charge of the maintenance of other airports, under a service contract paid for by the Government. The Kenya Civil Aviation Authority is in charge of the regulatory functions, as well as the service provider for Air Traffic Control, but ATC services are planned to be established as a separate body in the near future. The policy of the Government of Kenya regarding institutional matters is to eliminate conflicts of interest by separating regulation functions from those of services provider. Recently, the accident investigation unit was removed from KCAA to become part of an independent agency. KCAA and KAA share the same building and have facilities in common. This suggests that the separation between the two bodies still is somewhat theoretical. Some functions (such as air traffic statistics) that are the responsibility of a Civil Aviation Authority, are actually carried out by KCAA (which, in practical terms, is quite appropriate), and do not seem to be supervised by the KCAA (KCAA did not seem to have been concerned by the fact that records of traffic had not been compiled by KAA for two years in a rank). The liberalisation policy has had three consequences: (1) the introduction of competition on domestic routes, with subsequent fare reduction and increase of traffic; (2) the waiver of the specialisation policy that used to reserve NBO for scheduled international traffic and MBA for charter traffic, but few practical consequences have been observed so far in view of the very different profiles of the markets for the two destinations; a further step may possibly be necessary to promote a more even distribution of traffic between the two airports (and provide more convenient international links to the Mombasa business community), such as declaring an open-sky policy in Mombasa, but this is not a decision that can be taken without careful consideration; (3) the Kenya Government is undertaking a revision of the bilateral air services agreements to introduce multidesignation whenever acceptable to the counterpart states. Rwanda Rwanda has separated the policy-making body (Ministry of Infrastructures) and the Civil Aviation Authority. However, the CAA is also in charge of operating and managing Kigali airport. There are no plans to separate regulatory and operational functions. However, in view of the small size of the country and the low volume of operations, such separation may not be practical to achieve. The Civil Aviation Authority was established in 2004 (Loi 21/2004 of 10 August 2004). The CAA has its own inspectors. Rwanda has 30 aircraft on registry. They are maintained in approved workshops in Kenya and South Africa. Airworthiness certificates are issued by the CAA upon the recommendation of an independent certification committee. CAA has a plan for upgrading its organisation, including training additional airworthiness inspectors, and estimates the requirements at about 1.150 million USD, which the CAA cannot afford as it is already in deficit.

East Africa Air Transport Survey – March 2005 Page 33
The Ministry of Infrastructure is not involved in the privatisation process for the national airline and the matter is fully handled by the Board of Directors and the Ministry of Finance. Uganda Uganda has established the Civil Aviation Authority as an autonomous self supporting body in 1991. Current CAA legislation is based on Statute 3, 1994. Policy matters, negotiation of Bilateral Air Services Agreements and monitoring of agencies are the duty of the Division of Air Transport, Directorate of Transport and Communications of the Ministry of Works, Housing and Communications. In addition to its regulatory functions, the CAA provides ATC services (with the Entebbe Air Traffic Control Centre as a delegated sector of the Nairobi ACC), as well as the management and maintenance of 12 airports in Uganda. Major capital outlays are provided by the Government from its general budget, whereas the CAA also maintains smaller airports under a service agreement with the Government. Tanzania In Tanzania, the Civil Aviation Authority has been established as an autonomous statutory body, in charge of regulatory functions as well as of the ATM services. There are three main bodies in charge of airport operation and management: the Tanzania Airports Authority operates Dar es Salaam airport and most domestic airports in the mainland; Kilimanjaro airport is operated by a private company, the Kilimanjaro Airport Development Company Ltd; Zanzibar Airport is a department of the island’s autonomous government. Tanzania has carried out a partial privatisation of the flag carrier, Air Tanzania, with South African Airways as its strategic partner. 2-9-2 International instruments Bilateral Air Services Agreements List to be found from ICAO’s database. Multilateral All four countries are signatories of the Chicago Convention and members of ICAO. They are also members of AFCAC (African Civil Aviation Commission). As members of the African Union, they are bound by the Yamoussoukro Decision on the liberalisation of air transport in Africa. They are members of COMESA. COMESA has taken certain steps towards a more integrated approach to the implementation of the Yamoussoukro Decision. Tanzania is also a member of SADC whose approach to YD implementation is not exactly the same as COMESA’s. In several occasions, double membership has resulted in slowing down the decision process in both forums because of the need for “harmonisation” between the two bodies. However, as the two approaches seem to remain rather theoretical, this did not cause
East Africa Air Transport Survey – March 2005 Page 34
practical difficulties. Tanzania, Uganda and Kenya are members of the East African Community, which has been revived a few years ago. EAC rules are more binding than those of COMESA and SADC and have been more effective in promoting the integration of the markets, including the air transport market. Implementation of the Yamoussoukro Decision The general tone in the four countries seems to be to negotiate revisions of the BASAs with other African states so as to put them in compliance with the principles set by the YD, rather than to wait until the regulatory bodies provided for in the YD are established, as BASAs are felt to be familiar instruments which Governments know how to come along with, especially for handling practical day-to-day matters. However this is more a pragmatic approach rather than an explicitly formulated policy. Difficulties are mentioned regarding the implementation of the YD, especially in designation rules and fifth freedom rights. These difficulties always concern other states (outside the region, especially in West Africa, were Kenya Airways operates several routes). From the airlines’ side, no complaint was expressed about the Region’s Governments and Civil Aviation Authorities regarding their interpretation of the YD.
2-8-6 Government interference Government officials interviewed claimed that they do not interfere with the management and operations of the airlines, even with those where Governments retain shareholding. No complaints were expressed by the airlines in this respect. The real situation may however be slightly different: a company’s strategy is not purely a management matter and the authority to approve a strategy is normally vested in the Board, if not with the shareholders themselves, and there would be nothing wrong in the shareholders expressing their views on strategies, provided that it is done in the appropriate forum (a Board meeting or a General Meeting of shareholders). It is doubtful that Governments, in their capacity of shareholders, would not have their say and it may be that their influence is exercised behind the scene rather than in the statutory meetings. Complaints were heard from the tourism industry, especially regarding fares. There is a desire that Governments should put pressure on airlines to reduce fares and upgrade services (frequencies and capacity). There is nothing unusual in a situation where members of the business community often advocate that state control over their own industries should be abolished whereas it should be strengthened on others. In the specific case, it may also be that the liberalisation culture has not fully penetrated all industries, especially the tourism industry which remains dependent on Government for zoning and building permits, promotion, security, visa issuance policy and sometimes tax exemption and investment permits. 2-8-7 The competitive context

East Africa Air Transport Survey – March 2005 Page 35
Liberalisation policies have lifted legal barriers to market entry in Tanzania and Kenya. In Uganda and Rwanda, the small size of the market remains a barrier to market entry, irrespective of policies introduced by legislation. Liberalisation introduced by the Yamoussoukro system theoretically makes it possible for carriers registered in a member state (and designated by that member state for this purpose) to operate routes between two other member states. However, the provisions of the YD do not concern cabotage rights and are limited to fifth-freedom operations (i.e. the right to carry traffic between two other states as part of a multi-stage flight originating or terminating in the carrier’s own state). Additional liberalisation is being introduced by Comesa and EAC rules, but it is doubtful that this would, at least for the time being, deeply affect traffic patterns and the competitive context. As an example, even in the case a Kenyan flag carrier would have the right to operate EBB-DAR flights without restrictions, the hub-and-spoke strategy certainly makes it more attractive for such a carrier to offer connections via Nairobi to EBB-DAR passengers (thus strengthening its NBO hub and increasing its market shares on EBB-NBO and NBO-DAR) rather than to operate direct flights away from its own base with all the associated problems of fleet and crew rotation, maintenance scheduling, balancing capacities, etc. It can therefore be expected that additional liberalisation measures within the region would not promote much more competition as long as growth has not increased market size to the point where it “naturally” attracts additional competitors. In other words, it does not seem that insufficient liberalisation is now a bottleneck to market entry. It may not be the same for the long distance market, where individual states still retain the possibility to regulate competition through the grant of traffic rights. Introduction of more liberal policies in the issuance of intercontinental traffic rights (especially to Middle-East carriers that would be able to compete for “sixth-freedom” traffic with Europe, or to South Asia carriers for traffic to the Orient) would be likely to increase competition on the corresponding routes.

East Africa Air Transport Survey – March 2005 Page 36
3- Air transport industry 3-1 Kenya airline industry Kenya has two major carriers, Kenya Airways and the Kenyan franchisee of British Airways, as well as a large number of small air taxi and charter carriers operating with aircraft of small capacity. Kenya Airways Kenya Airways (KQ) operates domestic, regional and long-haul routes from its Nairobi hub. The company has been privatised, with KLM of the Netherlands as the strategic partner. Share capital is held as follows (as of January 2005; the company is listed on the Nairobi Stock exchange and shareholding may vary from time to time): KLM: 26% Government of Kenya: 25% Company employees: 4% Foreign private investors: 14% Kenyan private investors: 31% The route system and operating profile are shown in the following tables: Domestic network Route Weekly services Flight Eq.NBO-KIS 9 SF3NBO-LAU-MYD 7 SF3NBO-MYD-LAU 7 SF3NBO-MBA 40 737 Regional routes Route Weekly services Flight Eq.NBO-EBB 28 737NBO-KGL 7 737NBO-BJM 7 737MBA-JRO operated by PW NBO-JRO operated by PW NBO-ZNZ 5 737NBO-ZNZ 2 SF3NBO-ZNZ 7 operated by PW NBO-BJM 3 737NBO-DAR 16 737 Southern Africa Route Weekly services Flight Eq.NBO-LUN-LLW 2 737NBO-LUN-LLW 2 767NBO-LLW 1 777NBO-FBM-LUN 2 737

East Africa Air Transport Survey – March 2005 Page 37
NBO-LUN-HRE 2 737MBA-JNB 1 737NBO-SEZ 2 737NBO-JNB 11 737NBO-JNB 3 767NBO-CPT 3 737
West and Central Africa Route Weekly services Flight Eq.NBO-KIN 4 737NBO-LOS 4 767NBO-NSI-DLA 3 737NBO-ACC-ABJ 2 737NBO-DLA- ABJ 3 737
North-east Africa Route Weekly services Flight Eq.NBO-KRT-CAI 6 737NBO-ADD 2 737NBO-ADD-JIB 2 737 Europe Route Weekly services Flight Eq.NBO-LHR 6 767NBO-LHR 2 777NBO-AMS 5 767NBO-AMS 2 777 Asia Route Weekly services Flight Eq.NBO-BOM 7 767NBO-BKK-HKG 4 767NBO-DXB 7 767NBO-DXB 3 737 The fleet comprises:
Manufacturer Aircraft type Number in fleet Seating arrangement
Year manufactured
Boeing 777-200ER 3 322 (28 J, 294 Y) 2004-2005 Boeing 767-300ER 6 216 (20 J, 196 Y) 1989-2001 Boeing 737-700 4 116 (16 J, 100 Y) 2001-2003 Boeing 737-300 4 116 (16 J, 100 Y) 1997-1999 Boeing 737-200 3 101 (12 J, 89 Y) 1975-1979
Due to traffic growth, the company now achieves a 75% load factor system-wide; expansion of routes creates added strain on the carrier’s capacity and purchase of additional aircraft is underway (10 more in the next five years). After a period when conservative strategies had to

East Africa Air Transport Survey – March 2005 Page 38
be carried out so as to gain financial strength, it is now in a position to carry out more aggressive approaches and a more ambitious revised strategic plan is being adopted. More destinations are to be served, especially in Africa and the Far East. However, KQ is of the opinion that the current traffic growth (about 10% in 2004) includes some catch-up effect after the slump observed in 2001-2003, and that prospects should be viewed cautiously. Future expansion will require the Government of Kenya to negotiate additional BASAs (those with Turkey and China are underway). As KQ’s strategy is based on the NBO hub, airport capacity and performance is essential to its growth. Airport capacity is not yet a bottleneck and current plans for airport expansion should provide enough additional capacity for the next few years. As a hub operator, KQ does not view its relationship with the Kenya Airport Authority as a merely customer-supplier relationship but rather as a partnership. KQ represents 63% of aircraft movements and 55% of available seat capacity at NBO airport. With the merger of KLM and Air France, KQ is now in the process of joining the Skyteam Alliance as an associated partner in the near future. Actually, the code-share agreement with KLM already compelled KQ to upgrade their standards and Skyteam audits are ongoing. Maintenance is mostly carried out in house, with the support of a locally-based Boeing team, including C and D checks. Airworthiness oversight is performed by the KCAA. Regarding the competitive context, KQ does not view Ethiopian Airlines as its main challenger. Ethiopian carries less passengers but carries more cargo and has more RPK, due to its routes to the USA. However, ET is capitalising on the traffic potential represented by the many Ethiopians or persons of Ethiopian origin living in the United States and Europe, and does not need to be aggressive on the Europe-East Africa market to fill their flights. On the West African market, ET and KQ have very different strategies, with ET operating multistage flights with fifth freedom rights, whereas KQ opted for serving a limited number of regional gateways and negotiating agreements with local carriers for feeder traffic to these gateways. The major challenger is Emirates (EK). As an example, as soon as EK started to serve Lagos, the LOS-NBO traffic (much of it being “sixth-freedom” traffic to Asia) dropped dramatically. The Yamoussoukro system is not of much help in this respect, as EK has daily LOS-DXB flights, whereas Nigerian authorities have put a cap at 3/7 on KQ’s frequencies in spite of the liberalisation provisions of the Yamoussoukro Decision. The situation with the West African market may also be affected if the newly established Virgin Nigeria picks up on the continental routes. The main competitive uncertainties arise from the liberalisation of the Indian air transport market. So far, the Government of India has protected Air India on international routes, and Air India has had a rather conservative approach for its African routes, but things may change dramatically if the new and dynamic Indian private sector carriers are successful in obtaining international traffic rights. British Airways As a Kenyan private company operating under a franchise agreement with British Airways plc and under BA flight numbers, it offers domestic flights in Kenya and has achieved a strong competitive position on the NBO-MBA route. BA also flies to regional destinations such as Asmara, Khartoum, Djibouti, Lilongwe and Lusaka.

East Africa Air Transport Survey – March 2005 Page 39
3-2 Tanzania airline industry Tanzania has two major carriers, the formerly state-owned airline Air Tanzania and the privately-owned Precision Air. Air Tanzania Air Tanzania (TC) was established in November 2002 as a successor to the defunct Air Tanzania with two shareholders, South African Airways (49%) and the Government of Tanzania (51%). Debt accumulated by the old Air Tanzania was taken over by the Government. The carrier has a fleet of 4 aircraft, 3 B737-200 (of which one owned and 3 leased through South African Airways) and one F28, and a staff of 250. The use of older aircraft, although less fuel-efficient, is convenient in terms of scheduling, as they do not require tight rotations to absorb depreciation charges and this provides allowance for operational contingencies. Regarding maintenance arrangements, line and “A” checks are performed in-house, the rest of maintenance work being outsourced to South Africa. However, Air Tanzania is facing increasing “hidden costs” with its old aircraft and will have to consider fleet modernisation alongside with South African Airways’ phasing out of its B-737. It serves 4 domestic destinations (Mwanza, Mtwara, Kilimanjaro and Zanzibar) with 49 weekly frequencies, and 4 international destinations (Johannesburg, Nairobi, Entebbe and the Comoros) with 19 weekly frequencies, for a total of 217,000 passengers flown. However, the Nairobi route was suspended due to Air Tanzania’s difficulties in competing with the market dominance achieved by Kenya Airways, whereas the yield on domestic routes remains very low due to the competition with land transport. Air transport only has a small share of domestic transport and the market is very volatile. Regional yields are better, especially on the JNB route where the is a de facto monopoly of the TC-SA partnership. For its first period of operations (December 2002 to March 2004) the company recorded 36 billion TZS of traffic revenues and 39.6 billion TZS of total revenue, and an operating loss of 8.7 billion TZS (1,050 TZS = US$ 1). As South African Airways (SA) invested about 20 million USD (10 million payment to the Government in respect of goodwill and 10 million in respect of new shares issued), the loss represents nearly half the amount invested by the foreign partner after one year of operations. The company estimates that much of the extra costs incurred in 2002-2004 are non recurrent as they were linked to restructuring, training and strengthening of human resources. Some industry observers are doubtful about the possibility for SA to achieve its strategic objective to build up a strong and sustainable position on the East African market through its investment in Air Tanzania. Tanzania air transport market is still small but steadily growing and Air Tanzania posts ambitious objectives for expansion with new routes to London, Dubai and regional destinations. However, in view of the outcome of the first two years of operations, it is doubtful that these objectives can be achieved without a major new influx of equity capital which the private shareholder may be reluctant to provide for the time being. Air Tanzania’s

East Africa Air Transport Survey – March 2005 Page 40
problems illustrate how difficult it can be to make a company competitive after downsizing it and changing its status from a state-owned protected enterprise to a commercially-oriented operation. Precision Air Precision Air (PW) is a privately owned company, with Kenya Airways as its strategic partner. Kenya Airways purchased 49% of the shares in 2003, whereas a Tanzanian private investor (Mr Shirimu) holds 51%. The company started as an agricultural air-spraying operation, also operating charter services to the National Parks on behalf of the defunct East Africa Airways. It has operated as a scheduled air carrier for 4 years. Precision Air has a small fleet of 3 ATR-42, one ATR-72, four Let-410 and one Cessna 208 Caravan. The company plans to purchase two more ATR-72 as well as phasing out the Let-410 to reduce the costs of operating a mixed fleet. It might also introduce a B-737 for route expansion. It serves more domestic destinations (15) than Air Tanzania (4), as well as some international routes such as ZNZ-MBA, JRO-MBA and JRO-NBO. International routes are operated under code-sharing arrangements with Kenya Airways, and flights are scheduled so as to connect with KQ’s regional and long-haul flights, thus contributing to strengthen KQ as a sixth-freedom carriers as well as Nairobi as the major regional hub. On the domestic market, PW has carried a larger number of passengers than Air Tanzania and is experiencing a sustained growth. Plans for expanding the network include Johannesburg, Dubai, India and West Africa. To support its growth, the company estimates that it needs investments in training, especially to keep up with the planned upgrading of its partner’s standards of services when it joins the Skyteam alliance. Regarding infrastructure and associated services, Precision Air mentioned two problems:
• most domestic airports do not have asphalt runways, which results in high maintenance costs for the undercarriage of aircraft;
• the Government is reluctant to allow self handling by airlines or introducing competition in the ground handling business.
Others Other air carriers operate local flights on selected routes (e.g. between Zanzibar and Pemba) and charter flights. One hot air balloon is registered (Serengeti Balloons) and provides charter flights in the Serengeti National Park area. 3-3 Rwanda airline industry Rwanda has a flag carrier, Rwandair Express, a mixed company (77% shares held by the Government and 23% by private investors). The Government is currently looking for more private participation. The company operates one MD-82 and is considering expanding its fleet with one 120+ seat twin jet and one ATR type twin turbo prop, so as to cope with traffic growth on existing routes and open new routes. Rwandair’s objective is to build a niche rather than competing with major airlines on the regional market. There is a promising potential in

East Africa Air Transport Survey – March 2005 Page 41
the eastern provinces of the DRC, for which KGL already serves as a gateway: transfers are now done by land but could be done by feeder air routes as soon as the security situation improves (the ATR is specifically aimed at serving these routes). Rwandans also travel in increasing numbers, in spite of the high fares (1,500 € round-trip for BRU-KGL whereas BRU-NBO can be purchased as low as 450 €). Rwandair has no plans to expand beyond the region, and is prepared to negotiate its traffic rights to its foreign counterparts. There is also a cargo operator, Silverback. 3-4 Air carriers based outside the Region Ethiopian Airlines Ethiopian (ET) is the continent’s and one of the world’s oldest airlines, with over sixty years of existence. ET operates a comprehensive domestic network as well as regional, continental and intercontinental routes. Actually, ET pioneered the “sixth-freedom” carrier concept in Africa, with routes to West and Central Africa (ABJ 3/7; ACC 4/7; BKO 4/7; BZV 2/7; DLA 2/7; FIH 3/7; LOS 10/7; LFW 3/7; LAD 1/7; NDJ 2/7) connecting to its flights to Asia and the Middle-East (BKK 5/7; BJS 2/7; BEY 3/7; DEL 2/7; DXB 10/7; CAN 2/7; HKG 3/7; JED 3/7; BOM 4/7; TLV 4/7) through its Addis Ababa hub, and has been on this particular market for a longer time than Kenya Airways. The fast growth of Emirates and its penetration on the West African and Eastern African markets are now increasingly challenging this traditional business of Ethiopian’s. In the East Africa region, ET flies to NBO (13/7); EBB (7/7); JRO (3/7); KGL (3/7); DAR (7/7) and BJM (3/7). It operates fifth-freedom rights on regional routes, especially on NBO-EBB and NBO-DAR. Some members of the Region’s airline industry view ET as “a sleeping giant” with a huge development potential, especially as Eastern Africa’s only carrier with routes to North America (IAD 3/7). Although not yet a major challenger on the European routes (AMS 2/7; FRA 3/7; LHR 5/7; CDG 2/7; FCO 8/7), ET is said by other airlines to have a destabilising impact, offering very low fares (US$ 399 round-trip from East Africa to Europe). South African Airways South African Airways (SA) is the continent’s biggest airline and Africa’s only global carrier with routes to Europe, Asia, North and South America, and Australasia. Since South Africa normalised its political relation with other African states in the mid-nineties, SA has opened routes to many sub-Saharan destinations and has undertaken to promote Johannesburg as the major African hub airport. However, due to the situation of JNB at the extreme South of the continent, its dominance as an intercontinental hub is limited to destinations located South of a Dar es Salaam – Kinshasa line, except for connexions to South America and Australasia. Recent problems met by SA in its financial policies in relation with the quick increase in the rate of exchange of the Rand have limited its growth in 2004. SA’s strategic investment in Air Tanzania has not so far been successful in securing a role as a hub operator in East Africa’s regional traffic, partly because of Air Tanzania’s weak competitive position and partly because of DAR’s location at the Region’s south-east tip. On the Regional scene, SA capitalises on (1) the development of business links with the Region, as illustrated by the
East Africa Air Transport Survey – March 2005 Page 42
strong positions achieved by South African firms in the tourism, manufacturing, retailing and services industries of East Africa countries; (2) tourism traffic driven by South Africa’s appeal for wealthy residents of East Africa as well as East Africa’s appeal for South African tourists. SA has recently opted for membership in Star Alliance, the largest airline alliance group led by Lufthansa and United Airlines. Emirates Emirates Airlines (EK) is based in Dubai and has emerged as one the world’s most dynamic and fastest expanding air carriers, with a modern all-wide-body fleet, becoming the archetypal global “sixth-freedom” operator. The initial development of Emirates benefited from the financial backing of Dubai Government as part of its aggressive policy of making the Gulf city a major trading and services centre, so as to prepare for the future depletion of oil resources. However, the airline claims that it has now fully self-supporting. The role of Dubai as the major transhipment hub for manufactured goods between Asia and the Middle-East / Africa region supports a large business traffic, especially with Africa. EK is heavily patronized by the numerous and active African trading community travelling to transact import-export business in Dubai: as an example, EK’s traffic at DAR is 20% destination, 80% origin (including many passengers connecting from ZNZ and the Comoros). EK is now increasingly successful on the tourism market, with attractive pricing and efficient connections. On East African routes, EK quickly outperformed Gulf Air (a multinational company of Qatar, Bahrain, UAE and Oman) whose schedules were not appropriate to the requirements of the market. Gulf Air eventually pulled out. Emirates now operate two daily flights to the Region, DXB-NBO-EBB and DXB-NBO-DAR. Dar and Entebbe alone would not provide enough volume to support daily services, which is considered by EK as a requirement to effectively compete for connecting traffic. This is the reason why both destinations are served via an intermediate stop at Nairobi. Nairobi airport is also used the main logistics base (e.g. storage of spare parts). Emirates new routes to West Africa also are a challenge to Kenya Airways’ connecting traffic between West Africa and Asia. Emirate’s network expansion with the introduction of new destinations such as Oslo, Beijing, Geneva, Hamburg, and Seychelles, will attract its appeal as a “sixth-freedom” carrier on the European as well as on the African markets. In terms of future developments, EK is also looking at opportunities such as Zanzibar, which might become attractive for a scheduled carrier if the airport facilities are improved, especially for traffic originating from Spain and Germany. As Tanzania is the most dynamic market, with faster growth than NBO and EBB, further increase in the frequency to DAR might be considered in the future, but only in conjunction with another destination. Emirate’s ambition is to build up as a global carrier of its own, and is not currently considering joining any of the global alliances. Its short-term plans for fleet expansion comprise the acquisition of 15 additional B-777-ER and the introduction of the A-380 in 2006. British Airways

East Africa Air Transport Survey – March 2005 Page 43
British Airways (BA) has been present on the East African market ever since the company was established as Imperial Airways, and later on, as BOAC. One the world’s major airlines (actually the world’s biggest in terms of international traffic), it operates three long haul routes to the Region, LHR-NBO (10 weekly frequencies, 7 with B-747 and 3 with B-767), NBO-DAR (3 weekly frequencies with B-767) and NBO-EBB. For BA, only NBO is a volume market. It even had to suspend its services to DAR for a few years because of insufficient traffic and resumed in 2002. Due to the competition of charter flight operators between the UK and the Region, BA tends to give priority to business traffic and yield maximization rather than to try to compete with low fares for tourism traffic. For British Airways, East Africa is chiefly a destination market, with a large proportion of “missionary” traffic (NGOs and international agencies). British Airways has also developed a franchise policy, with two franchisees, one in Kenya and one in South Africa. BA’s South African franchisee flies domestic routes in South Africa, as well as international routes between Johannesburg and destinations in Southern and Eastern Africa. Together with BA proper, they offer a relatively dense coverage of the two Regions, connecting with BA’s long haul flights. BA also gives priority to achieving economies of scale by concentrating its operations to the three airports of NBO, DAR and EBB rather than to expand its network to places such as Kilimanjaro, in spite of the potential of the destination. Some members of the tourism trade however expressed the view that BA might as well be willing to operate at JRO but has so far been unable to secure traffic rights from the Government of Tanzania. British Airways is a leading member of the One World global alliance with American Airlines. KLM KLM (KL) also has a long-time presence in East Africa. However, KL’s profile on the East African market is different from BA’s. KLM’s business does not rely on historic ties with the Region’s countries and operates chiefly as a “sixth-freedom” carrier. More outbound passengers travel to other destinations than to the Netherlands, while inbound traffic comes more from other European countries and North America than from the Netherlands. The recent merger between KLM and Air France and its integration in the Skyteam alliance have strengthened KL’s “sixth-freedom” line of business on the East African market. Since the merger became effective, an increase has been observed in traffic connecting between KL’s East African routes and destinations served by Air France. Another Skyteam partner, Continental Airlines is considering introducing services between EWR and LOS, thus providing additional connection opportunities to Kenya Airways’ traffic on the NBO-LOS route. Although the Dutch market has one of the highest per capita long haul travel rates and strong tour operators, KLM does not aggressively compete for the low-fare leisure business on its East African routes and prefers to concentrate on the major traffic “pipe-lines” and on yield maximization, leaving the leisure market to charter operators, such as Martinair. KLM also is one of the leading air cargo operators. The Dutch carrier operates two routes in the Region, AMS-NBO-AMS and AMS-JRO-DAR-AMS, the latter being flown as a “triangle” (the flight does not stop at JRO on the return flight and passengers boarding at JRO for AMS stop in

East Africa Air Transport Survey – March 2005 Page 44
DAR). Market profile is different in the three airports served by KLM. JRO is chiefly a destination market, whereas the bulk of outbound traffic is in NBO and DAR. KLM has a special role in the Region’s air transport industry as a shareholder and strategic partner of Kenya Airways (thus indirectly participating in the shareholding of Tanzania’s Precision Air). KL’s well established “hub-and-spoke” culture based on the Amsterdam hub is often mentioned as a key factor in helping Kenya Airways establish its own hub operations in Nairobi. A sizeable proportion of KLM’s traffic in Nairobi is connecting to/from regional destinations such as EBB, KGL or ZNZ, thus strengthening Kenya Airway’s regional role. KL is represented on KQ’s Board of Directors by high ranking executives, thus demonstrating the high level of interest arisen in KLM by its partnership with KQ. KLM has a right of veto in KQ’s Board, but does not interfere in the company’s management. Others Other carriers operating on the Region’s market on a sizeable scale are: Air India, SN-Brussels and Swiss International. Swiss and its predecessor company, Swissair, have been present in the Region since 1968. Swiis operates three weekly frequencies ZRH-NBO-DAR with Airbus A330-200. After two bad years in 2002 and 2003, traffic has recovered on both destinations in 2004 and the prospects are good, especially for Tanzania with a 12% growth in tourism. For Swiss, East Africa is chiefly a destination market. Freight traffic is also important, with consumer goods on the import side and vegetables and live animals on the export side. Air France and Lufthansa, although not operating passenger flights have a sizeable cargo operation, with daily all-freight B-747 flights in Nairobi. Another all-cargo operator having a regular business in the Region is DAS. Overview No single carrier has an overall dominance on the East African market. However, it appears that, in view of Kenya Airways’ leading role on the regional interstate market and its participation in the Tanzanian domestic market through its affiliate Precision Air, there is a clear leadership of the KLM-Kenya Airways partnership over the Region’s air transport business. The two challengers are Emirates and British Airways. So far, South African’s attempts to establish itself as a major contender on the East African market have not been successful. 3-5 Infrastructure operators Two categories of infrastructure operators are involved in air transport: ATM service providers and airport operators.

East Africa Air Transport Survey – March 2005 Page 45
3-5-1 ATM services The Region is divided into two areas: the Nairobi FIR (Flight Information Region) and the Dar es Salaam FIR. The lower airspaces (i.e. below Flight Level 260 in Uganda and FL 240 in Rwanda, that is up to 26,000 feet or 24,000 feet over the 1,013 millibar mark) of Uganda and Rwanda are managed respectively by the Entebbe and Kigali air traffic centres as “delegated sectors” of the Nairobi FIR and Dar es Salaam FIR. In the four countries ATM services are provided by a specialised department of the Civil Aviation Authority. The CAAs also provide approach and aerodrome control on major airports, as well as AFIS (Aerodrome Flight Information Services) on some secondary airports. No problems of airspace saturation were mentioned in the four countries, although the authorities in charge of Zanzibar airport expressed some complaints about the fact that ZNZ approach is handled from the Dar es Salaam ACC. This however should not be a serious concern as it is a quite classical method to provide a common approach control for two airports when they are close to each other. Plans for upgrading ATM services involve institutional as well as technical issues. In technical terms, the volume of flight operations remains relatively low in the Region and the unification of upper space (i.e. over FL 260) might bring sizeable economies of scale and added efficiency. The establishment of a single Upper Space ACC for the East African Community is considered as a long term prospect but there are some political problems to be resolved by the participating countries before the plan can proceed to implementation. In the case of Tanzania, it also conflicts with the current plans to establish a single upper space ACC for SADC, of which Tanzania is also a member. The problem is not however purely of a diplomatic nature, because upper space ATM services are usually quite profitable compared to lower space services. Actually, revenue from overflights is often used to cross-subsidy facilities and services used by low-volume local traffic in the lower airspace. Whereas it would be easy to establish profitable commercially operated ATM entities in charge of upper space, there is a risk that this would leave the participating states with the responsibility of providing unprofitable lower space services. Establishing a multinational commercially-based entity in charge of upper space ATM services to Civil Aviation may also conflict with the matter of coordination between civilian and military flights, which most states are not prepared to relinquish to such an entity. Tanzania’s project launched in 2001 for the modernisation of its ATM system also arose controversy because some critics claimed that it was oversized in view of the needs of civil aviation and might include some components that would be chiefly useful to military operations, thus bringing the suspicion that users’ charges levied from commercial air carriers might be used to cross-subsidy Air Force activity. No information was obtained during the mission to substantiate whether these claims were relevant or not. In any case, all future plans for ATM services upgrading should be reviewed for consistency with the future technological evolutions in CNS-ATM. One example is provided by Kenya’s project of establishing GPS approaches for its secondary airports, a sensible and cost-effective

East Africa Air Transport Survey – March 2005 Page 46
method for improving operational conditions at airports where ground-based navigational aids would be too costly in view of the volume of traffic. As ATM services are part of the Civil Aviation Authorities in the four countries, there is an important issue involved in their planned separation from the CAAs. CAAs have generally achieved financial autonomy through the revenue generated by Air Traffic Control service charges, which contribute to the CAA’s overheads and possibly cross-subsidy some of the regulatory functions. It the CAAs are to lose this source of revenue, it is estimated that it will be difficult for them to remain self-supporting, as the revenue generated by their other activities (licensing fees, issuance of airworthiness certificates) may not be sufficient to support their operations. Potential for increase in these revenues is limited because of the relatively low volume of civil aviation activity (except maybe in Kenya), unless prohibitive rates are fixed, which would be detrimental to the growth and competitiveness of the sector. Any plan for further institutional evolution should therefore be reviewed in the light of a thorough assessment of the financial sustainability of the future “downsized” CAAs. 3-5-2 Airport operators Of the four countries, Tanzania is the only one where the private sector is involved in airport operation. As mentioned earlier, Rwanda and Uganda have entrusted the operation and management of their airports to the Civil Aviation Authority, whereas Kenya and Tanzania have set up specialised entities to that effect. Kenya Airport Authority KAA is established as a statutory body in charge of the investments, operation and management for the country’s major airports. The existing facilities at Nairobi Jomo Kenyatta International Airport were commissioned in 1978 with a nominal capacity of 2.5 million passengers p.a.; which is now exceeded by actual traffic (although the analysis of statistics suggested, as mentioned earlier, that actual traffic may be overestimated). Airside capacity is estimated at 80,000 aircraft movements p.a. versus an actual traffic of 55,000 movements. Facilities include:
• one 4,200 metre runway ; • 200,000 m² apron, with 11 international and 9 domestic stands; • passenger terminal with 58,000 m² floor area; • a cargo apron with 4 wide-body stands and two cargo terminals; • car park for 1,200 vehicles.
Generally speaking, the users (airlines) are relatively satisfied with the services offered and schedules of charges of the KAA. The concerns expressed pertain to:
• near-saturation of terminal facilities during peak hours; this applies to NBO as well as to MBA, especially because of the high peak factor associated with charter flights operations, which are constrained by marketing considerations (week-end peaks) and

East Africa Air Transport Survey – March 2005 Page 47
curfew or slot limitations at the flights’ other end; at MBA, the most critical problem seems to be the parking of the tour operators’ buses on the landside.
• handling of connections (especially international/domestic) at NBO; this indeed applies chiefly to KQ’s operations and is an obstacle to the development of Nairobi as a hub; some of the first-class lounges are situated in the “arrivals” building, at a large distance (10 minutes walking time) from the boarding gates.
• pricing problems (especially for dedicated facilities such as check-in and transfer counters: should charges be based on allocation or on effective use, as this has different implications for carriers with high frequencies and those with only one or two flights daily);
• lack of loading bridges. Security is also a problem, as the airport configuration was designed at a time when security considerations were not paramount. The strict security measures now enforced at NBO (with up to three or four successive security screenings) are accommodated at the cost of a serious hindrance to the efficient flow of passengers during peak hours. KAA’s investment plans include:
• the upgrading and expansion of Nairobi airport; • the upgrading of MBA airport; facilities are still able to cope with more traffic, but
might become saturated if the upturn in tourism traffic is confirmed; • the upgrading of Kusumi airport, with improvement of the runway and construction of
a new terminal, in view of the contemplated developments of tourism activity in the Lake Victoria area;
• runway expansion at Eldoret to make the airport functional for direct intercontinental cargo flights; however, the prospects of attracting economically viable operations are weak;
• security improvements at Nairobi’s Wilson airport (several operators have their own landside access);
• development of Meru airport for cargo flights carrying agricultural produce to Djibouti and Somalia.
At NBO airport, the most critical immediate capacity constraints concern the apron (the number of aircraft stands already being insufficient for peak hour requirements) and the apron-gate system (lack of loading bridges). Additional car park space is also needed. KAA also mentions a lack of commercial space. However, there is a very large number of shopping concessions which do not seem to be operating at their maximum capacity. If sales volumes and revenue to the Airport Authority remain modest, the global impression is rather that it may actually be caused by a lack of diversification (most shopping concessions offer the same lines of goods) and weak dynamics; this may be linked more to an inappropriate policy for granting concessions rather than to a lack of shopping space. In the first phase, expansion would involve transferring domestic flights to the old Embakasi terminal whereas the current domestic unit would be converted to international. Embakasi is located on the opposite side of the runway and is now part of the area allocated to the Kenya Air Force; it had been phased out when the present terminal was commissioned. This alternative is considered inappropriate by the airlines and a source of additional costs and delays in the handling of traffic and technical operations, which could be a major setback to NBO’s ambition to develop as a hub.

East Africa Air Transport Survey – March 2005 Page 48
With an area of 4,674 hectares, land availability is not a constraint on the airport’s future development (subject to appropriate land use planning and good coordination with the Air Force regarding land allocation matters). Tanzania Airports Authority TAA manages Dar es Salaam and the major domestic airports in “mainland” Tanzania, maintaining a total of 62 airports in Tanzania. Dar es Salaam airport has experienced impressive growth in the past three years, with a traffic of 1 million passengers in 2004, compared to 600,000 in 2002 and 800,000 in 2003. Cargo traffic has increased 17% and aircraft movements 11%. However it is not yet faced with saturation problems, although its configuration is not very efficient for the handling of traffic at peak hours. Complaints have however been recorded from members of the tourist industry regarding the operational and maintenance status of the facilities (unreliable water supply, insufficient staffing of immigration facilities, loading bridges not working). Complaints also have been recorded regarding the fact that not all the officers of the Airport Authority and law-enforcement agencies are uniformed, thus creating confusion. The Airport Authority does not allow airlines to install their own data processing systems, thus preventing them from using e-ticketing. There is an ongoing project for installing a CUT system (Common User Terminal) that will resolve the problem, but the project is too slow in implementation. In summary, improvement of the services is felt more urgent than size expansion. There are no plans for privatisation of the airport authority, but private investment is encouraged in the construction of hotels, maintenance workshops and commercial facilities (such as in-flight catering) on the airports, preferably through private/public partnership or BOT arrangements. TAA has a three-year rolling strategic plan and annual business plans. Airport master planning involves other Government agencies for consistency with environmental constraints. Plans for investments on airports are summarized in the following table: Airport Description Amount
(USD million)
Status
Dar es Salaam Pavement rehabilitation (apron, taxiway and RWY) Electrical/mechanical works Apron rehab. at Terminal 1 Extension of parallel taxiway Security equipment Air-con rehabilitation Terminal 2 rehab. and extension
64.0 Funding obtained from the Netherlands Government for pavement works (22 M€, eq. to 27.9 M USD
Arusha RWY and apron rehab + extension Safety and security improvements
8.7
Lake Manyara RWY, apron, roadwork Construction of terminal bdg
4.5
Mwanza New apron Safety and security improvements
12.0
Mafia RWY, apron and taxiway rehab. Construction of control tower Safety and security improvements
6.6

East Africa Air Transport Survey – March 2005 Page 49
Moshi RWY and terminal bdg. rehab. Security improvements
3.6
Zanzibar RWY rehab. + extension Apron rehab. Security improvements Construction of new terminal bdg.
14.8 10 M USD funding obtained from WB/IDA for runway rehab. and extension; construction work ongoing
Tabora RWY, taxiway and apron rehab. 5.6 Songwe Construction of a new airport (RWY,
taxiway, apron, terminal bdg, control tower, RFFS, navaids
18.1
Sumbawanga Pavements and bdg. rehab. 0.1 Mtwara Apron rehab. + extension
Construction of new terminal bdg. 4.5
Bukoba RWY rehab. + extension Terminal and other bdgs. rehab. Emergency services improvement
7.8
Total estimated cost of the programme amounts to 150.3 million US Dollars, of which 38 million are already funded. It is doubtful that the remaining 112 million can be funded in the next few years and the Tanzania will certainly need to prioritise the projects to select those to be implemented first. Another alternative may be to review the project objectives with due consideration to the level of service required. Problems considered by TAA as the most urgent are: peak hour congestion at DAR (a maximum of 3 international flights can be handled simultaneously and it would be difficult to relieve congestion by flight rescheduling because of the scheduling constraints of international carriers: slots, curfew, connections); congestion at Mwanza airport, with the high volume of cargo operations for the export of fish from Lake Victoria; the inadequate standard of Mafia airport in view of developing tourism on the island. A security audit is due to be carried out by ICAO next June. Improvements will certainly by needed and they are reviewed in liaison with the Government. There is a security operational plan, and a security master plan is under study. TAA’s turnover is 18 billion TZS (approx. 17 M USD) and Dar es Salaam airport provides 80% of TAA’s total revenue. Proceeds of the passenger service charge are shared between TAA (80%), CAA (10%, chiefly for security costs) and the Government (10%). Foreign carriers complain about the rates, especially because they feel that airport charges paid at DAR may partly be used to cross-subsidy costs incurred at domestic airports and because they have to pay in USD whereas local carriers pay in TZS. Kilimanjaro Airport Development Company Ltd KADC is not just in charge of operating and managing JRO airport. Its assignment also comprises the development of economic activities on the airport’s massive land endowment of 102 km². The airport was commissioned in 1971. The initial impression that it was built “in the middle of nowhere” results from the considerations developed in the initial feasibility study that it should serve the two towns of Arusha (48 km West) and Moshi (35 km East). Flight safety issues were also involved (to keep clear from the two high spots of Mt Kilimanjaro and Mt

East Africa Air Transport Survey – March 2005 Page 50
Meru). The objective was to support tourism in the area and to serve the headquarters of the East African Community. JRO was supposed to become the major maintenance base for East African Airways and a huge aviation hangar was built to house the airline’s workshop. The EAC collapsed in 1977, East African Airways was split between participating states and the economic policies pursued by Tanzania were a major obstacle to development, including for tourism. Foreign air carriers such as BA, SN and ET pulled out and the airport became underutilised, a “white elephant”. The towns of Arusha and Moshi developed their own airfields. Moshi is now abandoned, but Arusha is still active and investment is continuing. Policies changed in 1990 and tourism improved. The airport needed rehabilitation. A World Bank loan of 10 million USD was negotiated in 1994 to resurface the runway. The European Investment Bank financed the navaids (ILS and beacon), the control tower and refurbishment of the terminal. In 1998 a concession was granted to KADC to operate and manage the airport. KADC is a private company incorporated in Tanzania, and its share capital is held as follows: Mot McDonald (a UK engineering firm): 42% SA Infrastructure Bank: 30% Interconsult: 4% Government of Tanzania: 24% The duration of the concession is 25 years. TAA is the landlord and retains the right of approval of the master plan and investments done on the airport. KADC pays a concession fee and a lease for the airport estate and participates in some investments (10% of the runway resurfacing). KADC is also responsible for maintenance and replacement. Although the company is economically sustainable, the airport cannot be viewed as self-supporting as Government grants are needed to fund the major investments (50% for power distribution, etc.). So far, the company has built a hotel (80 beds in first phase) and has undertaken some projects such as a golf course and an Export Processing Zone. Cold storage facilities were built by the ground handling company, Dahco, for the export of cut flowers. One of KADC’s challenges is to find a profitable use for the massive maintenance hangar inherited from the defunct East African Airways. The airport is served by several scheduled airlines (Air Tanzania, Precision Air, Ethiopian, KLM and now Rwandair Express) and by charter carriers (Condor). British Airways pulled out in 1980, but is selling a lot in Arusha. French charter operator Corsair also served JRO as an intermediate stop en route to/from La Réunion and was selling the destination both in France and in Réunion, but pulled out in 2002 after it was taken-over by the German tour operator TUI. One major problem facing the development of traffic at RJO is the competition of land transport on the NBO-JRO route, for freight as well as for passengers. Bus fares (by modern buses at international standard) for Arusha-Nairobi are just a fraction of the airfare, and buses stop at Nairobi airport on their way to downtown Nairobi, thus competing even on the connecting traffic flying to/from other destinations. Due to the competition on NBO’s freight market, freight rates are lower and the differential easily absorbs the extra cost of haulage to Nairobi airport. Freight mainly consists of export of fresh produce, chiefly cut flowers for the

East Africa Air Transport Survey – March 2005 Page 51
European and Gulf markets. This business represents 60 to 80 tons daily, of which 75% are trucked to Nairobi. KADC recognizes that airport charges at JRO are relatively high, reflecting the lack of economies of scale. However, they are set by the TCAA and the company has little say on the matter. Airport charges have to be competitive in comparison with other airports in the Region and it is estimated that there is little chance of attracting major foreign carriers (e.g. BA) is the rates offered by JRO do not compete. Zanzibar Zanzibar Airport is operated by the Zanzibar Government. The runway is undergoing a major construction programme, comprising an extension of 560 metres, full resurfacing and rehabilitation of the airfield lighting (World Bank financing). The terminal building is felt inadequate, especially in view of peak hour international traffic requirements. A new terminal building is considered. The airport is fitted with a NDB (non directional beacon, a radio navigation aid). The Zanzibar aviation authorities expressed some queries about the status of air navigation and ATM facilities. At the technical level, they wish to have an ILS to improve operations during the rainy season and to relocate approach control in Zanzibar (ZNZ approach is now handled by the DAR approach). At the institutional level, they wish to obtain full control of navaids and ATC, which are now under the responsibility of the TCAA. This would indeed imply collecting the air navigation charges which are now collected by the TCAA. These queries may not be fully relevant as:
• traffic volume seems low to justify ILS, especially during the rainy season when international traffic is virtually nil; the alternative of fitting the airport with DVOR and, possibly DME, would dramatically improve operational minima at a much lower cost (at least 4 to 5 times lower); however this alternative is rejected by the Zanzibar aviation department;
• separating ZNZ and DAR approach may cause delicate airspace coordination problems; where airports are so close to each other (about 50 km), a joint approach is usually recommended for better coordination; this might also reflect on airline operations, for those flying the short DAR-ZNZ stage (adding one transfer from DAR approach to ZNZ approach would increase cockpit workload; coordination requirements may also result in longer flight paths);
• having all the country’s ATM system under one umbrella (TCAA) generates economies of scale in terms of maintenance, spare parts, training, etc. and it may not be advisable to give up these benefits. Chances are also that, if the air navigation charges are collected by the Zanzibar Government, additional administrative costs would be incurred.
The problem of the mix between wide-body international charters and smaller domestic flights which conflict for space allocation on the small apron has to be addressed. However, consideration should be given to traffic volumes (5 to 7 wide-body flights per week) and to the fact that they do not necessarily operate during the peak hours of local traffic. If the construction of a new apron is undertaken, the existing one would then be allocated to general aviation.

East Africa Air Transport Survey – March 2005 Page 52
The low standard of the facilities and services at Zanzibar airport is also viewed by Zanzibar’s tourism industry as a major hindrance to the development of traffic. Security is considered poor, with domestic and international departures not being separated and insufficient training of security officers. Waiting space is not enough for present flights and thinks are due to become worse when the runway extension will allow bigger aircraft to use Zanzibar airport. There is no protection from rain for passengers waiting to enter the check-in area, and not enough car park capacity. Refuelling facilities are not able to cope with the requirements of long-range operations. Charter operators have been able to get along with combined flight itineraries (e.g. MWP-ZNZ-MBA, with refuelling at MBA for the long-haul flight stage). This may become very unpractical and too costly when traffic develops and single-destination flights with bigger aircraft are introduced. In terms of costs, the local tourism industry estimates that they are high, especially in view of the service provided, which is considered poor. The costs for a B-767 are as follows:
• 2,200 USD for ramp service; • 1,150 USD for landing fees and airfield lighting; • 975 USD for air navigation charges; • 25 USD per person for passenger tax (to be paid separately, which adds to the delays
and confusion during check-in procedures). Charter operators are also subject to 820 USD charge for each flight (“short permit licence”, which tour operators view as a “royalty for traffic rights”). Rwanda and Uganda In Kigali as well as in Entebbe, airport facilities still have lots of reserve capacity compared to the volume of traffic and there is no saturation problem. Improvements are however needed, especially in the areas of security and service. The Tanzanian-based company operating duty free shops and first class lounges at Entebbe, mentions a lack of space for the lounge, but this is minor issue. 3-6 Ground handling services The situation is very different in Kenya and Tanzania. Kenya has introduced a competition policy, whereas Tanzania still has a monopoly policy. Kenya Eight companies provide ground handling services in Nairobi. Two of them are linked to other organisations (Kenya Airways and Swissport) and the remaining six are independent Kenyan companies. Four of them also operate at Mombasa. Tough competition has brought the rates down in spite of increasing costs for ground support equipment, insurance and security-induced obligations. Some members of this industry estimate that the business is becoming unprofitable and that too many licenses have been granted, whereas licensing criteria were not strict enough. Apparently, the size of the market is not sufficient to support such a high number of competitors, and it is likely that some of them, who attempt to survive
East Africa Air Transport Survey – March 2005 Page 53
by cutting rates and standards of service, will have to withdraw, but with the “open” licensing system, they may as well be replaced by new entrants. However, some industry members estimate that the competition is biased, as Kenya Airways is also servicing KLM (as part of their partnership agreement) and most of the Region’s foreign carriers on a reciprocity basis (“cross-patronization”), thus achieving market dominance in spite of the high number of competitors. Regulatory improvement is needed, especially in the area of quality assurance, qualification, competition rules and non-discrimination practices. There is however no chance of improving things without reshaping the rules, as licenses are indefinite (when licenses are issued for a limited period, it is easier to upgrade the “terms of reference” at the time of application for renewal). Uganda Only two ground handling companies operate at EBB, with rates about twice higher than at NBO. Rwanda Rwandair Express is the sole service provider of ground handling at Kigali. Tanzania Tanzania has a monopoly policy and the sole provider of ground handling services is Dahaco, a Tanzanian subsidiary of Swissport, with operations at DAR and JRO airports. Dahaco was established in 1985 by Air Tanzania, SAS-Scandinavian Airlines and venture capital funds from Northen Europe. It was privatised in 2000 and TC’s shares were taken over by Swissport who now holds 51% of the share capital, the remaining 49% being held by institutional and private investors. Dahaco offers the full range of ground handling services: passenger, ramp and cargo. It also operates the cargo terminals and the perishable cargo cold storages at DAR and JRO and specialised services for the handling of valuable cargo. Cargo traffic in DAR is mainly import and it is the opposite in JRO (export of flowers and vegetables). In terms of prospects, Dahaco sees promising opportunities in the economic reforms pursued by the Government of Tanzania and its willingness to push export oriented industries (e.g. the liberalisation of mining industries had a sizeable impact on the movement of people, spare parts, and export of high-value minerals), although it is estimated that Tanzania’s dependence on imports will continue in the middle term. Tanzania’s industries lack competitiveness, in terms of quality and prices, due to the high cost of factors. Labour is expensive, in spite of the low wages (minimum wage law fixed at 45 USD for unskilled workers), because of lower productivity. 3-7 The tourism industry Basic concepts used in tourism The tourism industry comprises all the service providers involved in the travel, accommodation and leisure business: travel agencies, tour operators, hoteliers, etc. Transport

East Africa Air Transport Survey – March 2005 Page 54
companies are not, as such, part of the tourism industry, but tourism and transport industries are closely linked to each other: a large proportion of the passenger transport business is sold through travel agencies and tour operators, whereas transport, and especially air transport, is used by tourists to reach their destinations. An international “tourist” is any person who travels from his (her) country of usual residence to another country for more than 24 hours and less than one year (over one year, travel is considered as a “change of residence”; under 24 hours, the term used is “same day visitor”). Therefore, tourism data refer to all travellers, irrespective of the motive of travel (business, leisure, visit to relatives, conventions, pilgrimage, etc.). The statistical concept used in tourism is the number of arrivals. Therefore the number of passengers is the double of the number of tourists (one arrival + one departure). The number of tourists can be estimated from the reconciliation of several sources (transport statistics, arrival recorded by immigration border offices, etc.). Length of stay is measured by the number of nights spent in the country (either in commercial accommodations or in private dwellings). “Tourism receipts” are made of the sums spent in the country by international tourists (“international tourists” include all visitors whose permanent residence is outside the country, irrespective of nationality). One important data is the “average daily per capita spending”. These data also are estimated from the reconciliation of several sources (currency transactions at exchange facilities, turnover of tourism enterprises, purchases made by foreign residents). They usually cannot be as accurate as transport statistics or “arrivals” data), but they are indeed very important as regard the impact of tourism on the economy. Tourism attractions Tourism attractions in the East African Region belong to three categories: nature (sightseeing, wildlife and marine life); leisure (beach, mountain climbing, water sports, fishing); culture (monuments, remains of old civilisation, traditions, and meeting with people). One of the specific appeals of the Region, compared to competing destinations, is the opportunity to combine several of these attractions, as illustrated by the large number of combined tours sold in the Region (e.g. combination of a wildlife safari and sea-side stay). Kenya Kenya’s most patronized attractions comprise the big wildlife parks in the uplands, Mt Kenya, the beaches on the Mombasa coast, the old Swahili towns such as Lamu, the Rift Valley and traditional cultures. Kenya tourism statistics record the following data: International arrivals 2001 2002 2003 Air and sea
of which: holiday business
492 731
404 717 40 665
495 751
377 180 45 557
547 314
337 488 73 786
Cross border 500 869 505 549 598 786

East Africa Air Transport Survey – March 2005 Page 55
Total 993 600 1 001 300 1 146 100 Employment in the tourism sector 2001 2002 2003 Private sector 150 800 151 000 147 900 Public sector 6 200 6 100 6 000 Total 157 000 157 100 153 900
Tourism earnings 2001 2002 2003 (million USD) 263 227 303 % change 0 -13.5 +33.1
Accommodation establishments Hotels Beds 4 and 5-star hotels 4 and 5-star beds Nairobi 433 15 684 18 4 339 Coast 456 28 743 48 14 185 Parks and reserves 67 5 735 Rest of country 1 272 Key origin markets 2002 2003 UK 91 472 8 5198 Germany 59 338 51 257 Italy 38 815 44 481 France 34 239 32 956 Switzerland 23 628 21 451 India 11 329 20 585 Japan 8 008 7 762 United Arab Emirates 3 683 6 569 China 2 596 4 797 Korea 1 814 2 182 USA 40 346 39 743 Canada 6 038 8 721 South Africa 14 395 19 638 Tanzania 13 752 18 082 Uganda 11 954 16 766 Ethiopia 6 513 8 223 Australia 4 618 5 534 New Zealand 808 1 106 Two observations can be made on these data:
• in spite of the increase in the total number of arrivals recorded in 2003 compared to 2002, the volume of the leisure market actually went down: the global increase reflects the growth of the business market; this can be linked to the economic recovery of the country and, possibly, to the growing activity of the aid and relief agencies based in Kenya (operating in Kenya as well as in the neighbouring countries); the sizeable increase in tourism earnings (+33%) then reflects the shift in the composition of arrivals (more business and less leisure) in addition to possible other factors (such as increase in length of stay or the shift, among holidaymakers, to services of a higher standard, or, maybe, a loss of competitiveness of Kenya for low budget tourists);

East Africa Air Transport Survey – March 2005 Page 56
• among the key source markets, some have increased (Italy, UAE, China, South Africa), whereas others have gone down (UK, Germany); since tourism figures comprise business travellers as well as holidaymakers, this may not only reflect increased or reduced tourism attractiveness of Kenyan destinations on specific markets, but also a shift in business trends.
Kenya’s tourist industry is slowly recovering from the severe downturn triggered by the terrorist attacks on the US Embassy in Nairobi and on hotels and flights at Mombasa. However, the recovery is not yet complete and occupancy rates remain low, especially on the coast. According to industry sources, the market is fragmented with different expectations and consumer profiles in its different segments. On most European markets, typologies are mainly determined by age: seaside stays and outdoor recreation activities for the 25-35 age bracket; wildlife, sightseeing and cultural tours for the over 50; combination tours in-between. On the North American and Japanese markets, the interest is predominantly for wildlife tours (Kenya beach destinations cannot compete on these markets with Caribbean, South East Asian and Pacific Ocean destinations, because of the distance). Within the Indian Ocean Region, the main competitors are Seychelles and Mauritius but the two island countries have a clear “yield maximisation” policy and Kenya remains much more competitive for low to medium income clients. For wildlife tours, the emergence of South Africa as a prime competitor on the European, East Asian and American markets, with affordable airfares due to economies of scale and attractive pricing of accommodation and receptive services (especially during the three years when the Rand was low), may have been among the causes of the moderate growth experienced by tourism to Kenya. This also applies to Tanzania. Beyond problems of competitiveness, there can be two constraints to the long term development of tourism: (1) excessive visitor pressure on some of the most heavily patronised wildlife parks that especially impacts on the reproductive behaviour of some of the species and threatens some of the resources (impact of 4-wheel drive vehicles on grassed areas); (2) land availability and water supply in the coastal region. Industry sources do not however express too much concern about these limitations for the short to medium term. There is enough potential for development in some of the parks situated in the South-West (Lake Victoria and in the Rift Valley, which still are scarcely patronised by tourists. Large areas in the North of the country can also be opened to international tourism if the security situation improves. As for the Coast, existing development is concentrated on the first 50 km on each side of Mombasa and there is plentiful space available beyond. In the short term, the current excess accommodation capacity on the coast can easily absorb larger volumes of tourists. The industry appears more concerned with the cost problems, especially for domestic airfares which they view as an obstacle to a more aggressive development of combined tours. Rwanda Most travel to Rwanda is linked to business and to the operations of the aid and relief agencies. Rwandan authorities hope to develop tourism based on the country’s attractions: mountain rainforest, beautiful countryside, volcanoes and lakes, especially along the border with the DRC; Rwanda also has a small population of mountain gorillas, a species unique to that part of Africa. Prospects however remain modest in the short term as security problems are mentioned in the border areas and because the country’s largest wildlife park (Akagera)

East Africa Air Transport Survey – March 2005 Page 57
has experienced severe damage during the years of civil war. Mountain gorillas are an endangered species that cannot sustain large volumes of tourist activities in their ecosystems. Therefore, tourism is not expected to become the major driving force of the growth of air traffic in Rwanda. Uganda Uganda offers the same type of attractions as Rwanda on its western edge (mountains, lakes and gorillas). It may have, however, a larger potential, not just because of the mere size of the country, several times bigger, but also because it also offers other attractions, with the Nile Valley (and the famed Murchison Falls National Park), the shores and islands of Lake Victoria and historic heritage sites (Buganda Kingdom). Its proximity with Kenya makes it accessible to land tours covering the two countries. Serious security problems that have affected its Northern part for many years still are a major obstacle to the growth of the tourism market. Tanzania Tanzania offers the same varied range of tourist attractions as Kenya, with a land area that is twice as large as Kenya’s and good security conditions throughout the country. Actually, Tanzania claims to have a proportion of its territory allocated to national parks and nature reserves (25%) that is the largest in the world. Major attractions comprise Mt Kilimanjaro, a favourite among the world’s mountain climbers, the famous Ngorongoro Crater (a world heritage site), the Serengeti plains and Olduvai gorge (one of the cradles of mankind), Zanzibar Island (Zanzibar old town is a world heritage site) and the marine parks of the south coast islands. Key tourism statistics 1995 1996 1997 1998 1999 2000 2001 2002 2003 Receipts (M USD) 259 322 392 570 733 739 725 730 731 Arrivals (thousands) 295 326 359 482 627 502 525 575 576 of which: air 110 146 160 311 365 312 315 316 320
sea 17 22 35 8 6 15 21 20 25 road 153 149 150 152 220 155 173 214 215 rail 16 9 14 11 36 20 16 25 16
of which: leisure 198 219 246 300 383 340 341 358 337 business 59 64 81 128 133 130 152 115 133 other 38 42 33 54 111 32 32 102 106
The relatively small number of arrivals by road (about 40% lower than by air) suggests that some of the cross-border traffic is unreported (it may happen that border posts do not record arrivals of nationals of the neighbouring countries who routinely cross the borders undocumented for family visits or business). Note that the distribution by purpose of travel may be unreliable, because business travellers were subject to a visa fee of 200 USD until 1998 (against 50 USD for “tourists”), and large

East Africa Air Transport Survey – March 2005 Page 58
numbers of business travellers were declaring “tourism” as their purpose of visit just to escape the higher fee. Official statistics for 2004 are not yet available but industry sources indicated that 2004 has been their “best year ever”, but remain cautious as this may just result from a catch-up effect after several years of stagnation. Seasonal profile
0
10000
20000
30000
40000
50000
60000
70000
80000
Jan Feb Mar Apr May jun Jul Aug Sep Oct Nov Dec
19982003
The comparison between the seasonal profiles of tourist arrivals in 1998 and 2003 suggests that changes have taken place in the tourism market. The dry season peak (August-September) is lower (not only in proportion, but also in absolute numbers) in 2003 than in 1998, which suggests that the relative weight of holiday tourism has gone down (in other words that the increase in arrivals is likely to be chiefly due to business traffic). The emergence of a peak in December, which did not existed in 1998, suggests that new origin markets have been found (possibly South Africa) by Tanzanian tourism stakeholders. Origin markets 1995 1996 1997 1998 1999 2000 2001 2002 2003 Africa 124 136 151 202 263 202 213 249 268 of which: Kenya 50 55 61 82 106 85 102 112 119
Uganda 12 14 15 20 26 21 25 29 35 South Africa 9 10 11 14 19 15 18 23 35
Americas 29 32 36 48 62 49 45 59 50 of which: USA 19 21 24 32 41 33 31 38 36
Canada 5 6 7 9 12 9 7 12 10 East Asia & Pacific 22 25 27 37 48 38 47 30 27 of which: China 3 4 4 5 7 6 5 3 4
Japan 3 4 4 6 7 6 8 5 6 Australia 5 5 6 8 10 8 12 10 10
Europe 88 97 107 143 186 157 162 192 191 of which: Sweden 9 10 12 15 20 16 17 8 8
UK 20 22 25 33 43 34 34 43 44 Italy 3 4 4 5 7 6 8 23 25 Spain 5 5 6 8 10 8 8 16 9 France 10 11 12 16 21 17 17 22 22

East Africa Air Transport Survey – March 2005 Page 59
Germany 13 15 16 22 28 23 21 18 19 Netherlands 0 0 0 0 0 8 10 16 15 Switzerland 5 5 6 8 11 8 6 9 7
Middle East 18 20 22 29 38 30 30 17 14 of which: Oman 5 6 6 8 11 9 10 8 5
UAE 3 3 3 4 6 4 4 1 1 Yemen 4 4 5 7 9 7 6 3 3
South Asia 15 16 18 24 31 25 28 28 26 of which: India 11 12 13 18 23 19 24 22 22 Among the changes that have affected the geographic distribution of the origins of foreign visitors, the following can be noted:
• Africa alone represents nearly half of the arrivals, with Kenya as the clear leader, and a steady growth of the Ugandan and South African markets (the slump observed in arrivals from South Africa in 1999-2002 may be attributable to the weakness of the Rand, whereas the market increased a lot in 2003 with the recovery of the Rand, suggesting a high proportion of holiday makers);
• the American market is slowly recovering after the serious drop observed in 2000; Tanzania is now on par with Kenya on the US market;
• China’s and Japan’s markets are growing, but remain marginal; in view of the huge potential represented by these markets, they can be viewed as being major target for promotion strategies;
• after a high in the late nineties, the Swedish market has dropped dramatically, suggesting a higher sensitivity of this market to security problems and/or to the competition of other destinations;
• the most spectacular growths were achieved by the Italian and Dutch markets; the German market has not recovered since its drop in the late nineties, whereas the British market remains first in Europe and has doubled in size; the lower volatility of the British market suggests that it may generate a higher proportion of business traffic and possible “ethnic traffic” (Tanzanian nationals resident in the UK and visits of relatives to British expatriates resident in Tanzania);
• visitors from the UAE are in small numbers; this contrasts with the very high volumes of traffic recorded on the DAR-DXB route, suggesting that this traffic includes a high proportion of “sixth-freedom” inbound traffic as well as point-to-point traffic originating from Tanzania (this is confirmed by industry sources).
Traffic originating from Tanzania comprises corporate traffic as well as traffic in conjunction with official travel of the international agencies and NGOs which, according to industry sources is a massive segment of their business. Another important segment is the traffic generated by foreign investment in Tanzania, especially on the DAR-JNB route (South African investment in the mining, tourism, food processing and manufacturing sectors). The industry performance has been good in the past five years. Dubai and Johannesburg are the two major routes for corporate travel. For outgoing traffic, Kenya is the biggest destination, with a large proportion of this traffic connecting in Nairobi to onward destinations. Another important segment is school traffic: wealthy Tanzanian residents started sending their children to boarding schools in Kenya when English was removed as the teaching language in Tanzania; this also had another important consequence for the tourism industry, making it more difficult for tourism companies and hoteliers to recruit staff with a good working

East Africa Air Transport Survey – March 2005 Page 60
knowledge of English. Inbound tourism does not provide very large volumes of business to the local tourism industry (i.e. travel agents) as a large proportion of the tours are pre-booked from overseas by foreign tour operators directly with Tanzanian tour companies, and very few tourists buy their receptive services individually from local travel agencies. Most of their sales in this line of business are made to foreign nationals resident in Tanzania (employees of embassies, UN agencies and NGOs). There is an exception with the clients of the charter flights to ZNZ, who buy local excursions as add-on to their packages. Most combination packages comprise a mix of beach and wildlife tours. Adventure tours (e.g. mountain climbing to Mt Kilimanjaro) are not however sold in combination as this is a “special interest” product, with enough appeal per se for mountain fans. Among the concerns expressed by the tourism industry, lots of complaints relate to poor standards of service at the airports, especially DAR and ZNZ, as already mentioned. Other concerns are related to: the fact that domestic fares offered by TC and PW do not interline with international fares; high accommodation rates in hotels (although food is generally very affordable); the 20% VAT levied on agents’ commissions, in a context where airlines steadily reduce the commissions paid to travel agencies; the fact that the TCAA does not allow bank guarantee as a substitute for cash deposit for issuing travel agents’ licences (although IATA/BSP normally accepts bank guarantees for accreditation, usually in the amount of one month’s turnover, to secure payment of sums due to airlines at the end of each month). For several decades, tourism was not a priority to the Government of Tanzania as it did not fit well with its socialist orientations based on the development of state-owned industries. The promotion of the tourism sector started in 1993 with the creation of the Tanzania Tourism Board as a statutory agency. The Board of Directors comprises Government appointees and members of the private sector. Tanzania’s tourism policy is aimed at developing tourism spending rather than volume, with due consideration to the sustainability of wildlife. Average stay has now increased from 7 to 10 days and the aim is to increase it to 12 / 14 days. Tanzania’s major problem is that Kenya has always been the historic gateway to the Region thus making tourism to Tanzania a “by-product” of tours to Kenya. It is only in the past 5 to 6 years that Tanzania has succeeded in emerging as a destination of its own, with the construction of new hotels and lodges, the improvement of roads and the development of domestic air transport. Tourism now represents 16% of Tanzania’s GDP. The Government is reviewing the tax regime applying to tourism services, in an effort to alleviate the factors that make Tanzania an expensive destination. Tourism authorities do not see traffic rights as an obstacle to the growth of tourism, as Tanzania has a liberal policy regarding BASAs. The Government is also helping in providing training (a new hotel school is being built with a 5.7 M€ grant from France) and supports the restoration of old monuments, with the financial and technical assistance of France, Japan and UNESCO. Among Tanzania’s tourism destinations, Zanzibar has had one of the fastest growths over the past few years. Zanzibar has 173 accommodation establishments, with 6,600 beds. Tourism represents 21% of the local economy with a direct employment of 6,700. It is estimated that 37,000 jobs depend indirectly on tourism. The market is evenly split between package tours (48%) and individual travellers (52%). Key origin market is Europe (70% of the tourists to Zanzibar). USA, Australia, and now East Asia and India are growing. The fastest growing market is South Africa, and there are more and more direct JNB-ZNZ flights. South Africa’s tour operators typically offer attractively priced 6-day packages and capitalise on the island “magic” image. Zanzibar is also increasingly attractive to domestic tourists. Its comparative

East Africa Air Transport Survey – March 2005 Page 61
advantage, in the competition with other beach destinations, is to offer cultural attractions (Stone Town, monuments, Swahili heritage and its magic as “Spice Island”) although some members of the local tourism industry expressed the view that only a minority of their clients have actually opted for Zanzibar on cultural grounds: only 20% of the beach hotels guests actually take the cultural tours or visit Stone Town by themselves. In the past, Zanzibar used to be patronised as an extension to Safari tours or as a week end destination for business travellers staying in Dar es Salaam. It has only recently built up as destination of its own, and excellent business was done in 2004. This shift is illustrated by the increase in the average length of stay in Zanzibar hotels: from 3-4 nights, it has gone up to 6-7 days and is expected to reach 7-8 days in the near future. Average daily per capita spending has increased to 60-70 USD. There is, however, a problem of sustainability. As an example, the coral reefs, one of Zanzibar’s attractions, are deteriorating and there is a need for better supervision and training of diving operators, especially because of the activity of unlicensed illegal tour-operators belonging to the informal economy who offer excursions at dumping rates. As regard diving, Zanzibar’s competitors are Mexico, the Dominican Republic, the Maldives and Kenya. Prices on the European market are competitive with other Indian Ocean destinations (diving packages sold 1,700 € full board) but service is of a lower standard (services offered by Zanzibar 5-star hotels compare with those of Mauritius’s 2-star). Prices are higher than those of Caribbean destinations (1,400 € in Dominican Republic). Some stakeholders in the island’s tourist industry complain that the authorities are not very effective in enforcing the laws, especially regarding the activities of the so-called “beach boys” who are freely allowed to sell everything from drugs to illegal excursions, and this is increasingly scaring out serious investors from investing in high standing tourist facilities. Many of them agree that the climate would be improved if alternative activities could provide more jobs to the local population (e.g. much of the food consumed at resorts is imported from the mainland, whereas it could be produced locally if agriculture was better encouraged). 3-8 Freight forwarders and export-oriented industries Air cargo import trade in the East Africa Region is very similar to that of other Regions in Africa (electronic goods, dairy products, luxury items) but the export business is very specific, with a high concentration on three categories of products:
• off-season high-value fresh vegetables (green beans, etc.) • cut flowers • freshwater fish from Lake Victoria (tilapia and Nile perch)
The export freight business started in the Region when airlines offered attractive rates for outbound hold cargo because of the directional imbalance. This in turn encouraged the development of export-oriented agricultural productions. Specialised freighters stepped in the market when the demand became too big to be accommodated in the cargo hold of passenger aircraft; they were further attracted to the Region when some of the scheduled airlines withdrew from the passenger market. According to freight forwarders, specialised cargo flights offer something more, i.e. “tramping” (flying from place to place to consolidate their loads) and can adjust their operations to the needs of the freight forwarders, but scheduled flights are better for perishable farm products, although they cannot always guarantee space availability (regulations provide that, in case of weight limitations, mail has priority over

East Africa Air Transport Survey – March 2005 Page 62
passengers, and passengers over freight) and are not suitable for the needs of the biggest shippers such as the big flower farms. The main concern of the freight forwarders is the rate structure. In the time of IATA-regulated fares, there were official posted fares, but everyone was cheating with fares and the industry had to deregulate. Now, the rate structure is unstable, making it difficult for farmers to manage their costs in the face of fluctuating selling prices in the destination countries. The biggest individual freight route is with Dubai, which offers “sea-air” services (big consolidated shipments carried by sea from East Asia to Dubai, and then broken down for transhipment by air to African destinations). However, the European routes as a whole represent more business than Dubai’s. This traffic pattern is a cause of directional imbalance. Export of farm produce to Dubai remains low because of the competition of cheaper products from India, resulting in bad northbound load factors; on the European routes, it is the opposite, with higher northbound load factors. Another difficulty for freight forwarders is the lack of detailed statistics that limits their knowledge and understanding of the changes affecting trade trends and prevents them from targeting their marketing efforts (a concern that they have in common with travel agents who suffer from the lack and unreliability of air transport statistics). The cut flower business started in the mid-eighties with open-air species (“summer flowers”) well adapted to the mild climate of East Africa’s uplands. As of 1990, flower farmers shifted to greenhouse production to improve temperature control and now very few continue to produce summer flowers. They also tended to specialise. Whereas the region of Entebbe, which has a warmer climate specialised in sweetheart varieties, the region of Arusha specialised in roses. The season extends from September to end-May. East African production has a comparative advantage, compared to the Mediterranean regions of Europe: with the milder temperatures, fuel consumption by the greenhouses is much lower. The cost of air transport is a vital factor for this industry: airfreight used to represent 33% of the cost, and it has now jumped to 47% with the impact of higher insurance and fuel costs. The farmers have to absorb this increase, as market prices are set at destination. The biggest wholesale buyers are in the Netherlands, with some also in the UK, Germany and Sweden. Airfreight is the responsibility of the farmers, as market prices are fixed CIF in the destination countries and fluctuate from day to day: the farmers ship their goods and pay the airfare without knowing what will be the next day’s market price when their consignment arrives. The horticulture industry has now grown to be one the major job providers in the Kilimanjaro area. Rwanda has recently started flower production on a small scale; the results are encouraging and extension is contemplated. In the region of Mwanza, as well as in Entebbe, there has been a big development of fishing. Lake Victoria fish is exported in large quantities and has become a major economic activity, especially in Mwanza. Critics have been recorded regarding the environmental impact of the uncontrolled development of the stocks of Nile perch (Nile perch is not indigenous to the lake, and was introduced about 25 years ago), which are eating out all other species in the lake, with a resulting excessive growth of algae caused by the depletion of the algae-eating fish species. The sustainability of marine life in Lake Victoria is therefore contingent on the continuation and development of fishing the Nile perch.

East Africa Air Transport Survey – March 2005 Page 63
3-9 International aid and relief agencies No specific data have been recorded regarding the activities of these agencies, but it is useful to note that they are among the major stakeholders because of the high volume of business they generate for the Region’s air transport :
• official travel; • personal travel of employees posted in the Region; • movement of supplies and goods for the relief operations (especially in Entebbe and
Kigali). 3-10 The role of air transport in the Region’s development Most considerations pertaining to the economic role of air transport have been discussed earlier in this report. This section will then mainly consist of a reminder. 3-10-1 Enhancing the potential of specific activities The activities depend most on air transport are:
• tourism; • export-oriented farming (fresh vegetables, cut flowers); • Lake Victoria fisheries.
Unfortunately, there are no consistent statistics that would enable to determine their exact weight in the Region’s GDP. This can however be estimated on the basis of the information collected. Tourism represents about 15% of Kenya’s and Tanzania’s GDP. There is no precise indication whether this figure represents the value added of the tourism sector or includes the value added induced in industries providing inputs to the tourism industry (e.g. construction, handicrafts, etc.). Export-oriented horticulture and fishing probably represent about 10% of the two countries’ GDP. Based on these estimates, about 25% of the GDP depends heavily on air transport. In view of the limited volume of other exports (other cash crops such as tea and coffee, mining, manufacturing), it can be estimated that not less than 40% of the foreign exchange earnings of the two countries depend on air transport. In Uganda and Rwanda, not enough data were available even to establish such a rough estimate. 3-10-2 Benefits to landlocked or isolated communities The benefits of air transport to isolated or landlocked communities in developing countries are often overestimated. Except where these communities have specific economic activities depending on air transport and on routes with high volumes of business travel, the observation of consumer behaviour suggests that, as soon as adequate land transport becomes available, even with lower standards of service than offered by air transport, the demand shifts to the more affordable land transport. All interviewed stakeholders have mentioned that air transport volumes remain marginal compared to volumes carried by buses, and that cheap bus fares are the major challenge to domestic airlines. Liberalisation policies have strengthened this aspect:

East Africa Air Transport Survey – March 2005 Page 64
in a monopoly context, it is possible to use the profits made on trunk routes to cross-subsidise unprofitable feeder routes to isolated communities. As soon as competition is introduced, it primarily affects the most profitable routes where fares go down, thus making it impossible to continue the cross-subsidisation pattern, and fares go up on low-traffic routes, thus weakening the competitive position of air transport versus land transport. This is often resented in the air transport industry, although it generally results in global savings for the country’s economy. 3-10-3 Provide qualified jobs Another aspect that must not be overlooked is that the existence of air carriers based in a country helps provide qualified jobs to the nationals of this country. This has been often viewed as an implicit justification for state support to national carriers, even though they might be unprofitable. Generally, this support was not granted on the basis of economic analysis, but rather on the grounds that these qualified jobs primarily benefited to members of the social groups who were closer to political authorities. This does not mean that Governments should not support their air transport and their flag carriers, but this support should be granted through appropriate competitive market-oriented policies and creating a favourable context rather that through subsidising inefficient sate-owned companies. The Region’s countries have all opted for liberalisation and privatisation (even though the privatisation process has not been complete everywhere): the country which has been the most active in promoting such policies (i.e. Kenya) now appears as the leader in the Region’s air transport.

East Africa Air Transport Survey – March 2005 Page 65
4- Prospects and issues 4-1 Implementation of the Yamoussoukro Decision The Yamoussoukro decision now appears to have become an everyday factor in the Region’s air transport. Tangible benefits have already been observed, such as the introduction of new services. But the major consequences of the Yamoussoukro Decision are yet to come. It has triggered a dynamic process, which still is at its initial stage. The build-up of Kenya Airways as the Region’s major hub carrier (in conjunction with its Tanzanian subsidiary, Precision Air) adds a new dimension to the carrier, enabling it to become one of the most serious contenders for the future consolidation of air transport in Africa. Whereas discussions continue regarding the possible instruments for a more thorough implementation of the YD within the COMESA and EAC forums, the Region’s states have not waited for the outcome of these discussions and it is noteworthy that they have adopted a pragmatic course of action consisting of incorporating the Yamoussoukro principles into the Bilateral Air Services Agreements, which are instruments they are familiar with and they know how to handle. They have not formulated this course of action as an explicit policy, but rather as a practical way to go ahead. This does not mean that the implementation of the Yamoussoukro is not faced with problems (e. g. the reluctance of some states to grant unrestricted fifth freedom capacity), but it no more is an issue: it has become a fact of life. 4-2 Consolidation forces in the global air transport industry Recent events (September 11, the rise of fuel costs, the emergence of new global carriers in Asia and the Middle East, etc.) have continued to push for consolidation of the air transport industry, especially in Europe. In the past two years, KLM and Air France have merged, whereas Swiss International is being taken over by Lufthansa. Iberia has strengthened its ties with British Airways and the future of Alitalia is uncertain. US carriers have not been aggressive on international markets, as several of them fight for survival: for them, the key competitive battle is fought on the US market itself, and they preferred to rely on their alliance partners for fighting overseas competitive battles. It is likely that a stage of consolidation will soon take place on the US market itself. When the US air transport industry is further consolidated, US carriers will certainly come back more aggressively to the competition for international markets. The alliance system is closely linked to the bilateral system (BASAs impose that the carriers operating a country’s traffic rights be bona fide “nationals” of that country). Ultimately, the GATS agreements will probably waive the exclusions granted to the aviation sector, and “nationality clauses” will disappear. This will remove the obstacle to unrestricted foreign shareholding in air carriers. This will certainly have a major impact on the alliances, either a transformation of the alliances into corporate groups linked by equity participations, or a reconfiguration of the groupings further to mergers and acquisitions (as already happened in

East Africa Air Transport Survey – March 2005 Page 66
the case of the Swiss take-over: Swiss was poised to join One World, but its take-over by Lufthansa brought it into Staralliance). The emergence of so-called “low-cost” carriers (which would more appropriately be called “point-to-point” carriers) is likely to destabilise the “hub-and-spoke” model on which the full service carriers have based their business. In Europe, they are now a serious challenge to the dominance of European global carriers. The “low-cost” model is now penetrating other geographic areas, especially India, where two of them, Deccan Airlines and Kingfisher have posted ambitious objectives. In view of India’s proximity, the evolutions of Indian air transport are likely to affect East Africa. In this context, African carriers will not escape consolidation. Out of the existing airlines, probably 3 or 4 will eventually emerge as the continent’s “majors” and others will either disappear or be taken over by these majors. With the exception of Air Mauritius, which can continue to operate as a niche carrier due to its geographical position, no more than 5 carriers are in a position to be serious contenders in the competition for continental leadership: South African, Egyptair, Ethiopian, Royal Air Maroc, and indeed Kenya Airways. South African’s efforts to build a strong presence in East Africa through its participation in Air Tanzania have not been successful so far, but it remains the clear leader for all the southern part of the continent (with nearly half of Africa’s RPK) and the only African carrier to have achieved “global” carrier status. Royal Air Maroc has built up a strong presence on the Western coast through its take-over of Air Senegal and now Air Gabon. Egyptair and Ethiopian seem to stick to a purely national strategy. The diagram next page illustrates competition patterns in Southern and Eastern Africa. 4-3 Regional challenges and investment issues Governments do not have much leverage on the outcome of the competitive battles in air transport. However, alternative investment policies can have a sizeable impact. This indeed applies to hub airports. Hub-and-spoke carriers need to have competitive efficient airports as their base, as was mentioned by Kenya Airways as well as by the Kenya Airports Authority, when they viewed their relationship as a “partnership”. This also applies to the other airports depending on the standard to which they are built or upgraded. With a hub-and-spoke strategy, “secondary” airports need to be designed for feeder flights. On the opposite, if they are upgraded to full international status, it may facilitate market penetration by carriers based outside the Region. Two alternative strategies may be envisioned to promote the development of the Region’s air transport:
• establishing the conditions for maximum competition, and thus opening market access for the highest number of competitors, from the Region as well as from outside the Region; upgrading infrastructure to the highest possible standards would then facilitate the widest possible market access;

East Africa Air Transport Survey – March 2005 Page 67
to Sao Paulo, Buenos Aires
to New York
to Asia
Capetown
Johannesburg
Maputo
to Perth, Melbourne, Sydney
to Europe
Windhoek
Luanda
Kinshasa Entebbe
Lubumbashi
Nairobi
Dar es Salaam
Lilongwe
Harare
Lusaka
Area of JNB’s attraction for connections to Europe & Asia
to Dubai
to Asia
Area of NBO’s attraction for connections to Europe, Middle-East & Asia

East Africa Air Transport Survey – March 2005 Page 68
• providing the best opportunities for the Region’s main contenders in the global competitive context; giving preference to infrastructure alternatives corresponding to the requirements of feeder carriers would strengthen the role of regional hub operators in the global competitive context.
Investment strategies should also be based on a good understanding of the real requirements. Accurate data and sensible projections are needed to establish the requirements. In a similar manner, market forces can work efficiently only if all actors on the market are correctly informed and have a fair access to information. These objectives cannot be achieved unless there is a serious improvement on the collection, processing and of air transport data in the four countries.