Easing into Data Exploration, Reporting, and Analytics...
17
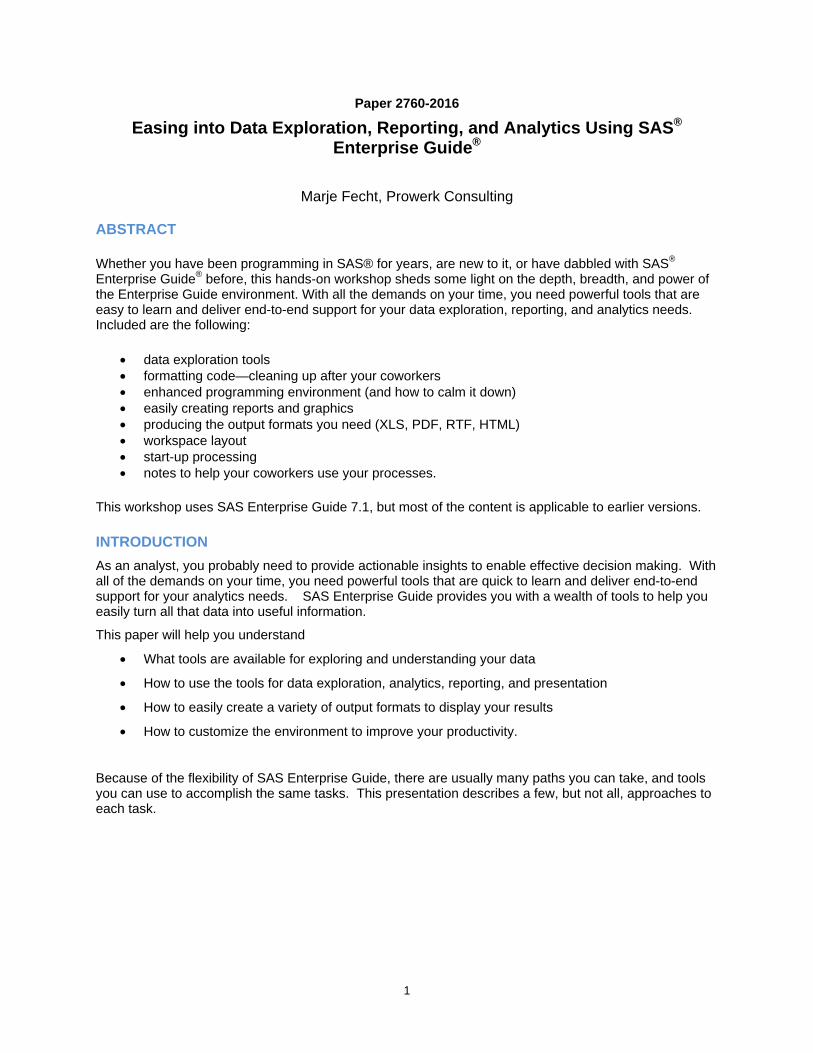
1 Paper 2760-2016 Easing into Data Exploration, Reporting, and Analytics Using SAS ® Enterprise Guide ® Marje Fecht, Prowerk Consulting ABSTRACT Whether you have been programming in SAS® for years, are new to it, or have dabbled with SAS ® Enterprise Guide ® before, this hands-on workshop sheds some light on the depth, breadth, and power of the Enterprise Guide environment. With all the demands on your time, you need powerful tools that are easy to learn and deliver end-to-end support for your data exploration, reporting, and analytics needs. Included are the following: • data exploration tools • formatting code—cleaning up after your coworkers • enhanced programming environment (and how to calm it down) • easily creating reports and graphics • producing the output formats you need (XLS, PDF, RTF, HTML) • workspace layout • start-up processing • notes to help your coworkers use your processes. This workshop uses SAS Enterprise Guide 7.1, but most of the content is applicable to earlier versions. INTRODUCTION As an analyst, you probably need to provide actionable insights to enable effective decision making. With all of the demands on your time, you need powerful tools that are quick to learn and deliver end-to-end support for your analytics needs. SAS Enterprise Guide provides you with a wealth of tools to help you easily turn all that data into useful information. This paper will help you understand • What tools are available for exploring and understanding your data • How to use the tools for data exploration, analytics, reporting, and presentation • How to easily create a variety of output formats to display your results • How to customize the environment to improve your productivity. Because of the flexibility of SAS Enterprise Guide, there are usually many paths you can take, and tools you can use to accomplish the same tasks. This presentation describes a few, but not all, approaches to each task.
-
Upload
truonglien -
Category
Documents
-
view
217 -
download
4
Transcript of Easing into Data Exploration, Reporting, and Analytics...
1
Paper 2760-2016
Easing into Data Exploration, Reporting, and Analytics Using SAS® Enterprise Guide®
Marje Fecht, Prowerk Consulting
ABSTRACT
Whether you have been programming in SAS® for years, are new to it, or have dabbled with SAS® Enterprise Guide® before, this hands-on workshop sheds some light on the depth, breadth, and power of the Enterprise Guide environment. With all the demands on your time, you need powerful tools that are easy to learn and deliver end-to-end support for your data exploration, reporting, and analytics needs. Included are the following:
• data exploration tools • formatting code—cleaning up after your coworkers • enhanced programming environment (and how to calm it down) • easily creating reports and graphics • producing the output formats you need (XLS, PDF, RTF, HTML) • workspace layout • start-up processing • notes to help your coworkers use your processes.
This workshop uses SAS Enterprise Guide 7.1, but most of the content is applicable to earlier versions.
INTRODUCTION
As an analyst, you probably need to provide actionable insights to enable effective decision making. With all of the demands on your time, you need powerful tools that are quick to learn and deliver end-to-end support for your analytics needs. SAS Enterprise Guide provides you with a wealth of tools to help you easily turn all that data into useful information.
This paper will help you understand
• What tools are available for exploring and understanding your data
• How to use the tools for data exploration, analytics, reporting, and presentation
• How to easily create a variety of output formats to display your results
• How to customize the environment to improve your productivity.
Because of the flexibility of SAS Enterprise Guide, there are usually many paths you can take, and tools you can use to accomplish the same tasks. This presentation describes a few, but not all, approaches to each task.

2
EXPLORING AND UNDERSTANDING YOUR DATA
How can you easily get a feel for your data?
Perhaps you eyeball the data, OR if you are a SAS Programmer, you may run a series of Procedures like CONTENTS, FREQ, SUMMARY, GCHART, GPLOT, SGPLOT, SGSCATTER, etc.. But, there is a much easier and more effective approach!
QUICK AND EASY LOOK AT THE DATA
My first stop with any new set of data is the SAS Enterprise Guide Data Explorer, which enables you to
• View all or a portion of your detail data
• Easily create charts and graphs to explore the variables, and quickly highlight possible issues and outliers
• Highlight the “top 10” values of variables
• And produce many other statistics of your choosing.
How do you access the Data Explorer?
There are multiple ways to access the Data Explorer (File Open Data Exploration) but my preference is
• In the Server List window, you can view a list of the available servers, libraries, and SAS files.
• Use the plus sign (+) to expand the Servers and Libraries, and navigate to the dataset of interest
• Right click on the dataset and select Explorer
• Tip: If you want to Explore Temporary (WORK) datasets – OR – if you are working with LARGE data - see the tricks in the FAQ at http://blogs.sas.com/content/sasdummy/2014/02/17/favorite-eg-tricks-fecht/ http://blogs.sas.com/content/sasdummy/2014/07/09/performance-tips-sas-eg-datagrid/
• Note: The Data Explorer options are normally configured to limit the number of rows and columns that are available (by default).
• Once you are in the explorer window, you can
o Apply filters to control which variables and rows you view
o Request Quick Stats, to view charts, plots, summary statistics, and more
o Customize the environment to control
Usage with large data
Statistics that appear by default for character, numeric, date/time, and currency variables. Just select the Select Statistics tool in the Quick Stats view.
And many other options (SAS Enterprise Guide has A LOT of options!!).

3
To illustrate some of the features, see Figure 1 to view a portion of the data in SASHELP.HEART and notice
Icons next to variable name describing the data type (numeric, character, currency, date)
Quick Stats view on the right
• Tools let you control data display (rows, columns)
• Select Statistics lets you choose the default graphics and statistics to display for each of the 4 data types
• For Character variables, the default statistics include
o # of distinct values
o Count
o Vertical Bar chart showing frequencies
o Top Distinct values – including frequencies for each (up to Top 10)
• Notice that numeric variables have different default statistics.
Figure 1 - Data Explorer - with Quick Stats on all variables

4
If you click on one of the graphics or tables in the Quick Stats view, it magnifies.
Figure 2 - Frequency Chart for AgeCHDdiag
DIG DEEPER – FIND THE ISSUES AND ANOMALIES
In the Data Explorer, you can focus in on areas of concern by using the Filters to explore subsets of data. The filters can be defined either in the Data View List view in the right pane, or by selecting the filter tool in the column of interest. When you apply filters, and rerun Quick Stats, the statistics represent just the subset of data so that you can focus in to find issues and anomalies.
TIP: SAS doesn’t APPLY the filters (select columns, subset data, sort) until you select Apply Updates.
In addition to the Data Explorer for reviewing your data, filtering, and viewing subsets of data, there are many “built-in” Enterprise Guide tasks to easily accommodate further data investigations. Use the Task Gallery (new to SAS Enterprise Guide 6.1), or select Tasks from the menu bar, to select from over 95 different built-in tasks. No Coding required!
The Task Gallery provides easy access to the tools you need to explore, summarize, visualize, analyze, report, and so on. You can access tasks by Category, Name, and even visual representations.
Figure 3 Task Gallery - by Category

5
Notice that the Task Gallery “by Name” also displays the underlying SAS Procedure. This can be useful if you need additional documentation on how the procedure handles data, methodologies, etc.
Figure 4 Task Gallery - by Task Name
If you want univariate descriptions of all of your variables, similar to the Data Explorer results, select Tasks Describe Characterize Data . . . The Characterize Data Wizard will step you thru the selections and produce results that can easily be printed or saved for later usage.
6
EASILY CREATING REPORTS AND GRAPHICS
To help you understand the underlying relationships in your data, SAS Enterprise Guide provides extensive graphics and analytics capabilities, through the built-in tasks.
SCATTERPLOT MATRIX
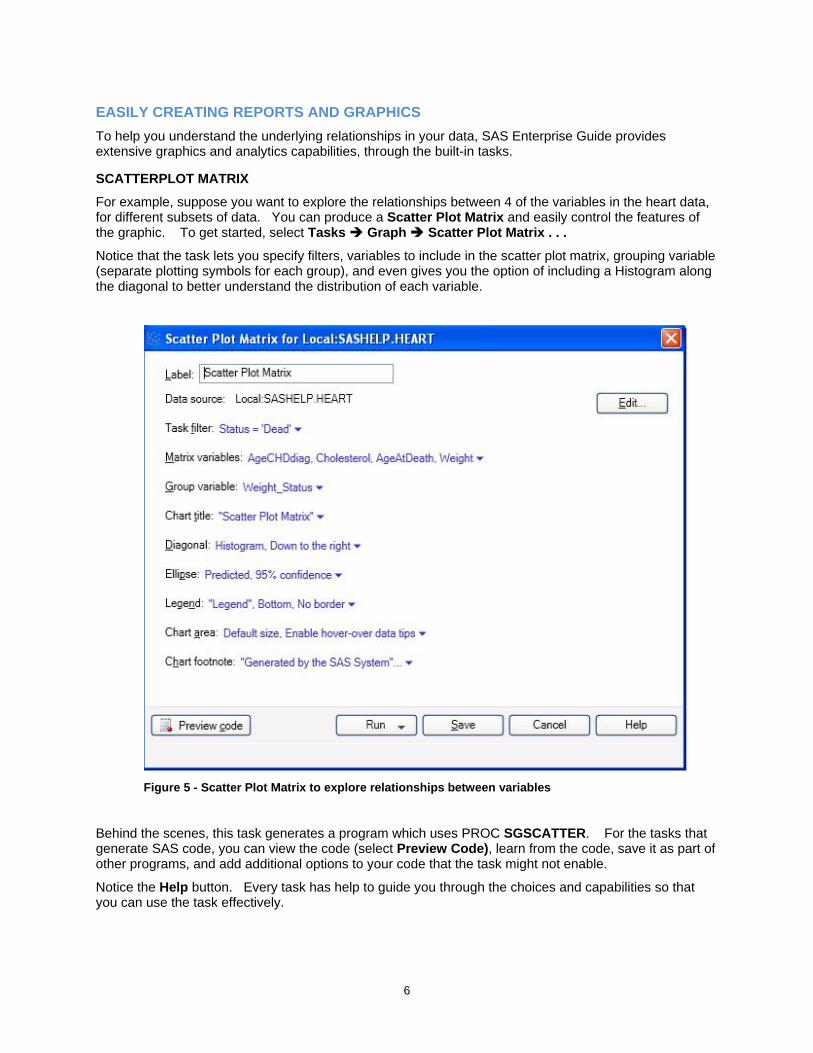
For example, suppose you want to explore the relationships between 4 of the variables in the heart data, for different subsets of data. You can produce a Scatter Plot Matrix and easily control the features of the graphic. To get started, select Tasks Graph Scatter Plot Matrix . . .
Notice that the task lets you specify filters, variables to include in the scatter plot matrix, grouping variable (separate plotting symbols for each group), and even gives you the option of including a Histogram along the diagonal to better understand the distribution of each variable.
Figure 5 - Scatter Plot Matrix to explore relationships between variables
Behind the scenes, this task generates a program which uses PROC SGSCATTER. For the tasks that generate SAS code, you can view the code (select Preview Code), learn from the code, save it as part of other programs, and add additional options to your code that the task might not enable.
Notice the Help button. Every task has help to guide you through the choices and capabilities so that you can use the task effectively.

7
When you select Run, the task will produce your Scatter Plot matrix. Notice
Histogram for each variable along the diagonal
Scatter plot of each pair of variables
Plotting symbol represents the grouping variable Weight Status
Additional tabs can be opened to view
• SAS code that is created for the task
• Log with any messages
If you need to make changes to your selections, select Modify Task
You can export the results in a variety of formats. This will be discussed later in this paper.
Figure 6 - Scatter Plot describing the relationships between pairs of variables

8
That was easy – wasn’t it?? What other ways can you visualize your data in SAS Enterprise Guide?
Depending on the version you are using, there are a lot of additional Graph Tasks.
Figure 7 - Graph Tasks - choices are version dependent
Similar to Figure 5, the tasks above provide you with a variety of selections to specify your choices for data, variables, options, output customization, and more.
VERTICAL BAR CHART
Perhaps you would like to use a simple vertical bar chart to describe your data, but you are not familiar with the SAS/GRAPH code you would need? Let SAS write the code for you!
• Select Tasks Graph Bar Chart from the main menu. This opens the Bar Chart Wizard.
• In the Bar Chart screen, double click on Simple Vertical Bar
• In the Task Roles screen (accessible by selecting Data (second item in far left)
change the Data source, by selecting
• Edit (upper right of window)
• Browse and then choose Local Libraries SASHELP Shoes OK
Drag Region to Column to Chart
9
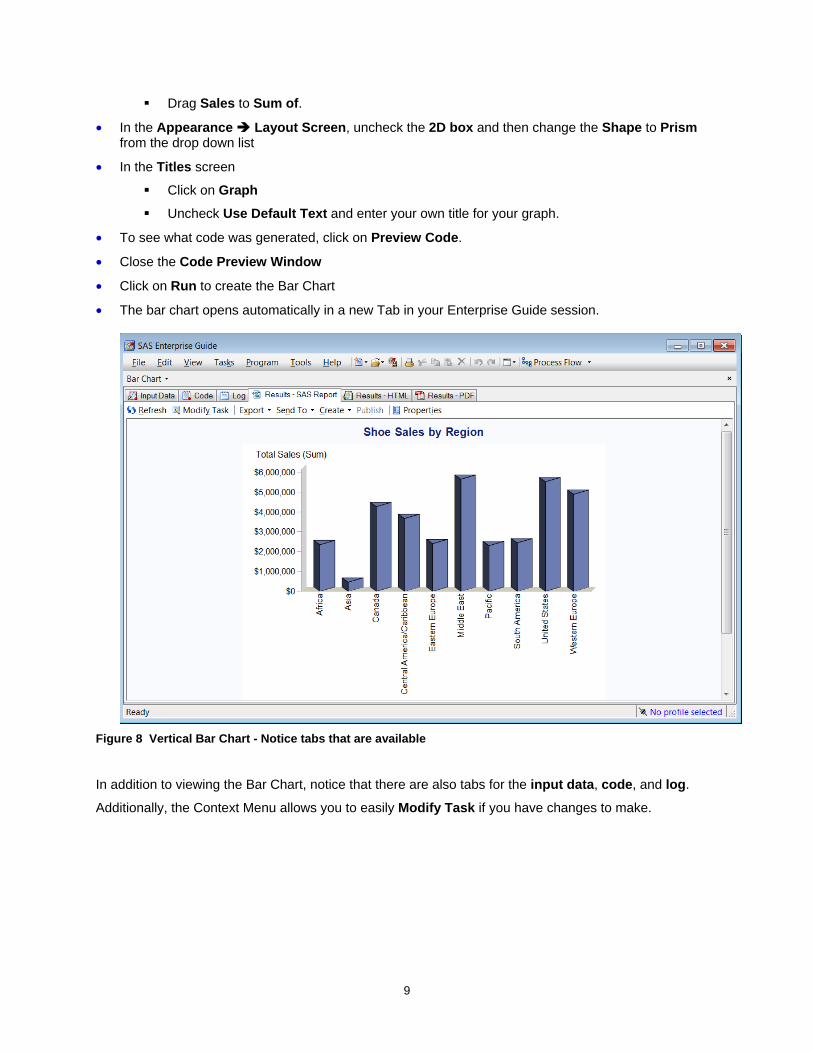
Drag Sales to Sum of.
• In the Appearance Layout Screen, uncheck the 2D box and then change the Shape to Prism from the drop down list
• In the Titles screen
Click on Graph
Uncheck Use Default Text and enter your own title for your graph.
• To see what code was generated, click on Preview Code.
• Close the Code Preview Window
• Click on Run to create the Bar Chart
• The bar chart opens automatically in a new Tab in your Enterprise Guide session.
Figure 8 Vertical Bar Chart - Notice tabs that are available
In addition to viewing the Bar Chart, notice that there are also tabs for the input data, code, and log.
Additionally, the Context Menu allows you to easily Modify Task if you have changes to make.

10
The Code tab displays the program that was created to produce the Bar Chart, and there are many visual cues to help with code readability and understanding.
• Code coloration helps you view possible code issues (try removing a semicolon or quote and watch the color adjust)
• SAS Documentation displays when you hover your mouse over keywords (Figure 9).
Figure 9 Documentation Displays Easily

11
TASKS ARE FUN, BUT LET’S BORROW THE CODE AND MAKE CHANGES
If you would like to copy this code as a starting point for your programs, you can save the generated code, and then make modifications.
• Select the code tab (see figure 9)
• Select the AXIS, GOPTIONS, TITLE, and FOOTNOTE statements and the PROC GCHART statements up to the RUN; statement
• Right click anywhere in the highlighted code, and select Copy
• Select File New Program
• Paste the copied code into the new (empty) Program Tab (Figure 10).
Figure 10 Creating a New Program
PRODUCTIVITY TIPS FOR PROGRAMMING IN ENTERPRISE GUIDE
A few pointers about working with a Program in Enterprise Guide:
• Notice the * in the Program Tab above; it is a reminder to save the most recent changes.

12
• To Save your program, select the Save down arrow, and select Save As. Specify a name and
location for your program. The * will disappear and the program name will appear above the tab.
• Code generated by Tasks normally creates a temporary view of your data. In Figure 10, notice PROC GCHART uses WORK.SORTTempTableSorted. Update the dataset name when creating your own program.
• Many productivity tools are available for programmers including
o Code completion (see figure 11) for Data Set Name completion
o Parentheses matching
o Syntax suggestions.
Figure 11 Code Completion - for Libraries and Data Set Names
13
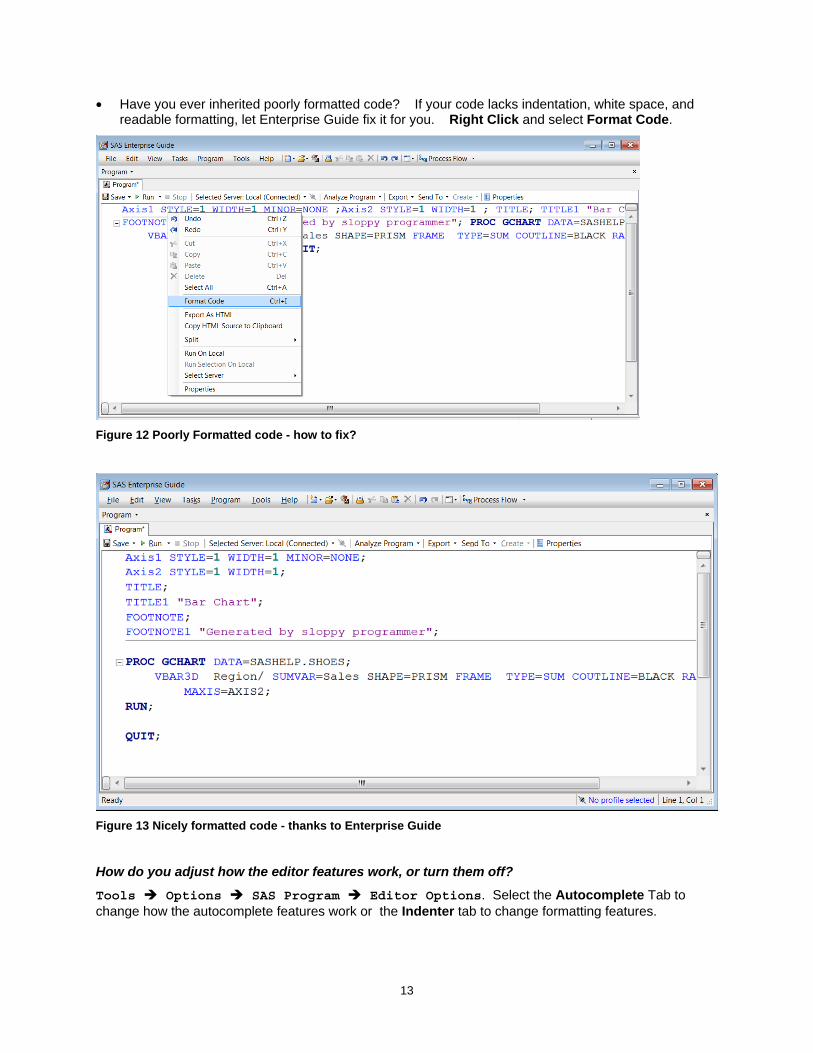
• Have you ever inherited poorly formatted code? If your code lacks indentation, white space, and readable formatting, let Enterprise Guide fix it for you. Right Click and select Format Code.
Figure 12 Poorly Formatted code - how to fix?
Figure 13 Nicely formatted code - thanks to Enterprise Guide
How do you adjust how the editor features work, or turn them off?
Tools Options SAS Program Editor Options. Select the Autocomplete Tab to change how the autocomplete features work or the Indenter tab to change formatting features.
14
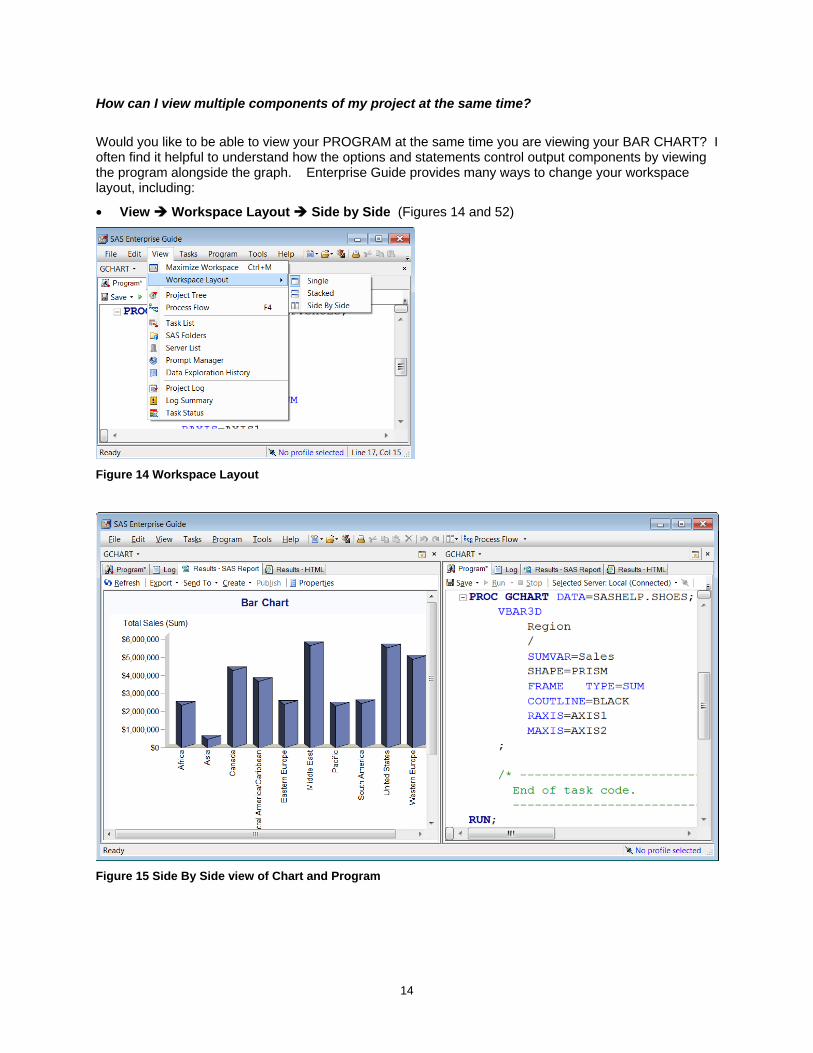
How can I view multiple components of my project at the same time?
Would you like to be able to view your PROGRAM at the same time you are viewing your BAR CHART? I often find it helpful to understand how the options and statements control output components by viewing the program alongside the graph. Enterprise Guide provides many ways to change your workspace layout, including:
• View Workspace Layout Side by Side (Figures 14 and 52)
Figure 14 Workspace Layout
Figure 15 Side By Side view of Chart and Program
15
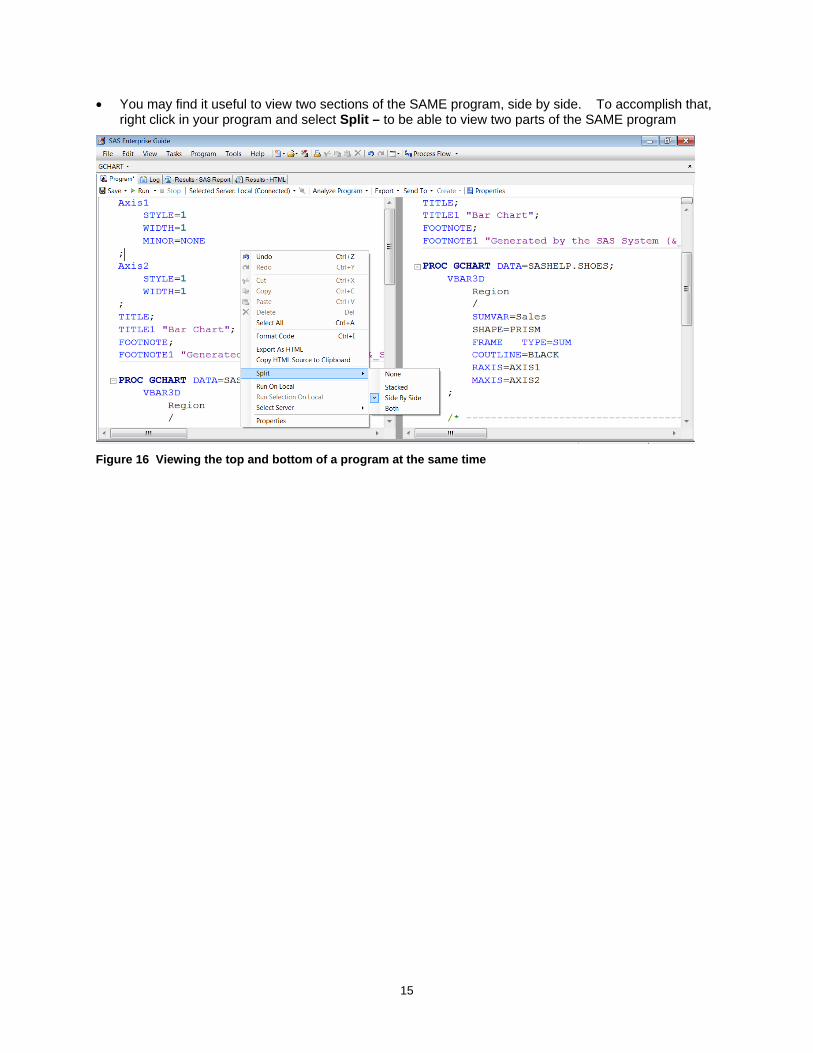
• You may find it useful to view two sections of the SAME program, side by side. To accomplish that, right click in your program and select Split – to be able to view two parts of the SAME program
Figure 16 Viewing the top and bottom of a program at the same time
16
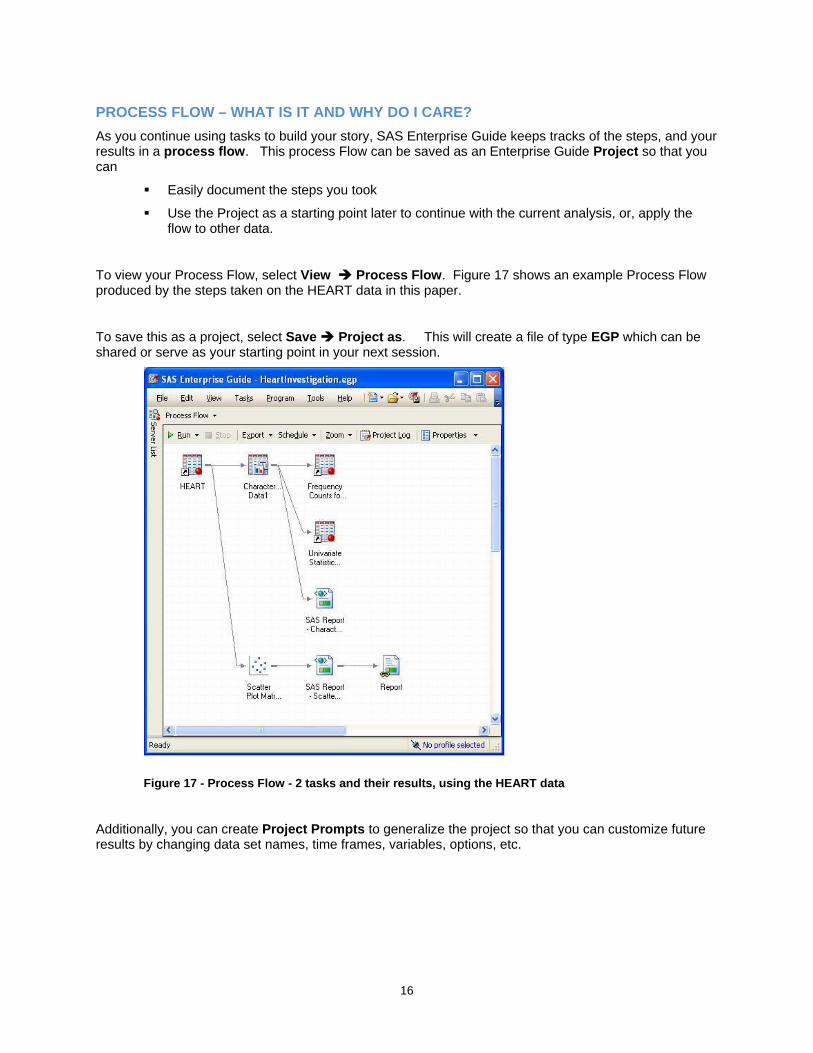
PROCESS FLOW – WHAT IS IT AND WHY DO I CARE?
As you continue using tasks to build your story, SAS Enterprise Guide keeps tracks of the steps, and your results in a process flow. This process Flow can be saved as an Enterprise Guide Project so that you can
Easily document the steps you took
Use the Project as a starting point later to continue with the current analysis, or, apply the flow to other data.
To view your Process Flow, select View Process Flow. Figure 17 shows an example Process Flow produced by the steps taken on the HEART data in this paper.
To save this as a project, select Save Project as. This will create a file of type EGP which can be shared or serve as your starting point in your next session.
Figure 17 - Process Flow - 2 tasks and their results, using the HEART data
Additionally, you can create Project Prompts to generalize the project so that you can customize future results by changing data set names, time frames, variables, options, etc.

17
PRESENTING THE RESULTS
A challenge we all face is getting our results into a presentable format. SAS Enterprise Guide provides a variety of output formats for viewing or saving the results of tasks, as well as an excellent tool to pull results together into a single report template.
Most results within Enterprise Guide can be
Exported to HTML, XML, or PDF - select Export
Sent to WORD, EXCEL, PPT - select Send To
Saved as a report in the Enterprise Guide environment. - select Create.
You can also use Tools Options Results to
control the format of all results that you produce
customize the formats and properties of the different result formats.
If you would like to use Enterprise Guide to assemble multiple pictures and tables into a single location, select File New Report, select the reports from those you have created, and begin assembling your report. You can even bring in images such as company logos or pictures that support the data.
CONCLUSION
SAS Enterprise Guide provides a powerful and flexible environment to let you focus your time and energies on finding and delivering actionable insights for effective decision making. Instead of learning and writing SAS programs, you can explore the built-in tasks and capabilities to fulfill your reporting and analytics needs.
RECOMMENDED READING
For additional SAS® Enterprise Guide® presentations and explanations, please see
• http://www.sascommunity.org/wiki/Presentations:Marje_Papers_and_Presentations
• http://blogs.sas.com/content/sasdummy/2014/02/17/favorite-eg-tricks-fecht/
• http://blogs.sas.com/content/sasdummy/2014/07/09/performance-tips-sas-eg-datagrid/
• Join the Enterprise Guide Community, and other communities at communities.sas.com
CONTACT INFORMATION
Your comments and questions are valued and encouraged. Contact the author at:
Marje Fecht Prowerk Consulting [email protected] www.prowerk.com
SAS and all other SAS Institute Inc. product or service names are registered trademarks or trademarks of SAS Institute Inc. in the USA and other countries. ® indicates USA registration.
Other brand and product names are trademarks of their respective companies.