Earthquake Disaster - indiaenvironmentportal3.2 City/Town Housing Information 13 3.3 Data Collection...
56
Transcript of Earthquake Disaster - indiaenvironmentportal3.2 City/Town Housing Information 13 3.3 Data Collection...


Earthquake DisasterRisk Index Report
50 Towns & 1 District in Seismic Zones III, IV and V

Earthquake Disaster Risk Index Report
A publication of:National Disaster Management AuthorityMinistry of Home AffairsGovernment of IndiaNDMA BhawanA-1, Safdarjung EnclaveNew Delhi - 110029
September 2019
When citing this manual, the following citation should be used: Earthquake Disaster Risk Index ReportA publication of the National Disaster Management Authority, Government of India.September 2019, New Delhi
These Earthquake Disaster Risk Index Report are formulated under the Chairmanship of Lt. Gen. (Retd.) N.C. Marwah Member, NDMA, in consultation with various stakeholders, regulators, service providers, and specialists in the subject field concerned from all across the country.

National Disaster Management Authority
Earthquake DisasterRisk Index Report
50 Towns & 1 District inSeismic Zones III, IV and V
September 2019

iv
NatioNal Disaster MaNageMeNt authority

v
EarthquakE DisastEr risk inDEx rEport
Table of ContentsList of Figures vi
List of Tables vi
Preface vii
Acknowledgement ix
Executive Summary xi
1 Introduction & Scope of Work 11.1 Scenario of Earthquake Disaster Worldwide 1
1.2 Scenario of Earthquake Disasters in India 1
1.3 Impact of Urbanization in India 3
1.4 Scope of Work 4
2 Literature Review and Methodology 52.1 Introduction 5
2.2 Review of existing Risk Assessment methods 6
2.3 Objectives and Advantages of EDRI 8
2.4 Methodology 8
3 Data Collection in 50 Cities and Towns 133.1 Introduction 13
3.2 City/Town Housing Information 13
3.3 Data Collection Format 16
3.4 EDRI 17
4 Data Analysis and Results 214.1 Introduction 21
4.2 Major Factors Contributing to Risk 21
4.3 Cities with similar challenges 23
5 Major Observations 255.1 Cities in Seismic Zone V 25
5.2 Cities in Seismic Zone IV 27
6 Way Forward 31
Bibliography 33

vi
NatioNal Disaster MaNageMeNt authority
List of FiguresFigure 1.1: Percentage of threat to urban population in industrialized and
developing countries 1
Figure 2.1: (a) Seismic Hazard Map, and (b) Housing Threat Factor 7
Figure 2.2: Flowchart for Hazard Estimation of a Building 9
Figure 2.3: Flowchart for Exposure Estimation of a Building (values of Importance
Factor I recommended in IS1893 (1) are given in brackets) 10
Figure 2.4: Flowchart for Vulnerability Estimation of a Building (values of Economic
Loss Inducing Factors are given alongside the flowchart 11
Figure 5.1: Possible Damage States of different building typologies in the cities in
seismic Zone V with highest EDRI 26
Figure 5.2: Possible Damage States of building typologies in the cities in seismic
Zone IV cities with highest EDRI 28
List of TablesTable 1.1: Brief overview of earthquake incidents in India 2
Table 2.1: Casualties during past earthquake events 6
Table 3.1: Selected Cities Located in Seismic Zone V 13
Table 3.2: Selected Cities Located in Seismic Zone IV 14
Table 3.3: Selected Metro Cities 14
Table 3.4: Tehsils in Bareilly District (Uttar Pradesh) 15
Table 3.5: Villages visited in each Tehsil of Bareilly District (Uttar Pradesh) 15
Table 3.6: Methods followed for Data Collection of 50 Cities 16
Table 3.7: Sample Calculation of EDRI of all Surveyed Buildings and EDRI of
Pithoragarh City 17
Table 3.8: Comparison of Final Score and Level of Risk/Damage of Building 18
Table 4.1: Sub-groups of cities with High and Medium risk level 23
Table 5.1: Five cities in seismic Zone V cities with highest EDRI 25
Table 5.2: Top ten cities in seismic Zone IV with highest EDRI 27

vii
EarthquakE DisastEr risk inDEx rEport
jk"Vªh; vkink izca/u izkf/dj.kNational Disaster Management Authority
Hkkjr ljdkjGovernment of India
PrefaceIndia’s hazard profile shows that about 59 percent area of India is vulnerable to
moderate to major earthquakes. It is evident from past earthquakes such as Manipur (2016), Nepal (2015), Sikkim (2011), Kashmir (2005), Bhuj (2001), Chamoli (1999), Jabalpur (1997) and Latur (1993) that all type of buildings sustain damage if not designed properly. The experiences of these earthquakes have demonstrated that many typical buildings of different types have sustained significant damage in these earthquakes. More than 90% of the casualties in past earthquakes in India have occurred due to collapse of houses and structures. The loss of life and property can be minimized significantly by ensuring better code compliance of upcoming constructions and undertaking seismic retrofitting of existing buildings thereby making them earthquake resilient. Therefore, the need was felt to quantify the earthquake risk to the buildings so that decision makers put the adequate structural measures after prioritizing the buildings.
NDMA through International Institute of Information Technology (IIIT) Hyderabad has developed Earthquake Disaster Risk Index (EDRI) for 50 cities and 1 district on pilot basis. In this pilot study, the cities were selected based on the population density, housing threat factor and cities identified by Government of India as Smart Cities. The major area of focus is the seismically active regions in India, i.e., seismic zones IV and V. The EDRI report has been prepared based on the field visit of 25 cities and collection of secondary data from the remaining cities’ officials.
The risk has been categorized as Low, Medium and High for easy understanding of the decision-makers and town planners. We hope that the report will be of help to concerned city officials and act as a guide towards disaster risk mitigation and preparedness efforts.
Shri Kamal Kishore Dr. D. N. Sharma Lt.Gen.N.C.Marwah (Retd.) Shri G. V. Venugopal Sarma, IAS Member Member Member Member-Secretary

viii
NatioNal Disaster MaNageMeNt authority

ix
EarthquakE DisastEr risk inDEx rEport
Acknowledgements
I acknowledge the valuable contribution of Prof. Pradeep Kumar Ramancharla, International Institute of Information Technology (IIIT), Hyderabad and his team for preparing this report.
The credit is also due to the Project Technical Committee members who constantly guided and monitored the progress of the same during the course of the project implementation.
I also acknowledge the concerned city officials for hosting the field visit by the IIIT team and providing the required data to evaluate the Earthquake Disaster Risk Index.
Efforts of Mitigation Division, NDMA officials for coordinating during the course of the project are acknowledged.
It is hoped that this report will prove to be useful to the concerned city officials, town planners and other stakeholders to undertake the mitigation measures for earthquake risk reduction.
(Sandeep Poundrik)Advisor (Mitigation)

x
NatioNal Disaster MaNageMeNt authority

xi
EarthquakE DisastEr risk inDEx rEport
Executive Summary
BackgroundThe Disaster Mitigation Act, 2005 (DM Act, 2005) seeks a paradigm shift from the hitherto
relief-centric approach to a more proactive, holistic and integrated approach of strengthening disaster mitigation, preparedness and response. NDMA acknowledged that initiatives be taken up that are not only significant and far-reaching, but they also highlighted the need for a holistic and integrated risk reduction strategy. On the basis of these deliberations, the NDMA and IIIT Hyderabad together have developed an Earthquake Disaster Risk Index (EDRI), to forecast the relative risk within a city and across cities based on three important factors i.e., topographical condition (known as Hazard), total number of people and buildings spread in the topography (known as Exposure) and the present condition of the buildings (known as Vulnerability). This forecast of risk within a city projects the overall damage or loss that city may experience in expected earthquakes in future and the necessary precautions to be taken.
Need for Estimating Risk in IndiaIn the last 2-3 decades, India has experienced many earthquakes that have caused significant
loss of life as well as property. The key observations in those severely affected areas were the lack of awareness in people about the earthquake and its consequences, and absence of a mechanism to ensure earthquake resistant buildings. A large part of these losses are directly because of housing typologies in practice in the country. For example, the 2001 M7.7 Bhuj (Gujarat, India) earthquake caused about 13,000 deaths, whereas relatively smaller size 1993 M6.4 Killari (Maharastra, India) earthquake caused about 8,000 deaths; this colossal loss of life is attributed directly to the collapse of houses.
Rapid urbanization of Indian cities in last few decades has put large pressure on the housing industry to speed up the development. This fast pace of construction with limited and non-holistic planning has led to unregulated development of low-to-medium rise buildings in Tier II cities and medium-to-high rise building in Tier I cities, causing serious threat to life and property during disasters. There are ongoing endeavours in the form of frequent revision of design codes, capacity building of architects, engineers and other stakeholders of the construction industry, developing disaster awareness, towards achieving reduction in loss of life and economic losses during future events. An important step towards this is to assess periodically the earthquake risk in cities in India, which will help mitigate negative consequences, prepare and respond to the next event. Earthquake Disaster Risk Index of cities in Seismic Zones IV and V is an attempt to estimate the earthquake risk of the country to help reduce the social and economic consequences due to an earthquake. In particular, it will help provide a quantitative feel of the impending risk involved, and its consequences, and guide government agencies for prioritizing disaster preparedness and response measures in the more vulnerable cities.

xii
NatioNal Disaster MaNageMeNt authority
Thus, it is critical to estimate Earthquake Disaster Risk of cities and use the same to guide disaster risk mitigation and preparedness efforts.
Earthquake Disaster Risk IndexEarthquake Disaster Risk Index combines nonlinearly the earthquake hazard, vulnerability and
exposure of a city. Each of these parameters is sub-divided in pointers, and depending on the location, built environment, and usage, weightages were assigned to each of the pointers, which contribute EDRI. Thus, EDRI is a composite risk index that allows direct comparison of the relative overall earthquake disaster risk of cities nationwide, and captures the relative contributions of various factors to that overall risk.
MethodologyEarthquake risk is represented as the product of the prevalent earthquake hazard (H) of the
area, the exposure (E) of persons to the earthquake hazard, and known vulnerability (V) of the houses in that area. Of these three factors, Vulnerability plays an important role to forecast the expected damage in a building. This vulnerability parameter is divided further into two sub-factors namely, Life Threatening Factors (LTF) and Economic Loss Inducing Factors (ELIF). LTF indicates the parameters which directly related to the life loss, whereas ELIF indicates the damage expected in the building. The procedure for risk calculation of individual building involves a set of questions which need answers only in the form of ‘Yes’ or ‘No’. Each question has a weightage. This weightage varies across questions. The questions are selected in such a way that they cover all three components of risk, i.e., hazard, exposure and vulnerability. The risk is estimated of individual building typology in a city, based on the surveyed buildings in the city and finally risk index of the city is projected using the census data of total number of buildings in that city of that typology. When more than one typology is present in the city, above procedure is employed for buildings of each typology first, and then averaged over the total number of buildings in the city.
Pilot StudyIn the pilot study, the cities were selected based on the population density, housing threat
factor and the cities identified by Government of India to develop as Smart Cities. The major area of focus is the seismically active regions in India, i.e., seismic zones IV and V. Considering these factors, a total of 50 cities were selected. Of these, 15 cities were selected from zone seismic V, 28 cities from seismic zone IV, and remaining 7 are metro cities. A Few of the metro cities lie in seismic zone III, also but were selected considering the high population density and high housing threat factor.
OutcomeThe present built environment in all the 50 cities were studied to estimate risk of each city,
and are placed in three categories (namely Low, Medium and High) risk as shown in the table below:
S.No. Town State Hazard Exposure Vulnerability EDRI1 Itanagar Arunachal
PradeshHigh Low Medium Medium

xiii
EarthquakE DisastEr risk inDEx rEport
2 Guwahati Assam High Low Medium Medium3 Dispur Assam High Medium Medium Medium4 Port Blair A&N Islands High Low Medium Medium5 Darbhanga Bihar High Medium High Medium6 Bhuj Gujarat High Low Low Low7 Mandi Himachal
PradeshMedium Low High Medium
8 Srinagar Jammu & Kashmir
High Medium Medium High
9 Imphal Manipur High Medium Medium Medium10 Shillong Meghalaya High Medium Medium Medium11 Aizawl Mizoram High High High High12 Kohima Nagaland High Medium Medium Medium13 Agartala Tripura High Medium Medium Medium14 Chamoli Uttarakhand HighLow Medium Medium15 Pithoragarh Uttarakhand High Medium High High16 Patna Bihar Medium Medium High Medium17 Bhagalpur Bihar High Medium Medium High18 JamnagarGujarat Medium Medium Medium Medium19 Faridabad Haryana Medium Medium Medium Medium20 Gurgaon Haryana Medium Medium Medium Medium21 Panipat Haryana High Medium Medium High22 Panchakula Haryana Medium Medium Medium Medium23 Shimla Himachal
PradeshMedium Medium High High
24 Solan Himachal Pradesh
Medium High Medium High
25 Jammu Jammu & Kashmir
High Medium Medium Medium
26 Ratnagiri Maharashtra Medium Medium Medium High27 Amritsar Punjab Medium Medium Medium Low28 Jalandhar Punjab Medium Medium Medium Medium29 Ludhiana Punjab Medium Medium Low Low30 Alwar Rajasthan Medium Medium Low Medium31 Gangtok Sikkim Medium High Medium High32 Ghaziabad Uttar Pradesh High High Low Medium33 Gautam Budh
NagarUttar Pradesh Medium Medium Medium Medium
S.No. Town State Hazard Exposure Vulnerability EDRI

xiv
NatioNal Disaster MaNageMeNt authority
34 Meerut Uttar Pradesh Medium Medium Medium Medium35 Bareily Uttar Pradesh Medium Medium Low Medium36 Mathura Uttar Pradesh High Medium Medium Medium37 Moradabad Uttar Pradesh Medium Medium Medium High38 Dehradun Uttarakhand Medium Low Medium Low39 Uttarkashi Uttrakhand High Low High High40 Nainital Uttarkhand High Medium High High41 Chandigarh UT Medium Medium Medium Medium42 Darjeeling West Bengal Medium Medium Medium Medium43 Siliguri West Bengal Medium Medium Medium Low44 Vijayawada Andhra Pradesh Medium High Medium High45 Ahmedabad Gujarat Medium Low Medium Medium46 Mumbai Maharashtra Medium High Medium Medium47 Pune Maharashtra Medium High Medium Medium48 Chennai Tamil Nadu Medium Low High Medium49 Kolkata West Bengal Medium Medium Medium Medium50 Delhi NCT of Delhi Medium Medium Medium Medium
As cities were selected from the higher seismic zones, no city has low hazard level. Cities with hilly terrain have low exposure, whereas cities with flat terrain and high populations have high exposure. The vulnerability of each city depends only on the construction typology adopted, of the 50 cities, the vulnerability of built environment is low in only 5 cities, medium in 36 cities and high for 9 cities. The final result of the EDRI shows that, of the 50 cities, only 7 cities have low level risk, whereas 30 cities medium level risk and 13 cities high level risk. This scenario is alarming and needs immediate attention.
Note: Results presented above are based on the sample survey conducted and are based on the data supplied by the city officials. Hence, more accurate risk index can be calculated if sample size is more and also spread out uniformly throughout the city/town.
The Way Forward…Earthquake Disaster Risk Index obtained is based on the preliminary screening of different
housing typologies of selected cities. It further requires a detailed structural evaluation by seismic design professionals for highly vulnerable buildings so that suitable retrofitting measures can be adopted by the policy makers. Other remaining cities lying in zone IV & V shall be targeted in the similar manner. As the screening conducted was on a macro level, so highlighting the hotspot area which are lacking in adequate structural parameter and need utmost attention can be figured out. Further, Extensive field study has to be carried out to get a realistic picture and this can be achieved by inclusion of the local body at the cities itself like city official, local colleges which can aid in task and can help in developing and maintaining the inventory at the city level itself.
S.No. Town State Hazard Exposure Vulnerability EDRI
xv
EarthquakE DisastEr risk inDEx rEport
In order to better understand the potential risk, an inventory of the surveyed buildings has to be developed such that it can be utilized in case of future event and which in turn help in planning and implementation of mitigation strategies. An Intercity and Intra city comparison of the similar kind of building typologies can be made to notch out the different parameter considered presently such that it can help coming to conclusion for determining the risk estimation in a much better way and need to realize whether additional parameter is required apart from (a) Siting Issues; (b) Soil and Foundation; (c) Architectural Features; (d) Structural Aspects and (e) Material and Construction Details.
Periodic Evaluation of the EDRI & Technical structural safety audit of the buildings shall have to be planned such that present conditions can be compared from the inventory to have a reality check and to gauge out the pattern of improvement and based on which further appropriate measure shall have to be adopted to reduce the risk factor over the period of time. i.e. from high to moderate, moderate to low. Beside all these a ranking system should be developed so that the construction pattern may be gauged and link with the associated pattern which would help in identifying the trend in the construction and associated policy intervention may be fused accordingly. which can help in identifying the critical building and such that mitigation plan can execute effectively.
The EDRI will be helpful in increasing significant awareness among the people residing in highly seismic vulnerable area on broad perspective. It can be achieved by conducting awareness programme and establishment of demonstration retrofitting unit, teaching risk reduction measures, acquiring lifesaving skill and a way to respond during and after earthquake such that even local people should be prepared and can plan their immediate mitigation strategies in case of mishappening; and able to identify the vulnerable hazardous buildings and can plan for quick repair, restoration, and retrofit the structure to make it function thereby reducing the life and property losses. Stringent actions shall have to be implemented into practices against stakeholder for adopting / following illicit practices or deviating away from the laid down guidelines.
Thus, Estimating Earthquake Disaster Risk Index requires active participation of three principal stakeholders, namely:
(1) Academia: It shall (a) identify and document various building typologies; (b) study these typologies in detail and describe ideal building in each typology category; (c) identify penalties for each departure by conducting analytical and/or experimental research and to introduce the new technique in the market that can be adopted by industry ; and (d)train graduate and post graduate students to identify the different kind of distress present in the buildings and make them understand the structural and non-structural deficiency (e) introducing the retrofit course as part of course curriculum (f) train manpower for undertaking design of new constructions and retrofit of existing buildings.
(2) Industry: It shall: (a) outlaw unsafe typologies and encourage good typologies within the laid guidelines; (b) propose new technologies; (c) build facilities to undertake full-scale testing; (d) build skills in its artisans; (d) encourage continuing education and research; (e) undertake to build competence in retrofit of unsafe constructions; (f) actively engage in developing standards; and (g) update its fraternity with the latest developments in earthquake safety.
(3) Government: It shall ensure that policies and systems (with legal standing) are in place for:

xvi
NatioNal Disaster MaNageMeNt authority
(a) ensuring all future constructions to be earthquake resistant; (b) identify cities whose earthquake risks are high; and (c) Seek peer review of structural safety of new constructions and modifications to existing constructions. (d) Setting up the periodic Technical structural safety Audit to ensure the safety and to understand the present condition of the buildings. (e)Stringent action shall be taken against the stakeholders for deviating away from the guidelines. (f) Establishment of the Demonstration unit to aware people and make them understand the severity of the risk involved.
1
EarthquakE DisastEr risk inDEx rEport
Introduction and Scope of Work11.1 Scenario of Earthquake Disasters Worldwide
Physical Infrastructure is built across the world with an intent to meet the needs of people. However, often, sufficient attention was not paid on safety of these structures at the time of design and construction. In addition, natural hazards such as floods, cyclones, fires and earthquakes are also disrupting these threats. Some of the significant and devastating disasters include, but not limited to, 2004 Asian Boxing Day Tsunami killing 2,30,000 people across 14 countries, 2004 floods in Pakistan affecting 20 million people, 2010 Haiti earthquake causing in a human life loss of 3,16,000 (Cross 2016).
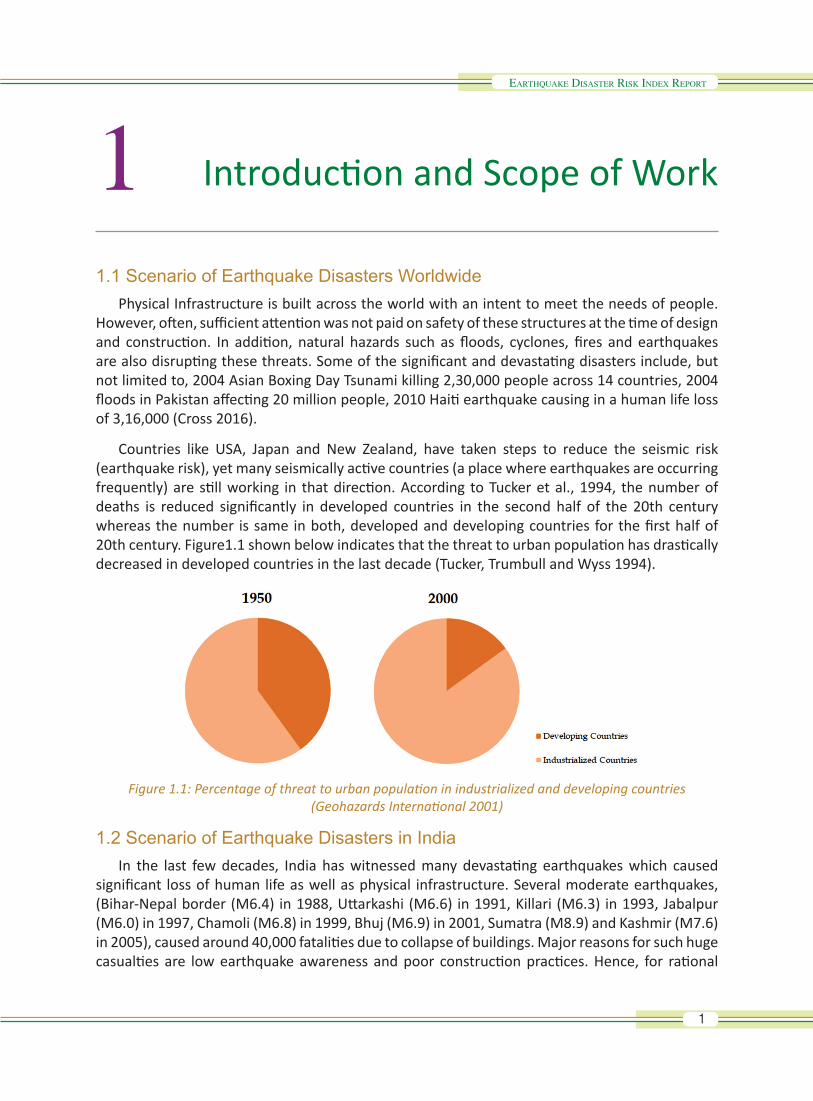
Countries like USA, Japan and New Zealand, have taken steps to reduce the seismic risk (earthquake risk), yet many seismically active countries (a place where earthquakes are occurring frequently) are still working in that direction. According to Tucker et al., 1994, the number of deaths is reduced significantly in developed countries in the second half of the 20th century whereas the number is same in both, developed and developing countries for the first half of 20th century. Figure1.1 shown below indicates that the threat to urban population has drastically decreased in developed countries in the last decade (Tucker, Trumbull and Wyss 1994).
Figure 1.1: Percentage of threat to urban population in industrialized and developing countries (Geohazards International 2001)
1.2 Scenario of Earthquake Disasters in IndiaIn the last few decades, India has witnessed many devastating earthquakes which caused
significant loss of human life as well as physical infrastructure. Several moderate earthquakes, (Bihar-Nepal border (M6.4) in 1988, Uttarkashi (M6.6) in 1991, Killari (M6.3) in 1993, Jabalpur (M6.0) in 1997, Chamoli (M6.8) in 1999, Bhuj (M6.9) in 2001, Sumatra (M8.9) and Kashmir (M7.6) in 2005), caused around 40,000 fatalities due to collapse of buildings. Major reasons for such huge casualties are low earthquake awareness and poor construction practices. Hence, for rational

2
NatioNal Disaster MaNageMeNt authority
understanding of the complex problem, it is necessary to carry out Earthquake Disaster Risk Index of cities and districts and use the same for disaster risk mitigation and preparedness efforts.
It is common practice in India that most houses are constructed by individual owners without much guidance on the seismic safety measures that are required while constructing a house or a building. The contractor construct houses to meet the demand and conveniences of owners, without the involvement of engineers or architect. Such houses or buildings are called Non-engineered constructions which demonstrate poor behaviour during earthquake shaking, leading to severe damage or even collapse of structures. Table 1.1 shows the overview of several earthquake incidents that caused devastating building collapses in India.
Table 1.1: Brief overview of earthquake incidents in India
Date Location Magnitude /MSK Intensity
Remarks
8 February, 1900
Coimbatore 6.0/VII Shock was felt throughout south India. Coimbatore and Coonoor worst affected.
4 April, 1905 Kangra 8.0/X ~19,000 deaths. Considerable damage in Lahore. High intensity around Dehradun and Mussorie VIII
15 January, 1934
Bihar-Nepal 8.3/X ~7,000 deaths in India and ~3,000 deaths in Nepal. Liquefaction in many areas.
26 June, 1941 Andaman & Nicobar Islands
7.7/VIII Triggered Tsunami-1.0m high on the east coast, causing many deaths.
15 August, 1950
Assam-Tibet 8.6/XII About 1,500 deaths in India and ~2,500 in China. Caused huge landslides which blocked rivers and later caused flood.
21 July, 1956 Anjar (in Kutch) 6.1/IX About 115 deaths. Part of Anjar on rocky sites suffered much less damage comparatively.
10 December, 1967
Koyana, Maharashtra
6.5/VIII About 180 deaths. Caused significant damage to the concrete gravity dam.
21 August,1988 Bihar-Nepal 6.6/IX About ~709 deaths.20 October, 1991
Uttarkashi 6.4/IX ~750 deaths. 56m span Gawana bridge 6 km from Uttarkashi collapsed.
30 September, 1993
Killari, Maharashtra
6.2/IX ~8,000 deaths. Most deadly earthquake in India since Independence.
22 May, 1997 Jabalpur 6.0/VIII ~40 deaths and ~1,000 injured. Concrete frame buildings with open ground storey suffered damage.
26 January, 2001
Bhuj (Kutch) 7.7/X ~13,800 deaths. Numerous modern multistorey buildings collapsed. Number of medium and small earth dams severely damaged.

3
EarthquakE DisastEr risk inDEx rEport
26 December, 2004
Sumatra 9.4/VI (in Andaman)
Caused most devastating Tsunami in the history resulting in ~2,27,898 deaths in 14 countries.
8 October, 2005
Kashmir 7.6/VIII Poor performance of masonry buildings caused many life losses. Unique construction found in this region Dhajji Diwari showed very good seismic performance.
28 September, 2011
Sikkim 6.9/VI ~80 deaths. Large number of landslides, significant damage to the buildings and infrastructure.
Source: (S. K. Jain 2016)
The table indicates the likely potential seismic areas of the country. Considering the potential of such seismic areas, hazardous zones were identified by categorizing the different parts of the country. According to the guidelines issued by Bureau of Indian Standards, the country is divided into 4 seismic zones; namely zone II, III, IV and V in the increasing order of the intensity and frequency of occurrences of earthquake incidents. The key observation in those severely affected areas was lack of earthquake resistant features in the buildings or lack of awareness among people on the consequences of earthquakes. For instance, the 2001 Bhuj earthquake (Gujarat, India) (M7.7) incident caused about 13,800 deaths whereas 1993 Killari (Latur, India) (M6.4) earthquake caused 8,000 deaths. In both the cases, the severe loss of human life is mainly because of collapse of houses [ (Jain, Lettis, et al. 2001), (S. K. Jain, C. V. Murty and N. N. Chandak, et al. 1994)].
Another important contributing factor for such collapses of houses is the lack of professional environment in the construction field. In fact, there is no system available which enforces builders and contractors to comply with seismic codes and guidelines issued by Bureau of Indian Standards (BIS). There was also no such system exists either during construction and post construction to penalize the violators. In addition to this, adopting new construction practices, that are available in others countries, in India is proven to be disruptive. For example, most of the school buildings constructed with precast construction technology, adopted from outside the country, collapsed in most undesirable manner leading to many casualties of school children. Any such innovative technology or earthquake safety practices should align with Indian construction practices including geological conditions. Further, there are some engineering aspects of local housing typology, which require appropriate measures to be taken explicitly.
1.3 Impact of Urbanization in IndiaIndian Administrative structure has classified the liveable localities into several categories
based on the geography conditions of a locality and the population density. A hamlet, Village, Panchayat, Town, Municipality, City and Metro Cities etc., are all categorized and fixed a range of the population to live-in. This is to ease the administration process of policy makers. For example, a Town population was fasten between 50,000 and below 1,00,000; In case, more than One Lakh then it should be called as a City; Similarly, if a population ranges more than 10,00,000 – it should be a Metro City. But, during the recent times this range was exceeding than the defined one’s. Especially during 80’s and 90’s period, slowly, people from villages, towns have started migrating to the Urban Cities– this is known as Urbanisation.
4
NatioNal Disaster MaNageMeNt authority
This phenomenon is increasing due to the advantages that the urban cities have viz., accessibility to employment opportunities, education, hospital facilities and more importantly, standards of living etc. This resulted into produce more human resources, decent conditions in urban cities. This transformation helped to promote Urban Cities much better than their previous regime resulting into more development. Especially in India, nearly 2/3rd of population is living in rural areas and their major income source is from agriculture sector. At this juncture, majority of academic research was carried out on rural areas and their needs because of the population density. In contrast, due to the urbanization, more industries are established in majority of the Cities. But, the affect of recent low-income reduction rate in agriculture sector, agriculture labour started shifting their profession to industries in Cites.
Because of this shift, nearly 31.6% of the Indian population (377.1 million) is living in urban areas, currently contributing to 63% of GDP of the Nation. Escalating these numbers, it is also estimated by 2030, nearly 40% of population is going to settle down in urban cities that may contribute to 75% of the GDP of the Nation. But, due to this migration, the government’s responsibilities are also challenging while meeting the people’s desires. For instance, Government’s one function is to provide basic facilities such as decent water, sanitation, education, roads, parks and health facilities on priority basis. This resulted governments to concentrate on providing basic amenities in the Cities by giving high priority on setting up sufficient infrastructure.
However, there was very less attention paid on securing this infrastructure and providing safety of the City residents. Especially, the 2004 Tsunami incident exposed policy makers to concentrate on protecting such physical infrastructure. Rigorous research was carried on identifying post incident measures to secure society from natural calamities (e.g., flood, fires, cyclones and earthquakes etc). Globally, much attention was also paid to Disaster Risk Reduction in the forum of UN’s Sustainable Development Goals (SDG’s) as a major concern. The NDMA’s disaster management policy introduced in the year 2009 was another timely step. With this background, this study aims to find the essence of Disaster Mitigation Risks and future of Urban Cities in Indian Context to leverage the risk preparedness.
1.4 Scope of WorkThere are ongoing endeavours in the form of frequent revision of design codes, capacity
building of architects, engineers & other stakeholders of the construction industry, and developing disaster awareness, towards achieving reduction in loss of life and economic losses (i.e., loss of time, business etc.) during future events. An important step towards this is to assess periodically the earthquake risk of cities in India, which will help mitigate negative consequences, prepare, and respond to the next event.
Preparing the Earthquake Disaster Risk Index of cities in Seismic Zones IV and V is an attempt to estimate the earthquake risk of the country to help reduce the social and economic consequences due to an earthquake. In particular, it will help provide a qualitative feel of the impending risk involved and its consequences, and guide governmental agencies for prioritising disaster preparedness and response measures in the more vulnerable cities.

5
EarthquakE DisastEr risk inDEx rEport
Literature Review and Methodology
22.1 Introduction
In the last 25 years, India has witnessed several moderate earthquakes that caused around 40,000 deaths, largely due to collapse of buildings. One of the main reasons for such large casualties is lack of awareness of earthquake risks and poor construction practices (Table 2.1). The losses could have been reduced, if there was preparedness for the expected disaster. Such preparedness can be initiated by an assessment of earthquake disaster risks. It also helps in enabling the mitigation efforts for future earthquake events. Risk assessment will produce quantitative value that can result in a qualitative sense of severity of problem. To expedite the risk reduction on priority, it is necessary to compare the relative seismic risk levels.
In this project, a pilot study was performed in which the cities were selected based on the population density, housing threat factor and the cities identified by Government of India to develop as Smart Cities. The major area of focus is the seismically active regions in India, i.e., seismic zones IV and V. Considering these factors, a total of 50 cities were selected. Of these, 15 cities were selected from zone seismic V, 28 cities from seismic zone IV, and remaining 7 are metro cities. A Few of the metro cities lie in seismic zone III, also but were selected considering the high population density and high housing threat factor.
In general, Risk is integrals of a combination of Hazard, Vulnerability and Exposure. A seismic hazard is a possible level of shaking of a particular site. Exposure describes the size of a city that is subject to the physical demand imposed by the hazard. Vulnerability describes how easily and how severely a city’s exposed entities can be affected given a specified level of hazard. On the fly, each of these risks have their own defined parameters and certain weightages for each parameter. EDRI combines all such parameters and weightages in a nonlinear combination to find out the value of risk of a particular city. Using such values, categorization of the cities will become easier.
Attempts were made in the past to develop earthquake vulnerability assessment methodologies and to use them in earthquake risk assessment by considering physical, social, and economical parameters (Davidson 1997). Local, regional, national and international variability was observed in these methodologies. This method is inspired from the Human Development Index (UNDP 1994) which give relative levels of development in various countries. Whereas the proposed methodology rate relative levels of earthquake disaster risk in different cities. The approach adopted to synthesizes the vast amount of information on urban earthquake disaster risk into a simple, easily usable form. Earthquake disaster risk is examined by considering the factors that contribute to it (e.g., frequent earthquakes, vulnerable structures), rather than by directly examining the expected consequences (e.g., deaths, economic loss). The approach gives relative

6
NatioNal Disaster MaNageMeNt authority
risk since disaster risk was conceived as a continuous, open-ended scale, against traditional bindery classification of Disaster and Not a Disaster. The assessment addresses the full array of factors that contribute to a city’s risk without losing sight of the big picture.
Table 2.1: Casualties during past earthquake events
Year Location Magnitude Deaths Buildings Collapsed1988 Bihar-Nepal 6.4 1,004 2,50,0001991 Uttarkashi 6.6 768 42,4001993 Killari 6.3 8,000 30,0001997 Jabalpur 6.0 38 8,5461999 Chamoli 6.8 100 2,5952001 Bhuj 6.9 13,805 2,31,0002004 Sumatra 8.9 10,805 Not Available2005 Kashmir 7.6 ~1,500 4,50,0002006 Sikkim 5.3 2 Not Available2011 Sikkim 6.9 110 Not Available2016 Manipur 6.7 ~10 Not Available
Source: (Seeber, et al. 1993); (S. K. Jain, C. V. Murty and N. N. Chandak, et al. 1994); (S. K. Jain, C. V. Murty and J. N. Arlekar, et al. 1997); (S. Jain, et al. 1999); (Jain, Lettis, et al. 2001); (S. K. Jain, C. V. Murty and D. C. Rai, et al. 2005); (Rai and Murty 2005); (C. V. Murty 2007); (Murty, Sheth and Rai 2011); (C. V. Murty, et al. 2012); (Ramancharla and Murty 2014); (Mahajan, et al. 2012); (Chenna and Ramancharla 2016); (Gahalaut and Kundu 2016).
2.2 Review of existing Risk Assessment methodsEarthquake hazard zonation map of India was first published in 1962 by Bureau of Indian
Standards (BIS) and was revised from time to time, based on the findings after major earthquakes took place in the country; the version published in the year 2016 is the very recent one. According to that map, 56% of Indian Geographical area is prone to moderate-to-severe earthquake shaking (Figure 2.1 (a)).
On the other hand, the first institutional attempt to map the earthquake vulnerability of built environment in India was made by the Building Materials and Technology Promotion Council (BMTPC) in the year 2012, based on the types of material used in the construction of roofs and walls. However, it is difficult to compare the seismic risk of different cities in the absence of quantitative mechanism to measure the risk. Quantification of risk through a Risk Index provides the opportunity to compare the risk of cities under threats and prepare them to respond better when an event occurs and demonstrate the resilience to face the future events. Despite that there was no study attempted to estimate the earthquake risk of the cities in Seismic Zones III, IV and V.
The first significant effort of developing the risk index was initiated is USA, where apart from physical risk, the effect of social fragility and resilience of the society also were considered in defining the overall risk (Davidson 1997). It was developed for comparisons of relative risk of

7
EarthquakE DisastEr risk inDEx rEport
different cities, but not for comparing the risk of urban fabrics within a city. Various methodologies have been developed to define the disaster risk index incorporated with vulnerability analysis at different levels internationally [e.g., (IDNDR 1999); (FEMA-NIBS 1999); (Cardona 2001); (Kundak 2004); (Birkmann 2007); (Amini-Hosseini, et al. 2009); (Duzgun, et al. 2011)]. This includes earthquake risk assessment considering the physical urban environment (buildings and infrastructure systems) of select cities from select regions of Asia, Europe, the Middle East, Africa, and Latin America [ (IDNDR 1999)]. Further, socio economic aspects of urban earthquake risk, buildings, lifelines, transportation and infrastructure has been incorporated by Federal Emergency Management and Agency (FEMA) in developing a software, Hazard of United States (HAZUS) [ (FEMA-NIBS 1999)]. However, the methodology suggested by HAZUS is complicated for urban earthquake risk assessment approach, and its application is limited to the American physical and social conditions. Several initiatives in Europe to develop earthquake risk assessment and loss estimation methodologies across the Euro Mediterranean region are underway. Usually, the final products of their studies are software packages for assessing the seismic risk and earthquake losses.
(a) (b)Figure 2.1: (a) Seismic Hazard Map [ (IS 1893(Part 1) 2016)], and (b) Housing Threat Factor
[ (Ramancharla and Murty 2014)]
A holistic model is developed the seismic risk analysis of urban centres considering both ‘hard’ and ‘soft’ risk variables [ (Cardona 2001)]. This model takes into account physical risk, exposure and socio-economic characteristics of the different units of the city and their disaster coping capacity or degree of resilience. Relative Seismic Risk Index (RSRi) method applied in the Tehran city of Iran is another holistic seismic risk assessment approach proposed for urban areas. The proposed approach estimates the risk indicator associated with each parameter as a product of vulnerability factor and hazard factor. The risk indicator/weights for each parameter were arrived on validating with damages in past earthquakes in Indian context. Further, total relative seismic risk index is evaluated using the weighted combination of risk indicators. Other methods such as Disaster Risk Index (DRI) developed by UNDP and World Bank’s study were used for mapping the natural disaster risk of countries [ (Cardona 2001)].
8
NatioNal Disaster MaNageMeNt authority
From the above studies, it was learnt that the methods developed elsewhere in the world are finetuned to their respective built environments and social status of the country in focus, these methods cannot be directly applied in the Indian context. Thus, there is a need to develop an earthquake risk index specifically for Indian cities located in Seismic Zones III, IV and V. As an initial attempt in India, a Housing Threat Factor (HTF) was developed (Figure 2.1 (b)) considering the earthquake hazard and housing density at the district level.
HTF was developed with the aim of prioritizing the districts of the country for earthquake risk mitigation projects in the housing sector [ (Ramancharla and Murty 2014)]. However, a framework with a holistic view of understanding the earthquake risk is required with vulnerability included.
2.3 Objectives and Advantages of EDRIThe objectives in development of EDRI are
[1] To provide a systematic way to compare the overall earthquake disaster risks across a large number of cities and regions in India;
[2] To create awareness on seismic zones that are under low seismic hazard regions yet poses seismic risk threats and the influencing parameters
[3] To sensitize policy makers for taking appropriate actions towards reducing the earthquake risks
[4] To identify the gaps in the existing seismic risk assessment methods, thereby select specific parameters for building a model that has features of interim assessment and easy replication channel for better management
[5] To prioritize the cities and regions based on the severity of risk for implementing mitigation programs using EDRI model.
The advantages of estimating EDRI are the following
[1] Comparison of overall earthquake risk for relative allocation of available limited mitigation resources and efforts;
[2] EDRI will enunciate the factors that are responsible for the risks vis., expected magnitude of ground shaking, large number of vulnerable structures, and city’s current economic situation;
[3] EDRI will also help the national and state governments to identify the higher risk cities and regions on a priority basis to mitigate the expected risks
[4] Towards the end, this study will help the executive authorities for preparing the Master Plan for city development.
2.4 MethodologyDisaster risk requires a multi-disciplinary assessment viz., architecture, building conditions,
soil type, geographical conditions, engineering etc. Apart from expected physical damages, there are a set of parameters that lead to second order effects which are to be considered such as conditions related to social fragility and lack of resilience which are required to be considered in the assessment. Therefore, as a first step, a method is proposed that considers mitigating aspects in this study followed by a step-wise procedure for evaluating EDRI.

9
EarthquakE DisastEr risk inDEx rEport
2.4.1 Earthquake Disaster Risk Index of Building (EDRIb)
Earthquake risk is represented as the product of the prevalent earthquake hazard (H) of the area, the number of persons exposed to the earthquake hazard (E), and the known vulnerability (V) of the houses in that area, as:
Risk=H ×V ×E (2.1)
Each of these components of risk has its own characteristics, which can be spatial (e.g., hazard), thematic (e.g., vulnerability of houses) and temporal (e.g., exposure).
2.4.1.1 Seismic Hazard of Building (Hb)
Earthquake Hazard the potential threat of occurrence of a damaging earthquake, within the design life of the house in a given area. The hazard due to an earthquake can be reflected by expected intensity of ground shaking (quantified by PGA, PGV and PGD, soil liquefaction, surface fault rupture and slope instability). Rational understanding of the seismic hazard of the different areas is critical to a meaningful risk assessment exercise.
Hazard is generally estimated as a combination of Seismic Zone Factor (Z), Soil Type (Sta) and Spectral Shape (Sa) (Figure 2.2); the value of hazard estimated consistent with IS 1893 (1), using the above procedure, ranges from 0.2 to 1.5. Further, if buildings are located in regions susceptible to liquefaction, landslide or rock fall or fire hazard, the building is declared as one with 100% risk; no further calculations are done.
Figure 2.2: Flowchart for Hazard Estimation of a Building
2.4.1.2 Exposure (Eb)
Exposure is assessed as:
IEb=I ×FAR (2.2)
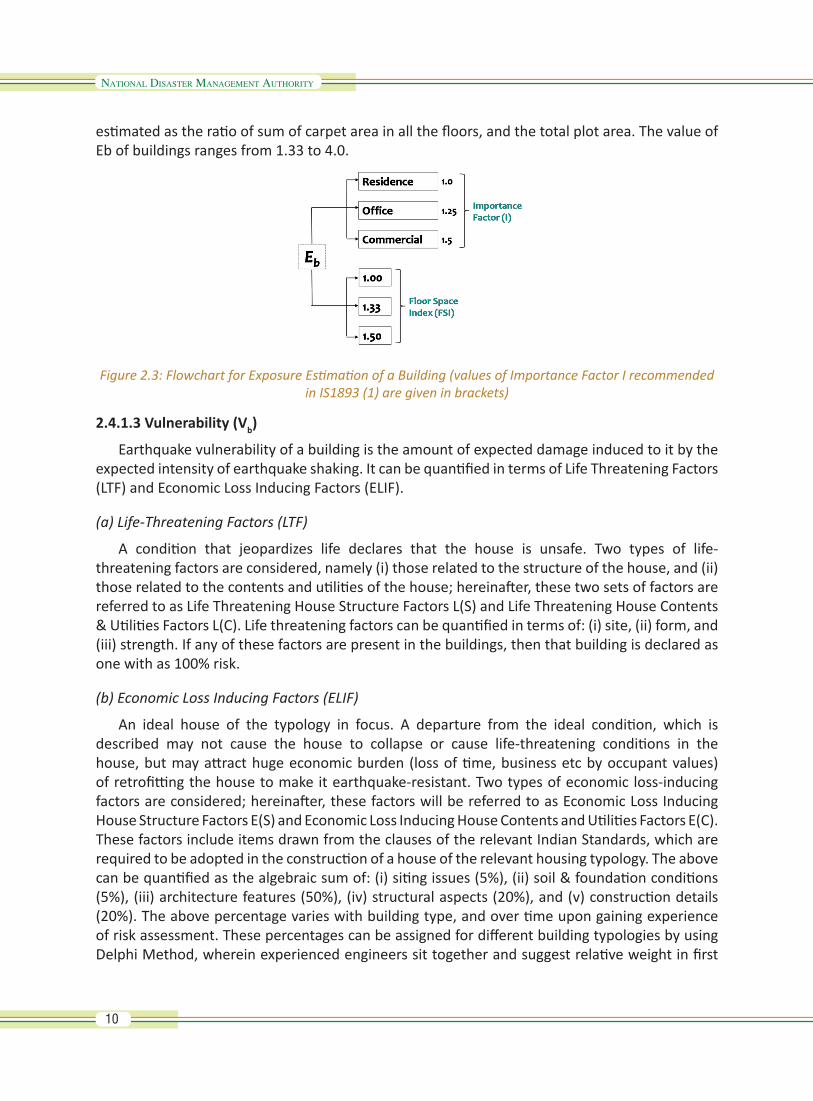
where I is Importance Factor of the building and FAR the Floor Area Ratio. Importance Factor I is 1 for ordinary residential buildings, 1.25 for offices and 1.5 for important buildings (like hospitals), as per IS1893 (1) (Figure 2.3). Floor area ratio is specified in Municipal bye-laws. Usually, it is
10
NatioNal Disaster MaNageMeNt authority
estimated as the ratio of sum of carpet area in all the floors, and the total plot area. The value of Eb of buildings ranges from 1.33 to 4.0.
Figure 2.3: Flowchart for Exposure Estimation of a Building (values of Importance Factor I recommended in IS1893 (1) are given in brackets)
2.4.1.3 Vulnerability (Vb)
Earthquake vulnerability of a building is the amount of expected damage induced to it by the expected intensity of earthquake shaking. It can be quantified in terms of Life Threatening Factors (LTF) and Economic Loss Inducing Factors (ELIF).
(a) Life-Threatening Factors (LTF)
A condition that jeopardizes life declares that the house is unsafe. Two types of life-threatening factors are considered, namely (i) those related to the structure of the house, and (ii) those related to the contents and utilities of the house; hereinafter, these two sets of factors are referred to as Life Threatening House Structure Factors L(S) and Life Threatening House Contents & Utilities Factors L(C). Life threatening factors can be quantified in terms of: (i) site, (ii) form, and (iii) strength. If any of these factors are present in the buildings, then that building is declared as one with as 100% risk.
(b) Economic Loss Inducing Factors (ELIF)
An ideal house of the typology in focus. A departure from the ideal condition, which is described may not cause the house to collapse or cause life-threatening conditions in the house, but may attract huge economic burden (loss of time, business etc by occupant values) of retrofitting the house to make it earthquake-resistant. Two types of economic loss-inducing factors are considered; hereinafter, these factors will be referred to as Economic Loss Inducing House Structure Factors E(S) and Economic Loss Inducing House Contents and Utilities Factors E(C). These factors include items drawn from the clauses of the relevant Indian Standards, which are required to be adopted in the construction of a house of the relevant housing typology. The above can be quantified as the algebraic sum of: (i) siting issues (5%), (ii) soil & foundation conditions (5%), (iii) architecture features (50%), (iv) structural aspects (20%), and (v) construction details (20%). The above percentage varies with building type, and over time upon gaining experience of risk assessment. These percentages can be assigned for different building typologies by using Delphi Method, wherein experienced engineers sit together and suggest relative weight in first

11
EarthquakE DisastEr risk inDEx rEport
round, and upon discussion on mean and standard deviation of their proposed value with the overall average, they propose revised percentages if convinced. Vulnerability estimated will be between zero (for a resistant building) and 100% (for a fully vulnerable building) (Figure 2.4).
Figure 2.4: Flowchart for Vulnerability Estimation of a Building (values of Economic Loss Inducing Factors are given alongside the flowchart [ (Murty, Raghukanth, et al. 2012)]
2.4.1.4 Earthquake Disaster Risk Index of a Building
Finally, EDRIb of a building is estimated as:
Risk = Hb ×Vb ×Eb (2.3)
Substituting the minimum and maximum values of hazard, exposure and vulnerability in Eq. (2.3), the EDRIb value ranges from 0 to 9.
2.4.1.5 Earthquake Disaster Risk Index of a Town
EDRI for a town or city is estimated by considering EDRI of fully vulnerable buildings and partially vulnerable buildings, as:
(2.4)
(2.5)
where EDRITown is the Earthquake Disaster Risk Index of Town, N1 the number of buildings of typology 1, Rb1 the summation of risks of buildings of typology 1, (EDRITown)Stop the Earthquake Disaster Risk Index of Town having 100% risk and (N1)Stop the number of buildings of typology 1 having 100% risk.

12
NatioNal Disaster MaNageMeNt authority

13
EarthquakE DisastEr risk inDEx rEport
Data Collection in 50 Cities and Towns3
3.1 IntroductionAs per the Census of India, the towns in the country are categorized based on population
into three classes, namely (i) semi-urban centers, having population in the range 10,000-99,999, (ii) urban centers, having population in the range 1,00,000-9,99,999, (iii) metro Cities, having population more than 10,00,000. In this study, 50 cities were selected based on the population density and high Housing Threat Factor (Chapter 2), cities identified by Government of India to develop as Smart Cities, and those in the seismically active regions in India, i.e., Seismic Zones IV and V. These, 50 cities include: (i) cities in Seismic Zones IV and V, (ii) state capitals, (iii) metro cities (Tables 3.1, 3.2 and 3.3).
Apart from these 50 cities, one district Bareilly District in Uttar Pradesh, was selected for study. In the 50 cities, the area of interest was within the municipal boundaries only, but in the Bareilly District, the survey was done in the City, in all the Tehsils of the Bareilly District (Table 3.4) and few villages in each Tehsil (Table 3.5). The task of collection of necessary information from the 50 cities and one district, within the limited time and with available limited manpower, was overcome by carrying out the tasks with the separate teams in only selected 24 cities of the 50 cities, and in the Bareilly district (Annex A: Table A.1). Rapid Visual Survey (RVS) was performed in those cities between January 2017 and November 2017.
Table 3.1: Selected Cities Located in Seismic Zone V
S. No. City/Town State/Union Territory1 Itanagar Arunachal Pradesh2 Guwahati Assam3 Dispur Assam4 Port Blair Andaman &Nicobar Islands5 Darbhanga Bihar6 Bhuj Gujarat7 Mandi Himachal Pradesh8 Srinagar Jammu and Kashmir9 Imphal Manipur10 Shillong Meghalaya11 Aizwal Mizoram12 Kohima Nagaland13 Agartala Tripura14 Chamoli Uttarakhand15 Pithoragarh Uttarakhand

14
NatioNal Disaster MaNageMeNt authority
Table 3.2: Selected Cities Located in Seismic Zone IV
S. No. City/Town State/ Union Territory16 Patna Bihar17 Bhagalpur Bihar18 Jamnagar Gujarat19 Faridabad Haryana20 Gurgaon Haryana21 Panipat Haryana22 Panchkula Haryana23 Shimla Himachal Pradesh24 Solan Himachal Pradesh25 Jammu Jammu and Kashmir26 Ratnagiri Maharashtra27 Amritsar Punjab28 Jalandhar Punjab29 Ludhiana Punjab30 Alwar Rajasthan31 Gangtok Sikkim32 Ghaziabad Uttar Pradesh33 GautamBudh Nagar Uttar Pradesh34 Meerut Uttar Pradesh35 Bareilly Uttar Pradesh36 Mathura Uttar Pradesh37 Moradabad Uttar Pradesh38 Dehradun Uttarakhand39 Uttarkashi Uttarakhand40 Nainital Uttarakhand41 Chandigarh Union Territory42 Darjeeling West Bengal43 Siliguri West Bengal
Table 3.3: Selected Metro Cities
S. No. City/Town State/UT Seismic Zone44 Delhi Delhi IV45 Vijayawada Andhra Pradesh III46 Ahmedabad Gujarat III47 Mumbai Maharashtra III48 Pune Maharashtra III49 Chennai Tamil Nadu III50 Kolkata West Bengal III

15
EarthquakE DisastEr risk inDEx rEport
Table 3.4: Tehsils in Bareilly District (Uttar Pradesh)
S. No. Tehsil District Seismic Zone1 Bareilly (Sadar) Bareilly (Uttar
Pradesh)IV
2 Aaonla3 Baheri4 Faridpur5 Meerganj6 Nawabganj
Table 3.5: Villages visited in each Tehsil of Bareilly District (Uttar Pradesh)
S. No. Village Tehsil1 Devchara Aaonla2 Bhamora3 Ramnagla4 Sendha5 Motipura6 BehtaJanu7 Shivpuri8 Balliya9 Ramnagar10 Richa Baheri11 Kesar Sugar Mill12 Girdharpur13 Sharif Nagar14 Shergarh15 Bhindolia Faridpur16 Zed Sabdalpur17 Pachoni18 PurvFatehgang19 Bilpur20 Tisva21 Dunka Meerganj22 Jaferpur23 Saijna24 Sindhouli25 Id Jagir26 Richhola Kifayatullah Nawabganj27 Hardua Kifayatullah28 Hafizganj

16
NatioNal Disaster MaNageMeNt authority
3.2 City/Town Housing InformationThe level of risk in a city depend not only on the vulnerability of individual building typologies in
that city, but also on factors such as topography of city, soil conditions, seismic hazard, population, possibilities of collateral hazards (e.g., liquefaction of soil, landslides and fire), use of buildings (e.g., residential, office and commercial uses), and FAR or FSI (i.e., floor area ratio or floor space index). In addition, quality of construction alone does not ensure safety of a building. For example, if all the design guidelines are properly followed for the construction of a G+5 storey RC framed building, but built on a very loose soil strata or on a vulnerable hill slope, is safe under normal loading conditions and clearly unsafe under severe earthquake shaking. This is because, during earthquake shaking, loose soil may undergo liquefaction, resulting in severe damage and even collapse of building. Further, landslides may occur in a vulnerable hill slope during earthquake shaking and the buildings may collapse into the valley.
Due to the difficulty of collecting information on each building in a city, it was decided that at least 50 representative buildings are surveyed. In the process, in 36 cities, the size of sample buildings is between 60 to 100 buildings, and in remaining cities, it is more than 100. Further, after evaluating the risk index using the sample surveyed buildings in each city, the risk index of all buildings is obtained by extrapolating the risk in each typology of the total number of buildings in that typology.
3.3 Data Collection FormatThe data collection was carried out personally by visiting 24 cities. Further, two sets of
information were collected, namely building information and city information (Table 3.6). The parameters involved are dependent on geology, site conditions, overall built environment, and building typologies present in the building. The Nodal Officers of each city (identified by local governments) provided the data online; the online google form was developed by IIIT Hyderabad. The link of the online google form along with the soft copy of the form was sent through an eMails to the District Collectors and the concerned Nodal Officers of all 50 cities. And, the type of data collected during the field visits is the same as required in the online form.
Table 3.6: Methods followed for Data Collection of 50 Cities
Data Collection of 50 CitiesIIIT Hyderabad (for 24 Cities) Nodal Officer (for 26 Cities)
City information collected by personally visiting the Municipal Office and discussing with the concerned Officers
Building information collected by RVS and photographs of buildings taken in person in different areas of the city
City information provided through online form with help of different persons in the Municipal Office
Building photographs in different wards of city collected by Nodal Officers team and provided online
The risk at individual building level requires visual inspection and estimate based on its functionality, which together form the Rapid Visual Survey (RVS). The RVS has predefined set of questions regarding the presence or absence of a certain feature in the building, and in general has to be documented in the field manually. But, considering the large time required for survey

17
EarthquakE DisastEr risk inDEx rEport
and field data conversion in a computer for further analysis, it was decided to capture the visual inspection notes in the form of photographs. These photographs of buildings were analysed later for estimating the risk of individual buildings. As a result, the risk calculations and results were documented in a systematic way on the computer. In addition to collecting city information of 10 cities, RVS was performed by IIIT Hyderabad on few sample buildings first, and photographs captured of many buildings later in different parts of city. Similarly, in the remaining 40 cities also, the building photographs were collected from different wards of city. A sample google survey form duly filled is attached in Annexure B.
3.4 EDRIThe next step was the estimation of the risk of individual building, and the risk of city. IIIT
Hyderabad prepared a procedure to estimate the risk of city based upon the risk of individual buildings in the city (Chapter 2). The procedure for risk estimation of individual building involves a set of questions, which needs answers only in the form of ‘Yes’ or ‘No’. The questions are selected in such a way that they address all three components of risk i.e., hazard, exposure and vulnerability of building, and all five broad domains related to the vulnerability of building, namely site issues, soil and foundation condition, architectural features, structural aspects and construction details. At the beginning, each building typology is given a score of 100 and each question is given a negative penalty. The questions are prepared in such a way that it asks whether the building has any of those parameters related to the three components, which will affect negatively the building performance or behaviour, during an earthquake. Building earns penalties for the questions whose answers are YES and no penalties for those whose answers are NO. Proper and detailed inspection of each photograph of a building is required to understand the building’s functionality, before answering these questions. Building typology with maximum questions answered as ‘yes’ gets the least total score. The total score is a quantitative value. Then, the risk of all the surveyed buildings is estimated. Finally, the typology-wise score collected over sample buildings (at least 50) is extrapolated to all buildings in the city of that typology. Thus, the final EDRI of city is estimated considering all buildings in the city. A sample calculation is presented in Table 3.7. The breakup of EDRI score is presented in Table 3.8, with a score of more than 0.4 being an alarming number.
Table 3.7: Sample Calculation of EDRI of all Surveyed Buildings and EDRI of Pithoragarh City
Housing Typology EDRI Calculation of Surveyed Buildings EDRI Calculation from Census
Number of Buildings
ΣRi,RC EDRI Vulnerable
EDRI Number of Buildings
Sum Risk (T)
EDRI of Town
Reinforced Concrete Building
279 181.54 0.65
0.65
6,565 4,272
0.65
Brick Masonry building with Concrete Roof
43 30.96 0.72 3,282 2,363
Brick Masonry building with Other Roof
26 12.56 0.48 1,641 793
Stone Masonry building 0 0.00 0.00 0.00 0.00
Other 0 0.00 0.00 0.00 0.00

18
NatioNal Disaster MaNageMeNt authority
Table 3.8: Comparison of Final Score and Level of Risk/Damage of Building
Score Level of Risk/Damage0.0 – 0.2 No Damage0.2 – 0.4 Slight Damage0.4 – 0.6 Moderate Damage0.6 – 0.8 Severe Damage0.8 – 1.0 Collapse
3.4.1 EDRI of a City
The risk index of overall city was estimated as shown below:
(3.1)
(3.2)
(3.3)
(3.4)
where, RRC is EDRI of all reinforced concrete buildings, ΣRi, RC the summation of EDRI of individual reinforced concrete buildings, Rb1 the summation of risk of buildings of Typology 1, N1 the total number of surveyed buildings of Typology 1, N1T the total number of buildings of Typology 1 in city, RB1 the summation of risk of all buildings of Typology 1 in city, N Total the total number of buildings in city (including all typologies), EDRISampleBuilding the Earthquake Disaster Risk Index of the sample buildings surveyed and EDRI Town the Earthquake Disaster Risk Index of the overall city.
Similarly, the risk indexes of all the 50 cities were estimated as shown in Annex B: Table B.1. But, the level of damage in a city cannot be projected from there of a single building, but can be done by projecting thereof a typology. This is because in the large building stock of a single typology, there are varying levels of damage in a city, owing to different geology, soil conditions and construction quality. Every single building in any group of buildings in any city may have a different score, but this study considers the values averaged for all buildings of a single typology.
In general, EDRI of a particular city, indicates levels of damage ranging from No Damage state to Collapse state. This distribution varies between cities; some cities have more buildings with slight or no damage, while some other have more buildings with severe to collapse damage state. Thus, EDRI of a city is estimated quantitatively. Therefore, a simple and quantitative approach is proposed by assigning a percentage to the risk; risk of 0% is safe, and 100% is unsafe. Percentages of the EDRI values in the said 50 cities and metro cities are estimated and presented in Annex

19
EarthquakE DisastEr risk inDEx rEport
B: Tables B.1, B.2, B.3, and B.4. Buildings with risk close to 100% may experience huge losses to life and property, in the event of expected earthquakes. In the above tables, RC represents the Reinforced Concrete Buildings, BM_CR the Brick Masonry Buildings with concrete roof, and BM_OR the Brick Masonry Buildings with other roof materials. The accuracy of estimation of risk of a city increases as the size of the sample buildings surveyed increases.
3.4.2 EDRI of a Circle/Ward within a City
The EDRI of circle or ward in a city is attempted, because the same typology of a building within a city may not be equally vulnerable earthquakes. For instance, if the risk of a city is 85%, it can be assumed that large number of buildings in this city is expected to reach a damage state between severe and collapse. Thus, the vulnerable area can be divided into small groups (circles or wards) which is more convenient for authorities to take necessary steps to reduce the vulnerability of buildings in that area. Also, this will speed up the disaster response of the city. Conceptually, the method of risk estimation is the same for a city and a small area within the city; the risk can be estimated, if the necessary census data of a particular small area in the city is available, similar to the estimation of risk of a city. Because the data for each number of wards in each city and town are provided by the Census of India, the risk (in percentage) is estimated of all the wards in a city. But, building information of wards/circles was available in only a few cities, namely Pithoragarh, Agartala, and Gangtok; thus, EDRI values of these Cities are presented in Annex B: Table B.4, B.5 and B.6.

20
NatioNal Disaster MaNageMeNt authority

21
EarthquakE DisastEr risk inDEx rEport
Data Analysis and Results44.1 Introduction
The factors are identified, which contribute to risk of the individual house, and thereby risk of city as a whole. The focus of the study is to determine a trend of risk factor on cumulative EDRI score of housing typology, and its effect on the risk of town. The factors contributing to risk of a building in each city are different and depending on the percentage of each factor, the risk varies.
4.2 Major Factors Contributing to RiskThe factors contributing to risk are identified separately for the three typologies of buildings,
namely the Reinforced Concrete (RC) moment resisting frame (MRF) buildings, Brick Masonry (BM) buildings with concrete roof, and BM buildings with roof other than RC. These factors are discussed separately for the said three building typologies in Seismic Zone V and Zone IV cities.
4.2.1 RC MRF Buildings in Cities in Seismic Zone V
The common economic loss inducing factors observed in RC MRF buildings of five cities in Seismic Zone V are presented in Annex C: Table C.1. These factors pertain to three categories, namely (i) structural aspects; (ii) architectural features of the building, and (c) soil and foundation conditions of building location. Further, the percentages of buildings with the identified deficiency are also presented.
The most common Economic Loss Inducing Factors observed in RC MRF buildings in Zone V cities are presented in Annex C: Table C.2. Ten cities have the risk of incurring damages due to lack of separation of staircase from the house. The architectural and structural features of large window opening were found to be common in six cities. This was followed by unsymmetrical placement of staircase in plan area and staircase not integrally built in to building frame in five and four cities respectively. Other factors (like insufficient gap between house, house touching each other and large area of door openings) were found in four cities.
4.2.2 BM Buildings with Concrete Roof in Cities in Seismic Zone V
The common Economic Loss Inducing Factors observed in the BM buildings with RC roof in Seismic Zone V are presented in Annex C: Table C.3. These factors pertain to three categories, namely (i) structural aspects, (ii) architectural features of the building, and (c) soil and foundation conditions of building location. Further, the percentages of buildings with the identified deficiency are presented. But conclusion was not drawn from all the cities because of insufficient or no data available for a building typology under consideration from that city. “Not Applicable” indicates no data for analysis, because building data is less than 50 from that city. The total number of buildings in such cases is mentioned in the bracket.
22
NatioNal Disaster MaNageMeNt authority
The most common Economic Loss Inducing Factors observed in BM buildings with concrete roof in Zone V cities are presented in Annex C: Table C.4. Absence of band at lintel and sill level were the most common architectural and structural deficiencies found in about nine cities in Zone V. Houses constructed touching each other, unsymmetrical staircase location with respect to plan and staircase not adequately separated from house, were common among the factors contributing to risk.
4.2.3 BM Buildings with Other Types of Roof in Cities Located in Seismic Zone V
The common Economic Loss Inducing Factors observed in the BM buildings with roofs other than concrete in cities in Seismic Zone V are presented in Annex C: Table C.5. These factors pertain to two categories, namely (i) structural aspects, and (ii) architectural features of the building. But, it is difficult to draw any similarities as a particular type of building belonging to one city are either absent or very few in other cities. Further, the percentages of buildings with the identified deficiency are presented.
4.2.4 RC MRF Buildings in Cities in Seismic Zone IV
The common Economic Loss Inducing Factors observed in the BM buildings with RC roof in cities in Seismic Zone IV are presented in Annex C: Table C.6. These factors pertain to three categories, namely (i) structural aspects; (ii) architectural features of the building, and (c) soil and foundation conditions of building location. Architectural Features found to contribute to risk more common than structural aspects. Further, the percentages of buildings with the identified deficiency are presented.
The most common Economic Loss Inducing Factors observed in RC MRF buildings in Zone IV cities are presented in Annex C: Table C.7. 22 cities have the risk of incurring damages due to window openings covering large area. The architectural and structural features of large and heavy projections were another major parameter is common in 11 cities. Rare single are windows are close to corner and staircase are not separated from house.
4.2.5 BM Buildings with Concrete Roof in Cities in Seismic Zone IV
The common Economic Loss Inducing Factors observed in the BM buildings with RC roof in cities in Seismic Zone IV are presented in Annex C: Table C.8. These factors pertain to three categories, namely (i) structural aspects, (ii) architectural features of the building, and (c) soil and foundation conditions of building location. Further, the percentages of buildings with the identified deficiency are presented. But, conclusion was not drawn from all the cities because of insufficient or no data available for a building typology under consideration from cities. “Not Applicable” indicates no data for analysis, because building data is less than 50 from that city. The total number of buildings in such cases is mentioned in the bracket.
The most common Economic Loss Inducing Factors observed in BM buildings with concrete roof in cities in Seismic Zone IV are presented in Annex C: Table C.9. Absence of RC band at lintel and sill level were the most common architectural and structural deficiency found in 11 cities in Seismic Zone IV. This observation is similar to that in cities in Seismic Zone V. Staircase not separated from house, houses touching each other and large projection/overhangs are other common factors contributing to risk, in half of the cities where sufficient building data is available.

23
EarthquakE DisastEr risk inDEx rEport
4.2.6 BM buildings with Other Types of Roof in Cities in Seismic Zone IV
BM buildings with other types of roof are common in Seismic Zone IV regions with heavy rainfall or snow fall, but sufficient data of such buildings is not available to draw any conclusion on the level of risk except in the Bareilly city (Annex C: Table C.11).
4.3 Cities with similar challengesThe present built environment in all the 50 cities were studied to calculate risk of each city.
Further all the cities were divided into three main categories to understand the qualitative risk level of each city. Separate group of cities with High and Medium risk level were formed and further sub-groups were made in order to identify cities with similar challenges. The names of cities based on stated classifications are tabulated below Table 4.1.
Table 4.1: Sub-groups of cities with High and Medium risk level
Group ID Classification CitiesG1A High EDRI - High Hazard Aizwal, Pithoragarh, Srinagar, Uttarkashi, Nainital,
Bhagalpur, and PanipatG1B Medium EDRI - High Hazard Darbhanga, Ghaziabad, Itanagar, Guwahati,
Dispur, Port Blair, Imphal, Shillong, Kohima, Agartala, Chamoli, Jammu, and Mathura
G2A High EDRI - High Exposure Aizwal, Solan, Gangtok, and VijayawadaG2B Medium EDRI - High Exposure Ghaziabad, Pune, and MumbaiG3A High EDRI - High Vulnerability Shimla, Aizwal, Pithoragarh, Nainital, and
UttarkashiG3B Medium EDRI - High Vulnerability Darbhanga, Patna, Mandi, and Chennai
Among 50 cities, 13 cities were found to have High risk, 30 cities have Medium risk and remaining 7 cities with Low risk level. Hazard is estimated as a combination of Seismic Zone Factor, Soil Type and Spectral Shape. It was observed that among 13 cities with High risk level, 7 cities have High hazard level. Aizwal, Pithoragarh, and Srinagar lies in zone V which leads to higher hazard level. The cities like Uttarkashi, Nainital, Bhagalpur, and Panipat even though lies in seismic zone IV, however, they still make into this sub-group of high hazard level. Aizwal, Pithoragarh, Uttarkashi, and Nainital are located in hilly terrain compared to Srinagar, Bhagalpur, and Panipat which are located in relatively flat terrain. Soft soil in Bhagalpur and good number of low to mid-rise buildings surveyed in Panipat city is contributing to high hazard level. Among 30 cities with medium risk, 13 cities can be grouped together based on their high hazard level. Among these 13 cities 10 cities lies in seismic zone V which obviously led them for higher level of hazard. Geographically 7 cities among these 13 are located in hilly region.
Exposure is estimated based on functional use of building surveyed and maximum FAR (Floor Area Ratio) mentioned in bye-laws of town. Larger violation of FAR by private building owners leads to higher state of exposure. Aizawl, Solan, Gangtok and Vijayawada are the four cities which have high exposure among 13 cities with High risk level. Similarly, Ghaziabad, Pune and Mumbai are three cities which have higher exposure among 30 cities with Medium risk level. Lack of
24
NatioNal Disaster MaNageMeNt authority
space and increase in demand of functional space of town due to its economic importance in nearby area cities like Aizwal, Solan and Gangtok face challenges in strict implementation of FAR for private buildings. Whereas, remaining cities of sub-group G2A and G2B have high population density leading to higher exposure level.
Vulnerability includes items drawn from the clauses of the relevant Indian Standards, which are required to be adopted in the earthquake resistant construction of a house of the relevant housing typology. It is assessed based on: (i) siting issues, (ii) soil & foundation conditions, (iii) architecture features, (iv) structural aspects, and (v) construction details. Among 13 towns with high risk, 5 cities have higher vulnerability, and those are Shimla, Aizawl, Pithoragarh, Nainital, and Uttarkashi. More than half of the top five vulnerable parameters in RC buildings, among all these 5 cities, belong to Architectural features. Few distinct architectural features found common among two or more cities are, about half of the openings close to corner, difference in storey height, houses touching each other, large area of door or window opening. Staircase not adequately separated from house is one of the vulnerable parameters of structural category found common in 3 cities. In case of BM buildings, in these cities, larger opening and absence of bands at different level found more common which contributes as more vulnerable among architectural and structural category respectively. Darbhanga, Patna, Mandi and Chennai found to have higher vulnerability with medium risk level. In these cities also, for RC buildings architectural parameters are found dominant compared to structural parameters. Parameters like large projection or overhang and houses having insufficient gap found to be common vulnerable parameter among architectural features. Staircase not being adequately separated from house is one of the vulnerable parameters of structural category, found to be common in 3 cities. Similarly, in case of BM buildings, structural features are of more concern compared to architectural features. Staircase not being adequately separated from building, and absence of bands at sill and plinth level found to be very common structural vulnerable parameters in BM buildings. Whereas, Irregular orientation of rooms found to be common vulnerable parameter under architectural category.

25
EarthquakE DisastEr risk inDEx rEport
Major Observations5The major findings of the earthquake risk assessment exercise are summarized here. The risk
of cities in seismic Zone V and IV are discussed separately, and similarities are identified. This is expected to help take crucial decisions in identifying techniques of retrofitting the buildings located in such regions; improving local construction techniques and adhering to Indian Standard Code of Practice, regularizing construction on hilly regions will bring down the seismic risk of these cities.
5.1. Cities in Seismic Zone VFrom all the selected cities in seismic zone V, cities with high percentage of risk are listed in
Table 5.1. Aizwal city in Mizoram is observed to have maximum risk; more than 90% of buildings are either built on hill slopes or located on sites vulnerable to falling debris from the hill tops (Figure 5.1a). 35% of these buildings are located very close to an adjacent and seemingly unsafe building/construction, whose collapse can damage the building easily. Pithoragarh, Shillong and Kohima have more or less similar conditions as that of Aizwal. These cities are situated in hilly areas, which have steep to extremely steep sloped terrains. Srinagar is situated at the foot hills.
Pithoragarh city has around 20% reinforced concrete buildings as well as brick masonry with concrete roof buildings falling in no damage category; around 50% of brick masonry with other roof buildings are in the same damage category. Whereas the City has nearly 50-60% reinforced concrete buildings, brick masonry concrete roof buildings and brick masonry other roof buildings are in the category of collapse damage state. Even though brick masonry buildings and reinforced concrete buildings are of same percentage the number of sample buildings is different of these typologies (Figure 5.1b).
In Srinagar City, 50% of reinforced concrete buildings and nearly 40% of brick masonry other roof buildings are in the category of collapse. Split roof and pitched roof are the main common factors contributing to the high risk of reinforced concrete buildings.
Table 5.1: Five cities in seismic Zone V cities with highest EDRI
S.No. City State/UT EDRI City (%)1 Aizwal Mizoram 962 Pithoragarh Uttarakhand 653 Srinagar J & K 624 Shillong Meghalaya 565 Kohima Nagaland 54
Srinagar city has small number of brick masonry concrete roof sample buildings. Therefore, it is not possible to conclude the overall behaviour of those buildings (Figure 5.1c). As in Aizwal,
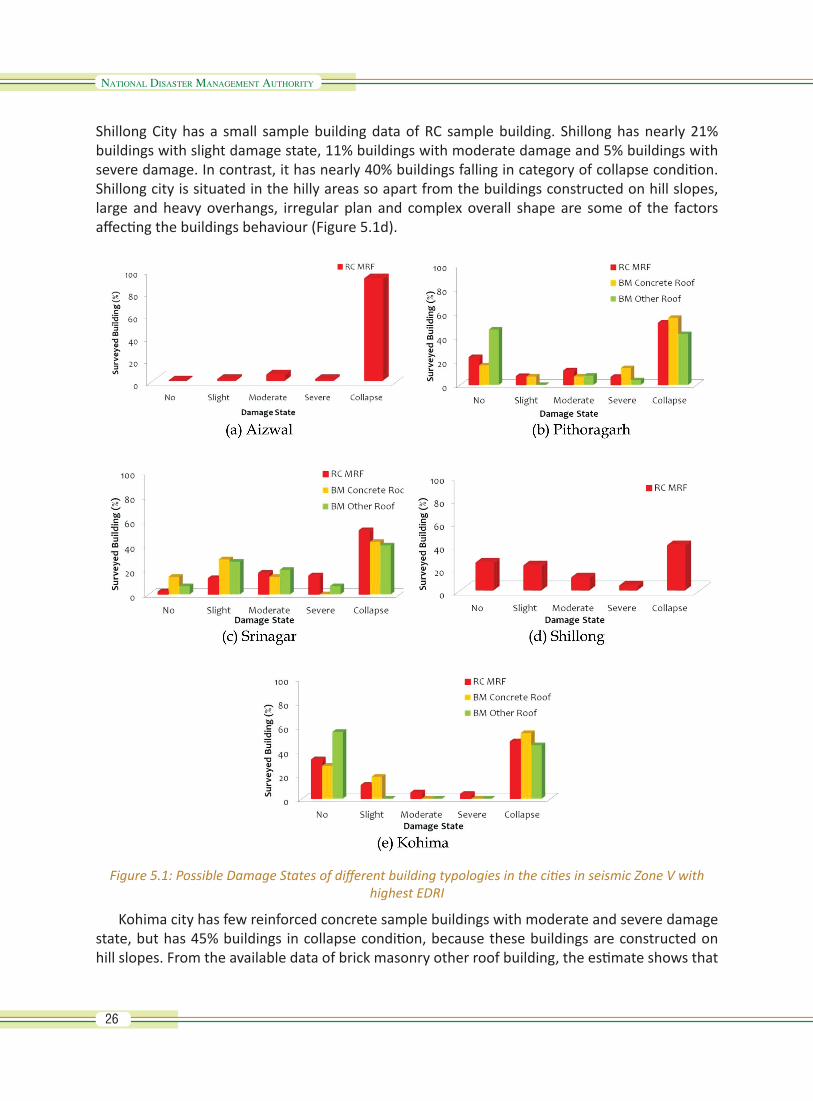
26
NatioNal Disaster MaNageMeNt authority
Shillong City has a small sample building data of RC sample building. Shillong has nearly 21% buildings with slight damage state, 11% buildings with moderate damage and 5% buildings with severe damage. In contrast, it has nearly 40% buildings falling in category of collapse condition. Shillong city is situated in the hilly areas so apart from the buildings constructed on hill slopes, large and heavy overhangs, irregular plan and complex overall shape are some of the factors affecting the buildings behaviour (Figure 5.1d).
Figure 5.1: Possible Damage States of different building typologies in the cities in seismic Zone V with highest EDRI
Kohima city has few reinforced concrete sample buildings with moderate and severe damage state, but has 45% buildings in collapse condition, because these buildings are constructed on hill slopes. From the available data of brick masonry other roof building, the estimate shows that

27
EarthquakE DisastEr risk inDEx rEport
56% buildings are likely to be in no damage state and remaining 44% in complete collapse state. But, the total number of brick masonry buildings is so small that it is not possible to conclude anything about the current condition of these buildings in the city, unless a detailed investigation is done. Apart from the buildings built on hill slopes, there are no structural features, but there are few architectural factors that are likely to contribute 8% of moderate damage and 4% of severe damage state of the buildings in Kohima city (Figure 5.1e).
Buildings located on unstable slopes, houses constructed close to each other, presence of overhang or large projection area in a building to get maximum benefit of usable space, and large opening for windows, are the most common factors observed in the cities with highest risk (Table 5.1).
5.2 Cities in seismic Zone IVShimla (the capital of Himachal Pradesh) is observed to have highest risk of 83% of all cities
in seismic Zone IV. Shimla is the second most vulnerable city compared to the cities considered for risk assessment, irrespective of their seismic zone. Cities located on hilly regions are most vulnerable compared to cities located in flat terrains (Table 5.2) The factors contributing to risk in hilly regions in cities are same as those in cities in seismic Zone V.
Table 5.2: Top ten cities in seismic Zone IV with highest EDRI
S. No. City State/UT EDRI City (%)1 Shimla Himachal Pradesh 812 Panipat Haryana 783 Ratnagiri Maharashtra 694 Gangtok Sikkim 685 Moradabad Uttar Pradesh 676 Nainital Uttarakhand 657 Bhagalpur Bihar 628 Solan Himachal Pradesh 629 Uttarkashi Uttarakhand 6210 Patna Bihar 52
Shimla has 34% reinforced concrete sample buildings and 63% brick masonry buildings with concrete roof buildings, which are either located on hill slopes or built almost touching or located close to an adjacent seemingly unsafe building, whose collapse can damage such buildings. Hence, all these buildings fall under collapse category.
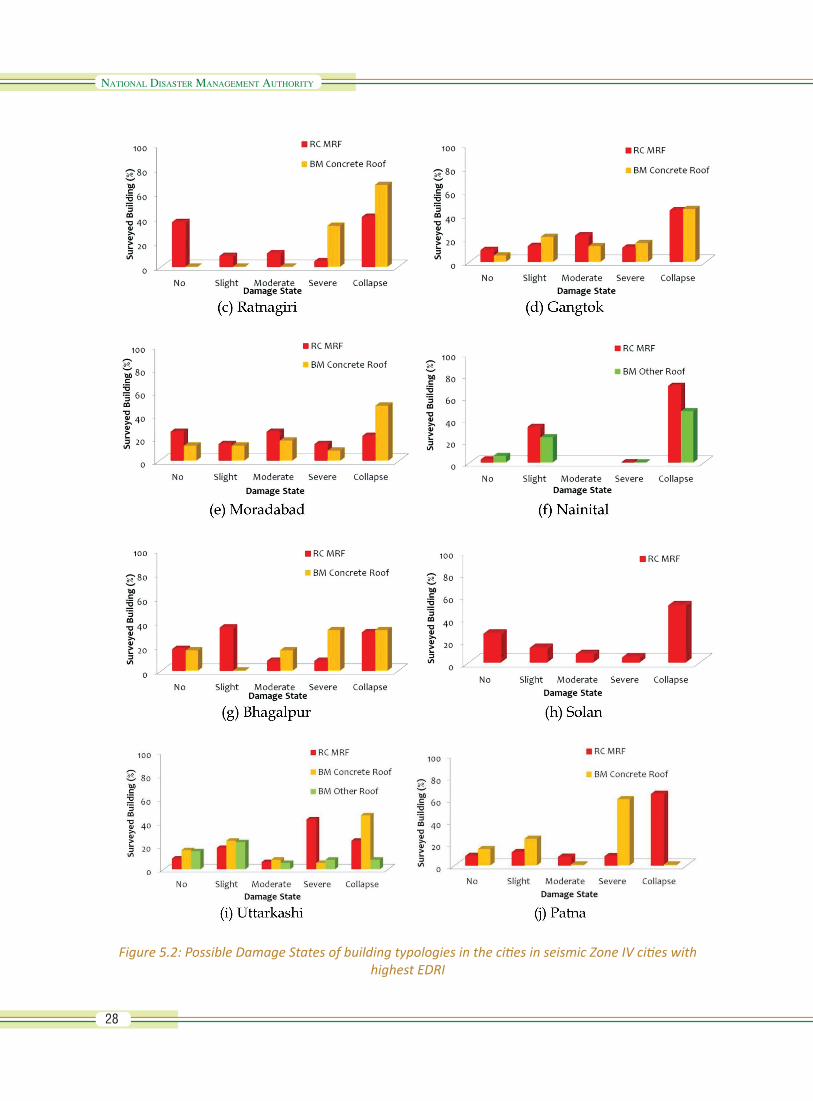
28
NatioNal Disaster MaNageMeNt authority
Figure 5.2: Possible Damage States of building typologies in the cities in seismic Zone IV cities with highest EDRI

29
EarthquakE DisastEr risk inDEx rEport
The damage distribution in reinforced concrete buildings is found to be skew towards no damage state i.e., more buildings fall under no damage state. About 26% of brick masonry buildings with concrete roof fall under collapse state. But, overall damage distribution of such buildings is skew towards higher damage category, i.e., percentage of buildings falling under no damage state is less compared to those falling under higher states of damage. This is because majority of these buildings have large door and window openings provided near corner. Due to local climate, these buildings have pitched roof, which adds to the risk in such buildings during earthquake shaking (Figure 5.2a).
Panipat has nearly 30% of reinforced concrete sample buildings falling under collapse category, because and there as on being more than half of the buildings have open ground storey that are not designed for earthquake resistance. It was also observed that around 45% buildings are expected to have minimum damage i.e., (no damage state). In the other three damage categories the percentage of buildings varies from 5 to 8%. The number of brick masonry buildings, with other roof is only 7%. Hence, it is not possible to comment on damage pattern of such buildings (Figure 5.2b).
Ratnagiri has 40% of reinforced concrete sample buildings coming in collapse category, because most buildings have open ground storeys and are not designed for earthquake shaking. Also, they buildings touching or located close to an adjacent seemingly unsafe building/construction. Also many buildings are in no damage condition. In the remaining three damage categories, the percentage of buildings varies from 4-10%. Numbers of brick masonry building with RC roof are only three in number. Hence it is not possible to comment on the expected damage pattern of such buildings (Figure 5.2c).
Gangtok city has normal distribution of damage between no damage to severe damage category for both reinforced concrete buildings and brick masonry buildings with concrete roof. The buildings of both typologies are expected to sustain slight damage, 13% and 21% respectively. But the percentage of reinforced concrete buildings in collapse state is 43%, because most buildings in the city are constructed on sloping ground by excavating some part of the hill; owners keep finding more space in the front portion and extending the building in the front in this newly available space, making the building vertically irregular. In addition, open ground storey, heavy overhangs, heavy roof tops, and irregular plan shapes are common in buildings in the city that makes them seismically more vulnerable (Figure 5.2d).
Reinforced concrete buildings in Moradabad city are skewed towards no damage but have about 21% buildings expected to be in collapsed state. Whereas 48% of brick masonry buildings with concrete roof building are expected to be in collapse state in the city, the remaining 52% of buildings come under the four damage states with highest 17% of buildings in the moderate category (Figure 5.2e).
Most buildings in Nainital city are constructed on hill slope. Due to this geographical condition and local construction practices, buildings with large amount of window openings and openings (door or windows) located near corner are common. Such factors make nearly 32% of reinforced concrete and 23% of brick masonry buildings with other roof come under collapse category. Other buildings are constructed on flat ground or sufficiently away from slope and hence are in no or slight damage state (Figure 5.2f).

30
NatioNal Disaster MaNageMeNt authority
In Bhagalpur City reinforced concrete buildings have similar trend as their counterparts in Moradabad city with nearly 30% buildings in collapse state and the remaining skewed towards slight damage state. The percentage of reinforced concrete buildings in the no damage state is only 17%. Commenting on damage pattern of brick masonry building with concrete roof is difficult because due total number of sample buildings is just 12 (Figure 5.2g).
Reinforced concrete buildings in Solan city are skewed towards no damage state and have about 50% buildings in collapse state. In other damage categories, the highest number of buildings is about 25% in no damage state, and reduces to 4.2% in severe category. Other typologies were not part of the sample buildings, and hence, no comment is made on damage pattern in masonry buildings (Figure 5.2h).
In Uttarkashi, large number of brick masonry buildings is likely to collapse. Analysis of various factors responsible for high vulnerability of the brick masonry buildings, suggests that the structural aspects (like absence of provision of horizontal bands at different levels) are the major cause for the damage of such buildings. In RC buildings, the major risk factors contributing to 66% risk of severe damage to collapse state are large window opening and its location near the corner, unsymmetrical location of column and non-separation of staircase from main structure. Damage state of 13 sample buildings of brick masonry with other roof category, indicate similar damage of all five-damage state (Figure 5.2i).
In Patna City, of all buildings surveyed, the percentage of reinforced concrete buildings in category of collapse state is very high (64%), that of brick masonry buildings with concrete roof in severe damage state is also high (60%) (Figure 5.2j). During field visit, it was observed that most reinforced concrete buildings privately constructed do not have earthquake resistant features. For example, out of 359 surveyed reinforced concrete buildings, nearly 40% buildings are touching or located close to an adjacent building, whose collapse can cause damage, and nearly 15% buildings have open ground storey. Of the brick masonry buildings surveyed, nearly 50% have door and window openings in walls at the corners, which can cause severe damage to the building in future.

31
EarthquakE DisastEr risk inDEx rEport
Way Forward6Earthquake Disaster Risk Index obtained is based on the preliminary screening of different
housing typologies of selected cities. It further requires a detailed structural evaluation by seismic design professionals for highly vulnerable buildings so that suitable retrofitting measures can be adopted by the policy makers. Other remaining cities lying in zone IV & V need to be targeted in the similar manner. As the screening conducted was on a macro level, so highlighting the hotspot area which are lacking in adequate structural parameter and need utmost attention can be figured out. Further, Extensive field study has to be carried out to get a realistic picture and this can be achieved by inclusion of the local bodies like city officials, local colleges which can aid in task and can help in developing and maintaining the inventory at the city level itself.
In order to better understand the potential risk, an inventory of the surveyed buildings is to be developed such that it can be utilized in case of future events and which in turn help in planning and implementation of mitigation strategies. An Intercity and Intra city comparison of the similar kind of building typologies can be made to notch out the different parameter considered presently such that it can help coming to conclusion for determining the risk estimation in a better way and to assess whether additional parameters are required apart from (a) Siting Issues; (b) Soil and Foundation; (c) Architectural Features; (d) Structural Aspects and (e) Material and Construction Details.
Periodic Evaluation of the EDRI & Technical structural safety audit of the buildings shall have to be planned such that present conditions can be compared from the inventory to have a reality check and to gauge out the pattern of improvement and based on which further appropriate measure shall have to be adopted to reduce the risk factor over the period of time. i.e. from high to moderate, moderate to low. Beside all these a ranking system may be developed so that the construction pattern may be gauged and link with the associated pattern which would help in identifying the trend in the construction and associated policy intervention may be fused accordingly.
The EDRI will be helpful in increasing significant awareness among the people residing in highly seismic vulnerable area. It can be achieved by conducting awareness programme and establishment of demonstration retrofitting units, teaching risk reduction measures, acquiring lifesaving skills and a way to respond during and after earthquakes such that local people should be prepared and can plan their immediate mitigation strategies in case of mishappening; and are able to identify the vulnerable hazardous buildings and can plan for quick repair, restoration, and retrofit the structures. Stringent actions shall have to be put in place on violation of codes or deviating away from the laid down guidelines.
32
NatioNal Disaster MaNageMeNt authority
Thus, Estimating Earthquake Disaster Risk Index requires active participation of three principal stakeholders, namely:
(1) Academia:It shall (a) identify and document various building typologies; (b) study these typologies in detail
and describe ideal building in each typology category; (c) identify penalties for each departure by conducting analytical and/or experimental research and to introduce the new technique in the market that can be adopted by industry ; and (d)train graduate and post graduate students to identify the different kind of distress present in the buildings and make them understand the structural and non-structural deficiency (e) introducing the retrofit course as part of course curriculum (f) train manpower for undertaking design of new constructions and retrofit of existing buildings.
(2) Industry:It shall: (a) outlaw unsafe typologies and encourage good typologies within the laid guidelines;
(b) propose new technologies; (c) build facilities to undertake full-scale testing; (d) build skills in its artisans; (d) encourage continuing education and research; (e) undertake to build competence in retrofit of unsafe constructions; (f) actively engage in developing standards; and (g) update its fraternity with the latest developments in earthquake safety.
(3) Government:It shall ensure that policies and systems (with legal standing) are in place for: (a) ensuring
all future constructions to be earthquake resistant; (b) identify cities whose earthquake risks are high; and (c) Seek peer review of structural safety of new constructions and modifications to existing constructions. (d) Setting up the periodic Technical structural safety Audit to ensure the safety and to understand the present condition of the buildings. (e)Stringent action shall be taken against the stakeholders for deviating away from the guidelines. (f) Establishment of the Demonstration unit to aware people and make them understand the severity of the risk involved.

33
EarthquakE DisastEr risk inDEx rEport
Bibliography
Amini-Hosseini, K., M. Hosseini, M. K. Jafari, and S. Hosseinioon. “Recognition of Vulnerable Urban Fabrics in Earthquake Zones: A Case Study of the Tehran Metropolitan Area.” Journal of Seismology and Earthquake Engineering 10, no. 4 (2009): 175-187.
Birkmann, Joern. “Risk and vulnerability indicators at different scales: Applicability, usefulness and policy implications.” Environmental Hazards 7, no. 1 (2007): 20-31.
Cardona, O.D. Holistic evaluation of the seismic risk using complex dynamic systems. PhD Thesis, Barcelona, Spain: Technical University of Catalonia, 2001.
Chenna, Rajaram, and Pradeep Kumar Ramancharla. “Calculation of Separation of Distance between Adjacent Buildings: A Review on Codal Provisions.” Journal of Seismology and Earthquake Engineering 17, no. 1 (June 2016): 31-42.
Cross, Red. World Disasters Report. France: Imprimerie Chirat, Lyon, 2016.
Davidson, Rachel. “A multidisciplinary urban earthquake disaster risk index.” Earthquake Spectra 13, no. 2 (May 1997): 211-223.
Duzgun, H. S. B., et al. “An integrated earthquake vulnerability assessment framework for urban areas.” Natural Hazard (Springer Netherlands) 59 (2011): 917-947.
FEMA-NIBS. HAZUS: user’s manual and technical manuals. Vols. 1-4. Washington, DC: Federal emergency Management Agency and Institute of Building Sciences, 1999.
Gahalaut, V. K., and B. Kundu. “The 4 January 2016 Manipur Earthquake in the Indo-Burmese wedge, an intra-slab event” Geomatics.” Natural Hazards and Risk 7, no. 5 (2016): 1506-1512.
Geohazards International, (UNCRD), University of British Columbia. “Global earthquake safety initiative (GESI): Pilot Project.” 2001.
IDNDR, International Decade for Natural Disaster Reduction. RADIUS: risk assessment tools for diagnosis of urban areas against seismic disasters. UNDRR: UN Office for Diaster Risk Reduction, 1999.
IITK-BMTPC Earthquake Tips National Information Centre of Earthquake Engineering, IIT Kanpur2007
IS 1893(Part 1), BIS. Criteria for Earthquake Resistant Design of Strctures Part 1 General Provision and Buildings. Sixth. New Delhi: Bureau of Indian Standards, 2016.
Jain, S. K., C. V. R. Murty, J. N. Arlekar, R. Sinha, A. Goyal, and C. K Jain. “Some Observations on Engineering Aspects of the Jabalpur Earthquake of 22 May 1997.” EERI Special Earthquake Report, EERI Newsletter, August 1997: 1-8.

34
NatioNal Disaster MaNageMeNt authority
Jain, S. K., C. V. R. Murty, N. N. Chandak, L. Seeber, and N. K. Jain. “The September 29, 1993, M6.4 Killari, Maharashtra, Earthquake in Central India.” EERI Special Earthquake Report, EERI Newsletter, January 1994.
Jain, S. K., et al. “The Great Sumatra Earthquake and Indian Ocean Tsunami of December 26, 2004.” EERI Special Earthquake Report #3, EERI Newsletter, April 2005: 1-12.
—. “Preliminary Observations on the Origin and Effects of the January 26, 2001 Bhuj (Gujarat, India) Earthquake.” EERI Special Earthquake Report, EERI Newsletter, April 2001: 1-16.
Jain, S.K., C.V.R. Murty, J. N. Arlekar, C. P. Rajendran, K. Rajendran, and R. Sinha. “The Chamoli, India, Earthquake of March 29, 1999.” EERI Special Earthquake Report, EERI Newsletter, July 1999: 1-8.
Jain, Sudhir K. “Earthquake Safety in India: achievements, challenges and opportunities.” Bulletin of Earthquake Engineering 14, no. 5 (May 2016): 1337-1436.
Kundak, Seda. “Economic loss estimation for earthquake hazard in Istanbul.” 44th European Congress of the European Regional Science Association. Porto, Portugal , 2004.
Mahajan, A. K., A. K. Mundepi, N. Chauhan, A. S. Jastoria, Rai Nitesh, and T. K. Gachhayat. “Active and Passive Microtremer HVSR for Assessing Site Effects in Jammu City, NW Himalaya, India - A Case Study.” Journal of Applied Geophysics 22 (2012): 51-62.
Murty, C V R, et al. Methodology for documenting seismic safety of housing typologies in India. New Delhi: Building Materials and Technology Promotion Council, 2012.
Murty, C. V. R., A. R. Sheth, and D. C. Rai. “M6.9 Sikkim Earthquake of September 19, 2011.” EERI Learning from Earthquakes, EERI Newsletter, November 2011: 6-7.
Murty, C. V. R., et al. “The Mw 6.9 Sikkim-Nepal Border Earthquake of September 18, 2011.” EERI Special Earthquake Report, EERI Newsletter, February 2012: 1-14.
Rai, D. C., and C. V. R. Murty. “The Kashmir Earthquake of October 8, 2005.” EERI Special Earthquake Report, EERI Newsletter, December 2005: 5-8.
Ramancharla, Pradeep Kumar, and C V R Murty. “Earthquake Safety of houses in India: Understanding the bottlenecks in implementation.” Indian Concrete Journal 88, no. 9 (September 2014): 51-63.
Seeber, L, S K Jain, C V R Murty, and N N Chandak. “Surface Rupture and DamagePatterns in the Ms=6.4, September 29, 1993, Killari (Latur) Earthquake in Central India.” NCEER Bulletin, October 1993.
Tucker, B, G Trumbull, and S Wyss. Some Remarks Concerning Worldwide Urban. Dordrecht, Netherlands: Kluwer Academic Publishers, 1994.
UNDP. Human Development Report. New York: Oxford University Press, 1994.

35
EarthquakE DisastEr risk inDEx rEport
Project Team
1. International Institute of Information Technology, Hyderabad
i. Ramancharla Pradeep Kumarii. Swajit Singh Goudiii. Aniket Bhalkikariv. Patnala V S Neelimav. Velani Pulkit Dilipvi. Pammi Raghu Nandan Vyasvii. Niharika Talyaviii. Himachandan Dasarix. Etoori Keethanax. Manoj Reddy
2. Project Technical Committee
i. Shri Kamal Kishore, Member, NDMAii. Joint Secretary (PP), NDMAiii. Joint Secretary (Mitigation),NDMAiv. Prof. CVR Murty, IIT Madrasv. Prof. Pradeep Kumar Ramancharlavi. Dr. Ajay Chourasia, CBRI Roorkeevii. Ms. Garima Jain, IIHS Bengaluruviii. Prof. Rupen Goswami, IIT Madrasix. Prof. Neera Agnimitra, Delhi Universityx. Dr. Satya R Chakravarty, ISI Kolkataxi. Shri R Srinivas, TCPO, MoHUA, New Delhixii. Shri Arvind jaiswal, Structural Engineer, Hyderabadxiii. Shri AP Tiwari, HUDCO, New Delhixiv. Shri Hari Kumar, Geohazard International New Delhixv. Dr. Vineet Kohli, TISS Mumbai

36
NatioNal Disaster MaNageMeNt authority