Earth Science 105 Laboratory Manual - WOU
103
Earth Science 105 Laboratory Manual 2015-2016 Updated December 2014
Transcript of Earth Science 105 Laboratory Manual - WOU

Earth
Science 105
Laboratory
Manual
2015-2016 Updated December 2014
Earth Science 105 2015-2016 Academic Year
Updated December 2014
Laboratory Manual
Table of Contents
Lab 1 ENERGY AND ENERGY TRANSFORMATIONS Lab 2 EXPLORING WORK MOTION AND GRAVITY Lab 3 ENERGY OF OBJECTS IN MOTION AND PHYSICS OF
LANDSLIDES Lab 4 UNDERSTANDING GEOLOGIC TIME
Relative Dating and Fossils Radioactivity and Numerical Age Determination
Lab 5 INTRODUCTION TO CHEMICAL REACTIONS Lab 6 STUDY OF SEDIMENTS AND SEDIMENTARY ROCKS Lab 7 TOPOGRAPHIC MAPS AND STREAM SYSTEMS
A Introduction to Topographic Maps B Stream Tables and Fluvial Landscapes
Appendix ndash ADDITIONAL LABORATORY EXERCISES
11
ES 105 Laboratory 1 ENERGY AND ENERGY TRANSFORMATIONS
Introduction
Energy is an integral and fundamental part of our lives and we often do not realize how
dependent we and our society are on energy Our bodies in order to perform their most basic
biological functions consume large amounts of energy This lab is designed to give you examples
of different types of energy and to demonstrate some of the ways energy can be transformed from
one type to another
One of the main concepts you will be introduced to is the concept of conservation of energy
This important concept tells us that energy is never created or destroyed it can however
be transformed into different types of energy (like motion or heat) During any given energy
conversion an equal amount of energy exists before and after the conversion process There will
be several stations that explain and demonstrate the conservation and conversion of energy You
will see that energy can seem to disappear No process of transforming one type of energy to
another is perfectly efficient and some energy will always be converted into forms that are
inaccessible to us As you tour each station refer to the various sections in this manual that will
lead you through this exploration of energy
Goals and Objectives
bull Investigate the concept of conservation of energy
bull Explain transformation of energy
bull Convert energy from one type to another
Forms of Energy (a few examples)
bull Mechanical (Kinetic)
bull Mechanical (Potential)
bull Electromagnetic (Light)
bull Electromagnetic (other)
bull Heat
bull Chemical
bull Electrical
bull Magnetic
bull Nuclear
P
a
Pre Lab Act
and comple
tivity Fill in
ete Table 1 (
n the blanks
(next page)
s below with
Name____
Lab Day __
h appropria
___________
____ Lab Tim
te Energy F
__________
me________
Forms and T
__________
__________
Transforma
12
_____
_____
ations
13
Pre-Lab Activity (continued) ndash Start Table 1 before coming to lab
Instructions Complete Table 1 before class and compare and contrast answers with your lab group when you arrive in class
Table 1 is provided for you to complete In the left-hand column list as many forms of energy as you can In the right-hand column identify an example To get you started you might recall that electromagnetic waves are one form of energy and an example might be the microwaves in your microwave oven
Table 1
Form of Energy Example
Electromagnetic Waves (light) Microwaves (in your microwave oven)
14
Part A - Conversion of Mechanical Energy into Heat Energy
Conservation of energy is a very important concept The term simply means that energy cannot be created or destroyed - it is conserved There is a finite and unchanging amount of energy in the universe There is however no restriction on converting one form of energy into another (except as per the Second Law of Thermodynamics) There are many devices (or processes) that transform one type of energy to a different type of energy Sometimes it is said that energy is ldquolostrdquo in transforming one kind of energy into another but in reality the ldquolostrdquo energy is only converted into a form that is unavailable to use conveniently Often the ldquolostrdquo energy is in the form of heat that escapes into the surrounding environment
Activity 1 Use the table below extend the list by adding your own entries to the table
Then share your list with the others in your group and compile a lsquomaster listrsquo Table 2 Shows some possible ways that energy can be lost during a conversion
To Convert Into You Might Use Ways Energy Might Be Lost Electrical Light A light bulb The lamp heats up and the heat
escapes into the air
Mechanical (Kinetic)
Electricity An electrical generator
Light Heat A solar collector (that sits in the sun and uses black pipes filled with water)
The water that absorbs the light and converts it to heat begins to boil and this requires a form of chemical energy
Heat Mechanical A steam engine
Chemical Light A chemical reaction
Ultraviolet (UV) Waves
Visible Light Waves
15
Activity 2 Moving hands (Mechanical energy transformed into heat energy) Instructions Press your hands together and rub them back and forth twenty times As you do this press as hard as you can but still allow them to rub together Try to apply the same force throughout this activity As soon as you stop rubbing feel the temperature of your hands
1 What did you observe Explain in terms of energy conservation and conversion
2 Change the amount of frictional force between your two hands by pressing your hands together very lightly (reducing friction) Rub them back and forth twenty times As before feel the temperature of your hands where they touched Were they warmer or cooler than before
3 Compare this observation to the one above Explain in terms of energy conservation and conversion
4 Does reducing the frictional force affect how much mechanical energy is transformed
into heat energy
5 Explain why you put grease (a lubricant) on parts of your bicycle that rub together (eg
wheel bearings) Explain your answer to this question in terms of energy conservation and lost energy
6 Make a short list of things (five things) you encounter every day that convert mechanical
energy (of moving objects) into heat
16
Part B - Conversion of Mechanical and Chemical Energy into Electrical Energy
A generator converts mechanical energy into electrical energy Electrical energy can flow through a wire in the form of an electrical voltage and commonly is used to light a bulb to produce light The light bulb converts the electrical energy into light energy that our eyes can easily detect
Activity 1 Hand crank generator to electric light (Mechanical to Electrical)
This consists of a hand-crank generator to convert mechanical energy to electrical energy and wires to carry the electrical energy (voltage) to a light bulb Instructions
1 Connect one wire-lead from hand generator to light bulb leaving the other wire-lead unconnected (open circuit) Gentle turn the generator and ldquofeelrdquo (gauge) the degree of difficulty Was it (easy moderate or difficult) to turn the crank
2 While turning the crank at the same speed as above connect the other wire-lead to the light (closed circuit) and ldquofeelrdquo (gauge) the degree of difficulty to turn the crank Was it (easy moderate or difficult) to turn the crank
Questions
1 What do you notice about how hard the hand crank turns with respect to a closed circuit (light bulb on) verses an open circuit (light bulb off) Explain why there is a difference
Activity 2 Measuring actual voltage in a closed circuit
Instructions bull For Multimeter black wire-lead connects to COM terminal and red wire-lead connects to
theVmA terminal (check with instructor) bull Connect hand generator wires to each wire of the Multimeter (at direct voltage (DCV) setting of
20) and slowly turn the handle and record the voltage in the table below Repeat for a faster turn Slow Turn Voltage (volts) = Fast Turn Voltage (volts) = Thought Question
1 (Think about and Discuss) How hard (fast) and how long you would need to turn the hand generator to produce enough energy to light a 60 watt light bulb for an hour Or brew a cup of coffee in the morning
17
Activity 3 Comparing chemical (battery) energy to mechanical energy Instructions bull Connect the battery pack to the Multimeter and record the voltage (in table below) using same
settings (Multimeter at direct voltage (DCV) setting of 20) as activity 2 above bull Disconnect the battery pack and connect the hand generator to the Multimeter and try to maintain
a constant turn that replicates the same voltage as the battery pack Now you can FEEL the energy associated with 3-volts
Voltage (volts) with 3-volt (2-battery) pack =
Speed of hand generator (slow medium or fast) associated with 3-volts (2-batteries) =
Questions
1 (Think about and Discuss) How hard (fast) and how long you would need to turn the hand generator to produce enough energy to recharge your cell phone (Typical cell phone batteries are 37 volt and 800 mAhour)
Part C - Conversion of Heat into Mechanical Energy
Figure 1 Apparatus to investigate conversion of heat energy to mechanical energy
Rubber hose
(Test tube)
18
At this station you will convert heat energy into mechanical potential energy To understand how the potential energy is observed consider the U shaped tube in Figure 1 One side of the U-shaped tube is connected to a small reservoir (a test tube) the other end of the U-shaped tube is open to the atmosphere If the pressure in the reservoir is the same as the atmosphere the water level in both sides of the tube will be the same However if the pressure inside the reservoir is larger than the atmospheric pressure the water levels will be different the pressure inside the reservoir tends to push the water out of the tube In lifting the water in the tube the gas in the reservoir does work holding the water up (that is holding it in a non-equilibrium position) requires energy -- mechanical potential energy To make the gas expand (and increase the pressure in the reservoir) we rely on the ideal gas law The Ideal Gas Law states that if you increase the temperature of a gas the pressure will increase To increase the temperature you must transfer heat (energy) into the system
Activity 1 Hot and Cold (thermal energy) converted into Mechanical Energy
Instruction
bull Record the location of the water level on the scale (Measure the level of water on the open end of the glass U tube)
bull Place the air-test tube (reservoir) into the warm water beaker and record the new level of the water in the table below
bull Now place the air-test tube (reservoir) into a beaker of cold water What happens to the water level in the tube when the reservoir is cooled Record your observations in the table
Observations Initial water level on open side of the glass U tube
Water level on open side of the glass U tube in warm water reservoir for 30 sec
Water level on open side of the glass lsquoUrsquo tube after immersing in beaker of cold water
Describe change of water level from previous level
Questions 1 1 Explain your observations recorded in the table in terms of energy conservation and
energy conversion 2 What happens when you leave a blown-up balloon in the sun Give a detailed explanation as
to what happens to such a balloon in terms of energy transfer and conservation of energy
19
Part D mdash Conversion of Light Energy into Electricity Light energy conversion to other types of energy (eg electricity) is never 100 efficient
This station contains a solar cell which directly converts light to electricity with approximately 5 efficiency That is 5 of the light that reaches the panel surface is converted to electricity
Activity 1 Solar to electrical to mechanical
Instructions The small motor connected to the solar cell converts light to electricity and then to mechanical energy
1 Turn 40-watt lamp on and observe if motor (Fan) turns Record how fast fan is turning
2 Turn 75-watt lamp on and observe if motor (Fan) turns Record how fast fan is turning
Questions 1 Which wattage (light bulb) produced the most electricity (turned the fan fastest) 2 Most (95) of the light energy was lost in the process of conversion Where do you suppose
the other 95 of the light energy is going if only 5 is converted to electrical energy Refer to Table 5 below to answer the post-lab question about energy conservation Table 5 Estimates and comparisons of energy usages in your daily lives
Energy Using Activity Is Comparable With
Take a hot bath (full tub) Burning a 100 Watt lamp for a day
Using a 250 watt hair dryer for 8 minutes Riding your bike 30 miles (under ideal conditions)
Heating a pot of water for tea or coffee on the stove
Bench lifting a 50 lb weight 40000 times
Watch TV for an hour Eating a dessert with 250000 calories
Driving your car 45 miles to Portland Playing 13400 games of racquetball
Leaving a 100 watt light burning all night (10 hours)
Dancing the Tango for 45 days nonstop
110
Name____________________________________
Lab Day _____ Lab Time_____________________ POST-LAB ASSESSMENT Comparison of Energy Sources
Questions 1 It is part of our common language to use the term lsquoconserve energyrsquo to mean lsquotry to
consume less energyrsquo Contrast this meaning of lsquoconserve energyrsquo with the physics law of lsquoconservation of energyrsquo
2 All methods of generating electricity have adverse impacts on the environment Try to list at least two ways that each of the following energy sources used to generate electricity negatively impact the environment a) Burning fossil fuels b) Hydroelectric (dams) c) Solar
(Hint you might consider what impact building such plants may have on the environment) 3 Which is you favorite energy source Why
4 Try to stump your lab partner by thinking of a situation where energy is apparently lost for good Write down the ideas you come up with and give your lab partnerrsquos explanation of where the lost energy went
Consider the idea that energy is always conserved and discuss whether people will ever be able to generate power without affecting the planet Record your discussion
2-1
ES 105 Laboratory 2 EXPLORING WORK MOTION AND GRAVITY
Introduction
Work Work is a word used in many different ways It is used to describe our jobs and
careers It is used to describe what we do when we study for an exam However with regards to science that is not what work is The scientific definition of work is a force acting through a distance (Work = Force x Distance) A force is just a ldquopush or a pullrdquo that gives energy to an object sometimes causing a change in motion of the object (Recall from last lab that Energy is the property of a system that enables it to do work) Work is done only when a force moves an object When you push lift or throw an object you are doing work Your force is acting on the object causing it to move a certain distance One important aspect of work to note is the direction of the applied FORCE must be in the same direction of the DISPLACEMENT (movement) for it to be considered WORK
Friction Friction is a resistive force that opposes the motion or attempted motion of an object with which it is in contact In a sense friction is a force that resists (or limits) the work being done as objects are moved Friction always acts in a direction to oppose motion So when an object falls downward through the air the force of friction (referred to as Air Resistance) acts upward There are different types of friction including rolling friction and fluid friction but for the purpose of sliding solid objects across a floor or tabletop the two important types of friction are static and sliding friction The strength of these forces of friction depends upon two factors 1) the types of surfaces involved and 2) how hard the surfaces push together Static friction occurs when you first try to move the object before it is in motion and is a little stronger of a friction force than sliding (or moving) friction once the object is in motion
Gravity and Free Fall ldquoFree-falling objectsrdquo refer to objects that are allowed to fall straight down accelerated ONLY by the force of gravity An object in free fall accelerates as it falls due to the force of gravity (acting as an unbalanced force) Other than the force of gravity what other affects might there be on a falling object The dreaded air resistance is one effect However the effects of air resistance can be ignored as long as the (maximum) velocity of the object is relatively modest For most objects beginning at rest air resistance is negligible throughout the first seconds of fall
In this weekrsquos lab there will be a series of stations that will allow you to explore the motion of objects and how friction affects the motion of both sliding and free-falling objects You will also learn how to calculate the work needed to move objects Your instructor will help you gather data to measure the acceleration of free falling objects due to gravity
There are a few basic measurements and calculations that are necessary to understand the motion of objects and the work needed to move objects These measurements and calculations include
2-2
Distance or Displacement
(d) the distance over which an object moves under the influence of gravity (units of measurement eg centimeters meters kilometers)
Time of Travel (t)
the time during which an object completes its travel (units of measurement eg seconds minutes hours)
Velocity v = dt
the rate of change or displacement (units of measurement eg mileshour meterssec)
Acceleration a = change in velocity time
the rate of change of velocity of an object over time (units of measurement for acceleration are dt2 such as meterssecsec = meterssecond2)
Force (F)
is a push or a pull units generally measured in (Newtons)
Work (w)
is the change in an objectrsquos state of motion that results from the application of a Force
Work (joules) = Force (Newtons) x Displacement (meters)
Power (P)
Is the time rate of work Units generally measured in (watts)
Power (watts) = Work (joules)Time (seconds)
Goals and Objectives
bull Students will be able to perform measurements using a spring scale to determine the force associated with lifting and pulling weight
bull Students will be able to be able to calculate the average work bull Describe what is meant by accelerated motion bull Determine the acceleration of gravity
Useful Websites
bull httpwwwpbsorgwgbhnovagalileo
2-3
Name____________________________________
Lab Day _____ Lab Time_____________________ Pre-Lab Activity Complete the following calculations prior to arrive in lab Show all of your math work and unit conversions (HINT 1 hour = 60 minutes 1 min = 60 seconds 1 km = 1000 m) and (1 kilogram = 1000 grams) 1 If you drive a car for a distance of 35 km and it takes you 45 minutes to do so what is your
average velocity in units of kmhr What is your average velocity in msec 2 Phil has a very messy office and wants rearrange some furniture He needs to move a desk 10
meters If Phil exerts a force of 20 Newtons how much work is he doing 3 What is the Force (in Newtons) associated with a 500 gram weight in free fall near the
Earthrsquos surface (assume acceleration due to Earthrsquos gravity is ~ 10 meterssecond2) (note the 2nd Law of Motion is F(Newtons) = mass(kilograms) x acceleration(metersseconds2)
4 You will be using a Spring-scale to determine the Force associated with moving objects in the
lab Go to Wikepidiaorg (httpenwikipediaorgwikiSpring_scale) and write a brief definition of what a Spring scale is (Be careful to discuss difference between Mass and Force readings)
5 A spring scale measuring the force associated with lifting a 500 gram weight on Earth (3
above) is now used on the Moon What will the Spring scale readings be for Mass and Force associated with the Spring scale reading on the Moon
(assume acceleration due to Moonrsquos gravity is ~16 meterssecond2)
MASS (in grams) FORCE (in Newtons)
2-4
Part A mdash Work Activity 1 Letrsquos Talk Work Instructions
bull Tape a meter stick to an object to keep it vertical bull Use a force spring scale to lift weights of different sizes to the 30 cm mark bull Record your data in the table below bull Use a force spring scale to lift weights of different sizes to the 60 cm mark bull Record your data in the table below
Data Table One
Weights (Grams)
Height (Centimeters)
Distance (Meters)
Force (Newtons)
Work (joules)
100
30
Predict
What will happen to force if weight is raised to 60 cm _____________________
__________________________________________________________________
What will happen to work if weight is raised to 60 cm ______________________
__________________________________________________________________
Now try it and see if your prediction was correct
100
60
200
30
Predict
What will happen to force if weight is raised to 60 cm _____________________
__________________________________________________________________
What will happen to work if weight is raised to 60 cm ______________________
__________________________________________________________________
Now try it and see if your prediction was correct
200
60
Try 500
30
2-5
Questions
1 What does doubling the height (distance moved) do to total work
2 What does doubling the force do to total work Solving Problems Remember to include your units of measurement Some measurements are required to solve
1 Kelsey is a very strong She lifted a 200-gram weight to 50 cm How much work did she do 2 Mario wants to be a super hero He has been practicing for his super hero test by lifting cars If
Mario exerts a force of 12000 Newtons to lift a car 2 meters how much works is being done on the car
Part B mdash Friction Use the spring scale to measure the pulling force (associated with Static and Sliding friction) necessary to move at constant velocity a wood block across different surfaces Add a 200 gram weight to block and measure the pulling force again Record your measurements in Table below
Friction Surfaces Static vs Moving Type of Surface Static Friction
(Newtonrsquos) Moving (Newtonrsquos)
Static with weight
Moving with weight
Smooth-smooth
Smooth-rough
Rough-rough
1 What surface(s) and weight had highest amount of friction Explain your answer Which
was greater Static or sliding friction
2-6
Part C mdash Gravity and the Physics of Free-Falling Bodies Activity 1 Free Fall of Objects with Similar Size but Different Mass Collect two balls of the same size but different weight such as a heavy solid steel ball and a light hollow plastic ball With your lab partners hold both balls simultaneously at a height of one (1) meter above the floor
As a group make a hypothesis (predict) as to which ball will hit the ground first As a group test your hypothesis by releasing the balls at the same time Repeat the experiment several times and describe your results
1 How did the actual results compare to your initial hypothesis What can you conclude about the effects of the Earthrsquos gravity on the heavy and light ball respectively
Activity 2 Free Fall of Unlike Objects In your group repeat activity 1 only this time using a rock and a feather (or piece of paper if you cant find a feather) Hold the rock and feather at a height of 1 m above the floor
As a group make a hypothesis (predict) as to which object will hit the ground first the rock or the feather As a group test your hypothesis by releasing the rock and feather at the same time Repeat the experiment several times and describe your results
2 How did the actual results compare to your initial hypothesis What can you conclude about the effects of the Earthrsquos gravity on the rock and feather respectively
3 How does this activity compare to Activity 1 with two balls of the same size but different
weight Explain the differences andor similarities
2-7
Activity 3 Free Fall in a Vacuum
NOTE Do NOT run the vacuum pump unless it is connected to the lsquoRock and the Featherrsquo tube
As a lab group visit the station that consists of a glass vacuum tube and vacuum pump The apparatus consists of a long tube containing a rock and a bit of paper (or feather depending which tube is available) Air in this tube can be evacuated using the vacuum pump thus creating a vacuum (similar to space) Hold the tube vertically with the valve-end up Hook up the hose to the tube open the valve and turn on the pump After 60-80 seconds all air should be evacuated from the tube Shut the valve turn off the pump and remove the hose With all of the air out of the tube quickly turn the tube end up and hold it vertically while the feather and rock experience free fall Repeat the process several times and note your observations 4 Which object hits first in the vacuum tube the rock or the feather (or piece of paper as the
case may be) 5 How do the vacuum tube results compare with the results from Free Fall Activity 2 (above) 6 Explain processes that influence free-fall of objects under the influence of Earthrsquos gravity
a What are the controlling factors
b How does the Earthrsquos atmosphere affect the free fall of objects under the influence of gravity
c What other force(s) besides gravity is operating on the objects
2-8
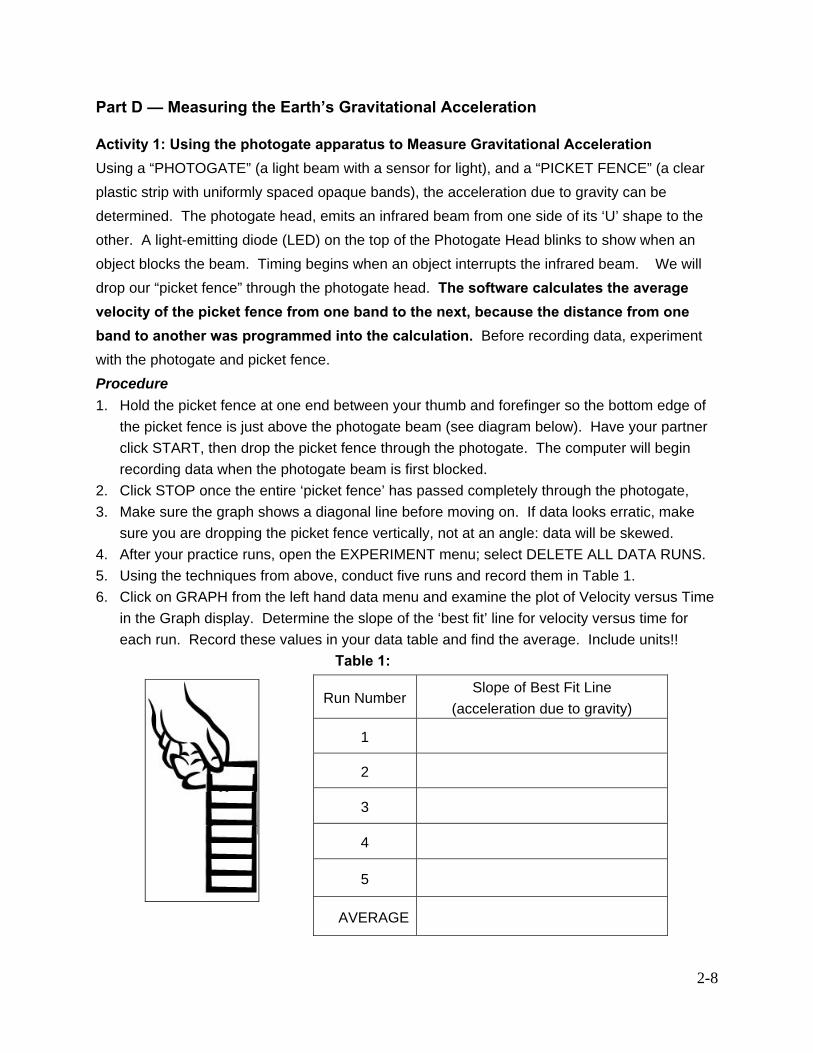
Part D mdash Measuring the Earthrsquos Gravitational Acceleration Activity 1 Using the photogate apparatus to Measure Gravitational Acceleration Using a ldquoPHOTOGATErdquo (a light beam with a sensor for light) and a ldquoPICKET FENCErdquo (a clear plastic strip with uniformly spaced opaque bands) the acceleration due to gravity can be determined The photogate head emits an infrared beam from one side of its lsquoUrsquo shape to the other A light-emitting diode (LED) on the top of the Photogate Head blinks to show when an object blocks the beam Timing begins when an object interrupts the infrared beam We will drop our ldquopicket fencerdquo through the photogate head The software calculates the average velocity of the picket fence from one band to the next because the distance from one band to another was programmed into the calculation Before recording data experiment with the photogate and picket fence Procedure 1 Hold the picket fence at one end between your thumb and forefinger so the bottom edge of
the picket fence is just above the photogate beam (see diagram below) Have your partner click START then drop the picket fence through the photogate The computer will begin recording data when the photogate beam is first blocked
2 Click STOP once the entire lsquopicket fencersquo has passed completely through the photogate 3 Make sure the graph shows a diagonal line before moving on If data looks erratic make
sure you are dropping the picket fence vertically not at an angle data will be skewed 4 After your practice runs open the EXPERIMENT menu select DELETE ALL DATA RUNS 5 Using the techniques from above conduct five runs and record them in Table 1 6 Click on GRAPH from the left hand data menu and examine the plot of Velocity versus Time
in the Graph display Determine the slope of the lsquobest fitrsquo line for velocity versus time for each run Record these values in your data table and find the average Include units
Table 1
Run Number Slope of Best Fit Line (acceleration due to gravity)
1
2
3
4
5
AVERAGE
2-9
Name____________________________________
Lab Day _____ Lab Time_____________________
Post-Lab Questions on Acceleration Due to Gravity 1 What can you say about the values for acceleration from Table 1 Is it constant or does it
vary in some consistent manner
2 Compare your values (from Table 1 above) for the acceleration due to gravity g (with the accepted value for g at sea level at the equator of g = 981 ms2
3 What factors may have contributed to the value you determined experimentally being
different from the accepted value List and briefly describe several of these
31
ES 105 Laboratory 3 ENERGY OF OBJECTS IN MOTION and
PHYSICS OF LANDSLIDES
Introduction In this lab we will work with two important aspects of the physics of objects in motion From
lab 1 you should recall that energy can be transformed from one type to another and that energy is never created or destroyed it can however be transformed into different types of energy (like motion or heat) This is known as the concept of conservation of energy This very important concept tells us that an equal amount of energy exists before and after the conversion process Today in lab you will work with converting gravitational potential energy to kinetic In doing so it will seem that energy can disappear No process of transforming one type of energy to another is perfectly efficient and some energy will always be converted into forms that are inaccessible to us
The second key aspect of todayrsquos lab will focus on the physics of landslides Landslides are part of a spectrum of gravity-driven geomorphic processes collectively known as ldquomass wastingrdquo Mass wasting processes include rock fall rock avalanche landslide earth flow debris flow and soil creep The prerequisite conditions for landslides typically include (1) the Earthrsquos gravitational field (a fundamental driving force) (2) the occurrence of loose rock and sediment at the Earthrsquos surface (3) heavy rainfall and (4) steep slopes To understand the occurrence of landslides geologists and engineers must first understand the physics of gravity (ldquoNewtonian physicsrdquo ldquoNewtonrsquos Laws of Gravityrdquo) and how it interacts with materials (rock and sediment) at the Earthrsquos surface This lab provides an introduction to Newtonian physics gravity and the forces that cause landslides
Goals and Objectives
bull Further investigate the concept of conservation of energy bull Investigate the conversion of gravitational potential energy to kinetic energy bull Formulate explanations for energy that can seem to disappear bull Calculate effect of angle of influence on the acceleration of gravity bull Investigate frictional effect on motion
Useful Websites bull httplandslidesusgsgov bull httpwwwfemagovhazardlandslideindexshtm bull httpwwwphysicsclassroomcomClassnewtlawsU2L3ahtml bull httpwwwgrcnasagovWWWK-12airplanenewton2html bull httpenwikipediaorgwikiSineComputation
32
Name____________________________________
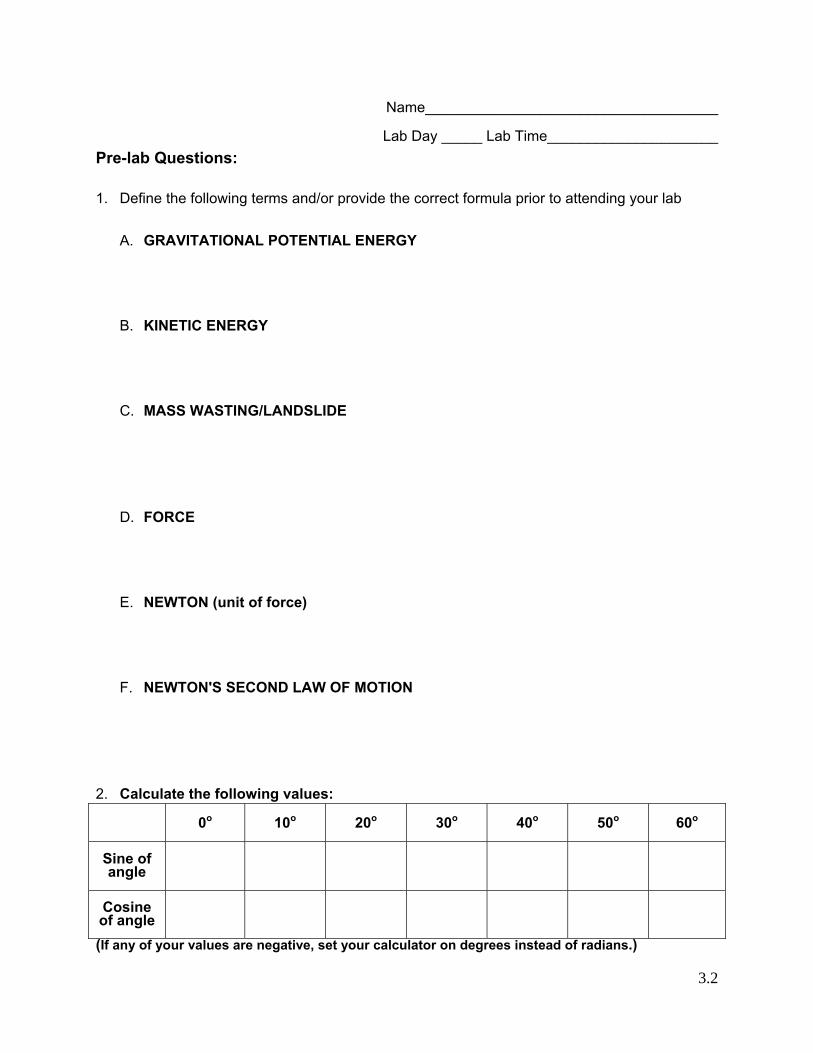
Lab Day _____ Lab Time_____________________ Pre-lab Questions 1 Define the following terms andor provide the correct formula prior to attending your lab
A GRAVITATIONAL POTENTIAL ENERGY
B KINETIC ENERGY
C MASS WASTINGLANDSLIDE
D FORCE
E NEWTON (unit of force)
F NEWTONS SECOND LAW OF MOTION
2 Calculate the following values
0o 10o 20o 30o 40o 50o 60o
Sine of angle
Cosine of angle
(If any of your values are negative set your calculator on degrees instead of radians)
33
Part A mdash Energy Transformation and Conservation In closed systems the Law of Conservation of Energy is obeyed It states the total energy
remains constant Another way to say this is that the initial total energy in a closed system is equal to the final total energy In this part of the lab we will examine two types of energy
1mdashTranslational Kinetic Energy = 2mv
21
EK =
where m = mass (kilograms) and v = velocity (msec) Kinetic energy is the energy associated with motion along a line It is measured in Joules [J] which is the same as
2
2
secondmeters kilogramstimes
2mdashGravitational Potential Energy = EP = mgh
where m = mass (kilograms) g = acceleration due to gravity (98 msec2) and h = height above surface (m) Gravitational potential energy is the energy associated with the gravitational pull on an object that is some elevation (h) above a surface (usually Earthrsquos surface) Think of skiing down a slope at the top of the hill you have a large potential energy ndash your elevation h is large As you travel down the hill your elevation decreases so does your potential energy EP = mgh At the bottom of the hill (at an altitude of h = 0) your potential energy is zero Does this mean your energy went to zero No Your potential has been converted into translational kinetic energy and yoursquore zipping along
Instead of skis we will roll a ball down a ramp converting potential energy into kinetic energy At the bottom of the ramp the ball can roll with some friction along a horizontal track We measure the final velocity as the ball traverses one meter along this track By comparing the initial potential energy to the final kinetic energy we will determine if energy is conserved Activity 1 Investigating gravitational potential energy and translational kinetic energy Go to the ramp-track station in the lab It should look like this
Support (Rods and Clamps)
Ramp
Table
Horizontal Track
lsquozerorsquo marker lsquo1 meterrsquo marker
Tape lsquocatcherrsquo
Release Point
h = 003 m
Meter Stick
Figure 1 Apparatus to investigate the conservation of energy
34
Procedures
1 Determine the mass of the ball in grams using one of the balances in the lab Record below
The ballrsquos mass is __________________ g and convert this mass to kilograms record below
__________________ kg 2 Carefully measure a starting point on the ramp that is 3 centimeters above the base of the
horizontal track (H= 003 m) Make sure you are measuring the VERTICAL HEIGHT of the starting point NOT the diagonal length from the base of the ramp
3 One person will release the ball from the previously determined release point Another person in the group will click START to begin recording The program will record the value of position versus time One person must catch the ball before it hits the motion sensor
DO NOT LET THE BALL HIT THE MOTION DETECTOR 4 Repeat this measurement for a total of five trials After each trial use the best fit line tool to
determine the slope of the graph following directions provide below The slope of the position versus time graph is equal to the average velocity of the ball rolling along the horizontal surface Record the velocity for each trial in the data table below (Table 1) Repeat your experiment 5 times and find the average
5 Follow these directions to determine the best fit line a Click the DATA tool button Select NO DATA b Click the DATA tool button again This time choose Run 1 c Click on the SCALE TO FIT button d Using your mouse select data click and hold the left mouse button to draw a box
around the part of the graph that is a smooth diagonal line This part of the graph corresponds to the ball rolling along the horizontal surface The line should be highlighted in yellow
e Now click on the FIT button and select LINEAR Record the slope (m) in Table 1 as the velocity
f Repeat steps a through e for all five trials Be sure to select part of the line for each trial Do not rely on it having yellow highlight Tabulate your data in Table 1
6 Run the experiment again starting the ball at 6 centimeters above the table top and calculate the velocity on the horizontal track in meterssecond Repeat your experiment 5 times and find the average Tabulate your data in Table 2
35
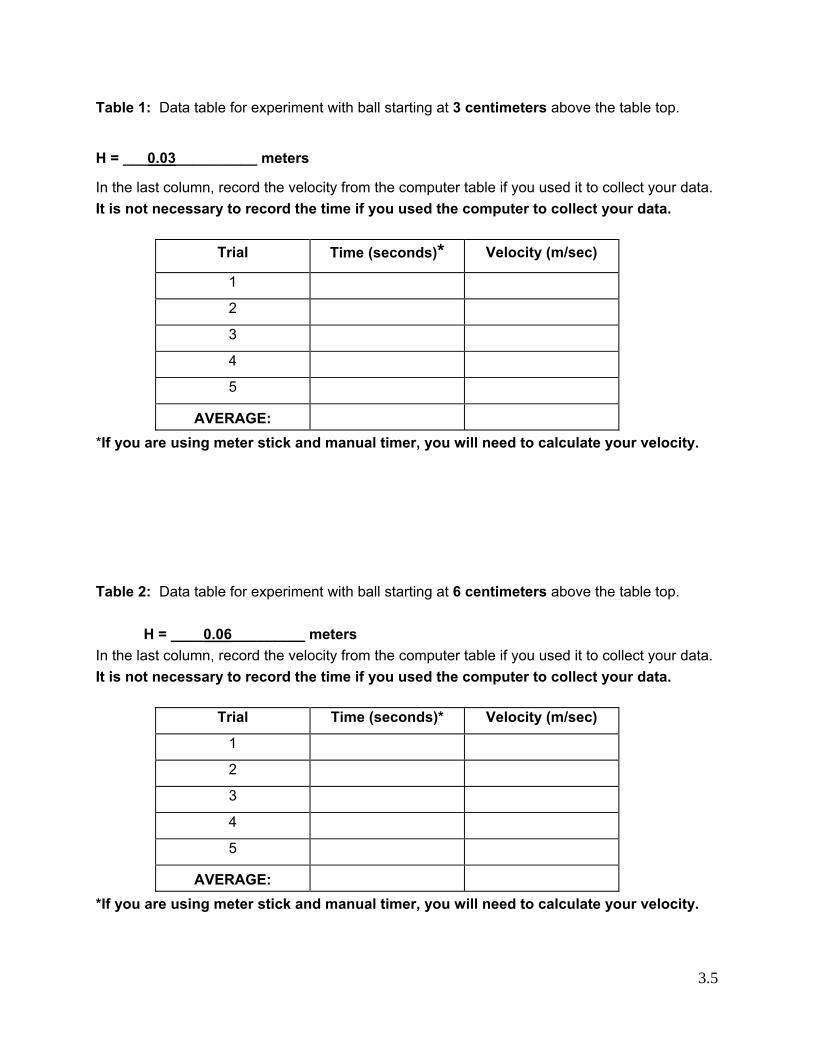
Table 1 Data table for experiment with ball starting at 3 centimeters above the table top
H = ___003__________ meters
In the last column record the velocity from the computer table if you used it to collect your data It is not necessary to record the time if you used the computer to collect your data
Trial Time (seconds) Velocity (msec)
1
2
3
4
5
AVERAGE
If you are using meter stick and manual timer you will need to calculate your velocity Table 2 Data table for experiment with ball starting at 6 centimeters above the table top H = ____006_________ meters In the last column record the velocity from the computer table if you used it to collect your data It is not necessary to record the time if you used the computer to collect your data
Trial Time (seconds) Velocity (msec)
1
2
3
4
5
AVERAGE
If you are using meter stick and manual timer you will need to calculate your velocity
36
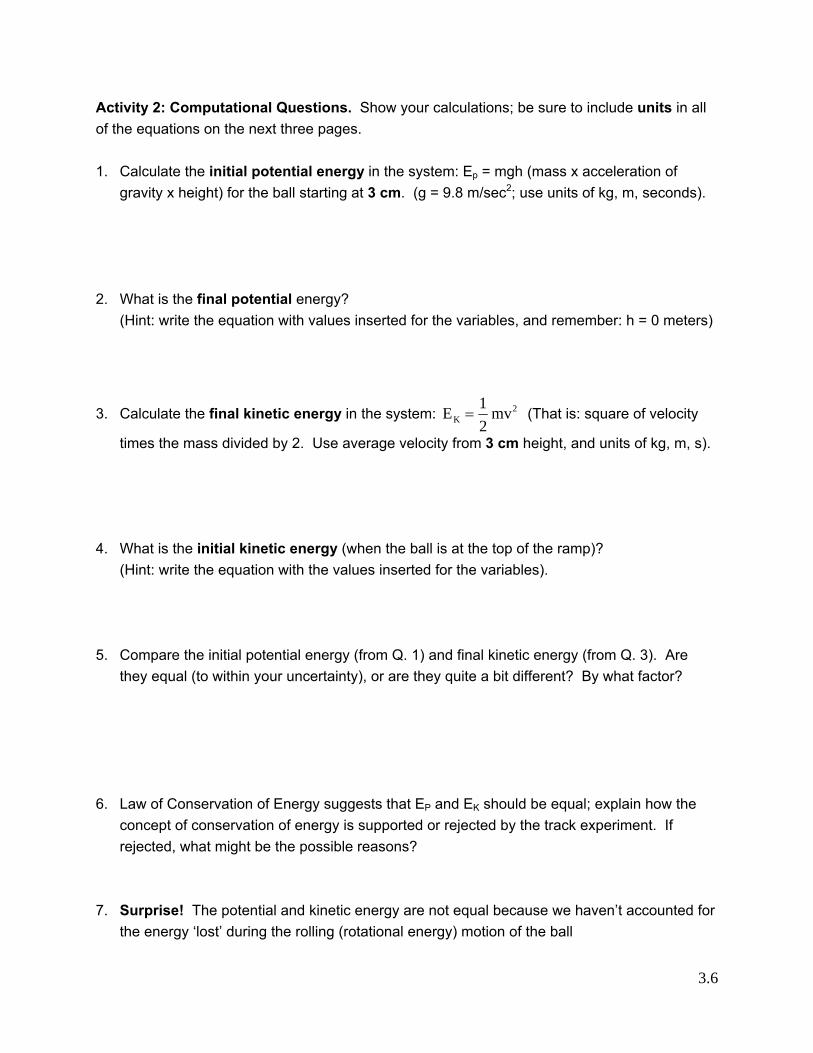
Activity 2 Computational Questions Show your calculations be sure to include units in all of the equations on the next three pages 1 Calculate the initial potential energy in the system Ep = mgh (mass x acceleration of
gravity x height) for the ball starting at 3 cm (g = 98 msec2 use units of kg m seconds) 2 What is the final potential energy
(Hint write the equation with values inserted for the variables and remember h = 0 meters)
3 Calculate the final kinetic energy in the system 2K mv
21 E = (That is square of velocity
times the mass divided by 2 Use average velocity from 3 cm height and units of kg m s) 4 What is the initial kinetic energy (when the ball is at the top of the ramp)
(Hint write the equation with the values inserted for the variables) 5 Compare the initial potential energy (from Q 1) and final kinetic energy (from Q 3) Are
they equal (to within your uncertainty) or are they quite a bit different By what factor 6 Law of Conservation of Energy suggests that EP and EK should be equal explain how the
concept of conservation of energy is supported or rejected by the track experiment If rejected what might be the possible reasons
7 Surprise The potential and kinetic energy are not equal because we havenrsquot accounted for
the energy lsquolostrsquo during the rolling (rotational energy) motion of the ball
37
Part B mdash Newtonrsquos Second Law Force and Landslide Analysis Landslides are driven by the Earthrsquos force of gravity acting on a mass of rock or sediment on an inclined hillslope The critical analytical parameters include
Symbol Name Description Units
F Force of Gravity The pulling action on an object due to Earthrsquos gravity
Newton N = 1 kg-msec2
g Acceleration due to gravity
Constant on the Earth g = 983 msec2 msec2
m Mass Amount of material measured in kilograms
kg
θ Angle of Slope Angle of hill-slope inclination (90 degrees = sheer cliff face 0 degrees = flat surface)
degrees
Newtonrsquos second law of gravity states that the force operating on an object in space is directly proportional to the product of its mass and acceleration Newtonrsquos second law translates into the following equation
F = ma where F = force (Newton) m = mass (kg) and a = acceleration (msec2)
When Earthrsquos gravity is considered ldquoFrdquo is equivalent to ldquoweightrdquo (eg your weight on a scale is a measure of the Earthrsquos gravitational pull on your body mass the more mass you have the more you weigh) and ldquoardquo is equivalent to ldquogrdquo which is the acceleration due to gravity (a constant = 98 msec2) In terms of Earthrsquos gravitational pull Newtonrsquos second law is translated as
Wt = mg where Wt = weight of an object (Newtons) m = mass of object (kg) and g = acceleration due to gravity (g = 98 msec2)
This part of the lab is particularly relevant because the Willamette Valley represents one of
the most dynamic and spectacular geologic environments in the United States Intense seasonal rainfall patterns steep mountain slopes and expansive valleys provide for an active geomorphic setting associated with seasonal flooding and landslides Annual cost of damage to public and private lands in western Oregon ranks among the top 20 of the most severe in the United
38
States Damage to public infrastructure from storm events during the mid-1990rsquos alone totaled hundreds of millions of dollars Landslides accounted for a large portion of this damage Slope failure and erosion in the Coast Range are further exacerbated by sustained timber harvesting and the Willamette Valley is experiencing unprecedented population growth and development invading the foothills Understanding of the spatial and temporal distribution of landslides is critical for the appropriate design of land-use regulations hazards mitigation and conservation planning (read this as ldquoYour house could be next How do you know if you are at risk for landslide and what can you do about itrdquo)
Application of Newtonrsquos Second Law With your lab group visit the inclined plane station and examine the apparatus A mass of rock is sitting on an inclined plane this is analogous to a mass of rock on a hill-slope in the Coast Range or western Cascades The figure below illustrates the forces acting on the slope material
Figure 2 Diagram of forces of weight Definitions for Particle on Slope
θ = slope angle relative to horizontal plane (units in degrees) Wt = weight of particle or mass of material (units in N) = mass x gravity Shear force parallel to slope = Wt x sin θ (units in N) Normal force perpendicular to slope = Wt x cos θ (units in N)
Equations for Particle on Slope
Wt (weight of particle in Newtons) = mg (= mass times acceleration of gravity) SHEAR force (in N) = Wt (sin θ) NORMAL force (in N) = Wt (cos θ)
39
Activity 1 Force Analysis of a Rock Mass on a Slope (Inclined Plane) Questions Given that shear force is oriented down slope and normal force is oriented perpendicular to slope answer the following questions (refer to the inclined plane drawing above) 1 Which of the two forces (shear or normal) will drive the rock-block down slope when it fails 2 Which of the two forces will tend to resist down-slope movement of the rock mass 3 When do you think the block will begin sliding down the slope (Circle one comparison) shear = normal shear lt normal shear gt normal
Instructions
1 Determine the mass of our block-of-rock sample by using the balance in the room a Mass of Rock Block kg (HINT 1 kg = 1000 g)
b Weight of Rock Block N (Newtons) Show Calculations
2 Place the rock on the inclined plane and slowly lift the board to determine the critical
angle at which it slides down the slope (tilt the plane until the rock begins to slide) Record the angle in Table 3
3 Now repeat the experiment with various types of surfaces Record the angles in Table 3 Reduced friction Tape wax paper to the rock (place it between rock and wood) Increased friction Tape a piece of sand paper (place it between rock and wood)
Figure 3 Critical Angle apparatus
310
Table 3 Critical Angle of sliding for various surfaces
Condition of Inclined plane
Critical Angle of sliding (degrees)
Normal Force at Critical Angle
Wt x (cos θ)
Shear Force at Critical Angle Wt x (sin θ)
Rock on Wood
Rock on Wax Paper
Rock on Sandpaper
4 Calculate the normal force and shear force of the critical anglesmdashbe sure your calculator is
using degrees not radians to calculate the sine and cosine of angle θ Record in Table 3 5 How do inclined-plane results (Table 3) compare to your prediction in question 3 above 6 List some ideas as to what other physical factors may be important to slope failure that are
not part of the above equations for slope analysis
7 Based on your experiments above discuss the effects of surface friction on the critical hill slope angle at which landslides occur
8 In the absence of wax paper and sand paper on hill slopes in the natural environment what
types of factors will influence the frictional conditions and critical angles at which hill slopes fail
311
Name____________________________________
Lab Day _____ Lab Time_____________________
Post-Lab Assessment Calculations 1 Imagine you have placed yourself on a balance and determined that your body mass is
100 kg Calculate your weight in units of Newtonrsquos (hint 1 N = 1 kgmsec2) Show all of your math work keep units with numbers
2 A car has a mass of 1000 kg and the net force exerted on the car is 0 N Use Newtons
2nd Law to calculate the acceleration of the car in msec2 Show all of your math work keep units with numbers
3 A rocket has a mass of 1000 kg and the net force exerted by the rocket engine is 2000 N
Use Newtons 2nd Law to calculate the acceleration of the rocket in msec2 Show all of your math work
Questions 1 What effect will clear-cut logging of trees have on slope stability in the Coast Range
Explain your answer in the context of todays lab experiments 2 Write a 5-10 sentence summary of the critical factors that affect landslide susceptibility in
western Oregon Think about the conditions necessary for landslides to occur and the factors that affect the critical thresholds at which they begin
41
ES 105 Laboratory 4 UNDERSTANDING GEOLOGIC TIME
Relative Dating and Fossils Radioactivity and Numerical Age Determination
Introduction The Geologic Time Scale was developed using two approaches In the first rock units were
studied and correlated between geographically distant areas using the principle of faunal succession With the discovery of radioactivity in the early 20th century numerical (or ldquoabsoluterdquo) ages could be applied to the Geologic Time Scale In this weekrsquos lab you will explore both of these aspects of geologic time
First you will investigate the Geologic Time Scale and examine how features of the geological record ndash species of fossils and other features ndash can be used to correlate geological events In this approach geologic events are placed in a correct sequence and the relative age (which layerstrata is older and which is younger) of the events is determined
You will then explore the concept of half-life One half-life represents the time it takes for half of the radioactive parent isotopes to decay into stable daughter isotopes Numeric ages are calculated from rock samples by comparing the amount of daughter isotope in the rock to the amount of remaining parent isotope because different radiometric isotopes decay at known statistically constant rates Radiometric dating thus provides Earth scientists with a powerful tool to investigate Earth history Goals and Objectives
bull Construct a geologic time scale to gain an understanding of the timing of major events in Earthrsquos history
bull Use fossils to constrain the ages of sedimentary strata and to correlate strata of different thicknesses
bull Develop a conceptual understanding of half-life bull Calculate half-life from counts of decay to daughter atoms bull Determine ages of materials using half-life radioactive decay techniques
Useful websites
bull httpwwwgeosocietyorgsciencetimescaletimesclhtm bull httppubsusgsgovgipfossilssuccessionhtml bull httppubsusgsgovgipgeotimeradiometrichtml bull httpevolutionberkeleyeduevolibraryarticlehistory_23
42
Name____________________________________
Lab Day _____ Lab Time_____________________
Pre-lab Questions ndash Complete these questions before coming to lab 1 Define the following terms prior to arriving at your lab section
A Geologic period
B Stratigraphic correlation
C Parent atom
D Daughter atom
E Isotope 2 Your lab period lasts 110 minutes If your lab instructor spends 20 minutes introducing the
lab and giving instructions what percentage of the lab will you have spent listening to your instructor talk Show your calculations
3 The oldest known crustal rock is 38 billion years old Give this age in millions of years
Show your calculations Include units with the numbers 4 Briefly describe and graphically represent (draw a diagram) the concept of half-life in the
space here
43
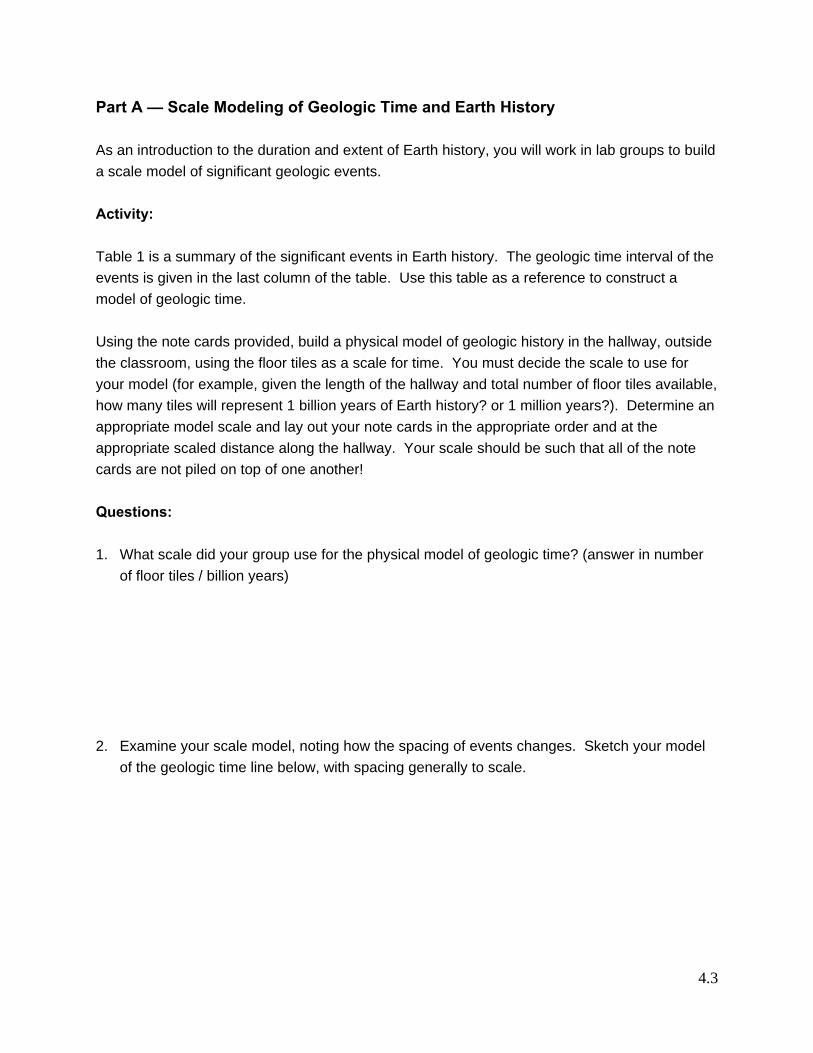
Part A mdash Scale Modeling of Geologic Time and Earth History As an introduction to the duration and extent of Earth history you will work in lab groups to build a scale model of significant geologic events Activity Table 1 is a summary of the significant events in Earth history The geologic time interval of the events is given in the last column of the table Use this table as a reference to construct a model of geologic time Using the note cards provided build a physical model of geologic history in the hallway outside the classroom using the floor tiles as a scale for time You must decide the scale to use for your model (for example given the length of the hallway and total number of floor tiles available how many tiles will represent 1 billion years of Earth history or 1 million years) Determine an appropriate model scale and lay out your note cards in the appropriate order and at the appropriate scaled distance along the hallway Your scale should be such that all of the note cards are not piled on top of one another Questions 1 What scale did your group use for the physical model of geologic time (answer in number
of floor tiles billion years)
2 Examine your scale model noting how the spacing of events changes Sketch your model of the geologic time line below with spacing generally to scale
44
Table 1 Summary of Significant Events in Geologic Time (from oldest to youngest)
Years Before Present
Event in Earth History Event occurred during this Geologic Time Interval
46 billion Estimated origin of Earth
Pre
cam
bria
n Ti
me
Beginning of Hadean Eon 38 billion Oldest known crustal rocks Beginning of Archean Eon
30 billion Oldest known fossil life (stromatolites = fossil mats of bacteriablue-green algae) Archean Eon
25 billion Evidence of glaciations climate impact preserved in the rock record (ancient glacial deposits)
Start of Proterozoic Eon
18 billion Multicellular algae preserved in the fossil record Proterozoic Eon
700 million Oldest well-documented worm burrows preserved in rock record Late Proterozoic Eon
540 million
Invertebrate marine organisms abundant (trilobites brachiopods)
Pale
ozoi
c Er
a
Start of the Paleozoic Era Cambrian Period
430 million First jawed fish vertebrates evolve first early land plants Silurian Period
370 million Amphibians evolve (water-land animals) fish abundant Devonian Period
300 million Reptiles evolve amphibians abundant coniferous land forests abundant Carboniferous Period
245 million
Mass extinction event many invertebrates become extinct End of Permian Period
220 million Dinosaurs evolve first mammals evolve
Mes
ozoi
c E
ra Triassic Period (Mesozoic Era)
200 million First birds evolve dinosaur city Jurassic Period (Mesozoic Era)
100 million Flowering plants evolve mammals become very diverse dinosaurs still around Cretaceous Period (Mesozoic Era)
66 million Mass extinction event dinosaurs become extinct (global asteroid impact event)
End of Cretaceous Period (Beginning of Cenozoic Era)
55 million Global greenhouse climate warm and toasty on the planet mammals diversify
Cen
ozoi
c E
ra
Eocene Epoch (Tertiary Period)
35 million Global cooling of climate start of the glacial climate cycles glaciers develop on Antarctica Oligocene Epoch (Tertiary Period)
3 million Hominids (man) evolve from hominoids Pliocene Epoch 2 million Massive ice sheets in North America Start of the Pleistocene Epoch 18 million Homo erectus evolves (precursor to modern) Pleistocene 300000 Homo sapiens evolve Pleistocene Epoch 10000 Modern humans take over Holocene Epoch 0 years You and I sit here thinking about it Late Holocene
45
Part B ndash Time and Stratigraphy For this part of the lab you will use a beaker sediment and fossils to explore the relationship of time and correlation in geology Obtain the materials for this activity Follow the instructions record your observations and answer the questions in the spaces provided Procedure 1 Pour a few centimeters of sand into the beaker Level the sand by gently shaking the jar
from side to side 2 Place an Ordovician fossil on top of the sand layer 3 Pour a few centimeters of gravel on top of the sand and shell 4 Place a Devonian fossil on top of the gravel layer 5 Cover the gravel layer and shell with a few more centimeters of sand 6 On the left side of the diagram below sketch the contents of your beaker actual thickness
Label the two sand layers the gravel layer and the two fossils along with the geologic ages of the fossils
7 Trade beakers with another group or set your beaker by the fossil and sediment supplies 8 Measure the size of an individual grain of sand in millimeters and record the grain size in the
data table (Table 2) Estimate the average size of the gravel in millimeters and record the grain size in the data table (Table 2)
9 Measure the thickness of your layers in millimeters and record in the data table (Table 2) Your Group Other Group (see pg 49 q 8)
46
Table 2 Data table for Time and Stratigraphy activity
Answer the following questions 1 If a bed of sand a single grain in thickness was deposited once each year how long would it
take to form beds with the thickness of the sand layers in your beaker Determine for both lower and upper sand layers Show calculations below and record answers in Table 2 above
2 If the minimum thickness of a gravel bed were a single grain of gravel in thickness how long
would it take to form your gravel layer if one grain-thickness was deposited each year Show calculation below and record answer in Table 2 above
3 Compare the relative age of the lower sand bed to the Ordovician fossil Is the sand
younger or older than the fossil What about the gravel
Layer Grain size
(mm) Thickness
(mm)
Time to deposit layer (years) ndash calculated in
Questions 1 amp 2 below
Upper sand
Gravel
Lower sand
47
For the following questions refer to the Geologic Time Scale Answer in terms of PERIOD listed on Geologic Time Scale not absolute age in millions of years 4 Assuming that the lower fossil in your beaker was deposited in the Ordovician Period what
is the OLDEST that the gravel bed could be (Answer in terms of Period listed on Geologic Time Scale)
5 What is the YOUNGEST that the lower sand bed could be (Answer in terms of Period listed
on Geologic Time Scale) 6 Assuming that the upper fossil was deposited during the Devonian Period what is the
YOUNGEST possible age of the gravel layer (Answer in terms of Period listed on Geologic Time Scale)
7 What is the OLDEST possible age of the upper sand layer (Answer in terms of Period listed
on Geologic Time Scale) 8 Borrow a jar from another group On the right side of the diagram on page 6 sketch and
label the sediment layering in the other grouprsquos jar Draw lines between the columns to CORRELATE (match) the layers fossils and geological ages You have just demonstrated how geologists relate rocks in one area to those in another area
9 Do you think fossil or the type of sediment is more important in correlating of rock units
between different areas Explain your answer
GGeologicc Time Scale
hhttpgeologgycomtime
48
ehtm
49
Part C ndash Exploring the Concept of Half-Life The determination of Earth history by numerical ages is achieved from measurements of
radiometric isotopes found in some rocks and other Earth materials The PARENTDAUGHTER ratio may be used to calculate the absolute age of a rock sample Recall from lecture that numerical (or absolute) ages for geological events are derived from the measurement of certain radioactive isotopes in Earth materials Isotopes are atoms of an element that have differing numbers of neutrons in their nuclei Various isotopes of the chemical elements are radioactive meaning that the nucleus is unstable and decays (disintegrates) by emitting one or more particles which are designated as alpha (α) beta (β) and gamma (γ) This decay usually changes the original radioactive isotope (PARENT) into a different isotope (DAUGHTER) For example 238U 234Th + α
While the time interval before each individual nuclide disintegrates is random each known isotope has a determined half-life value which represents the rate of isotope decay A second half-life is reached when half of the remaining radioactive parent decays and so on Hence half-life is the time during which each nucleus has a 50 chance of disintegrating
In this activity you will explore the basic concept behind radioactive decay and half-life You will need a cup 100 pennies and a calculator for this activity You will treat these pennies as if they were radioactive isotopes that are decaying A penny that lands heads up is a parent isotope and a penny that lands tails up has ldquodecayedrdquo into a daughter isotope Procedure
1 Count your set of pennies to make sure you have 100 For Trial 1 put the pennies into the cup and shake vigorously Pour the pennies out on the table count how many pennies are heads up record result in Table 3 and calculate the percentage of heads up pennies [(heads up)(total of pennies poured out on that trial)] and record in table
2 For Trial 2 put the heads-up pennies back into the cup and set the tails-up pennies aside Repeat step 1 making the same calculation as above and record results in Table 3
3 For Trial 3 put the heads-up pennies back into the cup and set the tails-up pennies
aside Repeat step 2 making the same calculations as above Record results in Table 3
4 Continue this process until the pennies are gone recording the results in Table 3
410
Table 3 Results of penny experiment
Trial Number of Heads of Heads Up in Trial 1 2 3 4 5 6 7 8 9
10
Instructions Plot the results of this experiment on the graphs below (Figures 1 and 2)
On Figure 1 graph the total number of heads-up pennies for each trial On Figure 2 graph the percentage of heads-up pennies for each trial
100 90 80 70 60 50 40 30 20 10
Trial 1 2 3 4 5 6 7 8 9 10
Figure 1 Graph showing the total number of heads up pennies for each trial
100
90
80
70
60
50
40
30
20
10
Trial 1 2 3 4 5 6 7 8 9 10 Figure 2 Graph showing the percent of heads
up pennies in each trial
411
Questions 1 Is your graph of the total number of heads up pennies per trial (Figure 1) a linear or
exponential (curved) relationship Explain why you think the graph has this shape 2 What would be the predicted ratio of heads to tails in each trial Is this prediction verified by
the results of this experiment displayed in Figure 2 3 The number of radiometric parent and daughter isotopes in even a small sample of rock is
huge however statistical errors still must be accounted for This is one source of uncertainty in radiometric dating methodology Make a generalized statement about the statistical reliability of the headstails experiment That is how does the number of pennies used in the experiment increase or decrease the reliability of the results (Notice your results as the number of pennies decreases as you have graphed in figures 1 and 2)
4 How reliable would the results be from an experiment starting with billions of pennies Explain
412
Part D ndash Determining the Half-Life of 137Ba The isotope 137Cs has a half-life of 30 years and decays by the reaction
137Cs 137Ba + β where β is a beta particle (an electron from a nucleus) and 137Ba is an isotope of barium in the excited state The symbol denotes the excess energy that the barium nucleus has after it has formed through beta decay from cesium The barium nucleus loses the excess energy by releasing a gamma particle (high-energy electromagnetic particle) given by the following reaction
137Ba 137Ba + γ The half-life of this nuclear reaction is a few minutes To measure the half-life it is enough to measure the activity of a sample of 137Ba starting from the time it is formed until a significant amount has decayed The 137Ba source is produced by passing an eluting solution (slightly acidic saline solution) through a sample of 137Ba The 137Ba is dissolved into the eluting solution but the 137Cs is not dissolved So the solution contains only 137Ba
Procedure Your instructor will provide the solution to you and assist with the experiment 1 Place 3 drops of eluting solution containing the 137Ba on a watch glass 2 Place the watch glass under the Geiger counter 3 Start recording data by clicking START Record data until the decay rate shown on the
graph stops changing This should take about 10 minutes 4 Click STOP Print enough copies of the graph so that all of your group members have one 5 Draw (by hand) a best-fit curve through the data points on your graph extrapolating
the curve back to where it intersects with the y-axis of the graph Remember a best-fit curve does not connect the data points on the graph Instead a best-fit curve is a smooth curve that comes as close as possible to all of the data points without necessarily going through most of them You will use the graph to analyze the data and answer the questions on the following pages
413
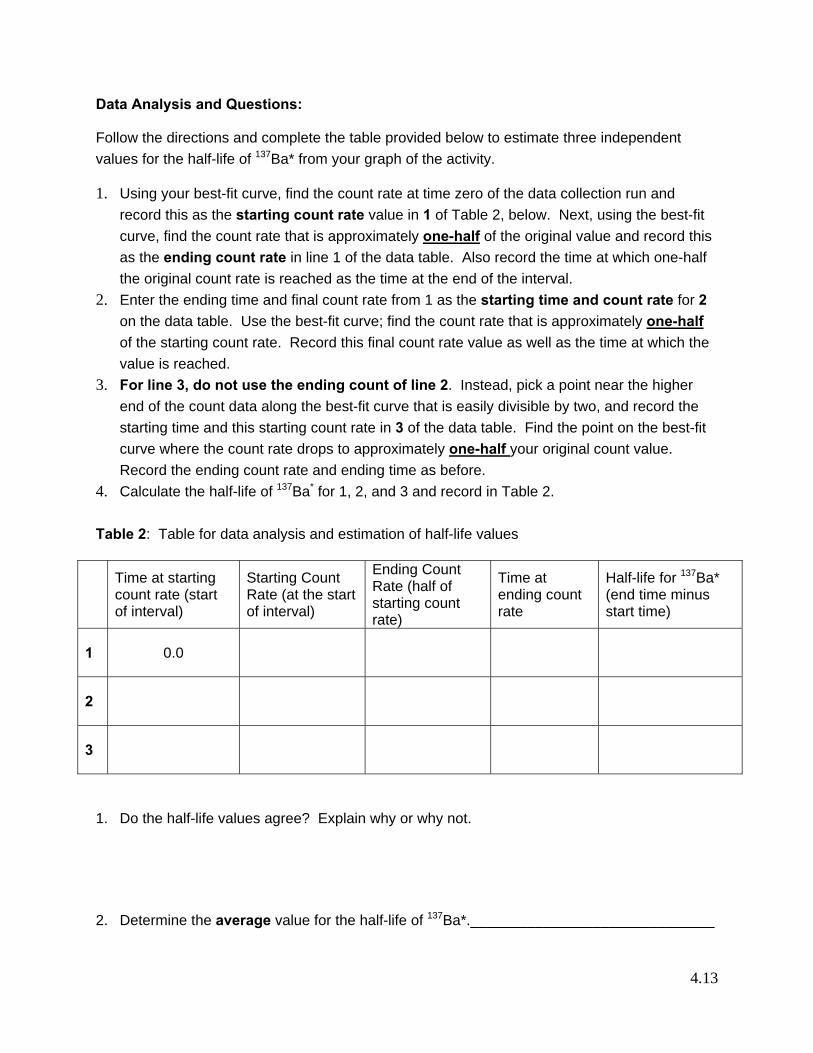
Data Analysis and Questions Follow the directions and complete the table provided below to estimate three independent values for the half-life of 137Ba from your graph of the activity 1 Using your best-fit curve find the count rate at time zero of the data collection run and
record this as the starting count rate value in 1 of Table 2 below Next using the best-fit curve find the count rate that is approximately one-half of the original value and record this as the ending count rate in line 1 of the data table Also record the time at which one-half the original count rate is reached as the time at the end of the interval
2 Enter the ending time and final count rate from 1 as the starting time and count rate for 2 on the data table Use the best-fit curve find the count rate that is approximately one-half of the starting count rate Record this final count rate value as well as the time at which the value is reached
3 For line 3 do not use the ending count of line 2 Instead pick a point near the higher end of the count data along the best-fit curve that is easily divisible by two and record the starting time and this starting count rate in 3 of the data table Find the point on the best-fit curve where the count rate drops to approximately one-half your original count value Record the ending count rate and ending time as before
4 Calculate the half-life of 137Ba for 1 2 and 3 and record in Table 2 Table 2 Table for data analysis and estimation of half-life values
Time at starting count rate (start of interval)
Starting Count Rate (at the start of interval)
Ending Count Rate (half of starting count rate)
Time at ending count rate
Half-life for 137Ba (end time minus start time)
1 00
2
3
1 Do the half-life values agree Explain why or why not
2 Determine the average value for the half-life of 137Ba______________________________
414
Name____________________________________
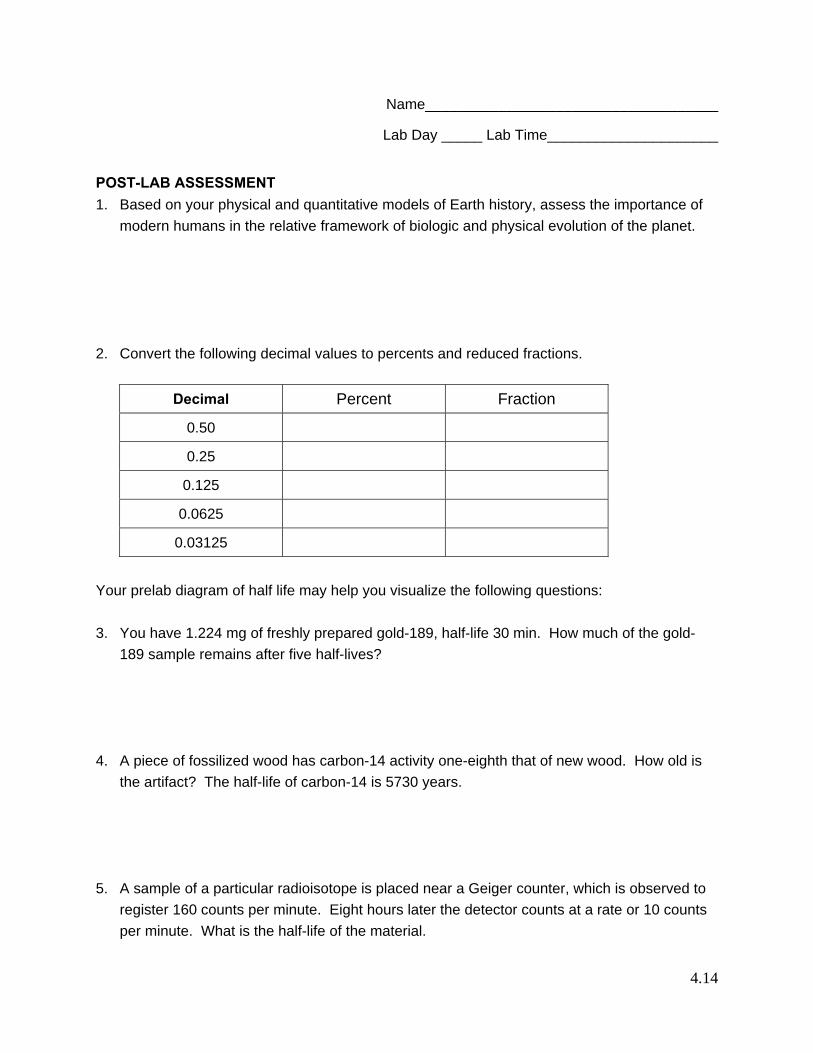
Lab Day _____ Lab Time_____________________ POST-LAB ASSESSMENT 1 Based on your physical and quantitative models of Earth history assess the importance of
modern humans in the relative framework of biologic and physical evolution of the planet 2 Convert the following decimal values to percents and reduced fractions
Decimal Percent Fraction
050
025
0125
00625
003125
Your prelab diagram of half life may help you visualize the following questions 3 You have 1224 mg of freshly prepared gold-189 half-life 30 min How much of the gold-
189 sample remains after five half-lives 4 A piece of fossilized wood has carbon-14 activity one-eighth that of new wood How old is
the artifact The half-life of carbon-14 is 5730 years 5 A sample of a particular radioisotope is placed near a Geiger counter which is observed to
register 160 counts per minute Eight hours later the detector counts at a rate or 10 counts per minute What is the half-life of the material
5-1
ES 105 Laboratory 5 INTRODUCTION TO CHEMICAL REACTIONS
Introduction
By definition a physical change is one in which only the physical characteristics such as state (gas liquid or solid) size density or color of a substance is changed without changing its composition Ice melting is an example of a physical change (solid to liquid change of state) A chemical change results in the formation of one or more NEW substances with different composition and properties from the original substances When a match burns the ashes and smoke are very different than the original match In todayrsquos lab you will observe a number of different chemical changes
A chemical change is accomplished by rearranging atoms through breaking and reforming of chemical bonds in a chemical reaction The actual rearrangement of atoms ndash bond breaking and reforming ndash is not directly observable Because we cannot see this process we have to use indirect evidence to infer that a chemical change has occurred These indirect lines of evidence include production of gas production of a solid (precipitate) release of heat (exothermic reaction) absorption of heat (endothermic reaction) change in pH andor change of color (unless using indicators to check for acids or bases) Goals and Objectives bull To acquaint students with the nature chemical changes bull To identify whether a chemical change has occurred based on a series of observations bull To study and explore basic types of chemical reactions bull To perform a series of experiments make observations and determine whether a
chemical reaction has occurred Useful Websites
bull httpwwwricedufacultyptiskusreactions bull httpwwwchemtutorcomreacthtm bull httpwwwmcwdnorgchemistpcchangehtml
5-2
Name____________________________________ Lab Day _____ Lab Time_____________________
Pre-Lab Activities Answer the following questions Use the material presented in the lab your lecture materials and text to assist in answering these questions 1 How is a chemical change different from a physical change How can you determine
whether a chemical change has occurred List at least three observations that may indicate a chemical change has occurred
2 In chemistry what is a lsquoreactantrsquo
3 Define endothermic 4 Define exothermic 5 If a reaction container feels warmer after the reaction has occurred was the reaction
endothermic or exothermic
5-3
SAFETY NOTES Be sure to read and understand before proceeding
For safety reasons before you begin this laboratory all books packs and coats
must be stored at the front of the room
Be sure that all of the equipment that should be in your kit is there and that it is clean
and ready to use For some of the reactions it is very important to have clean
equipment and not to introduce contaminants Contamination can produce incorrect
results If you are unable to clean a piece of equipment ask your instructor if you
need to replace it at this time
Be sure to follow instructions carefully Use the proper measurements as indicated
in the instructions Be observant
In some of the experiments you will be mixing acids and water The rule is
ALWAYS ADD ACIDS TO WATER NEVER ADD WATER TO ACIDS
When you are through with the lab be sure that you leave the equipment as you
would like to find it Remember there are many other students using the same
equipment over the course of the quarter
The Golden Rule of Chemistry Labs
LEAVE THE LAB FOR OTHERS AS YOU WOULD HAVE THEM LEAVE IT FOR YOU
WEAR YOUR GOGGLES
5-4
Part A ndash Indicators Chemical fluids are often acidic or alkaline (basic) The pH of a solution describes its
acidic or alkaline character Neutral pH is 7 acidic solutions range from pH 0 to 7 alkaline solutions range from pH 7 to 14 The number comes from the negative log of the hydrogen ion concentration (or pH = mdashlog [H+]) Solutions are characterized as acidic or alkaline according to their pH
Indicators are particular substances added to solutions that change color according to the pH (acidity or alkalinity) of the solution They are highly useful in measuring the pH of a solution quickly and quite accurately Indicators are used in a wide range of fields (environmental forensics petroleum) to determine the concentration of a chemical of interest with great accuracy There are many pH indicators used in chemistry each with their own color changes and active pH range One of the most common pH indicators is phenolphthalein Phenolphthalein is an ionic substance that changes color in solutions that have a particular pH range Activity 1 Pour 1-2 mL of 01 M Sulfuric Acid H2SO4 into a test tube Add 3-4 drops of phenolphthalein solution Place a stopper on the tube and shake gently Record result in Table 1 Do not throw out solution as you will need it for Activity 3 Activity 2 Place 5 mL of distilled water in a large test tube Using your forceps (tweezers) put a small pellet of sodium hydroxide NaOH into your test tube Gently tap the tube in the counter if the pellet is stuck to the side of the tube NEVER HANDLE NaOH WITH YOUR FINGERS It is strongly alkaline and will burn your skin Place a rubber stopper on the test tube and shake gently Remove the stopper and add 3-4 drops of the phenolphthalein solution to the tube Place the stopper back on the test tube and shake it gently Observe the tube for a few minutes Record result in Table 1 below Do not throw out solution as you will need it for Activity 3 Activity 3 Use pH paper (measures the specific range from pH 1 ndash 14) and determine the pH number associated with each solution in Activity 1 and 2 Record results in Table 1 below You are done with the solutions so discard solutions and rinse out test tubes Table 1 pH of solutions Fluid Character
(acidalkaline) Response of phenolphthalein indicator
pH number
Dilute H2SO4
Dilute NaOH
Question 1 Phenolphthalein is an indicator for what pH character
5-5
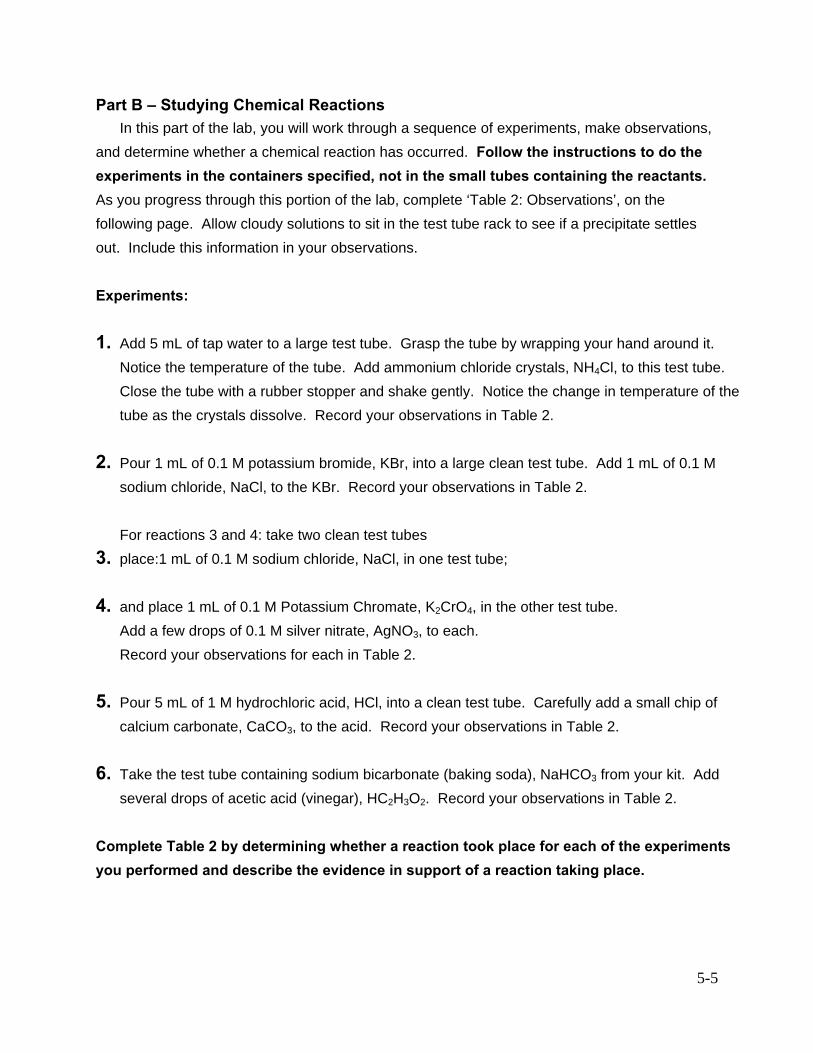
Part B ndash Studying Chemical Reactions In this part of the lab you will work through a sequence of experiments make observations
and determine whether a chemical reaction has occurred Follow the instructions to do the experiments in the containers specified not in the small tubes containing the reactants As you progress through this portion of the lab complete lsquoTable 2 Observationsrsquo on the following page Allow cloudy solutions to sit in the test tube rack to see if a precipitate settles out Include this information in your observations Experiments 1 Add 5 mL of tap water to a large test tube Grasp the tube by wrapping your hand around it
Notice the temperature of the tube Add ammonium chloride crystals NH4Cl to this test tube Close the tube with a rubber stopper and shake gently Notice the change in temperature of the tube as the crystals dissolve Record your observations in Table 2
2 Pour 1 mL of 01 M potassium bromide KBr into a large clean test tube Add 1 mL of 01 M
sodium chloride NaCl to the KBr Record your observations in Table 2
For reactions 3 and 4 take two clean test tubes 3 place1 mL of 01 M sodium chloride NaCl in one test tube
4 and place 1 mL of 01 M Potassium Chromate K2CrO4 in the other test tube
Add a few drops of 01 M silver nitrate AgNO3 to each Record your observations for each in Table 2
5 Pour 5 mL of 1 M hydrochloric acid HCl into a clean test tube Carefully add a small chip of
calcium carbonate CaCO3 to the acid Record your observations in Table 2 6 Take the test tube containing sodium bicarbonate (baking soda) NaHCO3 from your kit Add
several drops of acetic acid (vinegar) HC2H3O2 Record your observations in Table 2 Complete Table 2 by determining whether a reaction took place for each of the experiments you performed and describe the evidence in support of a reaction taking place
5-6
Table 2 Observations from chemical reaction experiments
Has
a c
hem
ical
re
actio
n oc
curr
ed
Obs
erva
tions
(F
izze
s) (
Prec
ipita
te fo
rms)
(co
lor c
hang
e)
(Tem
pera
ture
Cha
nge)
or
()
Writ
e ch
emic
al n
ames
of
reac
tant
s
(eg
Am
mon
ium
chl
orid
e +
wat
er)
Expe
ri-m
ent
1 2 3 4 5 6
5-7
Questions 1 Which chemical reactions produced a new phase
List by experiment number in the proper column in the table below Some of the reactions may have not created a new phase some may have created more than one new phase
CREATED SOLID PHASE CREATED LIQUID PHASE CREATED GAS PHASE
2 Is a new phase always an indication of a chemical change Explain
3 Which reactions were exothermic (gave off heat) How could you tell
4 Which were endothermic (absorbed heat) How could you tell 5 Is a color change a reliable indicator of a chemical reaction Explain
6 What gas was released in Experiment 5 How might you test for the type of gas released
during a chemical reaction
5-8
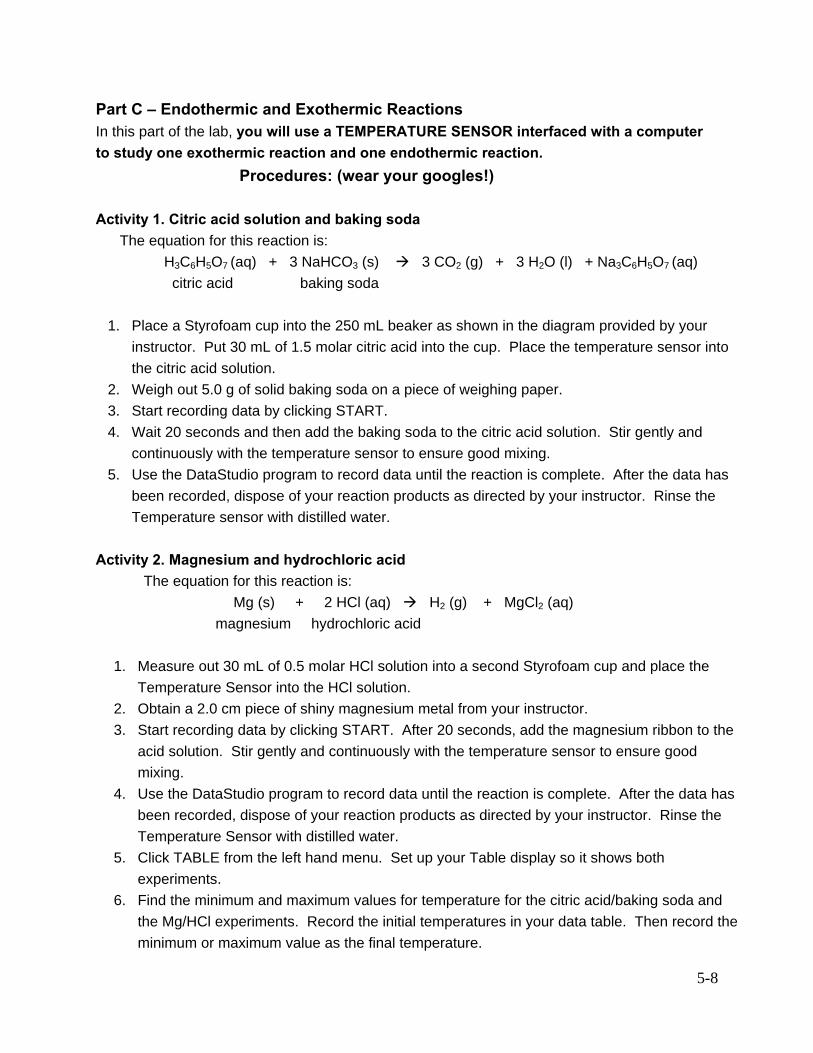
Part C ndash Endothermic and Exothermic Reactions In this part of the lab you will use a TEMPERATURE SENSOR interfaced with a computer to study one exothermic reaction and one endothermic reaction
Procedures (wear your googles) Activity 1 Citric acid solution and baking soda
The equation for this reaction is H3C6H5O7 (aq) + 3 NaHCO3 (s) 3 CO2 (g) + 3 H2O (l) + Na3C6H5O7 (aq)
citric acid baking soda
1 Place a Styrofoam cup into the 250 mL beaker as shown in the diagram provided by your instructor Put 30 mL of 15 molar citric acid into the cup Place the temperature sensor into the citric acid solution
2 Weigh out 50 g of solid baking soda on a piece of weighing paper 3 Start recording data by clicking START 4 Wait 20 seconds and then add the baking soda to the citric acid solution Stir gently and
continuously with the temperature sensor to ensure good mixing 5 Use the DataStudio program to record data until the reaction is complete After the data has
been recorded dispose of your reaction products as directed by your instructor Rinse the Temperature sensor with distilled water
Activity 2 Magnesium and hydrochloric acid
The equation for this reaction is Mg (s) + 2 HCl (aq) H2 (g) + MgCl2 (aq)
magnesium hydrochloric acid
1 Measure out 30 mL of 05 molar HCl solution into a second Styrofoam cup and place the Temperature Sensor into the HCl solution
2 Obtain a 20 cm piece of shiny magnesium metal from your instructor 3 Start recording data by clicking START After 20 seconds add the magnesium ribbon to the
acid solution Stir gently and continuously with the temperature sensor to ensure good mixing
4 Use the DataStudio program to record data until the reaction is complete After the data has been recorded dispose of your reaction products as directed by your instructor Rinse the Temperature Sensor with distilled water
5 Click TABLE from the left hand menu Set up your Table display so it shows both experiments
6 Find the minimum and maximum values for temperature for the citric acidbaking soda and the MgHCl experiments Record the initial temperatures in your data table Then record the minimum or maximum value as the final temperature
5-9
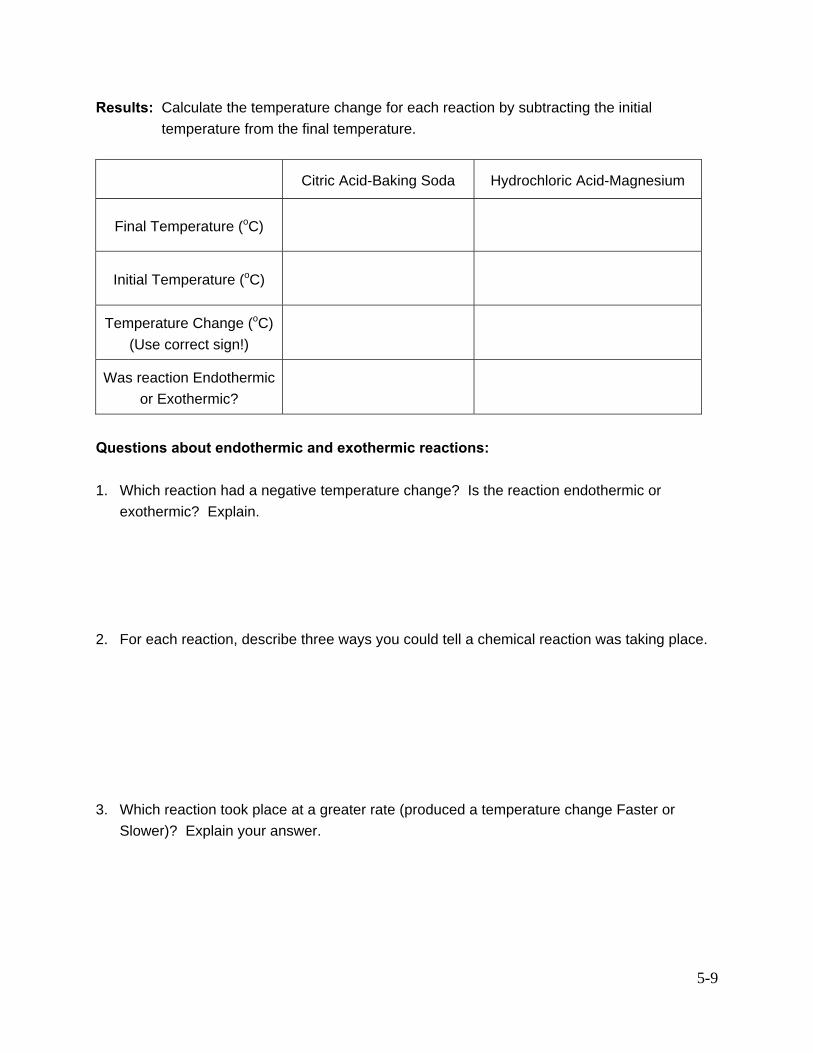
Results Calculate the temperature change for each reaction by subtracting the initial temperature from the final temperature
Citric Acid-Baking Soda Hydrochloric Acid-Magnesium
Final Temperature (oC)
Initial Temperature (oC)
Temperature Change (oC) (Use correct sign)
Was reaction Endothermic or Exothermic
Questions about endothermic and exothermic reactions 1 Which reaction had a negative temperature change Is the reaction endothermic or
exothermic Explain 2 For each reaction describe three ways you could tell a chemical reaction was taking place 3 Which reaction took place at a greater rate (produced a temperature change Faster or
Slower) Explain your answer
5-10
Name____________________________________
Lab Day _____ Lab Time_____________________ POST-LAB ASSESSMENT 1 What type of change (physical chemical or both) occurs when ice becomes water
2 When you apply rubbing alcohol to your skin you feel a cooling effect Is a chemical
reaction taking place Explain 3 When you apply hydrogen peroxide to a cut there are bubbles released Is a chemical
reaction taking place Explain 4 What factors affect the rate of a chemical reaction
5 List some chemical reactions that are useful or annoying in your daily life
6-1
ES 105 Laboratory 6 STUDY OF SEDIMENTS AND SEDIMENTARY ROCKS
Introduction Rocks are the materials of Earth and understanding their origin and how they change enables
us to begin to understand Earth and its processes Rocks are aggregates of minerals and are classified into three groups based on the processes that formed them Igneous Sedimentary and Metamorphic This lab focuses on some of the common sedimentary rocks which are formed at the surface of Earth
Sedimentary rocks can form from the consolidation and lithification of particles called sediment Sediment is created either by physical processes breaking pre-existing rocks into smaller particles or by inorganic or organic chemical processes where mineral material is precipitated from solution Sedimentary rocks can also form by the precipitation of mineral material from solutions containing dissolved mineral materials
Sedimentary rocks form at or near Earthrsquos surface in many different environments including oceans (marine) streams (fluvial) lakes (lacustrine) deserts (eolian (wind)) and alpine (glacial) Some sedimentary rocks have features that reveal a great deal about the environment in which they formed For example the degree of rounding of the particles the presence and nature of fossils and the mineral composition may help decipher the conditions in ancient environments These observations provide clues about ancient Earth history and also aid in finding potential fossil fuel deposits
A handful of minerals are commonly found in association with sedimentary rocks including quartz potassium feldspar plagioclase feldspar mica (muscovite and biotite) calcite halite gypsum clay minerals and hematite You will examine most of these minerals at the beginning of this lab activity Goals and Objectives
bull To become familiar with minerals commonly associated with sedimentary rocks bull Investigate the characteristics of sediment grains bull Recognize the classes of sedimentary rocks (Clastic and Chemical) and be able to
distinguish samples of each type bull Classify and name samples of sedimentary rocks by their composition and texture
Useful Websites
bull httpwwwphysicalgeographynetfundamentals10fhtml bull httpwwwwindowsucaredutourlink=earthgeologysed_clastichtml bull httpwwwwindowsucaredutourlink=earthgeologysed_chemicalhtml bull httpreynoldsasueduglg103sed_env_starthtm
6-2
Name____________________________________
Lab Day _____ Lab Time_____________________
Prelab questions Complete prior to arriving at your lab section Define TERMS that are in CAPITAL LETTERS and answer the questions below 1 CLASTIC SEDIMENTARY ROCK (also called detrital sedimentary rock)
2 What is the most common clastic sedimentary rock 3 CHEMICAL SEDIMENTARY ROCK 4 What is the most common chemical sedimentary rock 5 CEMENTATION (of clastic rocks) 6 List common sedimentary rock cements
6-3
Part A ndash Observing Sediment Grains In this part of the lab you will examine examples of common sediment grains with a
magnifying glass record your observations and provide sketches of the grains When you look at each sample of grains notice the shapes sizes distribution of sizes and variety of composition of the grains
bull Grain Shape can be well rounded subrounded subangular and angular bull Grain Size size becomes smaller and more rounded with more time in the
transportation system It is a clue to the environment of deposition Use millimeters (mm) to record the grain sizes
bull Grain Sorting is a term to describe the range of sizes present Well Sorted = grains are all about the same size Moderately Sorted = largest grains are 4 to 5 times the size of the smallest Poorly Sorted = largest grains are 5 to ten times the size of the smallest
bull Grain mineral types Often noting the colors of grains can be useful Include quartz (the most common) feldspar mica and rock fragments Fossils may indicate an adjective (fossiliferous) be added to sedimentary name
bull Cements are the ldquogluerdquo that hold together the grains Include calcite silica iron oxide gypsum and halite
Activity 1 Loose Sediment Grains
Study the samples of sediment grains that have been provided Complete the tables on the following page For each sample describe the general shape of the grains record the average grain size and the range of grain sizes describe the sorting list the grain types (or colors of individual grains) Use Table 1 to suggest (name) what the likely sedimentary rock would be formed from the sediment Also make a simplified sketch of the sediment grains showing the sorting and grain shape
Table 1 Grain sizes of clastic sedimentary rocks
Size descriptions Sediment Particle size Rocks formed from it
Coarse
Fine
Gravel
Boulder gt256 mm (10 in) Conglomerate (rounded grains)
Breccia (angular grains) Cobble 64-256 mm
Pebble 2 to 64 mm
Sand 00625 ( frac124) to 2 mm Sandstone
Mud
Silt 00039 ( frac128) to 00625 mm Siltstone
Clay lt00039 mm Mudstone (massive) Shale (bedded)
6-4
Sample 2 Observations Sketch of the sediment
General shape of grains
Average grain size
Range of grain sizes
Description of sorting
List of grain types
Probable rock type formed
Sample 3 Observations Sketch of the sediment
General shape of grains
Average grain size
Range of grain sizes
Description of sorting List of grain types
Probable rock type formed
Sample 4 Observations Sketch of the sediment
General shape of grains
Average grain size
Range of grain sizes
Description of sorting
List of grain types
Probable rock type formed
Sample 1 Observations Sketch of the sediment General shape of grains
Average grain size
Range of grain sizes
Description of sorting
List of grain types
Probable rock type formed
6-5
Part B ndash Introduction to Classifying Sedimentary Rocks Examine the sedimentary rock study sets provided and answer the following questions 1 Study the set of sedimentary rocks provided Place those that are made of pieces or
fragments of mineral andor rock material (but not the rocks that have shells or shell fragments) on one tray and the rocks made of organic material (like shells or coal) or of crystals on the other tray One group of samples is the CLASTIC SEDIMENTARY ROCKS The other group is the CHEMICAL SEDIMENTARY ROCKS
DO NOT CONTINUE TO (2) BEFORE YOUR INSTRUCTOR CHECKS YOUR WORK 2 In the spaces below list the sample numbers that occur in each group
Clastic Sedimentary Rocks
Chemical Sedimentary Rocks
Keep the rocks on these trays You will be asked to use one tray or the other for Part B 3 Use the clastic rock tray Pick up each specimen and look at the size of the grains (the
fragments of which it is composed) Use a magnifying lens and ruler to measure size of the grains Separate the clastic specimens into two groups based on the grain size those that have large grains (big enough to distinguish without a magnifying lens) from those that have small grains (too small to see individual grains without a magnifying lens) In the spaces below list the sample numbers that occur in each grain-size group
Coarse-grained Clastic Rocks
Fine-grained Clastic Rocks
4 Study one of the coarse-grained clastic rock samples Indicate which one you chose
Describe and sketch this specimen showing the grains and the surrounding material
6-6
5 Use the chemical sedimentary rocks Because they form from a wide variety of processes some chemical sedimentary rocks are Inorganic or crystalline (appear homogeneous) while others consist of Organic material including plant material shells and shell fragments Separate the chemical sedimentary rocks that are crystalline from the ones that are organic and write the specimen number in the table below
Inorganic (or crystalline) Chemical
Sedimentary Rocks
Organic Chemical Sedimentary Rocks
Limestone is the most abundant chemical sedimentary rock It is made of the mineral calcite
Calcite reacts with hydrochloric acid (HCl) When a drop of dilute HCl is placed on calcite it fizzes vigorously This is a good test for limestone Limestone comes in many different varieties which form by numerous processes The calcite can precipitate directly from seawater form as dripstone in cave formations or be incorporated into shells by marine organisms After an organism dies its shell can become calcite sediment Calcite also sometimes precipitates in the spaces between clastic grains as cement to hold the rock together 6 Test all of the sedimentary rocks with HCl and briefly describe your results List the
samples that react to HCl and describe the nature of the fizzing (vigorous or minimal) SAFETY NOTE Although dilute HCl is not dangerous it can irritate skin and occasionally cause damage (small holes) to fabricclothes Be careful when using it Please rinse your table top off if any spilt on it
HCl tests on chemical rocks
HCl tests on clastic rocks
6-7
Part C ndash Classification of Sedimentary Rocks
(NOTE you do not have specimens of every rock included in the classification tables) Activity 1
1 Classification of sedimentary rocks starts with determining if the rock is clastic or chemical
2 Begin your identification by describing the texture (grain size and shape) and composition (color of sediments) of the rocks listed in Table 6
3 Identify the rocks in the study set using the classification charts (Table 2 and 3) and your description
4 Complete Table 4 with the correct rock names including terms that describe special features of note about a rock is appropriate
Clastic Sedimentary Rocks are made from deposits of broken andor weathered rock Clastic rocks are first classified by the size and shape of the particles and secondly by the composition of the particles within the rock
Table 2 Clastic Sedimentary Rock Classification
Particle Size Characteristics Rock Name
gt 2mm (bb size) Grains are angular Breccia (say brech-chia)
Grains are rounded Conglomerate
2 mm to nearly microscopic
Sand grains consisting of pure quartz Quartzose Sandstone
Sand grains consisting of dark fragments and quartz Lithic Sandstone
microscopic Typically layered and soft MudstoneShale
6-8
Chemical Sedimentary Rocks are derived from material that had been dissolved in water They are composed of crystals that precipitated from water by physical or organic processes They may have formed when water evaporated in shallow lakes leaving chemicals behind to form evaporite deposits They are also are formed by organisms extracting dissolved material to create their hard parts For this reason deposits of shell debris or plant material are considered chemical sedimentary rocks In some cases the shell material is easily observable but in other cases the shells cannot be seen without a microscope Note that fossil-rich is used as a descriptor for any rock containing visible fossils
Table 3 Chemical Sedimentary Rock Classification
Mineral Composition Characteristics Rock Name
calcite Fizzes in HCl massive is fine grained oolitic contains small concentric balls
Limestone (use descriptors like massive fossil-rich oolitic)
calcite Dull appearance soft fizzes in HCl Chalk (not included in lab set)
calcite Composed mostly of visible shell fragments has large pore spaces fizzes in HCl
Coquina
quartz group Dense porcelain like sometimes sharp edges hardness = 7 Chert
gypsum Soft hardness = 2 Rock Gypsum (not included in lab set)
halite Translucent cubic cleavage salty taste (do not taste lab samples) Rock Salt (not included in lab set)
opal Dull appearance soft does not fizz Diatomaceous Earth (not included in lab set)
carbonplant material Glassy black brittle low density Coal
6-9
Table 4 Sedimentary Rock Description Table
Rock
Clastic or Chemical
Composition (light or dark grains)
ldquoTexturerdquo Grain Size Grain Shape Grain Sorting Rock Name
1
2
3
4
5
6
7
8
9
10
11
6-10
Name____________________________________
Lab Day _____ Lab Time_____________________ POST LAB ASSESSMENT QUESTIONS
1 List three sedimentary rocks (from table 2 andor 3) that are the most likely to contain fossils Explain why this is so in terms of composition and environment of formation
2 What is a good test to determine if a sedimentary rock is limestone Does this test cause a
physical change or chemical reaction Explain how you can tell 3 Why is the study of sedimentary rocks important for understanding how and where fossil
fuels such as oil natural gas and coal (hydrocarbons) are likely to be found
71
ES 105 Laboratory 7 INTRODUCTION TO TOPOGRAPHIC MAPS
Introduction
Topographic maps contain a wealth of information which can be valuable to those who learn how to use them Topographic maps also called contour maps represent the three-dimensional the surface of Earth on a two-dimensional piece of paper Unlike other maps topographic maps show natural features with a fair degree of accuracy in terms of width length and thickness (height or depth) Geologists make use of topographic maps as a means of studying features in three dimensions By examining the features and symbols of a topographic map a geologist can become familiar with Earth features and draw conclusions about the geologic processes that led to their formation Goals and Objectives bull Become familiar the information available on topographic maps bull Learn to use map scales to find distances bull Visualize the shape of the Earths surface using contour lines and topographic profiles bull Depict the third dimension of Earthrsquos surface from the various elements of topographic maps Useful Websites bull httpwwwtopozonecom bull httptopomapsusgsgov bull httpergusgsgovisbpubsbookletssymbols
72
Name____________________________________ Lab Day _____ Lab Time_____________________
Pre-lab Activities Complete these before coming to lab Find the following unit equivalents
1 mile = ________________ feet 1 km = ________________ meters
1 foot = ________________ inches 1 meter = ________________ centimeters
1 mile = ________________ kilometers 1 km = ________________ miles
1 inch = _______________ centimeters 1 cm = ________________ inches
1 Convert 7920 feet to miles (Hint see following page is you donrsquot know how to do this) Show each step or combined steps needed to complete the conversion
2 If a map has a scale of 124000 how many miles does 75 inches on the map represent
Show your calculations with units
3 If a stream channel is 50 feet lower elevation at one location than at a point 25 miles upstream of that location what is the gradient of the stream between those two sites Show your calculations with units
4 Define the following terms with respect to stream systems
a Velocity
b Discharge
c Gradient
73
Activity 1 Compare this list of steps to convert 15 inches into feet to the table below
1 Write 15 inches as a fraction using a horizontal fraction bar (see 1 in table)
2 Put a multiplication sign after the fraction aligned with the fraction bar Write another fraction bar after the multiplication sign using a horizontal line (see 2 in table)
3 Choose the unit equivalent needed to convert from the information above (see 3)
4 Write the lsquoinchesrsquo part of the unit equivalent on the opposite side of the second fraction bar as lsquoinchesrsquo is in relation to the first fraction bar Write the lsquofeetrsquo part of the unit equivalent on the opposite side of the second fraction bar as its equivalent inches has been written (see 4 in table)
5 Put an equal sign after the expression multiply as indicated and cross out any things found both above and below the fraction bar as a matching pair (both units and factors) Be sure to put the units remaining (feet in this example) after the final product (see 5)
Table 1
1 2 3 4 5
1in 15
times
1in 15 1 foot = 12 inches
in12ft 1
1in 15times ft 251
in 12 ft 1
1in 15
=times
Problems
1 Now use this method to convert 7920 feet to miles You can show each step or combine steps to complete the conversion as show in number 5 of the above table
Use this method to do unit conversions throughout this lab Remember to include units
74
Part A mdash Scale A topographic map is a smaller representation of a larger area The map scale is the
relationship between distance on the map and the corresponding distance on the ground The two types of map scales that are useful to the geologist are ratio and bar scales The ratio scale written 112000 for example means that one inch on the map equals 12000 inches (1000 feet) on the ground A bar scale is a line with units of distance (feet miles kilometers) marked on it The bar scale allows easy conversion of map distances to true ground distance On a topographic map both the ratio scale and the bar scale are provided in the center of the bottom margin Show your calculations and include units with numbers for these questions
1 A ratio scale of 124000 means 1 inch on the map is equal to _____________ inches on the ground
2 Convert ratio scale of 124000 to a verbal scale with 1rdquo =( how many feet)
3 Complete the table below Show calculations with units on the right side of the table
Ratio Scale Verbal Scale Math work
124000 1inch = feet
A ratio scale of 162500 means 1 inch on the map is equal to inches on the ground Convert to 1 inch = how many feet Record below in and show calculations with units
162500 1 inch = feet
Convert a map scale of 1 inch = 1 mile to a ratio scale Record below and show calculations with units
1 1 inch = 1 mile
1 In the space below draw a six inch long line Use a ruler Make this line into a bar scale using
2 inches = 1 mile Subdivide the entire scale into quarter mile sections and label the origin the divisions of the first mile and the whole miles for the rest of the scale
2 On the bar scale above one quarter inch equals ________ miles Convert this to feet Record this in the table below Also determine what is the ratio scale for this bar scale (Hint convert to inches) Show your calculations with units
Verbal Scale Ratio Scale Math work
frac14 inch = 1
75
Part BmdashTopographic Maps Topographic maps use contour lines to depict three-dimensional features on a flat piece of
paper Contour lines connect points of equal elevation on the ground surface which means for example that every point on a 60 foot contour line is 60 feet above sea level Therefore a single contour line on the map shows how and imaginary horizontal plane would intersect the Earths surface are that particular elevation The contour interval is the difference in elevation between two contour lines The contour interval on a given map is constant for the entire map The contour interval chosen depends on roughness of the terrain or relief which is defined as the difference in elevation between the highest and the lowest points on a map
______________________________________________________________________
THE FOLLOWING ARE IMPORTANT RULES ABOUT CONTOUR LINES
1 Every point on a single contour line connects points on the map that are exactly the same
elevation on the ground 2 Contour lines separate areas of higher elevation from areas of lower elevation You can
determine direction of slope of a hill by checking the values of the adjacent contour lines 3 The contour interval (the elevation between two adjacent contour lines of different
elevation) is constant for the topographic map The contour interval is chosen by the map-maker based upon the relief of the map (the difference in elevation from the highest point to the lowest point on the map)
4 Contour lines must be counted consecutively (none can be skipped) Heavier contour lines speed up counting of contour lines usually every fifth contour line is drawn heavier
5 Contour lines never cross each other (except in the very rare case where the mapped area contains an overhanging cliff) Contour lines will merge into a single contour line where mapping a vertical cliff (also a rare occurrence)
6 The spacing of contour lines reflects the steepness of slopes Widely spaced contour lines represent a gentle slope closely spaced contour lines reflect a steeper slope Evenly spaced contour lines represent a uniform slope
7 Contour lines make a V pointing upstream where they cross a channel or valley 8 Depressions (lower elevation areas enclosed within higher elevation areas) are marked by
hachures on the inside of contour lines 9 Contour lines either enclose an area (as a hill top or a depression) or they end at the map
edge On a large enough map they would all make closed forms
Activity 1 Locate areas on the Monmouth quadrangle that shows what is described in Contour Rules (4 6 7 8 and 9) above Discuss locations with lab partners and if you are not able to locate an example of rule PLEASE CHECK WITH LAB INSTRUCTOR
76
Activity 2mdashConstruct a Topographic Map from surveyed data points On Figure 1 draw all the contour lines in pencil using a contour interval of 20 feet If you have a pen put it away and get a pencil (Only one who is perfect in every way contours with a pen) Study the map and locate the higher and lower areas Refer to the rules on the previous page to assist you If you are having trouble see the sample exercises for the last website listed in the introduction to Lab 4 Lightly draw in contour lines starting either at the high elevations or the low elevations Make changes where you realize you missed a feature Use an eraser When you are finished (and satisfied) darken and label the contour values neatly
Figure 1 Topographic map construction
77
Activity 3mdashConstruct a Profile from a Topographic Map Profiles are made to illustrate the shape of the surface of the earth between two designated points These two points are at the ends of the line of profile which is drawn and labeled on the map The line is used in the construction of the profile To construct the profile use each intersection of a contour and the line of profile on the map Project a perpendicular line from this intersection to the horizontal line having the same elevation as that contour line Make a dot on the profile for each intersection of a contour line and the line of the profile as drawn on the contour map Remember to include information implied by the map NOTE where the profile crosses a stream channel the elevation is between two contour lines (The stream channels are shown by dot-dash lines) Hilltops and the ends of the profile also have implied information After all the dots are made on the profile connect the dots by a smooth line which represents the profile of Earths surface On Figure 3 draw a profile for the dashed line A to A in Figure 2 Be sure to label both ends of the profile and the elevations at the side of the profile
Figure 2 Topographic map with profile line drawn and labeled
100
90
80
70
60
50
40
30
20
10
Figure 3 Topographic profile AmdashArsquo from Figure 2
78
Part C mdash Additional Information on Topographic Maps Topographic maps are produced at various scales (124000 163360 etc) that represent different areas of coverage Common sizes are 75 minute and 15 minute (Discontinued) describing latitude and longitude dimensions and are given locality names (such as ldquoMonmouthrdquo) usually for some prominent town or geographic feature in the mapped area In this part of the lab you will study a US Geological Survey quadrangle that illustrates the kind of information available on these maps
Map study and use requires an understanding of latitude and longitude Lines of latitude and longitude form an imaginary grid system with lines that are measured in degrees of arc from a reference Any point on Earth may be pinpointed to its exact location by its latitude and longitude Latitude lines are oriented in an east-west direction They are parallel to one another with the equator designated 0 degrees and increasing in degree measurement to the poles at 90 degrees Those in the northern hemisphere are north latitude and those in the southern hemisphere are south latitude Longitude lines are oriented in a north-south direction and start from 0 degrees at Greenwich England and increase in measurement both east and west up to 180 degrees on the other side of the Earth near the International Date Line Those to the east are called east longitude and those to the west are called west longitude For more exact locations degrees (o) are further broken down into minutes (lsquo) and seconds (ldquo) one degree has 60 minutes (1o=60rsquo) and one minute has 60 seconds (1rsquo=60rdquo)
If you plan to use a compass with a map for navigation is necessary to understand the concept of magnetic declination The compass needle when pointing north actually points to magnetic north the magnetic pole of Earth not to true north or geographic north which is Earths axis of rotation These two norths are not located at the same place and magnetic north moves over time The declination is the angle of correction needed because topographic maps are drawn aligned to geographic north which is toward the top and parallel to the left and right margins of the map Because magnetic north moves knowing the date the declination is accurate is important also Study the Monmouth Oregon Quadrangle and answer the following questions
1 __________________
2 __________________
3__________________
4 __________________
5 __________________
1 Who published this map
2 What year was it published
3 What is the latitude of the northern boundary of this map
4 What is the latitude of the southern boundary of this map
5 How many degrees of latitude are along the eastern edge (HINT subtract southern edge latitude from northern edge latitude)
6 __________________
7 __________________
8__________________
9 __________________
6 What is the longitude of the west side of this map
7 What is the longitude of the east side of this map
8 How many degrees of longitude are along the southern edge
9 What is the contour interval
79
10 _________________
11 _________________
12 _________________
13 _________________
14 _________________
10 How much vertical distance separates the lighter contour lines
11 How much vertical distance separates heavier contour lines
12 What is the highest elevation shown on the map (Look in NE)
13 What is the lowest elevation (Follow river downstream)
14 What is the relief of this map (subtract lowest elevation from the highest elevation)
15 _________________
16a _________________
16b _________________
16c _________________
16d _________________
17a _________________
17b _________________
17c _________________
17d _________________
18 _________________
19 _________________
20 _________________
21a _________________
21b _________________
22 _________________
23 _________________
15 What is the value of the declination (in degrees) shown
In the area to the left sketch how declination is indicated on the map
16 What is the map scale in (Show math work with units here)
a inches to inches
b feet to feet
c inches to feet
d inches to miles
17 What is the name of the quadrangle to the a south
b east
c northwest
d west
18 What is the approximate elevation of the town of Monmouth
19 What is the elevation of the benchmark located at the intersection of
Main St and Monmouth St in Independence
20 How many miles is it along Hwy 99W from Main St in Monmouth
to where 99W crosses the Luckiamute River
21 What is the distance (21a in miles) and (21b in Kilometers)
between the top of Cupids Knoll and Fircrest Cemetery
22 What is the elevation of Cupids Knoll
23 Which side would be easiest to climb Explain why
710
Part D mdash Learning about rivers from topographic maps Note Chucksney Mountain Salem and Sauvie Island Quadrangles are 124000 scale maps
1 On the Chucksney Mountain Quadrangle look at the tributaries that drain into the North Fork of the Middle Fork of the Willamette River (in the Southwest corner of the map) Then look at the width of the Willamette River channel in the Salem and Sauvie Island Quadrangles Does the width of the river channel increase or decrease when going downstream towards the mouth of the Willamette
2 Use the contour lines on the Chucksney Mountain Quadrangle to determine the elevation change from the top to the bottom of one of the tributaries that you observed in the previous question and record the elevation change below (Be sure to look up the contour interval on the map)
3 On the Salem Quadrangle locate Beardsley Bar and Doves Bar along the Willamette River What is the difference in elevation between these two points along the river In what direction is the river flowing
4 Does the gradient of the Willamette River increase or decrease as you go from its upper tributaries downstream towards its mouth
5 What type of stream channel do the tributaries in the Chucksney Mountain Quadrangle have Circle the correct choice below
a Braided stream channel
b Steep gradient bedrock channel
c Low gradient meandering stream channel
6 What type of channel does the Willamette River have in the Monmouth and Salem Quadrangles Circle the correct choice below
a Braided stream channel
b Steep gradient bedrock channel
c Low gradient meandering stream channel
711
Name____________________________________
Lab Day _____ Lab Time_____________________ 7a Post-Lab Assessment
1 Imagine you were hiking with friends and became separated from your hiking companions If you had a topographic map of the area what clues on the topographic map would you use to arrive somewhere where you could be found
2 Would a GPS receiver be able to assist you in finding your location on the map What
information would be helpful 3 What large city is located near 40oN 116oE (Use globe atlas world map GoogleEarth) 4 In what area is 40oN 116oW 5 What coast are you near at 34oN 119oW (Name continent side of it and ocean) 6 What coast are you near at 34oS 119oE (Name continent side of it and ocean)
7 Is it important to include N or S and E or W with latitude and longitude information Why
81
ES 105 Laboratory Additional Activities APPENDIX ndash Additional Laboratory Activities Lab 1 Energy and Energy Transformations
bull No Additional Activities Lab 2 Work Motion Gravity
bull Falling Objects Spark Tape Experiment p 82 - 84 Lab 3 Objects in Motion Landslides
bull Rotational Kinetic EnergyTrack Experiment p 85 - 86 bull Landslide Prediction p 87 bull AccelerationCart Experiment p 88 - 89
Lab 4 Geologic Time
bull Relative Age Dating Exercises p 810 - 814 Lab 5 Chemical Reactions
bull Chemical and Physical Changes p 815 - 816 bull Balancing Chemical Equations p 817 - 819
Lab 6 Sediments and Sedimentary Rocks
bull Overview of Sedimentary Minerals p 820 - 821 bull Depositional Environments p 822 - 823
Lab 7 Topographic Maps
bull Rivers and Topographic Maps p 824 - 825 bull Stream Table Experiments p 826
82
Lab 2 Calculation of Acceleration due to Earthrsquos Gravity
In this activity you will study the motion of a free-falling body Using a special timer the position of the object will be recorded at even intervals of time Letrsquos call the time interval Δt (read as ldquodelta trdquo or ldquochange in timerdquo) We will use the letter y to indicate the position of the object The position at a chosen time will be called y0 After one time interval passes we refer to the objectrsquos position as y1 after two intervals y2 and so forth From the changes in positions we can compute the velocity The average velocity is determined by the change in position per change in time Δt For instance the (average) velocity after four intervals of time have passed v4 is
This equation could be read as lsquothe velocity (after fourth time interval) is the change in position (between the third and fourth time interval) over the change in timersquo Once the average velocities have been calculated these values can be used to determine the average acceleration The slope of the graph of average speed versus time gives the acceleration of the falling object Mathematically the average acceleration after the fourth time interval a4 is described by the following equation
In this part of the lab you will measure the acceleration of a free-falling body using two different methods and devices ndash a spark-tape apparatus and a picket-fencephotogate system Activity 1 Using the spark-tape apparatus to Measure Gravitational Acceleration Procedure We will drop our object a carbon-coated tape approximately 2 meters As the tape falls a spark generator produces sparks at even time intervals These produce marks on the tape representing equal times between each spark The result is pictured below Figure 1 The distance between two successive marks indicates the distance fallen in a particular time interval The time interval Δt is given on the knob on the spark timer It is a fixed time interval (typically Δt = 130 sec = 0033 seconds) Ask your instructor to verify the value for Δt Your instructor will help you drop the tape and produce the marks You should have at least 9 marks on your tape
v y yt4
4 3=minusΔ
a v vt4
4 3=minusΔ
83
y1
y2
y3
y4
y5
y6
y7
Tapersquos initial position(big burned spot)
1st clearly identifiable (position y0)mark after initial position mark
Last spark on tape
Figure 1 Schematic representation of spark tape resulting from free-fall apparatus Note The first mark (the prominent burned one) gives the tapersquos initial position However the weight
was released at a random time Furthermore the second mark may be covered up by the first mark
(What you think is the 2nd mark may actually be the 3rd mark) Hence you canrsquot rely on total elapsed
time or the position of the next mark after the first mark However you can rely the on time intervals t
and distances between successive marks
Analysis Lay the tape flat on the table You may wish to secure it with masking tape Locate the initial mark Now find the next clearly identifiable mark -- probably the 2nd or 3rd mark after the first (prominent) mark This will be position yomdashlabel it accordingly Place a meter stick along the tape in preparation to measure the y-distances (as shown above) from yo to other mark locations See the diagram above Complete Table 1 for at least seven data points (Hopefully you will have more data points than seven) Measure the distances very carefully enter them into your table Be sure to record all your distances in meters NOTICEΔt is always the same value (probably 00333 sec -- but check with your instructor) NOTICE that all the distances in column 2mdashthe lsquoy (meters)rsquo columnmdashmust be in meters Fill out the rest of the table Δt is the same number of seconds for every point
84
Table 1 Δt
(sec) y
(meters) Δy v=ΔyΔt (meterssec)
Δv a=ΔvΔt (meterssec2)
301
y0 = 0 No Data No Data No Data No Data
301
y1 = 01 yy minus = 1v = No Data No Data
301
y2 = 12 yy minus = 2v = 12 vv minus =
301
y3 = 23 yy minus = 3v 23 vv minus =
301
y4 = 34 yy minus = v4= 34 vv minus =
301
y5 = 45 yy minus = v5= 45 vv minus =
301
y6 = 56 yy minus = v6= 56 vv minus =
301
y7 = 67 yy minus = v7= 67 vv minus =
301
y8 = 78 yy minus = v8= 78 vv minus =
301
y9 = 89 yy minus = v9= 89 vv minus =
301
y10 = 910 yy minus = v10= 910 vv minus =
Note about calculations 301
divide is the same as x 30
Compute an average of the accelerations in your table Letrsquos call this number the acceleration due to gravity The acceleration due to gravity is _______________________ in units of ________________ There You did it You measured the acceleration due to gravity
85
Lab 3 Rotational Kinetic Energy Determination
1 Surprise The potential and kinetic energy are not equal because we havenrsquot accounted for the energy lsquolostrsquo during motion of the ball Letrsquos calculate the rotational kinetic energy of the system by using the formula below Show your calculations be sure to include units
2R mv
51 E = ER = _______________ in units of __________________
Now add all of the kinetic energy (EK + ER) ___________________ in units of ____________ 2 How does the sum of kinetic energy (EK + ER) compare to the initial potential energy Is the
total energy conserved What other energy factor(s) havenrsquot we accounted for yet (HINT why does the ball slow down as it is rolling)
3 What would be the potential energy in the system if the ball were positioned at a height of 01
meters Show your calculations be sure to include units (Your answer should be in Joules) Predicting the Final Velocity of the Ball Because the total energy is conserved you know that at the beginning the total energy is only gravitational potential energy At the end of the experiment the ball has no altitude (h = 0 above the horizontal table) so all the energy is in the form of kinetic energy Since the total energy at the beginning must be equal to the total energy at the end we can say
Potential energy (EP) at beginning = Kinetic energy at end (both rolling + translation)
Or mgh = 22KR mv
51mv
21 EE =+=+ This simplifies to mgh = 2mv
107
Solving the above for the final velocity of the ball along the horizontal ramp we find
v gh=107
86
Questions
4 Using the equation v gh=107
calculate the ideal velocity on the horizontal track when the
ball is released on the ramp at h = 003 meters What are the units of the velocity 5 In reality will the velocity be higher or lower than the ideal calculation above Why 6 How did your average velocity (from table 1 pg6) compare with the ideal velocity (as
calculated in question 10 above) Comment on why it is the same or different (HINT there is more than one reason the velocity is not ideal)
7 Without calculating PREDICT what happens to the final velocity if we double the initial
height (h = 006 m) Will the final velocity increase or decrease About how much double one-half or some other value compared to when it is released from h = 003 meters
8 Support your above answer by employing the equation v gh=107
for h = 006 m
That is calculate the final velocity of the ball when it is released from 6 centimeters Be sure show your calculations and report your answer with the appropriate units
87
Lab 3 Energy of Motion and Landslides
PART C mdash Landslide Prediction Examine the cross-sectional sketch below Label in Figure 4 with numbers the positions where you might expect to find the following mass wasting processes
(1) rock fall (ie free-falling rock material) (2) soil creep (slowly moving sediment under the influence of gravity) (3) catastrophic landsliding and (4) zone of little to no chance of mass wasting processes
Figure 4 Landslide prediction diagram Questions 1 What are the chances of your property experiencing a landslide if you live in the Coast
Range of Oregon (for example somewhere between Dallas and Lincoln City) List the critical factors that apply (or donrsquot apply as the case may be) to why you think these are your chances
2 What are the chances of your property experiencing a landslide if you live in the middle of
the Willamette Valley (for example in Salem or Albany) List the critical factors that apply (or donrsquot apply as the case may be) to why you think these are your chances
88
Acceleration of a Cart If a cart moves on a plane that is inclined at an angle θ the component of force acting on the cart in a direction that is parallel to the surface of the plane is the shear force The acceleration of the cart should be given by
a = g sin θ Procedures 1 Before recording any data make sure the Motion Sensor can ldquoseerdquo the cart as it moves 2 Measure the angle the track makes with the table top Record in Table 4 below 3 Place the cart on the low end of the track and have one person start recording Have the
other group member give the cart a gentle push up the inclined plane track so the cart will move toward the Motion Sensor Keep recording as the cart moves away from the sensor
4 Stop recording when the cart returns to the bottom of the track 5 If the plot of data is not smooth check with your instructor to realign the Motion Sensor The
repeat the above procedure until the plot is smooth for the run up and then down the track 6 Erase your practice runs by clicking on the EXPERIMENT menu and selecting DELETE ALL
DATA RUNS Do NOT use the FILE menu and delete the activity 7 You are now ready to collect data Place the cart at the low end of the track Start
recording data Give the cart a gentle push toward the Motion Sensor Continue collecting data until the cart has returned to the bottom of the track This is lsquoRun 1rsquo
8 Set the track to a steeper angle and measure the angle Repeat data recording (Run 2) 9 Open the GRAPH from the left hand menu Select Data Run 1 Choose the plot of velocity
vs time Use the cursor to select the region of the plot that shows the cartrsquos motion after the push and before it stopped at the bottom of the track Determine the slope of the best fit line This slope is the acceleration of the cart (Note Units are ms2)
10 Repeat for Data Run 2 Record all data in Table 1 and answer the questions on the following page
89
Table 1 Acceleration of cart on Inclined plane
Run 1 Run 2
Angle of track (θ)
Experimental Acceleration (slope of velocity time)
Theoretical Acceleration (calculate from a = g sin θ)
Questions 1 What happens to the velocity of the cart as it moves up the inclined plane 2 What happens to the velocity of the cart as it moves down the inclined plane 3 What happens to the acceleration of the cart as it moves up the inclined plane 4 What happens to the acceleration of the cart as it moves down the inclined plane 5 How did the acceleration change when the track became steeper 6 Calculate the theoretical value for the acceleration of the cart based on the trackrsquos angle and
record it in Table 1 7 What is the percent difference between the acceleration determined in the activity and the
theoretical value for acceleration ⎟⎠⎞
⎜⎝⎛ =times differencepercent 100
ltheoreticaalexperiment-ltheoretica
(Show calculations here) 8 What is a possible explanation for the difference in these two values
810
Lab 4 Relative Age Dating Pre-lab Questions for Determining Relative Ages of Geologic Events Define the following terms prior to arriving at your lab section
Stratigraphic correlation
Principle of original horizontality
Principle of stratigraphic superposition
Principle of lateral continuity
Unconformity
Law of cross-cutting relationships
811
Determining Relative Ages of Geologic Events Another technique to determine the relative ages of geological events is the Principle of
Cross-Cutting relationships which states that any geological feature which cuts another geological feature must be younger than the cross-cut feature Stated in simple terms a loaf of bread must be older than the bread slices which transect the loaf
Activity Study the sketch on the following page LIST the sequence of geological events oldest at the bottom and youngest at the top on the table below and cite reasons for this order of events Close ups of significant relationships are shown on the following page (84)
Event Older than Because Younger
than Because
812
HINTS
bull ldquoIrdquo contains inclusions of ldquoJrdquo and ldquoKrdquo bull ldquoIrdquo changes from conglomerate at the bottom to sandstone at the top bull ldquoIrdquo does not include pieces of H
Rock Types Igneous ndash Intrusive Metamorphic
Gneiss Sedimentary
Cong ndash Conglomerate SS ndash Sandstone Sit S ndash Siltstone Sh ndash Shale Ls ndash Limestone
There are details of this cross section on the following page Working on the geologic history of smaller portions first can help you unravel the geologic history of a complicated section like the one above
ldquoBakedrdquo zone of contact metamorphism
813
Angular Unconformity Fault
Intrusions Refolded area
814
Questions Quantify some basic observations on geologic time in the spaces provided (Use dates shown in the ldquoGeologic Time Scalerdquo) Show all of your math work
___________ Based on the data given how old is the Earth (ie what is the total known
time encompassed by geologic history) Answer in billions of years ___________ What is the total duration of the Precambrian Eons (in millions of years) ___________ What is the total duration of the Paleozoic Era (in millions of years) ___________ What is the total duration of the Mesozoic Era (in millions of years) ___________ What is the total duration of the Cenozoic Era (in millions of years) ___________ What percentage of total Earth history is comprised by the Precambrian
Eons ___________ What total percentage of Earth history is marked by the presence of life in
the fossil record Show all of your math work ___________ What total percentage of Earth history is marked by the absence of life in
the fossil record Show all of your math work ___________ Homo habilis is considered by many anthropologists to be the first true
human and lived ~ 2 million years ago What total percentage of Earth history is marked by the presence of human-like species in the fossil record Show all of your math work
___________ What total percentage of Earth history is marked by the presence of
ldquomodern manrdquo Show all of your math work write the answer in scientific notation
___________ Assuming that you live to the ripe old age of 82 what total percentage of
Earth history will be marked by your presence on this planet Show all of your math work write the answer in scientific notation
815
Lab 5 Chemical and Physical Changes Exploring the Differences between Chemical and Physical Changes In this part of the lab you will work through a sequence of experiments make observations and determine whether a chemical or physical change has occurred As you progress through this portion of the lab complete Table 1 Observations on the following page Procedure 1 Take a test tube labeled iron filings and a test tube labeled sulfur from your kit These have
already been pre-weighed for you with 35 grams of the iron filings and 20 grams of sulfur Mix the two completely by grinding them together with a mortar and pestle
2 Divide the mixtures into two piles (ie aliquots) and place each on wax paper 3 Observe one of the aliquots under a magnifying glass and record your observations in table 1 4 Test the same aliquot for magnetism by passing a magnet under the paper (Please do not
remove the magnet from the Ziploc bag) Does the material appear to be magnetic Record your observations in Table 1
5 Now pour each aliquot into a test tube one aliquot into a small Pyrex test tube from your kit
the other aliquot into the soft glass test tube from your kit that is labeled ldquobreakablerdquo (Set this one aside for a few minutes)
6 Add a small amount of water to the first test tube (Pyrex tube not breakable one) cover the
end of the tube with your thumb and shake vigorously Record your observations in Table 1 7 Clean out the mortar bowl and put some cold tap water into the bowl Take the mortar bowl
with water your breakable test tube containing the dry ironsulfur mixture and a test tube clamp to one of the hoods Be sure to wear goggles
8 This step is performed under the hood Gently heat your mixture using the hottest part of
the flame (the inner blue tip) Heat your mixture until the mixture itself (not just the glass of the test tube) is producing a bright orange-red glow throughout the mixture Be patient it may take 5 or more minutes for the mixture to reach this stage Confirm with your instructor when it has reached this stage (to be sure the reaction has proceeded) Immerse the hot end of the tube into the bowl of water before it has a chance to cool This will break the end of the tube and there will be a small but exciting steam explosion
9 Carefully throw the broken glass of the test tube (but not the new compound you just created)
into one of the white glass disposal bins in the lab Using the cooled material that was in the test tube repeat the tests you performed on the original iron and sulfur mixture (examining with a magnifying lens checking the magnetic properties and mixing with distilled water in a large clean test tube) Record your observations in Table 1
816
Clean all the permanent glassware and return all the materials to your kit in a neat and tidy manner Leave the laboratory counter neat and in a condition that you could walk in and begin work immediately if you were in the next lab section Thank you Table 1 Observations of ironsulfur mixture
Material Viewed with magnifying glass
Tested with magnet Properties in water
Before Heating
After Heating
Questions 1 At what point did a chemical change occur How could you tell 2 Based on what you have observed in this laboratory exercise write a conclusion to the
experiment that summarizes how a chemical change differs from a physical change
817
Lab 5 Balancing Chemical Equations Balanced chemical equations are used to describe chemical reactions This equation tells
what substances are involved as reactants and what substances are formed as products In addition the relative proportions of molecules of each of the substances are specified The coefficients in the balanced equation give the mole ratios(comparing the number of molecules) of the various substances From these mole ratios the quantities of reactants required to produce a certain quantity of product can be determined as well as how much product can be expected when given quantities of reactants are utilized
1 Balance the chemical equations listed below by placing the correct coefficient in the space
provided in front of each substance ____ Mg + ____ O2 ____ MgO magnesium oxygen magnesium oxide ____ KIO3 ____ KIO2 + ____ O2 potassium iodate potassium iodide oxygen ____ AgNO3 + ____ Cu ____ CuNO3 + ____ Ag silver nitrate copper copper nitrate silver ___ AgNO3 + ___ NaCl ___ AgCl + ___ NaNO3 silver nitrate sodium chloride silver chloride sodium nitrate
818
Part A ndash Cooking with Chemistry Although you probably have never thought about it you carry out chemical reactions frequently in your kitchenmdashotherwise called cooking In many chemical reactions one reactant is present in a quantity that will limit the amount of products that can be formed This reactant is called the limiting reactant The concept of a limiting reactant will be explored by preparing a confection called SrsquoMORES which is a well-known camperrsquos delight Srsquomores (Sm) are a concoction of graham crackers (Gc) marshmallows (M) and chocolate pieces (Cp) The recipe can be written in the form of a chemical equation
2 Gc + 1 M + 3 Cp 1 Gc2MCp3 Where the reactants (ingredients) are Gc = graham cracker
M = marshmallow Cp = chocolate piece
And the product is Gc2MCp3 = a srsquomore If you were camping you would make a srsquomore by toasting a marshmallow on a stick over the campfire and then putting it between two graham cracker halves with three chocolate pieces When the graham cracker pieces are pressed together the hot marshmallow melts the chocolate and a gooey treat results (You will not be allowed to eat any of your srsquomores due to OSHA regulations and standard laboratory safety procedures) This part of the lab explores the results of adding proportions which differ from those specified by the balanced equation for a chemical reaction From different combinations of reactants you will predict the maximum numbers of srsquomores which can be prepared and test your prediction Procedure There are six different srsquomore stations labeled ldquoArdquo through ldquoFrdquo Be sure that all the reactants for each bag at each station are put back into the bag before proceeding to the next station Recall the proportions of reactants which follow the balanced equation above Record your results in Table 1 on pg 55
1 First use to srsquomore station A From the above proportions determine how many srsquomores
you can make from the reactants provided Write a balanced equation for the reactants in this bag including leftovers Test your prediction by assembling the reactants into srsquomores
2 Using the reactants in station B predict the maximum number of srsquomores which you will be able to prepare Again write the equation and test
3 Repeat Step 2 using the reactants in the stations C D and E
819
Table 1 Srsquomores reactions
Reactants present predicted yield actual yield
A
B
C
D
E
F
4 Write a unit conversion Reactant
moresS for each reactant
5 Predict the maximum number of srsquomores which can be prepared using the reactants in
station F Unit conversion calculations for Station F
Identify the limiting reactant in station F
820
Lab 6 Sedimentary Rock Identification
Part A ndash Overview of Minerals in Sedimentary Rocks As noted in the introduction a small number of minerals are commonly associated with sedimentary rocks including quartz (SiO2) potassium feldspar (KAlSi3O8) plagioclase feldspar (Na AlSi3O8 CaAl2Si2O8) mica (muscovite and biotite) calcite (CaCO3) halite (NaCl) and gypsum (CaSO4H2O) Table 2 is a summary of the diagnostic (ie distinguishing) physical properties that are used to identify these minerals Use the set of mineral identification tools (Table 2 nails pennies dilute HCl your eyes and intellect) and identify the names of the set of unknown mineral samples provided List your results in Table 1 (NOTE There is one example of each mineral so use the process of elimination to your advantage) Table 1 Identification of minerals commonly associated with sedimentary rocks
Sample Number
List of Diagnostic Properties(Used to Identify Each Mineral) Mineral Name
3
5
6
8
10
13
14
15
821
Table 2 Common sedimentary minerals and their diagnostic physical properties ____________________________________________________________________________ Mineral Name Diagnostic Physical Properties Quartz Harder than glass (specimen will scratch glass) SiO2 Glassy to waxy surface appearance (luster) Various colors of milky white clear smoky gray rose Potassium Feldspar Harder than glass (specimen will scratch glass) KAlSi3O8 Breaks into blocky angular pieces
(two directions of cleavage at 90o) Common varieties are salmon pink or white in color Plagioclase Feldspar Harder than glass (specimen will scratch glass) NaAlSi3O8CaAl2Si2O8 Breaks into blocky angular pieces (two directions of cleavage at 90o) Whitish to medium gray in color Parallel striations (lines) commonly visible Mica Softer than fingernail (fingernail will scratch specimen) K[Al2(Mg3 Fe3)](AlSi3O10)(OH)2 Breaks into thin sheetsflakes book-like occurrence Muscovite Mica Clear to silvery in color Breaks into thin silvery flakes
Biotite Mica Brown to black in color Breaks into thin dark flakes Calcite Softer than a penny harder than fingernail CaCO3 Breaks into rhombohedra (three directions of cleavage) Whitish in color Fizzes in dilute hydrochloricacid
(the ldquofizzingrdquo is the result of CO2 release) Halite Softer than a penny harder than fingernail NaCl Breaks into cubes (three directions of cleavage) Clear in color tastes salty (Donrsquot lick lab samples) Gypsum Very soft scratches easily with fingernail CaSO4H2O Clear to white to pink in color
May show three directions of cleavage
822
Figure 1 Environments in which sediments are deposited The diagram is not to scale
1 Abyssal Fan 9 River Channel 2 Deep Sea Floor 10 Delta 3 Reef 11 Lagoon 4 Beach 12 Barrier Island 5 Sand Dunes 13 Continental Shelf 6 Glaciers 14 Submarine Canyon 7 Alluvial Fans 15 Continental Slope 8 Flood Plain 16 Lake
You will refer to this diagram in the post-lab exercise Concentrate on the energy of the environment and the characteristics of the rocks that would form there Think about the way the environment would transport sediment grains the size sorting and shape of the grains the surface features that may be preserved etc You may want to look up some of the terms listed in the diagram in your textbook or from other sources
823
1 Study Figure 1 (previous page) and list at least two environments where the following sedimentary rocks would be deposited Think about the energy necessary to transport the grains Describe the overall characteristic of the depositional environment for each rock type
a SANDSTONE b SHALE
c LIMESTONE
824
d Lab 7Rivers and Topographic Maps Acitivity 1 The Willamette River 1 Describe stream gradient in your own words 2 How can you determine the stream gradient from a topographic map What information do
you need to know Express stream gradient mathematically 3 On the Chucksney Mountain OR Quadrangle determine the gradient of a tributary of the
North Fork of the Middle Fork of the Willamette River Look in the southwest corner of the map and find a stream that drains into the fork of the Willamette Show your calculations Also state the type of channel (see previous page for channel descriptions)
4 Determine the gradient of the Willamette River on the Salem OR Quadrangle between
Beardsley Bar and Doves Bar Show your calculations and describe the channel type 5 Use information on the Sauvie Island OR Quadrangle to determine the gradient of the
Columbia River between the mouth of the Willamette River and the point where it enters the Pacific Ocean Assume the distance between these locations is 100 hundred miles (Hint what is the elevation of the mouth of the Columbia River) Show your calculations
6 Study the gradient channel type and channel size of the three segments of the
WillametteColumbia River system Write a brief paragraph summarizing how these variables change as you move downstream in a river system
825
Activity 2 River Features Examine the Monmouth Oregon Quadrangle which shows many features associated with a moderately large river and answer the following questions
1 Locate the area along the Willamette River east of Independence What is name given to this river-formed feature (HINT Refer to the discussion of channel features earlier in lab)
2 Is this feature likely to change its shapeposition in the future In which direction will it
migrate and how can you tell Should folks in Independence be worried 3 Where would you expect an oxbow lake to form on the Luckiamute River in the near future
Describe location with direction and distance from landmarks Why did you pick this location
4 Several stream terraces are located along the course of the Willamette River associated
with periods of deposition and incision of the valley floor during the Quaternary Using the Monmouth quadrangle try to locate at least two (there are more) of these terraces by stating their general location and an approximate elevation
5 Sketch a topographic profile (cross section) from the top of Davidson Hill southwest across
the valley of the Luckiamute River (south central portion of map) Indicate the type of materials (solid bedrock and alluvial sediment) you would expect to find underlying various portions of your cross section based on their relative elevation slope and position with respect to the Luckiamute River
826
Lab 8 Stream Table Experiment on Sediment Transport Determine Effect of Flow Velocity on Mode of Sediment Transport and Stream Competence Visible sediment grains move through a channel as either bed load (rolling sliding or saltation (ie bouncing like a jumping bean)) or suspended load Reduce the discharge to a minimum by pinching the tube so the current is moving only a few grains
In the table below record how the sand-sized sediment is being transported under Low flow conditions Use some chalk dust to observe suspended load transport under Low flow conditions Increase the discharge to a Medium flow by squeezing the tube about half way Again record your observations for how the sand-sized sediment moving Increase the discharge to High flow by releasing the tube completely Once again record on the table how the sand-sized grains are moving
Table 1 Sediment Transport Record how the sand-sized sediment is being transport for each condition
Discharge Condition
Sand-Sized Bed Load
Sliding Rolling Saltation
LOW
MEDIUM
HIGH
Question 1 Describe how the transport mode and behavior of sand changed under each new flow
condition Consider the amount of grains moving and how the transport mode changed with increasing discharge

Earth Science 105 2015-2016 Academic Year
Updated December 2014
Laboratory Manual
Table of Contents
Lab 1 ENERGY AND ENERGY TRANSFORMATIONS Lab 2 EXPLORING WORK MOTION AND GRAVITY Lab 3 ENERGY OF OBJECTS IN MOTION AND PHYSICS OF
LANDSLIDES Lab 4 UNDERSTANDING GEOLOGIC TIME
Relative Dating and Fossils Radioactivity and Numerical Age Determination
Lab 5 INTRODUCTION TO CHEMICAL REACTIONS Lab 6 STUDY OF SEDIMENTS AND SEDIMENTARY ROCKS Lab 7 TOPOGRAPHIC MAPS AND STREAM SYSTEMS
A Introduction to Topographic Maps B Stream Tables and Fluvial Landscapes
Appendix ndash ADDITIONAL LABORATORY EXERCISES
11
ES 105 Laboratory 1 ENERGY AND ENERGY TRANSFORMATIONS
Introduction
Energy is an integral and fundamental part of our lives and we often do not realize how
dependent we and our society are on energy Our bodies in order to perform their most basic
biological functions consume large amounts of energy This lab is designed to give you examples
of different types of energy and to demonstrate some of the ways energy can be transformed from
one type to another
One of the main concepts you will be introduced to is the concept of conservation of energy
This important concept tells us that energy is never created or destroyed it can however
be transformed into different types of energy (like motion or heat) During any given energy
conversion an equal amount of energy exists before and after the conversion process There will
be several stations that explain and demonstrate the conservation and conversion of energy You
will see that energy can seem to disappear No process of transforming one type of energy to
another is perfectly efficient and some energy will always be converted into forms that are
inaccessible to us As you tour each station refer to the various sections in this manual that will
lead you through this exploration of energy
Goals and Objectives
bull Investigate the concept of conservation of energy
bull Explain transformation of energy
bull Convert energy from one type to another
Forms of Energy (a few examples)
bull Mechanical (Kinetic)
bull Mechanical (Potential)
bull Electromagnetic (Light)
bull Electromagnetic (other)
bull Heat
bull Chemical
bull Electrical
bull Magnetic
bull Nuclear
P
a
Pre Lab Act
and comple
tivity Fill in
ete Table 1 (
n the blanks
(next page)
s below with
Name____
Lab Day __
h appropria
___________
____ Lab Tim
te Energy F
__________
me________
Forms and T
__________
__________
Transforma
12
_____
_____
ations
13
Pre-Lab Activity (continued) ndash Start Table 1 before coming to lab
Instructions Complete Table 1 before class and compare and contrast answers with your lab group when you arrive in class
Table 1 is provided for you to complete In the left-hand column list as many forms of energy as you can In the right-hand column identify an example To get you started you might recall that electromagnetic waves are one form of energy and an example might be the microwaves in your microwave oven
Table 1
Form of Energy Example
Electromagnetic Waves (light) Microwaves (in your microwave oven)
14
Part A - Conversion of Mechanical Energy into Heat Energy
Conservation of energy is a very important concept The term simply means that energy cannot be created or destroyed - it is conserved There is a finite and unchanging amount of energy in the universe There is however no restriction on converting one form of energy into another (except as per the Second Law of Thermodynamics) There are many devices (or processes) that transform one type of energy to a different type of energy Sometimes it is said that energy is ldquolostrdquo in transforming one kind of energy into another but in reality the ldquolostrdquo energy is only converted into a form that is unavailable to use conveniently Often the ldquolostrdquo energy is in the form of heat that escapes into the surrounding environment
Activity 1 Use the table below extend the list by adding your own entries to the table
Then share your list with the others in your group and compile a lsquomaster listrsquo Table 2 Shows some possible ways that energy can be lost during a conversion
To Convert Into You Might Use Ways Energy Might Be Lost Electrical Light A light bulb The lamp heats up and the heat
escapes into the air
Mechanical (Kinetic)
Electricity An electrical generator
Light Heat A solar collector (that sits in the sun and uses black pipes filled with water)
The water that absorbs the light and converts it to heat begins to boil and this requires a form of chemical energy
Heat Mechanical A steam engine
Chemical Light A chemical reaction
Ultraviolet (UV) Waves
Visible Light Waves
15
Activity 2 Moving hands (Mechanical energy transformed into heat energy) Instructions Press your hands together and rub them back and forth twenty times As you do this press as hard as you can but still allow them to rub together Try to apply the same force throughout this activity As soon as you stop rubbing feel the temperature of your hands
1 What did you observe Explain in terms of energy conservation and conversion
2 Change the amount of frictional force between your two hands by pressing your hands together very lightly (reducing friction) Rub them back and forth twenty times As before feel the temperature of your hands where they touched Were they warmer or cooler than before
3 Compare this observation to the one above Explain in terms of energy conservation and conversion
4 Does reducing the frictional force affect how much mechanical energy is transformed
into heat energy
5 Explain why you put grease (a lubricant) on parts of your bicycle that rub together (eg
wheel bearings) Explain your answer to this question in terms of energy conservation and lost energy
6 Make a short list of things (five things) you encounter every day that convert mechanical
energy (of moving objects) into heat
16
Part B - Conversion of Mechanical and Chemical Energy into Electrical Energy
A generator converts mechanical energy into electrical energy Electrical energy can flow through a wire in the form of an electrical voltage and commonly is used to light a bulb to produce light The light bulb converts the electrical energy into light energy that our eyes can easily detect
Activity 1 Hand crank generator to electric light (Mechanical to Electrical)
This consists of a hand-crank generator to convert mechanical energy to electrical energy and wires to carry the electrical energy (voltage) to a light bulb Instructions
1 Connect one wire-lead from hand generator to light bulb leaving the other wire-lead unconnected (open circuit) Gentle turn the generator and ldquofeelrdquo (gauge) the degree of difficulty Was it (easy moderate or difficult) to turn the crank
2 While turning the crank at the same speed as above connect the other wire-lead to the light (closed circuit) and ldquofeelrdquo (gauge) the degree of difficulty to turn the crank Was it (easy moderate or difficult) to turn the crank
Questions
1 What do you notice about how hard the hand crank turns with respect to a closed circuit (light bulb on) verses an open circuit (light bulb off) Explain why there is a difference
Activity 2 Measuring actual voltage in a closed circuit
Instructions bull For Multimeter black wire-lead connects to COM terminal and red wire-lead connects to
theVmA terminal (check with instructor) bull Connect hand generator wires to each wire of the Multimeter (at direct voltage (DCV) setting of
20) and slowly turn the handle and record the voltage in the table below Repeat for a faster turn Slow Turn Voltage (volts) = Fast Turn Voltage (volts) = Thought Question
1 (Think about and Discuss) How hard (fast) and how long you would need to turn the hand generator to produce enough energy to light a 60 watt light bulb for an hour Or brew a cup of coffee in the morning
17
Activity 3 Comparing chemical (battery) energy to mechanical energy Instructions bull Connect the battery pack to the Multimeter and record the voltage (in table below) using same
settings (Multimeter at direct voltage (DCV) setting of 20) as activity 2 above bull Disconnect the battery pack and connect the hand generator to the Multimeter and try to maintain
a constant turn that replicates the same voltage as the battery pack Now you can FEEL the energy associated with 3-volts
Voltage (volts) with 3-volt (2-battery) pack =
Speed of hand generator (slow medium or fast) associated with 3-volts (2-batteries) =
Questions
1 (Think about and Discuss) How hard (fast) and how long you would need to turn the hand generator to produce enough energy to recharge your cell phone (Typical cell phone batteries are 37 volt and 800 mAhour)
Part C - Conversion of Heat into Mechanical Energy
Figure 1 Apparatus to investigate conversion of heat energy to mechanical energy
Rubber hose
(Test tube)
18
At this station you will convert heat energy into mechanical potential energy To understand how the potential energy is observed consider the U shaped tube in Figure 1 One side of the U-shaped tube is connected to a small reservoir (a test tube) the other end of the U-shaped tube is open to the atmosphere If the pressure in the reservoir is the same as the atmosphere the water level in both sides of the tube will be the same However if the pressure inside the reservoir is larger than the atmospheric pressure the water levels will be different the pressure inside the reservoir tends to push the water out of the tube In lifting the water in the tube the gas in the reservoir does work holding the water up (that is holding it in a non-equilibrium position) requires energy -- mechanical potential energy To make the gas expand (and increase the pressure in the reservoir) we rely on the ideal gas law The Ideal Gas Law states that if you increase the temperature of a gas the pressure will increase To increase the temperature you must transfer heat (energy) into the system
Activity 1 Hot and Cold (thermal energy) converted into Mechanical Energy
Instruction
bull Record the location of the water level on the scale (Measure the level of water on the open end of the glass U tube)
bull Place the air-test tube (reservoir) into the warm water beaker and record the new level of the water in the table below
bull Now place the air-test tube (reservoir) into a beaker of cold water What happens to the water level in the tube when the reservoir is cooled Record your observations in the table
Observations Initial water level on open side of the glass U tube
Water level on open side of the glass U tube in warm water reservoir for 30 sec
Water level on open side of the glass lsquoUrsquo tube after immersing in beaker of cold water
Describe change of water level from previous level
Questions 1 1 Explain your observations recorded in the table in terms of energy conservation and
energy conversion 2 What happens when you leave a blown-up balloon in the sun Give a detailed explanation as
to what happens to such a balloon in terms of energy transfer and conservation of energy
19
Part D mdash Conversion of Light Energy into Electricity Light energy conversion to other types of energy (eg electricity) is never 100 efficient
This station contains a solar cell which directly converts light to electricity with approximately 5 efficiency That is 5 of the light that reaches the panel surface is converted to electricity
Activity 1 Solar to electrical to mechanical
Instructions The small motor connected to the solar cell converts light to electricity and then to mechanical energy
1 Turn 40-watt lamp on and observe if motor (Fan) turns Record how fast fan is turning
2 Turn 75-watt lamp on and observe if motor (Fan) turns Record how fast fan is turning
Questions 1 Which wattage (light bulb) produced the most electricity (turned the fan fastest) 2 Most (95) of the light energy was lost in the process of conversion Where do you suppose
the other 95 of the light energy is going if only 5 is converted to electrical energy Refer to Table 5 below to answer the post-lab question about energy conservation Table 5 Estimates and comparisons of energy usages in your daily lives
Energy Using Activity Is Comparable With
Take a hot bath (full tub) Burning a 100 Watt lamp for a day
Using a 250 watt hair dryer for 8 minutes Riding your bike 30 miles (under ideal conditions)
Heating a pot of water for tea or coffee on the stove
Bench lifting a 50 lb weight 40000 times
Watch TV for an hour Eating a dessert with 250000 calories
Driving your car 45 miles to Portland Playing 13400 games of racquetball
Leaving a 100 watt light burning all night (10 hours)
Dancing the Tango for 45 days nonstop
110
Name____________________________________
Lab Day _____ Lab Time_____________________ POST-LAB ASSESSMENT Comparison of Energy Sources
Questions 1 It is part of our common language to use the term lsquoconserve energyrsquo to mean lsquotry to
consume less energyrsquo Contrast this meaning of lsquoconserve energyrsquo with the physics law of lsquoconservation of energyrsquo
2 All methods of generating electricity have adverse impacts on the environment Try to list at least two ways that each of the following energy sources used to generate electricity negatively impact the environment a) Burning fossil fuels b) Hydroelectric (dams) c) Solar
(Hint you might consider what impact building such plants may have on the environment) 3 Which is you favorite energy source Why
4 Try to stump your lab partner by thinking of a situation where energy is apparently lost for good Write down the ideas you come up with and give your lab partnerrsquos explanation of where the lost energy went
Consider the idea that energy is always conserved and discuss whether people will ever be able to generate power without affecting the planet Record your discussion
2-1
ES 105 Laboratory 2 EXPLORING WORK MOTION AND GRAVITY
Introduction
Work Work is a word used in many different ways It is used to describe our jobs and
careers It is used to describe what we do when we study for an exam However with regards to science that is not what work is The scientific definition of work is a force acting through a distance (Work = Force x Distance) A force is just a ldquopush or a pullrdquo that gives energy to an object sometimes causing a change in motion of the object (Recall from last lab that Energy is the property of a system that enables it to do work) Work is done only when a force moves an object When you push lift or throw an object you are doing work Your force is acting on the object causing it to move a certain distance One important aspect of work to note is the direction of the applied FORCE must be in the same direction of the DISPLACEMENT (movement) for it to be considered WORK
Friction Friction is a resistive force that opposes the motion or attempted motion of an object with which it is in contact In a sense friction is a force that resists (or limits) the work being done as objects are moved Friction always acts in a direction to oppose motion So when an object falls downward through the air the force of friction (referred to as Air Resistance) acts upward There are different types of friction including rolling friction and fluid friction but for the purpose of sliding solid objects across a floor or tabletop the two important types of friction are static and sliding friction The strength of these forces of friction depends upon two factors 1) the types of surfaces involved and 2) how hard the surfaces push together Static friction occurs when you first try to move the object before it is in motion and is a little stronger of a friction force than sliding (or moving) friction once the object is in motion
Gravity and Free Fall ldquoFree-falling objectsrdquo refer to objects that are allowed to fall straight down accelerated ONLY by the force of gravity An object in free fall accelerates as it falls due to the force of gravity (acting as an unbalanced force) Other than the force of gravity what other affects might there be on a falling object The dreaded air resistance is one effect However the effects of air resistance can be ignored as long as the (maximum) velocity of the object is relatively modest For most objects beginning at rest air resistance is negligible throughout the first seconds of fall
In this weekrsquos lab there will be a series of stations that will allow you to explore the motion of objects and how friction affects the motion of both sliding and free-falling objects You will also learn how to calculate the work needed to move objects Your instructor will help you gather data to measure the acceleration of free falling objects due to gravity
There are a few basic measurements and calculations that are necessary to understand the motion of objects and the work needed to move objects These measurements and calculations include
2-2
Distance or Displacement
(d) the distance over which an object moves under the influence of gravity (units of measurement eg centimeters meters kilometers)
Time of Travel (t)
the time during which an object completes its travel (units of measurement eg seconds minutes hours)
Velocity v = dt
the rate of change or displacement (units of measurement eg mileshour meterssec)
Acceleration a = change in velocity time
the rate of change of velocity of an object over time (units of measurement for acceleration are dt2 such as meterssecsec = meterssecond2)
Force (F)
is a push or a pull units generally measured in (Newtons)
Work (w)
is the change in an objectrsquos state of motion that results from the application of a Force
Work (joules) = Force (Newtons) x Displacement (meters)
Power (P)
Is the time rate of work Units generally measured in (watts)
Power (watts) = Work (joules)Time (seconds)
Goals and Objectives
bull Students will be able to perform measurements using a spring scale to determine the force associated with lifting and pulling weight
bull Students will be able to be able to calculate the average work bull Describe what is meant by accelerated motion bull Determine the acceleration of gravity
Useful Websites
bull httpwwwpbsorgwgbhnovagalileo
2-3
Name____________________________________
Lab Day _____ Lab Time_____________________ Pre-Lab Activity Complete the following calculations prior to arrive in lab Show all of your math work and unit conversions (HINT 1 hour = 60 minutes 1 min = 60 seconds 1 km = 1000 m) and (1 kilogram = 1000 grams) 1 If you drive a car for a distance of 35 km and it takes you 45 minutes to do so what is your
average velocity in units of kmhr What is your average velocity in msec 2 Phil has a very messy office and wants rearrange some furniture He needs to move a desk 10
meters If Phil exerts a force of 20 Newtons how much work is he doing 3 What is the Force (in Newtons) associated with a 500 gram weight in free fall near the
Earthrsquos surface (assume acceleration due to Earthrsquos gravity is ~ 10 meterssecond2) (note the 2nd Law of Motion is F(Newtons) = mass(kilograms) x acceleration(metersseconds2)
4 You will be using a Spring-scale to determine the Force associated with moving objects in the
lab Go to Wikepidiaorg (httpenwikipediaorgwikiSpring_scale) and write a brief definition of what a Spring scale is (Be careful to discuss difference between Mass and Force readings)
5 A spring scale measuring the force associated with lifting a 500 gram weight on Earth (3
above) is now used on the Moon What will the Spring scale readings be for Mass and Force associated with the Spring scale reading on the Moon
(assume acceleration due to Moonrsquos gravity is ~16 meterssecond2)
MASS (in grams) FORCE (in Newtons)
2-4
Part A mdash Work Activity 1 Letrsquos Talk Work Instructions
bull Tape a meter stick to an object to keep it vertical bull Use a force spring scale to lift weights of different sizes to the 30 cm mark bull Record your data in the table below bull Use a force spring scale to lift weights of different sizes to the 60 cm mark bull Record your data in the table below
Data Table One
Weights (Grams)
Height (Centimeters)
Distance (Meters)
Force (Newtons)
Work (joules)
100
30
Predict
What will happen to force if weight is raised to 60 cm _____________________
__________________________________________________________________
What will happen to work if weight is raised to 60 cm ______________________
__________________________________________________________________
Now try it and see if your prediction was correct
100
60
200
30
Predict
What will happen to force if weight is raised to 60 cm _____________________
__________________________________________________________________
What will happen to work if weight is raised to 60 cm ______________________
__________________________________________________________________
Now try it and see if your prediction was correct
200
60
Try 500
30
2-5
Questions
1 What does doubling the height (distance moved) do to total work
2 What does doubling the force do to total work Solving Problems Remember to include your units of measurement Some measurements are required to solve
1 Kelsey is a very strong She lifted a 200-gram weight to 50 cm How much work did she do 2 Mario wants to be a super hero He has been practicing for his super hero test by lifting cars If
Mario exerts a force of 12000 Newtons to lift a car 2 meters how much works is being done on the car
Part B mdash Friction Use the spring scale to measure the pulling force (associated with Static and Sliding friction) necessary to move at constant velocity a wood block across different surfaces Add a 200 gram weight to block and measure the pulling force again Record your measurements in Table below
Friction Surfaces Static vs Moving Type of Surface Static Friction
(Newtonrsquos) Moving (Newtonrsquos)
Static with weight
Moving with weight
Smooth-smooth
Smooth-rough
Rough-rough
1 What surface(s) and weight had highest amount of friction Explain your answer Which
was greater Static or sliding friction
2-6
Part C mdash Gravity and the Physics of Free-Falling Bodies Activity 1 Free Fall of Objects with Similar Size but Different Mass Collect two balls of the same size but different weight such as a heavy solid steel ball and a light hollow plastic ball With your lab partners hold both balls simultaneously at a height of one (1) meter above the floor
As a group make a hypothesis (predict) as to which ball will hit the ground first As a group test your hypothesis by releasing the balls at the same time Repeat the experiment several times and describe your results
1 How did the actual results compare to your initial hypothesis What can you conclude about the effects of the Earthrsquos gravity on the heavy and light ball respectively
Activity 2 Free Fall of Unlike Objects In your group repeat activity 1 only this time using a rock and a feather (or piece of paper if you cant find a feather) Hold the rock and feather at a height of 1 m above the floor
As a group make a hypothesis (predict) as to which object will hit the ground first the rock or the feather As a group test your hypothesis by releasing the rock and feather at the same time Repeat the experiment several times and describe your results
2 How did the actual results compare to your initial hypothesis What can you conclude about the effects of the Earthrsquos gravity on the rock and feather respectively
3 How does this activity compare to Activity 1 with two balls of the same size but different
weight Explain the differences andor similarities
2-7
Activity 3 Free Fall in a Vacuum
NOTE Do NOT run the vacuum pump unless it is connected to the lsquoRock and the Featherrsquo tube
As a lab group visit the station that consists of a glass vacuum tube and vacuum pump The apparatus consists of a long tube containing a rock and a bit of paper (or feather depending which tube is available) Air in this tube can be evacuated using the vacuum pump thus creating a vacuum (similar to space) Hold the tube vertically with the valve-end up Hook up the hose to the tube open the valve and turn on the pump After 60-80 seconds all air should be evacuated from the tube Shut the valve turn off the pump and remove the hose With all of the air out of the tube quickly turn the tube end up and hold it vertically while the feather and rock experience free fall Repeat the process several times and note your observations 4 Which object hits first in the vacuum tube the rock or the feather (or piece of paper as the
case may be) 5 How do the vacuum tube results compare with the results from Free Fall Activity 2 (above) 6 Explain processes that influence free-fall of objects under the influence of Earthrsquos gravity
a What are the controlling factors
b How does the Earthrsquos atmosphere affect the free fall of objects under the influence of gravity
c What other force(s) besides gravity is operating on the objects
2-8
Part D mdash Measuring the Earthrsquos Gravitational Acceleration Activity 1 Using the photogate apparatus to Measure Gravitational Acceleration Using a ldquoPHOTOGATErdquo (a light beam with a sensor for light) and a ldquoPICKET FENCErdquo (a clear plastic strip with uniformly spaced opaque bands) the acceleration due to gravity can be determined The photogate head emits an infrared beam from one side of its lsquoUrsquo shape to the other A light-emitting diode (LED) on the top of the Photogate Head blinks to show when an object blocks the beam Timing begins when an object interrupts the infrared beam We will drop our ldquopicket fencerdquo through the photogate head The software calculates the average velocity of the picket fence from one band to the next because the distance from one band to another was programmed into the calculation Before recording data experiment with the photogate and picket fence Procedure 1 Hold the picket fence at one end between your thumb and forefinger so the bottom edge of
the picket fence is just above the photogate beam (see diagram below) Have your partner click START then drop the picket fence through the photogate The computer will begin recording data when the photogate beam is first blocked
2 Click STOP once the entire lsquopicket fencersquo has passed completely through the photogate 3 Make sure the graph shows a diagonal line before moving on If data looks erratic make
sure you are dropping the picket fence vertically not at an angle data will be skewed 4 After your practice runs open the EXPERIMENT menu select DELETE ALL DATA RUNS 5 Using the techniques from above conduct five runs and record them in Table 1 6 Click on GRAPH from the left hand data menu and examine the plot of Velocity versus Time
in the Graph display Determine the slope of the lsquobest fitrsquo line for velocity versus time for each run Record these values in your data table and find the average Include units
Table 1
Run Number Slope of Best Fit Line (acceleration due to gravity)
1
2
3
4
5
AVERAGE
2-9
Name____________________________________
Lab Day _____ Lab Time_____________________
Post-Lab Questions on Acceleration Due to Gravity 1 What can you say about the values for acceleration from Table 1 Is it constant or does it
vary in some consistent manner
2 Compare your values (from Table 1 above) for the acceleration due to gravity g (with the accepted value for g at sea level at the equator of g = 981 ms2
3 What factors may have contributed to the value you determined experimentally being
different from the accepted value List and briefly describe several of these
31
ES 105 Laboratory 3 ENERGY OF OBJECTS IN MOTION and
PHYSICS OF LANDSLIDES
Introduction In this lab we will work with two important aspects of the physics of objects in motion From
lab 1 you should recall that energy can be transformed from one type to another and that energy is never created or destroyed it can however be transformed into different types of energy (like motion or heat) This is known as the concept of conservation of energy This very important concept tells us that an equal amount of energy exists before and after the conversion process Today in lab you will work with converting gravitational potential energy to kinetic In doing so it will seem that energy can disappear No process of transforming one type of energy to another is perfectly efficient and some energy will always be converted into forms that are inaccessible to us
The second key aspect of todayrsquos lab will focus on the physics of landslides Landslides are part of a spectrum of gravity-driven geomorphic processes collectively known as ldquomass wastingrdquo Mass wasting processes include rock fall rock avalanche landslide earth flow debris flow and soil creep The prerequisite conditions for landslides typically include (1) the Earthrsquos gravitational field (a fundamental driving force) (2) the occurrence of loose rock and sediment at the Earthrsquos surface (3) heavy rainfall and (4) steep slopes To understand the occurrence of landslides geologists and engineers must first understand the physics of gravity (ldquoNewtonian physicsrdquo ldquoNewtonrsquos Laws of Gravityrdquo) and how it interacts with materials (rock and sediment) at the Earthrsquos surface This lab provides an introduction to Newtonian physics gravity and the forces that cause landslides
Goals and Objectives
bull Further investigate the concept of conservation of energy bull Investigate the conversion of gravitational potential energy to kinetic energy bull Formulate explanations for energy that can seem to disappear bull Calculate effect of angle of influence on the acceleration of gravity bull Investigate frictional effect on motion
Useful Websites bull httplandslidesusgsgov bull httpwwwfemagovhazardlandslideindexshtm bull httpwwwphysicsclassroomcomClassnewtlawsU2L3ahtml bull httpwwwgrcnasagovWWWK-12airplanenewton2html bull httpenwikipediaorgwikiSineComputation
32
Name____________________________________
Lab Day _____ Lab Time_____________________ Pre-lab Questions 1 Define the following terms andor provide the correct formula prior to attending your lab
A GRAVITATIONAL POTENTIAL ENERGY
B KINETIC ENERGY
C MASS WASTINGLANDSLIDE
D FORCE
E NEWTON (unit of force)
F NEWTONS SECOND LAW OF MOTION
2 Calculate the following values
0o 10o 20o 30o 40o 50o 60o
Sine of angle
Cosine of angle
(If any of your values are negative set your calculator on degrees instead of radians)
33
Part A mdash Energy Transformation and Conservation In closed systems the Law of Conservation of Energy is obeyed It states the total energy
remains constant Another way to say this is that the initial total energy in a closed system is equal to the final total energy In this part of the lab we will examine two types of energy
1mdashTranslational Kinetic Energy = 2mv
21
EK =
where m = mass (kilograms) and v = velocity (msec) Kinetic energy is the energy associated with motion along a line It is measured in Joules [J] which is the same as
2
2
secondmeters kilogramstimes
2mdashGravitational Potential Energy = EP = mgh
where m = mass (kilograms) g = acceleration due to gravity (98 msec2) and h = height above surface (m) Gravitational potential energy is the energy associated with the gravitational pull on an object that is some elevation (h) above a surface (usually Earthrsquos surface) Think of skiing down a slope at the top of the hill you have a large potential energy ndash your elevation h is large As you travel down the hill your elevation decreases so does your potential energy EP = mgh At the bottom of the hill (at an altitude of h = 0) your potential energy is zero Does this mean your energy went to zero No Your potential has been converted into translational kinetic energy and yoursquore zipping along
Instead of skis we will roll a ball down a ramp converting potential energy into kinetic energy At the bottom of the ramp the ball can roll with some friction along a horizontal track We measure the final velocity as the ball traverses one meter along this track By comparing the initial potential energy to the final kinetic energy we will determine if energy is conserved Activity 1 Investigating gravitational potential energy and translational kinetic energy Go to the ramp-track station in the lab It should look like this
Support (Rods and Clamps)
Ramp
Table
Horizontal Track
lsquozerorsquo marker lsquo1 meterrsquo marker
Tape lsquocatcherrsquo
Release Point
h = 003 m
Meter Stick
Figure 1 Apparatus to investigate the conservation of energy
34
Procedures
1 Determine the mass of the ball in grams using one of the balances in the lab Record below
The ballrsquos mass is __________________ g and convert this mass to kilograms record below
__________________ kg 2 Carefully measure a starting point on the ramp that is 3 centimeters above the base of the
horizontal track (H= 003 m) Make sure you are measuring the VERTICAL HEIGHT of the starting point NOT the diagonal length from the base of the ramp
3 One person will release the ball from the previously determined release point Another person in the group will click START to begin recording The program will record the value of position versus time One person must catch the ball before it hits the motion sensor
DO NOT LET THE BALL HIT THE MOTION DETECTOR 4 Repeat this measurement for a total of five trials After each trial use the best fit line tool to
determine the slope of the graph following directions provide below The slope of the position versus time graph is equal to the average velocity of the ball rolling along the horizontal surface Record the velocity for each trial in the data table below (Table 1) Repeat your experiment 5 times and find the average
5 Follow these directions to determine the best fit line a Click the DATA tool button Select NO DATA b Click the DATA tool button again This time choose Run 1 c Click on the SCALE TO FIT button d Using your mouse select data click and hold the left mouse button to draw a box
around the part of the graph that is a smooth diagonal line This part of the graph corresponds to the ball rolling along the horizontal surface The line should be highlighted in yellow
e Now click on the FIT button and select LINEAR Record the slope (m) in Table 1 as the velocity
f Repeat steps a through e for all five trials Be sure to select part of the line for each trial Do not rely on it having yellow highlight Tabulate your data in Table 1
6 Run the experiment again starting the ball at 6 centimeters above the table top and calculate the velocity on the horizontal track in meterssecond Repeat your experiment 5 times and find the average Tabulate your data in Table 2
35
Table 1 Data table for experiment with ball starting at 3 centimeters above the table top
H = ___003__________ meters
In the last column record the velocity from the computer table if you used it to collect your data It is not necessary to record the time if you used the computer to collect your data
Trial Time (seconds) Velocity (msec)
1
2
3
4
5
AVERAGE
If you are using meter stick and manual timer you will need to calculate your velocity Table 2 Data table for experiment with ball starting at 6 centimeters above the table top H = ____006_________ meters In the last column record the velocity from the computer table if you used it to collect your data It is not necessary to record the time if you used the computer to collect your data
Trial Time (seconds) Velocity (msec)
1
2
3
4
5
AVERAGE
If you are using meter stick and manual timer you will need to calculate your velocity
36
Activity 2 Computational Questions Show your calculations be sure to include units in all of the equations on the next three pages 1 Calculate the initial potential energy in the system Ep = mgh (mass x acceleration of
gravity x height) for the ball starting at 3 cm (g = 98 msec2 use units of kg m seconds) 2 What is the final potential energy
(Hint write the equation with values inserted for the variables and remember h = 0 meters)
3 Calculate the final kinetic energy in the system 2K mv
21 E = (That is square of velocity
times the mass divided by 2 Use average velocity from 3 cm height and units of kg m s) 4 What is the initial kinetic energy (when the ball is at the top of the ramp)
(Hint write the equation with the values inserted for the variables) 5 Compare the initial potential energy (from Q 1) and final kinetic energy (from Q 3) Are
they equal (to within your uncertainty) or are they quite a bit different By what factor 6 Law of Conservation of Energy suggests that EP and EK should be equal explain how the
concept of conservation of energy is supported or rejected by the track experiment If rejected what might be the possible reasons
7 Surprise The potential and kinetic energy are not equal because we havenrsquot accounted for
the energy lsquolostrsquo during the rolling (rotational energy) motion of the ball
37
Part B mdash Newtonrsquos Second Law Force and Landslide Analysis Landslides are driven by the Earthrsquos force of gravity acting on a mass of rock or sediment on an inclined hillslope The critical analytical parameters include
Symbol Name Description Units
F Force of Gravity The pulling action on an object due to Earthrsquos gravity
Newton N = 1 kg-msec2
g Acceleration due to gravity
Constant on the Earth g = 983 msec2 msec2
m Mass Amount of material measured in kilograms
kg
θ Angle of Slope Angle of hill-slope inclination (90 degrees = sheer cliff face 0 degrees = flat surface)
degrees
Newtonrsquos second law of gravity states that the force operating on an object in space is directly proportional to the product of its mass and acceleration Newtonrsquos second law translates into the following equation
F = ma where F = force (Newton) m = mass (kg) and a = acceleration (msec2)
When Earthrsquos gravity is considered ldquoFrdquo is equivalent to ldquoweightrdquo (eg your weight on a scale is a measure of the Earthrsquos gravitational pull on your body mass the more mass you have the more you weigh) and ldquoardquo is equivalent to ldquogrdquo which is the acceleration due to gravity (a constant = 98 msec2) In terms of Earthrsquos gravitational pull Newtonrsquos second law is translated as
Wt = mg where Wt = weight of an object (Newtons) m = mass of object (kg) and g = acceleration due to gravity (g = 98 msec2)
This part of the lab is particularly relevant because the Willamette Valley represents one of
the most dynamic and spectacular geologic environments in the United States Intense seasonal rainfall patterns steep mountain slopes and expansive valleys provide for an active geomorphic setting associated with seasonal flooding and landslides Annual cost of damage to public and private lands in western Oregon ranks among the top 20 of the most severe in the United
38
States Damage to public infrastructure from storm events during the mid-1990rsquos alone totaled hundreds of millions of dollars Landslides accounted for a large portion of this damage Slope failure and erosion in the Coast Range are further exacerbated by sustained timber harvesting and the Willamette Valley is experiencing unprecedented population growth and development invading the foothills Understanding of the spatial and temporal distribution of landslides is critical for the appropriate design of land-use regulations hazards mitigation and conservation planning (read this as ldquoYour house could be next How do you know if you are at risk for landslide and what can you do about itrdquo)
Application of Newtonrsquos Second Law With your lab group visit the inclined plane station and examine the apparatus A mass of rock is sitting on an inclined plane this is analogous to a mass of rock on a hill-slope in the Coast Range or western Cascades The figure below illustrates the forces acting on the slope material
Figure 2 Diagram of forces of weight Definitions for Particle on Slope
θ = slope angle relative to horizontal plane (units in degrees) Wt = weight of particle or mass of material (units in N) = mass x gravity Shear force parallel to slope = Wt x sin θ (units in N) Normal force perpendicular to slope = Wt x cos θ (units in N)
Equations for Particle on Slope
Wt (weight of particle in Newtons) = mg (= mass times acceleration of gravity) SHEAR force (in N) = Wt (sin θ) NORMAL force (in N) = Wt (cos θ)
39
Activity 1 Force Analysis of a Rock Mass on a Slope (Inclined Plane) Questions Given that shear force is oriented down slope and normal force is oriented perpendicular to slope answer the following questions (refer to the inclined plane drawing above) 1 Which of the two forces (shear or normal) will drive the rock-block down slope when it fails 2 Which of the two forces will tend to resist down-slope movement of the rock mass 3 When do you think the block will begin sliding down the slope (Circle one comparison) shear = normal shear lt normal shear gt normal
Instructions
1 Determine the mass of our block-of-rock sample by using the balance in the room a Mass of Rock Block kg (HINT 1 kg = 1000 g)
b Weight of Rock Block N (Newtons) Show Calculations
2 Place the rock on the inclined plane and slowly lift the board to determine the critical
angle at which it slides down the slope (tilt the plane until the rock begins to slide) Record the angle in Table 3
3 Now repeat the experiment with various types of surfaces Record the angles in Table 3 Reduced friction Tape wax paper to the rock (place it between rock and wood) Increased friction Tape a piece of sand paper (place it between rock and wood)
Figure 3 Critical Angle apparatus
310
Table 3 Critical Angle of sliding for various surfaces
Condition of Inclined plane
Critical Angle of sliding (degrees)
Normal Force at Critical Angle
Wt x (cos θ)
Shear Force at Critical Angle Wt x (sin θ)
Rock on Wood
Rock on Wax Paper
Rock on Sandpaper
4 Calculate the normal force and shear force of the critical anglesmdashbe sure your calculator is
using degrees not radians to calculate the sine and cosine of angle θ Record in Table 3 5 How do inclined-plane results (Table 3) compare to your prediction in question 3 above 6 List some ideas as to what other physical factors may be important to slope failure that are
not part of the above equations for slope analysis
7 Based on your experiments above discuss the effects of surface friction on the critical hill slope angle at which landslides occur
8 In the absence of wax paper and sand paper on hill slopes in the natural environment what
types of factors will influence the frictional conditions and critical angles at which hill slopes fail
311
Name____________________________________
Lab Day _____ Lab Time_____________________
Post-Lab Assessment Calculations 1 Imagine you have placed yourself on a balance and determined that your body mass is
100 kg Calculate your weight in units of Newtonrsquos (hint 1 N = 1 kgmsec2) Show all of your math work keep units with numbers
2 A car has a mass of 1000 kg and the net force exerted on the car is 0 N Use Newtons
2nd Law to calculate the acceleration of the car in msec2 Show all of your math work keep units with numbers
3 A rocket has a mass of 1000 kg and the net force exerted by the rocket engine is 2000 N
Use Newtons 2nd Law to calculate the acceleration of the rocket in msec2 Show all of your math work
Questions 1 What effect will clear-cut logging of trees have on slope stability in the Coast Range
Explain your answer in the context of todays lab experiments 2 Write a 5-10 sentence summary of the critical factors that affect landslide susceptibility in
western Oregon Think about the conditions necessary for landslides to occur and the factors that affect the critical thresholds at which they begin
41
ES 105 Laboratory 4 UNDERSTANDING GEOLOGIC TIME
Relative Dating and Fossils Radioactivity and Numerical Age Determination
Introduction The Geologic Time Scale was developed using two approaches In the first rock units were
studied and correlated between geographically distant areas using the principle of faunal succession With the discovery of radioactivity in the early 20th century numerical (or ldquoabsoluterdquo) ages could be applied to the Geologic Time Scale In this weekrsquos lab you will explore both of these aspects of geologic time
First you will investigate the Geologic Time Scale and examine how features of the geological record ndash species of fossils and other features ndash can be used to correlate geological events In this approach geologic events are placed in a correct sequence and the relative age (which layerstrata is older and which is younger) of the events is determined
You will then explore the concept of half-life One half-life represents the time it takes for half of the radioactive parent isotopes to decay into stable daughter isotopes Numeric ages are calculated from rock samples by comparing the amount of daughter isotope in the rock to the amount of remaining parent isotope because different radiometric isotopes decay at known statistically constant rates Radiometric dating thus provides Earth scientists with a powerful tool to investigate Earth history Goals and Objectives
bull Construct a geologic time scale to gain an understanding of the timing of major events in Earthrsquos history
bull Use fossils to constrain the ages of sedimentary strata and to correlate strata of different thicknesses
bull Develop a conceptual understanding of half-life bull Calculate half-life from counts of decay to daughter atoms bull Determine ages of materials using half-life radioactive decay techniques
Useful websites
bull httpwwwgeosocietyorgsciencetimescaletimesclhtm bull httppubsusgsgovgipfossilssuccessionhtml bull httppubsusgsgovgipgeotimeradiometrichtml bull httpevolutionberkeleyeduevolibraryarticlehistory_23
42
Name____________________________________
Lab Day _____ Lab Time_____________________
Pre-lab Questions ndash Complete these questions before coming to lab 1 Define the following terms prior to arriving at your lab section
A Geologic period
B Stratigraphic correlation
C Parent atom
D Daughter atom
E Isotope 2 Your lab period lasts 110 minutes If your lab instructor spends 20 minutes introducing the
lab and giving instructions what percentage of the lab will you have spent listening to your instructor talk Show your calculations
3 The oldest known crustal rock is 38 billion years old Give this age in millions of years
Show your calculations Include units with the numbers 4 Briefly describe and graphically represent (draw a diagram) the concept of half-life in the
space here
43
Part A mdash Scale Modeling of Geologic Time and Earth History As an introduction to the duration and extent of Earth history you will work in lab groups to build a scale model of significant geologic events Activity Table 1 is a summary of the significant events in Earth history The geologic time interval of the events is given in the last column of the table Use this table as a reference to construct a model of geologic time Using the note cards provided build a physical model of geologic history in the hallway outside the classroom using the floor tiles as a scale for time You must decide the scale to use for your model (for example given the length of the hallway and total number of floor tiles available how many tiles will represent 1 billion years of Earth history or 1 million years) Determine an appropriate model scale and lay out your note cards in the appropriate order and at the appropriate scaled distance along the hallway Your scale should be such that all of the note cards are not piled on top of one another Questions 1 What scale did your group use for the physical model of geologic time (answer in number
of floor tiles billion years)
2 Examine your scale model noting how the spacing of events changes Sketch your model of the geologic time line below with spacing generally to scale
44
Table 1 Summary of Significant Events in Geologic Time (from oldest to youngest)
Years Before Present
Event in Earth History Event occurred during this Geologic Time Interval
46 billion Estimated origin of Earth
Pre
cam
bria
n Ti
me
Beginning of Hadean Eon 38 billion Oldest known crustal rocks Beginning of Archean Eon
30 billion Oldest known fossil life (stromatolites = fossil mats of bacteriablue-green algae) Archean Eon
25 billion Evidence of glaciations climate impact preserved in the rock record (ancient glacial deposits)
Start of Proterozoic Eon
18 billion Multicellular algae preserved in the fossil record Proterozoic Eon
700 million Oldest well-documented worm burrows preserved in rock record Late Proterozoic Eon
540 million
Invertebrate marine organisms abundant (trilobites brachiopods)
Pale
ozoi
c Er
a
Start of the Paleozoic Era Cambrian Period
430 million First jawed fish vertebrates evolve first early land plants Silurian Period
370 million Amphibians evolve (water-land animals) fish abundant Devonian Period
300 million Reptiles evolve amphibians abundant coniferous land forests abundant Carboniferous Period
245 million
Mass extinction event many invertebrates become extinct End of Permian Period
220 million Dinosaurs evolve first mammals evolve
Mes
ozoi
c E
ra Triassic Period (Mesozoic Era)
200 million First birds evolve dinosaur city Jurassic Period (Mesozoic Era)
100 million Flowering plants evolve mammals become very diverse dinosaurs still around Cretaceous Period (Mesozoic Era)
66 million Mass extinction event dinosaurs become extinct (global asteroid impact event)
End of Cretaceous Period (Beginning of Cenozoic Era)
55 million Global greenhouse climate warm and toasty on the planet mammals diversify
Cen
ozoi
c E
ra
Eocene Epoch (Tertiary Period)
35 million Global cooling of climate start of the glacial climate cycles glaciers develop on Antarctica Oligocene Epoch (Tertiary Period)
3 million Hominids (man) evolve from hominoids Pliocene Epoch 2 million Massive ice sheets in North America Start of the Pleistocene Epoch 18 million Homo erectus evolves (precursor to modern) Pleistocene 300000 Homo sapiens evolve Pleistocene Epoch 10000 Modern humans take over Holocene Epoch 0 years You and I sit here thinking about it Late Holocene
45
Part B ndash Time and Stratigraphy For this part of the lab you will use a beaker sediment and fossils to explore the relationship of time and correlation in geology Obtain the materials for this activity Follow the instructions record your observations and answer the questions in the spaces provided Procedure 1 Pour a few centimeters of sand into the beaker Level the sand by gently shaking the jar
from side to side 2 Place an Ordovician fossil on top of the sand layer 3 Pour a few centimeters of gravel on top of the sand and shell 4 Place a Devonian fossil on top of the gravel layer 5 Cover the gravel layer and shell with a few more centimeters of sand 6 On the left side of the diagram below sketch the contents of your beaker actual thickness
Label the two sand layers the gravel layer and the two fossils along with the geologic ages of the fossils
7 Trade beakers with another group or set your beaker by the fossil and sediment supplies 8 Measure the size of an individual grain of sand in millimeters and record the grain size in the
data table (Table 2) Estimate the average size of the gravel in millimeters and record the grain size in the data table (Table 2)
9 Measure the thickness of your layers in millimeters and record in the data table (Table 2) Your Group Other Group (see pg 49 q 8)
46
Table 2 Data table for Time and Stratigraphy activity
Answer the following questions 1 If a bed of sand a single grain in thickness was deposited once each year how long would it
take to form beds with the thickness of the sand layers in your beaker Determine for both lower and upper sand layers Show calculations below and record answers in Table 2 above
2 If the minimum thickness of a gravel bed were a single grain of gravel in thickness how long
would it take to form your gravel layer if one grain-thickness was deposited each year Show calculation below and record answer in Table 2 above
3 Compare the relative age of the lower sand bed to the Ordovician fossil Is the sand
younger or older than the fossil What about the gravel
Layer Grain size
(mm) Thickness
(mm)
Time to deposit layer (years) ndash calculated in
Questions 1 amp 2 below
Upper sand
Gravel
Lower sand
47
For the following questions refer to the Geologic Time Scale Answer in terms of PERIOD listed on Geologic Time Scale not absolute age in millions of years 4 Assuming that the lower fossil in your beaker was deposited in the Ordovician Period what
is the OLDEST that the gravel bed could be (Answer in terms of Period listed on Geologic Time Scale)
5 What is the YOUNGEST that the lower sand bed could be (Answer in terms of Period listed
on Geologic Time Scale) 6 Assuming that the upper fossil was deposited during the Devonian Period what is the
YOUNGEST possible age of the gravel layer (Answer in terms of Period listed on Geologic Time Scale)
7 What is the OLDEST possible age of the upper sand layer (Answer in terms of Period listed
on Geologic Time Scale) 8 Borrow a jar from another group On the right side of the diagram on page 6 sketch and
label the sediment layering in the other grouprsquos jar Draw lines between the columns to CORRELATE (match) the layers fossils and geological ages You have just demonstrated how geologists relate rocks in one area to those in another area
9 Do you think fossil or the type of sediment is more important in correlating of rock units
between different areas Explain your answer
GGeologicc Time Scale
hhttpgeologgycomtime
48
ehtm
49
Part C ndash Exploring the Concept of Half-Life The determination of Earth history by numerical ages is achieved from measurements of
radiometric isotopes found in some rocks and other Earth materials The PARENTDAUGHTER ratio may be used to calculate the absolute age of a rock sample Recall from lecture that numerical (or absolute) ages for geological events are derived from the measurement of certain radioactive isotopes in Earth materials Isotopes are atoms of an element that have differing numbers of neutrons in their nuclei Various isotopes of the chemical elements are radioactive meaning that the nucleus is unstable and decays (disintegrates) by emitting one or more particles which are designated as alpha (α) beta (β) and gamma (γ) This decay usually changes the original radioactive isotope (PARENT) into a different isotope (DAUGHTER) For example 238U 234Th + α
While the time interval before each individual nuclide disintegrates is random each known isotope has a determined half-life value which represents the rate of isotope decay A second half-life is reached when half of the remaining radioactive parent decays and so on Hence half-life is the time during which each nucleus has a 50 chance of disintegrating
In this activity you will explore the basic concept behind radioactive decay and half-life You will need a cup 100 pennies and a calculator for this activity You will treat these pennies as if they were radioactive isotopes that are decaying A penny that lands heads up is a parent isotope and a penny that lands tails up has ldquodecayedrdquo into a daughter isotope Procedure
1 Count your set of pennies to make sure you have 100 For Trial 1 put the pennies into the cup and shake vigorously Pour the pennies out on the table count how many pennies are heads up record result in Table 3 and calculate the percentage of heads up pennies [(heads up)(total of pennies poured out on that trial)] and record in table
2 For Trial 2 put the heads-up pennies back into the cup and set the tails-up pennies aside Repeat step 1 making the same calculation as above and record results in Table 3
3 For Trial 3 put the heads-up pennies back into the cup and set the tails-up pennies
aside Repeat step 2 making the same calculations as above Record results in Table 3
4 Continue this process until the pennies are gone recording the results in Table 3
410
Table 3 Results of penny experiment
Trial Number of Heads of Heads Up in Trial 1 2 3 4 5 6 7 8 9
10
Instructions Plot the results of this experiment on the graphs below (Figures 1 and 2)
On Figure 1 graph the total number of heads-up pennies for each trial On Figure 2 graph the percentage of heads-up pennies for each trial
100 90 80 70 60 50 40 30 20 10
Trial 1 2 3 4 5 6 7 8 9 10
Figure 1 Graph showing the total number of heads up pennies for each trial
100
90
80
70
60
50
40
30
20
10
Trial 1 2 3 4 5 6 7 8 9 10 Figure 2 Graph showing the percent of heads
up pennies in each trial
411
Questions 1 Is your graph of the total number of heads up pennies per trial (Figure 1) a linear or
exponential (curved) relationship Explain why you think the graph has this shape 2 What would be the predicted ratio of heads to tails in each trial Is this prediction verified by
the results of this experiment displayed in Figure 2 3 The number of radiometric parent and daughter isotopes in even a small sample of rock is
huge however statistical errors still must be accounted for This is one source of uncertainty in radiometric dating methodology Make a generalized statement about the statistical reliability of the headstails experiment That is how does the number of pennies used in the experiment increase or decrease the reliability of the results (Notice your results as the number of pennies decreases as you have graphed in figures 1 and 2)
4 How reliable would the results be from an experiment starting with billions of pennies Explain
412
Part D ndash Determining the Half-Life of 137Ba The isotope 137Cs has a half-life of 30 years and decays by the reaction
137Cs 137Ba + β where β is a beta particle (an electron from a nucleus) and 137Ba is an isotope of barium in the excited state The symbol denotes the excess energy that the barium nucleus has after it has formed through beta decay from cesium The barium nucleus loses the excess energy by releasing a gamma particle (high-energy electromagnetic particle) given by the following reaction
137Ba 137Ba + γ The half-life of this nuclear reaction is a few minutes To measure the half-life it is enough to measure the activity of a sample of 137Ba starting from the time it is formed until a significant amount has decayed The 137Ba source is produced by passing an eluting solution (slightly acidic saline solution) through a sample of 137Ba The 137Ba is dissolved into the eluting solution but the 137Cs is not dissolved So the solution contains only 137Ba
Procedure Your instructor will provide the solution to you and assist with the experiment 1 Place 3 drops of eluting solution containing the 137Ba on a watch glass 2 Place the watch glass under the Geiger counter 3 Start recording data by clicking START Record data until the decay rate shown on the
graph stops changing This should take about 10 minutes 4 Click STOP Print enough copies of the graph so that all of your group members have one 5 Draw (by hand) a best-fit curve through the data points on your graph extrapolating
the curve back to where it intersects with the y-axis of the graph Remember a best-fit curve does not connect the data points on the graph Instead a best-fit curve is a smooth curve that comes as close as possible to all of the data points without necessarily going through most of them You will use the graph to analyze the data and answer the questions on the following pages
413
Data Analysis and Questions Follow the directions and complete the table provided below to estimate three independent values for the half-life of 137Ba from your graph of the activity 1 Using your best-fit curve find the count rate at time zero of the data collection run and
record this as the starting count rate value in 1 of Table 2 below Next using the best-fit curve find the count rate that is approximately one-half of the original value and record this as the ending count rate in line 1 of the data table Also record the time at which one-half the original count rate is reached as the time at the end of the interval
2 Enter the ending time and final count rate from 1 as the starting time and count rate for 2 on the data table Use the best-fit curve find the count rate that is approximately one-half of the starting count rate Record this final count rate value as well as the time at which the value is reached
3 For line 3 do not use the ending count of line 2 Instead pick a point near the higher end of the count data along the best-fit curve that is easily divisible by two and record the starting time and this starting count rate in 3 of the data table Find the point on the best-fit curve where the count rate drops to approximately one-half your original count value Record the ending count rate and ending time as before
4 Calculate the half-life of 137Ba for 1 2 and 3 and record in Table 2 Table 2 Table for data analysis and estimation of half-life values
Time at starting count rate (start of interval)
Starting Count Rate (at the start of interval)
Ending Count Rate (half of starting count rate)
Time at ending count rate
Half-life for 137Ba (end time minus start time)
1 00
2
3
1 Do the half-life values agree Explain why or why not
2 Determine the average value for the half-life of 137Ba______________________________
414
Name____________________________________
Lab Day _____ Lab Time_____________________ POST-LAB ASSESSMENT 1 Based on your physical and quantitative models of Earth history assess the importance of
modern humans in the relative framework of biologic and physical evolution of the planet 2 Convert the following decimal values to percents and reduced fractions
Decimal Percent Fraction
050
025
0125
00625
003125
Your prelab diagram of half life may help you visualize the following questions 3 You have 1224 mg of freshly prepared gold-189 half-life 30 min How much of the gold-
189 sample remains after five half-lives 4 A piece of fossilized wood has carbon-14 activity one-eighth that of new wood How old is
the artifact The half-life of carbon-14 is 5730 years 5 A sample of a particular radioisotope is placed near a Geiger counter which is observed to
register 160 counts per minute Eight hours later the detector counts at a rate or 10 counts per minute What is the half-life of the material
5-1
ES 105 Laboratory 5 INTRODUCTION TO CHEMICAL REACTIONS
Introduction
By definition a physical change is one in which only the physical characteristics such as state (gas liquid or solid) size density or color of a substance is changed without changing its composition Ice melting is an example of a physical change (solid to liquid change of state) A chemical change results in the formation of one or more NEW substances with different composition and properties from the original substances When a match burns the ashes and smoke are very different than the original match In todayrsquos lab you will observe a number of different chemical changes
A chemical change is accomplished by rearranging atoms through breaking and reforming of chemical bonds in a chemical reaction The actual rearrangement of atoms ndash bond breaking and reforming ndash is not directly observable Because we cannot see this process we have to use indirect evidence to infer that a chemical change has occurred These indirect lines of evidence include production of gas production of a solid (precipitate) release of heat (exothermic reaction) absorption of heat (endothermic reaction) change in pH andor change of color (unless using indicators to check for acids or bases) Goals and Objectives bull To acquaint students with the nature chemical changes bull To identify whether a chemical change has occurred based on a series of observations bull To study and explore basic types of chemical reactions bull To perform a series of experiments make observations and determine whether a
chemical reaction has occurred Useful Websites
bull httpwwwricedufacultyptiskusreactions bull httpwwwchemtutorcomreacthtm bull httpwwwmcwdnorgchemistpcchangehtml
5-2
Name____________________________________ Lab Day _____ Lab Time_____________________
Pre-Lab Activities Answer the following questions Use the material presented in the lab your lecture materials and text to assist in answering these questions 1 How is a chemical change different from a physical change How can you determine
whether a chemical change has occurred List at least three observations that may indicate a chemical change has occurred
2 In chemistry what is a lsquoreactantrsquo
3 Define endothermic 4 Define exothermic 5 If a reaction container feels warmer after the reaction has occurred was the reaction
endothermic or exothermic
5-3
SAFETY NOTES Be sure to read and understand before proceeding
For safety reasons before you begin this laboratory all books packs and coats
must be stored at the front of the room
Be sure that all of the equipment that should be in your kit is there and that it is clean
and ready to use For some of the reactions it is very important to have clean
equipment and not to introduce contaminants Contamination can produce incorrect
results If you are unable to clean a piece of equipment ask your instructor if you
need to replace it at this time
Be sure to follow instructions carefully Use the proper measurements as indicated
in the instructions Be observant
In some of the experiments you will be mixing acids and water The rule is
ALWAYS ADD ACIDS TO WATER NEVER ADD WATER TO ACIDS
When you are through with the lab be sure that you leave the equipment as you
would like to find it Remember there are many other students using the same
equipment over the course of the quarter
The Golden Rule of Chemistry Labs
LEAVE THE LAB FOR OTHERS AS YOU WOULD HAVE THEM LEAVE IT FOR YOU
WEAR YOUR GOGGLES
5-4
Part A ndash Indicators Chemical fluids are often acidic or alkaline (basic) The pH of a solution describes its
acidic or alkaline character Neutral pH is 7 acidic solutions range from pH 0 to 7 alkaline solutions range from pH 7 to 14 The number comes from the negative log of the hydrogen ion concentration (or pH = mdashlog [H+]) Solutions are characterized as acidic or alkaline according to their pH
Indicators are particular substances added to solutions that change color according to the pH (acidity or alkalinity) of the solution They are highly useful in measuring the pH of a solution quickly and quite accurately Indicators are used in a wide range of fields (environmental forensics petroleum) to determine the concentration of a chemical of interest with great accuracy There are many pH indicators used in chemistry each with their own color changes and active pH range One of the most common pH indicators is phenolphthalein Phenolphthalein is an ionic substance that changes color in solutions that have a particular pH range Activity 1 Pour 1-2 mL of 01 M Sulfuric Acid H2SO4 into a test tube Add 3-4 drops of phenolphthalein solution Place a stopper on the tube and shake gently Record result in Table 1 Do not throw out solution as you will need it for Activity 3 Activity 2 Place 5 mL of distilled water in a large test tube Using your forceps (tweezers) put a small pellet of sodium hydroxide NaOH into your test tube Gently tap the tube in the counter if the pellet is stuck to the side of the tube NEVER HANDLE NaOH WITH YOUR FINGERS It is strongly alkaline and will burn your skin Place a rubber stopper on the test tube and shake gently Remove the stopper and add 3-4 drops of the phenolphthalein solution to the tube Place the stopper back on the test tube and shake it gently Observe the tube for a few minutes Record result in Table 1 below Do not throw out solution as you will need it for Activity 3 Activity 3 Use pH paper (measures the specific range from pH 1 ndash 14) and determine the pH number associated with each solution in Activity 1 and 2 Record results in Table 1 below You are done with the solutions so discard solutions and rinse out test tubes Table 1 pH of solutions Fluid Character
(acidalkaline) Response of phenolphthalein indicator
pH number
Dilute H2SO4
Dilute NaOH
Question 1 Phenolphthalein is an indicator for what pH character
5-5
Part B ndash Studying Chemical Reactions In this part of the lab you will work through a sequence of experiments make observations
and determine whether a chemical reaction has occurred Follow the instructions to do the experiments in the containers specified not in the small tubes containing the reactants As you progress through this portion of the lab complete lsquoTable 2 Observationsrsquo on the following page Allow cloudy solutions to sit in the test tube rack to see if a precipitate settles out Include this information in your observations Experiments 1 Add 5 mL of tap water to a large test tube Grasp the tube by wrapping your hand around it
Notice the temperature of the tube Add ammonium chloride crystals NH4Cl to this test tube Close the tube with a rubber stopper and shake gently Notice the change in temperature of the tube as the crystals dissolve Record your observations in Table 2
2 Pour 1 mL of 01 M potassium bromide KBr into a large clean test tube Add 1 mL of 01 M
sodium chloride NaCl to the KBr Record your observations in Table 2
For reactions 3 and 4 take two clean test tubes 3 place1 mL of 01 M sodium chloride NaCl in one test tube
4 and place 1 mL of 01 M Potassium Chromate K2CrO4 in the other test tube
Add a few drops of 01 M silver nitrate AgNO3 to each Record your observations for each in Table 2
5 Pour 5 mL of 1 M hydrochloric acid HCl into a clean test tube Carefully add a small chip of
calcium carbonate CaCO3 to the acid Record your observations in Table 2 6 Take the test tube containing sodium bicarbonate (baking soda) NaHCO3 from your kit Add
several drops of acetic acid (vinegar) HC2H3O2 Record your observations in Table 2 Complete Table 2 by determining whether a reaction took place for each of the experiments you performed and describe the evidence in support of a reaction taking place
5-6
Table 2 Observations from chemical reaction experiments
Has
a c
hem
ical
re
actio
n oc
curr
ed
Obs
erva
tions
(F
izze
s) (
Prec
ipita
te fo
rms)
(co
lor c
hang
e)
(Tem
pera
ture
Cha
nge)
or
()
Writ
e ch
emic
al n
ames
of
reac
tant
s
(eg
Am
mon
ium
chl
orid
e +
wat
er)
Expe
ri-m
ent
1 2 3 4 5 6
5-7
Questions 1 Which chemical reactions produced a new phase
List by experiment number in the proper column in the table below Some of the reactions may have not created a new phase some may have created more than one new phase
CREATED SOLID PHASE CREATED LIQUID PHASE CREATED GAS PHASE
2 Is a new phase always an indication of a chemical change Explain
3 Which reactions were exothermic (gave off heat) How could you tell
4 Which were endothermic (absorbed heat) How could you tell 5 Is a color change a reliable indicator of a chemical reaction Explain
6 What gas was released in Experiment 5 How might you test for the type of gas released
during a chemical reaction
5-8
Part C ndash Endothermic and Exothermic Reactions In this part of the lab you will use a TEMPERATURE SENSOR interfaced with a computer to study one exothermic reaction and one endothermic reaction
Procedures (wear your googles) Activity 1 Citric acid solution and baking soda
The equation for this reaction is H3C6H5O7 (aq) + 3 NaHCO3 (s) 3 CO2 (g) + 3 H2O (l) + Na3C6H5O7 (aq)
citric acid baking soda
1 Place a Styrofoam cup into the 250 mL beaker as shown in the diagram provided by your instructor Put 30 mL of 15 molar citric acid into the cup Place the temperature sensor into the citric acid solution
2 Weigh out 50 g of solid baking soda on a piece of weighing paper 3 Start recording data by clicking START 4 Wait 20 seconds and then add the baking soda to the citric acid solution Stir gently and
continuously with the temperature sensor to ensure good mixing 5 Use the DataStudio program to record data until the reaction is complete After the data has
been recorded dispose of your reaction products as directed by your instructor Rinse the Temperature sensor with distilled water
Activity 2 Magnesium and hydrochloric acid
The equation for this reaction is Mg (s) + 2 HCl (aq) H2 (g) + MgCl2 (aq)
magnesium hydrochloric acid
1 Measure out 30 mL of 05 molar HCl solution into a second Styrofoam cup and place the Temperature Sensor into the HCl solution
2 Obtain a 20 cm piece of shiny magnesium metal from your instructor 3 Start recording data by clicking START After 20 seconds add the magnesium ribbon to the
acid solution Stir gently and continuously with the temperature sensor to ensure good mixing
4 Use the DataStudio program to record data until the reaction is complete After the data has been recorded dispose of your reaction products as directed by your instructor Rinse the Temperature Sensor with distilled water
5 Click TABLE from the left hand menu Set up your Table display so it shows both experiments
6 Find the minimum and maximum values for temperature for the citric acidbaking soda and the MgHCl experiments Record the initial temperatures in your data table Then record the minimum or maximum value as the final temperature
5-9
Results Calculate the temperature change for each reaction by subtracting the initial temperature from the final temperature
Citric Acid-Baking Soda Hydrochloric Acid-Magnesium
Final Temperature (oC)
Initial Temperature (oC)
Temperature Change (oC) (Use correct sign)
Was reaction Endothermic or Exothermic
Questions about endothermic and exothermic reactions 1 Which reaction had a negative temperature change Is the reaction endothermic or
exothermic Explain 2 For each reaction describe three ways you could tell a chemical reaction was taking place 3 Which reaction took place at a greater rate (produced a temperature change Faster or
Slower) Explain your answer
5-10
Name____________________________________
Lab Day _____ Lab Time_____________________ POST-LAB ASSESSMENT 1 What type of change (physical chemical or both) occurs when ice becomes water
2 When you apply rubbing alcohol to your skin you feel a cooling effect Is a chemical
reaction taking place Explain 3 When you apply hydrogen peroxide to a cut there are bubbles released Is a chemical
reaction taking place Explain 4 What factors affect the rate of a chemical reaction
5 List some chemical reactions that are useful or annoying in your daily life
6-1
ES 105 Laboratory 6 STUDY OF SEDIMENTS AND SEDIMENTARY ROCKS
Introduction Rocks are the materials of Earth and understanding their origin and how they change enables
us to begin to understand Earth and its processes Rocks are aggregates of minerals and are classified into three groups based on the processes that formed them Igneous Sedimentary and Metamorphic This lab focuses on some of the common sedimentary rocks which are formed at the surface of Earth
Sedimentary rocks can form from the consolidation and lithification of particles called sediment Sediment is created either by physical processes breaking pre-existing rocks into smaller particles or by inorganic or organic chemical processes where mineral material is precipitated from solution Sedimentary rocks can also form by the precipitation of mineral material from solutions containing dissolved mineral materials
Sedimentary rocks form at or near Earthrsquos surface in many different environments including oceans (marine) streams (fluvial) lakes (lacustrine) deserts (eolian (wind)) and alpine (glacial) Some sedimentary rocks have features that reveal a great deal about the environment in which they formed For example the degree of rounding of the particles the presence and nature of fossils and the mineral composition may help decipher the conditions in ancient environments These observations provide clues about ancient Earth history and also aid in finding potential fossil fuel deposits
A handful of minerals are commonly found in association with sedimentary rocks including quartz potassium feldspar plagioclase feldspar mica (muscovite and biotite) calcite halite gypsum clay minerals and hematite You will examine most of these minerals at the beginning of this lab activity Goals and Objectives
bull To become familiar with minerals commonly associated with sedimentary rocks bull Investigate the characteristics of sediment grains bull Recognize the classes of sedimentary rocks (Clastic and Chemical) and be able to
distinguish samples of each type bull Classify and name samples of sedimentary rocks by their composition and texture
Useful Websites
bull httpwwwphysicalgeographynetfundamentals10fhtml bull httpwwwwindowsucaredutourlink=earthgeologysed_clastichtml bull httpwwwwindowsucaredutourlink=earthgeologysed_chemicalhtml bull httpreynoldsasueduglg103sed_env_starthtm
6-2
Name____________________________________
Lab Day _____ Lab Time_____________________
Prelab questions Complete prior to arriving at your lab section Define TERMS that are in CAPITAL LETTERS and answer the questions below 1 CLASTIC SEDIMENTARY ROCK (also called detrital sedimentary rock)
2 What is the most common clastic sedimentary rock 3 CHEMICAL SEDIMENTARY ROCK 4 What is the most common chemical sedimentary rock 5 CEMENTATION (of clastic rocks) 6 List common sedimentary rock cements
6-3
Part A ndash Observing Sediment Grains In this part of the lab you will examine examples of common sediment grains with a
magnifying glass record your observations and provide sketches of the grains When you look at each sample of grains notice the shapes sizes distribution of sizes and variety of composition of the grains
bull Grain Shape can be well rounded subrounded subangular and angular bull Grain Size size becomes smaller and more rounded with more time in the
transportation system It is a clue to the environment of deposition Use millimeters (mm) to record the grain sizes
bull Grain Sorting is a term to describe the range of sizes present Well Sorted = grains are all about the same size Moderately Sorted = largest grains are 4 to 5 times the size of the smallest Poorly Sorted = largest grains are 5 to ten times the size of the smallest
bull Grain mineral types Often noting the colors of grains can be useful Include quartz (the most common) feldspar mica and rock fragments Fossils may indicate an adjective (fossiliferous) be added to sedimentary name
bull Cements are the ldquogluerdquo that hold together the grains Include calcite silica iron oxide gypsum and halite
Activity 1 Loose Sediment Grains
Study the samples of sediment grains that have been provided Complete the tables on the following page For each sample describe the general shape of the grains record the average grain size and the range of grain sizes describe the sorting list the grain types (or colors of individual grains) Use Table 1 to suggest (name) what the likely sedimentary rock would be formed from the sediment Also make a simplified sketch of the sediment grains showing the sorting and grain shape
Table 1 Grain sizes of clastic sedimentary rocks
Size descriptions Sediment Particle size Rocks formed from it
Coarse
Fine
Gravel
Boulder gt256 mm (10 in) Conglomerate (rounded grains)
Breccia (angular grains) Cobble 64-256 mm
Pebble 2 to 64 mm
Sand 00625 ( frac124) to 2 mm Sandstone
Mud
Silt 00039 ( frac128) to 00625 mm Siltstone
Clay lt00039 mm Mudstone (massive) Shale (bedded)
6-4
Sample 2 Observations Sketch of the sediment
General shape of grains
Average grain size
Range of grain sizes
Description of sorting
List of grain types
Probable rock type formed
Sample 3 Observations Sketch of the sediment
General shape of grains
Average grain size
Range of grain sizes
Description of sorting List of grain types
Probable rock type formed
Sample 4 Observations Sketch of the sediment
General shape of grains
Average grain size
Range of grain sizes
Description of sorting
List of grain types
Probable rock type formed
Sample 1 Observations Sketch of the sediment General shape of grains
Average grain size
Range of grain sizes
Description of sorting
List of grain types
Probable rock type formed
6-5
Part B ndash Introduction to Classifying Sedimentary Rocks Examine the sedimentary rock study sets provided and answer the following questions 1 Study the set of sedimentary rocks provided Place those that are made of pieces or
fragments of mineral andor rock material (but not the rocks that have shells or shell fragments) on one tray and the rocks made of organic material (like shells or coal) or of crystals on the other tray One group of samples is the CLASTIC SEDIMENTARY ROCKS The other group is the CHEMICAL SEDIMENTARY ROCKS
DO NOT CONTINUE TO (2) BEFORE YOUR INSTRUCTOR CHECKS YOUR WORK 2 In the spaces below list the sample numbers that occur in each group
Clastic Sedimentary Rocks
Chemical Sedimentary Rocks
Keep the rocks on these trays You will be asked to use one tray or the other for Part B 3 Use the clastic rock tray Pick up each specimen and look at the size of the grains (the
fragments of which it is composed) Use a magnifying lens and ruler to measure size of the grains Separate the clastic specimens into two groups based on the grain size those that have large grains (big enough to distinguish without a magnifying lens) from those that have small grains (too small to see individual grains without a magnifying lens) In the spaces below list the sample numbers that occur in each grain-size group
Coarse-grained Clastic Rocks
Fine-grained Clastic Rocks
4 Study one of the coarse-grained clastic rock samples Indicate which one you chose
Describe and sketch this specimen showing the grains and the surrounding material
6-6
5 Use the chemical sedimentary rocks Because they form from a wide variety of processes some chemical sedimentary rocks are Inorganic or crystalline (appear homogeneous) while others consist of Organic material including plant material shells and shell fragments Separate the chemical sedimentary rocks that are crystalline from the ones that are organic and write the specimen number in the table below
Inorganic (or crystalline) Chemical
Sedimentary Rocks
Organic Chemical Sedimentary Rocks
Limestone is the most abundant chemical sedimentary rock It is made of the mineral calcite
Calcite reacts with hydrochloric acid (HCl) When a drop of dilute HCl is placed on calcite it fizzes vigorously This is a good test for limestone Limestone comes in many different varieties which form by numerous processes The calcite can precipitate directly from seawater form as dripstone in cave formations or be incorporated into shells by marine organisms After an organism dies its shell can become calcite sediment Calcite also sometimes precipitates in the spaces between clastic grains as cement to hold the rock together 6 Test all of the sedimentary rocks with HCl and briefly describe your results List the
samples that react to HCl and describe the nature of the fizzing (vigorous or minimal) SAFETY NOTE Although dilute HCl is not dangerous it can irritate skin and occasionally cause damage (small holes) to fabricclothes Be careful when using it Please rinse your table top off if any spilt on it
HCl tests on chemical rocks
HCl tests on clastic rocks
6-7
Part C ndash Classification of Sedimentary Rocks
(NOTE you do not have specimens of every rock included in the classification tables) Activity 1
1 Classification of sedimentary rocks starts with determining if the rock is clastic or chemical
2 Begin your identification by describing the texture (grain size and shape) and composition (color of sediments) of the rocks listed in Table 6
3 Identify the rocks in the study set using the classification charts (Table 2 and 3) and your description
4 Complete Table 4 with the correct rock names including terms that describe special features of note about a rock is appropriate
Clastic Sedimentary Rocks are made from deposits of broken andor weathered rock Clastic rocks are first classified by the size and shape of the particles and secondly by the composition of the particles within the rock
Table 2 Clastic Sedimentary Rock Classification
Particle Size Characteristics Rock Name
gt 2mm (bb size) Grains are angular Breccia (say brech-chia)
Grains are rounded Conglomerate
2 mm to nearly microscopic
Sand grains consisting of pure quartz Quartzose Sandstone
Sand grains consisting of dark fragments and quartz Lithic Sandstone
microscopic Typically layered and soft MudstoneShale
6-8
Chemical Sedimentary Rocks are derived from material that had been dissolved in water They are composed of crystals that precipitated from water by physical or organic processes They may have formed when water evaporated in shallow lakes leaving chemicals behind to form evaporite deposits They are also are formed by organisms extracting dissolved material to create their hard parts For this reason deposits of shell debris or plant material are considered chemical sedimentary rocks In some cases the shell material is easily observable but in other cases the shells cannot be seen without a microscope Note that fossil-rich is used as a descriptor for any rock containing visible fossils
Table 3 Chemical Sedimentary Rock Classification
Mineral Composition Characteristics Rock Name
calcite Fizzes in HCl massive is fine grained oolitic contains small concentric balls
Limestone (use descriptors like massive fossil-rich oolitic)
calcite Dull appearance soft fizzes in HCl Chalk (not included in lab set)
calcite Composed mostly of visible shell fragments has large pore spaces fizzes in HCl
Coquina
quartz group Dense porcelain like sometimes sharp edges hardness = 7 Chert
gypsum Soft hardness = 2 Rock Gypsum (not included in lab set)
halite Translucent cubic cleavage salty taste (do not taste lab samples) Rock Salt (not included in lab set)
opal Dull appearance soft does not fizz Diatomaceous Earth (not included in lab set)
carbonplant material Glassy black brittle low density Coal
6-9
Table 4 Sedimentary Rock Description Table
Rock
Clastic or Chemical
Composition (light or dark grains)
ldquoTexturerdquo Grain Size Grain Shape Grain Sorting Rock Name
1
2
3
4
5
6
7
8
9
10
11
6-10
Name____________________________________
Lab Day _____ Lab Time_____________________ POST LAB ASSESSMENT QUESTIONS
1 List three sedimentary rocks (from table 2 andor 3) that are the most likely to contain fossils Explain why this is so in terms of composition and environment of formation
2 What is a good test to determine if a sedimentary rock is limestone Does this test cause a
physical change or chemical reaction Explain how you can tell 3 Why is the study of sedimentary rocks important for understanding how and where fossil
fuels such as oil natural gas and coal (hydrocarbons) are likely to be found
71
ES 105 Laboratory 7 INTRODUCTION TO TOPOGRAPHIC MAPS
Introduction
Topographic maps contain a wealth of information which can be valuable to those who learn how to use them Topographic maps also called contour maps represent the three-dimensional the surface of Earth on a two-dimensional piece of paper Unlike other maps topographic maps show natural features with a fair degree of accuracy in terms of width length and thickness (height or depth) Geologists make use of topographic maps as a means of studying features in three dimensions By examining the features and symbols of a topographic map a geologist can become familiar with Earth features and draw conclusions about the geologic processes that led to their formation Goals and Objectives bull Become familiar the information available on topographic maps bull Learn to use map scales to find distances bull Visualize the shape of the Earths surface using contour lines and topographic profiles bull Depict the third dimension of Earthrsquos surface from the various elements of topographic maps Useful Websites bull httpwwwtopozonecom bull httptopomapsusgsgov bull httpergusgsgovisbpubsbookletssymbols
72
Name____________________________________ Lab Day _____ Lab Time_____________________
Pre-lab Activities Complete these before coming to lab Find the following unit equivalents
1 mile = ________________ feet 1 km = ________________ meters
1 foot = ________________ inches 1 meter = ________________ centimeters
1 mile = ________________ kilometers 1 km = ________________ miles
1 inch = _______________ centimeters 1 cm = ________________ inches
1 Convert 7920 feet to miles (Hint see following page is you donrsquot know how to do this) Show each step or combined steps needed to complete the conversion
2 If a map has a scale of 124000 how many miles does 75 inches on the map represent
Show your calculations with units
3 If a stream channel is 50 feet lower elevation at one location than at a point 25 miles upstream of that location what is the gradient of the stream between those two sites Show your calculations with units
4 Define the following terms with respect to stream systems
a Velocity
b Discharge
c Gradient
73
Activity 1 Compare this list of steps to convert 15 inches into feet to the table below
1 Write 15 inches as a fraction using a horizontal fraction bar (see 1 in table)
2 Put a multiplication sign after the fraction aligned with the fraction bar Write another fraction bar after the multiplication sign using a horizontal line (see 2 in table)
3 Choose the unit equivalent needed to convert from the information above (see 3)
4 Write the lsquoinchesrsquo part of the unit equivalent on the opposite side of the second fraction bar as lsquoinchesrsquo is in relation to the first fraction bar Write the lsquofeetrsquo part of the unit equivalent on the opposite side of the second fraction bar as its equivalent inches has been written (see 4 in table)
5 Put an equal sign after the expression multiply as indicated and cross out any things found both above and below the fraction bar as a matching pair (both units and factors) Be sure to put the units remaining (feet in this example) after the final product (see 5)
Table 1
1 2 3 4 5
1in 15
times
1in 15 1 foot = 12 inches
in12ft 1
1in 15times ft 251
in 12 ft 1
1in 15
=times
Problems
1 Now use this method to convert 7920 feet to miles You can show each step or combine steps to complete the conversion as show in number 5 of the above table
Use this method to do unit conversions throughout this lab Remember to include units
74
Part A mdash Scale A topographic map is a smaller representation of a larger area The map scale is the
relationship between distance on the map and the corresponding distance on the ground The two types of map scales that are useful to the geologist are ratio and bar scales The ratio scale written 112000 for example means that one inch on the map equals 12000 inches (1000 feet) on the ground A bar scale is a line with units of distance (feet miles kilometers) marked on it The bar scale allows easy conversion of map distances to true ground distance On a topographic map both the ratio scale and the bar scale are provided in the center of the bottom margin Show your calculations and include units with numbers for these questions
1 A ratio scale of 124000 means 1 inch on the map is equal to _____________ inches on the ground
2 Convert ratio scale of 124000 to a verbal scale with 1rdquo =( how many feet)
3 Complete the table below Show calculations with units on the right side of the table
Ratio Scale Verbal Scale Math work
124000 1inch = feet
A ratio scale of 162500 means 1 inch on the map is equal to inches on the ground Convert to 1 inch = how many feet Record below in and show calculations with units
162500 1 inch = feet
Convert a map scale of 1 inch = 1 mile to a ratio scale Record below and show calculations with units
1 1 inch = 1 mile
1 In the space below draw a six inch long line Use a ruler Make this line into a bar scale using
2 inches = 1 mile Subdivide the entire scale into quarter mile sections and label the origin the divisions of the first mile and the whole miles for the rest of the scale
2 On the bar scale above one quarter inch equals ________ miles Convert this to feet Record this in the table below Also determine what is the ratio scale for this bar scale (Hint convert to inches) Show your calculations with units
Verbal Scale Ratio Scale Math work
frac14 inch = 1
75
Part BmdashTopographic Maps Topographic maps use contour lines to depict three-dimensional features on a flat piece of
paper Contour lines connect points of equal elevation on the ground surface which means for example that every point on a 60 foot contour line is 60 feet above sea level Therefore a single contour line on the map shows how and imaginary horizontal plane would intersect the Earths surface are that particular elevation The contour interval is the difference in elevation between two contour lines The contour interval on a given map is constant for the entire map The contour interval chosen depends on roughness of the terrain or relief which is defined as the difference in elevation between the highest and the lowest points on a map
______________________________________________________________________
THE FOLLOWING ARE IMPORTANT RULES ABOUT CONTOUR LINES
1 Every point on a single contour line connects points on the map that are exactly the same
elevation on the ground 2 Contour lines separate areas of higher elevation from areas of lower elevation You can
determine direction of slope of a hill by checking the values of the adjacent contour lines 3 The contour interval (the elevation between two adjacent contour lines of different
elevation) is constant for the topographic map The contour interval is chosen by the map-maker based upon the relief of the map (the difference in elevation from the highest point to the lowest point on the map)
4 Contour lines must be counted consecutively (none can be skipped) Heavier contour lines speed up counting of contour lines usually every fifth contour line is drawn heavier
5 Contour lines never cross each other (except in the very rare case where the mapped area contains an overhanging cliff) Contour lines will merge into a single contour line where mapping a vertical cliff (also a rare occurrence)
6 The spacing of contour lines reflects the steepness of slopes Widely spaced contour lines represent a gentle slope closely spaced contour lines reflect a steeper slope Evenly spaced contour lines represent a uniform slope
7 Contour lines make a V pointing upstream where they cross a channel or valley 8 Depressions (lower elevation areas enclosed within higher elevation areas) are marked by
hachures on the inside of contour lines 9 Contour lines either enclose an area (as a hill top or a depression) or they end at the map
edge On a large enough map they would all make closed forms
Activity 1 Locate areas on the Monmouth quadrangle that shows what is described in Contour Rules (4 6 7 8 and 9) above Discuss locations with lab partners and if you are not able to locate an example of rule PLEASE CHECK WITH LAB INSTRUCTOR
76
Activity 2mdashConstruct a Topographic Map from surveyed data points On Figure 1 draw all the contour lines in pencil using a contour interval of 20 feet If you have a pen put it away and get a pencil (Only one who is perfect in every way contours with a pen) Study the map and locate the higher and lower areas Refer to the rules on the previous page to assist you If you are having trouble see the sample exercises for the last website listed in the introduction to Lab 4 Lightly draw in contour lines starting either at the high elevations or the low elevations Make changes where you realize you missed a feature Use an eraser When you are finished (and satisfied) darken and label the contour values neatly
Figure 1 Topographic map construction
77
Activity 3mdashConstruct a Profile from a Topographic Map Profiles are made to illustrate the shape of the surface of the earth between two designated points These two points are at the ends of the line of profile which is drawn and labeled on the map The line is used in the construction of the profile To construct the profile use each intersection of a contour and the line of profile on the map Project a perpendicular line from this intersection to the horizontal line having the same elevation as that contour line Make a dot on the profile for each intersection of a contour line and the line of the profile as drawn on the contour map Remember to include information implied by the map NOTE where the profile crosses a stream channel the elevation is between two contour lines (The stream channels are shown by dot-dash lines) Hilltops and the ends of the profile also have implied information After all the dots are made on the profile connect the dots by a smooth line which represents the profile of Earths surface On Figure 3 draw a profile for the dashed line A to A in Figure 2 Be sure to label both ends of the profile and the elevations at the side of the profile
Figure 2 Topographic map with profile line drawn and labeled
100
90
80
70
60
50
40
30
20
10
Figure 3 Topographic profile AmdashArsquo from Figure 2
78
Part C mdash Additional Information on Topographic Maps Topographic maps are produced at various scales (124000 163360 etc) that represent different areas of coverage Common sizes are 75 minute and 15 minute (Discontinued) describing latitude and longitude dimensions and are given locality names (such as ldquoMonmouthrdquo) usually for some prominent town or geographic feature in the mapped area In this part of the lab you will study a US Geological Survey quadrangle that illustrates the kind of information available on these maps
Map study and use requires an understanding of latitude and longitude Lines of latitude and longitude form an imaginary grid system with lines that are measured in degrees of arc from a reference Any point on Earth may be pinpointed to its exact location by its latitude and longitude Latitude lines are oriented in an east-west direction They are parallel to one another with the equator designated 0 degrees and increasing in degree measurement to the poles at 90 degrees Those in the northern hemisphere are north latitude and those in the southern hemisphere are south latitude Longitude lines are oriented in a north-south direction and start from 0 degrees at Greenwich England and increase in measurement both east and west up to 180 degrees on the other side of the Earth near the International Date Line Those to the east are called east longitude and those to the west are called west longitude For more exact locations degrees (o) are further broken down into minutes (lsquo) and seconds (ldquo) one degree has 60 minutes (1o=60rsquo) and one minute has 60 seconds (1rsquo=60rdquo)
If you plan to use a compass with a map for navigation is necessary to understand the concept of magnetic declination The compass needle when pointing north actually points to magnetic north the magnetic pole of Earth not to true north or geographic north which is Earths axis of rotation These two norths are not located at the same place and magnetic north moves over time The declination is the angle of correction needed because topographic maps are drawn aligned to geographic north which is toward the top and parallel to the left and right margins of the map Because magnetic north moves knowing the date the declination is accurate is important also Study the Monmouth Oregon Quadrangle and answer the following questions
1 __________________
2 __________________
3__________________
4 __________________
5 __________________
1 Who published this map
2 What year was it published
3 What is the latitude of the northern boundary of this map
4 What is the latitude of the southern boundary of this map
5 How many degrees of latitude are along the eastern edge (HINT subtract southern edge latitude from northern edge latitude)
6 __________________
7 __________________
8__________________
9 __________________
6 What is the longitude of the west side of this map
7 What is the longitude of the east side of this map
8 How many degrees of longitude are along the southern edge
9 What is the contour interval
79
10 _________________
11 _________________
12 _________________
13 _________________
14 _________________
10 How much vertical distance separates the lighter contour lines
11 How much vertical distance separates heavier contour lines
12 What is the highest elevation shown on the map (Look in NE)
13 What is the lowest elevation (Follow river downstream)
14 What is the relief of this map (subtract lowest elevation from the highest elevation)
15 _________________
16a _________________
16b _________________
16c _________________
16d _________________
17a _________________
17b _________________
17c _________________
17d _________________
18 _________________
19 _________________
20 _________________
21a _________________
21b _________________
22 _________________
23 _________________
15 What is the value of the declination (in degrees) shown
In the area to the left sketch how declination is indicated on the map
16 What is the map scale in (Show math work with units here)
a inches to inches
b feet to feet
c inches to feet
d inches to miles
17 What is the name of the quadrangle to the a south
b east
c northwest
d west
18 What is the approximate elevation of the town of Monmouth
19 What is the elevation of the benchmark located at the intersection of
Main St and Monmouth St in Independence
20 How many miles is it along Hwy 99W from Main St in Monmouth
to where 99W crosses the Luckiamute River
21 What is the distance (21a in miles) and (21b in Kilometers)
between the top of Cupids Knoll and Fircrest Cemetery
22 What is the elevation of Cupids Knoll
23 Which side would be easiest to climb Explain why
710
Part D mdash Learning about rivers from topographic maps Note Chucksney Mountain Salem and Sauvie Island Quadrangles are 124000 scale maps
1 On the Chucksney Mountain Quadrangle look at the tributaries that drain into the North Fork of the Middle Fork of the Willamette River (in the Southwest corner of the map) Then look at the width of the Willamette River channel in the Salem and Sauvie Island Quadrangles Does the width of the river channel increase or decrease when going downstream towards the mouth of the Willamette
2 Use the contour lines on the Chucksney Mountain Quadrangle to determine the elevation change from the top to the bottom of one of the tributaries that you observed in the previous question and record the elevation change below (Be sure to look up the contour interval on the map)
3 On the Salem Quadrangle locate Beardsley Bar and Doves Bar along the Willamette River What is the difference in elevation between these two points along the river In what direction is the river flowing
4 Does the gradient of the Willamette River increase or decrease as you go from its upper tributaries downstream towards its mouth
5 What type of stream channel do the tributaries in the Chucksney Mountain Quadrangle have Circle the correct choice below
a Braided stream channel
b Steep gradient bedrock channel
c Low gradient meandering stream channel
6 What type of channel does the Willamette River have in the Monmouth and Salem Quadrangles Circle the correct choice below
a Braided stream channel
b Steep gradient bedrock channel
c Low gradient meandering stream channel
711
Name____________________________________
Lab Day _____ Lab Time_____________________ 7a Post-Lab Assessment
1 Imagine you were hiking with friends and became separated from your hiking companions If you had a topographic map of the area what clues on the topographic map would you use to arrive somewhere where you could be found
2 Would a GPS receiver be able to assist you in finding your location on the map What
information would be helpful 3 What large city is located near 40oN 116oE (Use globe atlas world map GoogleEarth) 4 In what area is 40oN 116oW 5 What coast are you near at 34oN 119oW (Name continent side of it and ocean) 6 What coast are you near at 34oS 119oE (Name continent side of it and ocean)
7 Is it important to include N or S and E or W with latitude and longitude information Why
81
ES 105 Laboratory Additional Activities APPENDIX ndash Additional Laboratory Activities Lab 1 Energy and Energy Transformations
bull No Additional Activities Lab 2 Work Motion Gravity
bull Falling Objects Spark Tape Experiment p 82 - 84 Lab 3 Objects in Motion Landslides
bull Rotational Kinetic EnergyTrack Experiment p 85 - 86 bull Landslide Prediction p 87 bull AccelerationCart Experiment p 88 - 89
Lab 4 Geologic Time
bull Relative Age Dating Exercises p 810 - 814 Lab 5 Chemical Reactions
bull Chemical and Physical Changes p 815 - 816 bull Balancing Chemical Equations p 817 - 819
Lab 6 Sediments and Sedimentary Rocks
bull Overview of Sedimentary Minerals p 820 - 821 bull Depositional Environments p 822 - 823
Lab 7 Topographic Maps
bull Rivers and Topographic Maps p 824 - 825 bull Stream Table Experiments p 826
82
Lab 2 Calculation of Acceleration due to Earthrsquos Gravity
In this activity you will study the motion of a free-falling body Using a special timer the position of the object will be recorded at even intervals of time Letrsquos call the time interval Δt (read as ldquodelta trdquo or ldquochange in timerdquo) We will use the letter y to indicate the position of the object The position at a chosen time will be called y0 After one time interval passes we refer to the objectrsquos position as y1 after two intervals y2 and so forth From the changes in positions we can compute the velocity The average velocity is determined by the change in position per change in time Δt For instance the (average) velocity after four intervals of time have passed v4 is
This equation could be read as lsquothe velocity (after fourth time interval) is the change in position (between the third and fourth time interval) over the change in timersquo Once the average velocities have been calculated these values can be used to determine the average acceleration The slope of the graph of average speed versus time gives the acceleration of the falling object Mathematically the average acceleration after the fourth time interval a4 is described by the following equation
In this part of the lab you will measure the acceleration of a free-falling body using two different methods and devices ndash a spark-tape apparatus and a picket-fencephotogate system Activity 1 Using the spark-tape apparatus to Measure Gravitational Acceleration Procedure We will drop our object a carbon-coated tape approximately 2 meters As the tape falls a spark generator produces sparks at even time intervals These produce marks on the tape representing equal times between each spark The result is pictured below Figure 1 The distance between two successive marks indicates the distance fallen in a particular time interval The time interval Δt is given on the knob on the spark timer It is a fixed time interval (typically Δt = 130 sec = 0033 seconds) Ask your instructor to verify the value for Δt Your instructor will help you drop the tape and produce the marks You should have at least 9 marks on your tape
v y yt4
4 3=minusΔ
a v vt4
4 3=minusΔ
83
y1
y2
y3
y4
y5
y6
y7
Tapersquos initial position(big burned spot)
1st clearly identifiable (position y0)mark after initial position mark
Last spark on tape
Figure 1 Schematic representation of spark tape resulting from free-fall apparatus Note The first mark (the prominent burned one) gives the tapersquos initial position However the weight
was released at a random time Furthermore the second mark may be covered up by the first mark
(What you think is the 2nd mark may actually be the 3rd mark) Hence you canrsquot rely on total elapsed
time or the position of the next mark after the first mark However you can rely the on time intervals t
and distances between successive marks
Analysis Lay the tape flat on the table You may wish to secure it with masking tape Locate the initial mark Now find the next clearly identifiable mark -- probably the 2nd or 3rd mark after the first (prominent) mark This will be position yomdashlabel it accordingly Place a meter stick along the tape in preparation to measure the y-distances (as shown above) from yo to other mark locations See the diagram above Complete Table 1 for at least seven data points (Hopefully you will have more data points than seven) Measure the distances very carefully enter them into your table Be sure to record all your distances in meters NOTICEΔt is always the same value (probably 00333 sec -- but check with your instructor) NOTICE that all the distances in column 2mdashthe lsquoy (meters)rsquo columnmdashmust be in meters Fill out the rest of the table Δt is the same number of seconds for every point
84
Table 1 Δt
(sec) y
(meters) Δy v=ΔyΔt (meterssec)
Δv a=ΔvΔt (meterssec2)
301
y0 = 0 No Data No Data No Data No Data
301
y1 = 01 yy minus = 1v = No Data No Data
301
y2 = 12 yy minus = 2v = 12 vv minus =
301
y3 = 23 yy minus = 3v 23 vv minus =
301
y4 = 34 yy minus = v4= 34 vv minus =
301
y5 = 45 yy minus = v5= 45 vv minus =
301
y6 = 56 yy minus = v6= 56 vv minus =
301
y7 = 67 yy minus = v7= 67 vv minus =
301
y8 = 78 yy minus = v8= 78 vv minus =
301
y9 = 89 yy minus = v9= 89 vv minus =
301
y10 = 910 yy minus = v10= 910 vv minus =
Note about calculations 301
divide is the same as x 30
Compute an average of the accelerations in your table Letrsquos call this number the acceleration due to gravity The acceleration due to gravity is _______________________ in units of ________________ There You did it You measured the acceleration due to gravity
85
Lab 3 Rotational Kinetic Energy Determination
1 Surprise The potential and kinetic energy are not equal because we havenrsquot accounted for the energy lsquolostrsquo during motion of the ball Letrsquos calculate the rotational kinetic energy of the system by using the formula below Show your calculations be sure to include units
2R mv
51 E = ER = _______________ in units of __________________
Now add all of the kinetic energy (EK + ER) ___________________ in units of ____________ 2 How does the sum of kinetic energy (EK + ER) compare to the initial potential energy Is the
total energy conserved What other energy factor(s) havenrsquot we accounted for yet (HINT why does the ball slow down as it is rolling)
3 What would be the potential energy in the system if the ball were positioned at a height of 01
meters Show your calculations be sure to include units (Your answer should be in Joules) Predicting the Final Velocity of the Ball Because the total energy is conserved you know that at the beginning the total energy is only gravitational potential energy At the end of the experiment the ball has no altitude (h = 0 above the horizontal table) so all the energy is in the form of kinetic energy Since the total energy at the beginning must be equal to the total energy at the end we can say
Potential energy (EP) at beginning = Kinetic energy at end (both rolling + translation)
Or mgh = 22KR mv
51mv
21 EE =+=+ This simplifies to mgh = 2mv
107
Solving the above for the final velocity of the ball along the horizontal ramp we find
v gh=107
86
Questions
4 Using the equation v gh=107
calculate the ideal velocity on the horizontal track when the
ball is released on the ramp at h = 003 meters What are the units of the velocity 5 In reality will the velocity be higher or lower than the ideal calculation above Why 6 How did your average velocity (from table 1 pg6) compare with the ideal velocity (as
calculated in question 10 above) Comment on why it is the same or different (HINT there is more than one reason the velocity is not ideal)
7 Without calculating PREDICT what happens to the final velocity if we double the initial
height (h = 006 m) Will the final velocity increase or decrease About how much double one-half or some other value compared to when it is released from h = 003 meters
8 Support your above answer by employing the equation v gh=107
for h = 006 m
That is calculate the final velocity of the ball when it is released from 6 centimeters Be sure show your calculations and report your answer with the appropriate units
87
Lab 3 Energy of Motion and Landslides
PART C mdash Landslide Prediction Examine the cross-sectional sketch below Label in Figure 4 with numbers the positions where you might expect to find the following mass wasting processes
(1) rock fall (ie free-falling rock material) (2) soil creep (slowly moving sediment under the influence of gravity) (3) catastrophic landsliding and (4) zone of little to no chance of mass wasting processes
Figure 4 Landslide prediction diagram Questions 1 What are the chances of your property experiencing a landslide if you live in the Coast
Range of Oregon (for example somewhere between Dallas and Lincoln City) List the critical factors that apply (or donrsquot apply as the case may be) to why you think these are your chances
2 What are the chances of your property experiencing a landslide if you live in the middle of
the Willamette Valley (for example in Salem or Albany) List the critical factors that apply (or donrsquot apply as the case may be) to why you think these are your chances
88
Acceleration of a Cart If a cart moves on a plane that is inclined at an angle θ the component of force acting on the cart in a direction that is parallel to the surface of the plane is the shear force The acceleration of the cart should be given by
a = g sin θ Procedures 1 Before recording any data make sure the Motion Sensor can ldquoseerdquo the cart as it moves 2 Measure the angle the track makes with the table top Record in Table 4 below 3 Place the cart on the low end of the track and have one person start recording Have the
other group member give the cart a gentle push up the inclined plane track so the cart will move toward the Motion Sensor Keep recording as the cart moves away from the sensor
4 Stop recording when the cart returns to the bottom of the track 5 If the plot of data is not smooth check with your instructor to realign the Motion Sensor The
repeat the above procedure until the plot is smooth for the run up and then down the track 6 Erase your practice runs by clicking on the EXPERIMENT menu and selecting DELETE ALL
DATA RUNS Do NOT use the FILE menu and delete the activity 7 You are now ready to collect data Place the cart at the low end of the track Start
recording data Give the cart a gentle push toward the Motion Sensor Continue collecting data until the cart has returned to the bottom of the track This is lsquoRun 1rsquo
8 Set the track to a steeper angle and measure the angle Repeat data recording (Run 2) 9 Open the GRAPH from the left hand menu Select Data Run 1 Choose the plot of velocity
vs time Use the cursor to select the region of the plot that shows the cartrsquos motion after the push and before it stopped at the bottom of the track Determine the slope of the best fit line This slope is the acceleration of the cart (Note Units are ms2)
10 Repeat for Data Run 2 Record all data in Table 1 and answer the questions on the following page
89
Table 1 Acceleration of cart on Inclined plane
Run 1 Run 2
Angle of track (θ)
Experimental Acceleration (slope of velocity time)
Theoretical Acceleration (calculate from a = g sin θ)
Questions 1 What happens to the velocity of the cart as it moves up the inclined plane 2 What happens to the velocity of the cart as it moves down the inclined plane 3 What happens to the acceleration of the cart as it moves up the inclined plane 4 What happens to the acceleration of the cart as it moves down the inclined plane 5 How did the acceleration change when the track became steeper 6 Calculate the theoretical value for the acceleration of the cart based on the trackrsquos angle and
record it in Table 1 7 What is the percent difference between the acceleration determined in the activity and the
theoretical value for acceleration ⎟⎠⎞
⎜⎝⎛ =times differencepercent 100
ltheoreticaalexperiment-ltheoretica
(Show calculations here) 8 What is a possible explanation for the difference in these two values
810
Lab 4 Relative Age Dating Pre-lab Questions for Determining Relative Ages of Geologic Events Define the following terms prior to arriving at your lab section
Stratigraphic correlation
Principle of original horizontality
Principle of stratigraphic superposition
Principle of lateral continuity
Unconformity
Law of cross-cutting relationships
811
Determining Relative Ages of Geologic Events Another technique to determine the relative ages of geological events is the Principle of
Cross-Cutting relationships which states that any geological feature which cuts another geological feature must be younger than the cross-cut feature Stated in simple terms a loaf of bread must be older than the bread slices which transect the loaf
Activity Study the sketch on the following page LIST the sequence of geological events oldest at the bottom and youngest at the top on the table below and cite reasons for this order of events Close ups of significant relationships are shown on the following page (84)
Event Older than Because Younger
than Because
812
HINTS
bull ldquoIrdquo contains inclusions of ldquoJrdquo and ldquoKrdquo bull ldquoIrdquo changes from conglomerate at the bottom to sandstone at the top bull ldquoIrdquo does not include pieces of H
Rock Types Igneous ndash Intrusive Metamorphic
Gneiss Sedimentary
Cong ndash Conglomerate SS ndash Sandstone Sit S ndash Siltstone Sh ndash Shale Ls ndash Limestone
There are details of this cross section on the following page Working on the geologic history of smaller portions first can help you unravel the geologic history of a complicated section like the one above
ldquoBakedrdquo zone of contact metamorphism
813
Angular Unconformity Fault
Intrusions Refolded area
814
Questions Quantify some basic observations on geologic time in the spaces provided (Use dates shown in the ldquoGeologic Time Scalerdquo) Show all of your math work
___________ Based on the data given how old is the Earth (ie what is the total known
time encompassed by geologic history) Answer in billions of years ___________ What is the total duration of the Precambrian Eons (in millions of years) ___________ What is the total duration of the Paleozoic Era (in millions of years) ___________ What is the total duration of the Mesozoic Era (in millions of years) ___________ What is the total duration of the Cenozoic Era (in millions of years) ___________ What percentage of total Earth history is comprised by the Precambrian
Eons ___________ What total percentage of Earth history is marked by the presence of life in
the fossil record Show all of your math work ___________ What total percentage of Earth history is marked by the absence of life in
the fossil record Show all of your math work ___________ Homo habilis is considered by many anthropologists to be the first true
human and lived ~ 2 million years ago What total percentage of Earth history is marked by the presence of human-like species in the fossil record Show all of your math work
___________ What total percentage of Earth history is marked by the presence of
ldquomodern manrdquo Show all of your math work write the answer in scientific notation
___________ Assuming that you live to the ripe old age of 82 what total percentage of
Earth history will be marked by your presence on this planet Show all of your math work write the answer in scientific notation
815
Lab 5 Chemical and Physical Changes Exploring the Differences between Chemical and Physical Changes In this part of the lab you will work through a sequence of experiments make observations and determine whether a chemical or physical change has occurred As you progress through this portion of the lab complete Table 1 Observations on the following page Procedure 1 Take a test tube labeled iron filings and a test tube labeled sulfur from your kit These have
already been pre-weighed for you with 35 grams of the iron filings and 20 grams of sulfur Mix the two completely by grinding them together with a mortar and pestle
2 Divide the mixtures into two piles (ie aliquots) and place each on wax paper 3 Observe one of the aliquots under a magnifying glass and record your observations in table 1 4 Test the same aliquot for magnetism by passing a magnet under the paper (Please do not
remove the magnet from the Ziploc bag) Does the material appear to be magnetic Record your observations in Table 1
5 Now pour each aliquot into a test tube one aliquot into a small Pyrex test tube from your kit
the other aliquot into the soft glass test tube from your kit that is labeled ldquobreakablerdquo (Set this one aside for a few minutes)
6 Add a small amount of water to the first test tube (Pyrex tube not breakable one) cover the
end of the tube with your thumb and shake vigorously Record your observations in Table 1 7 Clean out the mortar bowl and put some cold tap water into the bowl Take the mortar bowl
with water your breakable test tube containing the dry ironsulfur mixture and a test tube clamp to one of the hoods Be sure to wear goggles
8 This step is performed under the hood Gently heat your mixture using the hottest part of
the flame (the inner blue tip) Heat your mixture until the mixture itself (not just the glass of the test tube) is producing a bright orange-red glow throughout the mixture Be patient it may take 5 or more minutes for the mixture to reach this stage Confirm with your instructor when it has reached this stage (to be sure the reaction has proceeded) Immerse the hot end of the tube into the bowl of water before it has a chance to cool This will break the end of the tube and there will be a small but exciting steam explosion
9 Carefully throw the broken glass of the test tube (but not the new compound you just created)
into one of the white glass disposal bins in the lab Using the cooled material that was in the test tube repeat the tests you performed on the original iron and sulfur mixture (examining with a magnifying lens checking the magnetic properties and mixing with distilled water in a large clean test tube) Record your observations in Table 1
816
Clean all the permanent glassware and return all the materials to your kit in a neat and tidy manner Leave the laboratory counter neat and in a condition that you could walk in and begin work immediately if you were in the next lab section Thank you Table 1 Observations of ironsulfur mixture
Material Viewed with magnifying glass
Tested with magnet Properties in water
Before Heating
After Heating
Questions 1 At what point did a chemical change occur How could you tell 2 Based on what you have observed in this laboratory exercise write a conclusion to the
experiment that summarizes how a chemical change differs from a physical change
817
Lab 5 Balancing Chemical Equations Balanced chemical equations are used to describe chemical reactions This equation tells
what substances are involved as reactants and what substances are formed as products In addition the relative proportions of molecules of each of the substances are specified The coefficients in the balanced equation give the mole ratios(comparing the number of molecules) of the various substances From these mole ratios the quantities of reactants required to produce a certain quantity of product can be determined as well as how much product can be expected when given quantities of reactants are utilized
1 Balance the chemical equations listed below by placing the correct coefficient in the space
provided in front of each substance ____ Mg + ____ O2 ____ MgO magnesium oxygen magnesium oxide ____ KIO3 ____ KIO2 + ____ O2 potassium iodate potassium iodide oxygen ____ AgNO3 + ____ Cu ____ CuNO3 + ____ Ag silver nitrate copper copper nitrate silver ___ AgNO3 + ___ NaCl ___ AgCl + ___ NaNO3 silver nitrate sodium chloride silver chloride sodium nitrate
818
Part A ndash Cooking with Chemistry Although you probably have never thought about it you carry out chemical reactions frequently in your kitchenmdashotherwise called cooking In many chemical reactions one reactant is present in a quantity that will limit the amount of products that can be formed This reactant is called the limiting reactant The concept of a limiting reactant will be explored by preparing a confection called SrsquoMORES which is a well-known camperrsquos delight Srsquomores (Sm) are a concoction of graham crackers (Gc) marshmallows (M) and chocolate pieces (Cp) The recipe can be written in the form of a chemical equation
2 Gc + 1 M + 3 Cp 1 Gc2MCp3 Where the reactants (ingredients) are Gc = graham cracker
M = marshmallow Cp = chocolate piece
And the product is Gc2MCp3 = a srsquomore If you were camping you would make a srsquomore by toasting a marshmallow on a stick over the campfire and then putting it between two graham cracker halves with three chocolate pieces When the graham cracker pieces are pressed together the hot marshmallow melts the chocolate and a gooey treat results (You will not be allowed to eat any of your srsquomores due to OSHA regulations and standard laboratory safety procedures) This part of the lab explores the results of adding proportions which differ from those specified by the balanced equation for a chemical reaction From different combinations of reactants you will predict the maximum numbers of srsquomores which can be prepared and test your prediction Procedure There are six different srsquomore stations labeled ldquoArdquo through ldquoFrdquo Be sure that all the reactants for each bag at each station are put back into the bag before proceeding to the next station Recall the proportions of reactants which follow the balanced equation above Record your results in Table 1 on pg 55
1 First use to srsquomore station A From the above proportions determine how many srsquomores
you can make from the reactants provided Write a balanced equation for the reactants in this bag including leftovers Test your prediction by assembling the reactants into srsquomores
2 Using the reactants in station B predict the maximum number of srsquomores which you will be able to prepare Again write the equation and test
3 Repeat Step 2 using the reactants in the stations C D and E
819
Table 1 Srsquomores reactions
Reactants present predicted yield actual yield
A
B
C
D
E
F
4 Write a unit conversion Reactant
moresS for each reactant
5 Predict the maximum number of srsquomores which can be prepared using the reactants in
station F Unit conversion calculations for Station F
Identify the limiting reactant in station F
820
Lab 6 Sedimentary Rock Identification
Part A ndash Overview of Minerals in Sedimentary Rocks As noted in the introduction a small number of minerals are commonly associated with sedimentary rocks including quartz (SiO2) potassium feldspar (KAlSi3O8) plagioclase feldspar (Na AlSi3O8 CaAl2Si2O8) mica (muscovite and biotite) calcite (CaCO3) halite (NaCl) and gypsum (CaSO4H2O) Table 2 is a summary of the diagnostic (ie distinguishing) physical properties that are used to identify these minerals Use the set of mineral identification tools (Table 2 nails pennies dilute HCl your eyes and intellect) and identify the names of the set of unknown mineral samples provided List your results in Table 1 (NOTE There is one example of each mineral so use the process of elimination to your advantage) Table 1 Identification of minerals commonly associated with sedimentary rocks
Sample Number
List of Diagnostic Properties(Used to Identify Each Mineral) Mineral Name
3
5
6
8
10
13
14
15
821
Table 2 Common sedimentary minerals and their diagnostic physical properties ____________________________________________________________________________ Mineral Name Diagnostic Physical Properties Quartz Harder than glass (specimen will scratch glass) SiO2 Glassy to waxy surface appearance (luster) Various colors of milky white clear smoky gray rose Potassium Feldspar Harder than glass (specimen will scratch glass) KAlSi3O8 Breaks into blocky angular pieces
(two directions of cleavage at 90o) Common varieties are salmon pink or white in color Plagioclase Feldspar Harder than glass (specimen will scratch glass) NaAlSi3O8CaAl2Si2O8 Breaks into blocky angular pieces (two directions of cleavage at 90o) Whitish to medium gray in color Parallel striations (lines) commonly visible Mica Softer than fingernail (fingernail will scratch specimen) K[Al2(Mg3 Fe3)](AlSi3O10)(OH)2 Breaks into thin sheetsflakes book-like occurrence Muscovite Mica Clear to silvery in color Breaks into thin silvery flakes
Biotite Mica Brown to black in color Breaks into thin dark flakes Calcite Softer than a penny harder than fingernail CaCO3 Breaks into rhombohedra (three directions of cleavage) Whitish in color Fizzes in dilute hydrochloricacid
(the ldquofizzingrdquo is the result of CO2 release) Halite Softer than a penny harder than fingernail NaCl Breaks into cubes (three directions of cleavage) Clear in color tastes salty (Donrsquot lick lab samples) Gypsum Very soft scratches easily with fingernail CaSO4H2O Clear to white to pink in color
May show three directions of cleavage
822
Figure 1 Environments in which sediments are deposited The diagram is not to scale
1 Abyssal Fan 9 River Channel 2 Deep Sea Floor 10 Delta 3 Reef 11 Lagoon 4 Beach 12 Barrier Island 5 Sand Dunes 13 Continental Shelf 6 Glaciers 14 Submarine Canyon 7 Alluvial Fans 15 Continental Slope 8 Flood Plain 16 Lake
You will refer to this diagram in the post-lab exercise Concentrate on the energy of the environment and the characteristics of the rocks that would form there Think about the way the environment would transport sediment grains the size sorting and shape of the grains the surface features that may be preserved etc You may want to look up some of the terms listed in the diagram in your textbook or from other sources
823
1 Study Figure 1 (previous page) and list at least two environments where the following sedimentary rocks would be deposited Think about the energy necessary to transport the grains Describe the overall characteristic of the depositional environment for each rock type
a SANDSTONE b SHALE
c LIMESTONE
824
d Lab 7Rivers and Topographic Maps Acitivity 1 The Willamette River 1 Describe stream gradient in your own words 2 How can you determine the stream gradient from a topographic map What information do
you need to know Express stream gradient mathematically 3 On the Chucksney Mountain OR Quadrangle determine the gradient of a tributary of the
North Fork of the Middle Fork of the Willamette River Look in the southwest corner of the map and find a stream that drains into the fork of the Willamette Show your calculations Also state the type of channel (see previous page for channel descriptions)
4 Determine the gradient of the Willamette River on the Salem OR Quadrangle between
Beardsley Bar and Doves Bar Show your calculations and describe the channel type 5 Use information on the Sauvie Island OR Quadrangle to determine the gradient of the
Columbia River between the mouth of the Willamette River and the point where it enters the Pacific Ocean Assume the distance between these locations is 100 hundred miles (Hint what is the elevation of the mouth of the Columbia River) Show your calculations
6 Study the gradient channel type and channel size of the three segments of the
WillametteColumbia River system Write a brief paragraph summarizing how these variables change as you move downstream in a river system
825
Activity 2 River Features Examine the Monmouth Oregon Quadrangle which shows many features associated with a moderately large river and answer the following questions
1 Locate the area along the Willamette River east of Independence What is name given to this river-formed feature (HINT Refer to the discussion of channel features earlier in lab)
2 Is this feature likely to change its shapeposition in the future In which direction will it
migrate and how can you tell Should folks in Independence be worried 3 Where would you expect an oxbow lake to form on the Luckiamute River in the near future
Describe location with direction and distance from landmarks Why did you pick this location
4 Several stream terraces are located along the course of the Willamette River associated
with periods of deposition and incision of the valley floor during the Quaternary Using the Monmouth quadrangle try to locate at least two (there are more) of these terraces by stating their general location and an approximate elevation
5 Sketch a topographic profile (cross section) from the top of Davidson Hill southwest across
the valley of the Luckiamute River (south central portion of map) Indicate the type of materials (solid bedrock and alluvial sediment) you would expect to find underlying various portions of your cross section based on their relative elevation slope and position with respect to the Luckiamute River
826
Lab 8 Stream Table Experiment on Sediment Transport Determine Effect of Flow Velocity on Mode of Sediment Transport and Stream Competence Visible sediment grains move through a channel as either bed load (rolling sliding or saltation (ie bouncing like a jumping bean)) or suspended load Reduce the discharge to a minimum by pinching the tube so the current is moving only a few grains
In the table below record how the sand-sized sediment is being transported under Low flow conditions Use some chalk dust to observe suspended load transport under Low flow conditions Increase the discharge to a Medium flow by squeezing the tube about half way Again record your observations for how the sand-sized sediment moving Increase the discharge to High flow by releasing the tube completely Once again record on the table how the sand-sized grains are moving
Table 1 Sediment Transport Record how the sand-sized sediment is being transport for each condition
Discharge Condition
Sand-Sized Bed Load
Sliding Rolling Saltation
LOW
MEDIUM
HIGH
Question 1 Describe how the transport mode and behavior of sand changed under each new flow
condition Consider the amount of grains moving and how the transport mode changed with increasing discharge

11
ES 105 Laboratory 1 ENERGY AND ENERGY TRANSFORMATIONS
Introduction
Energy is an integral and fundamental part of our lives and we often do not realize how
dependent we and our society are on energy Our bodies in order to perform their most basic
biological functions consume large amounts of energy This lab is designed to give you examples
of different types of energy and to demonstrate some of the ways energy can be transformed from
one type to another
One of the main concepts you will be introduced to is the concept of conservation of energy
This important concept tells us that energy is never created or destroyed it can however
be transformed into different types of energy (like motion or heat) During any given energy
conversion an equal amount of energy exists before and after the conversion process There will
be several stations that explain and demonstrate the conservation and conversion of energy You
will see that energy can seem to disappear No process of transforming one type of energy to
another is perfectly efficient and some energy will always be converted into forms that are
inaccessible to us As you tour each station refer to the various sections in this manual that will
lead you through this exploration of energy
Goals and Objectives
bull Investigate the concept of conservation of energy
bull Explain transformation of energy
bull Convert energy from one type to another
Forms of Energy (a few examples)
bull Mechanical (Kinetic)
bull Mechanical (Potential)
bull Electromagnetic (Light)
bull Electromagnetic (other)
bull Heat
bull Chemical
bull Electrical
bull Magnetic
bull Nuclear
P
a
Pre Lab Act
and comple
tivity Fill in
ete Table 1 (
n the blanks
(next page)
s below with
Name____
Lab Day __
h appropria
___________
____ Lab Tim
te Energy F
__________
me________
Forms and T
__________
__________
Transforma
12
_____
_____
ations
13
Pre-Lab Activity (continued) ndash Start Table 1 before coming to lab
Instructions Complete Table 1 before class and compare and contrast answers with your lab group when you arrive in class
Table 1 is provided for you to complete In the left-hand column list as many forms of energy as you can In the right-hand column identify an example To get you started you might recall that electromagnetic waves are one form of energy and an example might be the microwaves in your microwave oven
Table 1
Form of Energy Example
Electromagnetic Waves (light) Microwaves (in your microwave oven)
14
Part A - Conversion of Mechanical Energy into Heat Energy
Conservation of energy is a very important concept The term simply means that energy cannot be created or destroyed - it is conserved There is a finite and unchanging amount of energy in the universe There is however no restriction on converting one form of energy into another (except as per the Second Law of Thermodynamics) There are many devices (or processes) that transform one type of energy to a different type of energy Sometimes it is said that energy is ldquolostrdquo in transforming one kind of energy into another but in reality the ldquolostrdquo energy is only converted into a form that is unavailable to use conveniently Often the ldquolostrdquo energy is in the form of heat that escapes into the surrounding environment
Activity 1 Use the table below extend the list by adding your own entries to the table
Then share your list with the others in your group and compile a lsquomaster listrsquo Table 2 Shows some possible ways that energy can be lost during a conversion
To Convert Into You Might Use Ways Energy Might Be Lost Electrical Light A light bulb The lamp heats up and the heat
escapes into the air
Mechanical (Kinetic)
Electricity An electrical generator
Light Heat A solar collector (that sits in the sun and uses black pipes filled with water)
The water that absorbs the light and converts it to heat begins to boil and this requires a form of chemical energy
Heat Mechanical A steam engine
Chemical Light A chemical reaction
Ultraviolet (UV) Waves
Visible Light Waves
15
Activity 2 Moving hands (Mechanical energy transformed into heat energy) Instructions Press your hands together and rub them back and forth twenty times As you do this press as hard as you can but still allow them to rub together Try to apply the same force throughout this activity As soon as you stop rubbing feel the temperature of your hands
1 What did you observe Explain in terms of energy conservation and conversion
2 Change the amount of frictional force between your two hands by pressing your hands together very lightly (reducing friction) Rub them back and forth twenty times As before feel the temperature of your hands where they touched Were they warmer or cooler than before
3 Compare this observation to the one above Explain in terms of energy conservation and conversion
4 Does reducing the frictional force affect how much mechanical energy is transformed
into heat energy
5 Explain why you put grease (a lubricant) on parts of your bicycle that rub together (eg
wheel bearings) Explain your answer to this question in terms of energy conservation and lost energy
6 Make a short list of things (five things) you encounter every day that convert mechanical
energy (of moving objects) into heat
16
Part B - Conversion of Mechanical and Chemical Energy into Electrical Energy
A generator converts mechanical energy into electrical energy Electrical energy can flow through a wire in the form of an electrical voltage and commonly is used to light a bulb to produce light The light bulb converts the electrical energy into light energy that our eyes can easily detect
Activity 1 Hand crank generator to electric light (Mechanical to Electrical)
This consists of a hand-crank generator to convert mechanical energy to electrical energy and wires to carry the electrical energy (voltage) to a light bulb Instructions
1 Connect one wire-lead from hand generator to light bulb leaving the other wire-lead unconnected (open circuit) Gentle turn the generator and ldquofeelrdquo (gauge) the degree of difficulty Was it (easy moderate or difficult) to turn the crank
2 While turning the crank at the same speed as above connect the other wire-lead to the light (closed circuit) and ldquofeelrdquo (gauge) the degree of difficulty to turn the crank Was it (easy moderate or difficult) to turn the crank
Questions
1 What do you notice about how hard the hand crank turns with respect to a closed circuit (light bulb on) verses an open circuit (light bulb off) Explain why there is a difference
Activity 2 Measuring actual voltage in a closed circuit
Instructions bull For Multimeter black wire-lead connects to COM terminal and red wire-lead connects to
theVmA terminal (check with instructor) bull Connect hand generator wires to each wire of the Multimeter (at direct voltage (DCV) setting of
20) and slowly turn the handle and record the voltage in the table below Repeat for a faster turn Slow Turn Voltage (volts) = Fast Turn Voltage (volts) = Thought Question
1 (Think about and Discuss) How hard (fast) and how long you would need to turn the hand generator to produce enough energy to light a 60 watt light bulb for an hour Or brew a cup of coffee in the morning
17
Activity 3 Comparing chemical (battery) energy to mechanical energy Instructions bull Connect the battery pack to the Multimeter and record the voltage (in table below) using same
settings (Multimeter at direct voltage (DCV) setting of 20) as activity 2 above bull Disconnect the battery pack and connect the hand generator to the Multimeter and try to maintain
a constant turn that replicates the same voltage as the battery pack Now you can FEEL the energy associated with 3-volts
Voltage (volts) with 3-volt (2-battery) pack =
Speed of hand generator (slow medium or fast) associated with 3-volts (2-batteries) =
Questions
1 (Think about and Discuss) How hard (fast) and how long you would need to turn the hand generator to produce enough energy to recharge your cell phone (Typical cell phone batteries are 37 volt and 800 mAhour)
Part C - Conversion of Heat into Mechanical Energy
Figure 1 Apparatus to investigate conversion of heat energy to mechanical energy
Rubber hose
(Test tube)
18
At this station you will convert heat energy into mechanical potential energy To understand how the potential energy is observed consider the U shaped tube in Figure 1 One side of the U-shaped tube is connected to a small reservoir (a test tube) the other end of the U-shaped tube is open to the atmosphere If the pressure in the reservoir is the same as the atmosphere the water level in both sides of the tube will be the same However if the pressure inside the reservoir is larger than the atmospheric pressure the water levels will be different the pressure inside the reservoir tends to push the water out of the tube In lifting the water in the tube the gas in the reservoir does work holding the water up (that is holding it in a non-equilibrium position) requires energy -- mechanical potential energy To make the gas expand (and increase the pressure in the reservoir) we rely on the ideal gas law The Ideal Gas Law states that if you increase the temperature of a gas the pressure will increase To increase the temperature you must transfer heat (energy) into the system
Activity 1 Hot and Cold (thermal energy) converted into Mechanical Energy
Instruction
bull Record the location of the water level on the scale (Measure the level of water on the open end of the glass U tube)
bull Place the air-test tube (reservoir) into the warm water beaker and record the new level of the water in the table below
bull Now place the air-test tube (reservoir) into a beaker of cold water What happens to the water level in the tube when the reservoir is cooled Record your observations in the table
Observations Initial water level on open side of the glass U tube
Water level on open side of the glass U tube in warm water reservoir for 30 sec
Water level on open side of the glass lsquoUrsquo tube after immersing in beaker of cold water
Describe change of water level from previous level
Questions 1 1 Explain your observations recorded in the table in terms of energy conservation and
energy conversion 2 What happens when you leave a blown-up balloon in the sun Give a detailed explanation as
to what happens to such a balloon in terms of energy transfer and conservation of energy
19
Part D mdash Conversion of Light Energy into Electricity Light energy conversion to other types of energy (eg electricity) is never 100 efficient
This station contains a solar cell which directly converts light to electricity with approximately 5 efficiency That is 5 of the light that reaches the panel surface is converted to electricity
Activity 1 Solar to electrical to mechanical
Instructions The small motor connected to the solar cell converts light to electricity and then to mechanical energy
1 Turn 40-watt lamp on and observe if motor (Fan) turns Record how fast fan is turning
2 Turn 75-watt lamp on and observe if motor (Fan) turns Record how fast fan is turning
Questions 1 Which wattage (light bulb) produced the most electricity (turned the fan fastest) 2 Most (95) of the light energy was lost in the process of conversion Where do you suppose
the other 95 of the light energy is going if only 5 is converted to electrical energy Refer to Table 5 below to answer the post-lab question about energy conservation Table 5 Estimates and comparisons of energy usages in your daily lives
Energy Using Activity Is Comparable With
Take a hot bath (full tub) Burning a 100 Watt lamp for a day
Using a 250 watt hair dryer for 8 minutes Riding your bike 30 miles (under ideal conditions)
Heating a pot of water for tea or coffee on the stove
Bench lifting a 50 lb weight 40000 times
Watch TV for an hour Eating a dessert with 250000 calories
Driving your car 45 miles to Portland Playing 13400 games of racquetball
Leaving a 100 watt light burning all night (10 hours)
Dancing the Tango for 45 days nonstop
110
Name____________________________________
Lab Day _____ Lab Time_____________________ POST-LAB ASSESSMENT Comparison of Energy Sources
Questions 1 It is part of our common language to use the term lsquoconserve energyrsquo to mean lsquotry to
consume less energyrsquo Contrast this meaning of lsquoconserve energyrsquo with the physics law of lsquoconservation of energyrsquo
2 All methods of generating electricity have adverse impacts on the environment Try to list at least two ways that each of the following energy sources used to generate electricity negatively impact the environment a) Burning fossil fuels b) Hydroelectric (dams) c) Solar
(Hint you might consider what impact building such plants may have on the environment) 3 Which is you favorite energy source Why
4 Try to stump your lab partner by thinking of a situation where energy is apparently lost for good Write down the ideas you come up with and give your lab partnerrsquos explanation of where the lost energy went
Consider the idea that energy is always conserved and discuss whether people will ever be able to generate power without affecting the planet Record your discussion
2-1
ES 105 Laboratory 2 EXPLORING WORK MOTION AND GRAVITY
Introduction
Work Work is a word used in many different ways It is used to describe our jobs and
careers It is used to describe what we do when we study for an exam However with regards to science that is not what work is The scientific definition of work is a force acting through a distance (Work = Force x Distance) A force is just a ldquopush or a pullrdquo that gives energy to an object sometimes causing a change in motion of the object (Recall from last lab that Energy is the property of a system that enables it to do work) Work is done only when a force moves an object When you push lift or throw an object you are doing work Your force is acting on the object causing it to move a certain distance One important aspect of work to note is the direction of the applied FORCE must be in the same direction of the DISPLACEMENT (movement) for it to be considered WORK
Friction Friction is a resistive force that opposes the motion or attempted motion of an object with which it is in contact In a sense friction is a force that resists (or limits) the work being done as objects are moved Friction always acts in a direction to oppose motion So when an object falls downward through the air the force of friction (referred to as Air Resistance) acts upward There are different types of friction including rolling friction and fluid friction but for the purpose of sliding solid objects across a floor or tabletop the two important types of friction are static and sliding friction The strength of these forces of friction depends upon two factors 1) the types of surfaces involved and 2) how hard the surfaces push together Static friction occurs when you first try to move the object before it is in motion and is a little stronger of a friction force than sliding (or moving) friction once the object is in motion
Gravity and Free Fall ldquoFree-falling objectsrdquo refer to objects that are allowed to fall straight down accelerated ONLY by the force of gravity An object in free fall accelerates as it falls due to the force of gravity (acting as an unbalanced force) Other than the force of gravity what other affects might there be on a falling object The dreaded air resistance is one effect However the effects of air resistance can be ignored as long as the (maximum) velocity of the object is relatively modest For most objects beginning at rest air resistance is negligible throughout the first seconds of fall
In this weekrsquos lab there will be a series of stations that will allow you to explore the motion of objects and how friction affects the motion of both sliding and free-falling objects You will also learn how to calculate the work needed to move objects Your instructor will help you gather data to measure the acceleration of free falling objects due to gravity
There are a few basic measurements and calculations that are necessary to understand the motion of objects and the work needed to move objects These measurements and calculations include
2-2
Distance or Displacement
(d) the distance over which an object moves under the influence of gravity (units of measurement eg centimeters meters kilometers)
Time of Travel (t)
the time during which an object completes its travel (units of measurement eg seconds minutes hours)
Velocity v = dt
the rate of change or displacement (units of measurement eg mileshour meterssec)
Acceleration a = change in velocity time
the rate of change of velocity of an object over time (units of measurement for acceleration are dt2 such as meterssecsec = meterssecond2)
Force (F)
is a push or a pull units generally measured in (Newtons)
Work (w)
is the change in an objectrsquos state of motion that results from the application of a Force
Work (joules) = Force (Newtons) x Displacement (meters)
Power (P)
Is the time rate of work Units generally measured in (watts)
Power (watts) = Work (joules)Time (seconds)
Goals and Objectives
bull Students will be able to perform measurements using a spring scale to determine the force associated with lifting and pulling weight
bull Students will be able to be able to calculate the average work bull Describe what is meant by accelerated motion bull Determine the acceleration of gravity
Useful Websites
bull httpwwwpbsorgwgbhnovagalileo
2-3
Name____________________________________
Lab Day _____ Lab Time_____________________ Pre-Lab Activity Complete the following calculations prior to arrive in lab Show all of your math work and unit conversions (HINT 1 hour = 60 minutes 1 min = 60 seconds 1 km = 1000 m) and (1 kilogram = 1000 grams) 1 If you drive a car for a distance of 35 km and it takes you 45 minutes to do so what is your
average velocity in units of kmhr What is your average velocity in msec 2 Phil has a very messy office and wants rearrange some furniture He needs to move a desk 10
meters If Phil exerts a force of 20 Newtons how much work is he doing 3 What is the Force (in Newtons) associated with a 500 gram weight in free fall near the
Earthrsquos surface (assume acceleration due to Earthrsquos gravity is ~ 10 meterssecond2) (note the 2nd Law of Motion is F(Newtons) = mass(kilograms) x acceleration(metersseconds2)
4 You will be using a Spring-scale to determine the Force associated with moving objects in the
lab Go to Wikepidiaorg (httpenwikipediaorgwikiSpring_scale) and write a brief definition of what a Spring scale is (Be careful to discuss difference between Mass and Force readings)
5 A spring scale measuring the force associated with lifting a 500 gram weight on Earth (3
above) is now used on the Moon What will the Spring scale readings be for Mass and Force associated with the Spring scale reading on the Moon
(assume acceleration due to Moonrsquos gravity is ~16 meterssecond2)
MASS (in grams) FORCE (in Newtons)
2-4
Part A mdash Work Activity 1 Letrsquos Talk Work Instructions
bull Tape a meter stick to an object to keep it vertical bull Use a force spring scale to lift weights of different sizes to the 30 cm mark bull Record your data in the table below bull Use a force spring scale to lift weights of different sizes to the 60 cm mark bull Record your data in the table below
Data Table One
Weights (Grams)
Height (Centimeters)
Distance (Meters)
Force (Newtons)
Work (joules)
100
30
Predict
What will happen to force if weight is raised to 60 cm _____________________
__________________________________________________________________
What will happen to work if weight is raised to 60 cm ______________________
__________________________________________________________________
Now try it and see if your prediction was correct
100
60
200
30
Predict
What will happen to force if weight is raised to 60 cm _____________________
__________________________________________________________________
What will happen to work if weight is raised to 60 cm ______________________
__________________________________________________________________
Now try it and see if your prediction was correct
200
60
Try 500
30
2-5
Questions
1 What does doubling the height (distance moved) do to total work
2 What does doubling the force do to total work Solving Problems Remember to include your units of measurement Some measurements are required to solve
1 Kelsey is a very strong She lifted a 200-gram weight to 50 cm How much work did she do 2 Mario wants to be a super hero He has been practicing for his super hero test by lifting cars If
Mario exerts a force of 12000 Newtons to lift a car 2 meters how much works is being done on the car
Part B mdash Friction Use the spring scale to measure the pulling force (associated with Static and Sliding friction) necessary to move at constant velocity a wood block across different surfaces Add a 200 gram weight to block and measure the pulling force again Record your measurements in Table below
Friction Surfaces Static vs Moving Type of Surface Static Friction
(Newtonrsquos) Moving (Newtonrsquos)
Static with weight
Moving with weight
Smooth-smooth
Smooth-rough
Rough-rough
1 What surface(s) and weight had highest amount of friction Explain your answer Which
was greater Static or sliding friction
2-6
Part C mdash Gravity and the Physics of Free-Falling Bodies Activity 1 Free Fall of Objects with Similar Size but Different Mass Collect two balls of the same size but different weight such as a heavy solid steel ball and a light hollow plastic ball With your lab partners hold both balls simultaneously at a height of one (1) meter above the floor
As a group make a hypothesis (predict) as to which ball will hit the ground first As a group test your hypothesis by releasing the balls at the same time Repeat the experiment several times and describe your results
1 How did the actual results compare to your initial hypothesis What can you conclude about the effects of the Earthrsquos gravity on the heavy and light ball respectively
Activity 2 Free Fall of Unlike Objects In your group repeat activity 1 only this time using a rock and a feather (or piece of paper if you cant find a feather) Hold the rock and feather at a height of 1 m above the floor
As a group make a hypothesis (predict) as to which object will hit the ground first the rock or the feather As a group test your hypothesis by releasing the rock and feather at the same time Repeat the experiment several times and describe your results
2 How did the actual results compare to your initial hypothesis What can you conclude about the effects of the Earthrsquos gravity on the rock and feather respectively
3 How does this activity compare to Activity 1 with two balls of the same size but different
weight Explain the differences andor similarities
2-7
Activity 3 Free Fall in a Vacuum
NOTE Do NOT run the vacuum pump unless it is connected to the lsquoRock and the Featherrsquo tube
As a lab group visit the station that consists of a glass vacuum tube and vacuum pump The apparatus consists of a long tube containing a rock and a bit of paper (or feather depending which tube is available) Air in this tube can be evacuated using the vacuum pump thus creating a vacuum (similar to space) Hold the tube vertically with the valve-end up Hook up the hose to the tube open the valve and turn on the pump After 60-80 seconds all air should be evacuated from the tube Shut the valve turn off the pump and remove the hose With all of the air out of the tube quickly turn the tube end up and hold it vertically while the feather and rock experience free fall Repeat the process several times and note your observations 4 Which object hits first in the vacuum tube the rock or the feather (or piece of paper as the
case may be) 5 How do the vacuum tube results compare with the results from Free Fall Activity 2 (above) 6 Explain processes that influence free-fall of objects under the influence of Earthrsquos gravity
a What are the controlling factors
b How does the Earthrsquos atmosphere affect the free fall of objects under the influence of gravity
c What other force(s) besides gravity is operating on the objects
2-8
Part D mdash Measuring the Earthrsquos Gravitational Acceleration Activity 1 Using the photogate apparatus to Measure Gravitational Acceleration Using a ldquoPHOTOGATErdquo (a light beam with a sensor for light) and a ldquoPICKET FENCErdquo (a clear plastic strip with uniformly spaced opaque bands) the acceleration due to gravity can be determined The photogate head emits an infrared beam from one side of its lsquoUrsquo shape to the other A light-emitting diode (LED) on the top of the Photogate Head blinks to show when an object blocks the beam Timing begins when an object interrupts the infrared beam We will drop our ldquopicket fencerdquo through the photogate head The software calculates the average velocity of the picket fence from one band to the next because the distance from one band to another was programmed into the calculation Before recording data experiment with the photogate and picket fence Procedure 1 Hold the picket fence at one end between your thumb and forefinger so the bottom edge of
the picket fence is just above the photogate beam (see diagram below) Have your partner click START then drop the picket fence through the photogate The computer will begin recording data when the photogate beam is first blocked
2 Click STOP once the entire lsquopicket fencersquo has passed completely through the photogate 3 Make sure the graph shows a diagonal line before moving on If data looks erratic make
sure you are dropping the picket fence vertically not at an angle data will be skewed 4 After your practice runs open the EXPERIMENT menu select DELETE ALL DATA RUNS 5 Using the techniques from above conduct five runs and record them in Table 1 6 Click on GRAPH from the left hand data menu and examine the plot of Velocity versus Time
in the Graph display Determine the slope of the lsquobest fitrsquo line for velocity versus time for each run Record these values in your data table and find the average Include units
Table 1
Run Number Slope of Best Fit Line (acceleration due to gravity)
1
2
3
4
5
AVERAGE
2-9
Name____________________________________
Lab Day _____ Lab Time_____________________
Post-Lab Questions on Acceleration Due to Gravity 1 What can you say about the values for acceleration from Table 1 Is it constant or does it
vary in some consistent manner
2 Compare your values (from Table 1 above) for the acceleration due to gravity g (with the accepted value for g at sea level at the equator of g = 981 ms2
3 What factors may have contributed to the value you determined experimentally being
different from the accepted value List and briefly describe several of these
31
ES 105 Laboratory 3 ENERGY OF OBJECTS IN MOTION and
PHYSICS OF LANDSLIDES
Introduction In this lab we will work with two important aspects of the physics of objects in motion From
lab 1 you should recall that energy can be transformed from one type to another and that energy is never created or destroyed it can however be transformed into different types of energy (like motion or heat) This is known as the concept of conservation of energy This very important concept tells us that an equal amount of energy exists before and after the conversion process Today in lab you will work with converting gravitational potential energy to kinetic In doing so it will seem that energy can disappear No process of transforming one type of energy to another is perfectly efficient and some energy will always be converted into forms that are inaccessible to us
The second key aspect of todayrsquos lab will focus on the physics of landslides Landslides are part of a spectrum of gravity-driven geomorphic processes collectively known as ldquomass wastingrdquo Mass wasting processes include rock fall rock avalanche landslide earth flow debris flow and soil creep The prerequisite conditions for landslides typically include (1) the Earthrsquos gravitational field (a fundamental driving force) (2) the occurrence of loose rock and sediment at the Earthrsquos surface (3) heavy rainfall and (4) steep slopes To understand the occurrence of landslides geologists and engineers must first understand the physics of gravity (ldquoNewtonian physicsrdquo ldquoNewtonrsquos Laws of Gravityrdquo) and how it interacts with materials (rock and sediment) at the Earthrsquos surface This lab provides an introduction to Newtonian physics gravity and the forces that cause landslides
Goals and Objectives
bull Further investigate the concept of conservation of energy bull Investigate the conversion of gravitational potential energy to kinetic energy bull Formulate explanations for energy that can seem to disappear bull Calculate effect of angle of influence on the acceleration of gravity bull Investigate frictional effect on motion
Useful Websites bull httplandslidesusgsgov bull httpwwwfemagovhazardlandslideindexshtm bull httpwwwphysicsclassroomcomClassnewtlawsU2L3ahtml bull httpwwwgrcnasagovWWWK-12airplanenewton2html bull httpenwikipediaorgwikiSineComputation
32
Name____________________________________
Lab Day _____ Lab Time_____________________ Pre-lab Questions 1 Define the following terms andor provide the correct formula prior to attending your lab
A GRAVITATIONAL POTENTIAL ENERGY
B KINETIC ENERGY
C MASS WASTINGLANDSLIDE
D FORCE
E NEWTON (unit of force)
F NEWTONS SECOND LAW OF MOTION
2 Calculate the following values
0o 10o 20o 30o 40o 50o 60o
Sine of angle
Cosine of angle
(If any of your values are negative set your calculator on degrees instead of radians)
33
Part A mdash Energy Transformation and Conservation In closed systems the Law of Conservation of Energy is obeyed It states the total energy
remains constant Another way to say this is that the initial total energy in a closed system is equal to the final total energy In this part of the lab we will examine two types of energy
1mdashTranslational Kinetic Energy = 2mv
21
EK =
where m = mass (kilograms) and v = velocity (msec) Kinetic energy is the energy associated with motion along a line It is measured in Joules [J] which is the same as
2
2
secondmeters kilogramstimes
2mdashGravitational Potential Energy = EP = mgh
where m = mass (kilograms) g = acceleration due to gravity (98 msec2) and h = height above surface (m) Gravitational potential energy is the energy associated with the gravitational pull on an object that is some elevation (h) above a surface (usually Earthrsquos surface) Think of skiing down a slope at the top of the hill you have a large potential energy ndash your elevation h is large As you travel down the hill your elevation decreases so does your potential energy EP = mgh At the bottom of the hill (at an altitude of h = 0) your potential energy is zero Does this mean your energy went to zero No Your potential has been converted into translational kinetic energy and yoursquore zipping along
Instead of skis we will roll a ball down a ramp converting potential energy into kinetic energy At the bottom of the ramp the ball can roll with some friction along a horizontal track We measure the final velocity as the ball traverses one meter along this track By comparing the initial potential energy to the final kinetic energy we will determine if energy is conserved Activity 1 Investigating gravitational potential energy and translational kinetic energy Go to the ramp-track station in the lab It should look like this
Support (Rods and Clamps)
Ramp
Table
Horizontal Track
lsquozerorsquo marker lsquo1 meterrsquo marker
Tape lsquocatcherrsquo
Release Point
h = 003 m
Meter Stick
Figure 1 Apparatus to investigate the conservation of energy
34
Procedures
1 Determine the mass of the ball in grams using one of the balances in the lab Record below
The ballrsquos mass is __________________ g and convert this mass to kilograms record below
__________________ kg 2 Carefully measure a starting point on the ramp that is 3 centimeters above the base of the
horizontal track (H= 003 m) Make sure you are measuring the VERTICAL HEIGHT of the starting point NOT the diagonal length from the base of the ramp
3 One person will release the ball from the previously determined release point Another person in the group will click START to begin recording The program will record the value of position versus time One person must catch the ball before it hits the motion sensor
DO NOT LET THE BALL HIT THE MOTION DETECTOR 4 Repeat this measurement for a total of five trials After each trial use the best fit line tool to
determine the slope of the graph following directions provide below The slope of the position versus time graph is equal to the average velocity of the ball rolling along the horizontal surface Record the velocity for each trial in the data table below (Table 1) Repeat your experiment 5 times and find the average
5 Follow these directions to determine the best fit line a Click the DATA tool button Select NO DATA b Click the DATA tool button again This time choose Run 1 c Click on the SCALE TO FIT button d Using your mouse select data click and hold the left mouse button to draw a box
around the part of the graph that is a smooth diagonal line This part of the graph corresponds to the ball rolling along the horizontal surface The line should be highlighted in yellow
e Now click on the FIT button and select LINEAR Record the slope (m) in Table 1 as the velocity
f Repeat steps a through e for all five trials Be sure to select part of the line for each trial Do not rely on it having yellow highlight Tabulate your data in Table 1
6 Run the experiment again starting the ball at 6 centimeters above the table top and calculate the velocity on the horizontal track in meterssecond Repeat your experiment 5 times and find the average Tabulate your data in Table 2
35
Table 1 Data table for experiment with ball starting at 3 centimeters above the table top
H = ___003__________ meters
In the last column record the velocity from the computer table if you used it to collect your data It is not necessary to record the time if you used the computer to collect your data
Trial Time (seconds) Velocity (msec)
1
2
3
4
5
AVERAGE
If you are using meter stick and manual timer you will need to calculate your velocity Table 2 Data table for experiment with ball starting at 6 centimeters above the table top H = ____006_________ meters In the last column record the velocity from the computer table if you used it to collect your data It is not necessary to record the time if you used the computer to collect your data
Trial Time (seconds) Velocity (msec)
1
2
3
4
5
AVERAGE
If you are using meter stick and manual timer you will need to calculate your velocity
36
Activity 2 Computational Questions Show your calculations be sure to include units in all of the equations on the next three pages 1 Calculate the initial potential energy in the system Ep = mgh (mass x acceleration of
gravity x height) for the ball starting at 3 cm (g = 98 msec2 use units of kg m seconds) 2 What is the final potential energy
(Hint write the equation with values inserted for the variables and remember h = 0 meters)
3 Calculate the final kinetic energy in the system 2K mv
21 E = (That is square of velocity
times the mass divided by 2 Use average velocity from 3 cm height and units of kg m s) 4 What is the initial kinetic energy (when the ball is at the top of the ramp)
(Hint write the equation with the values inserted for the variables) 5 Compare the initial potential energy (from Q 1) and final kinetic energy (from Q 3) Are
they equal (to within your uncertainty) or are they quite a bit different By what factor 6 Law of Conservation of Energy suggests that EP and EK should be equal explain how the
concept of conservation of energy is supported or rejected by the track experiment If rejected what might be the possible reasons
7 Surprise The potential and kinetic energy are not equal because we havenrsquot accounted for
the energy lsquolostrsquo during the rolling (rotational energy) motion of the ball
37
Part B mdash Newtonrsquos Second Law Force and Landslide Analysis Landslides are driven by the Earthrsquos force of gravity acting on a mass of rock or sediment on an inclined hillslope The critical analytical parameters include
Symbol Name Description Units
F Force of Gravity The pulling action on an object due to Earthrsquos gravity
Newton N = 1 kg-msec2
g Acceleration due to gravity
Constant on the Earth g = 983 msec2 msec2
m Mass Amount of material measured in kilograms
kg
θ Angle of Slope Angle of hill-slope inclination (90 degrees = sheer cliff face 0 degrees = flat surface)
degrees
Newtonrsquos second law of gravity states that the force operating on an object in space is directly proportional to the product of its mass and acceleration Newtonrsquos second law translates into the following equation
F = ma where F = force (Newton) m = mass (kg) and a = acceleration (msec2)
When Earthrsquos gravity is considered ldquoFrdquo is equivalent to ldquoweightrdquo (eg your weight on a scale is a measure of the Earthrsquos gravitational pull on your body mass the more mass you have the more you weigh) and ldquoardquo is equivalent to ldquogrdquo which is the acceleration due to gravity (a constant = 98 msec2) In terms of Earthrsquos gravitational pull Newtonrsquos second law is translated as
Wt = mg where Wt = weight of an object (Newtons) m = mass of object (kg) and g = acceleration due to gravity (g = 98 msec2)
This part of the lab is particularly relevant because the Willamette Valley represents one of
the most dynamic and spectacular geologic environments in the United States Intense seasonal rainfall patterns steep mountain slopes and expansive valleys provide for an active geomorphic setting associated with seasonal flooding and landslides Annual cost of damage to public and private lands in western Oregon ranks among the top 20 of the most severe in the United
38
States Damage to public infrastructure from storm events during the mid-1990rsquos alone totaled hundreds of millions of dollars Landslides accounted for a large portion of this damage Slope failure and erosion in the Coast Range are further exacerbated by sustained timber harvesting and the Willamette Valley is experiencing unprecedented population growth and development invading the foothills Understanding of the spatial and temporal distribution of landslides is critical for the appropriate design of land-use regulations hazards mitigation and conservation planning (read this as ldquoYour house could be next How do you know if you are at risk for landslide and what can you do about itrdquo)
Application of Newtonrsquos Second Law With your lab group visit the inclined plane station and examine the apparatus A mass of rock is sitting on an inclined plane this is analogous to a mass of rock on a hill-slope in the Coast Range or western Cascades The figure below illustrates the forces acting on the slope material
Figure 2 Diagram of forces of weight Definitions for Particle on Slope
θ = slope angle relative to horizontal plane (units in degrees) Wt = weight of particle or mass of material (units in N) = mass x gravity Shear force parallel to slope = Wt x sin θ (units in N) Normal force perpendicular to slope = Wt x cos θ (units in N)
Equations for Particle on Slope
Wt (weight of particle in Newtons) = mg (= mass times acceleration of gravity) SHEAR force (in N) = Wt (sin θ) NORMAL force (in N) = Wt (cos θ)
39
Activity 1 Force Analysis of a Rock Mass on a Slope (Inclined Plane) Questions Given that shear force is oriented down slope and normal force is oriented perpendicular to slope answer the following questions (refer to the inclined plane drawing above) 1 Which of the two forces (shear or normal) will drive the rock-block down slope when it fails 2 Which of the two forces will tend to resist down-slope movement of the rock mass 3 When do you think the block will begin sliding down the slope (Circle one comparison) shear = normal shear lt normal shear gt normal
Instructions
1 Determine the mass of our block-of-rock sample by using the balance in the room a Mass of Rock Block kg (HINT 1 kg = 1000 g)
b Weight of Rock Block N (Newtons) Show Calculations
2 Place the rock on the inclined plane and slowly lift the board to determine the critical
angle at which it slides down the slope (tilt the plane until the rock begins to slide) Record the angle in Table 3
3 Now repeat the experiment with various types of surfaces Record the angles in Table 3 Reduced friction Tape wax paper to the rock (place it between rock and wood) Increased friction Tape a piece of sand paper (place it between rock and wood)
Figure 3 Critical Angle apparatus
310
Table 3 Critical Angle of sliding for various surfaces
Condition of Inclined plane
Critical Angle of sliding (degrees)
Normal Force at Critical Angle
Wt x (cos θ)
Shear Force at Critical Angle Wt x (sin θ)
Rock on Wood
Rock on Wax Paper
Rock on Sandpaper
4 Calculate the normal force and shear force of the critical anglesmdashbe sure your calculator is
using degrees not radians to calculate the sine and cosine of angle θ Record in Table 3 5 How do inclined-plane results (Table 3) compare to your prediction in question 3 above 6 List some ideas as to what other physical factors may be important to slope failure that are
not part of the above equations for slope analysis
7 Based on your experiments above discuss the effects of surface friction on the critical hill slope angle at which landslides occur
8 In the absence of wax paper and sand paper on hill slopes in the natural environment what
types of factors will influence the frictional conditions and critical angles at which hill slopes fail
311
Name____________________________________
Lab Day _____ Lab Time_____________________
Post-Lab Assessment Calculations 1 Imagine you have placed yourself on a balance and determined that your body mass is
100 kg Calculate your weight in units of Newtonrsquos (hint 1 N = 1 kgmsec2) Show all of your math work keep units with numbers
2 A car has a mass of 1000 kg and the net force exerted on the car is 0 N Use Newtons
2nd Law to calculate the acceleration of the car in msec2 Show all of your math work keep units with numbers
3 A rocket has a mass of 1000 kg and the net force exerted by the rocket engine is 2000 N
Use Newtons 2nd Law to calculate the acceleration of the rocket in msec2 Show all of your math work
Questions 1 What effect will clear-cut logging of trees have on slope stability in the Coast Range
Explain your answer in the context of todays lab experiments 2 Write a 5-10 sentence summary of the critical factors that affect landslide susceptibility in
western Oregon Think about the conditions necessary for landslides to occur and the factors that affect the critical thresholds at which they begin
41
ES 105 Laboratory 4 UNDERSTANDING GEOLOGIC TIME
Relative Dating and Fossils Radioactivity and Numerical Age Determination
Introduction The Geologic Time Scale was developed using two approaches In the first rock units were
studied and correlated between geographically distant areas using the principle of faunal succession With the discovery of radioactivity in the early 20th century numerical (or ldquoabsoluterdquo) ages could be applied to the Geologic Time Scale In this weekrsquos lab you will explore both of these aspects of geologic time
First you will investigate the Geologic Time Scale and examine how features of the geological record ndash species of fossils and other features ndash can be used to correlate geological events In this approach geologic events are placed in a correct sequence and the relative age (which layerstrata is older and which is younger) of the events is determined
You will then explore the concept of half-life One half-life represents the time it takes for half of the radioactive parent isotopes to decay into stable daughter isotopes Numeric ages are calculated from rock samples by comparing the amount of daughter isotope in the rock to the amount of remaining parent isotope because different radiometric isotopes decay at known statistically constant rates Radiometric dating thus provides Earth scientists with a powerful tool to investigate Earth history Goals and Objectives
bull Construct a geologic time scale to gain an understanding of the timing of major events in Earthrsquos history
bull Use fossils to constrain the ages of sedimentary strata and to correlate strata of different thicknesses
bull Develop a conceptual understanding of half-life bull Calculate half-life from counts of decay to daughter atoms bull Determine ages of materials using half-life radioactive decay techniques
Useful websites
bull httpwwwgeosocietyorgsciencetimescaletimesclhtm bull httppubsusgsgovgipfossilssuccessionhtml bull httppubsusgsgovgipgeotimeradiometrichtml bull httpevolutionberkeleyeduevolibraryarticlehistory_23
42
Name____________________________________
Lab Day _____ Lab Time_____________________
Pre-lab Questions ndash Complete these questions before coming to lab 1 Define the following terms prior to arriving at your lab section
A Geologic period
B Stratigraphic correlation
C Parent atom
D Daughter atom
E Isotope 2 Your lab period lasts 110 minutes If your lab instructor spends 20 minutes introducing the
lab and giving instructions what percentage of the lab will you have spent listening to your instructor talk Show your calculations
3 The oldest known crustal rock is 38 billion years old Give this age in millions of years
Show your calculations Include units with the numbers 4 Briefly describe and graphically represent (draw a diagram) the concept of half-life in the
space here
43
Part A mdash Scale Modeling of Geologic Time and Earth History As an introduction to the duration and extent of Earth history you will work in lab groups to build a scale model of significant geologic events Activity Table 1 is a summary of the significant events in Earth history The geologic time interval of the events is given in the last column of the table Use this table as a reference to construct a model of geologic time Using the note cards provided build a physical model of geologic history in the hallway outside the classroom using the floor tiles as a scale for time You must decide the scale to use for your model (for example given the length of the hallway and total number of floor tiles available how many tiles will represent 1 billion years of Earth history or 1 million years) Determine an appropriate model scale and lay out your note cards in the appropriate order and at the appropriate scaled distance along the hallway Your scale should be such that all of the note cards are not piled on top of one another Questions 1 What scale did your group use for the physical model of geologic time (answer in number
of floor tiles billion years)
2 Examine your scale model noting how the spacing of events changes Sketch your model of the geologic time line below with spacing generally to scale
44
Table 1 Summary of Significant Events in Geologic Time (from oldest to youngest)
Years Before Present
Event in Earth History Event occurred during this Geologic Time Interval
46 billion Estimated origin of Earth
Pre
cam
bria
n Ti
me
Beginning of Hadean Eon 38 billion Oldest known crustal rocks Beginning of Archean Eon
30 billion Oldest known fossil life (stromatolites = fossil mats of bacteriablue-green algae) Archean Eon
25 billion Evidence of glaciations climate impact preserved in the rock record (ancient glacial deposits)
Start of Proterozoic Eon
18 billion Multicellular algae preserved in the fossil record Proterozoic Eon
700 million Oldest well-documented worm burrows preserved in rock record Late Proterozoic Eon
540 million
Invertebrate marine organisms abundant (trilobites brachiopods)
Pale
ozoi
c Er
a
Start of the Paleozoic Era Cambrian Period
430 million First jawed fish vertebrates evolve first early land plants Silurian Period
370 million Amphibians evolve (water-land animals) fish abundant Devonian Period
300 million Reptiles evolve amphibians abundant coniferous land forests abundant Carboniferous Period
245 million
Mass extinction event many invertebrates become extinct End of Permian Period
220 million Dinosaurs evolve first mammals evolve
Mes
ozoi
c E
ra Triassic Period (Mesozoic Era)
200 million First birds evolve dinosaur city Jurassic Period (Mesozoic Era)
100 million Flowering plants evolve mammals become very diverse dinosaurs still around Cretaceous Period (Mesozoic Era)
66 million Mass extinction event dinosaurs become extinct (global asteroid impact event)
End of Cretaceous Period (Beginning of Cenozoic Era)
55 million Global greenhouse climate warm and toasty on the planet mammals diversify
Cen
ozoi
c E
ra
Eocene Epoch (Tertiary Period)
35 million Global cooling of climate start of the glacial climate cycles glaciers develop on Antarctica Oligocene Epoch (Tertiary Period)
3 million Hominids (man) evolve from hominoids Pliocene Epoch 2 million Massive ice sheets in North America Start of the Pleistocene Epoch 18 million Homo erectus evolves (precursor to modern) Pleistocene 300000 Homo sapiens evolve Pleistocene Epoch 10000 Modern humans take over Holocene Epoch 0 years You and I sit here thinking about it Late Holocene
45
Part B ndash Time and Stratigraphy For this part of the lab you will use a beaker sediment and fossils to explore the relationship of time and correlation in geology Obtain the materials for this activity Follow the instructions record your observations and answer the questions in the spaces provided Procedure 1 Pour a few centimeters of sand into the beaker Level the sand by gently shaking the jar
from side to side 2 Place an Ordovician fossil on top of the sand layer 3 Pour a few centimeters of gravel on top of the sand and shell 4 Place a Devonian fossil on top of the gravel layer 5 Cover the gravel layer and shell with a few more centimeters of sand 6 On the left side of the diagram below sketch the contents of your beaker actual thickness
Label the two sand layers the gravel layer and the two fossils along with the geologic ages of the fossils
7 Trade beakers with another group or set your beaker by the fossil and sediment supplies 8 Measure the size of an individual grain of sand in millimeters and record the grain size in the
data table (Table 2) Estimate the average size of the gravel in millimeters and record the grain size in the data table (Table 2)
9 Measure the thickness of your layers in millimeters and record in the data table (Table 2) Your Group Other Group (see pg 49 q 8)
46
Table 2 Data table for Time and Stratigraphy activity
Answer the following questions 1 If a bed of sand a single grain in thickness was deposited once each year how long would it
take to form beds with the thickness of the sand layers in your beaker Determine for both lower and upper sand layers Show calculations below and record answers in Table 2 above
2 If the minimum thickness of a gravel bed were a single grain of gravel in thickness how long
would it take to form your gravel layer if one grain-thickness was deposited each year Show calculation below and record answer in Table 2 above
3 Compare the relative age of the lower sand bed to the Ordovician fossil Is the sand
younger or older than the fossil What about the gravel
Layer Grain size
(mm) Thickness
(mm)
Time to deposit layer (years) ndash calculated in
Questions 1 amp 2 below
Upper sand
Gravel
Lower sand
47
For the following questions refer to the Geologic Time Scale Answer in terms of PERIOD listed on Geologic Time Scale not absolute age in millions of years 4 Assuming that the lower fossil in your beaker was deposited in the Ordovician Period what
is the OLDEST that the gravel bed could be (Answer in terms of Period listed on Geologic Time Scale)
5 What is the YOUNGEST that the lower sand bed could be (Answer in terms of Period listed
on Geologic Time Scale) 6 Assuming that the upper fossil was deposited during the Devonian Period what is the
YOUNGEST possible age of the gravel layer (Answer in terms of Period listed on Geologic Time Scale)
7 What is the OLDEST possible age of the upper sand layer (Answer in terms of Period listed
on Geologic Time Scale) 8 Borrow a jar from another group On the right side of the diagram on page 6 sketch and
label the sediment layering in the other grouprsquos jar Draw lines between the columns to CORRELATE (match) the layers fossils and geological ages You have just demonstrated how geologists relate rocks in one area to those in another area
9 Do you think fossil or the type of sediment is more important in correlating of rock units
between different areas Explain your answer
GGeologicc Time Scale
hhttpgeologgycomtime
48
ehtm
49
Part C ndash Exploring the Concept of Half-Life The determination of Earth history by numerical ages is achieved from measurements of
radiometric isotopes found in some rocks and other Earth materials The PARENTDAUGHTER ratio may be used to calculate the absolute age of a rock sample Recall from lecture that numerical (or absolute) ages for geological events are derived from the measurement of certain radioactive isotopes in Earth materials Isotopes are atoms of an element that have differing numbers of neutrons in their nuclei Various isotopes of the chemical elements are radioactive meaning that the nucleus is unstable and decays (disintegrates) by emitting one or more particles which are designated as alpha (α) beta (β) and gamma (γ) This decay usually changes the original radioactive isotope (PARENT) into a different isotope (DAUGHTER) For example 238U 234Th + α
While the time interval before each individual nuclide disintegrates is random each known isotope has a determined half-life value which represents the rate of isotope decay A second half-life is reached when half of the remaining radioactive parent decays and so on Hence half-life is the time during which each nucleus has a 50 chance of disintegrating
In this activity you will explore the basic concept behind radioactive decay and half-life You will need a cup 100 pennies and a calculator for this activity You will treat these pennies as if they were radioactive isotopes that are decaying A penny that lands heads up is a parent isotope and a penny that lands tails up has ldquodecayedrdquo into a daughter isotope Procedure
1 Count your set of pennies to make sure you have 100 For Trial 1 put the pennies into the cup and shake vigorously Pour the pennies out on the table count how many pennies are heads up record result in Table 3 and calculate the percentage of heads up pennies [(heads up)(total of pennies poured out on that trial)] and record in table
2 For Trial 2 put the heads-up pennies back into the cup and set the tails-up pennies aside Repeat step 1 making the same calculation as above and record results in Table 3
3 For Trial 3 put the heads-up pennies back into the cup and set the tails-up pennies
aside Repeat step 2 making the same calculations as above Record results in Table 3
4 Continue this process until the pennies are gone recording the results in Table 3
410
Table 3 Results of penny experiment
Trial Number of Heads of Heads Up in Trial 1 2 3 4 5 6 7 8 9
10
Instructions Plot the results of this experiment on the graphs below (Figures 1 and 2)
On Figure 1 graph the total number of heads-up pennies for each trial On Figure 2 graph the percentage of heads-up pennies for each trial
100 90 80 70 60 50 40 30 20 10
Trial 1 2 3 4 5 6 7 8 9 10
Figure 1 Graph showing the total number of heads up pennies for each trial
100
90
80
70
60
50
40
30
20
10
Trial 1 2 3 4 5 6 7 8 9 10 Figure 2 Graph showing the percent of heads
up pennies in each trial
411
Questions 1 Is your graph of the total number of heads up pennies per trial (Figure 1) a linear or
exponential (curved) relationship Explain why you think the graph has this shape 2 What would be the predicted ratio of heads to tails in each trial Is this prediction verified by
the results of this experiment displayed in Figure 2 3 The number of radiometric parent and daughter isotopes in even a small sample of rock is
huge however statistical errors still must be accounted for This is one source of uncertainty in radiometric dating methodology Make a generalized statement about the statistical reliability of the headstails experiment That is how does the number of pennies used in the experiment increase or decrease the reliability of the results (Notice your results as the number of pennies decreases as you have graphed in figures 1 and 2)
4 How reliable would the results be from an experiment starting with billions of pennies Explain
412
Part D ndash Determining the Half-Life of 137Ba The isotope 137Cs has a half-life of 30 years and decays by the reaction
137Cs 137Ba + β where β is a beta particle (an electron from a nucleus) and 137Ba is an isotope of barium in the excited state The symbol denotes the excess energy that the barium nucleus has after it has formed through beta decay from cesium The barium nucleus loses the excess energy by releasing a gamma particle (high-energy electromagnetic particle) given by the following reaction
137Ba 137Ba + γ The half-life of this nuclear reaction is a few minutes To measure the half-life it is enough to measure the activity of a sample of 137Ba starting from the time it is formed until a significant amount has decayed The 137Ba source is produced by passing an eluting solution (slightly acidic saline solution) through a sample of 137Ba The 137Ba is dissolved into the eluting solution but the 137Cs is not dissolved So the solution contains only 137Ba
Procedure Your instructor will provide the solution to you and assist with the experiment 1 Place 3 drops of eluting solution containing the 137Ba on a watch glass 2 Place the watch glass under the Geiger counter 3 Start recording data by clicking START Record data until the decay rate shown on the
graph stops changing This should take about 10 minutes 4 Click STOP Print enough copies of the graph so that all of your group members have one 5 Draw (by hand) a best-fit curve through the data points on your graph extrapolating
the curve back to where it intersects with the y-axis of the graph Remember a best-fit curve does not connect the data points on the graph Instead a best-fit curve is a smooth curve that comes as close as possible to all of the data points without necessarily going through most of them You will use the graph to analyze the data and answer the questions on the following pages
413
Data Analysis and Questions Follow the directions and complete the table provided below to estimate three independent values for the half-life of 137Ba from your graph of the activity 1 Using your best-fit curve find the count rate at time zero of the data collection run and
record this as the starting count rate value in 1 of Table 2 below Next using the best-fit curve find the count rate that is approximately one-half of the original value and record this as the ending count rate in line 1 of the data table Also record the time at which one-half the original count rate is reached as the time at the end of the interval
2 Enter the ending time and final count rate from 1 as the starting time and count rate for 2 on the data table Use the best-fit curve find the count rate that is approximately one-half of the starting count rate Record this final count rate value as well as the time at which the value is reached
3 For line 3 do not use the ending count of line 2 Instead pick a point near the higher end of the count data along the best-fit curve that is easily divisible by two and record the starting time and this starting count rate in 3 of the data table Find the point on the best-fit curve where the count rate drops to approximately one-half your original count value Record the ending count rate and ending time as before
4 Calculate the half-life of 137Ba for 1 2 and 3 and record in Table 2 Table 2 Table for data analysis and estimation of half-life values
Time at starting count rate (start of interval)
Starting Count Rate (at the start of interval)
Ending Count Rate (half of starting count rate)
Time at ending count rate
Half-life for 137Ba (end time minus start time)
1 00
2
3
1 Do the half-life values agree Explain why or why not
2 Determine the average value for the half-life of 137Ba______________________________
414
Name____________________________________
Lab Day _____ Lab Time_____________________ POST-LAB ASSESSMENT 1 Based on your physical and quantitative models of Earth history assess the importance of
modern humans in the relative framework of biologic and physical evolution of the planet 2 Convert the following decimal values to percents and reduced fractions
Decimal Percent Fraction
050
025
0125
00625
003125
Your prelab diagram of half life may help you visualize the following questions 3 You have 1224 mg of freshly prepared gold-189 half-life 30 min How much of the gold-
189 sample remains after five half-lives 4 A piece of fossilized wood has carbon-14 activity one-eighth that of new wood How old is
the artifact The half-life of carbon-14 is 5730 years 5 A sample of a particular radioisotope is placed near a Geiger counter which is observed to
register 160 counts per minute Eight hours later the detector counts at a rate or 10 counts per minute What is the half-life of the material
5-1
ES 105 Laboratory 5 INTRODUCTION TO CHEMICAL REACTIONS
Introduction
By definition a physical change is one in which only the physical characteristics such as state (gas liquid or solid) size density or color of a substance is changed without changing its composition Ice melting is an example of a physical change (solid to liquid change of state) A chemical change results in the formation of one or more NEW substances with different composition and properties from the original substances When a match burns the ashes and smoke are very different than the original match In todayrsquos lab you will observe a number of different chemical changes
A chemical change is accomplished by rearranging atoms through breaking and reforming of chemical bonds in a chemical reaction The actual rearrangement of atoms ndash bond breaking and reforming ndash is not directly observable Because we cannot see this process we have to use indirect evidence to infer that a chemical change has occurred These indirect lines of evidence include production of gas production of a solid (precipitate) release of heat (exothermic reaction) absorption of heat (endothermic reaction) change in pH andor change of color (unless using indicators to check for acids or bases) Goals and Objectives bull To acquaint students with the nature chemical changes bull To identify whether a chemical change has occurred based on a series of observations bull To study and explore basic types of chemical reactions bull To perform a series of experiments make observations and determine whether a
chemical reaction has occurred Useful Websites
bull httpwwwricedufacultyptiskusreactions bull httpwwwchemtutorcomreacthtm bull httpwwwmcwdnorgchemistpcchangehtml
5-2
Name____________________________________ Lab Day _____ Lab Time_____________________
Pre-Lab Activities Answer the following questions Use the material presented in the lab your lecture materials and text to assist in answering these questions 1 How is a chemical change different from a physical change How can you determine
whether a chemical change has occurred List at least three observations that may indicate a chemical change has occurred
2 In chemistry what is a lsquoreactantrsquo
3 Define endothermic 4 Define exothermic 5 If a reaction container feels warmer after the reaction has occurred was the reaction
endothermic or exothermic
5-3
SAFETY NOTES Be sure to read and understand before proceeding
For safety reasons before you begin this laboratory all books packs and coats
must be stored at the front of the room
Be sure that all of the equipment that should be in your kit is there and that it is clean
and ready to use For some of the reactions it is very important to have clean
equipment and not to introduce contaminants Contamination can produce incorrect
results If you are unable to clean a piece of equipment ask your instructor if you
need to replace it at this time
Be sure to follow instructions carefully Use the proper measurements as indicated
in the instructions Be observant
In some of the experiments you will be mixing acids and water The rule is
ALWAYS ADD ACIDS TO WATER NEVER ADD WATER TO ACIDS
When you are through with the lab be sure that you leave the equipment as you
would like to find it Remember there are many other students using the same
equipment over the course of the quarter
The Golden Rule of Chemistry Labs
LEAVE THE LAB FOR OTHERS AS YOU WOULD HAVE THEM LEAVE IT FOR YOU
WEAR YOUR GOGGLES
5-4
Part A ndash Indicators Chemical fluids are often acidic or alkaline (basic) The pH of a solution describes its
acidic or alkaline character Neutral pH is 7 acidic solutions range from pH 0 to 7 alkaline solutions range from pH 7 to 14 The number comes from the negative log of the hydrogen ion concentration (or pH = mdashlog [H+]) Solutions are characterized as acidic or alkaline according to their pH
Indicators are particular substances added to solutions that change color according to the pH (acidity or alkalinity) of the solution They are highly useful in measuring the pH of a solution quickly and quite accurately Indicators are used in a wide range of fields (environmental forensics petroleum) to determine the concentration of a chemical of interest with great accuracy There are many pH indicators used in chemistry each with their own color changes and active pH range One of the most common pH indicators is phenolphthalein Phenolphthalein is an ionic substance that changes color in solutions that have a particular pH range Activity 1 Pour 1-2 mL of 01 M Sulfuric Acid H2SO4 into a test tube Add 3-4 drops of phenolphthalein solution Place a stopper on the tube and shake gently Record result in Table 1 Do not throw out solution as you will need it for Activity 3 Activity 2 Place 5 mL of distilled water in a large test tube Using your forceps (tweezers) put a small pellet of sodium hydroxide NaOH into your test tube Gently tap the tube in the counter if the pellet is stuck to the side of the tube NEVER HANDLE NaOH WITH YOUR FINGERS It is strongly alkaline and will burn your skin Place a rubber stopper on the test tube and shake gently Remove the stopper and add 3-4 drops of the phenolphthalein solution to the tube Place the stopper back on the test tube and shake it gently Observe the tube for a few minutes Record result in Table 1 below Do not throw out solution as you will need it for Activity 3 Activity 3 Use pH paper (measures the specific range from pH 1 ndash 14) and determine the pH number associated with each solution in Activity 1 and 2 Record results in Table 1 below You are done with the solutions so discard solutions and rinse out test tubes Table 1 pH of solutions Fluid Character
(acidalkaline) Response of phenolphthalein indicator
pH number
Dilute H2SO4
Dilute NaOH
Question 1 Phenolphthalein is an indicator for what pH character
5-5
Part B ndash Studying Chemical Reactions In this part of the lab you will work through a sequence of experiments make observations
and determine whether a chemical reaction has occurred Follow the instructions to do the experiments in the containers specified not in the small tubes containing the reactants As you progress through this portion of the lab complete lsquoTable 2 Observationsrsquo on the following page Allow cloudy solutions to sit in the test tube rack to see if a precipitate settles out Include this information in your observations Experiments 1 Add 5 mL of tap water to a large test tube Grasp the tube by wrapping your hand around it
Notice the temperature of the tube Add ammonium chloride crystals NH4Cl to this test tube Close the tube with a rubber stopper and shake gently Notice the change in temperature of the tube as the crystals dissolve Record your observations in Table 2
2 Pour 1 mL of 01 M potassium bromide KBr into a large clean test tube Add 1 mL of 01 M
sodium chloride NaCl to the KBr Record your observations in Table 2
For reactions 3 and 4 take two clean test tubes 3 place1 mL of 01 M sodium chloride NaCl in one test tube
4 and place 1 mL of 01 M Potassium Chromate K2CrO4 in the other test tube
Add a few drops of 01 M silver nitrate AgNO3 to each Record your observations for each in Table 2
5 Pour 5 mL of 1 M hydrochloric acid HCl into a clean test tube Carefully add a small chip of
calcium carbonate CaCO3 to the acid Record your observations in Table 2 6 Take the test tube containing sodium bicarbonate (baking soda) NaHCO3 from your kit Add
several drops of acetic acid (vinegar) HC2H3O2 Record your observations in Table 2 Complete Table 2 by determining whether a reaction took place for each of the experiments you performed and describe the evidence in support of a reaction taking place
5-6
Table 2 Observations from chemical reaction experiments
Has
a c
hem
ical
re
actio
n oc
curr
ed
Obs
erva
tions
(F
izze
s) (
Prec
ipita
te fo
rms)
(co
lor c
hang
e)
(Tem
pera
ture
Cha
nge)
or
()
Writ
e ch
emic
al n
ames
of
reac
tant
s
(eg
Am
mon
ium
chl
orid
e +
wat
er)
Expe
ri-m
ent
1 2 3 4 5 6
5-7
Questions 1 Which chemical reactions produced a new phase
List by experiment number in the proper column in the table below Some of the reactions may have not created a new phase some may have created more than one new phase
CREATED SOLID PHASE CREATED LIQUID PHASE CREATED GAS PHASE
2 Is a new phase always an indication of a chemical change Explain
3 Which reactions were exothermic (gave off heat) How could you tell
4 Which were endothermic (absorbed heat) How could you tell 5 Is a color change a reliable indicator of a chemical reaction Explain
6 What gas was released in Experiment 5 How might you test for the type of gas released
during a chemical reaction
5-8
Part C ndash Endothermic and Exothermic Reactions In this part of the lab you will use a TEMPERATURE SENSOR interfaced with a computer to study one exothermic reaction and one endothermic reaction
Procedures (wear your googles) Activity 1 Citric acid solution and baking soda
The equation for this reaction is H3C6H5O7 (aq) + 3 NaHCO3 (s) 3 CO2 (g) + 3 H2O (l) + Na3C6H5O7 (aq)
citric acid baking soda
1 Place a Styrofoam cup into the 250 mL beaker as shown in the diagram provided by your instructor Put 30 mL of 15 molar citric acid into the cup Place the temperature sensor into the citric acid solution
2 Weigh out 50 g of solid baking soda on a piece of weighing paper 3 Start recording data by clicking START 4 Wait 20 seconds and then add the baking soda to the citric acid solution Stir gently and
continuously with the temperature sensor to ensure good mixing 5 Use the DataStudio program to record data until the reaction is complete After the data has
been recorded dispose of your reaction products as directed by your instructor Rinse the Temperature sensor with distilled water
Activity 2 Magnesium and hydrochloric acid
The equation for this reaction is Mg (s) + 2 HCl (aq) H2 (g) + MgCl2 (aq)
magnesium hydrochloric acid
1 Measure out 30 mL of 05 molar HCl solution into a second Styrofoam cup and place the Temperature Sensor into the HCl solution
2 Obtain a 20 cm piece of shiny magnesium metal from your instructor 3 Start recording data by clicking START After 20 seconds add the magnesium ribbon to the
acid solution Stir gently and continuously with the temperature sensor to ensure good mixing
4 Use the DataStudio program to record data until the reaction is complete After the data has been recorded dispose of your reaction products as directed by your instructor Rinse the Temperature Sensor with distilled water
5 Click TABLE from the left hand menu Set up your Table display so it shows both experiments
6 Find the minimum and maximum values for temperature for the citric acidbaking soda and the MgHCl experiments Record the initial temperatures in your data table Then record the minimum or maximum value as the final temperature
5-9
Results Calculate the temperature change for each reaction by subtracting the initial temperature from the final temperature
Citric Acid-Baking Soda Hydrochloric Acid-Magnesium
Final Temperature (oC)
Initial Temperature (oC)
Temperature Change (oC) (Use correct sign)
Was reaction Endothermic or Exothermic
Questions about endothermic and exothermic reactions 1 Which reaction had a negative temperature change Is the reaction endothermic or
exothermic Explain 2 For each reaction describe three ways you could tell a chemical reaction was taking place 3 Which reaction took place at a greater rate (produced a temperature change Faster or
Slower) Explain your answer
5-10
Name____________________________________
Lab Day _____ Lab Time_____________________ POST-LAB ASSESSMENT 1 What type of change (physical chemical or both) occurs when ice becomes water
2 When you apply rubbing alcohol to your skin you feel a cooling effect Is a chemical
reaction taking place Explain 3 When you apply hydrogen peroxide to a cut there are bubbles released Is a chemical
reaction taking place Explain 4 What factors affect the rate of a chemical reaction
5 List some chemical reactions that are useful or annoying in your daily life
6-1
ES 105 Laboratory 6 STUDY OF SEDIMENTS AND SEDIMENTARY ROCKS
Introduction Rocks are the materials of Earth and understanding their origin and how they change enables
us to begin to understand Earth and its processes Rocks are aggregates of minerals and are classified into three groups based on the processes that formed them Igneous Sedimentary and Metamorphic This lab focuses on some of the common sedimentary rocks which are formed at the surface of Earth
Sedimentary rocks can form from the consolidation and lithification of particles called sediment Sediment is created either by physical processes breaking pre-existing rocks into smaller particles or by inorganic or organic chemical processes where mineral material is precipitated from solution Sedimentary rocks can also form by the precipitation of mineral material from solutions containing dissolved mineral materials
Sedimentary rocks form at or near Earthrsquos surface in many different environments including oceans (marine) streams (fluvial) lakes (lacustrine) deserts (eolian (wind)) and alpine (glacial) Some sedimentary rocks have features that reveal a great deal about the environment in which they formed For example the degree of rounding of the particles the presence and nature of fossils and the mineral composition may help decipher the conditions in ancient environments These observations provide clues about ancient Earth history and also aid in finding potential fossil fuel deposits
A handful of minerals are commonly found in association with sedimentary rocks including quartz potassium feldspar plagioclase feldspar mica (muscovite and biotite) calcite halite gypsum clay minerals and hematite You will examine most of these minerals at the beginning of this lab activity Goals and Objectives
bull To become familiar with minerals commonly associated with sedimentary rocks bull Investigate the characteristics of sediment grains bull Recognize the classes of sedimentary rocks (Clastic and Chemical) and be able to
distinguish samples of each type bull Classify and name samples of sedimentary rocks by their composition and texture
Useful Websites
bull httpwwwphysicalgeographynetfundamentals10fhtml bull httpwwwwindowsucaredutourlink=earthgeologysed_clastichtml bull httpwwwwindowsucaredutourlink=earthgeologysed_chemicalhtml bull httpreynoldsasueduglg103sed_env_starthtm
6-2
Name____________________________________
Lab Day _____ Lab Time_____________________
Prelab questions Complete prior to arriving at your lab section Define TERMS that are in CAPITAL LETTERS and answer the questions below 1 CLASTIC SEDIMENTARY ROCK (also called detrital sedimentary rock)
2 What is the most common clastic sedimentary rock 3 CHEMICAL SEDIMENTARY ROCK 4 What is the most common chemical sedimentary rock 5 CEMENTATION (of clastic rocks) 6 List common sedimentary rock cements
6-3
Part A ndash Observing Sediment Grains In this part of the lab you will examine examples of common sediment grains with a
magnifying glass record your observations and provide sketches of the grains When you look at each sample of grains notice the shapes sizes distribution of sizes and variety of composition of the grains
bull Grain Shape can be well rounded subrounded subangular and angular bull Grain Size size becomes smaller and more rounded with more time in the
transportation system It is a clue to the environment of deposition Use millimeters (mm) to record the grain sizes
bull Grain Sorting is a term to describe the range of sizes present Well Sorted = grains are all about the same size Moderately Sorted = largest grains are 4 to 5 times the size of the smallest Poorly Sorted = largest grains are 5 to ten times the size of the smallest
bull Grain mineral types Often noting the colors of grains can be useful Include quartz (the most common) feldspar mica and rock fragments Fossils may indicate an adjective (fossiliferous) be added to sedimentary name
bull Cements are the ldquogluerdquo that hold together the grains Include calcite silica iron oxide gypsum and halite
Activity 1 Loose Sediment Grains
Study the samples of sediment grains that have been provided Complete the tables on the following page For each sample describe the general shape of the grains record the average grain size and the range of grain sizes describe the sorting list the grain types (or colors of individual grains) Use Table 1 to suggest (name) what the likely sedimentary rock would be formed from the sediment Also make a simplified sketch of the sediment grains showing the sorting and grain shape
Table 1 Grain sizes of clastic sedimentary rocks
Size descriptions Sediment Particle size Rocks formed from it
Coarse
Fine
Gravel
Boulder gt256 mm (10 in) Conglomerate (rounded grains)
Breccia (angular grains) Cobble 64-256 mm
Pebble 2 to 64 mm
Sand 00625 ( frac124) to 2 mm Sandstone
Mud
Silt 00039 ( frac128) to 00625 mm Siltstone
Clay lt00039 mm Mudstone (massive) Shale (bedded)
6-4
Sample 2 Observations Sketch of the sediment
General shape of grains
Average grain size
Range of grain sizes
Description of sorting
List of grain types
Probable rock type formed
Sample 3 Observations Sketch of the sediment
General shape of grains
Average grain size
Range of grain sizes
Description of sorting List of grain types
Probable rock type formed
Sample 4 Observations Sketch of the sediment
General shape of grains
Average grain size
Range of grain sizes
Description of sorting
List of grain types
Probable rock type formed
Sample 1 Observations Sketch of the sediment General shape of grains
Average grain size
Range of grain sizes
Description of sorting
List of grain types
Probable rock type formed
6-5
Part B ndash Introduction to Classifying Sedimentary Rocks Examine the sedimentary rock study sets provided and answer the following questions 1 Study the set of sedimentary rocks provided Place those that are made of pieces or
fragments of mineral andor rock material (but not the rocks that have shells or shell fragments) on one tray and the rocks made of organic material (like shells or coal) or of crystals on the other tray One group of samples is the CLASTIC SEDIMENTARY ROCKS The other group is the CHEMICAL SEDIMENTARY ROCKS
DO NOT CONTINUE TO (2) BEFORE YOUR INSTRUCTOR CHECKS YOUR WORK 2 In the spaces below list the sample numbers that occur in each group
Clastic Sedimentary Rocks
Chemical Sedimentary Rocks
Keep the rocks on these trays You will be asked to use one tray or the other for Part B 3 Use the clastic rock tray Pick up each specimen and look at the size of the grains (the
fragments of which it is composed) Use a magnifying lens and ruler to measure size of the grains Separate the clastic specimens into two groups based on the grain size those that have large grains (big enough to distinguish without a magnifying lens) from those that have small grains (too small to see individual grains without a magnifying lens) In the spaces below list the sample numbers that occur in each grain-size group
Coarse-grained Clastic Rocks
Fine-grained Clastic Rocks
4 Study one of the coarse-grained clastic rock samples Indicate which one you chose
Describe and sketch this specimen showing the grains and the surrounding material
6-6
5 Use the chemical sedimentary rocks Because they form from a wide variety of processes some chemical sedimentary rocks are Inorganic or crystalline (appear homogeneous) while others consist of Organic material including plant material shells and shell fragments Separate the chemical sedimentary rocks that are crystalline from the ones that are organic and write the specimen number in the table below
Inorganic (or crystalline) Chemical
Sedimentary Rocks
Organic Chemical Sedimentary Rocks
Limestone is the most abundant chemical sedimentary rock It is made of the mineral calcite
Calcite reacts with hydrochloric acid (HCl) When a drop of dilute HCl is placed on calcite it fizzes vigorously This is a good test for limestone Limestone comes in many different varieties which form by numerous processes The calcite can precipitate directly from seawater form as dripstone in cave formations or be incorporated into shells by marine organisms After an organism dies its shell can become calcite sediment Calcite also sometimes precipitates in the spaces between clastic grains as cement to hold the rock together 6 Test all of the sedimentary rocks with HCl and briefly describe your results List the
samples that react to HCl and describe the nature of the fizzing (vigorous or minimal) SAFETY NOTE Although dilute HCl is not dangerous it can irritate skin and occasionally cause damage (small holes) to fabricclothes Be careful when using it Please rinse your table top off if any spilt on it
HCl tests on chemical rocks
HCl tests on clastic rocks
6-7
Part C ndash Classification of Sedimentary Rocks
(NOTE you do not have specimens of every rock included in the classification tables) Activity 1
1 Classification of sedimentary rocks starts with determining if the rock is clastic or chemical
2 Begin your identification by describing the texture (grain size and shape) and composition (color of sediments) of the rocks listed in Table 6
3 Identify the rocks in the study set using the classification charts (Table 2 and 3) and your description
4 Complete Table 4 with the correct rock names including terms that describe special features of note about a rock is appropriate
Clastic Sedimentary Rocks are made from deposits of broken andor weathered rock Clastic rocks are first classified by the size and shape of the particles and secondly by the composition of the particles within the rock
Table 2 Clastic Sedimentary Rock Classification
Particle Size Characteristics Rock Name
gt 2mm (bb size) Grains are angular Breccia (say brech-chia)
Grains are rounded Conglomerate
2 mm to nearly microscopic
Sand grains consisting of pure quartz Quartzose Sandstone
Sand grains consisting of dark fragments and quartz Lithic Sandstone
microscopic Typically layered and soft MudstoneShale
6-8
Chemical Sedimentary Rocks are derived from material that had been dissolved in water They are composed of crystals that precipitated from water by physical or organic processes They may have formed when water evaporated in shallow lakes leaving chemicals behind to form evaporite deposits They are also are formed by organisms extracting dissolved material to create their hard parts For this reason deposits of shell debris or plant material are considered chemical sedimentary rocks In some cases the shell material is easily observable but in other cases the shells cannot be seen without a microscope Note that fossil-rich is used as a descriptor for any rock containing visible fossils
Table 3 Chemical Sedimentary Rock Classification
Mineral Composition Characteristics Rock Name
calcite Fizzes in HCl massive is fine grained oolitic contains small concentric balls
Limestone (use descriptors like massive fossil-rich oolitic)
calcite Dull appearance soft fizzes in HCl Chalk (not included in lab set)
calcite Composed mostly of visible shell fragments has large pore spaces fizzes in HCl
Coquina
quartz group Dense porcelain like sometimes sharp edges hardness = 7 Chert
gypsum Soft hardness = 2 Rock Gypsum (not included in lab set)
halite Translucent cubic cleavage salty taste (do not taste lab samples) Rock Salt (not included in lab set)
opal Dull appearance soft does not fizz Diatomaceous Earth (not included in lab set)
carbonplant material Glassy black brittle low density Coal
6-9
Table 4 Sedimentary Rock Description Table
Rock
Clastic or Chemical
Composition (light or dark grains)
ldquoTexturerdquo Grain Size Grain Shape Grain Sorting Rock Name
1
2
3
4
5
6
7
8
9
10
11
6-10
Name____________________________________
Lab Day _____ Lab Time_____________________ POST LAB ASSESSMENT QUESTIONS
1 List three sedimentary rocks (from table 2 andor 3) that are the most likely to contain fossils Explain why this is so in terms of composition and environment of formation
2 What is a good test to determine if a sedimentary rock is limestone Does this test cause a
physical change or chemical reaction Explain how you can tell 3 Why is the study of sedimentary rocks important for understanding how and where fossil
fuels such as oil natural gas and coal (hydrocarbons) are likely to be found
71
ES 105 Laboratory 7 INTRODUCTION TO TOPOGRAPHIC MAPS
Introduction
Topographic maps contain a wealth of information which can be valuable to those who learn how to use them Topographic maps also called contour maps represent the three-dimensional the surface of Earth on a two-dimensional piece of paper Unlike other maps topographic maps show natural features with a fair degree of accuracy in terms of width length and thickness (height or depth) Geologists make use of topographic maps as a means of studying features in three dimensions By examining the features and symbols of a topographic map a geologist can become familiar with Earth features and draw conclusions about the geologic processes that led to their formation Goals and Objectives bull Become familiar the information available on topographic maps bull Learn to use map scales to find distances bull Visualize the shape of the Earths surface using contour lines and topographic profiles bull Depict the third dimension of Earthrsquos surface from the various elements of topographic maps Useful Websites bull httpwwwtopozonecom bull httptopomapsusgsgov bull httpergusgsgovisbpubsbookletssymbols
72
Name____________________________________ Lab Day _____ Lab Time_____________________
Pre-lab Activities Complete these before coming to lab Find the following unit equivalents
1 mile = ________________ feet 1 km = ________________ meters
1 foot = ________________ inches 1 meter = ________________ centimeters
1 mile = ________________ kilometers 1 km = ________________ miles
1 inch = _______________ centimeters 1 cm = ________________ inches
1 Convert 7920 feet to miles (Hint see following page is you donrsquot know how to do this) Show each step or combined steps needed to complete the conversion
2 If a map has a scale of 124000 how many miles does 75 inches on the map represent
Show your calculations with units
3 If a stream channel is 50 feet lower elevation at one location than at a point 25 miles upstream of that location what is the gradient of the stream between those two sites Show your calculations with units
4 Define the following terms with respect to stream systems
a Velocity
b Discharge
c Gradient
73
Activity 1 Compare this list of steps to convert 15 inches into feet to the table below
1 Write 15 inches as a fraction using a horizontal fraction bar (see 1 in table)
2 Put a multiplication sign after the fraction aligned with the fraction bar Write another fraction bar after the multiplication sign using a horizontal line (see 2 in table)
3 Choose the unit equivalent needed to convert from the information above (see 3)
4 Write the lsquoinchesrsquo part of the unit equivalent on the opposite side of the second fraction bar as lsquoinchesrsquo is in relation to the first fraction bar Write the lsquofeetrsquo part of the unit equivalent on the opposite side of the second fraction bar as its equivalent inches has been written (see 4 in table)
5 Put an equal sign after the expression multiply as indicated and cross out any things found both above and below the fraction bar as a matching pair (both units and factors) Be sure to put the units remaining (feet in this example) after the final product (see 5)
Table 1
1 2 3 4 5
1in 15
times
1in 15 1 foot = 12 inches
in12ft 1
1in 15times ft 251
in 12 ft 1
1in 15
=times
Problems
1 Now use this method to convert 7920 feet to miles You can show each step or combine steps to complete the conversion as show in number 5 of the above table
Use this method to do unit conversions throughout this lab Remember to include units
74
Part A mdash Scale A topographic map is a smaller representation of a larger area The map scale is the
relationship between distance on the map and the corresponding distance on the ground The two types of map scales that are useful to the geologist are ratio and bar scales The ratio scale written 112000 for example means that one inch on the map equals 12000 inches (1000 feet) on the ground A bar scale is a line with units of distance (feet miles kilometers) marked on it The bar scale allows easy conversion of map distances to true ground distance On a topographic map both the ratio scale and the bar scale are provided in the center of the bottom margin Show your calculations and include units with numbers for these questions
1 A ratio scale of 124000 means 1 inch on the map is equal to _____________ inches on the ground
2 Convert ratio scale of 124000 to a verbal scale with 1rdquo =( how many feet)
3 Complete the table below Show calculations with units on the right side of the table
Ratio Scale Verbal Scale Math work
124000 1inch = feet
A ratio scale of 162500 means 1 inch on the map is equal to inches on the ground Convert to 1 inch = how many feet Record below in and show calculations with units
162500 1 inch = feet
Convert a map scale of 1 inch = 1 mile to a ratio scale Record below and show calculations with units
1 1 inch = 1 mile
1 In the space below draw a six inch long line Use a ruler Make this line into a bar scale using
2 inches = 1 mile Subdivide the entire scale into quarter mile sections and label the origin the divisions of the first mile and the whole miles for the rest of the scale
2 On the bar scale above one quarter inch equals ________ miles Convert this to feet Record this in the table below Also determine what is the ratio scale for this bar scale (Hint convert to inches) Show your calculations with units
Verbal Scale Ratio Scale Math work
frac14 inch = 1
75
Part BmdashTopographic Maps Topographic maps use contour lines to depict three-dimensional features on a flat piece of
paper Contour lines connect points of equal elevation on the ground surface which means for example that every point on a 60 foot contour line is 60 feet above sea level Therefore a single contour line on the map shows how and imaginary horizontal plane would intersect the Earths surface are that particular elevation The contour interval is the difference in elevation between two contour lines The contour interval on a given map is constant for the entire map The contour interval chosen depends on roughness of the terrain or relief which is defined as the difference in elevation between the highest and the lowest points on a map
______________________________________________________________________
THE FOLLOWING ARE IMPORTANT RULES ABOUT CONTOUR LINES
1 Every point on a single contour line connects points on the map that are exactly the same
elevation on the ground 2 Contour lines separate areas of higher elevation from areas of lower elevation You can
determine direction of slope of a hill by checking the values of the adjacent contour lines 3 The contour interval (the elevation between two adjacent contour lines of different
elevation) is constant for the topographic map The contour interval is chosen by the map-maker based upon the relief of the map (the difference in elevation from the highest point to the lowest point on the map)
4 Contour lines must be counted consecutively (none can be skipped) Heavier contour lines speed up counting of contour lines usually every fifth contour line is drawn heavier
5 Contour lines never cross each other (except in the very rare case where the mapped area contains an overhanging cliff) Contour lines will merge into a single contour line where mapping a vertical cliff (also a rare occurrence)
6 The spacing of contour lines reflects the steepness of slopes Widely spaced contour lines represent a gentle slope closely spaced contour lines reflect a steeper slope Evenly spaced contour lines represent a uniform slope
7 Contour lines make a V pointing upstream where they cross a channel or valley 8 Depressions (lower elevation areas enclosed within higher elevation areas) are marked by
hachures on the inside of contour lines 9 Contour lines either enclose an area (as a hill top or a depression) or they end at the map
edge On a large enough map they would all make closed forms
Activity 1 Locate areas on the Monmouth quadrangle that shows what is described in Contour Rules (4 6 7 8 and 9) above Discuss locations with lab partners and if you are not able to locate an example of rule PLEASE CHECK WITH LAB INSTRUCTOR
76
Activity 2mdashConstruct a Topographic Map from surveyed data points On Figure 1 draw all the contour lines in pencil using a contour interval of 20 feet If you have a pen put it away and get a pencil (Only one who is perfect in every way contours with a pen) Study the map and locate the higher and lower areas Refer to the rules on the previous page to assist you If you are having trouble see the sample exercises for the last website listed in the introduction to Lab 4 Lightly draw in contour lines starting either at the high elevations or the low elevations Make changes where you realize you missed a feature Use an eraser When you are finished (and satisfied) darken and label the contour values neatly
Figure 1 Topographic map construction
77
Activity 3mdashConstruct a Profile from a Topographic Map Profiles are made to illustrate the shape of the surface of the earth between two designated points These two points are at the ends of the line of profile which is drawn and labeled on the map The line is used in the construction of the profile To construct the profile use each intersection of a contour and the line of profile on the map Project a perpendicular line from this intersection to the horizontal line having the same elevation as that contour line Make a dot on the profile for each intersection of a contour line and the line of the profile as drawn on the contour map Remember to include information implied by the map NOTE where the profile crosses a stream channel the elevation is between two contour lines (The stream channels are shown by dot-dash lines) Hilltops and the ends of the profile also have implied information After all the dots are made on the profile connect the dots by a smooth line which represents the profile of Earths surface On Figure 3 draw a profile for the dashed line A to A in Figure 2 Be sure to label both ends of the profile and the elevations at the side of the profile
Figure 2 Topographic map with profile line drawn and labeled
100
90
80
70
60
50
40
30
20
10
Figure 3 Topographic profile AmdashArsquo from Figure 2
78
Part C mdash Additional Information on Topographic Maps Topographic maps are produced at various scales (124000 163360 etc) that represent different areas of coverage Common sizes are 75 minute and 15 minute (Discontinued) describing latitude and longitude dimensions and are given locality names (such as ldquoMonmouthrdquo) usually for some prominent town or geographic feature in the mapped area In this part of the lab you will study a US Geological Survey quadrangle that illustrates the kind of information available on these maps
Map study and use requires an understanding of latitude and longitude Lines of latitude and longitude form an imaginary grid system with lines that are measured in degrees of arc from a reference Any point on Earth may be pinpointed to its exact location by its latitude and longitude Latitude lines are oriented in an east-west direction They are parallel to one another with the equator designated 0 degrees and increasing in degree measurement to the poles at 90 degrees Those in the northern hemisphere are north latitude and those in the southern hemisphere are south latitude Longitude lines are oriented in a north-south direction and start from 0 degrees at Greenwich England and increase in measurement both east and west up to 180 degrees on the other side of the Earth near the International Date Line Those to the east are called east longitude and those to the west are called west longitude For more exact locations degrees (o) are further broken down into minutes (lsquo) and seconds (ldquo) one degree has 60 minutes (1o=60rsquo) and one minute has 60 seconds (1rsquo=60rdquo)
If you plan to use a compass with a map for navigation is necessary to understand the concept of magnetic declination The compass needle when pointing north actually points to magnetic north the magnetic pole of Earth not to true north or geographic north which is Earths axis of rotation These two norths are not located at the same place and magnetic north moves over time The declination is the angle of correction needed because topographic maps are drawn aligned to geographic north which is toward the top and parallel to the left and right margins of the map Because magnetic north moves knowing the date the declination is accurate is important also Study the Monmouth Oregon Quadrangle and answer the following questions
1 __________________
2 __________________
3__________________
4 __________________
5 __________________
1 Who published this map
2 What year was it published
3 What is the latitude of the northern boundary of this map
4 What is the latitude of the southern boundary of this map
5 How many degrees of latitude are along the eastern edge (HINT subtract southern edge latitude from northern edge latitude)
6 __________________
7 __________________
8__________________
9 __________________
6 What is the longitude of the west side of this map
7 What is the longitude of the east side of this map
8 How many degrees of longitude are along the southern edge
9 What is the contour interval
79
10 _________________
11 _________________
12 _________________
13 _________________
14 _________________
10 How much vertical distance separates the lighter contour lines
11 How much vertical distance separates heavier contour lines
12 What is the highest elevation shown on the map (Look in NE)
13 What is the lowest elevation (Follow river downstream)
14 What is the relief of this map (subtract lowest elevation from the highest elevation)
15 _________________
16a _________________
16b _________________
16c _________________
16d _________________
17a _________________
17b _________________
17c _________________
17d _________________
18 _________________
19 _________________
20 _________________
21a _________________
21b _________________
22 _________________
23 _________________
15 What is the value of the declination (in degrees) shown
In the area to the left sketch how declination is indicated on the map
16 What is the map scale in (Show math work with units here)
a inches to inches
b feet to feet
c inches to feet
d inches to miles
17 What is the name of the quadrangle to the a south
b east
c northwest
d west
18 What is the approximate elevation of the town of Monmouth
19 What is the elevation of the benchmark located at the intersection of
Main St and Monmouth St in Independence
20 How many miles is it along Hwy 99W from Main St in Monmouth
to where 99W crosses the Luckiamute River
21 What is the distance (21a in miles) and (21b in Kilometers)
between the top of Cupids Knoll and Fircrest Cemetery
22 What is the elevation of Cupids Knoll
23 Which side would be easiest to climb Explain why
710
Part D mdash Learning about rivers from topographic maps Note Chucksney Mountain Salem and Sauvie Island Quadrangles are 124000 scale maps
1 On the Chucksney Mountain Quadrangle look at the tributaries that drain into the North Fork of the Middle Fork of the Willamette River (in the Southwest corner of the map) Then look at the width of the Willamette River channel in the Salem and Sauvie Island Quadrangles Does the width of the river channel increase or decrease when going downstream towards the mouth of the Willamette
2 Use the contour lines on the Chucksney Mountain Quadrangle to determine the elevation change from the top to the bottom of one of the tributaries that you observed in the previous question and record the elevation change below (Be sure to look up the contour interval on the map)
3 On the Salem Quadrangle locate Beardsley Bar and Doves Bar along the Willamette River What is the difference in elevation between these two points along the river In what direction is the river flowing
4 Does the gradient of the Willamette River increase or decrease as you go from its upper tributaries downstream towards its mouth
5 What type of stream channel do the tributaries in the Chucksney Mountain Quadrangle have Circle the correct choice below
a Braided stream channel
b Steep gradient bedrock channel
c Low gradient meandering stream channel
6 What type of channel does the Willamette River have in the Monmouth and Salem Quadrangles Circle the correct choice below
a Braided stream channel
b Steep gradient bedrock channel
c Low gradient meandering stream channel
711
Name____________________________________
Lab Day _____ Lab Time_____________________ 7a Post-Lab Assessment
1 Imagine you were hiking with friends and became separated from your hiking companions If you had a topographic map of the area what clues on the topographic map would you use to arrive somewhere where you could be found
2 Would a GPS receiver be able to assist you in finding your location on the map What
information would be helpful 3 What large city is located near 40oN 116oE (Use globe atlas world map GoogleEarth) 4 In what area is 40oN 116oW 5 What coast are you near at 34oN 119oW (Name continent side of it and ocean) 6 What coast are you near at 34oS 119oE (Name continent side of it and ocean)
7 Is it important to include N or S and E or W with latitude and longitude information Why
81
ES 105 Laboratory Additional Activities APPENDIX ndash Additional Laboratory Activities Lab 1 Energy and Energy Transformations
bull No Additional Activities Lab 2 Work Motion Gravity
bull Falling Objects Spark Tape Experiment p 82 - 84 Lab 3 Objects in Motion Landslides
bull Rotational Kinetic EnergyTrack Experiment p 85 - 86 bull Landslide Prediction p 87 bull AccelerationCart Experiment p 88 - 89
Lab 4 Geologic Time
bull Relative Age Dating Exercises p 810 - 814 Lab 5 Chemical Reactions
bull Chemical and Physical Changes p 815 - 816 bull Balancing Chemical Equations p 817 - 819
Lab 6 Sediments and Sedimentary Rocks
bull Overview of Sedimentary Minerals p 820 - 821 bull Depositional Environments p 822 - 823
Lab 7 Topographic Maps
bull Rivers and Topographic Maps p 824 - 825 bull Stream Table Experiments p 826
82
Lab 2 Calculation of Acceleration due to Earthrsquos Gravity
In this activity you will study the motion of a free-falling body Using a special timer the position of the object will be recorded at even intervals of time Letrsquos call the time interval Δt (read as ldquodelta trdquo or ldquochange in timerdquo) We will use the letter y to indicate the position of the object The position at a chosen time will be called y0 After one time interval passes we refer to the objectrsquos position as y1 after two intervals y2 and so forth From the changes in positions we can compute the velocity The average velocity is determined by the change in position per change in time Δt For instance the (average) velocity after four intervals of time have passed v4 is
This equation could be read as lsquothe velocity (after fourth time interval) is the change in position (between the third and fourth time interval) over the change in timersquo Once the average velocities have been calculated these values can be used to determine the average acceleration The slope of the graph of average speed versus time gives the acceleration of the falling object Mathematically the average acceleration after the fourth time interval a4 is described by the following equation
In this part of the lab you will measure the acceleration of a free-falling body using two different methods and devices ndash a spark-tape apparatus and a picket-fencephotogate system Activity 1 Using the spark-tape apparatus to Measure Gravitational Acceleration Procedure We will drop our object a carbon-coated tape approximately 2 meters As the tape falls a spark generator produces sparks at even time intervals These produce marks on the tape representing equal times between each spark The result is pictured below Figure 1 The distance between two successive marks indicates the distance fallen in a particular time interval The time interval Δt is given on the knob on the spark timer It is a fixed time interval (typically Δt = 130 sec = 0033 seconds) Ask your instructor to verify the value for Δt Your instructor will help you drop the tape and produce the marks You should have at least 9 marks on your tape
v y yt4
4 3=minusΔ
a v vt4
4 3=minusΔ
83
y1
y2
y3
y4
y5
y6
y7
Tapersquos initial position(big burned spot)
1st clearly identifiable (position y0)mark after initial position mark
Last spark on tape
Figure 1 Schematic representation of spark tape resulting from free-fall apparatus Note The first mark (the prominent burned one) gives the tapersquos initial position However the weight
was released at a random time Furthermore the second mark may be covered up by the first mark
(What you think is the 2nd mark may actually be the 3rd mark) Hence you canrsquot rely on total elapsed
time or the position of the next mark after the first mark However you can rely the on time intervals t
and distances between successive marks
Analysis Lay the tape flat on the table You may wish to secure it with masking tape Locate the initial mark Now find the next clearly identifiable mark -- probably the 2nd or 3rd mark after the first (prominent) mark This will be position yomdashlabel it accordingly Place a meter stick along the tape in preparation to measure the y-distances (as shown above) from yo to other mark locations See the diagram above Complete Table 1 for at least seven data points (Hopefully you will have more data points than seven) Measure the distances very carefully enter them into your table Be sure to record all your distances in meters NOTICEΔt is always the same value (probably 00333 sec -- but check with your instructor) NOTICE that all the distances in column 2mdashthe lsquoy (meters)rsquo columnmdashmust be in meters Fill out the rest of the table Δt is the same number of seconds for every point
84
Table 1 Δt
(sec) y
(meters) Δy v=ΔyΔt (meterssec)
Δv a=ΔvΔt (meterssec2)
301
y0 = 0 No Data No Data No Data No Data
301
y1 = 01 yy minus = 1v = No Data No Data
301
y2 = 12 yy minus = 2v = 12 vv minus =
301
y3 = 23 yy minus = 3v 23 vv minus =
301
y4 = 34 yy minus = v4= 34 vv minus =
301
y5 = 45 yy minus = v5= 45 vv minus =
301
y6 = 56 yy minus = v6= 56 vv minus =
301
y7 = 67 yy minus = v7= 67 vv minus =
301
y8 = 78 yy minus = v8= 78 vv minus =
301
y9 = 89 yy minus = v9= 89 vv minus =
301
y10 = 910 yy minus = v10= 910 vv minus =
Note about calculations 301
divide is the same as x 30
Compute an average of the accelerations in your table Letrsquos call this number the acceleration due to gravity The acceleration due to gravity is _______________________ in units of ________________ There You did it You measured the acceleration due to gravity
85
Lab 3 Rotational Kinetic Energy Determination
1 Surprise The potential and kinetic energy are not equal because we havenrsquot accounted for the energy lsquolostrsquo during motion of the ball Letrsquos calculate the rotational kinetic energy of the system by using the formula below Show your calculations be sure to include units
2R mv
51 E = ER = _______________ in units of __________________
Now add all of the kinetic energy (EK + ER) ___________________ in units of ____________ 2 How does the sum of kinetic energy (EK + ER) compare to the initial potential energy Is the
total energy conserved What other energy factor(s) havenrsquot we accounted for yet (HINT why does the ball slow down as it is rolling)
3 What would be the potential energy in the system if the ball were positioned at a height of 01
meters Show your calculations be sure to include units (Your answer should be in Joules) Predicting the Final Velocity of the Ball Because the total energy is conserved you know that at the beginning the total energy is only gravitational potential energy At the end of the experiment the ball has no altitude (h = 0 above the horizontal table) so all the energy is in the form of kinetic energy Since the total energy at the beginning must be equal to the total energy at the end we can say
Potential energy (EP) at beginning = Kinetic energy at end (both rolling + translation)
Or mgh = 22KR mv
51mv
21 EE =+=+ This simplifies to mgh = 2mv
107
Solving the above for the final velocity of the ball along the horizontal ramp we find
v gh=107
86
Questions
4 Using the equation v gh=107
calculate the ideal velocity on the horizontal track when the
ball is released on the ramp at h = 003 meters What are the units of the velocity 5 In reality will the velocity be higher or lower than the ideal calculation above Why 6 How did your average velocity (from table 1 pg6) compare with the ideal velocity (as
calculated in question 10 above) Comment on why it is the same or different (HINT there is more than one reason the velocity is not ideal)
7 Without calculating PREDICT what happens to the final velocity if we double the initial
height (h = 006 m) Will the final velocity increase or decrease About how much double one-half or some other value compared to when it is released from h = 003 meters
8 Support your above answer by employing the equation v gh=107
for h = 006 m
That is calculate the final velocity of the ball when it is released from 6 centimeters Be sure show your calculations and report your answer with the appropriate units
87
Lab 3 Energy of Motion and Landslides
PART C mdash Landslide Prediction Examine the cross-sectional sketch below Label in Figure 4 with numbers the positions where you might expect to find the following mass wasting processes
(1) rock fall (ie free-falling rock material) (2) soil creep (slowly moving sediment under the influence of gravity) (3) catastrophic landsliding and (4) zone of little to no chance of mass wasting processes
Figure 4 Landslide prediction diagram Questions 1 What are the chances of your property experiencing a landslide if you live in the Coast
Range of Oregon (for example somewhere between Dallas and Lincoln City) List the critical factors that apply (or donrsquot apply as the case may be) to why you think these are your chances
2 What are the chances of your property experiencing a landslide if you live in the middle of
the Willamette Valley (for example in Salem or Albany) List the critical factors that apply (or donrsquot apply as the case may be) to why you think these are your chances
88
Acceleration of a Cart If a cart moves on a plane that is inclined at an angle θ the component of force acting on the cart in a direction that is parallel to the surface of the plane is the shear force The acceleration of the cart should be given by
a = g sin θ Procedures 1 Before recording any data make sure the Motion Sensor can ldquoseerdquo the cart as it moves 2 Measure the angle the track makes with the table top Record in Table 4 below 3 Place the cart on the low end of the track and have one person start recording Have the
other group member give the cart a gentle push up the inclined plane track so the cart will move toward the Motion Sensor Keep recording as the cart moves away from the sensor
4 Stop recording when the cart returns to the bottom of the track 5 If the plot of data is not smooth check with your instructor to realign the Motion Sensor The
repeat the above procedure until the plot is smooth for the run up and then down the track 6 Erase your practice runs by clicking on the EXPERIMENT menu and selecting DELETE ALL
DATA RUNS Do NOT use the FILE menu and delete the activity 7 You are now ready to collect data Place the cart at the low end of the track Start
recording data Give the cart a gentle push toward the Motion Sensor Continue collecting data until the cart has returned to the bottom of the track This is lsquoRun 1rsquo
8 Set the track to a steeper angle and measure the angle Repeat data recording (Run 2) 9 Open the GRAPH from the left hand menu Select Data Run 1 Choose the plot of velocity
vs time Use the cursor to select the region of the plot that shows the cartrsquos motion after the push and before it stopped at the bottom of the track Determine the slope of the best fit line This slope is the acceleration of the cart (Note Units are ms2)
10 Repeat for Data Run 2 Record all data in Table 1 and answer the questions on the following page
89
Table 1 Acceleration of cart on Inclined plane
Run 1 Run 2
Angle of track (θ)
Experimental Acceleration (slope of velocity time)
Theoretical Acceleration (calculate from a = g sin θ)
Questions 1 What happens to the velocity of the cart as it moves up the inclined plane 2 What happens to the velocity of the cart as it moves down the inclined plane 3 What happens to the acceleration of the cart as it moves up the inclined plane 4 What happens to the acceleration of the cart as it moves down the inclined plane 5 How did the acceleration change when the track became steeper 6 Calculate the theoretical value for the acceleration of the cart based on the trackrsquos angle and
record it in Table 1 7 What is the percent difference between the acceleration determined in the activity and the
theoretical value for acceleration ⎟⎠⎞
⎜⎝⎛ =times differencepercent 100
ltheoreticaalexperiment-ltheoretica
(Show calculations here) 8 What is a possible explanation for the difference in these two values
810
Lab 4 Relative Age Dating Pre-lab Questions for Determining Relative Ages of Geologic Events Define the following terms prior to arriving at your lab section
Stratigraphic correlation
Principle of original horizontality
Principle of stratigraphic superposition
Principle of lateral continuity
Unconformity
Law of cross-cutting relationships
811
Determining Relative Ages of Geologic Events Another technique to determine the relative ages of geological events is the Principle of
Cross-Cutting relationships which states that any geological feature which cuts another geological feature must be younger than the cross-cut feature Stated in simple terms a loaf of bread must be older than the bread slices which transect the loaf
Activity Study the sketch on the following page LIST the sequence of geological events oldest at the bottom and youngest at the top on the table below and cite reasons for this order of events Close ups of significant relationships are shown on the following page (84)
Event Older than Because Younger
than Because
812
HINTS
bull ldquoIrdquo contains inclusions of ldquoJrdquo and ldquoKrdquo bull ldquoIrdquo changes from conglomerate at the bottom to sandstone at the top bull ldquoIrdquo does not include pieces of H
Rock Types Igneous ndash Intrusive Metamorphic
Gneiss Sedimentary
Cong ndash Conglomerate SS ndash Sandstone Sit S ndash Siltstone Sh ndash Shale Ls ndash Limestone
There are details of this cross section on the following page Working on the geologic history of smaller portions first can help you unravel the geologic history of a complicated section like the one above
ldquoBakedrdquo zone of contact metamorphism
813
Angular Unconformity Fault
Intrusions Refolded area
814
Questions Quantify some basic observations on geologic time in the spaces provided (Use dates shown in the ldquoGeologic Time Scalerdquo) Show all of your math work
___________ Based on the data given how old is the Earth (ie what is the total known
time encompassed by geologic history) Answer in billions of years ___________ What is the total duration of the Precambrian Eons (in millions of years) ___________ What is the total duration of the Paleozoic Era (in millions of years) ___________ What is the total duration of the Mesozoic Era (in millions of years) ___________ What is the total duration of the Cenozoic Era (in millions of years) ___________ What percentage of total Earth history is comprised by the Precambrian
Eons ___________ What total percentage of Earth history is marked by the presence of life in
the fossil record Show all of your math work ___________ What total percentage of Earth history is marked by the absence of life in
the fossil record Show all of your math work ___________ Homo habilis is considered by many anthropologists to be the first true
human and lived ~ 2 million years ago What total percentage of Earth history is marked by the presence of human-like species in the fossil record Show all of your math work
___________ What total percentage of Earth history is marked by the presence of
ldquomodern manrdquo Show all of your math work write the answer in scientific notation
___________ Assuming that you live to the ripe old age of 82 what total percentage of
Earth history will be marked by your presence on this planet Show all of your math work write the answer in scientific notation
815
Lab 5 Chemical and Physical Changes Exploring the Differences between Chemical and Physical Changes In this part of the lab you will work through a sequence of experiments make observations and determine whether a chemical or physical change has occurred As you progress through this portion of the lab complete Table 1 Observations on the following page Procedure 1 Take a test tube labeled iron filings and a test tube labeled sulfur from your kit These have
already been pre-weighed for you with 35 grams of the iron filings and 20 grams of sulfur Mix the two completely by grinding them together with a mortar and pestle
2 Divide the mixtures into two piles (ie aliquots) and place each on wax paper 3 Observe one of the aliquots under a magnifying glass and record your observations in table 1 4 Test the same aliquot for magnetism by passing a magnet under the paper (Please do not
remove the magnet from the Ziploc bag) Does the material appear to be magnetic Record your observations in Table 1
5 Now pour each aliquot into a test tube one aliquot into a small Pyrex test tube from your kit
the other aliquot into the soft glass test tube from your kit that is labeled ldquobreakablerdquo (Set this one aside for a few minutes)
6 Add a small amount of water to the first test tube (Pyrex tube not breakable one) cover the
end of the tube with your thumb and shake vigorously Record your observations in Table 1 7 Clean out the mortar bowl and put some cold tap water into the bowl Take the mortar bowl
with water your breakable test tube containing the dry ironsulfur mixture and a test tube clamp to one of the hoods Be sure to wear goggles
8 This step is performed under the hood Gently heat your mixture using the hottest part of
the flame (the inner blue tip) Heat your mixture until the mixture itself (not just the glass of the test tube) is producing a bright orange-red glow throughout the mixture Be patient it may take 5 or more minutes for the mixture to reach this stage Confirm with your instructor when it has reached this stage (to be sure the reaction has proceeded) Immerse the hot end of the tube into the bowl of water before it has a chance to cool This will break the end of the tube and there will be a small but exciting steam explosion
9 Carefully throw the broken glass of the test tube (but not the new compound you just created)
into one of the white glass disposal bins in the lab Using the cooled material that was in the test tube repeat the tests you performed on the original iron and sulfur mixture (examining with a magnifying lens checking the magnetic properties and mixing with distilled water in a large clean test tube) Record your observations in Table 1
816
Clean all the permanent glassware and return all the materials to your kit in a neat and tidy manner Leave the laboratory counter neat and in a condition that you could walk in and begin work immediately if you were in the next lab section Thank you Table 1 Observations of ironsulfur mixture
Material Viewed with magnifying glass
Tested with magnet Properties in water
Before Heating
After Heating
Questions 1 At what point did a chemical change occur How could you tell 2 Based on what you have observed in this laboratory exercise write a conclusion to the
experiment that summarizes how a chemical change differs from a physical change
817
Lab 5 Balancing Chemical Equations Balanced chemical equations are used to describe chemical reactions This equation tells
what substances are involved as reactants and what substances are formed as products In addition the relative proportions of molecules of each of the substances are specified The coefficients in the balanced equation give the mole ratios(comparing the number of molecules) of the various substances From these mole ratios the quantities of reactants required to produce a certain quantity of product can be determined as well as how much product can be expected when given quantities of reactants are utilized
1 Balance the chemical equations listed below by placing the correct coefficient in the space
provided in front of each substance ____ Mg + ____ O2 ____ MgO magnesium oxygen magnesium oxide ____ KIO3 ____ KIO2 + ____ O2 potassium iodate potassium iodide oxygen ____ AgNO3 + ____ Cu ____ CuNO3 + ____ Ag silver nitrate copper copper nitrate silver ___ AgNO3 + ___ NaCl ___ AgCl + ___ NaNO3 silver nitrate sodium chloride silver chloride sodium nitrate
818
Part A ndash Cooking with Chemistry Although you probably have never thought about it you carry out chemical reactions frequently in your kitchenmdashotherwise called cooking In many chemical reactions one reactant is present in a quantity that will limit the amount of products that can be formed This reactant is called the limiting reactant The concept of a limiting reactant will be explored by preparing a confection called SrsquoMORES which is a well-known camperrsquos delight Srsquomores (Sm) are a concoction of graham crackers (Gc) marshmallows (M) and chocolate pieces (Cp) The recipe can be written in the form of a chemical equation
2 Gc + 1 M + 3 Cp 1 Gc2MCp3 Where the reactants (ingredients) are Gc = graham cracker
M = marshmallow Cp = chocolate piece
And the product is Gc2MCp3 = a srsquomore If you were camping you would make a srsquomore by toasting a marshmallow on a stick over the campfire and then putting it between two graham cracker halves with three chocolate pieces When the graham cracker pieces are pressed together the hot marshmallow melts the chocolate and a gooey treat results (You will not be allowed to eat any of your srsquomores due to OSHA regulations and standard laboratory safety procedures) This part of the lab explores the results of adding proportions which differ from those specified by the balanced equation for a chemical reaction From different combinations of reactants you will predict the maximum numbers of srsquomores which can be prepared and test your prediction Procedure There are six different srsquomore stations labeled ldquoArdquo through ldquoFrdquo Be sure that all the reactants for each bag at each station are put back into the bag before proceeding to the next station Recall the proportions of reactants which follow the balanced equation above Record your results in Table 1 on pg 55
1 First use to srsquomore station A From the above proportions determine how many srsquomores
you can make from the reactants provided Write a balanced equation for the reactants in this bag including leftovers Test your prediction by assembling the reactants into srsquomores
2 Using the reactants in station B predict the maximum number of srsquomores which you will be able to prepare Again write the equation and test
3 Repeat Step 2 using the reactants in the stations C D and E
819
Table 1 Srsquomores reactions
Reactants present predicted yield actual yield
A
B
C
D
E
F
4 Write a unit conversion Reactant
moresS for each reactant
5 Predict the maximum number of srsquomores which can be prepared using the reactants in
station F Unit conversion calculations for Station F
Identify the limiting reactant in station F
820
Lab 6 Sedimentary Rock Identification
Part A ndash Overview of Minerals in Sedimentary Rocks As noted in the introduction a small number of minerals are commonly associated with sedimentary rocks including quartz (SiO2) potassium feldspar (KAlSi3O8) plagioclase feldspar (Na AlSi3O8 CaAl2Si2O8) mica (muscovite and biotite) calcite (CaCO3) halite (NaCl) and gypsum (CaSO4H2O) Table 2 is a summary of the diagnostic (ie distinguishing) physical properties that are used to identify these minerals Use the set of mineral identification tools (Table 2 nails pennies dilute HCl your eyes and intellect) and identify the names of the set of unknown mineral samples provided List your results in Table 1 (NOTE There is one example of each mineral so use the process of elimination to your advantage) Table 1 Identification of minerals commonly associated with sedimentary rocks
Sample Number
List of Diagnostic Properties(Used to Identify Each Mineral) Mineral Name
3
5
6
8
10
13
14
15
821
Table 2 Common sedimentary minerals and their diagnostic physical properties ____________________________________________________________________________ Mineral Name Diagnostic Physical Properties Quartz Harder than glass (specimen will scratch glass) SiO2 Glassy to waxy surface appearance (luster) Various colors of milky white clear smoky gray rose Potassium Feldspar Harder than glass (specimen will scratch glass) KAlSi3O8 Breaks into blocky angular pieces
(two directions of cleavage at 90o) Common varieties are salmon pink or white in color Plagioclase Feldspar Harder than glass (specimen will scratch glass) NaAlSi3O8CaAl2Si2O8 Breaks into blocky angular pieces (two directions of cleavage at 90o) Whitish to medium gray in color Parallel striations (lines) commonly visible Mica Softer than fingernail (fingernail will scratch specimen) K[Al2(Mg3 Fe3)](AlSi3O10)(OH)2 Breaks into thin sheetsflakes book-like occurrence Muscovite Mica Clear to silvery in color Breaks into thin silvery flakes
Biotite Mica Brown to black in color Breaks into thin dark flakes Calcite Softer than a penny harder than fingernail CaCO3 Breaks into rhombohedra (three directions of cleavage) Whitish in color Fizzes in dilute hydrochloricacid
(the ldquofizzingrdquo is the result of CO2 release) Halite Softer than a penny harder than fingernail NaCl Breaks into cubes (three directions of cleavage) Clear in color tastes salty (Donrsquot lick lab samples) Gypsum Very soft scratches easily with fingernail CaSO4H2O Clear to white to pink in color
May show three directions of cleavage
822
Figure 1 Environments in which sediments are deposited The diagram is not to scale
1 Abyssal Fan 9 River Channel 2 Deep Sea Floor 10 Delta 3 Reef 11 Lagoon 4 Beach 12 Barrier Island 5 Sand Dunes 13 Continental Shelf 6 Glaciers 14 Submarine Canyon 7 Alluvial Fans 15 Continental Slope 8 Flood Plain 16 Lake
You will refer to this diagram in the post-lab exercise Concentrate on the energy of the environment and the characteristics of the rocks that would form there Think about the way the environment would transport sediment grains the size sorting and shape of the grains the surface features that may be preserved etc You may want to look up some of the terms listed in the diagram in your textbook or from other sources
823
1 Study Figure 1 (previous page) and list at least two environments where the following sedimentary rocks would be deposited Think about the energy necessary to transport the grains Describe the overall characteristic of the depositional environment for each rock type
a SANDSTONE b SHALE
c LIMESTONE
824
d Lab 7Rivers and Topographic Maps Acitivity 1 The Willamette River 1 Describe stream gradient in your own words 2 How can you determine the stream gradient from a topographic map What information do
you need to know Express stream gradient mathematically 3 On the Chucksney Mountain OR Quadrangle determine the gradient of a tributary of the
North Fork of the Middle Fork of the Willamette River Look in the southwest corner of the map and find a stream that drains into the fork of the Willamette Show your calculations Also state the type of channel (see previous page for channel descriptions)
4 Determine the gradient of the Willamette River on the Salem OR Quadrangle between
Beardsley Bar and Doves Bar Show your calculations and describe the channel type 5 Use information on the Sauvie Island OR Quadrangle to determine the gradient of the
Columbia River between the mouth of the Willamette River and the point where it enters the Pacific Ocean Assume the distance between these locations is 100 hundred miles (Hint what is the elevation of the mouth of the Columbia River) Show your calculations
6 Study the gradient channel type and channel size of the three segments of the
WillametteColumbia River system Write a brief paragraph summarizing how these variables change as you move downstream in a river system
825
Activity 2 River Features Examine the Monmouth Oregon Quadrangle which shows many features associated with a moderately large river and answer the following questions
1 Locate the area along the Willamette River east of Independence What is name given to this river-formed feature (HINT Refer to the discussion of channel features earlier in lab)
2 Is this feature likely to change its shapeposition in the future In which direction will it
migrate and how can you tell Should folks in Independence be worried 3 Where would you expect an oxbow lake to form on the Luckiamute River in the near future
Describe location with direction and distance from landmarks Why did you pick this location
4 Several stream terraces are located along the course of the Willamette River associated
with periods of deposition and incision of the valley floor during the Quaternary Using the Monmouth quadrangle try to locate at least two (there are more) of these terraces by stating their general location and an approximate elevation
5 Sketch a topographic profile (cross section) from the top of Davidson Hill southwest across
the valley of the Luckiamute River (south central portion of map) Indicate the type of materials (solid bedrock and alluvial sediment) you would expect to find underlying various portions of your cross section based on their relative elevation slope and position with respect to the Luckiamute River
826
Lab 8 Stream Table Experiment on Sediment Transport Determine Effect of Flow Velocity on Mode of Sediment Transport and Stream Competence Visible sediment grains move through a channel as either bed load (rolling sliding or saltation (ie bouncing like a jumping bean)) or suspended load Reduce the discharge to a minimum by pinching the tube so the current is moving only a few grains
In the table below record how the sand-sized sediment is being transported under Low flow conditions Use some chalk dust to observe suspended load transport under Low flow conditions Increase the discharge to a Medium flow by squeezing the tube about half way Again record your observations for how the sand-sized sediment moving Increase the discharge to High flow by releasing the tube completely Once again record on the table how the sand-sized grains are moving
Table 1 Sediment Transport Record how the sand-sized sediment is being transport for each condition
Discharge Condition
Sand-Sized Bed Load
Sliding Rolling Saltation
LOW
MEDIUM
HIGH
Question 1 Describe how the transport mode and behavior of sand changed under each new flow
condition Consider the amount of grains moving and how the transport mode changed with increasing discharge

13
Pre-Lab Activity (continued) ndash Start Table 1 before coming to lab
Instructions Complete Table 1 before class and compare and contrast answers with your lab group when you arrive in class
Table 1 is provided for you to complete In the left-hand column list as many forms of energy as you can In the right-hand column identify an example To get you started you might recall that electromagnetic waves are one form of energy and an example might be the microwaves in your microwave oven
Table 1
Form of Energy Example
Electromagnetic Waves (light) Microwaves (in your microwave oven)
14
Part A - Conversion of Mechanical Energy into Heat Energy
Conservation of energy is a very important concept The term simply means that energy cannot be created or destroyed - it is conserved There is a finite and unchanging amount of energy in the universe There is however no restriction on converting one form of energy into another (except as per the Second Law of Thermodynamics) There are many devices (or processes) that transform one type of energy to a different type of energy Sometimes it is said that energy is ldquolostrdquo in transforming one kind of energy into another but in reality the ldquolostrdquo energy is only converted into a form that is unavailable to use conveniently Often the ldquolostrdquo energy is in the form of heat that escapes into the surrounding environment
Activity 1 Use the table below extend the list by adding your own entries to the table
Then share your list with the others in your group and compile a lsquomaster listrsquo Table 2 Shows some possible ways that energy can be lost during a conversion
To Convert Into You Might Use Ways Energy Might Be Lost Electrical Light A light bulb The lamp heats up and the heat
escapes into the air
Mechanical (Kinetic)
Electricity An electrical generator
Light Heat A solar collector (that sits in the sun and uses black pipes filled with water)
The water that absorbs the light and converts it to heat begins to boil and this requires a form of chemical energy
Heat Mechanical A steam engine
Chemical Light A chemical reaction
Ultraviolet (UV) Waves
Visible Light Waves
15
Activity 2 Moving hands (Mechanical energy transformed into heat energy) Instructions Press your hands together and rub them back and forth twenty times As you do this press as hard as you can but still allow them to rub together Try to apply the same force throughout this activity As soon as you stop rubbing feel the temperature of your hands
1 What did you observe Explain in terms of energy conservation and conversion
2 Change the amount of frictional force between your two hands by pressing your hands together very lightly (reducing friction) Rub them back and forth twenty times As before feel the temperature of your hands where they touched Were they warmer or cooler than before
3 Compare this observation to the one above Explain in terms of energy conservation and conversion
4 Does reducing the frictional force affect how much mechanical energy is transformed
into heat energy
5 Explain why you put grease (a lubricant) on parts of your bicycle that rub together (eg
wheel bearings) Explain your answer to this question in terms of energy conservation and lost energy
6 Make a short list of things (five things) you encounter every day that convert mechanical
energy (of moving objects) into heat
16
Part B - Conversion of Mechanical and Chemical Energy into Electrical Energy
A generator converts mechanical energy into electrical energy Electrical energy can flow through a wire in the form of an electrical voltage and commonly is used to light a bulb to produce light The light bulb converts the electrical energy into light energy that our eyes can easily detect
Activity 1 Hand crank generator to electric light (Mechanical to Electrical)
This consists of a hand-crank generator to convert mechanical energy to electrical energy and wires to carry the electrical energy (voltage) to a light bulb Instructions
1 Connect one wire-lead from hand generator to light bulb leaving the other wire-lead unconnected (open circuit) Gentle turn the generator and ldquofeelrdquo (gauge) the degree of difficulty Was it (easy moderate or difficult) to turn the crank
2 While turning the crank at the same speed as above connect the other wire-lead to the light (closed circuit) and ldquofeelrdquo (gauge) the degree of difficulty to turn the crank Was it (easy moderate or difficult) to turn the crank
Questions
1 What do you notice about how hard the hand crank turns with respect to a closed circuit (light bulb on) verses an open circuit (light bulb off) Explain why there is a difference
Activity 2 Measuring actual voltage in a closed circuit
Instructions bull For Multimeter black wire-lead connects to COM terminal and red wire-lead connects to
theVmA terminal (check with instructor) bull Connect hand generator wires to each wire of the Multimeter (at direct voltage (DCV) setting of
20) and slowly turn the handle and record the voltage in the table below Repeat for a faster turn Slow Turn Voltage (volts) = Fast Turn Voltage (volts) = Thought Question
1 (Think about and Discuss) How hard (fast) and how long you would need to turn the hand generator to produce enough energy to light a 60 watt light bulb for an hour Or brew a cup of coffee in the morning
17
Activity 3 Comparing chemical (battery) energy to mechanical energy Instructions bull Connect the battery pack to the Multimeter and record the voltage (in table below) using same
settings (Multimeter at direct voltage (DCV) setting of 20) as activity 2 above bull Disconnect the battery pack and connect the hand generator to the Multimeter and try to maintain
a constant turn that replicates the same voltage as the battery pack Now you can FEEL the energy associated with 3-volts
Voltage (volts) with 3-volt (2-battery) pack =
Speed of hand generator (slow medium or fast) associated with 3-volts (2-batteries) =
Questions
1 (Think about and Discuss) How hard (fast) and how long you would need to turn the hand generator to produce enough energy to recharge your cell phone (Typical cell phone batteries are 37 volt and 800 mAhour)
Part C - Conversion of Heat into Mechanical Energy
Figure 1 Apparatus to investigate conversion of heat energy to mechanical energy
Rubber hose
(Test tube)
18
At this station you will convert heat energy into mechanical potential energy To understand how the potential energy is observed consider the U shaped tube in Figure 1 One side of the U-shaped tube is connected to a small reservoir (a test tube) the other end of the U-shaped tube is open to the atmosphere If the pressure in the reservoir is the same as the atmosphere the water level in both sides of the tube will be the same However if the pressure inside the reservoir is larger than the atmospheric pressure the water levels will be different the pressure inside the reservoir tends to push the water out of the tube In lifting the water in the tube the gas in the reservoir does work holding the water up (that is holding it in a non-equilibrium position) requires energy -- mechanical potential energy To make the gas expand (and increase the pressure in the reservoir) we rely on the ideal gas law The Ideal Gas Law states that if you increase the temperature of a gas the pressure will increase To increase the temperature you must transfer heat (energy) into the system
Activity 1 Hot and Cold (thermal energy) converted into Mechanical Energy
Instruction
bull Record the location of the water level on the scale (Measure the level of water on the open end of the glass U tube)
bull Place the air-test tube (reservoir) into the warm water beaker and record the new level of the water in the table below
bull Now place the air-test tube (reservoir) into a beaker of cold water What happens to the water level in the tube when the reservoir is cooled Record your observations in the table
Observations Initial water level on open side of the glass U tube
Water level on open side of the glass U tube in warm water reservoir for 30 sec
Water level on open side of the glass lsquoUrsquo tube after immersing in beaker of cold water
Describe change of water level from previous level
Questions 1 1 Explain your observations recorded in the table in terms of energy conservation and
energy conversion 2 What happens when you leave a blown-up balloon in the sun Give a detailed explanation as
to what happens to such a balloon in terms of energy transfer and conservation of energy
19
Part D mdash Conversion of Light Energy into Electricity Light energy conversion to other types of energy (eg electricity) is never 100 efficient
This station contains a solar cell which directly converts light to electricity with approximately 5 efficiency That is 5 of the light that reaches the panel surface is converted to electricity
Activity 1 Solar to electrical to mechanical
Instructions The small motor connected to the solar cell converts light to electricity and then to mechanical energy
1 Turn 40-watt lamp on and observe if motor (Fan) turns Record how fast fan is turning
2 Turn 75-watt lamp on and observe if motor (Fan) turns Record how fast fan is turning
Questions 1 Which wattage (light bulb) produced the most electricity (turned the fan fastest) 2 Most (95) of the light energy was lost in the process of conversion Where do you suppose
the other 95 of the light energy is going if only 5 is converted to electrical energy Refer to Table 5 below to answer the post-lab question about energy conservation Table 5 Estimates and comparisons of energy usages in your daily lives
Energy Using Activity Is Comparable With
Take a hot bath (full tub) Burning a 100 Watt lamp for a day
Using a 250 watt hair dryer for 8 minutes Riding your bike 30 miles (under ideal conditions)
Heating a pot of water for tea or coffee on the stove
Bench lifting a 50 lb weight 40000 times
Watch TV for an hour Eating a dessert with 250000 calories
Driving your car 45 miles to Portland Playing 13400 games of racquetball
Leaving a 100 watt light burning all night (10 hours)
Dancing the Tango for 45 days nonstop
110
Name____________________________________
Lab Day _____ Lab Time_____________________ POST-LAB ASSESSMENT Comparison of Energy Sources
Questions 1 It is part of our common language to use the term lsquoconserve energyrsquo to mean lsquotry to
consume less energyrsquo Contrast this meaning of lsquoconserve energyrsquo with the physics law of lsquoconservation of energyrsquo
2 All methods of generating electricity have adverse impacts on the environment Try to list at least two ways that each of the following energy sources used to generate electricity negatively impact the environment a) Burning fossil fuels b) Hydroelectric (dams) c) Solar
(Hint you might consider what impact building such plants may have on the environment) 3 Which is you favorite energy source Why
4 Try to stump your lab partner by thinking of a situation where energy is apparently lost for good Write down the ideas you come up with and give your lab partnerrsquos explanation of where the lost energy went
Consider the idea that energy is always conserved and discuss whether people will ever be able to generate power without affecting the planet Record your discussion
2-1
ES 105 Laboratory 2 EXPLORING WORK MOTION AND GRAVITY
Introduction
Work Work is a word used in many different ways It is used to describe our jobs and
careers It is used to describe what we do when we study for an exam However with regards to science that is not what work is The scientific definition of work is a force acting through a distance (Work = Force x Distance) A force is just a ldquopush or a pullrdquo that gives energy to an object sometimes causing a change in motion of the object (Recall from last lab that Energy is the property of a system that enables it to do work) Work is done only when a force moves an object When you push lift or throw an object you are doing work Your force is acting on the object causing it to move a certain distance One important aspect of work to note is the direction of the applied FORCE must be in the same direction of the DISPLACEMENT (movement) for it to be considered WORK
Friction Friction is a resistive force that opposes the motion or attempted motion of an object with which it is in contact In a sense friction is a force that resists (or limits) the work being done as objects are moved Friction always acts in a direction to oppose motion So when an object falls downward through the air the force of friction (referred to as Air Resistance) acts upward There are different types of friction including rolling friction and fluid friction but for the purpose of sliding solid objects across a floor or tabletop the two important types of friction are static and sliding friction The strength of these forces of friction depends upon two factors 1) the types of surfaces involved and 2) how hard the surfaces push together Static friction occurs when you first try to move the object before it is in motion and is a little stronger of a friction force than sliding (or moving) friction once the object is in motion
Gravity and Free Fall ldquoFree-falling objectsrdquo refer to objects that are allowed to fall straight down accelerated ONLY by the force of gravity An object in free fall accelerates as it falls due to the force of gravity (acting as an unbalanced force) Other than the force of gravity what other affects might there be on a falling object The dreaded air resistance is one effect However the effects of air resistance can be ignored as long as the (maximum) velocity of the object is relatively modest For most objects beginning at rest air resistance is negligible throughout the first seconds of fall
In this weekrsquos lab there will be a series of stations that will allow you to explore the motion of objects and how friction affects the motion of both sliding and free-falling objects You will also learn how to calculate the work needed to move objects Your instructor will help you gather data to measure the acceleration of free falling objects due to gravity
There are a few basic measurements and calculations that are necessary to understand the motion of objects and the work needed to move objects These measurements and calculations include
2-2
Distance or Displacement
(d) the distance over which an object moves under the influence of gravity (units of measurement eg centimeters meters kilometers)
Time of Travel (t)
the time during which an object completes its travel (units of measurement eg seconds minutes hours)
Velocity v = dt
the rate of change or displacement (units of measurement eg mileshour meterssec)
Acceleration a = change in velocity time
the rate of change of velocity of an object over time (units of measurement for acceleration are dt2 such as meterssecsec = meterssecond2)
Force (F)
is a push or a pull units generally measured in (Newtons)
Work (w)
is the change in an objectrsquos state of motion that results from the application of a Force
Work (joules) = Force (Newtons) x Displacement (meters)
Power (P)
Is the time rate of work Units generally measured in (watts)
Power (watts) = Work (joules)Time (seconds)
Goals and Objectives
bull Students will be able to perform measurements using a spring scale to determine the force associated with lifting and pulling weight
bull Students will be able to be able to calculate the average work bull Describe what is meant by accelerated motion bull Determine the acceleration of gravity
Useful Websites
bull httpwwwpbsorgwgbhnovagalileo
2-3
Name____________________________________
Lab Day _____ Lab Time_____________________ Pre-Lab Activity Complete the following calculations prior to arrive in lab Show all of your math work and unit conversions (HINT 1 hour = 60 minutes 1 min = 60 seconds 1 km = 1000 m) and (1 kilogram = 1000 grams) 1 If you drive a car for a distance of 35 km and it takes you 45 minutes to do so what is your
average velocity in units of kmhr What is your average velocity in msec 2 Phil has a very messy office and wants rearrange some furniture He needs to move a desk 10
meters If Phil exerts a force of 20 Newtons how much work is he doing 3 What is the Force (in Newtons) associated with a 500 gram weight in free fall near the
Earthrsquos surface (assume acceleration due to Earthrsquos gravity is ~ 10 meterssecond2) (note the 2nd Law of Motion is F(Newtons) = mass(kilograms) x acceleration(metersseconds2)
4 You will be using a Spring-scale to determine the Force associated with moving objects in the
lab Go to Wikepidiaorg (httpenwikipediaorgwikiSpring_scale) and write a brief definition of what a Spring scale is (Be careful to discuss difference between Mass and Force readings)
5 A spring scale measuring the force associated with lifting a 500 gram weight on Earth (3
above) is now used on the Moon What will the Spring scale readings be for Mass and Force associated with the Spring scale reading on the Moon
(assume acceleration due to Moonrsquos gravity is ~16 meterssecond2)
MASS (in grams) FORCE (in Newtons)
2-4
Part A mdash Work Activity 1 Letrsquos Talk Work Instructions
bull Tape a meter stick to an object to keep it vertical bull Use a force spring scale to lift weights of different sizes to the 30 cm mark bull Record your data in the table below bull Use a force spring scale to lift weights of different sizes to the 60 cm mark bull Record your data in the table below
Data Table One
Weights (Grams)
Height (Centimeters)
Distance (Meters)
Force (Newtons)
Work (joules)
100
30
Predict
What will happen to force if weight is raised to 60 cm _____________________
__________________________________________________________________
What will happen to work if weight is raised to 60 cm ______________________
__________________________________________________________________
Now try it and see if your prediction was correct
100
60
200
30
Predict
What will happen to force if weight is raised to 60 cm _____________________
__________________________________________________________________
What will happen to work if weight is raised to 60 cm ______________________
__________________________________________________________________
Now try it and see if your prediction was correct
200
60
Try 500
30
2-5
Questions
1 What does doubling the height (distance moved) do to total work
2 What does doubling the force do to total work Solving Problems Remember to include your units of measurement Some measurements are required to solve
1 Kelsey is a very strong She lifted a 200-gram weight to 50 cm How much work did she do 2 Mario wants to be a super hero He has been practicing for his super hero test by lifting cars If
Mario exerts a force of 12000 Newtons to lift a car 2 meters how much works is being done on the car
Part B mdash Friction Use the spring scale to measure the pulling force (associated with Static and Sliding friction) necessary to move at constant velocity a wood block across different surfaces Add a 200 gram weight to block and measure the pulling force again Record your measurements in Table below
Friction Surfaces Static vs Moving Type of Surface Static Friction
(Newtonrsquos) Moving (Newtonrsquos)
Static with weight
Moving with weight
Smooth-smooth
Smooth-rough
Rough-rough
1 What surface(s) and weight had highest amount of friction Explain your answer Which
was greater Static or sliding friction
2-6
Part C mdash Gravity and the Physics of Free-Falling Bodies Activity 1 Free Fall of Objects with Similar Size but Different Mass Collect two balls of the same size but different weight such as a heavy solid steel ball and a light hollow plastic ball With your lab partners hold both balls simultaneously at a height of one (1) meter above the floor
As a group make a hypothesis (predict) as to which ball will hit the ground first As a group test your hypothesis by releasing the balls at the same time Repeat the experiment several times and describe your results
1 How did the actual results compare to your initial hypothesis What can you conclude about the effects of the Earthrsquos gravity on the heavy and light ball respectively
Activity 2 Free Fall of Unlike Objects In your group repeat activity 1 only this time using a rock and a feather (or piece of paper if you cant find a feather) Hold the rock and feather at a height of 1 m above the floor
As a group make a hypothesis (predict) as to which object will hit the ground first the rock or the feather As a group test your hypothesis by releasing the rock and feather at the same time Repeat the experiment several times and describe your results
2 How did the actual results compare to your initial hypothesis What can you conclude about the effects of the Earthrsquos gravity on the rock and feather respectively
3 How does this activity compare to Activity 1 with two balls of the same size but different
weight Explain the differences andor similarities
2-7
Activity 3 Free Fall in a Vacuum
NOTE Do NOT run the vacuum pump unless it is connected to the lsquoRock and the Featherrsquo tube
As a lab group visit the station that consists of a glass vacuum tube and vacuum pump The apparatus consists of a long tube containing a rock and a bit of paper (or feather depending which tube is available) Air in this tube can be evacuated using the vacuum pump thus creating a vacuum (similar to space) Hold the tube vertically with the valve-end up Hook up the hose to the tube open the valve and turn on the pump After 60-80 seconds all air should be evacuated from the tube Shut the valve turn off the pump and remove the hose With all of the air out of the tube quickly turn the tube end up and hold it vertically while the feather and rock experience free fall Repeat the process several times and note your observations 4 Which object hits first in the vacuum tube the rock or the feather (or piece of paper as the
case may be) 5 How do the vacuum tube results compare with the results from Free Fall Activity 2 (above) 6 Explain processes that influence free-fall of objects under the influence of Earthrsquos gravity
a What are the controlling factors
b How does the Earthrsquos atmosphere affect the free fall of objects under the influence of gravity
c What other force(s) besides gravity is operating on the objects
2-8
Part D mdash Measuring the Earthrsquos Gravitational Acceleration Activity 1 Using the photogate apparatus to Measure Gravitational Acceleration Using a ldquoPHOTOGATErdquo (a light beam with a sensor for light) and a ldquoPICKET FENCErdquo (a clear plastic strip with uniformly spaced opaque bands) the acceleration due to gravity can be determined The photogate head emits an infrared beam from one side of its lsquoUrsquo shape to the other A light-emitting diode (LED) on the top of the Photogate Head blinks to show when an object blocks the beam Timing begins when an object interrupts the infrared beam We will drop our ldquopicket fencerdquo through the photogate head The software calculates the average velocity of the picket fence from one band to the next because the distance from one band to another was programmed into the calculation Before recording data experiment with the photogate and picket fence Procedure 1 Hold the picket fence at one end between your thumb and forefinger so the bottom edge of
the picket fence is just above the photogate beam (see diagram below) Have your partner click START then drop the picket fence through the photogate The computer will begin recording data when the photogate beam is first blocked
2 Click STOP once the entire lsquopicket fencersquo has passed completely through the photogate 3 Make sure the graph shows a diagonal line before moving on If data looks erratic make
sure you are dropping the picket fence vertically not at an angle data will be skewed 4 After your practice runs open the EXPERIMENT menu select DELETE ALL DATA RUNS 5 Using the techniques from above conduct five runs and record them in Table 1 6 Click on GRAPH from the left hand data menu and examine the plot of Velocity versus Time
in the Graph display Determine the slope of the lsquobest fitrsquo line for velocity versus time for each run Record these values in your data table and find the average Include units
Table 1
Run Number Slope of Best Fit Line (acceleration due to gravity)
1
2
3
4
5
AVERAGE
2-9
Name____________________________________
Lab Day _____ Lab Time_____________________
Post-Lab Questions on Acceleration Due to Gravity 1 What can you say about the values for acceleration from Table 1 Is it constant or does it
vary in some consistent manner
2 Compare your values (from Table 1 above) for the acceleration due to gravity g (with the accepted value for g at sea level at the equator of g = 981 ms2
3 What factors may have contributed to the value you determined experimentally being
different from the accepted value List and briefly describe several of these
31
ES 105 Laboratory 3 ENERGY OF OBJECTS IN MOTION and
PHYSICS OF LANDSLIDES
Introduction In this lab we will work with two important aspects of the physics of objects in motion From
lab 1 you should recall that energy can be transformed from one type to another and that energy is never created or destroyed it can however be transformed into different types of energy (like motion or heat) This is known as the concept of conservation of energy This very important concept tells us that an equal amount of energy exists before and after the conversion process Today in lab you will work with converting gravitational potential energy to kinetic In doing so it will seem that energy can disappear No process of transforming one type of energy to another is perfectly efficient and some energy will always be converted into forms that are inaccessible to us
The second key aspect of todayrsquos lab will focus on the physics of landslides Landslides are part of a spectrum of gravity-driven geomorphic processes collectively known as ldquomass wastingrdquo Mass wasting processes include rock fall rock avalanche landslide earth flow debris flow and soil creep The prerequisite conditions for landslides typically include (1) the Earthrsquos gravitational field (a fundamental driving force) (2) the occurrence of loose rock and sediment at the Earthrsquos surface (3) heavy rainfall and (4) steep slopes To understand the occurrence of landslides geologists and engineers must first understand the physics of gravity (ldquoNewtonian physicsrdquo ldquoNewtonrsquos Laws of Gravityrdquo) and how it interacts with materials (rock and sediment) at the Earthrsquos surface This lab provides an introduction to Newtonian physics gravity and the forces that cause landslides
Goals and Objectives
bull Further investigate the concept of conservation of energy bull Investigate the conversion of gravitational potential energy to kinetic energy bull Formulate explanations for energy that can seem to disappear bull Calculate effect of angle of influence on the acceleration of gravity bull Investigate frictional effect on motion
Useful Websites bull httplandslidesusgsgov bull httpwwwfemagovhazardlandslideindexshtm bull httpwwwphysicsclassroomcomClassnewtlawsU2L3ahtml bull httpwwwgrcnasagovWWWK-12airplanenewton2html bull httpenwikipediaorgwikiSineComputation
32
Name____________________________________
Lab Day _____ Lab Time_____________________ Pre-lab Questions 1 Define the following terms andor provide the correct formula prior to attending your lab
A GRAVITATIONAL POTENTIAL ENERGY
B KINETIC ENERGY
C MASS WASTINGLANDSLIDE
D FORCE
E NEWTON (unit of force)
F NEWTONS SECOND LAW OF MOTION
2 Calculate the following values
0o 10o 20o 30o 40o 50o 60o
Sine of angle
Cosine of angle
(If any of your values are negative set your calculator on degrees instead of radians)
33
Part A mdash Energy Transformation and Conservation In closed systems the Law of Conservation of Energy is obeyed It states the total energy
remains constant Another way to say this is that the initial total energy in a closed system is equal to the final total energy In this part of the lab we will examine two types of energy
1mdashTranslational Kinetic Energy = 2mv
21
EK =
where m = mass (kilograms) and v = velocity (msec) Kinetic energy is the energy associated with motion along a line It is measured in Joules [J] which is the same as
2
2
secondmeters kilogramstimes
2mdashGravitational Potential Energy = EP = mgh
where m = mass (kilograms) g = acceleration due to gravity (98 msec2) and h = height above surface (m) Gravitational potential energy is the energy associated with the gravitational pull on an object that is some elevation (h) above a surface (usually Earthrsquos surface) Think of skiing down a slope at the top of the hill you have a large potential energy ndash your elevation h is large As you travel down the hill your elevation decreases so does your potential energy EP = mgh At the bottom of the hill (at an altitude of h = 0) your potential energy is zero Does this mean your energy went to zero No Your potential has been converted into translational kinetic energy and yoursquore zipping along
Instead of skis we will roll a ball down a ramp converting potential energy into kinetic energy At the bottom of the ramp the ball can roll with some friction along a horizontal track We measure the final velocity as the ball traverses one meter along this track By comparing the initial potential energy to the final kinetic energy we will determine if energy is conserved Activity 1 Investigating gravitational potential energy and translational kinetic energy Go to the ramp-track station in the lab It should look like this
Support (Rods and Clamps)
Ramp
Table
Horizontal Track
lsquozerorsquo marker lsquo1 meterrsquo marker
Tape lsquocatcherrsquo
Release Point
h = 003 m
Meter Stick
Figure 1 Apparatus to investigate the conservation of energy
34
Procedures
1 Determine the mass of the ball in grams using one of the balances in the lab Record below
The ballrsquos mass is __________________ g and convert this mass to kilograms record below
__________________ kg 2 Carefully measure a starting point on the ramp that is 3 centimeters above the base of the
horizontal track (H= 003 m) Make sure you are measuring the VERTICAL HEIGHT of the starting point NOT the diagonal length from the base of the ramp
3 One person will release the ball from the previously determined release point Another person in the group will click START to begin recording The program will record the value of position versus time One person must catch the ball before it hits the motion sensor
DO NOT LET THE BALL HIT THE MOTION DETECTOR 4 Repeat this measurement for a total of five trials After each trial use the best fit line tool to
determine the slope of the graph following directions provide below The slope of the position versus time graph is equal to the average velocity of the ball rolling along the horizontal surface Record the velocity for each trial in the data table below (Table 1) Repeat your experiment 5 times and find the average
5 Follow these directions to determine the best fit line a Click the DATA tool button Select NO DATA b Click the DATA tool button again This time choose Run 1 c Click on the SCALE TO FIT button d Using your mouse select data click and hold the left mouse button to draw a box
around the part of the graph that is a smooth diagonal line This part of the graph corresponds to the ball rolling along the horizontal surface The line should be highlighted in yellow
e Now click on the FIT button and select LINEAR Record the slope (m) in Table 1 as the velocity
f Repeat steps a through e for all five trials Be sure to select part of the line for each trial Do not rely on it having yellow highlight Tabulate your data in Table 1
6 Run the experiment again starting the ball at 6 centimeters above the table top and calculate the velocity on the horizontal track in meterssecond Repeat your experiment 5 times and find the average Tabulate your data in Table 2
35
Table 1 Data table for experiment with ball starting at 3 centimeters above the table top
H = ___003__________ meters
In the last column record the velocity from the computer table if you used it to collect your data It is not necessary to record the time if you used the computer to collect your data
Trial Time (seconds) Velocity (msec)
1
2
3
4
5
AVERAGE
If you are using meter stick and manual timer you will need to calculate your velocity Table 2 Data table for experiment with ball starting at 6 centimeters above the table top H = ____006_________ meters In the last column record the velocity from the computer table if you used it to collect your data It is not necessary to record the time if you used the computer to collect your data
Trial Time (seconds) Velocity (msec)
1
2
3
4
5
AVERAGE
If you are using meter stick and manual timer you will need to calculate your velocity
36
Activity 2 Computational Questions Show your calculations be sure to include units in all of the equations on the next three pages 1 Calculate the initial potential energy in the system Ep = mgh (mass x acceleration of
gravity x height) for the ball starting at 3 cm (g = 98 msec2 use units of kg m seconds) 2 What is the final potential energy
(Hint write the equation with values inserted for the variables and remember h = 0 meters)
3 Calculate the final kinetic energy in the system 2K mv
21 E = (That is square of velocity
times the mass divided by 2 Use average velocity from 3 cm height and units of kg m s) 4 What is the initial kinetic energy (when the ball is at the top of the ramp)
(Hint write the equation with the values inserted for the variables) 5 Compare the initial potential energy (from Q 1) and final kinetic energy (from Q 3) Are
they equal (to within your uncertainty) or are they quite a bit different By what factor 6 Law of Conservation of Energy suggests that EP and EK should be equal explain how the
concept of conservation of energy is supported or rejected by the track experiment If rejected what might be the possible reasons
7 Surprise The potential and kinetic energy are not equal because we havenrsquot accounted for
the energy lsquolostrsquo during the rolling (rotational energy) motion of the ball
37
Part B mdash Newtonrsquos Second Law Force and Landslide Analysis Landslides are driven by the Earthrsquos force of gravity acting on a mass of rock or sediment on an inclined hillslope The critical analytical parameters include
Symbol Name Description Units
F Force of Gravity The pulling action on an object due to Earthrsquos gravity
Newton N = 1 kg-msec2
g Acceleration due to gravity
Constant on the Earth g = 983 msec2 msec2
m Mass Amount of material measured in kilograms
kg
θ Angle of Slope Angle of hill-slope inclination (90 degrees = sheer cliff face 0 degrees = flat surface)
degrees
Newtonrsquos second law of gravity states that the force operating on an object in space is directly proportional to the product of its mass and acceleration Newtonrsquos second law translates into the following equation
F = ma where F = force (Newton) m = mass (kg) and a = acceleration (msec2)
When Earthrsquos gravity is considered ldquoFrdquo is equivalent to ldquoweightrdquo (eg your weight on a scale is a measure of the Earthrsquos gravitational pull on your body mass the more mass you have the more you weigh) and ldquoardquo is equivalent to ldquogrdquo which is the acceleration due to gravity (a constant = 98 msec2) In terms of Earthrsquos gravitational pull Newtonrsquos second law is translated as
Wt = mg where Wt = weight of an object (Newtons) m = mass of object (kg) and g = acceleration due to gravity (g = 98 msec2)
This part of the lab is particularly relevant because the Willamette Valley represents one of
the most dynamic and spectacular geologic environments in the United States Intense seasonal rainfall patterns steep mountain slopes and expansive valleys provide for an active geomorphic setting associated with seasonal flooding and landslides Annual cost of damage to public and private lands in western Oregon ranks among the top 20 of the most severe in the United
38
States Damage to public infrastructure from storm events during the mid-1990rsquos alone totaled hundreds of millions of dollars Landslides accounted for a large portion of this damage Slope failure and erosion in the Coast Range are further exacerbated by sustained timber harvesting and the Willamette Valley is experiencing unprecedented population growth and development invading the foothills Understanding of the spatial and temporal distribution of landslides is critical for the appropriate design of land-use regulations hazards mitigation and conservation planning (read this as ldquoYour house could be next How do you know if you are at risk for landslide and what can you do about itrdquo)
Application of Newtonrsquos Second Law With your lab group visit the inclined plane station and examine the apparatus A mass of rock is sitting on an inclined plane this is analogous to a mass of rock on a hill-slope in the Coast Range or western Cascades The figure below illustrates the forces acting on the slope material
Figure 2 Diagram of forces of weight Definitions for Particle on Slope
θ = slope angle relative to horizontal plane (units in degrees) Wt = weight of particle or mass of material (units in N) = mass x gravity Shear force parallel to slope = Wt x sin θ (units in N) Normal force perpendicular to slope = Wt x cos θ (units in N)
Equations for Particle on Slope
Wt (weight of particle in Newtons) = mg (= mass times acceleration of gravity) SHEAR force (in N) = Wt (sin θ) NORMAL force (in N) = Wt (cos θ)
39
Activity 1 Force Analysis of a Rock Mass on a Slope (Inclined Plane) Questions Given that shear force is oriented down slope and normal force is oriented perpendicular to slope answer the following questions (refer to the inclined plane drawing above) 1 Which of the two forces (shear or normal) will drive the rock-block down slope when it fails 2 Which of the two forces will tend to resist down-slope movement of the rock mass 3 When do you think the block will begin sliding down the slope (Circle one comparison) shear = normal shear lt normal shear gt normal
Instructions
1 Determine the mass of our block-of-rock sample by using the balance in the room a Mass of Rock Block kg (HINT 1 kg = 1000 g)
b Weight of Rock Block N (Newtons) Show Calculations
2 Place the rock on the inclined plane and slowly lift the board to determine the critical
angle at which it slides down the slope (tilt the plane until the rock begins to slide) Record the angle in Table 3
3 Now repeat the experiment with various types of surfaces Record the angles in Table 3 Reduced friction Tape wax paper to the rock (place it between rock and wood) Increased friction Tape a piece of sand paper (place it between rock and wood)
Figure 3 Critical Angle apparatus
310
Table 3 Critical Angle of sliding for various surfaces
Condition of Inclined plane
Critical Angle of sliding (degrees)
Normal Force at Critical Angle
Wt x (cos θ)
Shear Force at Critical Angle Wt x (sin θ)
Rock on Wood
Rock on Wax Paper
Rock on Sandpaper
4 Calculate the normal force and shear force of the critical anglesmdashbe sure your calculator is
using degrees not radians to calculate the sine and cosine of angle θ Record in Table 3 5 How do inclined-plane results (Table 3) compare to your prediction in question 3 above 6 List some ideas as to what other physical factors may be important to slope failure that are
not part of the above equations for slope analysis
7 Based on your experiments above discuss the effects of surface friction on the critical hill slope angle at which landslides occur
8 In the absence of wax paper and sand paper on hill slopes in the natural environment what
types of factors will influence the frictional conditions and critical angles at which hill slopes fail
311
Name____________________________________
Lab Day _____ Lab Time_____________________
Post-Lab Assessment Calculations 1 Imagine you have placed yourself on a balance and determined that your body mass is
100 kg Calculate your weight in units of Newtonrsquos (hint 1 N = 1 kgmsec2) Show all of your math work keep units with numbers
2 A car has a mass of 1000 kg and the net force exerted on the car is 0 N Use Newtons
2nd Law to calculate the acceleration of the car in msec2 Show all of your math work keep units with numbers
3 A rocket has a mass of 1000 kg and the net force exerted by the rocket engine is 2000 N
Use Newtons 2nd Law to calculate the acceleration of the rocket in msec2 Show all of your math work
Questions 1 What effect will clear-cut logging of trees have on slope stability in the Coast Range
Explain your answer in the context of todays lab experiments 2 Write a 5-10 sentence summary of the critical factors that affect landslide susceptibility in
western Oregon Think about the conditions necessary for landslides to occur and the factors that affect the critical thresholds at which they begin
41
ES 105 Laboratory 4 UNDERSTANDING GEOLOGIC TIME
Relative Dating and Fossils Radioactivity and Numerical Age Determination
Introduction The Geologic Time Scale was developed using two approaches In the first rock units were
studied and correlated between geographically distant areas using the principle of faunal succession With the discovery of radioactivity in the early 20th century numerical (or ldquoabsoluterdquo) ages could be applied to the Geologic Time Scale In this weekrsquos lab you will explore both of these aspects of geologic time
First you will investigate the Geologic Time Scale and examine how features of the geological record ndash species of fossils and other features ndash can be used to correlate geological events In this approach geologic events are placed in a correct sequence and the relative age (which layerstrata is older and which is younger) of the events is determined
You will then explore the concept of half-life One half-life represents the time it takes for half of the radioactive parent isotopes to decay into stable daughter isotopes Numeric ages are calculated from rock samples by comparing the amount of daughter isotope in the rock to the amount of remaining parent isotope because different radiometric isotopes decay at known statistically constant rates Radiometric dating thus provides Earth scientists with a powerful tool to investigate Earth history Goals and Objectives
bull Construct a geologic time scale to gain an understanding of the timing of major events in Earthrsquos history
bull Use fossils to constrain the ages of sedimentary strata and to correlate strata of different thicknesses
bull Develop a conceptual understanding of half-life bull Calculate half-life from counts of decay to daughter atoms bull Determine ages of materials using half-life radioactive decay techniques
Useful websites
bull httpwwwgeosocietyorgsciencetimescaletimesclhtm bull httppubsusgsgovgipfossilssuccessionhtml bull httppubsusgsgovgipgeotimeradiometrichtml bull httpevolutionberkeleyeduevolibraryarticlehistory_23
42
Name____________________________________
Lab Day _____ Lab Time_____________________
Pre-lab Questions ndash Complete these questions before coming to lab 1 Define the following terms prior to arriving at your lab section
A Geologic period
B Stratigraphic correlation
C Parent atom
D Daughter atom
E Isotope 2 Your lab period lasts 110 minutes If your lab instructor spends 20 minutes introducing the
lab and giving instructions what percentage of the lab will you have spent listening to your instructor talk Show your calculations
3 The oldest known crustal rock is 38 billion years old Give this age in millions of years
Show your calculations Include units with the numbers 4 Briefly describe and graphically represent (draw a diagram) the concept of half-life in the
space here
43
Part A mdash Scale Modeling of Geologic Time and Earth History As an introduction to the duration and extent of Earth history you will work in lab groups to build a scale model of significant geologic events Activity Table 1 is a summary of the significant events in Earth history The geologic time interval of the events is given in the last column of the table Use this table as a reference to construct a model of geologic time Using the note cards provided build a physical model of geologic history in the hallway outside the classroom using the floor tiles as a scale for time You must decide the scale to use for your model (for example given the length of the hallway and total number of floor tiles available how many tiles will represent 1 billion years of Earth history or 1 million years) Determine an appropriate model scale and lay out your note cards in the appropriate order and at the appropriate scaled distance along the hallway Your scale should be such that all of the note cards are not piled on top of one another Questions 1 What scale did your group use for the physical model of geologic time (answer in number
of floor tiles billion years)
2 Examine your scale model noting how the spacing of events changes Sketch your model of the geologic time line below with spacing generally to scale
44
Table 1 Summary of Significant Events in Geologic Time (from oldest to youngest)
Years Before Present
Event in Earth History Event occurred during this Geologic Time Interval
46 billion Estimated origin of Earth
Pre
cam
bria
n Ti
me
Beginning of Hadean Eon 38 billion Oldest known crustal rocks Beginning of Archean Eon
30 billion Oldest known fossil life (stromatolites = fossil mats of bacteriablue-green algae) Archean Eon
25 billion Evidence of glaciations climate impact preserved in the rock record (ancient glacial deposits)
Start of Proterozoic Eon
18 billion Multicellular algae preserved in the fossil record Proterozoic Eon
700 million Oldest well-documented worm burrows preserved in rock record Late Proterozoic Eon
540 million
Invertebrate marine organisms abundant (trilobites brachiopods)
Pale
ozoi
c Er
a
Start of the Paleozoic Era Cambrian Period
430 million First jawed fish vertebrates evolve first early land plants Silurian Period
370 million Amphibians evolve (water-land animals) fish abundant Devonian Period
300 million Reptiles evolve amphibians abundant coniferous land forests abundant Carboniferous Period
245 million
Mass extinction event many invertebrates become extinct End of Permian Period
220 million Dinosaurs evolve first mammals evolve
Mes
ozoi
c E
ra Triassic Period (Mesozoic Era)
200 million First birds evolve dinosaur city Jurassic Period (Mesozoic Era)
100 million Flowering plants evolve mammals become very diverse dinosaurs still around Cretaceous Period (Mesozoic Era)
66 million Mass extinction event dinosaurs become extinct (global asteroid impact event)
End of Cretaceous Period (Beginning of Cenozoic Era)
55 million Global greenhouse climate warm and toasty on the planet mammals diversify
Cen
ozoi
c E
ra
Eocene Epoch (Tertiary Period)
35 million Global cooling of climate start of the glacial climate cycles glaciers develop on Antarctica Oligocene Epoch (Tertiary Period)
3 million Hominids (man) evolve from hominoids Pliocene Epoch 2 million Massive ice sheets in North America Start of the Pleistocene Epoch 18 million Homo erectus evolves (precursor to modern) Pleistocene 300000 Homo sapiens evolve Pleistocene Epoch 10000 Modern humans take over Holocene Epoch 0 years You and I sit here thinking about it Late Holocene
45
Part B ndash Time and Stratigraphy For this part of the lab you will use a beaker sediment and fossils to explore the relationship of time and correlation in geology Obtain the materials for this activity Follow the instructions record your observations and answer the questions in the spaces provided Procedure 1 Pour a few centimeters of sand into the beaker Level the sand by gently shaking the jar
from side to side 2 Place an Ordovician fossil on top of the sand layer 3 Pour a few centimeters of gravel on top of the sand and shell 4 Place a Devonian fossil on top of the gravel layer 5 Cover the gravel layer and shell with a few more centimeters of sand 6 On the left side of the diagram below sketch the contents of your beaker actual thickness
Label the two sand layers the gravel layer and the two fossils along with the geologic ages of the fossils
7 Trade beakers with another group or set your beaker by the fossil and sediment supplies 8 Measure the size of an individual grain of sand in millimeters and record the grain size in the
data table (Table 2) Estimate the average size of the gravel in millimeters and record the grain size in the data table (Table 2)
9 Measure the thickness of your layers in millimeters and record in the data table (Table 2) Your Group Other Group (see pg 49 q 8)
46
Table 2 Data table for Time and Stratigraphy activity
Answer the following questions 1 If a bed of sand a single grain in thickness was deposited once each year how long would it
take to form beds with the thickness of the sand layers in your beaker Determine for both lower and upper sand layers Show calculations below and record answers in Table 2 above
2 If the minimum thickness of a gravel bed were a single grain of gravel in thickness how long
would it take to form your gravel layer if one grain-thickness was deposited each year Show calculation below and record answer in Table 2 above
3 Compare the relative age of the lower sand bed to the Ordovician fossil Is the sand
younger or older than the fossil What about the gravel
Layer Grain size
(mm) Thickness
(mm)
Time to deposit layer (years) ndash calculated in
Questions 1 amp 2 below
Upper sand
Gravel
Lower sand
47
For the following questions refer to the Geologic Time Scale Answer in terms of PERIOD listed on Geologic Time Scale not absolute age in millions of years 4 Assuming that the lower fossil in your beaker was deposited in the Ordovician Period what
is the OLDEST that the gravel bed could be (Answer in terms of Period listed on Geologic Time Scale)
5 What is the YOUNGEST that the lower sand bed could be (Answer in terms of Period listed
on Geologic Time Scale) 6 Assuming that the upper fossil was deposited during the Devonian Period what is the
YOUNGEST possible age of the gravel layer (Answer in terms of Period listed on Geologic Time Scale)
7 What is the OLDEST possible age of the upper sand layer (Answer in terms of Period listed
on Geologic Time Scale) 8 Borrow a jar from another group On the right side of the diagram on page 6 sketch and
label the sediment layering in the other grouprsquos jar Draw lines between the columns to CORRELATE (match) the layers fossils and geological ages You have just demonstrated how geologists relate rocks in one area to those in another area
9 Do you think fossil or the type of sediment is more important in correlating of rock units
between different areas Explain your answer
GGeologicc Time Scale
hhttpgeologgycomtime
48
ehtm
49
Part C ndash Exploring the Concept of Half-Life The determination of Earth history by numerical ages is achieved from measurements of
radiometric isotopes found in some rocks and other Earth materials The PARENTDAUGHTER ratio may be used to calculate the absolute age of a rock sample Recall from lecture that numerical (or absolute) ages for geological events are derived from the measurement of certain radioactive isotopes in Earth materials Isotopes are atoms of an element that have differing numbers of neutrons in their nuclei Various isotopes of the chemical elements are radioactive meaning that the nucleus is unstable and decays (disintegrates) by emitting one or more particles which are designated as alpha (α) beta (β) and gamma (γ) This decay usually changes the original radioactive isotope (PARENT) into a different isotope (DAUGHTER) For example 238U 234Th + α
While the time interval before each individual nuclide disintegrates is random each known isotope has a determined half-life value which represents the rate of isotope decay A second half-life is reached when half of the remaining radioactive parent decays and so on Hence half-life is the time during which each nucleus has a 50 chance of disintegrating
In this activity you will explore the basic concept behind radioactive decay and half-life You will need a cup 100 pennies and a calculator for this activity You will treat these pennies as if they were radioactive isotopes that are decaying A penny that lands heads up is a parent isotope and a penny that lands tails up has ldquodecayedrdquo into a daughter isotope Procedure
1 Count your set of pennies to make sure you have 100 For Trial 1 put the pennies into the cup and shake vigorously Pour the pennies out on the table count how many pennies are heads up record result in Table 3 and calculate the percentage of heads up pennies [(heads up)(total of pennies poured out on that trial)] and record in table
2 For Trial 2 put the heads-up pennies back into the cup and set the tails-up pennies aside Repeat step 1 making the same calculation as above and record results in Table 3
3 For Trial 3 put the heads-up pennies back into the cup and set the tails-up pennies
aside Repeat step 2 making the same calculations as above Record results in Table 3
4 Continue this process until the pennies are gone recording the results in Table 3
410
Table 3 Results of penny experiment
Trial Number of Heads of Heads Up in Trial 1 2 3 4 5 6 7 8 9
10
Instructions Plot the results of this experiment on the graphs below (Figures 1 and 2)
On Figure 1 graph the total number of heads-up pennies for each trial On Figure 2 graph the percentage of heads-up pennies for each trial
100 90 80 70 60 50 40 30 20 10
Trial 1 2 3 4 5 6 7 8 9 10
Figure 1 Graph showing the total number of heads up pennies for each trial
100
90
80
70
60
50
40
30
20
10
Trial 1 2 3 4 5 6 7 8 9 10 Figure 2 Graph showing the percent of heads
up pennies in each trial
411
Questions 1 Is your graph of the total number of heads up pennies per trial (Figure 1) a linear or
exponential (curved) relationship Explain why you think the graph has this shape 2 What would be the predicted ratio of heads to tails in each trial Is this prediction verified by
the results of this experiment displayed in Figure 2 3 The number of radiometric parent and daughter isotopes in even a small sample of rock is
huge however statistical errors still must be accounted for This is one source of uncertainty in radiometric dating methodology Make a generalized statement about the statistical reliability of the headstails experiment That is how does the number of pennies used in the experiment increase or decrease the reliability of the results (Notice your results as the number of pennies decreases as you have graphed in figures 1 and 2)
4 How reliable would the results be from an experiment starting with billions of pennies Explain
412
Part D ndash Determining the Half-Life of 137Ba The isotope 137Cs has a half-life of 30 years and decays by the reaction
137Cs 137Ba + β where β is a beta particle (an electron from a nucleus) and 137Ba is an isotope of barium in the excited state The symbol denotes the excess energy that the barium nucleus has after it has formed through beta decay from cesium The barium nucleus loses the excess energy by releasing a gamma particle (high-energy electromagnetic particle) given by the following reaction
137Ba 137Ba + γ The half-life of this nuclear reaction is a few minutes To measure the half-life it is enough to measure the activity of a sample of 137Ba starting from the time it is formed until a significant amount has decayed The 137Ba source is produced by passing an eluting solution (slightly acidic saline solution) through a sample of 137Ba The 137Ba is dissolved into the eluting solution but the 137Cs is not dissolved So the solution contains only 137Ba
Procedure Your instructor will provide the solution to you and assist with the experiment 1 Place 3 drops of eluting solution containing the 137Ba on a watch glass 2 Place the watch glass under the Geiger counter 3 Start recording data by clicking START Record data until the decay rate shown on the
graph stops changing This should take about 10 minutes 4 Click STOP Print enough copies of the graph so that all of your group members have one 5 Draw (by hand) a best-fit curve through the data points on your graph extrapolating
the curve back to where it intersects with the y-axis of the graph Remember a best-fit curve does not connect the data points on the graph Instead a best-fit curve is a smooth curve that comes as close as possible to all of the data points without necessarily going through most of them You will use the graph to analyze the data and answer the questions on the following pages
413
Data Analysis and Questions Follow the directions and complete the table provided below to estimate three independent values for the half-life of 137Ba from your graph of the activity 1 Using your best-fit curve find the count rate at time zero of the data collection run and
record this as the starting count rate value in 1 of Table 2 below Next using the best-fit curve find the count rate that is approximately one-half of the original value and record this as the ending count rate in line 1 of the data table Also record the time at which one-half the original count rate is reached as the time at the end of the interval
2 Enter the ending time and final count rate from 1 as the starting time and count rate for 2 on the data table Use the best-fit curve find the count rate that is approximately one-half of the starting count rate Record this final count rate value as well as the time at which the value is reached
3 For line 3 do not use the ending count of line 2 Instead pick a point near the higher end of the count data along the best-fit curve that is easily divisible by two and record the starting time and this starting count rate in 3 of the data table Find the point on the best-fit curve where the count rate drops to approximately one-half your original count value Record the ending count rate and ending time as before
4 Calculate the half-life of 137Ba for 1 2 and 3 and record in Table 2 Table 2 Table for data analysis and estimation of half-life values
Time at starting count rate (start of interval)
Starting Count Rate (at the start of interval)
Ending Count Rate (half of starting count rate)
Time at ending count rate
Half-life for 137Ba (end time minus start time)
1 00
2
3
1 Do the half-life values agree Explain why or why not
2 Determine the average value for the half-life of 137Ba______________________________
414
Name____________________________________
Lab Day _____ Lab Time_____________________ POST-LAB ASSESSMENT 1 Based on your physical and quantitative models of Earth history assess the importance of
modern humans in the relative framework of biologic and physical evolution of the planet 2 Convert the following decimal values to percents and reduced fractions
Decimal Percent Fraction
050
025
0125
00625
003125
Your prelab diagram of half life may help you visualize the following questions 3 You have 1224 mg of freshly prepared gold-189 half-life 30 min How much of the gold-
189 sample remains after five half-lives 4 A piece of fossilized wood has carbon-14 activity one-eighth that of new wood How old is
the artifact The half-life of carbon-14 is 5730 years 5 A sample of a particular radioisotope is placed near a Geiger counter which is observed to
register 160 counts per minute Eight hours later the detector counts at a rate or 10 counts per minute What is the half-life of the material
5-1
ES 105 Laboratory 5 INTRODUCTION TO CHEMICAL REACTIONS
Introduction
By definition a physical change is one in which only the physical characteristics such as state (gas liquid or solid) size density or color of a substance is changed without changing its composition Ice melting is an example of a physical change (solid to liquid change of state) A chemical change results in the formation of one or more NEW substances with different composition and properties from the original substances When a match burns the ashes and smoke are very different than the original match In todayrsquos lab you will observe a number of different chemical changes
A chemical change is accomplished by rearranging atoms through breaking and reforming of chemical bonds in a chemical reaction The actual rearrangement of atoms ndash bond breaking and reforming ndash is not directly observable Because we cannot see this process we have to use indirect evidence to infer that a chemical change has occurred These indirect lines of evidence include production of gas production of a solid (precipitate) release of heat (exothermic reaction) absorption of heat (endothermic reaction) change in pH andor change of color (unless using indicators to check for acids or bases) Goals and Objectives bull To acquaint students with the nature chemical changes bull To identify whether a chemical change has occurred based on a series of observations bull To study and explore basic types of chemical reactions bull To perform a series of experiments make observations and determine whether a
chemical reaction has occurred Useful Websites
bull httpwwwricedufacultyptiskusreactions bull httpwwwchemtutorcomreacthtm bull httpwwwmcwdnorgchemistpcchangehtml
5-2
Name____________________________________ Lab Day _____ Lab Time_____________________
Pre-Lab Activities Answer the following questions Use the material presented in the lab your lecture materials and text to assist in answering these questions 1 How is a chemical change different from a physical change How can you determine
whether a chemical change has occurred List at least three observations that may indicate a chemical change has occurred
2 In chemistry what is a lsquoreactantrsquo
3 Define endothermic 4 Define exothermic 5 If a reaction container feels warmer after the reaction has occurred was the reaction
endothermic or exothermic
5-3
SAFETY NOTES Be sure to read and understand before proceeding
For safety reasons before you begin this laboratory all books packs and coats
must be stored at the front of the room
Be sure that all of the equipment that should be in your kit is there and that it is clean
and ready to use For some of the reactions it is very important to have clean
equipment and not to introduce contaminants Contamination can produce incorrect
results If you are unable to clean a piece of equipment ask your instructor if you
need to replace it at this time
Be sure to follow instructions carefully Use the proper measurements as indicated
in the instructions Be observant
In some of the experiments you will be mixing acids and water The rule is
ALWAYS ADD ACIDS TO WATER NEVER ADD WATER TO ACIDS
When you are through with the lab be sure that you leave the equipment as you
would like to find it Remember there are many other students using the same
equipment over the course of the quarter
The Golden Rule of Chemistry Labs
LEAVE THE LAB FOR OTHERS AS YOU WOULD HAVE THEM LEAVE IT FOR YOU
WEAR YOUR GOGGLES
5-4
Part A ndash Indicators Chemical fluids are often acidic or alkaline (basic) The pH of a solution describes its
acidic or alkaline character Neutral pH is 7 acidic solutions range from pH 0 to 7 alkaline solutions range from pH 7 to 14 The number comes from the negative log of the hydrogen ion concentration (or pH = mdashlog [H+]) Solutions are characterized as acidic or alkaline according to their pH
Indicators are particular substances added to solutions that change color according to the pH (acidity or alkalinity) of the solution They are highly useful in measuring the pH of a solution quickly and quite accurately Indicators are used in a wide range of fields (environmental forensics petroleum) to determine the concentration of a chemical of interest with great accuracy There are many pH indicators used in chemistry each with their own color changes and active pH range One of the most common pH indicators is phenolphthalein Phenolphthalein is an ionic substance that changes color in solutions that have a particular pH range Activity 1 Pour 1-2 mL of 01 M Sulfuric Acid H2SO4 into a test tube Add 3-4 drops of phenolphthalein solution Place a stopper on the tube and shake gently Record result in Table 1 Do not throw out solution as you will need it for Activity 3 Activity 2 Place 5 mL of distilled water in a large test tube Using your forceps (tweezers) put a small pellet of sodium hydroxide NaOH into your test tube Gently tap the tube in the counter if the pellet is stuck to the side of the tube NEVER HANDLE NaOH WITH YOUR FINGERS It is strongly alkaline and will burn your skin Place a rubber stopper on the test tube and shake gently Remove the stopper and add 3-4 drops of the phenolphthalein solution to the tube Place the stopper back on the test tube and shake it gently Observe the tube for a few minutes Record result in Table 1 below Do not throw out solution as you will need it for Activity 3 Activity 3 Use pH paper (measures the specific range from pH 1 ndash 14) and determine the pH number associated with each solution in Activity 1 and 2 Record results in Table 1 below You are done with the solutions so discard solutions and rinse out test tubes Table 1 pH of solutions Fluid Character
(acidalkaline) Response of phenolphthalein indicator
pH number
Dilute H2SO4
Dilute NaOH
Question 1 Phenolphthalein is an indicator for what pH character
5-5
Part B ndash Studying Chemical Reactions In this part of the lab you will work through a sequence of experiments make observations
and determine whether a chemical reaction has occurred Follow the instructions to do the experiments in the containers specified not in the small tubes containing the reactants As you progress through this portion of the lab complete lsquoTable 2 Observationsrsquo on the following page Allow cloudy solutions to sit in the test tube rack to see if a precipitate settles out Include this information in your observations Experiments 1 Add 5 mL of tap water to a large test tube Grasp the tube by wrapping your hand around it
Notice the temperature of the tube Add ammonium chloride crystals NH4Cl to this test tube Close the tube with a rubber stopper and shake gently Notice the change in temperature of the tube as the crystals dissolve Record your observations in Table 2
2 Pour 1 mL of 01 M potassium bromide KBr into a large clean test tube Add 1 mL of 01 M
sodium chloride NaCl to the KBr Record your observations in Table 2
For reactions 3 and 4 take two clean test tubes 3 place1 mL of 01 M sodium chloride NaCl in one test tube
4 and place 1 mL of 01 M Potassium Chromate K2CrO4 in the other test tube
Add a few drops of 01 M silver nitrate AgNO3 to each Record your observations for each in Table 2
5 Pour 5 mL of 1 M hydrochloric acid HCl into a clean test tube Carefully add a small chip of
calcium carbonate CaCO3 to the acid Record your observations in Table 2 6 Take the test tube containing sodium bicarbonate (baking soda) NaHCO3 from your kit Add
several drops of acetic acid (vinegar) HC2H3O2 Record your observations in Table 2 Complete Table 2 by determining whether a reaction took place for each of the experiments you performed and describe the evidence in support of a reaction taking place
5-6
Table 2 Observations from chemical reaction experiments
Has
a c
hem
ical
re
actio
n oc
curr
ed
Obs
erva
tions
(F
izze
s) (
Prec
ipita
te fo
rms)
(co
lor c
hang
e)
(Tem
pera
ture
Cha
nge)
or
()
Writ
e ch
emic
al n
ames
of
reac
tant
s
(eg
Am
mon
ium
chl
orid
e +
wat
er)
Expe
ri-m
ent
1 2 3 4 5 6
5-7
Questions 1 Which chemical reactions produced a new phase
List by experiment number in the proper column in the table below Some of the reactions may have not created a new phase some may have created more than one new phase
CREATED SOLID PHASE CREATED LIQUID PHASE CREATED GAS PHASE
2 Is a new phase always an indication of a chemical change Explain
3 Which reactions were exothermic (gave off heat) How could you tell
4 Which were endothermic (absorbed heat) How could you tell 5 Is a color change a reliable indicator of a chemical reaction Explain
6 What gas was released in Experiment 5 How might you test for the type of gas released
during a chemical reaction
5-8
Part C ndash Endothermic and Exothermic Reactions In this part of the lab you will use a TEMPERATURE SENSOR interfaced with a computer to study one exothermic reaction and one endothermic reaction
Procedures (wear your googles) Activity 1 Citric acid solution and baking soda
The equation for this reaction is H3C6H5O7 (aq) + 3 NaHCO3 (s) 3 CO2 (g) + 3 H2O (l) + Na3C6H5O7 (aq)
citric acid baking soda
1 Place a Styrofoam cup into the 250 mL beaker as shown in the diagram provided by your instructor Put 30 mL of 15 molar citric acid into the cup Place the temperature sensor into the citric acid solution
2 Weigh out 50 g of solid baking soda on a piece of weighing paper 3 Start recording data by clicking START 4 Wait 20 seconds and then add the baking soda to the citric acid solution Stir gently and
continuously with the temperature sensor to ensure good mixing 5 Use the DataStudio program to record data until the reaction is complete After the data has
been recorded dispose of your reaction products as directed by your instructor Rinse the Temperature sensor with distilled water
Activity 2 Magnesium and hydrochloric acid
The equation for this reaction is Mg (s) + 2 HCl (aq) H2 (g) + MgCl2 (aq)
magnesium hydrochloric acid
1 Measure out 30 mL of 05 molar HCl solution into a second Styrofoam cup and place the Temperature Sensor into the HCl solution
2 Obtain a 20 cm piece of shiny magnesium metal from your instructor 3 Start recording data by clicking START After 20 seconds add the magnesium ribbon to the
acid solution Stir gently and continuously with the temperature sensor to ensure good mixing
4 Use the DataStudio program to record data until the reaction is complete After the data has been recorded dispose of your reaction products as directed by your instructor Rinse the Temperature Sensor with distilled water
5 Click TABLE from the left hand menu Set up your Table display so it shows both experiments
6 Find the minimum and maximum values for temperature for the citric acidbaking soda and the MgHCl experiments Record the initial temperatures in your data table Then record the minimum or maximum value as the final temperature
5-9
Results Calculate the temperature change for each reaction by subtracting the initial temperature from the final temperature
Citric Acid-Baking Soda Hydrochloric Acid-Magnesium
Final Temperature (oC)
Initial Temperature (oC)
Temperature Change (oC) (Use correct sign)
Was reaction Endothermic or Exothermic
Questions about endothermic and exothermic reactions 1 Which reaction had a negative temperature change Is the reaction endothermic or
exothermic Explain 2 For each reaction describe three ways you could tell a chemical reaction was taking place 3 Which reaction took place at a greater rate (produced a temperature change Faster or
Slower) Explain your answer
5-10
Name____________________________________
Lab Day _____ Lab Time_____________________ POST-LAB ASSESSMENT 1 What type of change (physical chemical or both) occurs when ice becomes water
2 When you apply rubbing alcohol to your skin you feel a cooling effect Is a chemical
reaction taking place Explain 3 When you apply hydrogen peroxide to a cut there are bubbles released Is a chemical
reaction taking place Explain 4 What factors affect the rate of a chemical reaction
5 List some chemical reactions that are useful or annoying in your daily life
6-1
ES 105 Laboratory 6 STUDY OF SEDIMENTS AND SEDIMENTARY ROCKS
Introduction Rocks are the materials of Earth and understanding their origin and how they change enables
us to begin to understand Earth and its processes Rocks are aggregates of minerals and are classified into three groups based on the processes that formed them Igneous Sedimentary and Metamorphic This lab focuses on some of the common sedimentary rocks which are formed at the surface of Earth
Sedimentary rocks can form from the consolidation and lithification of particles called sediment Sediment is created either by physical processes breaking pre-existing rocks into smaller particles or by inorganic or organic chemical processes where mineral material is precipitated from solution Sedimentary rocks can also form by the precipitation of mineral material from solutions containing dissolved mineral materials
Sedimentary rocks form at or near Earthrsquos surface in many different environments including oceans (marine) streams (fluvial) lakes (lacustrine) deserts (eolian (wind)) and alpine (glacial) Some sedimentary rocks have features that reveal a great deal about the environment in which they formed For example the degree of rounding of the particles the presence and nature of fossils and the mineral composition may help decipher the conditions in ancient environments These observations provide clues about ancient Earth history and also aid in finding potential fossil fuel deposits
A handful of minerals are commonly found in association with sedimentary rocks including quartz potassium feldspar plagioclase feldspar mica (muscovite and biotite) calcite halite gypsum clay minerals and hematite You will examine most of these minerals at the beginning of this lab activity Goals and Objectives
bull To become familiar with minerals commonly associated with sedimentary rocks bull Investigate the characteristics of sediment grains bull Recognize the classes of sedimentary rocks (Clastic and Chemical) and be able to
distinguish samples of each type bull Classify and name samples of sedimentary rocks by their composition and texture
Useful Websites
bull httpwwwphysicalgeographynetfundamentals10fhtml bull httpwwwwindowsucaredutourlink=earthgeologysed_clastichtml bull httpwwwwindowsucaredutourlink=earthgeologysed_chemicalhtml bull httpreynoldsasueduglg103sed_env_starthtm
6-2
Name____________________________________
Lab Day _____ Lab Time_____________________
Prelab questions Complete prior to arriving at your lab section Define TERMS that are in CAPITAL LETTERS and answer the questions below 1 CLASTIC SEDIMENTARY ROCK (also called detrital sedimentary rock)
2 What is the most common clastic sedimentary rock 3 CHEMICAL SEDIMENTARY ROCK 4 What is the most common chemical sedimentary rock 5 CEMENTATION (of clastic rocks) 6 List common sedimentary rock cements
6-3
Part A ndash Observing Sediment Grains In this part of the lab you will examine examples of common sediment grains with a
magnifying glass record your observations and provide sketches of the grains When you look at each sample of grains notice the shapes sizes distribution of sizes and variety of composition of the grains
bull Grain Shape can be well rounded subrounded subangular and angular bull Grain Size size becomes smaller and more rounded with more time in the
transportation system It is a clue to the environment of deposition Use millimeters (mm) to record the grain sizes
bull Grain Sorting is a term to describe the range of sizes present Well Sorted = grains are all about the same size Moderately Sorted = largest grains are 4 to 5 times the size of the smallest Poorly Sorted = largest grains are 5 to ten times the size of the smallest
bull Grain mineral types Often noting the colors of grains can be useful Include quartz (the most common) feldspar mica and rock fragments Fossils may indicate an adjective (fossiliferous) be added to sedimentary name
bull Cements are the ldquogluerdquo that hold together the grains Include calcite silica iron oxide gypsum and halite
Activity 1 Loose Sediment Grains
Study the samples of sediment grains that have been provided Complete the tables on the following page For each sample describe the general shape of the grains record the average grain size and the range of grain sizes describe the sorting list the grain types (or colors of individual grains) Use Table 1 to suggest (name) what the likely sedimentary rock would be formed from the sediment Also make a simplified sketch of the sediment grains showing the sorting and grain shape
Table 1 Grain sizes of clastic sedimentary rocks
Size descriptions Sediment Particle size Rocks formed from it
Coarse
Fine
Gravel
Boulder gt256 mm (10 in) Conglomerate (rounded grains)
Breccia (angular grains) Cobble 64-256 mm
Pebble 2 to 64 mm
Sand 00625 ( frac124) to 2 mm Sandstone
Mud
Silt 00039 ( frac128) to 00625 mm Siltstone
Clay lt00039 mm Mudstone (massive) Shale (bedded)
6-4
Sample 2 Observations Sketch of the sediment
General shape of grains
Average grain size
Range of grain sizes
Description of sorting
List of grain types
Probable rock type formed
Sample 3 Observations Sketch of the sediment
General shape of grains
Average grain size
Range of grain sizes
Description of sorting List of grain types
Probable rock type formed
Sample 4 Observations Sketch of the sediment
General shape of grains
Average grain size
Range of grain sizes
Description of sorting
List of grain types
Probable rock type formed
Sample 1 Observations Sketch of the sediment General shape of grains
Average grain size
Range of grain sizes
Description of sorting
List of grain types
Probable rock type formed
6-5
Part B ndash Introduction to Classifying Sedimentary Rocks Examine the sedimentary rock study sets provided and answer the following questions 1 Study the set of sedimentary rocks provided Place those that are made of pieces or
fragments of mineral andor rock material (but not the rocks that have shells or shell fragments) on one tray and the rocks made of organic material (like shells or coal) or of crystals on the other tray One group of samples is the CLASTIC SEDIMENTARY ROCKS The other group is the CHEMICAL SEDIMENTARY ROCKS
DO NOT CONTINUE TO (2) BEFORE YOUR INSTRUCTOR CHECKS YOUR WORK 2 In the spaces below list the sample numbers that occur in each group
Clastic Sedimentary Rocks
Chemical Sedimentary Rocks
Keep the rocks on these trays You will be asked to use one tray or the other for Part B 3 Use the clastic rock tray Pick up each specimen and look at the size of the grains (the
fragments of which it is composed) Use a magnifying lens and ruler to measure size of the grains Separate the clastic specimens into two groups based on the grain size those that have large grains (big enough to distinguish without a magnifying lens) from those that have small grains (too small to see individual grains without a magnifying lens) In the spaces below list the sample numbers that occur in each grain-size group
Coarse-grained Clastic Rocks
Fine-grained Clastic Rocks
4 Study one of the coarse-grained clastic rock samples Indicate which one you chose
Describe and sketch this specimen showing the grains and the surrounding material
6-6
5 Use the chemical sedimentary rocks Because they form from a wide variety of processes some chemical sedimentary rocks are Inorganic or crystalline (appear homogeneous) while others consist of Organic material including plant material shells and shell fragments Separate the chemical sedimentary rocks that are crystalline from the ones that are organic and write the specimen number in the table below
Inorganic (or crystalline) Chemical
Sedimentary Rocks
Organic Chemical Sedimentary Rocks
Limestone is the most abundant chemical sedimentary rock It is made of the mineral calcite
Calcite reacts with hydrochloric acid (HCl) When a drop of dilute HCl is placed on calcite it fizzes vigorously This is a good test for limestone Limestone comes in many different varieties which form by numerous processes The calcite can precipitate directly from seawater form as dripstone in cave formations or be incorporated into shells by marine organisms After an organism dies its shell can become calcite sediment Calcite also sometimes precipitates in the spaces between clastic grains as cement to hold the rock together 6 Test all of the sedimentary rocks with HCl and briefly describe your results List the
samples that react to HCl and describe the nature of the fizzing (vigorous or minimal) SAFETY NOTE Although dilute HCl is not dangerous it can irritate skin and occasionally cause damage (small holes) to fabricclothes Be careful when using it Please rinse your table top off if any spilt on it
HCl tests on chemical rocks
HCl tests on clastic rocks
6-7
Part C ndash Classification of Sedimentary Rocks
(NOTE you do not have specimens of every rock included in the classification tables) Activity 1
1 Classification of sedimentary rocks starts with determining if the rock is clastic or chemical
2 Begin your identification by describing the texture (grain size and shape) and composition (color of sediments) of the rocks listed in Table 6
3 Identify the rocks in the study set using the classification charts (Table 2 and 3) and your description
4 Complete Table 4 with the correct rock names including terms that describe special features of note about a rock is appropriate
Clastic Sedimentary Rocks are made from deposits of broken andor weathered rock Clastic rocks are first classified by the size and shape of the particles and secondly by the composition of the particles within the rock
Table 2 Clastic Sedimentary Rock Classification
Particle Size Characteristics Rock Name
gt 2mm (bb size) Grains are angular Breccia (say brech-chia)
Grains are rounded Conglomerate
2 mm to nearly microscopic
Sand grains consisting of pure quartz Quartzose Sandstone
Sand grains consisting of dark fragments and quartz Lithic Sandstone
microscopic Typically layered and soft MudstoneShale
6-8
Chemical Sedimentary Rocks are derived from material that had been dissolved in water They are composed of crystals that precipitated from water by physical or organic processes They may have formed when water evaporated in shallow lakes leaving chemicals behind to form evaporite deposits They are also are formed by organisms extracting dissolved material to create their hard parts For this reason deposits of shell debris or plant material are considered chemical sedimentary rocks In some cases the shell material is easily observable but in other cases the shells cannot be seen without a microscope Note that fossil-rich is used as a descriptor for any rock containing visible fossils
Table 3 Chemical Sedimentary Rock Classification
Mineral Composition Characteristics Rock Name
calcite Fizzes in HCl massive is fine grained oolitic contains small concentric balls
Limestone (use descriptors like massive fossil-rich oolitic)
calcite Dull appearance soft fizzes in HCl Chalk (not included in lab set)
calcite Composed mostly of visible shell fragments has large pore spaces fizzes in HCl
Coquina
quartz group Dense porcelain like sometimes sharp edges hardness = 7 Chert
gypsum Soft hardness = 2 Rock Gypsum (not included in lab set)
halite Translucent cubic cleavage salty taste (do not taste lab samples) Rock Salt (not included in lab set)
opal Dull appearance soft does not fizz Diatomaceous Earth (not included in lab set)
carbonplant material Glassy black brittle low density Coal
6-9
Table 4 Sedimentary Rock Description Table
Rock
Clastic or Chemical
Composition (light or dark grains)
ldquoTexturerdquo Grain Size Grain Shape Grain Sorting Rock Name
1
2
3
4
5
6
7
8
9
10
11
6-10
Name____________________________________
Lab Day _____ Lab Time_____________________ POST LAB ASSESSMENT QUESTIONS
1 List three sedimentary rocks (from table 2 andor 3) that are the most likely to contain fossils Explain why this is so in terms of composition and environment of formation
2 What is a good test to determine if a sedimentary rock is limestone Does this test cause a
physical change or chemical reaction Explain how you can tell 3 Why is the study of sedimentary rocks important for understanding how and where fossil
fuels such as oil natural gas and coal (hydrocarbons) are likely to be found
71
ES 105 Laboratory 7 INTRODUCTION TO TOPOGRAPHIC MAPS
Introduction
Topographic maps contain a wealth of information which can be valuable to those who learn how to use them Topographic maps also called contour maps represent the three-dimensional the surface of Earth on a two-dimensional piece of paper Unlike other maps topographic maps show natural features with a fair degree of accuracy in terms of width length and thickness (height or depth) Geologists make use of topographic maps as a means of studying features in three dimensions By examining the features and symbols of a topographic map a geologist can become familiar with Earth features and draw conclusions about the geologic processes that led to their formation Goals and Objectives bull Become familiar the information available on topographic maps bull Learn to use map scales to find distances bull Visualize the shape of the Earths surface using contour lines and topographic profiles bull Depict the third dimension of Earthrsquos surface from the various elements of topographic maps Useful Websites bull httpwwwtopozonecom bull httptopomapsusgsgov bull httpergusgsgovisbpubsbookletssymbols
72
Name____________________________________ Lab Day _____ Lab Time_____________________
Pre-lab Activities Complete these before coming to lab Find the following unit equivalents
1 mile = ________________ feet 1 km = ________________ meters
1 foot = ________________ inches 1 meter = ________________ centimeters
1 mile = ________________ kilometers 1 km = ________________ miles
1 inch = _______________ centimeters 1 cm = ________________ inches
1 Convert 7920 feet to miles (Hint see following page is you donrsquot know how to do this) Show each step or combined steps needed to complete the conversion
2 If a map has a scale of 124000 how many miles does 75 inches on the map represent
Show your calculations with units
3 If a stream channel is 50 feet lower elevation at one location than at a point 25 miles upstream of that location what is the gradient of the stream between those two sites Show your calculations with units
4 Define the following terms with respect to stream systems
a Velocity
b Discharge
c Gradient
73
Activity 1 Compare this list of steps to convert 15 inches into feet to the table below
1 Write 15 inches as a fraction using a horizontal fraction bar (see 1 in table)
2 Put a multiplication sign after the fraction aligned with the fraction bar Write another fraction bar after the multiplication sign using a horizontal line (see 2 in table)
3 Choose the unit equivalent needed to convert from the information above (see 3)
4 Write the lsquoinchesrsquo part of the unit equivalent on the opposite side of the second fraction bar as lsquoinchesrsquo is in relation to the first fraction bar Write the lsquofeetrsquo part of the unit equivalent on the opposite side of the second fraction bar as its equivalent inches has been written (see 4 in table)
5 Put an equal sign after the expression multiply as indicated and cross out any things found both above and below the fraction bar as a matching pair (both units and factors) Be sure to put the units remaining (feet in this example) after the final product (see 5)
Table 1
1 2 3 4 5
1in 15
times
1in 15 1 foot = 12 inches
in12ft 1
1in 15times ft 251
in 12 ft 1
1in 15
=times
Problems
1 Now use this method to convert 7920 feet to miles You can show each step or combine steps to complete the conversion as show in number 5 of the above table
Use this method to do unit conversions throughout this lab Remember to include units
74
Part A mdash Scale A topographic map is a smaller representation of a larger area The map scale is the
relationship between distance on the map and the corresponding distance on the ground The two types of map scales that are useful to the geologist are ratio and bar scales The ratio scale written 112000 for example means that one inch on the map equals 12000 inches (1000 feet) on the ground A bar scale is a line with units of distance (feet miles kilometers) marked on it The bar scale allows easy conversion of map distances to true ground distance On a topographic map both the ratio scale and the bar scale are provided in the center of the bottom margin Show your calculations and include units with numbers for these questions
1 A ratio scale of 124000 means 1 inch on the map is equal to _____________ inches on the ground
2 Convert ratio scale of 124000 to a verbal scale with 1rdquo =( how many feet)
3 Complete the table below Show calculations with units on the right side of the table
Ratio Scale Verbal Scale Math work
124000 1inch = feet
A ratio scale of 162500 means 1 inch on the map is equal to inches on the ground Convert to 1 inch = how many feet Record below in and show calculations with units
162500 1 inch = feet
Convert a map scale of 1 inch = 1 mile to a ratio scale Record below and show calculations with units
1 1 inch = 1 mile
1 In the space below draw a six inch long line Use a ruler Make this line into a bar scale using
2 inches = 1 mile Subdivide the entire scale into quarter mile sections and label the origin the divisions of the first mile and the whole miles for the rest of the scale
2 On the bar scale above one quarter inch equals ________ miles Convert this to feet Record this in the table below Also determine what is the ratio scale for this bar scale (Hint convert to inches) Show your calculations with units
Verbal Scale Ratio Scale Math work
frac14 inch = 1
75
Part BmdashTopographic Maps Topographic maps use contour lines to depict three-dimensional features on a flat piece of
paper Contour lines connect points of equal elevation on the ground surface which means for example that every point on a 60 foot contour line is 60 feet above sea level Therefore a single contour line on the map shows how and imaginary horizontal plane would intersect the Earths surface are that particular elevation The contour interval is the difference in elevation between two contour lines The contour interval on a given map is constant for the entire map The contour interval chosen depends on roughness of the terrain or relief which is defined as the difference in elevation between the highest and the lowest points on a map
______________________________________________________________________
THE FOLLOWING ARE IMPORTANT RULES ABOUT CONTOUR LINES
1 Every point on a single contour line connects points on the map that are exactly the same
elevation on the ground 2 Contour lines separate areas of higher elevation from areas of lower elevation You can
determine direction of slope of a hill by checking the values of the adjacent contour lines 3 The contour interval (the elevation between two adjacent contour lines of different
elevation) is constant for the topographic map The contour interval is chosen by the map-maker based upon the relief of the map (the difference in elevation from the highest point to the lowest point on the map)
4 Contour lines must be counted consecutively (none can be skipped) Heavier contour lines speed up counting of contour lines usually every fifth contour line is drawn heavier
5 Contour lines never cross each other (except in the very rare case where the mapped area contains an overhanging cliff) Contour lines will merge into a single contour line where mapping a vertical cliff (also a rare occurrence)
6 The spacing of contour lines reflects the steepness of slopes Widely spaced contour lines represent a gentle slope closely spaced contour lines reflect a steeper slope Evenly spaced contour lines represent a uniform slope
7 Contour lines make a V pointing upstream where they cross a channel or valley 8 Depressions (lower elevation areas enclosed within higher elevation areas) are marked by
hachures on the inside of contour lines 9 Contour lines either enclose an area (as a hill top or a depression) or they end at the map
edge On a large enough map they would all make closed forms
Activity 1 Locate areas on the Monmouth quadrangle that shows what is described in Contour Rules (4 6 7 8 and 9) above Discuss locations with lab partners and if you are not able to locate an example of rule PLEASE CHECK WITH LAB INSTRUCTOR
76
Activity 2mdashConstruct a Topographic Map from surveyed data points On Figure 1 draw all the contour lines in pencil using a contour interval of 20 feet If you have a pen put it away and get a pencil (Only one who is perfect in every way contours with a pen) Study the map and locate the higher and lower areas Refer to the rules on the previous page to assist you If you are having trouble see the sample exercises for the last website listed in the introduction to Lab 4 Lightly draw in contour lines starting either at the high elevations or the low elevations Make changes where you realize you missed a feature Use an eraser When you are finished (and satisfied) darken and label the contour values neatly
Figure 1 Topographic map construction
77
Activity 3mdashConstruct a Profile from a Topographic Map Profiles are made to illustrate the shape of the surface of the earth between two designated points These two points are at the ends of the line of profile which is drawn and labeled on the map The line is used in the construction of the profile To construct the profile use each intersection of a contour and the line of profile on the map Project a perpendicular line from this intersection to the horizontal line having the same elevation as that contour line Make a dot on the profile for each intersection of a contour line and the line of the profile as drawn on the contour map Remember to include information implied by the map NOTE where the profile crosses a stream channel the elevation is between two contour lines (The stream channels are shown by dot-dash lines) Hilltops and the ends of the profile also have implied information After all the dots are made on the profile connect the dots by a smooth line which represents the profile of Earths surface On Figure 3 draw a profile for the dashed line A to A in Figure 2 Be sure to label both ends of the profile and the elevations at the side of the profile
Figure 2 Topographic map with profile line drawn and labeled
100
90
80
70
60
50
40
30
20
10
Figure 3 Topographic profile AmdashArsquo from Figure 2
78
Part C mdash Additional Information on Topographic Maps Topographic maps are produced at various scales (124000 163360 etc) that represent different areas of coverage Common sizes are 75 minute and 15 minute (Discontinued) describing latitude and longitude dimensions and are given locality names (such as ldquoMonmouthrdquo) usually for some prominent town or geographic feature in the mapped area In this part of the lab you will study a US Geological Survey quadrangle that illustrates the kind of information available on these maps
Map study and use requires an understanding of latitude and longitude Lines of latitude and longitude form an imaginary grid system with lines that are measured in degrees of arc from a reference Any point on Earth may be pinpointed to its exact location by its latitude and longitude Latitude lines are oriented in an east-west direction They are parallel to one another with the equator designated 0 degrees and increasing in degree measurement to the poles at 90 degrees Those in the northern hemisphere are north latitude and those in the southern hemisphere are south latitude Longitude lines are oriented in a north-south direction and start from 0 degrees at Greenwich England and increase in measurement both east and west up to 180 degrees on the other side of the Earth near the International Date Line Those to the east are called east longitude and those to the west are called west longitude For more exact locations degrees (o) are further broken down into minutes (lsquo) and seconds (ldquo) one degree has 60 minutes (1o=60rsquo) and one minute has 60 seconds (1rsquo=60rdquo)
If you plan to use a compass with a map for navigation is necessary to understand the concept of magnetic declination The compass needle when pointing north actually points to magnetic north the magnetic pole of Earth not to true north or geographic north which is Earths axis of rotation These two norths are not located at the same place and magnetic north moves over time The declination is the angle of correction needed because topographic maps are drawn aligned to geographic north which is toward the top and parallel to the left and right margins of the map Because magnetic north moves knowing the date the declination is accurate is important also Study the Monmouth Oregon Quadrangle and answer the following questions
1 __________________
2 __________________
3__________________
4 __________________
5 __________________
1 Who published this map
2 What year was it published
3 What is the latitude of the northern boundary of this map
4 What is the latitude of the southern boundary of this map
5 How many degrees of latitude are along the eastern edge (HINT subtract southern edge latitude from northern edge latitude)
6 __________________
7 __________________
8__________________
9 __________________
6 What is the longitude of the west side of this map
7 What is the longitude of the east side of this map
8 How many degrees of longitude are along the southern edge
9 What is the contour interval
79
10 _________________
11 _________________
12 _________________
13 _________________
14 _________________
10 How much vertical distance separates the lighter contour lines
11 How much vertical distance separates heavier contour lines
12 What is the highest elevation shown on the map (Look in NE)
13 What is the lowest elevation (Follow river downstream)
14 What is the relief of this map (subtract lowest elevation from the highest elevation)
15 _________________
16a _________________
16b _________________
16c _________________
16d _________________
17a _________________
17b _________________
17c _________________
17d _________________
18 _________________
19 _________________
20 _________________
21a _________________
21b _________________
22 _________________
23 _________________
15 What is the value of the declination (in degrees) shown
In the area to the left sketch how declination is indicated on the map
16 What is the map scale in (Show math work with units here)
a inches to inches
b feet to feet
c inches to feet
d inches to miles
17 What is the name of the quadrangle to the a south
b east
c northwest
d west
18 What is the approximate elevation of the town of Monmouth
19 What is the elevation of the benchmark located at the intersection of
Main St and Monmouth St in Independence
20 How many miles is it along Hwy 99W from Main St in Monmouth
to where 99W crosses the Luckiamute River
21 What is the distance (21a in miles) and (21b in Kilometers)
between the top of Cupids Knoll and Fircrest Cemetery
22 What is the elevation of Cupids Knoll
23 Which side would be easiest to climb Explain why
710
Part D mdash Learning about rivers from topographic maps Note Chucksney Mountain Salem and Sauvie Island Quadrangles are 124000 scale maps
1 On the Chucksney Mountain Quadrangle look at the tributaries that drain into the North Fork of the Middle Fork of the Willamette River (in the Southwest corner of the map) Then look at the width of the Willamette River channel in the Salem and Sauvie Island Quadrangles Does the width of the river channel increase or decrease when going downstream towards the mouth of the Willamette
2 Use the contour lines on the Chucksney Mountain Quadrangle to determine the elevation change from the top to the bottom of one of the tributaries that you observed in the previous question and record the elevation change below (Be sure to look up the contour interval on the map)
3 On the Salem Quadrangle locate Beardsley Bar and Doves Bar along the Willamette River What is the difference in elevation between these two points along the river In what direction is the river flowing
4 Does the gradient of the Willamette River increase or decrease as you go from its upper tributaries downstream towards its mouth
5 What type of stream channel do the tributaries in the Chucksney Mountain Quadrangle have Circle the correct choice below
a Braided stream channel
b Steep gradient bedrock channel
c Low gradient meandering stream channel
6 What type of channel does the Willamette River have in the Monmouth and Salem Quadrangles Circle the correct choice below
a Braided stream channel
b Steep gradient bedrock channel
c Low gradient meandering stream channel
711
Name____________________________________
Lab Day _____ Lab Time_____________________ 7a Post-Lab Assessment
1 Imagine you were hiking with friends and became separated from your hiking companions If you had a topographic map of the area what clues on the topographic map would you use to arrive somewhere where you could be found
2 Would a GPS receiver be able to assist you in finding your location on the map What
information would be helpful 3 What large city is located near 40oN 116oE (Use globe atlas world map GoogleEarth) 4 In what area is 40oN 116oW 5 What coast are you near at 34oN 119oW (Name continent side of it and ocean) 6 What coast are you near at 34oS 119oE (Name continent side of it and ocean)
7 Is it important to include N or S and E or W with latitude and longitude information Why
81
ES 105 Laboratory Additional Activities APPENDIX ndash Additional Laboratory Activities Lab 1 Energy and Energy Transformations
bull No Additional Activities Lab 2 Work Motion Gravity
bull Falling Objects Spark Tape Experiment p 82 - 84 Lab 3 Objects in Motion Landslides
bull Rotational Kinetic EnergyTrack Experiment p 85 - 86 bull Landslide Prediction p 87 bull AccelerationCart Experiment p 88 - 89
Lab 4 Geologic Time
bull Relative Age Dating Exercises p 810 - 814 Lab 5 Chemical Reactions
bull Chemical and Physical Changes p 815 - 816 bull Balancing Chemical Equations p 817 - 819
Lab 6 Sediments and Sedimentary Rocks
bull Overview of Sedimentary Minerals p 820 - 821 bull Depositional Environments p 822 - 823
Lab 7 Topographic Maps
bull Rivers and Topographic Maps p 824 - 825 bull Stream Table Experiments p 826
82
Lab 2 Calculation of Acceleration due to Earthrsquos Gravity
In this activity you will study the motion of a free-falling body Using a special timer the position of the object will be recorded at even intervals of time Letrsquos call the time interval Δt (read as ldquodelta trdquo or ldquochange in timerdquo) We will use the letter y to indicate the position of the object The position at a chosen time will be called y0 After one time interval passes we refer to the objectrsquos position as y1 after two intervals y2 and so forth From the changes in positions we can compute the velocity The average velocity is determined by the change in position per change in time Δt For instance the (average) velocity after four intervals of time have passed v4 is
This equation could be read as lsquothe velocity (after fourth time interval) is the change in position (between the third and fourth time interval) over the change in timersquo Once the average velocities have been calculated these values can be used to determine the average acceleration The slope of the graph of average speed versus time gives the acceleration of the falling object Mathematically the average acceleration after the fourth time interval a4 is described by the following equation
In this part of the lab you will measure the acceleration of a free-falling body using two different methods and devices ndash a spark-tape apparatus and a picket-fencephotogate system Activity 1 Using the spark-tape apparatus to Measure Gravitational Acceleration Procedure We will drop our object a carbon-coated tape approximately 2 meters As the tape falls a spark generator produces sparks at even time intervals These produce marks on the tape representing equal times between each spark The result is pictured below Figure 1 The distance between two successive marks indicates the distance fallen in a particular time interval The time interval Δt is given on the knob on the spark timer It is a fixed time interval (typically Δt = 130 sec = 0033 seconds) Ask your instructor to verify the value for Δt Your instructor will help you drop the tape and produce the marks You should have at least 9 marks on your tape
v y yt4
4 3=minusΔ
a v vt4
4 3=minusΔ
83
y1
y2
y3
y4
y5
y6
y7
Tapersquos initial position(big burned spot)
1st clearly identifiable (position y0)mark after initial position mark
Last spark on tape
Figure 1 Schematic representation of spark tape resulting from free-fall apparatus Note The first mark (the prominent burned one) gives the tapersquos initial position However the weight
was released at a random time Furthermore the second mark may be covered up by the first mark
(What you think is the 2nd mark may actually be the 3rd mark) Hence you canrsquot rely on total elapsed
time or the position of the next mark after the first mark However you can rely the on time intervals t
and distances between successive marks
Analysis Lay the tape flat on the table You may wish to secure it with masking tape Locate the initial mark Now find the next clearly identifiable mark -- probably the 2nd or 3rd mark after the first (prominent) mark This will be position yomdashlabel it accordingly Place a meter stick along the tape in preparation to measure the y-distances (as shown above) from yo to other mark locations See the diagram above Complete Table 1 for at least seven data points (Hopefully you will have more data points than seven) Measure the distances very carefully enter them into your table Be sure to record all your distances in meters NOTICEΔt is always the same value (probably 00333 sec -- but check with your instructor) NOTICE that all the distances in column 2mdashthe lsquoy (meters)rsquo columnmdashmust be in meters Fill out the rest of the table Δt is the same number of seconds for every point
84
Table 1 Δt
(sec) y
(meters) Δy v=ΔyΔt (meterssec)
Δv a=ΔvΔt (meterssec2)
301
y0 = 0 No Data No Data No Data No Data
301
y1 = 01 yy minus = 1v = No Data No Data
301
y2 = 12 yy minus = 2v = 12 vv minus =
301
y3 = 23 yy minus = 3v 23 vv minus =
301
y4 = 34 yy minus = v4= 34 vv minus =
301
y5 = 45 yy minus = v5= 45 vv minus =
301
y6 = 56 yy minus = v6= 56 vv minus =
301
y7 = 67 yy minus = v7= 67 vv minus =
301
y8 = 78 yy minus = v8= 78 vv minus =
301
y9 = 89 yy minus = v9= 89 vv minus =
301
y10 = 910 yy minus = v10= 910 vv minus =
Note about calculations 301
divide is the same as x 30
Compute an average of the accelerations in your table Letrsquos call this number the acceleration due to gravity The acceleration due to gravity is _______________________ in units of ________________ There You did it You measured the acceleration due to gravity
85
Lab 3 Rotational Kinetic Energy Determination
1 Surprise The potential and kinetic energy are not equal because we havenrsquot accounted for the energy lsquolostrsquo during motion of the ball Letrsquos calculate the rotational kinetic energy of the system by using the formula below Show your calculations be sure to include units
2R mv
51 E = ER = _______________ in units of __________________
Now add all of the kinetic energy (EK + ER) ___________________ in units of ____________ 2 How does the sum of kinetic energy (EK + ER) compare to the initial potential energy Is the
total energy conserved What other energy factor(s) havenrsquot we accounted for yet (HINT why does the ball slow down as it is rolling)
3 What would be the potential energy in the system if the ball were positioned at a height of 01
meters Show your calculations be sure to include units (Your answer should be in Joules) Predicting the Final Velocity of the Ball Because the total energy is conserved you know that at the beginning the total energy is only gravitational potential energy At the end of the experiment the ball has no altitude (h = 0 above the horizontal table) so all the energy is in the form of kinetic energy Since the total energy at the beginning must be equal to the total energy at the end we can say
Potential energy (EP) at beginning = Kinetic energy at end (both rolling + translation)
Or mgh = 22KR mv
51mv
21 EE =+=+ This simplifies to mgh = 2mv
107
Solving the above for the final velocity of the ball along the horizontal ramp we find
v gh=107
86
Questions
4 Using the equation v gh=107
calculate the ideal velocity on the horizontal track when the
ball is released on the ramp at h = 003 meters What are the units of the velocity 5 In reality will the velocity be higher or lower than the ideal calculation above Why 6 How did your average velocity (from table 1 pg6) compare with the ideal velocity (as
calculated in question 10 above) Comment on why it is the same or different (HINT there is more than one reason the velocity is not ideal)
7 Without calculating PREDICT what happens to the final velocity if we double the initial
height (h = 006 m) Will the final velocity increase or decrease About how much double one-half or some other value compared to when it is released from h = 003 meters
8 Support your above answer by employing the equation v gh=107
for h = 006 m
That is calculate the final velocity of the ball when it is released from 6 centimeters Be sure show your calculations and report your answer with the appropriate units
87
Lab 3 Energy of Motion and Landslides
PART C mdash Landslide Prediction Examine the cross-sectional sketch below Label in Figure 4 with numbers the positions where you might expect to find the following mass wasting processes
(1) rock fall (ie free-falling rock material) (2) soil creep (slowly moving sediment under the influence of gravity) (3) catastrophic landsliding and (4) zone of little to no chance of mass wasting processes
Figure 4 Landslide prediction diagram Questions 1 What are the chances of your property experiencing a landslide if you live in the Coast
Range of Oregon (for example somewhere between Dallas and Lincoln City) List the critical factors that apply (or donrsquot apply as the case may be) to why you think these are your chances
2 What are the chances of your property experiencing a landslide if you live in the middle of
the Willamette Valley (for example in Salem or Albany) List the critical factors that apply (or donrsquot apply as the case may be) to why you think these are your chances
88
Acceleration of a Cart If a cart moves on a plane that is inclined at an angle θ the component of force acting on the cart in a direction that is parallel to the surface of the plane is the shear force The acceleration of the cart should be given by
a = g sin θ Procedures 1 Before recording any data make sure the Motion Sensor can ldquoseerdquo the cart as it moves 2 Measure the angle the track makes with the table top Record in Table 4 below 3 Place the cart on the low end of the track and have one person start recording Have the
other group member give the cart a gentle push up the inclined plane track so the cart will move toward the Motion Sensor Keep recording as the cart moves away from the sensor
4 Stop recording when the cart returns to the bottom of the track 5 If the plot of data is not smooth check with your instructor to realign the Motion Sensor The
repeat the above procedure until the plot is smooth for the run up and then down the track 6 Erase your practice runs by clicking on the EXPERIMENT menu and selecting DELETE ALL
DATA RUNS Do NOT use the FILE menu and delete the activity 7 You are now ready to collect data Place the cart at the low end of the track Start
recording data Give the cart a gentle push toward the Motion Sensor Continue collecting data until the cart has returned to the bottom of the track This is lsquoRun 1rsquo
8 Set the track to a steeper angle and measure the angle Repeat data recording (Run 2) 9 Open the GRAPH from the left hand menu Select Data Run 1 Choose the plot of velocity
vs time Use the cursor to select the region of the plot that shows the cartrsquos motion after the push and before it stopped at the bottom of the track Determine the slope of the best fit line This slope is the acceleration of the cart (Note Units are ms2)
10 Repeat for Data Run 2 Record all data in Table 1 and answer the questions on the following page
89
Table 1 Acceleration of cart on Inclined plane
Run 1 Run 2
Angle of track (θ)
Experimental Acceleration (slope of velocity time)
Theoretical Acceleration (calculate from a = g sin θ)
Questions 1 What happens to the velocity of the cart as it moves up the inclined plane 2 What happens to the velocity of the cart as it moves down the inclined plane 3 What happens to the acceleration of the cart as it moves up the inclined plane 4 What happens to the acceleration of the cart as it moves down the inclined plane 5 How did the acceleration change when the track became steeper 6 Calculate the theoretical value for the acceleration of the cart based on the trackrsquos angle and
record it in Table 1 7 What is the percent difference between the acceleration determined in the activity and the
theoretical value for acceleration ⎟⎠⎞
⎜⎝⎛ =times differencepercent 100
ltheoreticaalexperiment-ltheoretica
(Show calculations here) 8 What is a possible explanation for the difference in these two values
810
Lab 4 Relative Age Dating Pre-lab Questions for Determining Relative Ages of Geologic Events Define the following terms prior to arriving at your lab section
Stratigraphic correlation
Principle of original horizontality
Principle of stratigraphic superposition
Principle of lateral continuity
Unconformity
Law of cross-cutting relationships
811
Determining Relative Ages of Geologic Events Another technique to determine the relative ages of geological events is the Principle of
Cross-Cutting relationships which states that any geological feature which cuts another geological feature must be younger than the cross-cut feature Stated in simple terms a loaf of bread must be older than the bread slices which transect the loaf
Activity Study the sketch on the following page LIST the sequence of geological events oldest at the bottom and youngest at the top on the table below and cite reasons for this order of events Close ups of significant relationships are shown on the following page (84)
Event Older than Because Younger
than Because
812
HINTS
bull ldquoIrdquo contains inclusions of ldquoJrdquo and ldquoKrdquo bull ldquoIrdquo changes from conglomerate at the bottom to sandstone at the top bull ldquoIrdquo does not include pieces of H
Rock Types Igneous ndash Intrusive Metamorphic
Gneiss Sedimentary
Cong ndash Conglomerate SS ndash Sandstone Sit S ndash Siltstone Sh ndash Shale Ls ndash Limestone
There are details of this cross section on the following page Working on the geologic history of smaller portions first can help you unravel the geologic history of a complicated section like the one above
ldquoBakedrdquo zone of contact metamorphism
813
Angular Unconformity Fault
Intrusions Refolded area
814
Questions Quantify some basic observations on geologic time in the spaces provided (Use dates shown in the ldquoGeologic Time Scalerdquo) Show all of your math work
___________ Based on the data given how old is the Earth (ie what is the total known
time encompassed by geologic history) Answer in billions of years ___________ What is the total duration of the Precambrian Eons (in millions of years) ___________ What is the total duration of the Paleozoic Era (in millions of years) ___________ What is the total duration of the Mesozoic Era (in millions of years) ___________ What is the total duration of the Cenozoic Era (in millions of years) ___________ What percentage of total Earth history is comprised by the Precambrian
Eons ___________ What total percentage of Earth history is marked by the presence of life in
the fossil record Show all of your math work ___________ What total percentage of Earth history is marked by the absence of life in
the fossil record Show all of your math work ___________ Homo habilis is considered by many anthropologists to be the first true
human and lived ~ 2 million years ago What total percentage of Earth history is marked by the presence of human-like species in the fossil record Show all of your math work
___________ What total percentage of Earth history is marked by the presence of
ldquomodern manrdquo Show all of your math work write the answer in scientific notation
___________ Assuming that you live to the ripe old age of 82 what total percentage of
Earth history will be marked by your presence on this planet Show all of your math work write the answer in scientific notation
815
Lab 5 Chemical and Physical Changes Exploring the Differences between Chemical and Physical Changes In this part of the lab you will work through a sequence of experiments make observations and determine whether a chemical or physical change has occurred As you progress through this portion of the lab complete Table 1 Observations on the following page Procedure 1 Take a test tube labeled iron filings and a test tube labeled sulfur from your kit These have
already been pre-weighed for you with 35 grams of the iron filings and 20 grams of sulfur Mix the two completely by grinding them together with a mortar and pestle
2 Divide the mixtures into two piles (ie aliquots) and place each on wax paper 3 Observe one of the aliquots under a magnifying glass and record your observations in table 1 4 Test the same aliquot for magnetism by passing a magnet under the paper (Please do not
remove the magnet from the Ziploc bag) Does the material appear to be magnetic Record your observations in Table 1
5 Now pour each aliquot into a test tube one aliquot into a small Pyrex test tube from your kit
the other aliquot into the soft glass test tube from your kit that is labeled ldquobreakablerdquo (Set this one aside for a few minutes)
6 Add a small amount of water to the first test tube (Pyrex tube not breakable one) cover the
end of the tube with your thumb and shake vigorously Record your observations in Table 1 7 Clean out the mortar bowl and put some cold tap water into the bowl Take the mortar bowl
with water your breakable test tube containing the dry ironsulfur mixture and a test tube clamp to one of the hoods Be sure to wear goggles
8 This step is performed under the hood Gently heat your mixture using the hottest part of
the flame (the inner blue tip) Heat your mixture until the mixture itself (not just the glass of the test tube) is producing a bright orange-red glow throughout the mixture Be patient it may take 5 or more minutes for the mixture to reach this stage Confirm with your instructor when it has reached this stage (to be sure the reaction has proceeded) Immerse the hot end of the tube into the bowl of water before it has a chance to cool This will break the end of the tube and there will be a small but exciting steam explosion
9 Carefully throw the broken glass of the test tube (but not the new compound you just created)
into one of the white glass disposal bins in the lab Using the cooled material that was in the test tube repeat the tests you performed on the original iron and sulfur mixture (examining with a magnifying lens checking the magnetic properties and mixing with distilled water in a large clean test tube) Record your observations in Table 1
816
Clean all the permanent glassware and return all the materials to your kit in a neat and tidy manner Leave the laboratory counter neat and in a condition that you could walk in and begin work immediately if you were in the next lab section Thank you Table 1 Observations of ironsulfur mixture
Material Viewed with magnifying glass
Tested with magnet Properties in water
Before Heating
After Heating
Questions 1 At what point did a chemical change occur How could you tell 2 Based on what you have observed in this laboratory exercise write a conclusion to the
experiment that summarizes how a chemical change differs from a physical change
817
Lab 5 Balancing Chemical Equations Balanced chemical equations are used to describe chemical reactions This equation tells
what substances are involved as reactants and what substances are formed as products In addition the relative proportions of molecules of each of the substances are specified The coefficients in the balanced equation give the mole ratios(comparing the number of molecules) of the various substances From these mole ratios the quantities of reactants required to produce a certain quantity of product can be determined as well as how much product can be expected when given quantities of reactants are utilized
1 Balance the chemical equations listed below by placing the correct coefficient in the space
provided in front of each substance ____ Mg + ____ O2 ____ MgO magnesium oxygen magnesium oxide ____ KIO3 ____ KIO2 + ____ O2 potassium iodate potassium iodide oxygen ____ AgNO3 + ____ Cu ____ CuNO3 + ____ Ag silver nitrate copper copper nitrate silver ___ AgNO3 + ___ NaCl ___ AgCl + ___ NaNO3 silver nitrate sodium chloride silver chloride sodium nitrate
818
Part A ndash Cooking with Chemistry Although you probably have never thought about it you carry out chemical reactions frequently in your kitchenmdashotherwise called cooking In many chemical reactions one reactant is present in a quantity that will limit the amount of products that can be formed This reactant is called the limiting reactant The concept of a limiting reactant will be explored by preparing a confection called SrsquoMORES which is a well-known camperrsquos delight Srsquomores (Sm) are a concoction of graham crackers (Gc) marshmallows (M) and chocolate pieces (Cp) The recipe can be written in the form of a chemical equation
2 Gc + 1 M + 3 Cp 1 Gc2MCp3 Where the reactants (ingredients) are Gc = graham cracker
M = marshmallow Cp = chocolate piece
And the product is Gc2MCp3 = a srsquomore If you were camping you would make a srsquomore by toasting a marshmallow on a stick over the campfire and then putting it between two graham cracker halves with three chocolate pieces When the graham cracker pieces are pressed together the hot marshmallow melts the chocolate and a gooey treat results (You will not be allowed to eat any of your srsquomores due to OSHA regulations and standard laboratory safety procedures) This part of the lab explores the results of adding proportions which differ from those specified by the balanced equation for a chemical reaction From different combinations of reactants you will predict the maximum numbers of srsquomores which can be prepared and test your prediction Procedure There are six different srsquomore stations labeled ldquoArdquo through ldquoFrdquo Be sure that all the reactants for each bag at each station are put back into the bag before proceeding to the next station Recall the proportions of reactants which follow the balanced equation above Record your results in Table 1 on pg 55
1 First use to srsquomore station A From the above proportions determine how many srsquomores
you can make from the reactants provided Write a balanced equation for the reactants in this bag including leftovers Test your prediction by assembling the reactants into srsquomores
2 Using the reactants in station B predict the maximum number of srsquomores which you will be able to prepare Again write the equation and test
3 Repeat Step 2 using the reactants in the stations C D and E
819
Table 1 Srsquomores reactions
Reactants present predicted yield actual yield
A
B
C
D
E
F
4 Write a unit conversion Reactant
moresS for each reactant
5 Predict the maximum number of srsquomores which can be prepared using the reactants in
station F Unit conversion calculations for Station F
Identify the limiting reactant in station F
820
Lab 6 Sedimentary Rock Identification
Part A ndash Overview of Minerals in Sedimentary Rocks As noted in the introduction a small number of minerals are commonly associated with sedimentary rocks including quartz (SiO2) potassium feldspar (KAlSi3O8) plagioclase feldspar (Na AlSi3O8 CaAl2Si2O8) mica (muscovite and biotite) calcite (CaCO3) halite (NaCl) and gypsum (CaSO4H2O) Table 2 is a summary of the diagnostic (ie distinguishing) physical properties that are used to identify these minerals Use the set of mineral identification tools (Table 2 nails pennies dilute HCl your eyes and intellect) and identify the names of the set of unknown mineral samples provided List your results in Table 1 (NOTE There is one example of each mineral so use the process of elimination to your advantage) Table 1 Identification of minerals commonly associated with sedimentary rocks
Sample Number
List of Diagnostic Properties(Used to Identify Each Mineral) Mineral Name
3
5
6
8
10
13
14
15
821
Table 2 Common sedimentary minerals and their diagnostic physical properties ____________________________________________________________________________ Mineral Name Diagnostic Physical Properties Quartz Harder than glass (specimen will scratch glass) SiO2 Glassy to waxy surface appearance (luster) Various colors of milky white clear smoky gray rose Potassium Feldspar Harder than glass (specimen will scratch glass) KAlSi3O8 Breaks into blocky angular pieces
(two directions of cleavage at 90o) Common varieties are salmon pink or white in color Plagioclase Feldspar Harder than glass (specimen will scratch glass) NaAlSi3O8CaAl2Si2O8 Breaks into blocky angular pieces (two directions of cleavage at 90o) Whitish to medium gray in color Parallel striations (lines) commonly visible Mica Softer than fingernail (fingernail will scratch specimen) K[Al2(Mg3 Fe3)](AlSi3O10)(OH)2 Breaks into thin sheetsflakes book-like occurrence Muscovite Mica Clear to silvery in color Breaks into thin silvery flakes
Biotite Mica Brown to black in color Breaks into thin dark flakes Calcite Softer than a penny harder than fingernail CaCO3 Breaks into rhombohedra (three directions of cleavage) Whitish in color Fizzes in dilute hydrochloricacid
(the ldquofizzingrdquo is the result of CO2 release) Halite Softer than a penny harder than fingernail NaCl Breaks into cubes (three directions of cleavage) Clear in color tastes salty (Donrsquot lick lab samples) Gypsum Very soft scratches easily with fingernail CaSO4H2O Clear to white to pink in color
May show three directions of cleavage
822
Figure 1 Environments in which sediments are deposited The diagram is not to scale
1 Abyssal Fan 9 River Channel 2 Deep Sea Floor 10 Delta 3 Reef 11 Lagoon 4 Beach 12 Barrier Island 5 Sand Dunes 13 Continental Shelf 6 Glaciers 14 Submarine Canyon 7 Alluvial Fans 15 Continental Slope 8 Flood Plain 16 Lake
You will refer to this diagram in the post-lab exercise Concentrate on the energy of the environment and the characteristics of the rocks that would form there Think about the way the environment would transport sediment grains the size sorting and shape of the grains the surface features that may be preserved etc You may want to look up some of the terms listed in the diagram in your textbook or from other sources
823
1 Study Figure 1 (previous page) and list at least two environments where the following sedimentary rocks would be deposited Think about the energy necessary to transport the grains Describe the overall characteristic of the depositional environment for each rock type
a SANDSTONE b SHALE
c LIMESTONE
824
d Lab 7Rivers and Topographic Maps Acitivity 1 The Willamette River 1 Describe stream gradient in your own words 2 How can you determine the stream gradient from a topographic map What information do
you need to know Express stream gradient mathematically 3 On the Chucksney Mountain OR Quadrangle determine the gradient of a tributary of the
North Fork of the Middle Fork of the Willamette River Look in the southwest corner of the map and find a stream that drains into the fork of the Willamette Show your calculations Also state the type of channel (see previous page for channel descriptions)
4 Determine the gradient of the Willamette River on the Salem OR Quadrangle between
Beardsley Bar and Doves Bar Show your calculations and describe the channel type 5 Use information on the Sauvie Island OR Quadrangle to determine the gradient of the
Columbia River between the mouth of the Willamette River and the point where it enters the Pacific Ocean Assume the distance between these locations is 100 hundred miles (Hint what is the elevation of the mouth of the Columbia River) Show your calculations
6 Study the gradient channel type and channel size of the three segments of the
WillametteColumbia River system Write a brief paragraph summarizing how these variables change as you move downstream in a river system
825
Activity 2 River Features Examine the Monmouth Oregon Quadrangle which shows many features associated with a moderately large river and answer the following questions
1 Locate the area along the Willamette River east of Independence What is name given to this river-formed feature (HINT Refer to the discussion of channel features earlier in lab)
2 Is this feature likely to change its shapeposition in the future In which direction will it
migrate and how can you tell Should folks in Independence be worried 3 Where would you expect an oxbow lake to form on the Luckiamute River in the near future
Describe location with direction and distance from landmarks Why did you pick this location
4 Several stream terraces are located along the course of the Willamette River associated
with periods of deposition and incision of the valley floor during the Quaternary Using the Monmouth quadrangle try to locate at least two (there are more) of these terraces by stating their general location and an approximate elevation
5 Sketch a topographic profile (cross section) from the top of Davidson Hill southwest across
the valley of the Luckiamute River (south central portion of map) Indicate the type of materials (solid bedrock and alluvial sediment) you would expect to find underlying various portions of your cross section based on their relative elevation slope and position with respect to the Luckiamute River
826
Lab 8 Stream Table Experiment on Sediment Transport Determine Effect of Flow Velocity on Mode of Sediment Transport and Stream Competence Visible sediment grains move through a channel as either bed load (rolling sliding or saltation (ie bouncing like a jumping bean)) or suspended load Reduce the discharge to a minimum by pinching the tube so the current is moving only a few grains
In the table below record how the sand-sized sediment is being transported under Low flow conditions Use some chalk dust to observe suspended load transport under Low flow conditions Increase the discharge to a Medium flow by squeezing the tube about half way Again record your observations for how the sand-sized sediment moving Increase the discharge to High flow by releasing the tube completely Once again record on the table how the sand-sized grains are moving
Table 1 Sediment Transport Record how the sand-sized sediment is being transport for each condition
Discharge Condition
Sand-Sized Bed Load
Sliding Rolling Saltation
LOW
MEDIUM
HIGH
Question 1 Describe how the transport mode and behavior of sand changed under each new flow
condition Consider the amount of grains moving and how the transport mode changed with increasing discharge
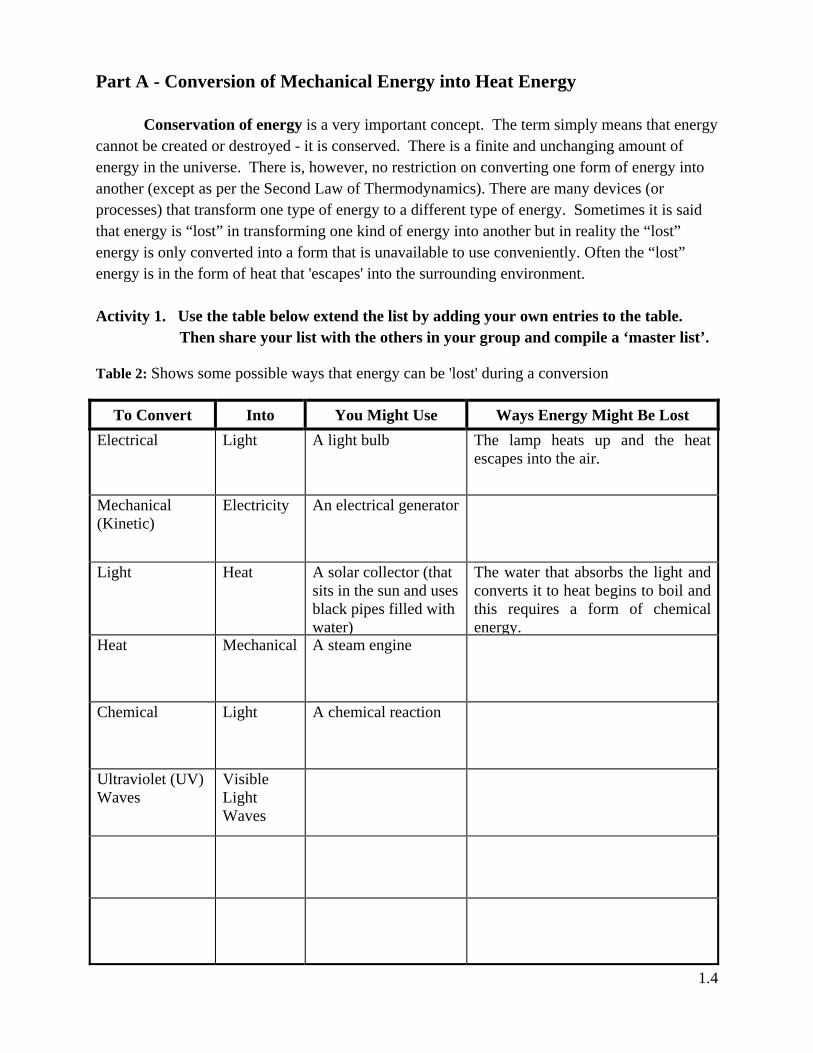
14
Part A - Conversion of Mechanical Energy into Heat Energy
Conservation of energy is a very important concept The term simply means that energy cannot be created or destroyed - it is conserved There is a finite and unchanging amount of energy in the universe There is however no restriction on converting one form of energy into another (except as per the Second Law of Thermodynamics) There are many devices (or processes) that transform one type of energy to a different type of energy Sometimes it is said that energy is ldquolostrdquo in transforming one kind of energy into another but in reality the ldquolostrdquo energy is only converted into a form that is unavailable to use conveniently Often the ldquolostrdquo energy is in the form of heat that escapes into the surrounding environment
Activity 1 Use the table below extend the list by adding your own entries to the table
Then share your list with the others in your group and compile a lsquomaster listrsquo Table 2 Shows some possible ways that energy can be lost during a conversion
To Convert Into You Might Use Ways Energy Might Be Lost Electrical Light A light bulb The lamp heats up and the heat
escapes into the air
Mechanical (Kinetic)
Electricity An electrical generator
Light Heat A solar collector (that sits in the sun and uses black pipes filled with water)
The water that absorbs the light and converts it to heat begins to boil and this requires a form of chemical energy
Heat Mechanical A steam engine
Chemical Light A chemical reaction
Ultraviolet (UV) Waves
Visible Light Waves
15
Activity 2 Moving hands (Mechanical energy transformed into heat energy) Instructions Press your hands together and rub them back and forth twenty times As you do this press as hard as you can but still allow them to rub together Try to apply the same force throughout this activity As soon as you stop rubbing feel the temperature of your hands
1 What did you observe Explain in terms of energy conservation and conversion
2 Change the amount of frictional force between your two hands by pressing your hands together very lightly (reducing friction) Rub them back and forth twenty times As before feel the temperature of your hands where they touched Were they warmer or cooler than before
3 Compare this observation to the one above Explain in terms of energy conservation and conversion
4 Does reducing the frictional force affect how much mechanical energy is transformed
into heat energy
5 Explain why you put grease (a lubricant) on parts of your bicycle that rub together (eg
wheel bearings) Explain your answer to this question in terms of energy conservation and lost energy
6 Make a short list of things (five things) you encounter every day that convert mechanical
energy (of moving objects) into heat
16
Part B - Conversion of Mechanical and Chemical Energy into Electrical Energy
A generator converts mechanical energy into electrical energy Electrical energy can flow through a wire in the form of an electrical voltage and commonly is used to light a bulb to produce light The light bulb converts the electrical energy into light energy that our eyes can easily detect
Activity 1 Hand crank generator to electric light (Mechanical to Electrical)
This consists of a hand-crank generator to convert mechanical energy to electrical energy and wires to carry the electrical energy (voltage) to a light bulb Instructions
1 Connect one wire-lead from hand generator to light bulb leaving the other wire-lead unconnected (open circuit) Gentle turn the generator and ldquofeelrdquo (gauge) the degree of difficulty Was it (easy moderate or difficult) to turn the crank
2 While turning the crank at the same speed as above connect the other wire-lead to the light (closed circuit) and ldquofeelrdquo (gauge) the degree of difficulty to turn the crank Was it (easy moderate or difficult) to turn the crank
Questions
1 What do you notice about how hard the hand crank turns with respect to a closed circuit (light bulb on) verses an open circuit (light bulb off) Explain why there is a difference
Activity 2 Measuring actual voltage in a closed circuit
Instructions bull For Multimeter black wire-lead connects to COM terminal and red wire-lead connects to
theVmA terminal (check with instructor) bull Connect hand generator wires to each wire of the Multimeter (at direct voltage (DCV) setting of
20) and slowly turn the handle and record the voltage in the table below Repeat for a faster turn Slow Turn Voltage (volts) = Fast Turn Voltage (volts) = Thought Question
1 (Think about and Discuss) How hard (fast) and how long you would need to turn the hand generator to produce enough energy to light a 60 watt light bulb for an hour Or brew a cup of coffee in the morning
17
Activity 3 Comparing chemical (battery) energy to mechanical energy Instructions bull Connect the battery pack to the Multimeter and record the voltage (in table below) using same
settings (Multimeter at direct voltage (DCV) setting of 20) as activity 2 above bull Disconnect the battery pack and connect the hand generator to the Multimeter and try to maintain
a constant turn that replicates the same voltage as the battery pack Now you can FEEL the energy associated with 3-volts
Voltage (volts) with 3-volt (2-battery) pack =
Speed of hand generator (slow medium or fast) associated with 3-volts (2-batteries) =
Questions
1 (Think about and Discuss) How hard (fast) and how long you would need to turn the hand generator to produce enough energy to recharge your cell phone (Typical cell phone batteries are 37 volt and 800 mAhour)
Part C - Conversion of Heat into Mechanical Energy
Figure 1 Apparatus to investigate conversion of heat energy to mechanical energy
Rubber hose
(Test tube)
18
At this station you will convert heat energy into mechanical potential energy To understand how the potential energy is observed consider the U shaped tube in Figure 1 One side of the U-shaped tube is connected to a small reservoir (a test tube) the other end of the U-shaped tube is open to the atmosphere If the pressure in the reservoir is the same as the atmosphere the water level in both sides of the tube will be the same However if the pressure inside the reservoir is larger than the atmospheric pressure the water levels will be different the pressure inside the reservoir tends to push the water out of the tube In lifting the water in the tube the gas in the reservoir does work holding the water up (that is holding it in a non-equilibrium position) requires energy -- mechanical potential energy To make the gas expand (and increase the pressure in the reservoir) we rely on the ideal gas law The Ideal Gas Law states that if you increase the temperature of a gas the pressure will increase To increase the temperature you must transfer heat (energy) into the system
Activity 1 Hot and Cold (thermal energy) converted into Mechanical Energy
Instruction
bull Record the location of the water level on the scale (Measure the level of water on the open end of the glass U tube)
bull Place the air-test tube (reservoir) into the warm water beaker and record the new level of the water in the table below
bull Now place the air-test tube (reservoir) into a beaker of cold water What happens to the water level in the tube when the reservoir is cooled Record your observations in the table
Observations Initial water level on open side of the glass U tube
Water level on open side of the glass U tube in warm water reservoir for 30 sec
Water level on open side of the glass lsquoUrsquo tube after immersing in beaker of cold water
Describe change of water level from previous level
Questions 1 1 Explain your observations recorded in the table in terms of energy conservation and
energy conversion 2 What happens when you leave a blown-up balloon in the sun Give a detailed explanation as
to what happens to such a balloon in terms of energy transfer and conservation of energy
19
Part D mdash Conversion of Light Energy into Electricity Light energy conversion to other types of energy (eg electricity) is never 100 efficient
This station contains a solar cell which directly converts light to electricity with approximately 5 efficiency That is 5 of the light that reaches the panel surface is converted to electricity
Activity 1 Solar to electrical to mechanical
Instructions The small motor connected to the solar cell converts light to electricity and then to mechanical energy
1 Turn 40-watt lamp on and observe if motor (Fan) turns Record how fast fan is turning
2 Turn 75-watt lamp on and observe if motor (Fan) turns Record how fast fan is turning
Questions 1 Which wattage (light bulb) produced the most electricity (turned the fan fastest) 2 Most (95) of the light energy was lost in the process of conversion Where do you suppose
the other 95 of the light energy is going if only 5 is converted to electrical energy Refer to Table 5 below to answer the post-lab question about energy conservation Table 5 Estimates and comparisons of energy usages in your daily lives
Energy Using Activity Is Comparable With
Take a hot bath (full tub) Burning a 100 Watt lamp for a day
Using a 250 watt hair dryer for 8 minutes Riding your bike 30 miles (under ideal conditions)
Heating a pot of water for tea or coffee on the stove
Bench lifting a 50 lb weight 40000 times
Watch TV for an hour Eating a dessert with 250000 calories
Driving your car 45 miles to Portland Playing 13400 games of racquetball
Leaving a 100 watt light burning all night (10 hours)
Dancing the Tango for 45 days nonstop
110
Name____________________________________
Lab Day _____ Lab Time_____________________ POST-LAB ASSESSMENT Comparison of Energy Sources
Questions 1 It is part of our common language to use the term lsquoconserve energyrsquo to mean lsquotry to
consume less energyrsquo Contrast this meaning of lsquoconserve energyrsquo with the physics law of lsquoconservation of energyrsquo
2 All methods of generating electricity have adverse impacts on the environment Try to list at least two ways that each of the following energy sources used to generate electricity negatively impact the environment a) Burning fossil fuels b) Hydroelectric (dams) c) Solar
(Hint you might consider what impact building such plants may have on the environment) 3 Which is you favorite energy source Why
4 Try to stump your lab partner by thinking of a situation where energy is apparently lost for good Write down the ideas you come up with and give your lab partnerrsquos explanation of where the lost energy went
Consider the idea that energy is always conserved and discuss whether people will ever be able to generate power without affecting the planet Record your discussion
2-1
ES 105 Laboratory 2 EXPLORING WORK MOTION AND GRAVITY
Introduction
Work Work is a word used in many different ways It is used to describe our jobs and
careers It is used to describe what we do when we study for an exam However with regards to science that is not what work is The scientific definition of work is a force acting through a distance (Work = Force x Distance) A force is just a ldquopush or a pullrdquo that gives energy to an object sometimes causing a change in motion of the object (Recall from last lab that Energy is the property of a system that enables it to do work) Work is done only when a force moves an object When you push lift or throw an object you are doing work Your force is acting on the object causing it to move a certain distance One important aspect of work to note is the direction of the applied FORCE must be in the same direction of the DISPLACEMENT (movement) for it to be considered WORK
Friction Friction is a resistive force that opposes the motion or attempted motion of an object with which it is in contact In a sense friction is a force that resists (or limits) the work being done as objects are moved Friction always acts in a direction to oppose motion So when an object falls downward through the air the force of friction (referred to as Air Resistance) acts upward There are different types of friction including rolling friction and fluid friction but for the purpose of sliding solid objects across a floor or tabletop the two important types of friction are static and sliding friction The strength of these forces of friction depends upon two factors 1) the types of surfaces involved and 2) how hard the surfaces push together Static friction occurs when you first try to move the object before it is in motion and is a little stronger of a friction force than sliding (or moving) friction once the object is in motion
Gravity and Free Fall ldquoFree-falling objectsrdquo refer to objects that are allowed to fall straight down accelerated ONLY by the force of gravity An object in free fall accelerates as it falls due to the force of gravity (acting as an unbalanced force) Other than the force of gravity what other affects might there be on a falling object The dreaded air resistance is one effect However the effects of air resistance can be ignored as long as the (maximum) velocity of the object is relatively modest For most objects beginning at rest air resistance is negligible throughout the first seconds of fall
In this weekrsquos lab there will be a series of stations that will allow you to explore the motion of objects and how friction affects the motion of both sliding and free-falling objects You will also learn how to calculate the work needed to move objects Your instructor will help you gather data to measure the acceleration of free falling objects due to gravity
There are a few basic measurements and calculations that are necessary to understand the motion of objects and the work needed to move objects These measurements and calculations include
2-2
Distance or Displacement
(d) the distance over which an object moves under the influence of gravity (units of measurement eg centimeters meters kilometers)
Time of Travel (t)
the time during which an object completes its travel (units of measurement eg seconds minutes hours)
Velocity v = dt
the rate of change or displacement (units of measurement eg mileshour meterssec)
Acceleration a = change in velocity time
the rate of change of velocity of an object over time (units of measurement for acceleration are dt2 such as meterssecsec = meterssecond2)
Force (F)
is a push or a pull units generally measured in (Newtons)
Work (w)
is the change in an objectrsquos state of motion that results from the application of a Force
Work (joules) = Force (Newtons) x Displacement (meters)
Power (P)
Is the time rate of work Units generally measured in (watts)
Power (watts) = Work (joules)Time (seconds)
Goals and Objectives
bull Students will be able to perform measurements using a spring scale to determine the force associated with lifting and pulling weight
bull Students will be able to be able to calculate the average work bull Describe what is meant by accelerated motion bull Determine the acceleration of gravity
Useful Websites
bull httpwwwpbsorgwgbhnovagalileo
2-3
Name____________________________________
Lab Day _____ Lab Time_____________________ Pre-Lab Activity Complete the following calculations prior to arrive in lab Show all of your math work and unit conversions (HINT 1 hour = 60 minutes 1 min = 60 seconds 1 km = 1000 m) and (1 kilogram = 1000 grams) 1 If you drive a car for a distance of 35 km and it takes you 45 minutes to do so what is your
average velocity in units of kmhr What is your average velocity in msec 2 Phil has a very messy office and wants rearrange some furniture He needs to move a desk 10
meters If Phil exerts a force of 20 Newtons how much work is he doing 3 What is the Force (in Newtons) associated with a 500 gram weight in free fall near the
Earthrsquos surface (assume acceleration due to Earthrsquos gravity is ~ 10 meterssecond2) (note the 2nd Law of Motion is F(Newtons) = mass(kilograms) x acceleration(metersseconds2)
4 You will be using a Spring-scale to determine the Force associated with moving objects in the
lab Go to Wikepidiaorg (httpenwikipediaorgwikiSpring_scale) and write a brief definition of what a Spring scale is (Be careful to discuss difference between Mass and Force readings)
5 A spring scale measuring the force associated with lifting a 500 gram weight on Earth (3
above) is now used on the Moon What will the Spring scale readings be for Mass and Force associated with the Spring scale reading on the Moon
(assume acceleration due to Moonrsquos gravity is ~16 meterssecond2)
MASS (in grams) FORCE (in Newtons)
2-4
Part A mdash Work Activity 1 Letrsquos Talk Work Instructions
bull Tape a meter stick to an object to keep it vertical bull Use a force spring scale to lift weights of different sizes to the 30 cm mark bull Record your data in the table below bull Use a force spring scale to lift weights of different sizes to the 60 cm mark bull Record your data in the table below
Data Table One
Weights (Grams)
Height (Centimeters)
Distance (Meters)
Force (Newtons)
Work (joules)
100
30
Predict
What will happen to force if weight is raised to 60 cm _____________________
__________________________________________________________________
What will happen to work if weight is raised to 60 cm ______________________
__________________________________________________________________
Now try it and see if your prediction was correct
100
60
200
30
Predict
What will happen to force if weight is raised to 60 cm _____________________
__________________________________________________________________
What will happen to work if weight is raised to 60 cm ______________________
__________________________________________________________________
Now try it and see if your prediction was correct
200
60
Try 500
30
2-5
Questions
1 What does doubling the height (distance moved) do to total work
2 What does doubling the force do to total work Solving Problems Remember to include your units of measurement Some measurements are required to solve
1 Kelsey is a very strong She lifted a 200-gram weight to 50 cm How much work did she do 2 Mario wants to be a super hero He has been practicing for his super hero test by lifting cars If
Mario exerts a force of 12000 Newtons to lift a car 2 meters how much works is being done on the car
Part B mdash Friction Use the spring scale to measure the pulling force (associated with Static and Sliding friction) necessary to move at constant velocity a wood block across different surfaces Add a 200 gram weight to block and measure the pulling force again Record your measurements in Table below
Friction Surfaces Static vs Moving Type of Surface Static Friction
(Newtonrsquos) Moving (Newtonrsquos)
Static with weight
Moving with weight
Smooth-smooth
Smooth-rough
Rough-rough
1 What surface(s) and weight had highest amount of friction Explain your answer Which
was greater Static or sliding friction
2-6
Part C mdash Gravity and the Physics of Free-Falling Bodies Activity 1 Free Fall of Objects with Similar Size but Different Mass Collect two balls of the same size but different weight such as a heavy solid steel ball and a light hollow plastic ball With your lab partners hold both balls simultaneously at a height of one (1) meter above the floor
As a group make a hypothesis (predict) as to which ball will hit the ground first As a group test your hypothesis by releasing the balls at the same time Repeat the experiment several times and describe your results
1 How did the actual results compare to your initial hypothesis What can you conclude about the effects of the Earthrsquos gravity on the heavy and light ball respectively
Activity 2 Free Fall of Unlike Objects In your group repeat activity 1 only this time using a rock and a feather (or piece of paper if you cant find a feather) Hold the rock and feather at a height of 1 m above the floor
As a group make a hypothesis (predict) as to which object will hit the ground first the rock or the feather As a group test your hypothesis by releasing the rock and feather at the same time Repeat the experiment several times and describe your results
2 How did the actual results compare to your initial hypothesis What can you conclude about the effects of the Earthrsquos gravity on the rock and feather respectively
3 How does this activity compare to Activity 1 with two balls of the same size but different
weight Explain the differences andor similarities
2-7
Activity 3 Free Fall in a Vacuum
NOTE Do NOT run the vacuum pump unless it is connected to the lsquoRock and the Featherrsquo tube
As a lab group visit the station that consists of a glass vacuum tube and vacuum pump The apparatus consists of a long tube containing a rock and a bit of paper (or feather depending which tube is available) Air in this tube can be evacuated using the vacuum pump thus creating a vacuum (similar to space) Hold the tube vertically with the valve-end up Hook up the hose to the tube open the valve and turn on the pump After 60-80 seconds all air should be evacuated from the tube Shut the valve turn off the pump and remove the hose With all of the air out of the tube quickly turn the tube end up and hold it vertically while the feather and rock experience free fall Repeat the process several times and note your observations 4 Which object hits first in the vacuum tube the rock or the feather (or piece of paper as the
case may be) 5 How do the vacuum tube results compare with the results from Free Fall Activity 2 (above) 6 Explain processes that influence free-fall of objects under the influence of Earthrsquos gravity
a What are the controlling factors
b How does the Earthrsquos atmosphere affect the free fall of objects under the influence of gravity
c What other force(s) besides gravity is operating on the objects
2-8
Part D mdash Measuring the Earthrsquos Gravitational Acceleration Activity 1 Using the photogate apparatus to Measure Gravitational Acceleration Using a ldquoPHOTOGATErdquo (a light beam with a sensor for light) and a ldquoPICKET FENCErdquo (a clear plastic strip with uniformly spaced opaque bands) the acceleration due to gravity can be determined The photogate head emits an infrared beam from one side of its lsquoUrsquo shape to the other A light-emitting diode (LED) on the top of the Photogate Head blinks to show when an object blocks the beam Timing begins when an object interrupts the infrared beam We will drop our ldquopicket fencerdquo through the photogate head The software calculates the average velocity of the picket fence from one band to the next because the distance from one band to another was programmed into the calculation Before recording data experiment with the photogate and picket fence Procedure 1 Hold the picket fence at one end between your thumb and forefinger so the bottom edge of
the picket fence is just above the photogate beam (see diagram below) Have your partner click START then drop the picket fence through the photogate The computer will begin recording data when the photogate beam is first blocked
2 Click STOP once the entire lsquopicket fencersquo has passed completely through the photogate 3 Make sure the graph shows a diagonal line before moving on If data looks erratic make
sure you are dropping the picket fence vertically not at an angle data will be skewed 4 After your practice runs open the EXPERIMENT menu select DELETE ALL DATA RUNS 5 Using the techniques from above conduct five runs and record them in Table 1 6 Click on GRAPH from the left hand data menu and examine the plot of Velocity versus Time
in the Graph display Determine the slope of the lsquobest fitrsquo line for velocity versus time for each run Record these values in your data table and find the average Include units
Table 1
Run Number Slope of Best Fit Line (acceleration due to gravity)
1
2
3
4
5
AVERAGE
2-9
Name____________________________________
Lab Day _____ Lab Time_____________________
Post-Lab Questions on Acceleration Due to Gravity 1 What can you say about the values for acceleration from Table 1 Is it constant or does it
vary in some consistent manner
2 Compare your values (from Table 1 above) for the acceleration due to gravity g (with the accepted value for g at sea level at the equator of g = 981 ms2
3 What factors may have contributed to the value you determined experimentally being
different from the accepted value List and briefly describe several of these
31
ES 105 Laboratory 3 ENERGY OF OBJECTS IN MOTION and
PHYSICS OF LANDSLIDES
Introduction In this lab we will work with two important aspects of the physics of objects in motion From
lab 1 you should recall that energy can be transformed from one type to another and that energy is never created or destroyed it can however be transformed into different types of energy (like motion or heat) This is known as the concept of conservation of energy This very important concept tells us that an equal amount of energy exists before and after the conversion process Today in lab you will work with converting gravitational potential energy to kinetic In doing so it will seem that energy can disappear No process of transforming one type of energy to another is perfectly efficient and some energy will always be converted into forms that are inaccessible to us
The second key aspect of todayrsquos lab will focus on the physics of landslides Landslides are part of a spectrum of gravity-driven geomorphic processes collectively known as ldquomass wastingrdquo Mass wasting processes include rock fall rock avalanche landslide earth flow debris flow and soil creep The prerequisite conditions for landslides typically include (1) the Earthrsquos gravitational field (a fundamental driving force) (2) the occurrence of loose rock and sediment at the Earthrsquos surface (3) heavy rainfall and (4) steep slopes To understand the occurrence of landslides geologists and engineers must first understand the physics of gravity (ldquoNewtonian physicsrdquo ldquoNewtonrsquos Laws of Gravityrdquo) and how it interacts with materials (rock and sediment) at the Earthrsquos surface This lab provides an introduction to Newtonian physics gravity and the forces that cause landslides
Goals and Objectives
bull Further investigate the concept of conservation of energy bull Investigate the conversion of gravitational potential energy to kinetic energy bull Formulate explanations for energy that can seem to disappear bull Calculate effect of angle of influence on the acceleration of gravity bull Investigate frictional effect on motion
Useful Websites bull httplandslidesusgsgov bull httpwwwfemagovhazardlandslideindexshtm bull httpwwwphysicsclassroomcomClassnewtlawsU2L3ahtml bull httpwwwgrcnasagovWWWK-12airplanenewton2html bull httpenwikipediaorgwikiSineComputation
32
Name____________________________________
Lab Day _____ Lab Time_____________________ Pre-lab Questions 1 Define the following terms andor provide the correct formula prior to attending your lab
A GRAVITATIONAL POTENTIAL ENERGY
B KINETIC ENERGY
C MASS WASTINGLANDSLIDE
D FORCE
E NEWTON (unit of force)
F NEWTONS SECOND LAW OF MOTION
2 Calculate the following values
0o 10o 20o 30o 40o 50o 60o
Sine of angle
Cosine of angle
(If any of your values are negative set your calculator on degrees instead of radians)
33
Part A mdash Energy Transformation and Conservation In closed systems the Law of Conservation of Energy is obeyed It states the total energy
remains constant Another way to say this is that the initial total energy in a closed system is equal to the final total energy In this part of the lab we will examine two types of energy
1mdashTranslational Kinetic Energy = 2mv
21
EK =
where m = mass (kilograms) and v = velocity (msec) Kinetic energy is the energy associated with motion along a line It is measured in Joules [J] which is the same as
2
2
secondmeters kilogramstimes
2mdashGravitational Potential Energy = EP = mgh
where m = mass (kilograms) g = acceleration due to gravity (98 msec2) and h = height above surface (m) Gravitational potential energy is the energy associated with the gravitational pull on an object that is some elevation (h) above a surface (usually Earthrsquos surface) Think of skiing down a slope at the top of the hill you have a large potential energy ndash your elevation h is large As you travel down the hill your elevation decreases so does your potential energy EP = mgh At the bottom of the hill (at an altitude of h = 0) your potential energy is zero Does this mean your energy went to zero No Your potential has been converted into translational kinetic energy and yoursquore zipping along
Instead of skis we will roll a ball down a ramp converting potential energy into kinetic energy At the bottom of the ramp the ball can roll with some friction along a horizontal track We measure the final velocity as the ball traverses one meter along this track By comparing the initial potential energy to the final kinetic energy we will determine if energy is conserved Activity 1 Investigating gravitational potential energy and translational kinetic energy Go to the ramp-track station in the lab It should look like this
Support (Rods and Clamps)
Ramp
Table
Horizontal Track
lsquozerorsquo marker lsquo1 meterrsquo marker
Tape lsquocatcherrsquo
Release Point
h = 003 m
Meter Stick
Figure 1 Apparatus to investigate the conservation of energy
34
Procedures
1 Determine the mass of the ball in grams using one of the balances in the lab Record below
The ballrsquos mass is __________________ g and convert this mass to kilograms record below
__________________ kg 2 Carefully measure a starting point on the ramp that is 3 centimeters above the base of the
horizontal track (H= 003 m) Make sure you are measuring the VERTICAL HEIGHT of the starting point NOT the diagonal length from the base of the ramp
3 One person will release the ball from the previously determined release point Another person in the group will click START to begin recording The program will record the value of position versus time One person must catch the ball before it hits the motion sensor
DO NOT LET THE BALL HIT THE MOTION DETECTOR 4 Repeat this measurement for a total of five trials After each trial use the best fit line tool to
determine the slope of the graph following directions provide below The slope of the position versus time graph is equal to the average velocity of the ball rolling along the horizontal surface Record the velocity for each trial in the data table below (Table 1) Repeat your experiment 5 times and find the average
5 Follow these directions to determine the best fit line a Click the DATA tool button Select NO DATA b Click the DATA tool button again This time choose Run 1 c Click on the SCALE TO FIT button d Using your mouse select data click and hold the left mouse button to draw a box
around the part of the graph that is a smooth diagonal line This part of the graph corresponds to the ball rolling along the horizontal surface The line should be highlighted in yellow
e Now click on the FIT button and select LINEAR Record the slope (m) in Table 1 as the velocity
f Repeat steps a through e for all five trials Be sure to select part of the line for each trial Do not rely on it having yellow highlight Tabulate your data in Table 1
6 Run the experiment again starting the ball at 6 centimeters above the table top and calculate the velocity on the horizontal track in meterssecond Repeat your experiment 5 times and find the average Tabulate your data in Table 2
35
Table 1 Data table for experiment with ball starting at 3 centimeters above the table top
H = ___003__________ meters
In the last column record the velocity from the computer table if you used it to collect your data It is not necessary to record the time if you used the computer to collect your data
Trial Time (seconds) Velocity (msec)
1
2
3
4
5
AVERAGE
If you are using meter stick and manual timer you will need to calculate your velocity Table 2 Data table for experiment with ball starting at 6 centimeters above the table top H = ____006_________ meters In the last column record the velocity from the computer table if you used it to collect your data It is not necessary to record the time if you used the computer to collect your data
Trial Time (seconds) Velocity (msec)
1
2
3
4
5
AVERAGE
If you are using meter stick and manual timer you will need to calculate your velocity
36
Activity 2 Computational Questions Show your calculations be sure to include units in all of the equations on the next three pages 1 Calculate the initial potential energy in the system Ep = mgh (mass x acceleration of
gravity x height) for the ball starting at 3 cm (g = 98 msec2 use units of kg m seconds) 2 What is the final potential energy
(Hint write the equation with values inserted for the variables and remember h = 0 meters)
3 Calculate the final kinetic energy in the system 2K mv
21 E = (That is square of velocity
times the mass divided by 2 Use average velocity from 3 cm height and units of kg m s) 4 What is the initial kinetic energy (when the ball is at the top of the ramp)
(Hint write the equation with the values inserted for the variables) 5 Compare the initial potential energy (from Q 1) and final kinetic energy (from Q 3) Are
they equal (to within your uncertainty) or are they quite a bit different By what factor 6 Law of Conservation of Energy suggests that EP and EK should be equal explain how the
concept of conservation of energy is supported or rejected by the track experiment If rejected what might be the possible reasons
7 Surprise The potential and kinetic energy are not equal because we havenrsquot accounted for
the energy lsquolostrsquo during the rolling (rotational energy) motion of the ball
37
Part B mdash Newtonrsquos Second Law Force and Landslide Analysis Landslides are driven by the Earthrsquos force of gravity acting on a mass of rock or sediment on an inclined hillslope The critical analytical parameters include
Symbol Name Description Units
F Force of Gravity The pulling action on an object due to Earthrsquos gravity
Newton N = 1 kg-msec2
g Acceleration due to gravity
Constant on the Earth g = 983 msec2 msec2
m Mass Amount of material measured in kilograms
kg
θ Angle of Slope Angle of hill-slope inclination (90 degrees = sheer cliff face 0 degrees = flat surface)
degrees
Newtonrsquos second law of gravity states that the force operating on an object in space is directly proportional to the product of its mass and acceleration Newtonrsquos second law translates into the following equation
F = ma where F = force (Newton) m = mass (kg) and a = acceleration (msec2)
When Earthrsquos gravity is considered ldquoFrdquo is equivalent to ldquoweightrdquo (eg your weight on a scale is a measure of the Earthrsquos gravitational pull on your body mass the more mass you have the more you weigh) and ldquoardquo is equivalent to ldquogrdquo which is the acceleration due to gravity (a constant = 98 msec2) In terms of Earthrsquos gravitational pull Newtonrsquos second law is translated as
Wt = mg where Wt = weight of an object (Newtons) m = mass of object (kg) and g = acceleration due to gravity (g = 98 msec2)
This part of the lab is particularly relevant because the Willamette Valley represents one of
the most dynamic and spectacular geologic environments in the United States Intense seasonal rainfall patterns steep mountain slopes and expansive valleys provide for an active geomorphic setting associated with seasonal flooding and landslides Annual cost of damage to public and private lands in western Oregon ranks among the top 20 of the most severe in the United
38
States Damage to public infrastructure from storm events during the mid-1990rsquos alone totaled hundreds of millions of dollars Landslides accounted for a large portion of this damage Slope failure and erosion in the Coast Range are further exacerbated by sustained timber harvesting and the Willamette Valley is experiencing unprecedented population growth and development invading the foothills Understanding of the spatial and temporal distribution of landslides is critical for the appropriate design of land-use regulations hazards mitigation and conservation planning (read this as ldquoYour house could be next How do you know if you are at risk for landslide and what can you do about itrdquo)
Application of Newtonrsquos Second Law With your lab group visit the inclined plane station and examine the apparatus A mass of rock is sitting on an inclined plane this is analogous to a mass of rock on a hill-slope in the Coast Range or western Cascades The figure below illustrates the forces acting on the slope material
Figure 2 Diagram of forces of weight Definitions for Particle on Slope
θ = slope angle relative to horizontal plane (units in degrees) Wt = weight of particle or mass of material (units in N) = mass x gravity Shear force parallel to slope = Wt x sin θ (units in N) Normal force perpendicular to slope = Wt x cos θ (units in N)
Equations for Particle on Slope
Wt (weight of particle in Newtons) = mg (= mass times acceleration of gravity) SHEAR force (in N) = Wt (sin θ) NORMAL force (in N) = Wt (cos θ)
39
Activity 1 Force Analysis of a Rock Mass on a Slope (Inclined Plane) Questions Given that shear force is oriented down slope and normal force is oriented perpendicular to slope answer the following questions (refer to the inclined plane drawing above) 1 Which of the two forces (shear or normal) will drive the rock-block down slope when it fails 2 Which of the two forces will tend to resist down-slope movement of the rock mass 3 When do you think the block will begin sliding down the slope (Circle one comparison) shear = normal shear lt normal shear gt normal
Instructions
1 Determine the mass of our block-of-rock sample by using the balance in the room a Mass of Rock Block kg (HINT 1 kg = 1000 g)
b Weight of Rock Block N (Newtons) Show Calculations
2 Place the rock on the inclined plane and slowly lift the board to determine the critical
angle at which it slides down the slope (tilt the plane until the rock begins to slide) Record the angle in Table 3
3 Now repeat the experiment with various types of surfaces Record the angles in Table 3 Reduced friction Tape wax paper to the rock (place it between rock and wood) Increased friction Tape a piece of sand paper (place it between rock and wood)
Figure 3 Critical Angle apparatus
310
Table 3 Critical Angle of sliding for various surfaces
Condition of Inclined plane
Critical Angle of sliding (degrees)
Normal Force at Critical Angle
Wt x (cos θ)
Shear Force at Critical Angle Wt x (sin θ)
Rock on Wood
Rock on Wax Paper
Rock on Sandpaper
4 Calculate the normal force and shear force of the critical anglesmdashbe sure your calculator is
using degrees not radians to calculate the sine and cosine of angle θ Record in Table 3 5 How do inclined-plane results (Table 3) compare to your prediction in question 3 above 6 List some ideas as to what other physical factors may be important to slope failure that are
not part of the above equations for slope analysis
7 Based on your experiments above discuss the effects of surface friction on the critical hill slope angle at which landslides occur
8 In the absence of wax paper and sand paper on hill slopes in the natural environment what
types of factors will influence the frictional conditions and critical angles at which hill slopes fail
311
Name____________________________________
Lab Day _____ Lab Time_____________________
Post-Lab Assessment Calculations 1 Imagine you have placed yourself on a balance and determined that your body mass is
100 kg Calculate your weight in units of Newtonrsquos (hint 1 N = 1 kgmsec2) Show all of your math work keep units with numbers
2 A car has a mass of 1000 kg and the net force exerted on the car is 0 N Use Newtons
2nd Law to calculate the acceleration of the car in msec2 Show all of your math work keep units with numbers
3 A rocket has a mass of 1000 kg and the net force exerted by the rocket engine is 2000 N
Use Newtons 2nd Law to calculate the acceleration of the rocket in msec2 Show all of your math work
Questions 1 What effect will clear-cut logging of trees have on slope stability in the Coast Range
Explain your answer in the context of todays lab experiments 2 Write a 5-10 sentence summary of the critical factors that affect landslide susceptibility in
western Oregon Think about the conditions necessary for landslides to occur and the factors that affect the critical thresholds at which they begin
41
ES 105 Laboratory 4 UNDERSTANDING GEOLOGIC TIME
Relative Dating and Fossils Radioactivity and Numerical Age Determination
Introduction The Geologic Time Scale was developed using two approaches In the first rock units were
studied and correlated between geographically distant areas using the principle of faunal succession With the discovery of radioactivity in the early 20th century numerical (or ldquoabsoluterdquo) ages could be applied to the Geologic Time Scale In this weekrsquos lab you will explore both of these aspects of geologic time
First you will investigate the Geologic Time Scale and examine how features of the geological record ndash species of fossils and other features ndash can be used to correlate geological events In this approach geologic events are placed in a correct sequence and the relative age (which layerstrata is older and which is younger) of the events is determined
You will then explore the concept of half-life One half-life represents the time it takes for half of the radioactive parent isotopes to decay into stable daughter isotopes Numeric ages are calculated from rock samples by comparing the amount of daughter isotope in the rock to the amount of remaining parent isotope because different radiometric isotopes decay at known statistically constant rates Radiometric dating thus provides Earth scientists with a powerful tool to investigate Earth history Goals and Objectives
bull Construct a geologic time scale to gain an understanding of the timing of major events in Earthrsquos history
bull Use fossils to constrain the ages of sedimentary strata and to correlate strata of different thicknesses
bull Develop a conceptual understanding of half-life bull Calculate half-life from counts of decay to daughter atoms bull Determine ages of materials using half-life radioactive decay techniques
Useful websites
bull httpwwwgeosocietyorgsciencetimescaletimesclhtm bull httppubsusgsgovgipfossilssuccessionhtml bull httppubsusgsgovgipgeotimeradiometrichtml bull httpevolutionberkeleyeduevolibraryarticlehistory_23
42
Name____________________________________
Lab Day _____ Lab Time_____________________
Pre-lab Questions ndash Complete these questions before coming to lab 1 Define the following terms prior to arriving at your lab section
A Geologic period
B Stratigraphic correlation
C Parent atom
D Daughter atom
E Isotope 2 Your lab period lasts 110 minutes If your lab instructor spends 20 minutes introducing the
lab and giving instructions what percentage of the lab will you have spent listening to your instructor talk Show your calculations
3 The oldest known crustal rock is 38 billion years old Give this age in millions of years
Show your calculations Include units with the numbers 4 Briefly describe and graphically represent (draw a diagram) the concept of half-life in the
space here
43
Part A mdash Scale Modeling of Geologic Time and Earth History As an introduction to the duration and extent of Earth history you will work in lab groups to build a scale model of significant geologic events Activity Table 1 is a summary of the significant events in Earth history The geologic time interval of the events is given in the last column of the table Use this table as a reference to construct a model of geologic time Using the note cards provided build a physical model of geologic history in the hallway outside the classroom using the floor tiles as a scale for time You must decide the scale to use for your model (for example given the length of the hallway and total number of floor tiles available how many tiles will represent 1 billion years of Earth history or 1 million years) Determine an appropriate model scale and lay out your note cards in the appropriate order and at the appropriate scaled distance along the hallway Your scale should be such that all of the note cards are not piled on top of one another Questions 1 What scale did your group use for the physical model of geologic time (answer in number
of floor tiles billion years)
2 Examine your scale model noting how the spacing of events changes Sketch your model of the geologic time line below with spacing generally to scale
44
Table 1 Summary of Significant Events in Geologic Time (from oldest to youngest)
Years Before Present
Event in Earth History Event occurred during this Geologic Time Interval
46 billion Estimated origin of Earth
Pre
cam
bria
n Ti
me
Beginning of Hadean Eon 38 billion Oldest known crustal rocks Beginning of Archean Eon
30 billion Oldest known fossil life (stromatolites = fossil mats of bacteriablue-green algae) Archean Eon
25 billion Evidence of glaciations climate impact preserved in the rock record (ancient glacial deposits)
Start of Proterozoic Eon
18 billion Multicellular algae preserved in the fossil record Proterozoic Eon
700 million Oldest well-documented worm burrows preserved in rock record Late Proterozoic Eon
540 million
Invertebrate marine organisms abundant (trilobites brachiopods)
Pale
ozoi
c Er
a
Start of the Paleozoic Era Cambrian Period
430 million First jawed fish vertebrates evolve first early land plants Silurian Period
370 million Amphibians evolve (water-land animals) fish abundant Devonian Period
300 million Reptiles evolve amphibians abundant coniferous land forests abundant Carboniferous Period
245 million
Mass extinction event many invertebrates become extinct End of Permian Period
220 million Dinosaurs evolve first mammals evolve
Mes
ozoi
c E
ra Triassic Period (Mesozoic Era)
200 million First birds evolve dinosaur city Jurassic Period (Mesozoic Era)
100 million Flowering plants evolve mammals become very diverse dinosaurs still around Cretaceous Period (Mesozoic Era)
66 million Mass extinction event dinosaurs become extinct (global asteroid impact event)
End of Cretaceous Period (Beginning of Cenozoic Era)
55 million Global greenhouse climate warm and toasty on the planet mammals diversify
Cen
ozoi
c E
ra
Eocene Epoch (Tertiary Period)
35 million Global cooling of climate start of the glacial climate cycles glaciers develop on Antarctica Oligocene Epoch (Tertiary Period)
3 million Hominids (man) evolve from hominoids Pliocene Epoch 2 million Massive ice sheets in North America Start of the Pleistocene Epoch 18 million Homo erectus evolves (precursor to modern) Pleistocene 300000 Homo sapiens evolve Pleistocene Epoch 10000 Modern humans take over Holocene Epoch 0 years You and I sit here thinking about it Late Holocene
45
Part B ndash Time and Stratigraphy For this part of the lab you will use a beaker sediment and fossils to explore the relationship of time and correlation in geology Obtain the materials for this activity Follow the instructions record your observations and answer the questions in the spaces provided Procedure 1 Pour a few centimeters of sand into the beaker Level the sand by gently shaking the jar
from side to side 2 Place an Ordovician fossil on top of the sand layer 3 Pour a few centimeters of gravel on top of the sand and shell 4 Place a Devonian fossil on top of the gravel layer 5 Cover the gravel layer and shell with a few more centimeters of sand 6 On the left side of the diagram below sketch the contents of your beaker actual thickness
Label the two sand layers the gravel layer and the two fossils along with the geologic ages of the fossils
7 Trade beakers with another group or set your beaker by the fossil and sediment supplies 8 Measure the size of an individual grain of sand in millimeters and record the grain size in the
data table (Table 2) Estimate the average size of the gravel in millimeters and record the grain size in the data table (Table 2)
9 Measure the thickness of your layers in millimeters and record in the data table (Table 2) Your Group Other Group (see pg 49 q 8)
46
Table 2 Data table for Time and Stratigraphy activity
Answer the following questions 1 If a bed of sand a single grain in thickness was deposited once each year how long would it
take to form beds with the thickness of the sand layers in your beaker Determine for both lower and upper sand layers Show calculations below and record answers in Table 2 above
2 If the minimum thickness of a gravel bed were a single grain of gravel in thickness how long
would it take to form your gravel layer if one grain-thickness was deposited each year Show calculation below and record answer in Table 2 above
3 Compare the relative age of the lower sand bed to the Ordovician fossil Is the sand
younger or older than the fossil What about the gravel
Layer Grain size
(mm) Thickness
(mm)
Time to deposit layer (years) ndash calculated in
Questions 1 amp 2 below
Upper sand
Gravel
Lower sand
47
For the following questions refer to the Geologic Time Scale Answer in terms of PERIOD listed on Geologic Time Scale not absolute age in millions of years 4 Assuming that the lower fossil in your beaker was deposited in the Ordovician Period what
is the OLDEST that the gravel bed could be (Answer in terms of Period listed on Geologic Time Scale)
5 What is the YOUNGEST that the lower sand bed could be (Answer in terms of Period listed
on Geologic Time Scale) 6 Assuming that the upper fossil was deposited during the Devonian Period what is the
YOUNGEST possible age of the gravel layer (Answer in terms of Period listed on Geologic Time Scale)
7 What is the OLDEST possible age of the upper sand layer (Answer in terms of Period listed
on Geologic Time Scale) 8 Borrow a jar from another group On the right side of the diagram on page 6 sketch and
label the sediment layering in the other grouprsquos jar Draw lines between the columns to CORRELATE (match) the layers fossils and geological ages You have just demonstrated how geologists relate rocks in one area to those in another area
9 Do you think fossil or the type of sediment is more important in correlating of rock units
between different areas Explain your answer
GGeologicc Time Scale
hhttpgeologgycomtime
48
ehtm
49
Part C ndash Exploring the Concept of Half-Life The determination of Earth history by numerical ages is achieved from measurements of
radiometric isotopes found in some rocks and other Earth materials The PARENTDAUGHTER ratio may be used to calculate the absolute age of a rock sample Recall from lecture that numerical (or absolute) ages for geological events are derived from the measurement of certain radioactive isotopes in Earth materials Isotopes are atoms of an element that have differing numbers of neutrons in their nuclei Various isotopes of the chemical elements are radioactive meaning that the nucleus is unstable and decays (disintegrates) by emitting one or more particles which are designated as alpha (α) beta (β) and gamma (γ) This decay usually changes the original radioactive isotope (PARENT) into a different isotope (DAUGHTER) For example 238U 234Th + α
While the time interval before each individual nuclide disintegrates is random each known isotope has a determined half-life value which represents the rate of isotope decay A second half-life is reached when half of the remaining radioactive parent decays and so on Hence half-life is the time during which each nucleus has a 50 chance of disintegrating
In this activity you will explore the basic concept behind radioactive decay and half-life You will need a cup 100 pennies and a calculator for this activity You will treat these pennies as if they were radioactive isotopes that are decaying A penny that lands heads up is a parent isotope and a penny that lands tails up has ldquodecayedrdquo into a daughter isotope Procedure
1 Count your set of pennies to make sure you have 100 For Trial 1 put the pennies into the cup and shake vigorously Pour the pennies out on the table count how many pennies are heads up record result in Table 3 and calculate the percentage of heads up pennies [(heads up)(total of pennies poured out on that trial)] and record in table
2 For Trial 2 put the heads-up pennies back into the cup and set the tails-up pennies aside Repeat step 1 making the same calculation as above and record results in Table 3
3 For Trial 3 put the heads-up pennies back into the cup and set the tails-up pennies
aside Repeat step 2 making the same calculations as above Record results in Table 3
4 Continue this process until the pennies are gone recording the results in Table 3
410
Table 3 Results of penny experiment
Trial Number of Heads of Heads Up in Trial 1 2 3 4 5 6 7 8 9
10
Instructions Plot the results of this experiment on the graphs below (Figures 1 and 2)
On Figure 1 graph the total number of heads-up pennies for each trial On Figure 2 graph the percentage of heads-up pennies for each trial
100 90 80 70 60 50 40 30 20 10
Trial 1 2 3 4 5 6 7 8 9 10
Figure 1 Graph showing the total number of heads up pennies for each trial
100
90
80
70
60
50
40
30
20
10
Trial 1 2 3 4 5 6 7 8 9 10 Figure 2 Graph showing the percent of heads
up pennies in each trial
411
Questions 1 Is your graph of the total number of heads up pennies per trial (Figure 1) a linear or
exponential (curved) relationship Explain why you think the graph has this shape 2 What would be the predicted ratio of heads to tails in each trial Is this prediction verified by
the results of this experiment displayed in Figure 2 3 The number of radiometric parent and daughter isotopes in even a small sample of rock is
huge however statistical errors still must be accounted for This is one source of uncertainty in radiometric dating methodology Make a generalized statement about the statistical reliability of the headstails experiment That is how does the number of pennies used in the experiment increase or decrease the reliability of the results (Notice your results as the number of pennies decreases as you have graphed in figures 1 and 2)
4 How reliable would the results be from an experiment starting with billions of pennies Explain
412
Part D ndash Determining the Half-Life of 137Ba The isotope 137Cs has a half-life of 30 years and decays by the reaction
137Cs 137Ba + β where β is a beta particle (an electron from a nucleus) and 137Ba is an isotope of barium in the excited state The symbol denotes the excess energy that the barium nucleus has after it has formed through beta decay from cesium The barium nucleus loses the excess energy by releasing a gamma particle (high-energy electromagnetic particle) given by the following reaction
137Ba 137Ba + γ The half-life of this nuclear reaction is a few minutes To measure the half-life it is enough to measure the activity of a sample of 137Ba starting from the time it is formed until a significant amount has decayed The 137Ba source is produced by passing an eluting solution (slightly acidic saline solution) through a sample of 137Ba The 137Ba is dissolved into the eluting solution but the 137Cs is not dissolved So the solution contains only 137Ba
Procedure Your instructor will provide the solution to you and assist with the experiment 1 Place 3 drops of eluting solution containing the 137Ba on a watch glass 2 Place the watch glass under the Geiger counter 3 Start recording data by clicking START Record data until the decay rate shown on the
graph stops changing This should take about 10 minutes 4 Click STOP Print enough copies of the graph so that all of your group members have one 5 Draw (by hand) a best-fit curve through the data points on your graph extrapolating
the curve back to where it intersects with the y-axis of the graph Remember a best-fit curve does not connect the data points on the graph Instead a best-fit curve is a smooth curve that comes as close as possible to all of the data points without necessarily going through most of them You will use the graph to analyze the data and answer the questions on the following pages
413
Data Analysis and Questions Follow the directions and complete the table provided below to estimate three independent values for the half-life of 137Ba from your graph of the activity 1 Using your best-fit curve find the count rate at time zero of the data collection run and
record this as the starting count rate value in 1 of Table 2 below Next using the best-fit curve find the count rate that is approximately one-half of the original value and record this as the ending count rate in line 1 of the data table Also record the time at which one-half the original count rate is reached as the time at the end of the interval
2 Enter the ending time and final count rate from 1 as the starting time and count rate for 2 on the data table Use the best-fit curve find the count rate that is approximately one-half of the starting count rate Record this final count rate value as well as the time at which the value is reached
3 For line 3 do not use the ending count of line 2 Instead pick a point near the higher end of the count data along the best-fit curve that is easily divisible by two and record the starting time and this starting count rate in 3 of the data table Find the point on the best-fit curve where the count rate drops to approximately one-half your original count value Record the ending count rate and ending time as before
4 Calculate the half-life of 137Ba for 1 2 and 3 and record in Table 2 Table 2 Table for data analysis and estimation of half-life values
Time at starting count rate (start of interval)
Starting Count Rate (at the start of interval)
Ending Count Rate (half of starting count rate)
Time at ending count rate
Half-life for 137Ba (end time minus start time)
1 00
2
3
1 Do the half-life values agree Explain why or why not
2 Determine the average value for the half-life of 137Ba______________________________
414
Name____________________________________
Lab Day _____ Lab Time_____________________ POST-LAB ASSESSMENT 1 Based on your physical and quantitative models of Earth history assess the importance of
modern humans in the relative framework of biologic and physical evolution of the planet 2 Convert the following decimal values to percents and reduced fractions
Decimal Percent Fraction
050
025
0125
00625
003125
Your prelab diagram of half life may help you visualize the following questions 3 You have 1224 mg of freshly prepared gold-189 half-life 30 min How much of the gold-
189 sample remains after five half-lives 4 A piece of fossilized wood has carbon-14 activity one-eighth that of new wood How old is
the artifact The half-life of carbon-14 is 5730 years 5 A sample of a particular radioisotope is placed near a Geiger counter which is observed to
register 160 counts per minute Eight hours later the detector counts at a rate or 10 counts per minute What is the half-life of the material
5-1
ES 105 Laboratory 5 INTRODUCTION TO CHEMICAL REACTIONS
Introduction
By definition a physical change is one in which only the physical characteristics such as state (gas liquid or solid) size density or color of a substance is changed without changing its composition Ice melting is an example of a physical change (solid to liquid change of state) A chemical change results in the formation of one or more NEW substances with different composition and properties from the original substances When a match burns the ashes and smoke are very different than the original match In todayrsquos lab you will observe a number of different chemical changes
A chemical change is accomplished by rearranging atoms through breaking and reforming of chemical bonds in a chemical reaction The actual rearrangement of atoms ndash bond breaking and reforming ndash is not directly observable Because we cannot see this process we have to use indirect evidence to infer that a chemical change has occurred These indirect lines of evidence include production of gas production of a solid (precipitate) release of heat (exothermic reaction) absorption of heat (endothermic reaction) change in pH andor change of color (unless using indicators to check for acids or bases) Goals and Objectives bull To acquaint students with the nature chemical changes bull To identify whether a chemical change has occurred based on a series of observations bull To study and explore basic types of chemical reactions bull To perform a series of experiments make observations and determine whether a
chemical reaction has occurred Useful Websites
bull httpwwwricedufacultyptiskusreactions bull httpwwwchemtutorcomreacthtm bull httpwwwmcwdnorgchemistpcchangehtml
5-2
Name____________________________________ Lab Day _____ Lab Time_____________________
Pre-Lab Activities Answer the following questions Use the material presented in the lab your lecture materials and text to assist in answering these questions 1 How is a chemical change different from a physical change How can you determine
whether a chemical change has occurred List at least three observations that may indicate a chemical change has occurred
2 In chemistry what is a lsquoreactantrsquo
3 Define endothermic 4 Define exothermic 5 If a reaction container feels warmer after the reaction has occurred was the reaction
endothermic or exothermic
5-3
SAFETY NOTES Be sure to read and understand before proceeding
For safety reasons before you begin this laboratory all books packs and coats
must be stored at the front of the room
Be sure that all of the equipment that should be in your kit is there and that it is clean
and ready to use For some of the reactions it is very important to have clean
equipment and not to introduce contaminants Contamination can produce incorrect
results If you are unable to clean a piece of equipment ask your instructor if you
need to replace it at this time
Be sure to follow instructions carefully Use the proper measurements as indicated
in the instructions Be observant
In some of the experiments you will be mixing acids and water The rule is
ALWAYS ADD ACIDS TO WATER NEVER ADD WATER TO ACIDS
When you are through with the lab be sure that you leave the equipment as you
would like to find it Remember there are many other students using the same
equipment over the course of the quarter
The Golden Rule of Chemistry Labs
LEAVE THE LAB FOR OTHERS AS YOU WOULD HAVE THEM LEAVE IT FOR YOU
WEAR YOUR GOGGLES
5-4
Part A ndash Indicators Chemical fluids are often acidic or alkaline (basic) The pH of a solution describes its
acidic or alkaline character Neutral pH is 7 acidic solutions range from pH 0 to 7 alkaline solutions range from pH 7 to 14 The number comes from the negative log of the hydrogen ion concentration (or pH = mdashlog [H+]) Solutions are characterized as acidic or alkaline according to their pH
Indicators are particular substances added to solutions that change color according to the pH (acidity or alkalinity) of the solution They are highly useful in measuring the pH of a solution quickly and quite accurately Indicators are used in a wide range of fields (environmental forensics petroleum) to determine the concentration of a chemical of interest with great accuracy There are many pH indicators used in chemistry each with their own color changes and active pH range One of the most common pH indicators is phenolphthalein Phenolphthalein is an ionic substance that changes color in solutions that have a particular pH range Activity 1 Pour 1-2 mL of 01 M Sulfuric Acid H2SO4 into a test tube Add 3-4 drops of phenolphthalein solution Place a stopper on the tube and shake gently Record result in Table 1 Do not throw out solution as you will need it for Activity 3 Activity 2 Place 5 mL of distilled water in a large test tube Using your forceps (tweezers) put a small pellet of sodium hydroxide NaOH into your test tube Gently tap the tube in the counter if the pellet is stuck to the side of the tube NEVER HANDLE NaOH WITH YOUR FINGERS It is strongly alkaline and will burn your skin Place a rubber stopper on the test tube and shake gently Remove the stopper and add 3-4 drops of the phenolphthalein solution to the tube Place the stopper back on the test tube and shake it gently Observe the tube for a few minutes Record result in Table 1 below Do not throw out solution as you will need it for Activity 3 Activity 3 Use pH paper (measures the specific range from pH 1 ndash 14) and determine the pH number associated with each solution in Activity 1 and 2 Record results in Table 1 below You are done with the solutions so discard solutions and rinse out test tubes Table 1 pH of solutions Fluid Character
(acidalkaline) Response of phenolphthalein indicator
pH number
Dilute H2SO4
Dilute NaOH
Question 1 Phenolphthalein is an indicator for what pH character
5-5
Part B ndash Studying Chemical Reactions In this part of the lab you will work through a sequence of experiments make observations
and determine whether a chemical reaction has occurred Follow the instructions to do the experiments in the containers specified not in the small tubes containing the reactants As you progress through this portion of the lab complete lsquoTable 2 Observationsrsquo on the following page Allow cloudy solutions to sit in the test tube rack to see if a precipitate settles out Include this information in your observations Experiments 1 Add 5 mL of tap water to a large test tube Grasp the tube by wrapping your hand around it
Notice the temperature of the tube Add ammonium chloride crystals NH4Cl to this test tube Close the tube with a rubber stopper and shake gently Notice the change in temperature of the tube as the crystals dissolve Record your observations in Table 2
2 Pour 1 mL of 01 M potassium bromide KBr into a large clean test tube Add 1 mL of 01 M
sodium chloride NaCl to the KBr Record your observations in Table 2
For reactions 3 and 4 take two clean test tubes 3 place1 mL of 01 M sodium chloride NaCl in one test tube
4 and place 1 mL of 01 M Potassium Chromate K2CrO4 in the other test tube
Add a few drops of 01 M silver nitrate AgNO3 to each Record your observations for each in Table 2
5 Pour 5 mL of 1 M hydrochloric acid HCl into a clean test tube Carefully add a small chip of
calcium carbonate CaCO3 to the acid Record your observations in Table 2 6 Take the test tube containing sodium bicarbonate (baking soda) NaHCO3 from your kit Add
several drops of acetic acid (vinegar) HC2H3O2 Record your observations in Table 2 Complete Table 2 by determining whether a reaction took place for each of the experiments you performed and describe the evidence in support of a reaction taking place
5-6
Table 2 Observations from chemical reaction experiments
Has
a c
hem
ical
re
actio
n oc
curr
ed
Obs
erva
tions
(F
izze
s) (
Prec
ipita
te fo
rms)
(co
lor c
hang
e)
(Tem
pera
ture
Cha
nge)
or
()
Writ
e ch
emic
al n
ames
of
reac
tant
s
(eg
Am
mon
ium
chl
orid
e +
wat
er)
Expe
ri-m
ent
1 2 3 4 5 6
5-7
Questions 1 Which chemical reactions produced a new phase
List by experiment number in the proper column in the table below Some of the reactions may have not created a new phase some may have created more than one new phase
CREATED SOLID PHASE CREATED LIQUID PHASE CREATED GAS PHASE
2 Is a new phase always an indication of a chemical change Explain
3 Which reactions were exothermic (gave off heat) How could you tell
4 Which were endothermic (absorbed heat) How could you tell 5 Is a color change a reliable indicator of a chemical reaction Explain
6 What gas was released in Experiment 5 How might you test for the type of gas released
during a chemical reaction
5-8
Part C ndash Endothermic and Exothermic Reactions In this part of the lab you will use a TEMPERATURE SENSOR interfaced with a computer to study one exothermic reaction and one endothermic reaction
Procedures (wear your googles) Activity 1 Citric acid solution and baking soda
The equation for this reaction is H3C6H5O7 (aq) + 3 NaHCO3 (s) 3 CO2 (g) + 3 H2O (l) + Na3C6H5O7 (aq)
citric acid baking soda
1 Place a Styrofoam cup into the 250 mL beaker as shown in the diagram provided by your instructor Put 30 mL of 15 molar citric acid into the cup Place the temperature sensor into the citric acid solution
2 Weigh out 50 g of solid baking soda on a piece of weighing paper 3 Start recording data by clicking START 4 Wait 20 seconds and then add the baking soda to the citric acid solution Stir gently and
continuously with the temperature sensor to ensure good mixing 5 Use the DataStudio program to record data until the reaction is complete After the data has
been recorded dispose of your reaction products as directed by your instructor Rinse the Temperature sensor with distilled water
Activity 2 Magnesium and hydrochloric acid
The equation for this reaction is Mg (s) + 2 HCl (aq) H2 (g) + MgCl2 (aq)
magnesium hydrochloric acid
1 Measure out 30 mL of 05 molar HCl solution into a second Styrofoam cup and place the Temperature Sensor into the HCl solution
2 Obtain a 20 cm piece of shiny magnesium metal from your instructor 3 Start recording data by clicking START After 20 seconds add the magnesium ribbon to the
acid solution Stir gently and continuously with the temperature sensor to ensure good mixing
4 Use the DataStudio program to record data until the reaction is complete After the data has been recorded dispose of your reaction products as directed by your instructor Rinse the Temperature Sensor with distilled water
5 Click TABLE from the left hand menu Set up your Table display so it shows both experiments
6 Find the minimum and maximum values for temperature for the citric acidbaking soda and the MgHCl experiments Record the initial temperatures in your data table Then record the minimum or maximum value as the final temperature
5-9
Results Calculate the temperature change for each reaction by subtracting the initial temperature from the final temperature
Citric Acid-Baking Soda Hydrochloric Acid-Magnesium
Final Temperature (oC)
Initial Temperature (oC)
Temperature Change (oC) (Use correct sign)
Was reaction Endothermic or Exothermic
Questions about endothermic and exothermic reactions 1 Which reaction had a negative temperature change Is the reaction endothermic or
exothermic Explain 2 For each reaction describe three ways you could tell a chemical reaction was taking place 3 Which reaction took place at a greater rate (produced a temperature change Faster or
Slower) Explain your answer
5-10
Name____________________________________
Lab Day _____ Lab Time_____________________ POST-LAB ASSESSMENT 1 What type of change (physical chemical or both) occurs when ice becomes water
2 When you apply rubbing alcohol to your skin you feel a cooling effect Is a chemical
reaction taking place Explain 3 When you apply hydrogen peroxide to a cut there are bubbles released Is a chemical
reaction taking place Explain 4 What factors affect the rate of a chemical reaction
5 List some chemical reactions that are useful or annoying in your daily life
6-1
ES 105 Laboratory 6 STUDY OF SEDIMENTS AND SEDIMENTARY ROCKS
Introduction Rocks are the materials of Earth and understanding their origin and how they change enables
us to begin to understand Earth and its processes Rocks are aggregates of minerals and are classified into three groups based on the processes that formed them Igneous Sedimentary and Metamorphic This lab focuses on some of the common sedimentary rocks which are formed at the surface of Earth
Sedimentary rocks can form from the consolidation and lithification of particles called sediment Sediment is created either by physical processes breaking pre-existing rocks into smaller particles or by inorganic or organic chemical processes where mineral material is precipitated from solution Sedimentary rocks can also form by the precipitation of mineral material from solutions containing dissolved mineral materials
Sedimentary rocks form at or near Earthrsquos surface in many different environments including oceans (marine) streams (fluvial) lakes (lacustrine) deserts (eolian (wind)) and alpine (glacial) Some sedimentary rocks have features that reveal a great deal about the environment in which they formed For example the degree of rounding of the particles the presence and nature of fossils and the mineral composition may help decipher the conditions in ancient environments These observations provide clues about ancient Earth history and also aid in finding potential fossil fuel deposits
A handful of minerals are commonly found in association with sedimentary rocks including quartz potassium feldspar plagioclase feldspar mica (muscovite and biotite) calcite halite gypsum clay minerals and hematite You will examine most of these minerals at the beginning of this lab activity Goals and Objectives
bull To become familiar with minerals commonly associated with sedimentary rocks bull Investigate the characteristics of sediment grains bull Recognize the classes of sedimentary rocks (Clastic and Chemical) and be able to
distinguish samples of each type bull Classify and name samples of sedimentary rocks by their composition and texture
Useful Websites
bull httpwwwphysicalgeographynetfundamentals10fhtml bull httpwwwwindowsucaredutourlink=earthgeologysed_clastichtml bull httpwwwwindowsucaredutourlink=earthgeologysed_chemicalhtml bull httpreynoldsasueduglg103sed_env_starthtm
6-2
Name____________________________________
Lab Day _____ Lab Time_____________________
Prelab questions Complete prior to arriving at your lab section Define TERMS that are in CAPITAL LETTERS and answer the questions below 1 CLASTIC SEDIMENTARY ROCK (also called detrital sedimentary rock)
2 What is the most common clastic sedimentary rock 3 CHEMICAL SEDIMENTARY ROCK 4 What is the most common chemical sedimentary rock 5 CEMENTATION (of clastic rocks) 6 List common sedimentary rock cements
6-3
Part A ndash Observing Sediment Grains In this part of the lab you will examine examples of common sediment grains with a
magnifying glass record your observations and provide sketches of the grains When you look at each sample of grains notice the shapes sizes distribution of sizes and variety of composition of the grains
bull Grain Shape can be well rounded subrounded subangular and angular bull Grain Size size becomes smaller and more rounded with more time in the
transportation system It is a clue to the environment of deposition Use millimeters (mm) to record the grain sizes
bull Grain Sorting is a term to describe the range of sizes present Well Sorted = grains are all about the same size Moderately Sorted = largest grains are 4 to 5 times the size of the smallest Poorly Sorted = largest grains are 5 to ten times the size of the smallest
bull Grain mineral types Often noting the colors of grains can be useful Include quartz (the most common) feldspar mica and rock fragments Fossils may indicate an adjective (fossiliferous) be added to sedimentary name
bull Cements are the ldquogluerdquo that hold together the grains Include calcite silica iron oxide gypsum and halite
Activity 1 Loose Sediment Grains
Study the samples of sediment grains that have been provided Complete the tables on the following page For each sample describe the general shape of the grains record the average grain size and the range of grain sizes describe the sorting list the grain types (or colors of individual grains) Use Table 1 to suggest (name) what the likely sedimentary rock would be formed from the sediment Also make a simplified sketch of the sediment grains showing the sorting and grain shape
Table 1 Grain sizes of clastic sedimentary rocks
Size descriptions Sediment Particle size Rocks formed from it
Coarse
Fine
Gravel
Boulder gt256 mm (10 in) Conglomerate (rounded grains)
Breccia (angular grains) Cobble 64-256 mm
Pebble 2 to 64 mm
Sand 00625 ( frac124) to 2 mm Sandstone
Mud
Silt 00039 ( frac128) to 00625 mm Siltstone
Clay lt00039 mm Mudstone (massive) Shale (bedded)
6-4
Sample 2 Observations Sketch of the sediment
General shape of grains
Average grain size
Range of grain sizes
Description of sorting
List of grain types
Probable rock type formed
Sample 3 Observations Sketch of the sediment
General shape of grains
Average grain size
Range of grain sizes
Description of sorting List of grain types
Probable rock type formed
Sample 4 Observations Sketch of the sediment
General shape of grains
Average grain size
Range of grain sizes
Description of sorting
List of grain types
Probable rock type formed
Sample 1 Observations Sketch of the sediment General shape of grains
Average grain size
Range of grain sizes
Description of sorting
List of grain types
Probable rock type formed
6-5
Part B ndash Introduction to Classifying Sedimentary Rocks Examine the sedimentary rock study sets provided and answer the following questions 1 Study the set of sedimentary rocks provided Place those that are made of pieces or
fragments of mineral andor rock material (but not the rocks that have shells or shell fragments) on one tray and the rocks made of organic material (like shells or coal) or of crystals on the other tray One group of samples is the CLASTIC SEDIMENTARY ROCKS The other group is the CHEMICAL SEDIMENTARY ROCKS
DO NOT CONTINUE TO (2) BEFORE YOUR INSTRUCTOR CHECKS YOUR WORK 2 In the spaces below list the sample numbers that occur in each group
Clastic Sedimentary Rocks
Chemical Sedimentary Rocks
Keep the rocks on these trays You will be asked to use one tray or the other for Part B 3 Use the clastic rock tray Pick up each specimen and look at the size of the grains (the
fragments of which it is composed) Use a magnifying lens and ruler to measure size of the grains Separate the clastic specimens into two groups based on the grain size those that have large grains (big enough to distinguish without a magnifying lens) from those that have small grains (too small to see individual grains without a magnifying lens) In the spaces below list the sample numbers that occur in each grain-size group
Coarse-grained Clastic Rocks
Fine-grained Clastic Rocks
4 Study one of the coarse-grained clastic rock samples Indicate which one you chose
Describe and sketch this specimen showing the grains and the surrounding material
6-6
5 Use the chemical sedimentary rocks Because they form from a wide variety of processes some chemical sedimentary rocks are Inorganic or crystalline (appear homogeneous) while others consist of Organic material including plant material shells and shell fragments Separate the chemical sedimentary rocks that are crystalline from the ones that are organic and write the specimen number in the table below
Inorganic (or crystalline) Chemical
Sedimentary Rocks
Organic Chemical Sedimentary Rocks
Limestone is the most abundant chemical sedimentary rock It is made of the mineral calcite
Calcite reacts with hydrochloric acid (HCl) When a drop of dilute HCl is placed on calcite it fizzes vigorously This is a good test for limestone Limestone comes in many different varieties which form by numerous processes The calcite can precipitate directly from seawater form as dripstone in cave formations or be incorporated into shells by marine organisms After an organism dies its shell can become calcite sediment Calcite also sometimes precipitates in the spaces between clastic grains as cement to hold the rock together 6 Test all of the sedimentary rocks with HCl and briefly describe your results List the
samples that react to HCl and describe the nature of the fizzing (vigorous or minimal) SAFETY NOTE Although dilute HCl is not dangerous it can irritate skin and occasionally cause damage (small holes) to fabricclothes Be careful when using it Please rinse your table top off if any spilt on it
HCl tests on chemical rocks
HCl tests on clastic rocks
6-7
Part C ndash Classification of Sedimentary Rocks
(NOTE you do not have specimens of every rock included in the classification tables) Activity 1
1 Classification of sedimentary rocks starts with determining if the rock is clastic or chemical
2 Begin your identification by describing the texture (grain size and shape) and composition (color of sediments) of the rocks listed in Table 6
3 Identify the rocks in the study set using the classification charts (Table 2 and 3) and your description
4 Complete Table 4 with the correct rock names including terms that describe special features of note about a rock is appropriate
Clastic Sedimentary Rocks are made from deposits of broken andor weathered rock Clastic rocks are first classified by the size and shape of the particles and secondly by the composition of the particles within the rock
Table 2 Clastic Sedimentary Rock Classification
Particle Size Characteristics Rock Name
gt 2mm (bb size) Grains are angular Breccia (say brech-chia)
Grains are rounded Conglomerate
2 mm to nearly microscopic
Sand grains consisting of pure quartz Quartzose Sandstone
Sand grains consisting of dark fragments and quartz Lithic Sandstone
microscopic Typically layered and soft MudstoneShale
6-8
Chemical Sedimentary Rocks are derived from material that had been dissolved in water They are composed of crystals that precipitated from water by physical or organic processes They may have formed when water evaporated in shallow lakes leaving chemicals behind to form evaporite deposits They are also are formed by organisms extracting dissolved material to create their hard parts For this reason deposits of shell debris or plant material are considered chemical sedimentary rocks In some cases the shell material is easily observable but in other cases the shells cannot be seen without a microscope Note that fossil-rich is used as a descriptor for any rock containing visible fossils
Table 3 Chemical Sedimentary Rock Classification
Mineral Composition Characteristics Rock Name
calcite Fizzes in HCl massive is fine grained oolitic contains small concentric balls
Limestone (use descriptors like massive fossil-rich oolitic)
calcite Dull appearance soft fizzes in HCl Chalk (not included in lab set)
calcite Composed mostly of visible shell fragments has large pore spaces fizzes in HCl
Coquina
quartz group Dense porcelain like sometimes sharp edges hardness = 7 Chert
gypsum Soft hardness = 2 Rock Gypsum (not included in lab set)
halite Translucent cubic cleavage salty taste (do not taste lab samples) Rock Salt (not included in lab set)
opal Dull appearance soft does not fizz Diatomaceous Earth (not included in lab set)
carbonplant material Glassy black brittle low density Coal
6-9
Table 4 Sedimentary Rock Description Table
Rock
Clastic or Chemical
Composition (light or dark grains)
ldquoTexturerdquo Grain Size Grain Shape Grain Sorting Rock Name
1
2
3
4
5
6
7
8
9
10
11
6-10
Name____________________________________
Lab Day _____ Lab Time_____________________ POST LAB ASSESSMENT QUESTIONS
1 List three sedimentary rocks (from table 2 andor 3) that are the most likely to contain fossils Explain why this is so in terms of composition and environment of formation
2 What is a good test to determine if a sedimentary rock is limestone Does this test cause a
physical change or chemical reaction Explain how you can tell 3 Why is the study of sedimentary rocks important for understanding how and where fossil
fuels such as oil natural gas and coal (hydrocarbons) are likely to be found
71
ES 105 Laboratory 7 INTRODUCTION TO TOPOGRAPHIC MAPS
Introduction
Topographic maps contain a wealth of information which can be valuable to those who learn how to use them Topographic maps also called contour maps represent the three-dimensional the surface of Earth on a two-dimensional piece of paper Unlike other maps topographic maps show natural features with a fair degree of accuracy in terms of width length and thickness (height or depth) Geologists make use of topographic maps as a means of studying features in three dimensions By examining the features and symbols of a topographic map a geologist can become familiar with Earth features and draw conclusions about the geologic processes that led to their formation Goals and Objectives bull Become familiar the information available on topographic maps bull Learn to use map scales to find distances bull Visualize the shape of the Earths surface using contour lines and topographic profiles bull Depict the third dimension of Earthrsquos surface from the various elements of topographic maps Useful Websites bull httpwwwtopozonecom bull httptopomapsusgsgov bull httpergusgsgovisbpubsbookletssymbols
72
Name____________________________________ Lab Day _____ Lab Time_____________________
Pre-lab Activities Complete these before coming to lab Find the following unit equivalents
1 mile = ________________ feet 1 km = ________________ meters
1 foot = ________________ inches 1 meter = ________________ centimeters
1 mile = ________________ kilometers 1 km = ________________ miles
1 inch = _______________ centimeters 1 cm = ________________ inches
1 Convert 7920 feet to miles (Hint see following page is you donrsquot know how to do this) Show each step or combined steps needed to complete the conversion
2 If a map has a scale of 124000 how many miles does 75 inches on the map represent
Show your calculations with units
3 If a stream channel is 50 feet lower elevation at one location than at a point 25 miles upstream of that location what is the gradient of the stream between those two sites Show your calculations with units
4 Define the following terms with respect to stream systems
a Velocity
b Discharge
c Gradient
73
Activity 1 Compare this list of steps to convert 15 inches into feet to the table below
1 Write 15 inches as a fraction using a horizontal fraction bar (see 1 in table)
2 Put a multiplication sign after the fraction aligned with the fraction bar Write another fraction bar after the multiplication sign using a horizontal line (see 2 in table)
3 Choose the unit equivalent needed to convert from the information above (see 3)
4 Write the lsquoinchesrsquo part of the unit equivalent on the opposite side of the second fraction bar as lsquoinchesrsquo is in relation to the first fraction bar Write the lsquofeetrsquo part of the unit equivalent on the opposite side of the second fraction bar as its equivalent inches has been written (see 4 in table)
5 Put an equal sign after the expression multiply as indicated and cross out any things found both above and below the fraction bar as a matching pair (both units and factors) Be sure to put the units remaining (feet in this example) after the final product (see 5)
Table 1
1 2 3 4 5
1in 15
times
1in 15 1 foot = 12 inches
in12ft 1
1in 15times ft 251
in 12 ft 1
1in 15
=times
Problems
1 Now use this method to convert 7920 feet to miles You can show each step or combine steps to complete the conversion as show in number 5 of the above table
Use this method to do unit conversions throughout this lab Remember to include units
74
Part A mdash Scale A topographic map is a smaller representation of a larger area The map scale is the
relationship between distance on the map and the corresponding distance on the ground The two types of map scales that are useful to the geologist are ratio and bar scales The ratio scale written 112000 for example means that one inch on the map equals 12000 inches (1000 feet) on the ground A bar scale is a line with units of distance (feet miles kilometers) marked on it The bar scale allows easy conversion of map distances to true ground distance On a topographic map both the ratio scale and the bar scale are provided in the center of the bottom margin Show your calculations and include units with numbers for these questions
1 A ratio scale of 124000 means 1 inch on the map is equal to _____________ inches on the ground
2 Convert ratio scale of 124000 to a verbal scale with 1rdquo =( how many feet)
3 Complete the table below Show calculations with units on the right side of the table
Ratio Scale Verbal Scale Math work
124000 1inch = feet
A ratio scale of 162500 means 1 inch on the map is equal to inches on the ground Convert to 1 inch = how many feet Record below in and show calculations with units
162500 1 inch = feet
Convert a map scale of 1 inch = 1 mile to a ratio scale Record below and show calculations with units
1 1 inch = 1 mile
1 In the space below draw a six inch long line Use a ruler Make this line into a bar scale using
2 inches = 1 mile Subdivide the entire scale into quarter mile sections and label the origin the divisions of the first mile and the whole miles for the rest of the scale
2 On the bar scale above one quarter inch equals ________ miles Convert this to feet Record this in the table below Also determine what is the ratio scale for this bar scale (Hint convert to inches) Show your calculations with units
Verbal Scale Ratio Scale Math work
frac14 inch = 1
75
Part BmdashTopographic Maps Topographic maps use contour lines to depict three-dimensional features on a flat piece of
paper Contour lines connect points of equal elevation on the ground surface which means for example that every point on a 60 foot contour line is 60 feet above sea level Therefore a single contour line on the map shows how and imaginary horizontal plane would intersect the Earths surface are that particular elevation The contour interval is the difference in elevation between two contour lines The contour interval on a given map is constant for the entire map The contour interval chosen depends on roughness of the terrain or relief which is defined as the difference in elevation between the highest and the lowest points on a map
______________________________________________________________________
THE FOLLOWING ARE IMPORTANT RULES ABOUT CONTOUR LINES
1 Every point on a single contour line connects points on the map that are exactly the same
elevation on the ground 2 Contour lines separate areas of higher elevation from areas of lower elevation You can
determine direction of slope of a hill by checking the values of the adjacent contour lines 3 The contour interval (the elevation between two adjacent contour lines of different
elevation) is constant for the topographic map The contour interval is chosen by the map-maker based upon the relief of the map (the difference in elevation from the highest point to the lowest point on the map)
4 Contour lines must be counted consecutively (none can be skipped) Heavier contour lines speed up counting of contour lines usually every fifth contour line is drawn heavier
5 Contour lines never cross each other (except in the very rare case where the mapped area contains an overhanging cliff) Contour lines will merge into a single contour line where mapping a vertical cliff (also a rare occurrence)
6 The spacing of contour lines reflects the steepness of slopes Widely spaced contour lines represent a gentle slope closely spaced contour lines reflect a steeper slope Evenly spaced contour lines represent a uniform slope
7 Contour lines make a V pointing upstream where they cross a channel or valley 8 Depressions (lower elevation areas enclosed within higher elevation areas) are marked by
hachures on the inside of contour lines 9 Contour lines either enclose an area (as a hill top or a depression) or they end at the map
edge On a large enough map they would all make closed forms
Activity 1 Locate areas on the Monmouth quadrangle that shows what is described in Contour Rules (4 6 7 8 and 9) above Discuss locations with lab partners and if you are not able to locate an example of rule PLEASE CHECK WITH LAB INSTRUCTOR
76
Activity 2mdashConstruct a Topographic Map from surveyed data points On Figure 1 draw all the contour lines in pencil using a contour interval of 20 feet If you have a pen put it away and get a pencil (Only one who is perfect in every way contours with a pen) Study the map and locate the higher and lower areas Refer to the rules on the previous page to assist you If you are having trouble see the sample exercises for the last website listed in the introduction to Lab 4 Lightly draw in contour lines starting either at the high elevations or the low elevations Make changes where you realize you missed a feature Use an eraser When you are finished (and satisfied) darken and label the contour values neatly
Figure 1 Topographic map construction
77
Activity 3mdashConstruct a Profile from a Topographic Map Profiles are made to illustrate the shape of the surface of the earth between two designated points These two points are at the ends of the line of profile which is drawn and labeled on the map The line is used in the construction of the profile To construct the profile use each intersection of a contour and the line of profile on the map Project a perpendicular line from this intersection to the horizontal line having the same elevation as that contour line Make a dot on the profile for each intersection of a contour line and the line of the profile as drawn on the contour map Remember to include information implied by the map NOTE where the profile crosses a stream channel the elevation is between two contour lines (The stream channels are shown by dot-dash lines) Hilltops and the ends of the profile also have implied information After all the dots are made on the profile connect the dots by a smooth line which represents the profile of Earths surface On Figure 3 draw a profile for the dashed line A to A in Figure 2 Be sure to label both ends of the profile and the elevations at the side of the profile
Figure 2 Topographic map with profile line drawn and labeled
100
90
80
70
60
50
40
30
20
10
Figure 3 Topographic profile AmdashArsquo from Figure 2
78
Part C mdash Additional Information on Topographic Maps Topographic maps are produced at various scales (124000 163360 etc) that represent different areas of coverage Common sizes are 75 minute and 15 minute (Discontinued) describing latitude and longitude dimensions and are given locality names (such as ldquoMonmouthrdquo) usually for some prominent town or geographic feature in the mapped area In this part of the lab you will study a US Geological Survey quadrangle that illustrates the kind of information available on these maps
Map study and use requires an understanding of latitude and longitude Lines of latitude and longitude form an imaginary grid system with lines that are measured in degrees of arc from a reference Any point on Earth may be pinpointed to its exact location by its latitude and longitude Latitude lines are oriented in an east-west direction They are parallel to one another with the equator designated 0 degrees and increasing in degree measurement to the poles at 90 degrees Those in the northern hemisphere are north latitude and those in the southern hemisphere are south latitude Longitude lines are oriented in a north-south direction and start from 0 degrees at Greenwich England and increase in measurement both east and west up to 180 degrees on the other side of the Earth near the International Date Line Those to the east are called east longitude and those to the west are called west longitude For more exact locations degrees (o) are further broken down into minutes (lsquo) and seconds (ldquo) one degree has 60 minutes (1o=60rsquo) and one minute has 60 seconds (1rsquo=60rdquo)
If you plan to use a compass with a map for navigation is necessary to understand the concept of magnetic declination The compass needle when pointing north actually points to magnetic north the magnetic pole of Earth not to true north or geographic north which is Earths axis of rotation These two norths are not located at the same place and magnetic north moves over time The declination is the angle of correction needed because topographic maps are drawn aligned to geographic north which is toward the top and parallel to the left and right margins of the map Because magnetic north moves knowing the date the declination is accurate is important also Study the Monmouth Oregon Quadrangle and answer the following questions
1 __________________
2 __________________
3__________________
4 __________________
5 __________________
1 Who published this map
2 What year was it published
3 What is the latitude of the northern boundary of this map
4 What is the latitude of the southern boundary of this map
5 How many degrees of latitude are along the eastern edge (HINT subtract southern edge latitude from northern edge latitude)
6 __________________
7 __________________
8__________________
9 __________________
6 What is the longitude of the west side of this map
7 What is the longitude of the east side of this map
8 How many degrees of longitude are along the southern edge
9 What is the contour interval
79
10 _________________
11 _________________
12 _________________
13 _________________
14 _________________
10 How much vertical distance separates the lighter contour lines
11 How much vertical distance separates heavier contour lines
12 What is the highest elevation shown on the map (Look in NE)
13 What is the lowest elevation (Follow river downstream)
14 What is the relief of this map (subtract lowest elevation from the highest elevation)
15 _________________
16a _________________
16b _________________
16c _________________
16d _________________
17a _________________
17b _________________
17c _________________
17d _________________
18 _________________
19 _________________
20 _________________
21a _________________
21b _________________
22 _________________
23 _________________
15 What is the value of the declination (in degrees) shown
In the area to the left sketch how declination is indicated on the map
16 What is the map scale in (Show math work with units here)
a inches to inches
b feet to feet
c inches to feet
d inches to miles
17 What is the name of the quadrangle to the a south
b east
c northwest
d west
18 What is the approximate elevation of the town of Monmouth
19 What is the elevation of the benchmark located at the intersection of
Main St and Monmouth St in Independence
20 How many miles is it along Hwy 99W from Main St in Monmouth
to where 99W crosses the Luckiamute River
21 What is the distance (21a in miles) and (21b in Kilometers)
between the top of Cupids Knoll and Fircrest Cemetery
22 What is the elevation of Cupids Knoll
23 Which side would be easiest to climb Explain why
710
Part D mdash Learning about rivers from topographic maps Note Chucksney Mountain Salem and Sauvie Island Quadrangles are 124000 scale maps
1 On the Chucksney Mountain Quadrangle look at the tributaries that drain into the North Fork of the Middle Fork of the Willamette River (in the Southwest corner of the map) Then look at the width of the Willamette River channel in the Salem and Sauvie Island Quadrangles Does the width of the river channel increase or decrease when going downstream towards the mouth of the Willamette
2 Use the contour lines on the Chucksney Mountain Quadrangle to determine the elevation change from the top to the bottom of one of the tributaries that you observed in the previous question and record the elevation change below (Be sure to look up the contour interval on the map)
3 On the Salem Quadrangle locate Beardsley Bar and Doves Bar along the Willamette River What is the difference in elevation between these two points along the river In what direction is the river flowing
4 Does the gradient of the Willamette River increase or decrease as you go from its upper tributaries downstream towards its mouth
5 What type of stream channel do the tributaries in the Chucksney Mountain Quadrangle have Circle the correct choice below
a Braided stream channel
b Steep gradient bedrock channel
c Low gradient meandering stream channel
6 What type of channel does the Willamette River have in the Monmouth and Salem Quadrangles Circle the correct choice below
a Braided stream channel
b Steep gradient bedrock channel
c Low gradient meandering stream channel
711
Name____________________________________
Lab Day _____ Lab Time_____________________ 7a Post-Lab Assessment
1 Imagine you were hiking with friends and became separated from your hiking companions If you had a topographic map of the area what clues on the topographic map would you use to arrive somewhere where you could be found
2 Would a GPS receiver be able to assist you in finding your location on the map What
information would be helpful 3 What large city is located near 40oN 116oE (Use globe atlas world map GoogleEarth) 4 In what area is 40oN 116oW 5 What coast are you near at 34oN 119oW (Name continent side of it and ocean) 6 What coast are you near at 34oS 119oE (Name continent side of it and ocean)
7 Is it important to include N or S and E or W with latitude and longitude information Why
81
ES 105 Laboratory Additional Activities APPENDIX ndash Additional Laboratory Activities Lab 1 Energy and Energy Transformations
bull No Additional Activities Lab 2 Work Motion Gravity
bull Falling Objects Spark Tape Experiment p 82 - 84 Lab 3 Objects in Motion Landslides
bull Rotational Kinetic EnergyTrack Experiment p 85 - 86 bull Landslide Prediction p 87 bull AccelerationCart Experiment p 88 - 89
Lab 4 Geologic Time
bull Relative Age Dating Exercises p 810 - 814 Lab 5 Chemical Reactions
bull Chemical and Physical Changes p 815 - 816 bull Balancing Chemical Equations p 817 - 819
Lab 6 Sediments and Sedimentary Rocks
bull Overview of Sedimentary Minerals p 820 - 821 bull Depositional Environments p 822 - 823
Lab 7 Topographic Maps
bull Rivers and Topographic Maps p 824 - 825 bull Stream Table Experiments p 826
82
Lab 2 Calculation of Acceleration due to Earthrsquos Gravity
In this activity you will study the motion of a free-falling body Using a special timer the position of the object will be recorded at even intervals of time Letrsquos call the time interval Δt (read as ldquodelta trdquo or ldquochange in timerdquo) We will use the letter y to indicate the position of the object The position at a chosen time will be called y0 After one time interval passes we refer to the objectrsquos position as y1 after two intervals y2 and so forth From the changes in positions we can compute the velocity The average velocity is determined by the change in position per change in time Δt For instance the (average) velocity after four intervals of time have passed v4 is
This equation could be read as lsquothe velocity (after fourth time interval) is the change in position (between the third and fourth time interval) over the change in timersquo Once the average velocities have been calculated these values can be used to determine the average acceleration The slope of the graph of average speed versus time gives the acceleration of the falling object Mathematically the average acceleration after the fourth time interval a4 is described by the following equation
In this part of the lab you will measure the acceleration of a free-falling body using two different methods and devices ndash a spark-tape apparatus and a picket-fencephotogate system Activity 1 Using the spark-tape apparatus to Measure Gravitational Acceleration Procedure We will drop our object a carbon-coated tape approximately 2 meters As the tape falls a spark generator produces sparks at even time intervals These produce marks on the tape representing equal times between each spark The result is pictured below Figure 1 The distance between two successive marks indicates the distance fallen in a particular time interval The time interval Δt is given on the knob on the spark timer It is a fixed time interval (typically Δt = 130 sec = 0033 seconds) Ask your instructor to verify the value for Δt Your instructor will help you drop the tape and produce the marks You should have at least 9 marks on your tape
v y yt4
4 3=minusΔ
a v vt4
4 3=minusΔ
83
y1
y2
y3
y4
y5
y6
y7
Tapersquos initial position(big burned spot)
1st clearly identifiable (position y0)mark after initial position mark
Last spark on tape
Figure 1 Schematic representation of spark tape resulting from free-fall apparatus Note The first mark (the prominent burned one) gives the tapersquos initial position However the weight
was released at a random time Furthermore the second mark may be covered up by the first mark
(What you think is the 2nd mark may actually be the 3rd mark) Hence you canrsquot rely on total elapsed
time or the position of the next mark after the first mark However you can rely the on time intervals t
and distances between successive marks
Analysis Lay the tape flat on the table You may wish to secure it with masking tape Locate the initial mark Now find the next clearly identifiable mark -- probably the 2nd or 3rd mark after the first (prominent) mark This will be position yomdashlabel it accordingly Place a meter stick along the tape in preparation to measure the y-distances (as shown above) from yo to other mark locations See the diagram above Complete Table 1 for at least seven data points (Hopefully you will have more data points than seven) Measure the distances very carefully enter them into your table Be sure to record all your distances in meters NOTICEΔt is always the same value (probably 00333 sec -- but check with your instructor) NOTICE that all the distances in column 2mdashthe lsquoy (meters)rsquo columnmdashmust be in meters Fill out the rest of the table Δt is the same number of seconds for every point
84
Table 1 Δt
(sec) y
(meters) Δy v=ΔyΔt (meterssec)
Δv a=ΔvΔt (meterssec2)
301
y0 = 0 No Data No Data No Data No Data
301
y1 = 01 yy minus = 1v = No Data No Data
301
y2 = 12 yy minus = 2v = 12 vv minus =
301
y3 = 23 yy minus = 3v 23 vv minus =
301
y4 = 34 yy minus = v4= 34 vv minus =
301
y5 = 45 yy minus = v5= 45 vv minus =
301
y6 = 56 yy minus = v6= 56 vv minus =
301
y7 = 67 yy minus = v7= 67 vv minus =
301
y8 = 78 yy minus = v8= 78 vv minus =
301
y9 = 89 yy minus = v9= 89 vv minus =
301
y10 = 910 yy minus = v10= 910 vv minus =
Note about calculations 301
divide is the same as x 30
Compute an average of the accelerations in your table Letrsquos call this number the acceleration due to gravity The acceleration due to gravity is _______________________ in units of ________________ There You did it You measured the acceleration due to gravity
85
Lab 3 Rotational Kinetic Energy Determination
1 Surprise The potential and kinetic energy are not equal because we havenrsquot accounted for the energy lsquolostrsquo during motion of the ball Letrsquos calculate the rotational kinetic energy of the system by using the formula below Show your calculations be sure to include units
2R mv
51 E = ER = _______________ in units of __________________
Now add all of the kinetic energy (EK + ER) ___________________ in units of ____________ 2 How does the sum of kinetic energy (EK + ER) compare to the initial potential energy Is the
total energy conserved What other energy factor(s) havenrsquot we accounted for yet (HINT why does the ball slow down as it is rolling)
3 What would be the potential energy in the system if the ball were positioned at a height of 01
meters Show your calculations be sure to include units (Your answer should be in Joules) Predicting the Final Velocity of the Ball Because the total energy is conserved you know that at the beginning the total energy is only gravitational potential energy At the end of the experiment the ball has no altitude (h = 0 above the horizontal table) so all the energy is in the form of kinetic energy Since the total energy at the beginning must be equal to the total energy at the end we can say
Potential energy (EP) at beginning = Kinetic energy at end (both rolling + translation)
Or mgh = 22KR mv
51mv
21 EE =+=+ This simplifies to mgh = 2mv
107
Solving the above for the final velocity of the ball along the horizontal ramp we find
v gh=107
86
Questions
4 Using the equation v gh=107
calculate the ideal velocity on the horizontal track when the
ball is released on the ramp at h = 003 meters What are the units of the velocity 5 In reality will the velocity be higher or lower than the ideal calculation above Why 6 How did your average velocity (from table 1 pg6) compare with the ideal velocity (as
calculated in question 10 above) Comment on why it is the same or different (HINT there is more than one reason the velocity is not ideal)
7 Without calculating PREDICT what happens to the final velocity if we double the initial
height (h = 006 m) Will the final velocity increase or decrease About how much double one-half or some other value compared to when it is released from h = 003 meters
8 Support your above answer by employing the equation v gh=107
for h = 006 m
That is calculate the final velocity of the ball when it is released from 6 centimeters Be sure show your calculations and report your answer with the appropriate units
87
Lab 3 Energy of Motion and Landslides
PART C mdash Landslide Prediction Examine the cross-sectional sketch below Label in Figure 4 with numbers the positions where you might expect to find the following mass wasting processes
(1) rock fall (ie free-falling rock material) (2) soil creep (slowly moving sediment under the influence of gravity) (3) catastrophic landsliding and (4) zone of little to no chance of mass wasting processes
Figure 4 Landslide prediction diagram Questions 1 What are the chances of your property experiencing a landslide if you live in the Coast
Range of Oregon (for example somewhere between Dallas and Lincoln City) List the critical factors that apply (or donrsquot apply as the case may be) to why you think these are your chances
2 What are the chances of your property experiencing a landslide if you live in the middle of
the Willamette Valley (for example in Salem or Albany) List the critical factors that apply (or donrsquot apply as the case may be) to why you think these are your chances
88
Acceleration of a Cart If a cart moves on a plane that is inclined at an angle θ the component of force acting on the cart in a direction that is parallel to the surface of the plane is the shear force The acceleration of the cart should be given by
a = g sin θ Procedures 1 Before recording any data make sure the Motion Sensor can ldquoseerdquo the cart as it moves 2 Measure the angle the track makes with the table top Record in Table 4 below 3 Place the cart on the low end of the track and have one person start recording Have the
other group member give the cart a gentle push up the inclined plane track so the cart will move toward the Motion Sensor Keep recording as the cart moves away from the sensor
4 Stop recording when the cart returns to the bottom of the track 5 If the plot of data is not smooth check with your instructor to realign the Motion Sensor The
repeat the above procedure until the plot is smooth for the run up and then down the track 6 Erase your practice runs by clicking on the EXPERIMENT menu and selecting DELETE ALL
DATA RUNS Do NOT use the FILE menu and delete the activity 7 You are now ready to collect data Place the cart at the low end of the track Start
recording data Give the cart a gentle push toward the Motion Sensor Continue collecting data until the cart has returned to the bottom of the track This is lsquoRun 1rsquo
8 Set the track to a steeper angle and measure the angle Repeat data recording (Run 2) 9 Open the GRAPH from the left hand menu Select Data Run 1 Choose the plot of velocity
vs time Use the cursor to select the region of the plot that shows the cartrsquos motion after the push and before it stopped at the bottom of the track Determine the slope of the best fit line This slope is the acceleration of the cart (Note Units are ms2)
10 Repeat for Data Run 2 Record all data in Table 1 and answer the questions on the following page
89
Table 1 Acceleration of cart on Inclined plane
Run 1 Run 2
Angle of track (θ)
Experimental Acceleration (slope of velocity time)
Theoretical Acceleration (calculate from a = g sin θ)
Questions 1 What happens to the velocity of the cart as it moves up the inclined plane 2 What happens to the velocity of the cart as it moves down the inclined plane 3 What happens to the acceleration of the cart as it moves up the inclined plane 4 What happens to the acceleration of the cart as it moves down the inclined plane 5 How did the acceleration change when the track became steeper 6 Calculate the theoretical value for the acceleration of the cart based on the trackrsquos angle and
record it in Table 1 7 What is the percent difference between the acceleration determined in the activity and the
theoretical value for acceleration ⎟⎠⎞
⎜⎝⎛ =times differencepercent 100
ltheoreticaalexperiment-ltheoretica
(Show calculations here) 8 What is a possible explanation for the difference in these two values
810
Lab 4 Relative Age Dating Pre-lab Questions for Determining Relative Ages of Geologic Events Define the following terms prior to arriving at your lab section
Stratigraphic correlation
Principle of original horizontality
Principle of stratigraphic superposition
Principle of lateral continuity
Unconformity
Law of cross-cutting relationships
811
Determining Relative Ages of Geologic Events Another technique to determine the relative ages of geological events is the Principle of
Cross-Cutting relationships which states that any geological feature which cuts another geological feature must be younger than the cross-cut feature Stated in simple terms a loaf of bread must be older than the bread slices which transect the loaf
Activity Study the sketch on the following page LIST the sequence of geological events oldest at the bottom and youngest at the top on the table below and cite reasons for this order of events Close ups of significant relationships are shown on the following page (84)
Event Older than Because Younger
than Because
812
HINTS
bull ldquoIrdquo contains inclusions of ldquoJrdquo and ldquoKrdquo bull ldquoIrdquo changes from conglomerate at the bottom to sandstone at the top bull ldquoIrdquo does not include pieces of H
Rock Types Igneous ndash Intrusive Metamorphic
Gneiss Sedimentary
Cong ndash Conglomerate SS ndash Sandstone Sit S ndash Siltstone Sh ndash Shale Ls ndash Limestone
There are details of this cross section on the following page Working on the geologic history of smaller portions first can help you unravel the geologic history of a complicated section like the one above
ldquoBakedrdquo zone of contact metamorphism
813
Angular Unconformity Fault
Intrusions Refolded area
814
Questions Quantify some basic observations on geologic time in the spaces provided (Use dates shown in the ldquoGeologic Time Scalerdquo) Show all of your math work
___________ Based on the data given how old is the Earth (ie what is the total known
time encompassed by geologic history) Answer in billions of years ___________ What is the total duration of the Precambrian Eons (in millions of years) ___________ What is the total duration of the Paleozoic Era (in millions of years) ___________ What is the total duration of the Mesozoic Era (in millions of years) ___________ What is the total duration of the Cenozoic Era (in millions of years) ___________ What percentage of total Earth history is comprised by the Precambrian
Eons ___________ What total percentage of Earth history is marked by the presence of life in
the fossil record Show all of your math work ___________ What total percentage of Earth history is marked by the absence of life in
the fossil record Show all of your math work ___________ Homo habilis is considered by many anthropologists to be the first true
human and lived ~ 2 million years ago What total percentage of Earth history is marked by the presence of human-like species in the fossil record Show all of your math work
___________ What total percentage of Earth history is marked by the presence of
ldquomodern manrdquo Show all of your math work write the answer in scientific notation
___________ Assuming that you live to the ripe old age of 82 what total percentage of
Earth history will be marked by your presence on this planet Show all of your math work write the answer in scientific notation
815
Lab 5 Chemical and Physical Changes Exploring the Differences between Chemical and Physical Changes In this part of the lab you will work through a sequence of experiments make observations and determine whether a chemical or physical change has occurred As you progress through this portion of the lab complete Table 1 Observations on the following page Procedure 1 Take a test tube labeled iron filings and a test tube labeled sulfur from your kit These have
already been pre-weighed for you with 35 grams of the iron filings and 20 grams of sulfur Mix the two completely by grinding them together with a mortar and pestle
2 Divide the mixtures into two piles (ie aliquots) and place each on wax paper 3 Observe one of the aliquots under a magnifying glass and record your observations in table 1 4 Test the same aliquot for magnetism by passing a magnet under the paper (Please do not
remove the magnet from the Ziploc bag) Does the material appear to be magnetic Record your observations in Table 1
5 Now pour each aliquot into a test tube one aliquot into a small Pyrex test tube from your kit
the other aliquot into the soft glass test tube from your kit that is labeled ldquobreakablerdquo (Set this one aside for a few minutes)
6 Add a small amount of water to the first test tube (Pyrex tube not breakable one) cover the
end of the tube with your thumb and shake vigorously Record your observations in Table 1 7 Clean out the mortar bowl and put some cold tap water into the bowl Take the mortar bowl
with water your breakable test tube containing the dry ironsulfur mixture and a test tube clamp to one of the hoods Be sure to wear goggles
8 This step is performed under the hood Gently heat your mixture using the hottest part of
the flame (the inner blue tip) Heat your mixture until the mixture itself (not just the glass of the test tube) is producing a bright orange-red glow throughout the mixture Be patient it may take 5 or more minutes for the mixture to reach this stage Confirm with your instructor when it has reached this stage (to be sure the reaction has proceeded) Immerse the hot end of the tube into the bowl of water before it has a chance to cool This will break the end of the tube and there will be a small but exciting steam explosion
9 Carefully throw the broken glass of the test tube (but not the new compound you just created)
into one of the white glass disposal bins in the lab Using the cooled material that was in the test tube repeat the tests you performed on the original iron and sulfur mixture (examining with a magnifying lens checking the magnetic properties and mixing with distilled water in a large clean test tube) Record your observations in Table 1
816
Clean all the permanent glassware and return all the materials to your kit in a neat and tidy manner Leave the laboratory counter neat and in a condition that you could walk in and begin work immediately if you were in the next lab section Thank you Table 1 Observations of ironsulfur mixture
Material Viewed with magnifying glass
Tested with magnet Properties in water
Before Heating
After Heating
Questions 1 At what point did a chemical change occur How could you tell 2 Based on what you have observed in this laboratory exercise write a conclusion to the
experiment that summarizes how a chemical change differs from a physical change
817
Lab 5 Balancing Chemical Equations Balanced chemical equations are used to describe chemical reactions This equation tells
what substances are involved as reactants and what substances are formed as products In addition the relative proportions of molecules of each of the substances are specified The coefficients in the balanced equation give the mole ratios(comparing the number of molecules) of the various substances From these mole ratios the quantities of reactants required to produce a certain quantity of product can be determined as well as how much product can be expected when given quantities of reactants are utilized
1 Balance the chemical equations listed below by placing the correct coefficient in the space
provided in front of each substance ____ Mg + ____ O2 ____ MgO magnesium oxygen magnesium oxide ____ KIO3 ____ KIO2 + ____ O2 potassium iodate potassium iodide oxygen ____ AgNO3 + ____ Cu ____ CuNO3 + ____ Ag silver nitrate copper copper nitrate silver ___ AgNO3 + ___ NaCl ___ AgCl + ___ NaNO3 silver nitrate sodium chloride silver chloride sodium nitrate
818
Part A ndash Cooking with Chemistry Although you probably have never thought about it you carry out chemical reactions frequently in your kitchenmdashotherwise called cooking In many chemical reactions one reactant is present in a quantity that will limit the amount of products that can be formed This reactant is called the limiting reactant The concept of a limiting reactant will be explored by preparing a confection called SrsquoMORES which is a well-known camperrsquos delight Srsquomores (Sm) are a concoction of graham crackers (Gc) marshmallows (M) and chocolate pieces (Cp) The recipe can be written in the form of a chemical equation
2 Gc + 1 M + 3 Cp 1 Gc2MCp3 Where the reactants (ingredients) are Gc = graham cracker
M = marshmallow Cp = chocolate piece
And the product is Gc2MCp3 = a srsquomore If you were camping you would make a srsquomore by toasting a marshmallow on a stick over the campfire and then putting it between two graham cracker halves with three chocolate pieces When the graham cracker pieces are pressed together the hot marshmallow melts the chocolate and a gooey treat results (You will not be allowed to eat any of your srsquomores due to OSHA regulations and standard laboratory safety procedures) This part of the lab explores the results of adding proportions which differ from those specified by the balanced equation for a chemical reaction From different combinations of reactants you will predict the maximum numbers of srsquomores which can be prepared and test your prediction Procedure There are six different srsquomore stations labeled ldquoArdquo through ldquoFrdquo Be sure that all the reactants for each bag at each station are put back into the bag before proceeding to the next station Recall the proportions of reactants which follow the balanced equation above Record your results in Table 1 on pg 55
1 First use to srsquomore station A From the above proportions determine how many srsquomores
you can make from the reactants provided Write a balanced equation for the reactants in this bag including leftovers Test your prediction by assembling the reactants into srsquomores
2 Using the reactants in station B predict the maximum number of srsquomores which you will be able to prepare Again write the equation and test
3 Repeat Step 2 using the reactants in the stations C D and E
819
Table 1 Srsquomores reactions
Reactants present predicted yield actual yield
A
B
C
D
E
F
4 Write a unit conversion Reactant
moresS for each reactant
5 Predict the maximum number of srsquomores which can be prepared using the reactants in
station F Unit conversion calculations for Station F
Identify the limiting reactant in station F
820
Lab 6 Sedimentary Rock Identification
Part A ndash Overview of Minerals in Sedimentary Rocks As noted in the introduction a small number of minerals are commonly associated with sedimentary rocks including quartz (SiO2) potassium feldspar (KAlSi3O8) plagioclase feldspar (Na AlSi3O8 CaAl2Si2O8) mica (muscovite and biotite) calcite (CaCO3) halite (NaCl) and gypsum (CaSO4H2O) Table 2 is a summary of the diagnostic (ie distinguishing) physical properties that are used to identify these minerals Use the set of mineral identification tools (Table 2 nails pennies dilute HCl your eyes and intellect) and identify the names of the set of unknown mineral samples provided List your results in Table 1 (NOTE There is one example of each mineral so use the process of elimination to your advantage) Table 1 Identification of minerals commonly associated with sedimentary rocks
Sample Number
List of Diagnostic Properties(Used to Identify Each Mineral) Mineral Name
3
5
6
8
10
13
14
15
821
Table 2 Common sedimentary minerals and their diagnostic physical properties ____________________________________________________________________________ Mineral Name Diagnostic Physical Properties Quartz Harder than glass (specimen will scratch glass) SiO2 Glassy to waxy surface appearance (luster) Various colors of milky white clear smoky gray rose Potassium Feldspar Harder than glass (specimen will scratch glass) KAlSi3O8 Breaks into blocky angular pieces
(two directions of cleavage at 90o) Common varieties are salmon pink or white in color Plagioclase Feldspar Harder than glass (specimen will scratch glass) NaAlSi3O8CaAl2Si2O8 Breaks into blocky angular pieces (two directions of cleavage at 90o) Whitish to medium gray in color Parallel striations (lines) commonly visible Mica Softer than fingernail (fingernail will scratch specimen) K[Al2(Mg3 Fe3)](AlSi3O10)(OH)2 Breaks into thin sheetsflakes book-like occurrence Muscovite Mica Clear to silvery in color Breaks into thin silvery flakes
Biotite Mica Brown to black in color Breaks into thin dark flakes Calcite Softer than a penny harder than fingernail CaCO3 Breaks into rhombohedra (three directions of cleavage) Whitish in color Fizzes in dilute hydrochloricacid
(the ldquofizzingrdquo is the result of CO2 release) Halite Softer than a penny harder than fingernail NaCl Breaks into cubes (three directions of cleavage) Clear in color tastes salty (Donrsquot lick lab samples) Gypsum Very soft scratches easily with fingernail CaSO4H2O Clear to white to pink in color
May show three directions of cleavage
822
Figure 1 Environments in which sediments are deposited The diagram is not to scale
1 Abyssal Fan 9 River Channel 2 Deep Sea Floor 10 Delta 3 Reef 11 Lagoon 4 Beach 12 Barrier Island 5 Sand Dunes 13 Continental Shelf 6 Glaciers 14 Submarine Canyon 7 Alluvial Fans 15 Continental Slope 8 Flood Plain 16 Lake
You will refer to this diagram in the post-lab exercise Concentrate on the energy of the environment and the characteristics of the rocks that would form there Think about the way the environment would transport sediment grains the size sorting and shape of the grains the surface features that may be preserved etc You may want to look up some of the terms listed in the diagram in your textbook or from other sources
823
1 Study Figure 1 (previous page) and list at least two environments where the following sedimentary rocks would be deposited Think about the energy necessary to transport the grains Describe the overall characteristic of the depositional environment for each rock type
a SANDSTONE b SHALE
c LIMESTONE
824
d Lab 7Rivers and Topographic Maps Acitivity 1 The Willamette River 1 Describe stream gradient in your own words 2 How can you determine the stream gradient from a topographic map What information do
you need to know Express stream gradient mathematically 3 On the Chucksney Mountain OR Quadrangle determine the gradient of a tributary of the
North Fork of the Middle Fork of the Willamette River Look in the southwest corner of the map and find a stream that drains into the fork of the Willamette Show your calculations Also state the type of channel (see previous page for channel descriptions)
4 Determine the gradient of the Willamette River on the Salem OR Quadrangle between
Beardsley Bar and Doves Bar Show your calculations and describe the channel type 5 Use information on the Sauvie Island OR Quadrangle to determine the gradient of the
Columbia River between the mouth of the Willamette River and the point where it enters the Pacific Ocean Assume the distance between these locations is 100 hundred miles (Hint what is the elevation of the mouth of the Columbia River) Show your calculations
6 Study the gradient channel type and channel size of the three segments of the
WillametteColumbia River system Write a brief paragraph summarizing how these variables change as you move downstream in a river system
825
Activity 2 River Features Examine the Monmouth Oregon Quadrangle which shows many features associated with a moderately large river and answer the following questions
1 Locate the area along the Willamette River east of Independence What is name given to this river-formed feature (HINT Refer to the discussion of channel features earlier in lab)
2 Is this feature likely to change its shapeposition in the future In which direction will it
migrate and how can you tell Should folks in Independence be worried 3 Where would you expect an oxbow lake to form on the Luckiamute River in the near future
Describe location with direction and distance from landmarks Why did you pick this location
4 Several stream terraces are located along the course of the Willamette River associated
with periods of deposition and incision of the valley floor during the Quaternary Using the Monmouth quadrangle try to locate at least two (there are more) of these terraces by stating their general location and an approximate elevation
5 Sketch a topographic profile (cross section) from the top of Davidson Hill southwest across
the valley of the Luckiamute River (south central portion of map) Indicate the type of materials (solid bedrock and alluvial sediment) you would expect to find underlying various portions of your cross section based on their relative elevation slope and position with respect to the Luckiamute River
826
Lab 8 Stream Table Experiment on Sediment Transport Determine Effect of Flow Velocity on Mode of Sediment Transport and Stream Competence Visible sediment grains move through a channel as either bed load (rolling sliding or saltation (ie bouncing like a jumping bean)) or suspended load Reduce the discharge to a minimum by pinching the tube so the current is moving only a few grains
In the table below record how the sand-sized sediment is being transported under Low flow conditions Use some chalk dust to observe suspended load transport under Low flow conditions Increase the discharge to a Medium flow by squeezing the tube about half way Again record your observations for how the sand-sized sediment moving Increase the discharge to High flow by releasing the tube completely Once again record on the table how the sand-sized grains are moving
Table 1 Sediment Transport Record how the sand-sized sediment is being transport for each condition
Discharge Condition
Sand-Sized Bed Load
Sliding Rolling Saltation
LOW
MEDIUM
HIGH
Question 1 Describe how the transport mode and behavior of sand changed under each new flow
condition Consider the amount of grains moving and how the transport mode changed with increasing discharge

15
Activity 2 Moving hands (Mechanical energy transformed into heat energy) Instructions Press your hands together and rub them back and forth twenty times As you do this press as hard as you can but still allow them to rub together Try to apply the same force throughout this activity As soon as you stop rubbing feel the temperature of your hands
1 What did you observe Explain in terms of energy conservation and conversion
2 Change the amount of frictional force between your two hands by pressing your hands together very lightly (reducing friction) Rub them back and forth twenty times As before feel the temperature of your hands where they touched Were they warmer or cooler than before
3 Compare this observation to the one above Explain in terms of energy conservation and conversion
4 Does reducing the frictional force affect how much mechanical energy is transformed
into heat energy
5 Explain why you put grease (a lubricant) on parts of your bicycle that rub together (eg
wheel bearings) Explain your answer to this question in terms of energy conservation and lost energy
6 Make a short list of things (five things) you encounter every day that convert mechanical
energy (of moving objects) into heat
16
Part B - Conversion of Mechanical and Chemical Energy into Electrical Energy
A generator converts mechanical energy into electrical energy Electrical energy can flow through a wire in the form of an electrical voltage and commonly is used to light a bulb to produce light The light bulb converts the electrical energy into light energy that our eyes can easily detect
Activity 1 Hand crank generator to electric light (Mechanical to Electrical)
This consists of a hand-crank generator to convert mechanical energy to electrical energy and wires to carry the electrical energy (voltage) to a light bulb Instructions
1 Connect one wire-lead from hand generator to light bulb leaving the other wire-lead unconnected (open circuit) Gentle turn the generator and ldquofeelrdquo (gauge) the degree of difficulty Was it (easy moderate or difficult) to turn the crank
2 While turning the crank at the same speed as above connect the other wire-lead to the light (closed circuit) and ldquofeelrdquo (gauge) the degree of difficulty to turn the crank Was it (easy moderate or difficult) to turn the crank
Questions
1 What do you notice about how hard the hand crank turns with respect to a closed circuit (light bulb on) verses an open circuit (light bulb off) Explain why there is a difference
Activity 2 Measuring actual voltage in a closed circuit
Instructions bull For Multimeter black wire-lead connects to COM terminal and red wire-lead connects to
theVmA terminal (check with instructor) bull Connect hand generator wires to each wire of the Multimeter (at direct voltage (DCV) setting of
20) and slowly turn the handle and record the voltage in the table below Repeat for a faster turn Slow Turn Voltage (volts) = Fast Turn Voltage (volts) = Thought Question
1 (Think about and Discuss) How hard (fast) and how long you would need to turn the hand generator to produce enough energy to light a 60 watt light bulb for an hour Or brew a cup of coffee in the morning
17
Activity 3 Comparing chemical (battery) energy to mechanical energy Instructions bull Connect the battery pack to the Multimeter and record the voltage (in table below) using same
settings (Multimeter at direct voltage (DCV) setting of 20) as activity 2 above bull Disconnect the battery pack and connect the hand generator to the Multimeter and try to maintain
a constant turn that replicates the same voltage as the battery pack Now you can FEEL the energy associated with 3-volts
Voltage (volts) with 3-volt (2-battery) pack =
Speed of hand generator (slow medium or fast) associated with 3-volts (2-batteries) =
Questions
1 (Think about and Discuss) How hard (fast) and how long you would need to turn the hand generator to produce enough energy to recharge your cell phone (Typical cell phone batteries are 37 volt and 800 mAhour)
Part C - Conversion of Heat into Mechanical Energy
Figure 1 Apparatus to investigate conversion of heat energy to mechanical energy
Rubber hose
(Test tube)
18
At this station you will convert heat energy into mechanical potential energy To understand how the potential energy is observed consider the U shaped tube in Figure 1 One side of the U-shaped tube is connected to a small reservoir (a test tube) the other end of the U-shaped tube is open to the atmosphere If the pressure in the reservoir is the same as the atmosphere the water level in both sides of the tube will be the same However if the pressure inside the reservoir is larger than the atmospheric pressure the water levels will be different the pressure inside the reservoir tends to push the water out of the tube In lifting the water in the tube the gas in the reservoir does work holding the water up (that is holding it in a non-equilibrium position) requires energy -- mechanical potential energy To make the gas expand (and increase the pressure in the reservoir) we rely on the ideal gas law The Ideal Gas Law states that if you increase the temperature of a gas the pressure will increase To increase the temperature you must transfer heat (energy) into the system
Activity 1 Hot and Cold (thermal energy) converted into Mechanical Energy
Instruction
bull Record the location of the water level on the scale (Measure the level of water on the open end of the glass U tube)
bull Place the air-test tube (reservoir) into the warm water beaker and record the new level of the water in the table below
bull Now place the air-test tube (reservoir) into a beaker of cold water What happens to the water level in the tube when the reservoir is cooled Record your observations in the table
Observations Initial water level on open side of the glass U tube
Water level on open side of the glass U tube in warm water reservoir for 30 sec
Water level on open side of the glass lsquoUrsquo tube after immersing in beaker of cold water
Describe change of water level from previous level
Questions 1 1 Explain your observations recorded in the table in terms of energy conservation and
energy conversion 2 What happens when you leave a blown-up balloon in the sun Give a detailed explanation as
to what happens to such a balloon in terms of energy transfer and conservation of energy
19
Part D mdash Conversion of Light Energy into Electricity Light energy conversion to other types of energy (eg electricity) is never 100 efficient
This station contains a solar cell which directly converts light to electricity with approximately 5 efficiency That is 5 of the light that reaches the panel surface is converted to electricity
Activity 1 Solar to electrical to mechanical
Instructions The small motor connected to the solar cell converts light to electricity and then to mechanical energy
1 Turn 40-watt lamp on and observe if motor (Fan) turns Record how fast fan is turning
2 Turn 75-watt lamp on and observe if motor (Fan) turns Record how fast fan is turning
Questions 1 Which wattage (light bulb) produced the most electricity (turned the fan fastest) 2 Most (95) of the light energy was lost in the process of conversion Where do you suppose
the other 95 of the light energy is going if only 5 is converted to electrical energy Refer to Table 5 below to answer the post-lab question about energy conservation Table 5 Estimates and comparisons of energy usages in your daily lives
Energy Using Activity Is Comparable With
Take a hot bath (full tub) Burning a 100 Watt lamp for a day
Using a 250 watt hair dryer for 8 minutes Riding your bike 30 miles (under ideal conditions)
Heating a pot of water for tea or coffee on the stove
Bench lifting a 50 lb weight 40000 times
Watch TV for an hour Eating a dessert with 250000 calories
Driving your car 45 miles to Portland Playing 13400 games of racquetball
Leaving a 100 watt light burning all night (10 hours)
Dancing the Tango for 45 days nonstop
110
Name____________________________________
Lab Day _____ Lab Time_____________________ POST-LAB ASSESSMENT Comparison of Energy Sources
Questions 1 It is part of our common language to use the term lsquoconserve energyrsquo to mean lsquotry to
consume less energyrsquo Contrast this meaning of lsquoconserve energyrsquo with the physics law of lsquoconservation of energyrsquo
2 All methods of generating electricity have adverse impacts on the environment Try to list at least two ways that each of the following energy sources used to generate electricity negatively impact the environment a) Burning fossil fuels b) Hydroelectric (dams) c) Solar
(Hint you might consider what impact building such plants may have on the environment) 3 Which is you favorite energy source Why
4 Try to stump your lab partner by thinking of a situation where energy is apparently lost for good Write down the ideas you come up with and give your lab partnerrsquos explanation of where the lost energy went
Consider the idea that energy is always conserved and discuss whether people will ever be able to generate power without affecting the planet Record your discussion
2-1
ES 105 Laboratory 2 EXPLORING WORK MOTION AND GRAVITY
Introduction
Work Work is a word used in many different ways It is used to describe our jobs and
careers It is used to describe what we do when we study for an exam However with regards to science that is not what work is The scientific definition of work is a force acting through a distance (Work = Force x Distance) A force is just a ldquopush or a pullrdquo that gives energy to an object sometimes causing a change in motion of the object (Recall from last lab that Energy is the property of a system that enables it to do work) Work is done only when a force moves an object When you push lift or throw an object you are doing work Your force is acting on the object causing it to move a certain distance One important aspect of work to note is the direction of the applied FORCE must be in the same direction of the DISPLACEMENT (movement) for it to be considered WORK
Friction Friction is a resistive force that opposes the motion or attempted motion of an object with which it is in contact In a sense friction is a force that resists (or limits) the work being done as objects are moved Friction always acts in a direction to oppose motion So when an object falls downward through the air the force of friction (referred to as Air Resistance) acts upward There are different types of friction including rolling friction and fluid friction but for the purpose of sliding solid objects across a floor or tabletop the two important types of friction are static and sliding friction The strength of these forces of friction depends upon two factors 1) the types of surfaces involved and 2) how hard the surfaces push together Static friction occurs when you first try to move the object before it is in motion and is a little stronger of a friction force than sliding (or moving) friction once the object is in motion
Gravity and Free Fall ldquoFree-falling objectsrdquo refer to objects that are allowed to fall straight down accelerated ONLY by the force of gravity An object in free fall accelerates as it falls due to the force of gravity (acting as an unbalanced force) Other than the force of gravity what other affects might there be on a falling object The dreaded air resistance is one effect However the effects of air resistance can be ignored as long as the (maximum) velocity of the object is relatively modest For most objects beginning at rest air resistance is negligible throughout the first seconds of fall
In this weekrsquos lab there will be a series of stations that will allow you to explore the motion of objects and how friction affects the motion of both sliding and free-falling objects You will also learn how to calculate the work needed to move objects Your instructor will help you gather data to measure the acceleration of free falling objects due to gravity
There are a few basic measurements and calculations that are necessary to understand the motion of objects and the work needed to move objects These measurements and calculations include
2-2
Distance or Displacement
(d) the distance over which an object moves under the influence of gravity (units of measurement eg centimeters meters kilometers)
Time of Travel (t)
the time during which an object completes its travel (units of measurement eg seconds minutes hours)
Velocity v = dt
the rate of change or displacement (units of measurement eg mileshour meterssec)
Acceleration a = change in velocity time
the rate of change of velocity of an object over time (units of measurement for acceleration are dt2 such as meterssecsec = meterssecond2)
Force (F)
is a push or a pull units generally measured in (Newtons)
Work (w)
is the change in an objectrsquos state of motion that results from the application of a Force
Work (joules) = Force (Newtons) x Displacement (meters)
Power (P)
Is the time rate of work Units generally measured in (watts)
Power (watts) = Work (joules)Time (seconds)
Goals and Objectives
bull Students will be able to perform measurements using a spring scale to determine the force associated with lifting and pulling weight
bull Students will be able to be able to calculate the average work bull Describe what is meant by accelerated motion bull Determine the acceleration of gravity
Useful Websites
bull httpwwwpbsorgwgbhnovagalileo
2-3
Name____________________________________
Lab Day _____ Lab Time_____________________ Pre-Lab Activity Complete the following calculations prior to arrive in lab Show all of your math work and unit conversions (HINT 1 hour = 60 minutes 1 min = 60 seconds 1 km = 1000 m) and (1 kilogram = 1000 grams) 1 If you drive a car for a distance of 35 km and it takes you 45 minutes to do so what is your
average velocity in units of kmhr What is your average velocity in msec 2 Phil has a very messy office and wants rearrange some furniture He needs to move a desk 10
meters If Phil exerts a force of 20 Newtons how much work is he doing 3 What is the Force (in Newtons) associated with a 500 gram weight in free fall near the
Earthrsquos surface (assume acceleration due to Earthrsquos gravity is ~ 10 meterssecond2) (note the 2nd Law of Motion is F(Newtons) = mass(kilograms) x acceleration(metersseconds2)
4 You will be using a Spring-scale to determine the Force associated with moving objects in the
lab Go to Wikepidiaorg (httpenwikipediaorgwikiSpring_scale) and write a brief definition of what a Spring scale is (Be careful to discuss difference between Mass and Force readings)
5 A spring scale measuring the force associated with lifting a 500 gram weight on Earth (3
above) is now used on the Moon What will the Spring scale readings be for Mass and Force associated with the Spring scale reading on the Moon
(assume acceleration due to Moonrsquos gravity is ~16 meterssecond2)
MASS (in grams) FORCE (in Newtons)
2-4
Part A mdash Work Activity 1 Letrsquos Talk Work Instructions
bull Tape a meter stick to an object to keep it vertical bull Use a force spring scale to lift weights of different sizes to the 30 cm mark bull Record your data in the table below bull Use a force spring scale to lift weights of different sizes to the 60 cm mark bull Record your data in the table below
Data Table One
Weights (Grams)
Height (Centimeters)
Distance (Meters)
Force (Newtons)
Work (joules)
100
30
Predict
What will happen to force if weight is raised to 60 cm _____________________
__________________________________________________________________
What will happen to work if weight is raised to 60 cm ______________________
__________________________________________________________________
Now try it and see if your prediction was correct
100
60
200
30
Predict
What will happen to force if weight is raised to 60 cm _____________________
__________________________________________________________________
What will happen to work if weight is raised to 60 cm ______________________
__________________________________________________________________
Now try it and see if your prediction was correct
200
60
Try 500
30
2-5
Questions
1 What does doubling the height (distance moved) do to total work
2 What does doubling the force do to total work Solving Problems Remember to include your units of measurement Some measurements are required to solve
1 Kelsey is a very strong She lifted a 200-gram weight to 50 cm How much work did she do 2 Mario wants to be a super hero He has been practicing for his super hero test by lifting cars If
Mario exerts a force of 12000 Newtons to lift a car 2 meters how much works is being done on the car
Part B mdash Friction Use the spring scale to measure the pulling force (associated with Static and Sliding friction) necessary to move at constant velocity a wood block across different surfaces Add a 200 gram weight to block and measure the pulling force again Record your measurements in Table below
Friction Surfaces Static vs Moving Type of Surface Static Friction
(Newtonrsquos) Moving (Newtonrsquos)
Static with weight
Moving with weight
Smooth-smooth
Smooth-rough
Rough-rough
1 What surface(s) and weight had highest amount of friction Explain your answer Which
was greater Static or sliding friction
2-6
Part C mdash Gravity and the Physics of Free-Falling Bodies Activity 1 Free Fall of Objects with Similar Size but Different Mass Collect two balls of the same size but different weight such as a heavy solid steel ball and a light hollow plastic ball With your lab partners hold both balls simultaneously at a height of one (1) meter above the floor
As a group make a hypothesis (predict) as to which ball will hit the ground first As a group test your hypothesis by releasing the balls at the same time Repeat the experiment several times and describe your results
1 How did the actual results compare to your initial hypothesis What can you conclude about the effects of the Earthrsquos gravity on the heavy and light ball respectively
Activity 2 Free Fall of Unlike Objects In your group repeat activity 1 only this time using a rock and a feather (or piece of paper if you cant find a feather) Hold the rock and feather at a height of 1 m above the floor
As a group make a hypothesis (predict) as to which object will hit the ground first the rock or the feather As a group test your hypothesis by releasing the rock and feather at the same time Repeat the experiment several times and describe your results
2 How did the actual results compare to your initial hypothesis What can you conclude about the effects of the Earthrsquos gravity on the rock and feather respectively
3 How does this activity compare to Activity 1 with two balls of the same size but different
weight Explain the differences andor similarities
2-7
Activity 3 Free Fall in a Vacuum
NOTE Do NOT run the vacuum pump unless it is connected to the lsquoRock and the Featherrsquo tube
As a lab group visit the station that consists of a glass vacuum tube and vacuum pump The apparatus consists of a long tube containing a rock and a bit of paper (or feather depending which tube is available) Air in this tube can be evacuated using the vacuum pump thus creating a vacuum (similar to space) Hold the tube vertically with the valve-end up Hook up the hose to the tube open the valve and turn on the pump After 60-80 seconds all air should be evacuated from the tube Shut the valve turn off the pump and remove the hose With all of the air out of the tube quickly turn the tube end up and hold it vertically while the feather and rock experience free fall Repeat the process several times and note your observations 4 Which object hits first in the vacuum tube the rock or the feather (or piece of paper as the
case may be) 5 How do the vacuum tube results compare with the results from Free Fall Activity 2 (above) 6 Explain processes that influence free-fall of objects under the influence of Earthrsquos gravity
a What are the controlling factors
b How does the Earthrsquos atmosphere affect the free fall of objects under the influence of gravity
c What other force(s) besides gravity is operating on the objects
2-8
Part D mdash Measuring the Earthrsquos Gravitational Acceleration Activity 1 Using the photogate apparatus to Measure Gravitational Acceleration Using a ldquoPHOTOGATErdquo (a light beam with a sensor for light) and a ldquoPICKET FENCErdquo (a clear plastic strip with uniformly spaced opaque bands) the acceleration due to gravity can be determined The photogate head emits an infrared beam from one side of its lsquoUrsquo shape to the other A light-emitting diode (LED) on the top of the Photogate Head blinks to show when an object blocks the beam Timing begins when an object interrupts the infrared beam We will drop our ldquopicket fencerdquo through the photogate head The software calculates the average velocity of the picket fence from one band to the next because the distance from one band to another was programmed into the calculation Before recording data experiment with the photogate and picket fence Procedure 1 Hold the picket fence at one end between your thumb and forefinger so the bottom edge of
the picket fence is just above the photogate beam (see diagram below) Have your partner click START then drop the picket fence through the photogate The computer will begin recording data when the photogate beam is first blocked
2 Click STOP once the entire lsquopicket fencersquo has passed completely through the photogate 3 Make sure the graph shows a diagonal line before moving on If data looks erratic make
sure you are dropping the picket fence vertically not at an angle data will be skewed 4 After your practice runs open the EXPERIMENT menu select DELETE ALL DATA RUNS 5 Using the techniques from above conduct five runs and record them in Table 1 6 Click on GRAPH from the left hand data menu and examine the plot of Velocity versus Time
in the Graph display Determine the slope of the lsquobest fitrsquo line for velocity versus time for each run Record these values in your data table and find the average Include units
Table 1
Run Number Slope of Best Fit Line (acceleration due to gravity)
1
2
3
4
5
AVERAGE
2-9
Name____________________________________
Lab Day _____ Lab Time_____________________
Post-Lab Questions on Acceleration Due to Gravity 1 What can you say about the values for acceleration from Table 1 Is it constant or does it
vary in some consistent manner
2 Compare your values (from Table 1 above) for the acceleration due to gravity g (with the accepted value for g at sea level at the equator of g = 981 ms2
3 What factors may have contributed to the value you determined experimentally being
different from the accepted value List and briefly describe several of these
31
ES 105 Laboratory 3 ENERGY OF OBJECTS IN MOTION and
PHYSICS OF LANDSLIDES
Introduction In this lab we will work with two important aspects of the physics of objects in motion From
lab 1 you should recall that energy can be transformed from one type to another and that energy is never created or destroyed it can however be transformed into different types of energy (like motion or heat) This is known as the concept of conservation of energy This very important concept tells us that an equal amount of energy exists before and after the conversion process Today in lab you will work with converting gravitational potential energy to kinetic In doing so it will seem that energy can disappear No process of transforming one type of energy to another is perfectly efficient and some energy will always be converted into forms that are inaccessible to us
The second key aspect of todayrsquos lab will focus on the physics of landslides Landslides are part of a spectrum of gravity-driven geomorphic processes collectively known as ldquomass wastingrdquo Mass wasting processes include rock fall rock avalanche landslide earth flow debris flow and soil creep The prerequisite conditions for landslides typically include (1) the Earthrsquos gravitational field (a fundamental driving force) (2) the occurrence of loose rock and sediment at the Earthrsquos surface (3) heavy rainfall and (4) steep slopes To understand the occurrence of landslides geologists and engineers must first understand the physics of gravity (ldquoNewtonian physicsrdquo ldquoNewtonrsquos Laws of Gravityrdquo) and how it interacts with materials (rock and sediment) at the Earthrsquos surface This lab provides an introduction to Newtonian physics gravity and the forces that cause landslides
Goals and Objectives
bull Further investigate the concept of conservation of energy bull Investigate the conversion of gravitational potential energy to kinetic energy bull Formulate explanations for energy that can seem to disappear bull Calculate effect of angle of influence on the acceleration of gravity bull Investigate frictional effect on motion
Useful Websites bull httplandslidesusgsgov bull httpwwwfemagovhazardlandslideindexshtm bull httpwwwphysicsclassroomcomClassnewtlawsU2L3ahtml bull httpwwwgrcnasagovWWWK-12airplanenewton2html bull httpenwikipediaorgwikiSineComputation
32
Name____________________________________
Lab Day _____ Lab Time_____________________ Pre-lab Questions 1 Define the following terms andor provide the correct formula prior to attending your lab
A GRAVITATIONAL POTENTIAL ENERGY
B KINETIC ENERGY
C MASS WASTINGLANDSLIDE
D FORCE
E NEWTON (unit of force)
F NEWTONS SECOND LAW OF MOTION
2 Calculate the following values
0o 10o 20o 30o 40o 50o 60o
Sine of angle
Cosine of angle
(If any of your values are negative set your calculator on degrees instead of radians)
33
Part A mdash Energy Transformation and Conservation In closed systems the Law of Conservation of Energy is obeyed It states the total energy
remains constant Another way to say this is that the initial total energy in a closed system is equal to the final total energy In this part of the lab we will examine two types of energy
1mdashTranslational Kinetic Energy = 2mv
21
EK =
where m = mass (kilograms) and v = velocity (msec) Kinetic energy is the energy associated with motion along a line It is measured in Joules [J] which is the same as
2
2
secondmeters kilogramstimes
2mdashGravitational Potential Energy = EP = mgh
where m = mass (kilograms) g = acceleration due to gravity (98 msec2) and h = height above surface (m) Gravitational potential energy is the energy associated with the gravitational pull on an object that is some elevation (h) above a surface (usually Earthrsquos surface) Think of skiing down a slope at the top of the hill you have a large potential energy ndash your elevation h is large As you travel down the hill your elevation decreases so does your potential energy EP = mgh At the bottom of the hill (at an altitude of h = 0) your potential energy is zero Does this mean your energy went to zero No Your potential has been converted into translational kinetic energy and yoursquore zipping along
Instead of skis we will roll a ball down a ramp converting potential energy into kinetic energy At the bottom of the ramp the ball can roll with some friction along a horizontal track We measure the final velocity as the ball traverses one meter along this track By comparing the initial potential energy to the final kinetic energy we will determine if energy is conserved Activity 1 Investigating gravitational potential energy and translational kinetic energy Go to the ramp-track station in the lab It should look like this
Support (Rods and Clamps)
Ramp
Table
Horizontal Track
lsquozerorsquo marker lsquo1 meterrsquo marker
Tape lsquocatcherrsquo
Release Point
h = 003 m
Meter Stick
Figure 1 Apparatus to investigate the conservation of energy
34
Procedures
1 Determine the mass of the ball in grams using one of the balances in the lab Record below
The ballrsquos mass is __________________ g and convert this mass to kilograms record below
__________________ kg 2 Carefully measure a starting point on the ramp that is 3 centimeters above the base of the
horizontal track (H= 003 m) Make sure you are measuring the VERTICAL HEIGHT of the starting point NOT the diagonal length from the base of the ramp
3 One person will release the ball from the previously determined release point Another person in the group will click START to begin recording The program will record the value of position versus time One person must catch the ball before it hits the motion sensor
DO NOT LET THE BALL HIT THE MOTION DETECTOR 4 Repeat this measurement for a total of five trials After each trial use the best fit line tool to
determine the slope of the graph following directions provide below The slope of the position versus time graph is equal to the average velocity of the ball rolling along the horizontal surface Record the velocity for each trial in the data table below (Table 1) Repeat your experiment 5 times and find the average
5 Follow these directions to determine the best fit line a Click the DATA tool button Select NO DATA b Click the DATA tool button again This time choose Run 1 c Click on the SCALE TO FIT button d Using your mouse select data click and hold the left mouse button to draw a box
around the part of the graph that is a smooth diagonal line This part of the graph corresponds to the ball rolling along the horizontal surface The line should be highlighted in yellow
e Now click on the FIT button and select LINEAR Record the slope (m) in Table 1 as the velocity
f Repeat steps a through e for all five trials Be sure to select part of the line for each trial Do not rely on it having yellow highlight Tabulate your data in Table 1
6 Run the experiment again starting the ball at 6 centimeters above the table top and calculate the velocity on the horizontal track in meterssecond Repeat your experiment 5 times and find the average Tabulate your data in Table 2
35
Table 1 Data table for experiment with ball starting at 3 centimeters above the table top
H = ___003__________ meters
In the last column record the velocity from the computer table if you used it to collect your data It is not necessary to record the time if you used the computer to collect your data
Trial Time (seconds) Velocity (msec)
1
2
3
4
5
AVERAGE
If you are using meter stick and manual timer you will need to calculate your velocity Table 2 Data table for experiment with ball starting at 6 centimeters above the table top H = ____006_________ meters In the last column record the velocity from the computer table if you used it to collect your data It is not necessary to record the time if you used the computer to collect your data
Trial Time (seconds) Velocity (msec)
1
2
3
4
5
AVERAGE
If you are using meter stick and manual timer you will need to calculate your velocity
36
Activity 2 Computational Questions Show your calculations be sure to include units in all of the equations on the next three pages 1 Calculate the initial potential energy in the system Ep = mgh (mass x acceleration of
gravity x height) for the ball starting at 3 cm (g = 98 msec2 use units of kg m seconds) 2 What is the final potential energy
(Hint write the equation with values inserted for the variables and remember h = 0 meters)
3 Calculate the final kinetic energy in the system 2K mv
21 E = (That is square of velocity
times the mass divided by 2 Use average velocity from 3 cm height and units of kg m s) 4 What is the initial kinetic energy (when the ball is at the top of the ramp)
(Hint write the equation with the values inserted for the variables) 5 Compare the initial potential energy (from Q 1) and final kinetic energy (from Q 3) Are
they equal (to within your uncertainty) or are they quite a bit different By what factor 6 Law of Conservation of Energy suggests that EP and EK should be equal explain how the
concept of conservation of energy is supported or rejected by the track experiment If rejected what might be the possible reasons
7 Surprise The potential and kinetic energy are not equal because we havenrsquot accounted for
the energy lsquolostrsquo during the rolling (rotational energy) motion of the ball
37
Part B mdash Newtonrsquos Second Law Force and Landslide Analysis Landslides are driven by the Earthrsquos force of gravity acting on a mass of rock or sediment on an inclined hillslope The critical analytical parameters include
Symbol Name Description Units
F Force of Gravity The pulling action on an object due to Earthrsquos gravity
Newton N = 1 kg-msec2
g Acceleration due to gravity
Constant on the Earth g = 983 msec2 msec2
m Mass Amount of material measured in kilograms
kg
θ Angle of Slope Angle of hill-slope inclination (90 degrees = sheer cliff face 0 degrees = flat surface)
degrees
Newtonrsquos second law of gravity states that the force operating on an object in space is directly proportional to the product of its mass and acceleration Newtonrsquos second law translates into the following equation
F = ma where F = force (Newton) m = mass (kg) and a = acceleration (msec2)
When Earthrsquos gravity is considered ldquoFrdquo is equivalent to ldquoweightrdquo (eg your weight on a scale is a measure of the Earthrsquos gravitational pull on your body mass the more mass you have the more you weigh) and ldquoardquo is equivalent to ldquogrdquo which is the acceleration due to gravity (a constant = 98 msec2) In terms of Earthrsquos gravitational pull Newtonrsquos second law is translated as
Wt = mg where Wt = weight of an object (Newtons) m = mass of object (kg) and g = acceleration due to gravity (g = 98 msec2)
This part of the lab is particularly relevant because the Willamette Valley represents one of
the most dynamic and spectacular geologic environments in the United States Intense seasonal rainfall patterns steep mountain slopes and expansive valleys provide for an active geomorphic setting associated with seasonal flooding and landslides Annual cost of damage to public and private lands in western Oregon ranks among the top 20 of the most severe in the United
38
States Damage to public infrastructure from storm events during the mid-1990rsquos alone totaled hundreds of millions of dollars Landslides accounted for a large portion of this damage Slope failure and erosion in the Coast Range are further exacerbated by sustained timber harvesting and the Willamette Valley is experiencing unprecedented population growth and development invading the foothills Understanding of the spatial and temporal distribution of landslides is critical for the appropriate design of land-use regulations hazards mitigation and conservation planning (read this as ldquoYour house could be next How do you know if you are at risk for landslide and what can you do about itrdquo)
Application of Newtonrsquos Second Law With your lab group visit the inclined plane station and examine the apparatus A mass of rock is sitting on an inclined plane this is analogous to a mass of rock on a hill-slope in the Coast Range or western Cascades The figure below illustrates the forces acting on the slope material
Figure 2 Diagram of forces of weight Definitions for Particle on Slope
θ = slope angle relative to horizontal plane (units in degrees) Wt = weight of particle or mass of material (units in N) = mass x gravity Shear force parallel to slope = Wt x sin θ (units in N) Normal force perpendicular to slope = Wt x cos θ (units in N)
Equations for Particle on Slope
Wt (weight of particle in Newtons) = mg (= mass times acceleration of gravity) SHEAR force (in N) = Wt (sin θ) NORMAL force (in N) = Wt (cos θ)
39
Activity 1 Force Analysis of a Rock Mass on a Slope (Inclined Plane) Questions Given that shear force is oriented down slope and normal force is oriented perpendicular to slope answer the following questions (refer to the inclined plane drawing above) 1 Which of the two forces (shear or normal) will drive the rock-block down slope when it fails 2 Which of the two forces will tend to resist down-slope movement of the rock mass 3 When do you think the block will begin sliding down the slope (Circle one comparison) shear = normal shear lt normal shear gt normal
Instructions
1 Determine the mass of our block-of-rock sample by using the balance in the room a Mass of Rock Block kg (HINT 1 kg = 1000 g)
b Weight of Rock Block N (Newtons) Show Calculations
2 Place the rock on the inclined plane and slowly lift the board to determine the critical
angle at which it slides down the slope (tilt the plane until the rock begins to slide) Record the angle in Table 3
3 Now repeat the experiment with various types of surfaces Record the angles in Table 3 Reduced friction Tape wax paper to the rock (place it between rock and wood) Increased friction Tape a piece of sand paper (place it between rock and wood)
Figure 3 Critical Angle apparatus
310
Table 3 Critical Angle of sliding for various surfaces
Condition of Inclined plane
Critical Angle of sliding (degrees)
Normal Force at Critical Angle
Wt x (cos θ)
Shear Force at Critical Angle Wt x (sin θ)
Rock on Wood
Rock on Wax Paper
Rock on Sandpaper
4 Calculate the normal force and shear force of the critical anglesmdashbe sure your calculator is
using degrees not radians to calculate the sine and cosine of angle θ Record in Table 3 5 How do inclined-plane results (Table 3) compare to your prediction in question 3 above 6 List some ideas as to what other physical factors may be important to slope failure that are
not part of the above equations for slope analysis
7 Based on your experiments above discuss the effects of surface friction on the critical hill slope angle at which landslides occur
8 In the absence of wax paper and sand paper on hill slopes in the natural environment what
types of factors will influence the frictional conditions and critical angles at which hill slopes fail
311
Name____________________________________
Lab Day _____ Lab Time_____________________
Post-Lab Assessment Calculations 1 Imagine you have placed yourself on a balance and determined that your body mass is
100 kg Calculate your weight in units of Newtonrsquos (hint 1 N = 1 kgmsec2) Show all of your math work keep units with numbers
2 A car has a mass of 1000 kg and the net force exerted on the car is 0 N Use Newtons
2nd Law to calculate the acceleration of the car in msec2 Show all of your math work keep units with numbers
3 A rocket has a mass of 1000 kg and the net force exerted by the rocket engine is 2000 N
Use Newtons 2nd Law to calculate the acceleration of the rocket in msec2 Show all of your math work
Questions 1 What effect will clear-cut logging of trees have on slope stability in the Coast Range
Explain your answer in the context of todays lab experiments 2 Write a 5-10 sentence summary of the critical factors that affect landslide susceptibility in
western Oregon Think about the conditions necessary for landslides to occur and the factors that affect the critical thresholds at which they begin
41
ES 105 Laboratory 4 UNDERSTANDING GEOLOGIC TIME
Relative Dating and Fossils Radioactivity and Numerical Age Determination
Introduction The Geologic Time Scale was developed using two approaches In the first rock units were
studied and correlated between geographically distant areas using the principle of faunal succession With the discovery of radioactivity in the early 20th century numerical (or ldquoabsoluterdquo) ages could be applied to the Geologic Time Scale In this weekrsquos lab you will explore both of these aspects of geologic time
First you will investigate the Geologic Time Scale and examine how features of the geological record ndash species of fossils and other features ndash can be used to correlate geological events In this approach geologic events are placed in a correct sequence and the relative age (which layerstrata is older and which is younger) of the events is determined
You will then explore the concept of half-life One half-life represents the time it takes for half of the radioactive parent isotopes to decay into stable daughter isotopes Numeric ages are calculated from rock samples by comparing the amount of daughter isotope in the rock to the amount of remaining parent isotope because different radiometric isotopes decay at known statistically constant rates Radiometric dating thus provides Earth scientists with a powerful tool to investigate Earth history Goals and Objectives
bull Construct a geologic time scale to gain an understanding of the timing of major events in Earthrsquos history
bull Use fossils to constrain the ages of sedimentary strata and to correlate strata of different thicknesses
bull Develop a conceptual understanding of half-life bull Calculate half-life from counts of decay to daughter atoms bull Determine ages of materials using half-life radioactive decay techniques
Useful websites
bull httpwwwgeosocietyorgsciencetimescaletimesclhtm bull httppubsusgsgovgipfossilssuccessionhtml bull httppubsusgsgovgipgeotimeradiometrichtml bull httpevolutionberkeleyeduevolibraryarticlehistory_23
42
Name____________________________________
Lab Day _____ Lab Time_____________________
Pre-lab Questions ndash Complete these questions before coming to lab 1 Define the following terms prior to arriving at your lab section
A Geologic period
B Stratigraphic correlation
C Parent atom
D Daughter atom
E Isotope 2 Your lab period lasts 110 minutes If your lab instructor spends 20 minutes introducing the
lab and giving instructions what percentage of the lab will you have spent listening to your instructor talk Show your calculations
3 The oldest known crustal rock is 38 billion years old Give this age in millions of years
Show your calculations Include units with the numbers 4 Briefly describe and graphically represent (draw a diagram) the concept of half-life in the
space here
43
Part A mdash Scale Modeling of Geologic Time and Earth History As an introduction to the duration and extent of Earth history you will work in lab groups to build a scale model of significant geologic events Activity Table 1 is a summary of the significant events in Earth history The geologic time interval of the events is given in the last column of the table Use this table as a reference to construct a model of geologic time Using the note cards provided build a physical model of geologic history in the hallway outside the classroom using the floor tiles as a scale for time You must decide the scale to use for your model (for example given the length of the hallway and total number of floor tiles available how many tiles will represent 1 billion years of Earth history or 1 million years) Determine an appropriate model scale and lay out your note cards in the appropriate order and at the appropriate scaled distance along the hallway Your scale should be such that all of the note cards are not piled on top of one another Questions 1 What scale did your group use for the physical model of geologic time (answer in number
of floor tiles billion years)
2 Examine your scale model noting how the spacing of events changes Sketch your model of the geologic time line below with spacing generally to scale
44
Table 1 Summary of Significant Events in Geologic Time (from oldest to youngest)
Years Before Present
Event in Earth History Event occurred during this Geologic Time Interval
46 billion Estimated origin of Earth
Pre
cam
bria
n Ti
me
Beginning of Hadean Eon 38 billion Oldest known crustal rocks Beginning of Archean Eon
30 billion Oldest known fossil life (stromatolites = fossil mats of bacteriablue-green algae) Archean Eon
25 billion Evidence of glaciations climate impact preserved in the rock record (ancient glacial deposits)
Start of Proterozoic Eon
18 billion Multicellular algae preserved in the fossil record Proterozoic Eon
700 million Oldest well-documented worm burrows preserved in rock record Late Proterozoic Eon
540 million
Invertebrate marine organisms abundant (trilobites brachiopods)
Pale
ozoi
c Er
a
Start of the Paleozoic Era Cambrian Period
430 million First jawed fish vertebrates evolve first early land plants Silurian Period
370 million Amphibians evolve (water-land animals) fish abundant Devonian Period
300 million Reptiles evolve amphibians abundant coniferous land forests abundant Carboniferous Period
245 million
Mass extinction event many invertebrates become extinct End of Permian Period
220 million Dinosaurs evolve first mammals evolve
Mes
ozoi
c E
ra Triassic Period (Mesozoic Era)
200 million First birds evolve dinosaur city Jurassic Period (Mesozoic Era)
100 million Flowering plants evolve mammals become very diverse dinosaurs still around Cretaceous Period (Mesozoic Era)
66 million Mass extinction event dinosaurs become extinct (global asteroid impact event)
End of Cretaceous Period (Beginning of Cenozoic Era)
55 million Global greenhouse climate warm and toasty on the planet mammals diversify
Cen
ozoi
c E
ra
Eocene Epoch (Tertiary Period)
35 million Global cooling of climate start of the glacial climate cycles glaciers develop on Antarctica Oligocene Epoch (Tertiary Period)
3 million Hominids (man) evolve from hominoids Pliocene Epoch 2 million Massive ice sheets in North America Start of the Pleistocene Epoch 18 million Homo erectus evolves (precursor to modern) Pleistocene 300000 Homo sapiens evolve Pleistocene Epoch 10000 Modern humans take over Holocene Epoch 0 years You and I sit here thinking about it Late Holocene
45
Part B ndash Time and Stratigraphy For this part of the lab you will use a beaker sediment and fossils to explore the relationship of time and correlation in geology Obtain the materials for this activity Follow the instructions record your observations and answer the questions in the spaces provided Procedure 1 Pour a few centimeters of sand into the beaker Level the sand by gently shaking the jar
from side to side 2 Place an Ordovician fossil on top of the sand layer 3 Pour a few centimeters of gravel on top of the sand and shell 4 Place a Devonian fossil on top of the gravel layer 5 Cover the gravel layer and shell with a few more centimeters of sand 6 On the left side of the diagram below sketch the contents of your beaker actual thickness
Label the two sand layers the gravel layer and the two fossils along with the geologic ages of the fossils
7 Trade beakers with another group or set your beaker by the fossil and sediment supplies 8 Measure the size of an individual grain of sand in millimeters and record the grain size in the
data table (Table 2) Estimate the average size of the gravel in millimeters and record the grain size in the data table (Table 2)
9 Measure the thickness of your layers in millimeters and record in the data table (Table 2) Your Group Other Group (see pg 49 q 8)
46
Table 2 Data table for Time and Stratigraphy activity
Answer the following questions 1 If a bed of sand a single grain in thickness was deposited once each year how long would it
take to form beds with the thickness of the sand layers in your beaker Determine for both lower and upper sand layers Show calculations below and record answers in Table 2 above
2 If the minimum thickness of a gravel bed were a single grain of gravel in thickness how long
would it take to form your gravel layer if one grain-thickness was deposited each year Show calculation below and record answer in Table 2 above
3 Compare the relative age of the lower sand bed to the Ordovician fossil Is the sand
younger or older than the fossil What about the gravel
Layer Grain size
(mm) Thickness
(mm)
Time to deposit layer (years) ndash calculated in
Questions 1 amp 2 below
Upper sand
Gravel
Lower sand
47
For the following questions refer to the Geologic Time Scale Answer in terms of PERIOD listed on Geologic Time Scale not absolute age in millions of years 4 Assuming that the lower fossil in your beaker was deposited in the Ordovician Period what
is the OLDEST that the gravel bed could be (Answer in terms of Period listed on Geologic Time Scale)
5 What is the YOUNGEST that the lower sand bed could be (Answer in terms of Period listed
on Geologic Time Scale) 6 Assuming that the upper fossil was deposited during the Devonian Period what is the
YOUNGEST possible age of the gravel layer (Answer in terms of Period listed on Geologic Time Scale)
7 What is the OLDEST possible age of the upper sand layer (Answer in terms of Period listed
on Geologic Time Scale) 8 Borrow a jar from another group On the right side of the diagram on page 6 sketch and
label the sediment layering in the other grouprsquos jar Draw lines between the columns to CORRELATE (match) the layers fossils and geological ages You have just demonstrated how geologists relate rocks in one area to those in another area
9 Do you think fossil or the type of sediment is more important in correlating of rock units
between different areas Explain your answer
GGeologicc Time Scale
hhttpgeologgycomtime
48
ehtm
49
Part C ndash Exploring the Concept of Half-Life The determination of Earth history by numerical ages is achieved from measurements of
radiometric isotopes found in some rocks and other Earth materials The PARENTDAUGHTER ratio may be used to calculate the absolute age of a rock sample Recall from lecture that numerical (or absolute) ages for geological events are derived from the measurement of certain radioactive isotopes in Earth materials Isotopes are atoms of an element that have differing numbers of neutrons in their nuclei Various isotopes of the chemical elements are radioactive meaning that the nucleus is unstable and decays (disintegrates) by emitting one or more particles which are designated as alpha (α) beta (β) and gamma (γ) This decay usually changes the original radioactive isotope (PARENT) into a different isotope (DAUGHTER) For example 238U 234Th + α
While the time interval before each individual nuclide disintegrates is random each known isotope has a determined half-life value which represents the rate of isotope decay A second half-life is reached when half of the remaining radioactive parent decays and so on Hence half-life is the time during which each nucleus has a 50 chance of disintegrating
In this activity you will explore the basic concept behind radioactive decay and half-life You will need a cup 100 pennies and a calculator for this activity You will treat these pennies as if they were radioactive isotopes that are decaying A penny that lands heads up is a parent isotope and a penny that lands tails up has ldquodecayedrdquo into a daughter isotope Procedure
1 Count your set of pennies to make sure you have 100 For Trial 1 put the pennies into the cup and shake vigorously Pour the pennies out on the table count how many pennies are heads up record result in Table 3 and calculate the percentage of heads up pennies [(heads up)(total of pennies poured out on that trial)] and record in table
2 For Trial 2 put the heads-up pennies back into the cup and set the tails-up pennies aside Repeat step 1 making the same calculation as above and record results in Table 3
3 For Trial 3 put the heads-up pennies back into the cup and set the tails-up pennies
aside Repeat step 2 making the same calculations as above Record results in Table 3
4 Continue this process until the pennies are gone recording the results in Table 3
410
Table 3 Results of penny experiment
Trial Number of Heads of Heads Up in Trial 1 2 3 4 5 6 7 8 9
10
Instructions Plot the results of this experiment on the graphs below (Figures 1 and 2)
On Figure 1 graph the total number of heads-up pennies for each trial On Figure 2 graph the percentage of heads-up pennies for each trial
100 90 80 70 60 50 40 30 20 10
Trial 1 2 3 4 5 6 7 8 9 10
Figure 1 Graph showing the total number of heads up pennies for each trial
100
90
80
70
60
50
40
30
20
10
Trial 1 2 3 4 5 6 7 8 9 10 Figure 2 Graph showing the percent of heads
up pennies in each trial
411
Questions 1 Is your graph of the total number of heads up pennies per trial (Figure 1) a linear or
exponential (curved) relationship Explain why you think the graph has this shape 2 What would be the predicted ratio of heads to tails in each trial Is this prediction verified by
the results of this experiment displayed in Figure 2 3 The number of radiometric parent and daughter isotopes in even a small sample of rock is
huge however statistical errors still must be accounted for This is one source of uncertainty in radiometric dating methodology Make a generalized statement about the statistical reliability of the headstails experiment That is how does the number of pennies used in the experiment increase or decrease the reliability of the results (Notice your results as the number of pennies decreases as you have graphed in figures 1 and 2)
4 How reliable would the results be from an experiment starting with billions of pennies Explain
412
Part D ndash Determining the Half-Life of 137Ba The isotope 137Cs has a half-life of 30 years and decays by the reaction
137Cs 137Ba + β where β is a beta particle (an electron from a nucleus) and 137Ba is an isotope of barium in the excited state The symbol denotes the excess energy that the barium nucleus has after it has formed through beta decay from cesium The barium nucleus loses the excess energy by releasing a gamma particle (high-energy electromagnetic particle) given by the following reaction
137Ba 137Ba + γ The half-life of this nuclear reaction is a few minutes To measure the half-life it is enough to measure the activity of a sample of 137Ba starting from the time it is formed until a significant amount has decayed The 137Ba source is produced by passing an eluting solution (slightly acidic saline solution) through a sample of 137Ba The 137Ba is dissolved into the eluting solution but the 137Cs is not dissolved So the solution contains only 137Ba
Procedure Your instructor will provide the solution to you and assist with the experiment 1 Place 3 drops of eluting solution containing the 137Ba on a watch glass 2 Place the watch glass under the Geiger counter 3 Start recording data by clicking START Record data until the decay rate shown on the
graph stops changing This should take about 10 minutes 4 Click STOP Print enough copies of the graph so that all of your group members have one 5 Draw (by hand) a best-fit curve through the data points on your graph extrapolating
the curve back to where it intersects with the y-axis of the graph Remember a best-fit curve does not connect the data points on the graph Instead a best-fit curve is a smooth curve that comes as close as possible to all of the data points without necessarily going through most of them You will use the graph to analyze the data and answer the questions on the following pages
413
Data Analysis and Questions Follow the directions and complete the table provided below to estimate three independent values for the half-life of 137Ba from your graph of the activity 1 Using your best-fit curve find the count rate at time zero of the data collection run and
record this as the starting count rate value in 1 of Table 2 below Next using the best-fit curve find the count rate that is approximately one-half of the original value and record this as the ending count rate in line 1 of the data table Also record the time at which one-half the original count rate is reached as the time at the end of the interval
2 Enter the ending time and final count rate from 1 as the starting time and count rate for 2 on the data table Use the best-fit curve find the count rate that is approximately one-half of the starting count rate Record this final count rate value as well as the time at which the value is reached
3 For line 3 do not use the ending count of line 2 Instead pick a point near the higher end of the count data along the best-fit curve that is easily divisible by two and record the starting time and this starting count rate in 3 of the data table Find the point on the best-fit curve where the count rate drops to approximately one-half your original count value Record the ending count rate and ending time as before
4 Calculate the half-life of 137Ba for 1 2 and 3 and record in Table 2 Table 2 Table for data analysis and estimation of half-life values
Time at starting count rate (start of interval)
Starting Count Rate (at the start of interval)
Ending Count Rate (half of starting count rate)
Time at ending count rate
Half-life for 137Ba (end time minus start time)
1 00
2
3
1 Do the half-life values agree Explain why or why not
2 Determine the average value for the half-life of 137Ba______________________________
414
Name____________________________________
Lab Day _____ Lab Time_____________________ POST-LAB ASSESSMENT 1 Based on your physical and quantitative models of Earth history assess the importance of
modern humans in the relative framework of biologic and physical evolution of the planet 2 Convert the following decimal values to percents and reduced fractions
Decimal Percent Fraction
050
025
0125
00625
003125
Your prelab diagram of half life may help you visualize the following questions 3 You have 1224 mg of freshly prepared gold-189 half-life 30 min How much of the gold-
189 sample remains after five half-lives 4 A piece of fossilized wood has carbon-14 activity one-eighth that of new wood How old is
the artifact The half-life of carbon-14 is 5730 years 5 A sample of a particular radioisotope is placed near a Geiger counter which is observed to
register 160 counts per minute Eight hours later the detector counts at a rate or 10 counts per minute What is the half-life of the material
5-1
ES 105 Laboratory 5 INTRODUCTION TO CHEMICAL REACTIONS
Introduction
By definition a physical change is one in which only the physical characteristics such as state (gas liquid or solid) size density or color of a substance is changed without changing its composition Ice melting is an example of a physical change (solid to liquid change of state) A chemical change results in the formation of one or more NEW substances with different composition and properties from the original substances When a match burns the ashes and smoke are very different than the original match In todayrsquos lab you will observe a number of different chemical changes
A chemical change is accomplished by rearranging atoms through breaking and reforming of chemical bonds in a chemical reaction The actual rearrangement of atoms ndash bond breaking and reforming ndash is not directly observable Because we cannot see this process we have to use indirect evidence to infer that a chemical change has occurred These indirect lines of evidence include production of gas production of a solid (precipitate) release of heat (exothermic reaction) absorption of heat (endothermic reaction) change in pH andor change of color (unless using indicators to check for acids or bases) Goals and Objectives bull To acquaint students with the nature chemical changes bull To identify whether a chemical change has occurred based on a series of observations bull To study and explore basic types of chemical reactions bull To perform a series of experiments make observations and determine whether a
chemical reaction has occurred Useful Websites
bull httpwwwricedufacultyptiskusreactions bull httpwwwchemtutorcomreacthtm bull httpwwwmcwdnorgchemistpcchangehtml
5-2
Name____________________________________ Lab Day _____ Lab Time_____________________
Pre-Lab Activities Answer the following questions Use the material presented in the lab your lecture materials and text to assist in answering these questions 1 How is a chemical change different from a physical change How can you determine
whether a chemical change has occurred List at least three observations that may indicate a chemical change has occurred
2 In chemistry what is a lsquoreactantrsquo
3 Define endothermic 4 Define exothermic 5 If a reaction container feels warmer after the reaction has occurred was the reaction
endothermic or exothermic
5-3
SAFETY NOTES Be sure to read and understand before proceeding
For safety reasons before you begin this laboratory all books packs and coats
must be stored at the front of the room
Be sure that all of the equipment that should be in your kit is there and that it is clean
and ready to use For some of the reactions it is very important to have clean
equipment and not to introduce contaminants Contamination can produce incorrect
results If you are unable to clean a piece of equipment ask your instructor if you
need to replace it at this time
Be sure to follow instructions carefully Use the proper measurements as indicated
in the instructions Be observant
In some of the experiments you will be mixing acids and water The rule is
ALWAYS ADD ACIDS TO WATER NEVER ADD WATER TO ACIDS
When you are through with the lab be sure that you leave the equipment as you
would like to find it Remember there are many other students using the same
equipment over the course of the quarter
The Golden Rule of Chemistry Labs
LEAVE THE LAB FOR OTHERS AS YOU WOULD HAVE THEM LEAVE IT FOR YOU
WEAR YOUR GOGGLES
5-4
Part A ndash Indicators Chemical fluids are often acidic or alkaline (basic) The pH of a solution describes its
acidic or alkaline character Neutral pH is 7 acidic solutions range from pH 0 to 7 alkaline solutions range from pH 7 to 14 The number comes from the negative log of the hydrogen ion concentration (or pH = mdashlog [H+]) Solutions are characterized as acidic or alkaline according to their pH
Indicators are particular substances added to solutions that change color according to the pH (acidity or alkalinity) of the solution They are highly useful in measuring the pH of a solution quickly and quite accurately Indicators are used in a wide range of fields (environmental forensics petroleum) to determine the concentration of a chemical of interest with great accuracy There are many pH indicators used in chemistry each with their own color changes and active pH range One of the most common pH indicators is phenolphthalein Phenolphthalein is an ionic substance that changes color in solutions that have a particular pH range Activity 1 Pour 1-2 mL of 01 M Sulfuric Acid H2SO4 into a test tube Add 3-4 drops of phenolphthalein solution Place a stopper on the tube and shake gently Record result in Table 1 Do not throw out solution as you will need it for Activity 3 Activity 2 Place 5 mL of distilled water in a large test tube Using your forceps (tweezers) put a small pellet of sodium hydroxide NaOH into your test tube Gently tap the tube in the counter if the pellet is stuck to the side of the tube NEVER HANDLE NaOH WITH YOUR FINGERS It is strongly alkaline and will burn your skin Place a rubber stopper on the test tube and shake gently Remove the stopper and add 3-4 drops of the phenolphthalein solution to the tube Place the stopper back on the test tube and shake it gently Observe the tube for a few minutes Record result in Table 1 below Do not throw out solution as you will need it for Activity 3 Activity 3 Use pH paper (measures the specific range from pH 1 ndash 14) and determine the pH number associated with each solution in Activity 1 and 2 Record results in Table 1 below You are done with the solutions so discard solutions and rinse out test tubes Table 1 pH of solutions Fluid Character
(acidalkaline) Response of phenolphthalein indicator
pH number
Dilute H2SO4
Dilute NaOH
Question 1 Phenolphthalein is an indicator for what pH character
5-5
Part B ndash Studying Chemical Reactions In this part of the lab you will work through a sequence of experiments make observations
and determine whether a chemical reaction has occurred Follow the instructions to do the experiments in the containers specified not in the small tubes containing the reactants As you progress through this portion of the lab complete lsquoTable 2 Observationsrsquo on the following page Allow cloudy solutions to sit in the test tube rack to see if a precipitate settles out Include this information in your observations Experiments 1 Add 5 mL of tap water to a large test tube Grasp the tube by wrapping your hand around it
Notice the temperature of the tube Add ammonium chloride crystals NH4Cl to this test tube Close the tube with a rubber stopper and shake gently Notice the change in temperature of the tube as the crystals dissolve Record your observations in Table 2
2 Pour 1 mL of 01 M potassium bromide KBr into a large clean test tube Add 1 mL of 01 M
sodium chloride NaCl to the KBr Record your observations in Table 2
For reactions 3 and 4 take two clean test tubes 3 place1 mL of 01 M sodium chloride NaCl in one test tube
4 and place 1 mL of 01 M Potassium Chromate K2CrO4 in the other test tube
Add a few drops of 01 M silver nitrate AgNO3 to each Record your observations for each in Table 2
5 Pour 5 mL of 1 M hydrochloric acid HCl into a clean test tube Carefully add a small chip of
calcium carbonate CaCO3 to the acid Record your observations in Table 2 6 Take the test tube containing sodium bicarbonate (baking soda) NaHCO3 from your kit Add
several drops of acetic acid (vinegar) HC2H3O2 Record your observations in Table 2 Complete Table 2 by determining whether a reaction took place for each of the experiments you performed and describe the evidence in support of a reaction taking place
5-6
Table 2 Observations from chemical reaction experiments
Has
a c
hem
ical
re
actio
n oc
curr
ed
Obs
erva
tions
(F
izze
s) (
Prec
ipita
te fo
rms)
(co
lor c
hang
e)
(Tem
pera
ture
Cha
nge)
or
()
Writ
e ch
emic
al n
ames
of
reac
tant
s
(eg
Am
mon
ium
chl
orid
e +
wat
er)
Expe
ri-m
ent
1 2 3 4 5 6
5-7
Questions 1 Which chemical reactions produced a new phase
List by experiment number in the proper column in the table below Some of the reactions may have not created a new phase some may have created more than one new phase
CREATED SOLID PHASE CREATED LIQUID PHASE CREATED GAS PHASE
2 Is a new phase always an indication of a chemical change Explain
3 Which reactions were exothermic (gave off heat) How could you tell
4 Which were endothermic (absorbed heat) How could you tell 5 Is a color change a reliable indicator of a chemical reaction Explain
6 What gas was released in Experiment 5 How might you test for the type of gas released
during a chemical reaction
5-8
Part C ndash Endothermic and Exothermic Reactions In this part of the lab you will use a TEMPERATURE SENSOR interfaced with a computer to study one exothermic reaction and one endothermic reaction
Procedures (wear your googles) Activity 1 Citric acid solution and baking soda
The equation for this reaction is H3C6H5O7 (aq) + 3 NaHCO3 (s) 3 CO2 (g) + 3 H2O (l) + Na3C6H5O7 (aq)
citric acid baking soda
1 Place a Styrofoam cup into the 250 mL beaker as shown in the diagram provided by your instructor Put 30 mL of 15 molar citric acid into the cup Place the temperature sensor into the citric acid solution
2 Weigh out 50 g of solid baking soda on a piece of weighing paper 3 Start recording data by clicking START 4 Wait 20 seconds and then add the baking soda to the citric acid solution Stir gently and
continuously with the temperature sensor to ensure good mixing 5 Use the DataStudio program to record data until the reaction is complete After the data has
been recorded dispose of your reaction products as directed by your instructor Rinse the Temperature sensor with distilled water
Activity 2 Magnesium and hydrochloric acid
The equation for this reaction is Mg (s) + 2 HCl (aq) H2 (g) + MgCl2 (aq)
magnesium hydrochloric acid
1 Measure out 30 mL of 05 molar HCl solution into a second Styrofoam cup and place the Temperature Sensor into the HCl solution
2 Obtain a 20 cm piece of shiny magnesium metal from your instructor 3 Start recording data by clicking START After 20 seconds add the magnesium ribbon to the
acid solution Stir gently and continuously with the temperature sensor to ensure good mixing
4 Use the DataStudio program to record data until the reaction is complete After the data has been recorded dispose of your reaction products as directed by your instructor Rinse the Temperature Sensor with distilled water
5 Click TABLE from the left hand menu Set up your Table display so it shows both experiments
6 Find the minimum and maximum values for temperature for the citric acidbaking soda and the MgHCl experiments Record the initial temperatures in your data table Then record the minimum or maximum value as the final temperature
5-9
Results Calculate the temperature change for each reaction by subtracting the initial temperature from the final temperature
Citric Acid-Baking Soda Hydrochloric Acid-Magnesium
Final Temperature (oC)
Initial Temperature (oC)
Temperature Change (oC) (Use correct sign)
Was reaction Endothermic or Exothermic
Questions about endothermic and exothermic reactions 1 Which reaction had a negative temperature change Is the reaction endothermic or
exothermic Explain 2 For each reaction describe three ways you could tell a chemical reaction was taking place 3 Which reaction took place at a greater rate (produced a temperature change Faster or
Slower) Explain your answer
5-10
Name____________________________________
Lab Day _____ Lab Time_____________________ POST-LAB ASSESSMENT 1 What type of change (physical chemical or both) occurs when ice becomes water
2 When you apply rubbing alcohol to your skin you feel a cooling effect Is a chemical
reaction taking place Explain 3 When you apply hydrogen peroxide to a cut there are bubbles released Is a chemical
reaction taking place Explain 4 What factors affect the rate of a chemical reaction
5 List some chemical reactions that are useful or annoying in your daily life
6-1
ES 105 Laboratory 6 STUDY OF SEDIMENTS AND SEDIMENTARY ROCKS
Introduction Rocks are the materials of Earth and understanding their origin and how they change enables
us to begin to understand Earth and its processes Rocks are aggregates of minerals and are classified into three groups based on the processes that formed them Igneous Sedimentary and Metamorphic This lab focuses on some of the common sedimentary rocks which are formed at the surface of Earth
Sedimentary rocks can form from the consolidation and lithification of particles called sediment Sediment is created either by physical processes breaking pre-existing rocks into smaller particles or by inorganic or organic chemical processes where mineral material is precipitated from solution Sedimentary rocks can also form by the precipitation of mineral material from solutions containing dissolved mineral materials
Sedimentary rocks form at or near Earthrsquos surface in many different environments including oceans (marine) streams (fluvial) lakes (lacustrine) deserts (eolian (wind)) and alpine (glacial) Some sedimentary rocks have features that reveal a great deal about the environment in which they formed For example the degree of rounding of the particles the presence and nature of fossils and the mineral composition may help decipher the conditions in ancient environments These observations provide clues about ancient Earth history and also aid in finding potential fossil fuel deposits
A handful of minerals are commonly found in association with sedimentary rocks including quartz potassium feldspar plagioclase feldspar mica (muscovite and biotite) calcite halite gypsum clay minerals and hematite You will examine most of these minerals at the beginning of this lab activity Goals and Objectives
bull To become familiar with minerals commonly associated with sedimentary rocks bull Investigate the characteristics of sediment grains bull Recognize the classes of sedimentary rocks (Clastic and Chemical) and be able to
distinguish samples of each type bull Classify and name samples of sedimentary rocks by their composition and texture
Useful Websites
bull httpwwwphysicalgeographynetfundamentals10fhtml bull httpwwwwindowsucaredutourlink=earthgeologysed_clastichtml bull httpwwwwindowsucaredutourlink=earthgeologysed_chemicalhtml bull httpreynoldsasueduglg103sed_env_starthtm
6-2
Name____________________________________
Lab Day _____ Lab Time_____________________
Prelab questions Complete prior to arriving at your lab section Define TERMS that are in CAPITAL LETTERS and answer the questions below 1 CLASTIC SEDIMENTARY ROCK (also called detrital sedimentary rock)
2 What is the most common clastic sedimentary rock 3 CHEMICAL SEDIMENTARY ROCK 4 What is the most common chemical sedimentary rock 5 CEMENTATION (of clastic rocks) 6 List common sedimentary rock cements
6-3
Part A ndash Observing Sediment Grains In this part of the lab you will examine examples of common sediment grains with a
magnifying glass record your observations and provide sketches of the grains When you look at each sample of grains notice the shapes sizes distribution of sizes and variety of composition of the grains
bull Grain Shape can be well rounded subrounded subangular and angular bull Grain Size size becomes smaller and more rounded with more time in the
transportation system It is a clue to the environment of deposition Use millimeters (mm) to record the grain sizes
bull Grain Sorting is a term to describe the range of sizes present Well Sorted = grains are all about the same size Moderately Sorted = largest grains are 4 to 5 times the size of the smallest Poorly Sorted = largest grains are 5 to ten times the size of the smallest
bull Grain mineral types Often noting the colors of grains can be useful Include quartz (the most common) feldspar mica and rock fragments Fossils may indicate an adjective (fossiliferous) be added to sedimentary name
bull Cements are the ldquogluerdquo that hold together the grains Include calcite silica iron oxide gypsum and halite
Activity 1 Loose Sediment Grains
Study the samples of sediment grains that have been provided Complete the tables on the following page For each sample describe the general shape of the grains record the average grain size and the range of grain sizes describe the sorting list the grain types (or colors of individual grains) Use Table 1 to suggest (name) what the likely sedimentary rock would be formed from the sediment Also make a simplified sketch of the sediment grains showing the sorting and grain shape
Table 1 Grain sizes of clastic sedimentary rocks
Size descriptions Sediment Particle size Rocks formed from it
Coarse
Fine
Gravel
Boulder gt256 mm (10 in) Conglomerate (rounded grains)
Breccia (angular grains) Cobble 64-256 mm
Pebble 2 to 64 mm
Sand 00625 ( frac124) to 2 mm Sandstone
Mud
Silt 00039 ( frac128) to 00625 mm Siltstone
Clay lt00039 mm Mudstone (massive) Shale (bedded)
6-4
Sample 2 Observations Sketch of the sediment
General shape of grains
Average grain size
Range of grain sizes
Description of sorting
List of grain types
Probable rock type formed
Sample 3 Observations Sketch of the sediment
General shape of grains
Average grain size
Range of grain sizes
Description of sorting List of grain types
Probable rock type formed
Sample 4 Observations Sketch of the sediment
General shape of grains
Average grain size
Range of grain sizes
Description of sorting
List of grain types
Probable rock type formed
Sample 1 Observations Sketch of the sediment General shape of grains
Average grain size
Range of grain sizes
Description of sorting
List of grain types
Probable rock type formed
6-5
Part B ndash Introduction to Classifying Sedimentary Rocks Examine the sedimentary rock study sets provided and answer the following questions 1 Study the set of sedimentary rocks provided Place those that are made of pieces or
fragments of mineral andor rock material (but not the rocks that have shells or shell fragments) on one tray and the rocks made of organic material (like shells or coal) or of crystals on the other tray One group of samples is the CLASTIC SEDIMENTARY ROCKS The other group is the CHEMICAL SEDIMENTARY ROCKS
DO NOT CONTINUE TO (2) BEFORE YOUR INSTRUCTOR CHECKS YOUR WORK 2 In the spaces below list the sample numbers that occur in each group
Clastic Sedimentary Rocks
Chemical Sedimentary Rocks
Keep the rocks on these trays You will be asked to use one tray or the other for Part B 3 Use the clastic rock tray Pick up each specimen and look at the size of the grains (the
fragments of which it is composed) Use a magnifying lens and ruler to measure size of the grains Separate the clastic specimens into two groups based on the grain size those that have large grains (big enough to distinguish without a magnifying lens) from those that have small grains (too small to see individual grains without a magnifying lens) In the spaces below list the sample numbers that occur in each grain-size group
Coarse-grained Clastic Rocks
Fine-grained Clastic Rocks
4 Study one of the coarse-grained clastic rock samples Indicate which one you chose
Describe and sketch this specimen showing the grains and the surrounding material
6-6
5 Use the chemical sedimentary rocks Because they form from a wide variety of processes some chemical sedimentary rocks are Inorganic or crystalline (appear homogeneous) while others consist of Organic material including plant material shells and shell fragments Separate the chemical sedimentary rocks that are crystalline from the ones that are organic and write the specimen number in the table below
Inorganic (or crystalline) Chemical
Sedimentary Rocks
Organic Chemical Sedimentary Rocks
Limestone is the most abundant chemical sedimentary rock It is made of the mineral calcite
Calcite reacts with hydrochloric acid (HCl) When a drop of dilute HCl is placed on calcite it fizzes vigorously This is a good test for limestone Limestone comes in many different varieties which form by numerous processes The calcite can precipitate directly from seawater form as dripstone in cave formations or be incorporated into shells by marine organisms After an organism dies its shell can become calcite sediment Calcite also sometimes precipitates in the spaces between clastic grains as cement to hold the rock together 6 Test all of the sedimentary rocks with HCl and briefly describe your results List the
samples that react to HCl and describe the nature of the fizzing (vigorous or minimal) SAFETY NOTE Although dilute HCl is not dangerous it can irritate skin and occasionally cause damage (small holes) to fabricclothes Be careful when using it Please rinse your table top off if any spilt on it
HCl tests on chemical rocks
HCl tests on clastic rocks
6-7
Part C ndash Classification of Sedimentary Rocks
(NOTE you do not have specimens of every rock included in the classification tables) Activity 1
1 Classification of sedimentary rocks starts with determining if the rock is clastic or chemical
2 Begin your identification by describing the texture (grain size and shape) and composition (color of sediments) of the rocks listed in Table 6
3 Identify the rocks in the study set using the classification charts (Table 2 and 3) and your description
4 Complete Table 4 with the correct rock names including terms that describe special features of note about a rock is appropriate
Clastic Sedimentary Rocks are made from deposits of broken andor weathered rock Clastic rocks are first classified by the size and shape of the particles and secondly by the composition of the particles within the rock
Table 2 Clastic Sedimentary Rock Classification
Particle Size Characteristics Rock Name
gt 2mm (bb size) Grains are angular Breccia (say brech-chia)
Grains are rounded Conglomerate
2 mm to nearly microscopic
Sand grains consisting of pure quartz Quartzose Sandstone
Sand grains consisting of dark fragments and quartz Lithic Sandstone
microscopic Typically layered and soft MudstoneShale
6-8
Chemical Sedimentary Rocks are derived from material that had been dissolved in water They are composed of crystals that precipitated from water by physical or organic processes They may have formed when water evaporated in shallow lakes leaving chemicals behind to form evaporite deposits They are also are formed by organisms extracting dissolved material to create their hard parts For this reason deposits of shell debris or plant material are considered chemical sedimentary rocks In some cases the shell material is easily observable but in other cases the shells cannot be seen without a microscope Note that fossil-rich is used as a descriptor for any rock containing visible fossils
Table 3 Chemical Sedimentary Rock Classification
Mineral Composition Characteristics Rock Name
calcite Fizzes in HCl massive is fine grained oolitic contains small concentric balls
Limestone (use descriptors like massive fossil-rich oolitic)
calcite Dull appearance soft fizzes in HCl Chalk (not included in lab set)
calcite Composed mostly of visible shell fragments has large pore spaces fizzes in HCl
Coquina
quartz group Dense porcelain like sometimes sharp edges hardness = 7 Chert
gypsum Soft hardness = 2 Rock Gypsum (not included in lab set)
halite Translucent cubic cleavage salty taste (do not taste lab samples) Rock Salt (not included in lab set)
opal Dull appearance soft does not fizz Diatomaceous Earth (not included in lab set)
carbonplant material Glassy black brittle low density Coal
6-9
Table 4 Sedimentary Rock Description Table
Rock
Clastic or Chemical
Composition (light or dark grains)
ldquoTexturerdquo Grain Size Grain Shape Grain Sorting Rock Name
1
2
3
4
5
6
7
8
9
10
11
6-10
Name____________________________________
Lab Day _____ Lab Time_____________________ POST LAB ASSESSMENT QUESTIONS
1 List three sedimentary rocks (from table 2 andor 3) that are the most likely to contain fossils Explain why this is so in terms of composition and environment of formation
2 What is a good test to determine if a sedimentary rock is limestone Does this test cause a
physical change or chemical reaction Explain how you can tell 3 Why is the study of sedimentary rocks important for understanding how and where fossil
fuels such as oil natural gas and coal (hydrocarbons) are likely to be found
71
ES 105 Laboratory 7 INTRODUCTION TO TOPOGRAPHIC MAPS
Introduction
Topographic maps contain a wealth of information which can be valuable to those who learn how to use them Topographic maps also called contour maps represent the three-dimensional the surface of Earth on a two-dimensional piece of paper Unlike other maps topographic maps show natural features with a fair degree of accuracy in terms of width length and thickness (height or depth) Geologists make use of topographic maps as a means of studying features in three dimensions By examining the features and symbols of a topographic map a geologist can become familiar with Earth features and draw conclusions about the geologic processes that led to their formation Goals and Objectives bull Become familiar the information available on topographic maps bull Learn to use map scales to find distances bull Visualize the shape of the Earths surface using contour lines and topographic profiles bull Depict the third dimension of Earthrsquos surface from the various elements of topographic maps Useful Websites bull httpwwwtopozonecom bull httptopomapsusgsgov bull httpergusgsgovisbpubsbookletssymbols
72
Name____________________________________ Lab Day _____ Lab Time_____________________
Pre-lab Activities Complete these before coming to lab Find the following unit equivalents
1 mile = ________________ feet 1 km = ________________ meters
1 foot = ________________ inches 1 meter = ________________ centimeters
1 mile = ________________ kilometers 1 km = ________________ miles
1 inch = _______________ centimeters 1 cm = ________________ inches
1 Convert 7920 feet to miles (Hint see following page is you donrsquot know how to do this) Show each step or combined steps needed to complete the conversion
2 If a map has a scale of 124000 how many miles does 75 inches on the map represent
Show your calculations with units
3 If a stream channel is 50 feet lower elevation at one location than at a point 25 miles upstream of that location what is the gradient of the stream between those two sites Show your calculations with units
4 Define the following terms with respect to stream systems
a Velocity
b Discharge
c Gradient
73
Activity 1 Compare this list of steps to convert 15 inches into feet to the table below
1 Write 15 inches as a fraction using a horizontal fraction bar (see 1 in table)
2 Put a multiplication sign after the fraction aligned with the fraction bar Write another fraction bar after the multiplication sign using a horizontal line (see 2 in table)
3 Choose the unit equivalent needed to convert from the information above (see 3)
4 Write the lsquoinchesrsquo part of the unit equivalent on the opposite side of the second fraction bar as lsquoinchesrsquo is in relation to the first fraction bar Write the lsquofeetrsquo part of the unit equivalent on the opposite side of the second fraction bar as its equivalent inches has been written (see 4 in table)
5 Put an equal sign after the expression multiply as indicated and cross out any things found both above and below the fraction bar as a matching pair (both units and factors) Be sure to put the units remaining (feet in this example) after the final product (see 5)
Table 1
1 2 3 4 5
1in 15
times
1in 15 1 foot = 12 inches
in12ft 1
1in 15times ft 251
in 12 ft 1
1in 15
=times
Problems
1 Now use this method to convert 7920 feet to miles You can show each step or combine steps to complete the conversion as show in number 5 of the above table
Use this method to do unit conversions throughout this lab Remember to include units
74
Part A mdash Scale A topographic map is a smaller representation of a larger area The map scale is the
relationship between distance on the map and the corresponding distance on the ground The two types of map scales that are useful to the geologist are ratio and bar scales The ratio scale written 112000 for example means that one inch on the map equals 12000 inches (1000 feet) on the ground A bar scale is a line with units of distance (feet miles kilometers) marked on it The bar scale allows easy conversion of map distances to true ground distance On a topographic map both the ratio scale and the bar scale are provided in the center of the bottom margin Show your calculations and include units with numbers for these questions
1 A ratio scale of 124000 means 1 inch on the map is equal to _____________ inches on the ground
2 Convert ratio scale of 124000 to a verbal scale with 1rdquo =( how many feet)
3 Complete the table below Show calculations with units on the right side of the table
Ratio Scale Verbal Scale Math work
124000 1inch = feet
A ratio scale of 162500 means 1 inch on the map is equal to inches on the ground Convert to 1 inch = how many feet Record below in and show calculations with units
162500 1 inch = feet
Convert a map scale of 1 inch = 1 mile to a ratio scale Record below and show calculations with units
1 1 inch = 1 mile
1 In the space below draw a six inch long line Use a ruler Make this line into a bar scale using
2 inches = 1 mile Subdivide the entire scale into quarter mile sections and label the origin the divisions of the first mile and the whole miles for the rest of the scale
2 On the bar scale above one quarter inch equals ________ miles Convert this to feet Record this in the table below Also determine what is the ratio scale for this bar scale (Hint convert to inches) Show your calculations with units
Verbal Scale Ratio Scale Math work
frac14 inch = 1
75
Part BmdashTopographic Maps Topographic maps use contour lines to depict three-dimensional features on a flat piece of
paper Contour lines connect points of equal elevation on the ground surface which means for example that every point on a 60 foot contour line is 60 feet above sea level Therefore a single contour line on the map shows how and imaginary horizontal plane would intersect the Earths surface are that particular elevation The contour interval is the difference in elevation between two contour lines The contour interval on a given map is constant for the entire map The contour interval chosen depends on roughness of the terrain or relief which is defined as the difference in elevation between the highest and the lowest points on a map
______________________________________________________________________
THE FOLLOWING ARE IMPORTANT RULES ABOUT CONTOUR LINES
1 Every point on a single contour line connects points on the map that are exactly the same
elevation on the ground 2 Contour lines separate areas of higher elevation from areas of lower elevation You can
determine direction of slope of a hill by checking the values of the adjacent contour lines 3 The contour interval (the elevation between two adjacent contour lines of different
elevation) is constant for the topographic map The contour interval is chosen by the map-maker based upon the relief of the map (the difference in elevation from the highest point to the lowest point on the map)
4 Contour lines must be counted consecutively (none can be skipped) Heavier contour lines speed up counting of contour lines usually every fifth contour line is drawn heavier
5 Contour lines never cross each other (except in the very rare case where the mapped area contains an overhanging cliff) Contour lines will merge into a single contour line where mapping a vertical cliff (also a rare occurrence)
6 The spacing of contour lines reflects the steepness of slopes Widely spaced contour lines represent a gentle slope closely spaced contour lines reflect a steeper slope Evenly spaced contour lines represent a uniform slope
7 Contour lines make a V pointing upstream where they cross a channel or valley 8 Depressions (lower elevation areas enclosed within higher elevation areas) are marked by
hachures on the inside of contour lines 9 Contour lines either enclose an area (as a hill top or a depression) or they end at the map
edge On a large enough map they would all make closed forms
Activity 1 Locate areas on the Monmouth quadrangle that shows what is described in Contour Rules (4 6 7 8 and 9) above Discuss locations with lab partners and if you are not able to locate an example of rule PLEASE CHECK WITH LAB INSTRUCTOR
76
Activity 2mdashConstruct a Topographic Map from surveyed data points On Figure 1 draw all the contour lines in pencil using a contour interval of 20 feet If you have a pen put it away and get a pencil (Only one who is perfect in every way contours with a pen) Study the map and locate the higher and lower areas Refer to the rules on the previous page to assist you If you are having trouble see the sample exercises for the last website listed in the introduction to Lab 4 Lightly draw in contour lines starting either at the high elevations or the low elevations Make changes where you realize you missed a feature Use an eraser When you are finished (and satisfied) darken and label the contour values neatly
Figure 1 Topographic map construction
77
Activity 3mdashConstruct a Profile from a Topographic Map Profiles are made to illustrate the shape of the surface of the earth between two designated points These two points are at the ends of the line of profile which is drawn and labeled on the map The line is used in the construction of the profile To construct the profile use each intersection of a contour and the line of profile on the map Project a perpendicular line from this intersection to the horizontal line having the same elevation as that contour line Make a dot on the profile for each intersection of a contour line and the line of the profile as drawn on the contour map Remember to include information implied by the map NOTE where the profile crosses a stream channel the elevation is between two contour lines (The stream channels are shown by dot-dash lines) Hilltops and the ends of the profile also have implied information After all the dots are made on the profile connect the dots by a smooth line which represents the profile of Earths surface On Figure 3 draw a profile for the dashed line A to A in Figure 2 Be sure to label both ends of the profile and the elevations at the side of the profile
Figure 2 Topographic map with profile line drawn and labeled
100
90
80
70
60
50
40
30
20
10
Figure 3 Topographic profile AmdashArsquo from Figure 2
78
Part C mdash Additional Information on Topographic Maps Topographic maps are produced at various scales (124000 163360 etc) that represent different areas of coverage Common sizes are 75 minute and 15 minute (Discontinued) describing latitude and longitude dimensions and are given locality names (such as ldquoMonmouthrdquo) usually for some prominent town or geographic feature in the mapped area In this part of the lab you will study a US Geological Survey quadrangle that illustrates the kind of information available on these maps
Map study and use requires an understanding of latitude and longitude Lines of latitude and longitude form an imaginary grid system with lines that are measured in degrees of arc from a reference Any point on Earth may be pinpointed to its exact location by its latitude and longitude Latitude lines are oriented in an east-west direction They are parallel to one another with the equator designated 0 degrees and increasing in degree measurement to the poles at 90 degrees Those in the northern hemisphere are north latitude and those in the southern hemisphere are south latitude Longitude lines are oriented in a north-south direction and start from 0 degrees at Greenwich England and increase in measurement both east and west up to 180 degrees on the other side of the Earth near the International Date Line Those to the east are called east longitude and those to the west are called west longitude For more exact locations degrees (o) are further broken down into minutes (lsquo) and seconds (ldquo) one degree has 60 minutes (1o=60rsquo) and one minute has 60 seconds (1rsquo=60rdquo)
If you plan to use a compass with a map for navigation is necessary to understand the concept of magnetic declination The compass needle when pointing north actually points to magnetic north the magnetic pole of Earth not to true north or geographic north which is Earths axis of rotation These two norths are not located at the same place and magnetic north moves over time The declination is the angle of correction needed because topographic maps are drawn aligned to geographic north which is toward the top and parallel to the left and right margins of the map Because magnetic north moves knowing the date the declination is accurate is important also Study the Monmouth Oregon Quadrangle and answer the following questions
1 __________________
2 __________________
3__________________
4 __________________
5 __________________
1 Who published this map
2 What year was it published
3 What is the latitude of the northern boundary of this map
4 What is the latitude of the southern boundary of this map
5 How many degrees of latitude are along the eastern edge (HINT subtract southern edge latitude from northern edge latitude)
6 __________________
7 __________________
8__________________
9 __________________
6 What is the longitude of the west side of this map
7 What is the longitude of the east side of this map
8 How many degrees of longitude are along the southern edge
9 What is the contour interval
79
10 _________________
11 _________________
12 _________________
13 _________________
14 _________________
10 How much vertical distance separates the lighter contour lines
11 How much vertical distance separates heavier contour lines
12 What is the highest elevation shown on the map (Look in NE)
13 What is the lowest elevation (Follow river downstream)
14 What is the relief of this map (subtract lowest elevation from the highest elevation)
15 _________________
16a _________________
16b _________________
16c _________________
16d _________________
17a _________________
17b _________________
17c _________________
17d _________________
18 _________________
19 _________________
20 _________________
21a _________________
21b _________________
22 _________________
23 _________________
15 What is the value of the declination (in degrees) shown
In the area to the left sketch how declination is indicated on the map
16 What is the map scale in (Show math work with units here)
a inches to inches
b feet to feet
c inches to feet
d inches to miles
17 What is the name of the quadrangle to the a south
b east
c northwest
d west
18 What is the approximate elevation of the town of Monmouth
19 What is the elevation of the benchmark located at the intersection of
Main St and Monmouth St in Independence
20 How many miles is it along Hwy 99W from Main St in Monmouth
to where 99W crosses the Luckiamute River
21 What is the distance (21a in miles) and (21b in Kilometers)
between the top of Cupids Knoll and Fircrest Cemetery
22 What is the elevation of Cupids Knoll
23 Which side would be easiest to climb Explain why
710
Part D mdash Learning about rivers from topographic maps Note Chucksney Mountain Salem and Sauvie Island Quadrangles are 124000 scale maps
1 On the Chucksney Mountain Quadrangle look at the tributaries that drain into the North Fork of the Middle Fork of the Willamette River (in the Southwest corner of the map) Then look at the width of the Willamette River channel in the Salem and Sauvie Island Quadrangles Does the width of the river channel increase or decrease when going downstream towards the mouth of the Willamette
2 Use the contour lines on the Chucksney Mountain Quadrangle to determine the elevation change from the top to the bottom of one of the tributaries that you observed in the previous question and record the elevation change below (Be sure to look up the contour interval on the map)
3 On the Salem Quadrangle locate Beardsley Bar and Doves Bar along the Willamette River What is the difference in elevation between these two points along the river In what direction is the river flowing
4 Does the gradient of the Willamette River increase or decrease as you go from its upper tributaries downstream towards its mouth
5 What type of stream channel do the tributaries in the Chucksney Mountain Quadrangle have Circle the correct choice below
a Braided stream channel
b Steep gradient bedrock channel
c Low gradient meandering stream channel
6 What type of channel does the Willamette River have in the Monmouth and Salem Quadrangles Circle the correct choice below
a Braided stream channel
b Steep gradient bedrock channel
c Low gradient meandering stream channel
711
Name____________________________________
Lab Day _____ Lab Time_____________________ 7a Post-Lab Assessment
1 Imagine you were hiking with friends and became separated from your hiking companions If you had a topographic map of the area what clues on the topographic map would you use to arrive somewhere where you could be found
2 Would a GPS receiver be able to assist you in finding your location on the map What
information would be helpful 3 What large city is located near 40oN 116oE (Use globe atlas world map GoogleEarth) 4 In what area is 40oN 116oW 5 What coast are you near at 34oN 119oW (Name continent side of it and ocean) 6 What coast are you near at 34oS 119oE (Name continent side of it and ocean)
7 Is it important to include N or S and E or W with latitude and longitude information Why
81
ES 105 Laboratory Additional Activities APPENDIX ndash Additional Laboratory Activities Lab 1 Energy and Energy Transformations
bull No Additional Activities Lab 2 Work Motion Gravity
bull Falling Objects Spark Tape Experiment p 82 - 84 Lab 3 Objects in Motion Landslides
bull Rotational Kinetic EnergyTrack Experiment p 85 - 86 bull Landslide Prediction p 87 bull AccelerationCart Experiment p 88 - 89
Lab 4 Geologic Time
bull Relative Age Dating Exercises p 810 - 814 Lab 5 Chemical Reactions
bull Chemical and Physical Changes p 815 - 816 bull Balancing Chemical Equations p 817 - 819
Lab 6 Sediments and Sedimentary Rocks
bull Overview of Sedimentary Minerals p 820 - 821 bull Depositional Environments p 822 - 823
Lab 7 Topographic Maps
bull Rivers and Topographic Maps p 824 - 825 bull Stream Table Experiments p 826
82
Lab 2 Calculation of Acceleration due to Earthrsquos Gravity
In this activity you will study the motion of a free-falling body Using a special timer the position of the object will be recorded at even intervals of time Letrsquos call the time interval Δt (read as ldquodelta trdquo or ldquochange in timerdquo) We will use the letter y to indicate the position of the object The position at a chosen time will be called y0 After one time interval passes we refer to the objectrsquos position as y1 after two intervals y2 and so forth From the changes in positions we can compute the velocity The average velocity is determined by the change in position per change in time Δt For instance the (average) velocity after four intervals of time have passed v4 is
This equation could be read as lsquothe velocity (after fourth time interval) is the change in position (between the third and fourth time interval) over the change in timersquo Once the average velocities have been calculated these values can be used to determine the average acceleration The slope of the graph of average speed versus time gives the acceleration of the falling object Mathematically the average acceleration after the fourth time interval a4 is described by the following equation
In this part of the lab you will measure the acceleration of a free-falling body using two different methods and devices ndash a spark-tape apparatus and a picket-fencephotogate system Activity 1 Using the spark-tape apparatus to Measure Gravitational Acceleration Procedure We will drop our object a carbon-coated tape approximately 2 meters As the tape falls a spark generator produces sparks at even time intervals These produce marks on the tape representing equal times between each spark The result is pictured below Figure 1 The distance between two successive marks indicates the distance fallen in a particular time interval The time interval Δt is given on the knob on the spark timer It is a fixed time interval (typically Δt = 130 sec = 0033 seconds) Ask your instructor to verify the value for Δt Your instructor will help you drop the tape and produce the marks You should have at least 9 marks on your tape
v y yt4
4 3=minusΔ
a v vt4
4 3=minusΔ
83
y1
y2
y3
y4
y5
y6
y7
Tapersquos initial position(big burned spot)
1st clearly identifiable (position y0)mark after initial position mark
Last spark on tape
Figure 1 Schematic representation of spark tape resulting from free-fall apparatus Note The first mark (the prominent burned one) gives the tapersquos initial position However the weight
was released at a random time Furthermore the second mark may be covered up by the first mark
(What you think is the 2nd mark may actually be the 3rd mark) Hence you canrsquot rely on total elapsed
time or the position of the next mark after the first mark However you can rely the on time intervals t
and distances between successive marks
Analysis Lay the tape flat on the table You may wish to secure it with masking tape Locate the initial mark Now find the next clearly identifiable mark -- probably the 2nd or 3rd mark after the first (prominent) mark This will be position yomdashlabel it accordingly Place a meter stick along the tape in preparation to measure the y-distances (as shown above) from yo to other mark locations See the diagram above Complete Table 1 for at least seven data points (Hopefully you will have more data points than seven) Measure the distances very carefully enter them into your table Be sure to record all your distances in meters NOTICEΔt is always the same value (probably 00333 sec -- but check with your instructor) NOTICE that all the distances in column 2mdashthe lsquoy (meters)rsquo columnmdashmust be in meters Fill out the rest of the table Δt is the same number of seconds for every point
84
Table 1 Δt
(sec) y
(meters) Δy v=ΔyΔt (meterssec)
Δv a=ΔvΔt (meterssec2)
301
y0 = 0 No Data No Data No Data No Data
301
y1 = 01 yy minus = 1v = No Data No Data
301
y2 = 12 yy minus = 2v = 12 vv minus =
301
y3 = 23 yy minus = 3v 23 vv minus =
301
y4 = 34 yy minus = v4= 34 vv minus =
301
y5 = 45 yy minus = v5= 45 vv minus =
301
y6 = 56 yy minus = v6= 56 vv minus =
301
y7 = 67 yy minus = v7= 67 vv minus =
301
y8 = 78 yy minus = v8= 78 vv minus =
301
y9 = 89 yy minus = v9= 89 vv minus =
301
y10 = 910 yy minus = v10= 910 vv minus =
Note about calculations 301
divide is the same as x 30
Compute an average of the accelerations in your table Letrsquos call this number the acceleration due to gravity The acceleration due to gravity is _______________________ in units of ________________ There You did it You measured the acceleration due to gravity
85
Lab 3 Rotational Kinetic Energy Determination
1 Surprise The potential and kinetic energy are not equal because we havenrsquot accounted for the energy lsquolostrsquo during motion of the ball Letrsquos calculate the rotational kinetic energy of the system by using the formula below Show your calculations be sure to include units
2R mv
51 E = ER = _______________ in units of __________________
Now add all of the kinetic energy (EK + ER) ___________________ in units of ____________ 2 How does the sum of kinetic energy (EK + ER) compare to the initial potential energy Is the
total energy conserved What other energy factor(s) havenrsquot we accounted for yet (HINT why does the ball slow down as it is rolling)
3 What would be the potential energy in the system if the ball were positioned at a height of 01
meters Show your calculations be sure to include units (Your answer should be in Joules) Predicting the Final Velocity of the Ball Because the total energy is conserved you know that at the beginning the total energy is only gravitational potential energy At the end of the experiment the ball has no altitude (h = 0 above the horizontal table) so all the energy is in the form of kinetic energy Since the total energy at the beginning must be equal to the total energy at the end we can say
Potential energy (EP) at beginning = Kinetic energy at end (both rolling + translation)
Or mgh = 22KR mv
51mv
21 EE =+=+ This simplifies to mgh = 2mv
107
Solving the above for the final velocity of the ball along the horizontal ramp we find
v gh=107
86
Questions
4 Using the equation v gh=107
calculate the ideal velocity on the horizontal track when the
ball is released on the ramp at h = 003 meters What are the units of the velocity 5 In reality will the velocity be higher or lower than the ideal calculation above Why 6 How did your average velocity (from table 1 pg6) compare with the ideal velocity (as
calculated in question 10 above) Comment on why it is the same or different (HINT there is more than one reason the velocity is not ideal)
7 Without calculating PREDICT what happens to the final velocity if we double the initial
height (h = 006 m) Will the final velocity increase or decrease About how much double one-half or some other value compared to when it is released from h = 003 meters
8 Support your above answer by employing the equation v gh=107
for h = 006 m
That is calculate the final velocity of the ball when it is released from 6 centimeters Be sure show your calculations and report your answer with the appropriate units
87
Lab 3 Energy of Motion and Landslides
PART C mdash Landslide Prediction Examine the cross-sectional sketch below Label in Figure 4 with numbers the positions where you might expect to find the following mass wasting processes
(1) rock fall (ie free-falling rock material) (2) soil creep (slowly moving sediment under the influence of gravity) (3) catastrophic landsliding and (4) zone of little to no chance of mass wasting processes
Figure 4 Landslide prediction diagram Questions 1 What are the chances of your property experiencing a landslide if you live in the Coast
Range of Oregon (for example somewhere between Dallas and Lincoln City) List the critical factors that apply (or donrsquot apply as the case may be) to why you think these are your chances
2 What are the chances of your property experiencing a landslide if you live in the middle of
the Willamette Valley (for example in Salem or Albany) List the critical factors that apply (or donrsquot apply as the case may be) to why you think these are your chances
88
Acceleration of a Cart If a cart moves on a plane that is inclined at an angle θ the component of force acting on the cart in a direction that is parallel to the surface of the plane is the shear force The acceleration of the cart should be given by
a = g sin θ Procedures 1 Before recording any data make sure the Motion Sensor can ldquoseerdquo the cart as it moves 2 Measure the angle the track makes with the table top Record in Table 4 below 3 Place the cart on the low end of the track and have one person start recording Have the
other group member give the cart a gentle push up the inclined plane track so the cart will move toward the Motion Sensor Keep recording as the cart moves away from the sensor
4 Stop recording when the cart returns to the bottom of the track 5 If the plot of data is not smooth check with your instructor to realign the Motion Sensor The
repeat the above procedure until the plot is smooth for the run up and then down the track 6 Erase your practice runs by clicking on the EXPERIMENT menu and selecting DELETE ALL
DATA RUNS Do NOT use the FILE menu and delete the activity 7 You are now ready to collect data Place the cart at the low end of the track Start
recording data Give the cart a gentle push toward the Motion Sensor Continue collecting data until the cart has returned to the bottom of the track This is lsquoRun 1rsquo
8 Set the track to a steeper angle and measure the angle Repeat data recording (Run 2) 9 Open the GRAPH from the left hand menu Select Data Run 1 Choose the plot of velocity
vs time Use the cursor to select the region of the plot that shows the cartrsquos motion after the push and before it stopped at the bottom of the track Determine the slope of the best fit line This slope is the acceleration of the cart (Note Units are ms2)
10 Repeat for Data Run 2 Record all data in Table 1 and answer the questions on the following page
89
Table 1 Acceleration of cart on Inclined plane
Run 1 Run 2
Angle of track (θ)
Experimental Acceleration (slope of velocity time)
Theoretical Acceleration (calculate from a = g sin θ)
Questions 1 What happens to the velocity of the cart as it moves up the inclined plane 2 What happens to the velocity of the cart as it moves down the inclined plane 3 What happens to the acceleration of the cart as it moves up the inclined plane 4 What happens to the acceleration of the cart as it moves down the inclined plane 5 How did the acceleration change when the track became steeper 6 Calculate the theoretical value for the acceleration of the cart based on the trackrsquos angle and
record it in Table 1 7 What is the percent difference between the acceleration determined in the activity and the
theoretical value for acceleration ⎟⎠⎞
⎜⎝⎛ =times differencepercent 100
ltheoreticaalexperiment-ltheoretica
(Show calculations here) 8 What is a possible explanation for the difference in these two values
810
Lab 4 Relative Age Dating Pre-lab Questions for Determining Relative Ages of Geologic Events Define the following terms prior to arriving at your lab section
Stratigraphic correlation
Principle of original horizontality
Principle of stratigraphic superposition
Principle of lateral continuity
Unconformity
Law of cross-cutting relationships
811
Determining Relative Ages of Geologic Events Another technique to determine the relative ages of geological events is the Principle of
Cross-Cutting relationships which states that any geological feature which cuts another geological feature must be younger than the cross-cut feature Stated in simple terms a loaf of bread must be older than the bread slices which transect the loaf
Activity Study the sketch on the following page LIST the sequence of geological events oldest at the bottom and youngest at the top on the table below and cite reasons for this order of events Close ups of significant relationships are shown on the following page (84)
Event Older than Because Younger
than Because
812
HINTS
bull ldquoIrdquo contains inclusions of ldquoJrdquo and ldquoKrdquo bull ldquoIrdquo changes from conglomerate at the bottom to sandstone at the top bull ldquoIrdquo does not include pieces of H
Rock Types Igneous ndash Intrusive Metamorphic
Gneiss Sedimentary
Cong ndash Conglomerate SS ndash Sandstone Sit S ndash Siltstone Sh ndash Shale Ls ndash Limestone
There are details of this cross section on the following page Working on the geologic history of smaller portions first can help you unravel the geologic history of a complicated section like the one above
ldquoBakedrdquo zone of contact metamorphism
813
Angular Unconformity Fault
Intrusions Refolded area
814
Questions Quantify some basic observations on geologic time in the spaces provided (Use dates shown in the ldquoGeologic Time Scalerdquo) Show all of your math work
___________ Based on the data given how old is the Earth (ie what is the total known
time encompassed by geologic history) Answer in billions of years ___________ What is the total duration of the Precambrian Eons (in millions of years) ___________ What is the total duration of the Paleozoic Era (in millions of years) ___________ What is the total duration of the Mesozoic Era (in millions of years) ___________ What is the total duration of the Cenozoic Era (in millions of years) ___________ What percentage of total Earth history is comprised by the Precambrian
Eons ___________ What total percentage of Earth history is marked by the presence of life in
the fossil record Show all of your math work ___________ What total percentage of Earth history is marked by the absence of life in
the fossil record Show all of your math work ___________ Homo habilis is considered by many anthropologists to be the first true
human and lived ~ 2 million years ago What total percentage of Earth history is marked by the presence of human-like species in the fossil record Show all of your math work
___________ What total percentage of Earth history is marked by the presence of
ldquomodern manrdquo Show all of your math work write the answer in scientific notation
___________ Assuming that you live to the ripe old age of 82 what total percentage of
Earth history will be marked by your presence on this planet Show all of your math work write the answer in scientific notation
815
Lab 5 Chemical and Physical Changes Exploring the Differences between Chemical and Physical Changes In this part of the lab you will work through a sequence of experiments make observations and determine whether a chemical or physical change has occurred As you progress through this portion of the lab complete Table 1 Observations on the following page Procedure 1 Take a test tube labeled iron filings and a test tube labeled sulfur from your kit These have
already been pre-weighed for you with 35 grams of the iron filings and 20 grams of sulfur Mix the two completely by grinding them together with a mortar and pestle
2 Divide the mixtures into two piles (ie aliquots) and place each on wax paper 3 Observe one of the aliquots under a magnifying glass and record your observations in table 1 4 Test the same aliquot for magnetism by passing a magnet under the paper (Please do not
remove the magnet from the Ziploc bag) Does the material appear to be magnetic Record your observations in Table 1
5 Now pour each aliquot into a test tube one aliquot into a small Pyrex test tube from your kit
the other aliquot into the soft glass test tube from your kit that is labeled ldquobreakablerdquo (Set this one aside for a few minutes)
6 Add a small amount of water to the first test tube (Pyrex tube not breakable one) cover the
end of the tube with your thumb and shake vigorously Record your observations in Table 1 7 Clean out the mortar bowl and put some cold tap water into the bowl Take the mortar bowl
with water your breakable test tube containing the dry ironsulfur mixture and a test tube clamp to one of the hoods Be sure to wear goggles
8 This step is performed under the hood Gently heat your mixture using the hottest part of
the flame (the inner blue tip) Heat your mixture until the mixture itself (not just the glass of the test tube) is producing a bright orange-red glow throughout the mixture Be patient it may take 5 or more minutes for the mixture to reach this stage Confirm with your instructor when it has reached this stage (to be sure the reaction has proceeded) Immerse the hot end of the tube into the bowl of water before it has a chance to cool This will break the end of the tube and there will be a small but exciting steam explosion
9 Carefully throw the broken glass of the test tube (but not the new compound you just created)
into one of the white glass disposal bins in the lab Using the cooled material that was in the test tube repeat the tests you performed on the original iron and sulfur mixture (examining with a magnifying lens checking the magnetic properties and mixing with distilled water in a large clean test tube) Record your observations in Table 1
816
Clean all the permanent glassware and return all the materials to your kit in a neat and tidy manner Leave the laboratory counter neat and in a condition that you could walk in and begin work immediately if you were in the next lab section Thank you Table 1 Observations of ironsulfur mixture
Material Viewed with magnifying glass
Tested with magnet Properties in water
Before Heating
After Heating
Questions 1 At what point did a chemical change occur How could you tell 2 Based on what you have observed in this laboratory exercise write a conclusion to the
experiment that summarizes how a chemical change differs from a physical change
817
Lab 5 Balancing Chemical Equations Balanced chemical equations are used to describe chemical reactions This equation tells
what substances are involved as reactants and what substances are formed as products In addition the relative proportions of molecules of each of the substances are specified The coefficients in the balanced equation give the mole ratios(comparing the number of molecules) of the various substances From these mole ratios the quantities of reactants required to produce a certain quantity of product can be determined as well as how much product can be expected when given quantities of reactants are utilized
1 Balance the chemical equations listed below by placing the correct coefficient in the space
provided in front of each substance ____ Mg + ____ O2 ____ MgO magnesium oxygen magnesium oxide ____ KIO3 ____ KIO2 + ____ O2 potassium iodate potassium iodide oxygen ____ AgNO3 + ____ Cu ____ CuNO3 + ____ Ag silver nitrate copper copper nitrate silver ___ AgNO3 + ___ NaCl ___ AgCl + ___ NaNO3 silver nitrate sodium chloride silver chloride sodium nitrate
818
Part A ndash Cooking with Chemistry Although you probably have never thought about it you carry out chemical reactions frequently in your kitchenmdashotherwise called cooking In many chemical reactions one reactant is present in a quantity that will limit the amount of products that can be formed This reactant is called the limiting reactant The concept of a limiting reactant will be explored by preparing a confection called SrsquoMORES which is a well-known camperrsquos delight Srsquomores (Sm) are a concoction of graham crackers (Gc) marshmallows (M) and chocolate pieces (Cp) The recipe can be written in the form of a chemical equation
2 Gc + 1 M + 3 Cp 1 Gc2MCp3 Where the reactants (ingredients) are Gc = graham cracker
M = marshmallow Cp = chocolate piece
And the product is Gc2MCp3 = a srsquomore If you were camping you would make a srsquomore by toasting a marshmallow on a stick over the campfire and then putting it between two graham cracker halves with three chocolate pieces When the graham cracker pieces are pressed together the hot marshmallow melts the chocolate and a gooey treat results (You will not be allowed to eat any of your srsquomores due to OSHA regulations and standard laboratory safety procedures) This part of the lab explores the results of adding proportions which differ from those specified by the balanced equation for a chemical reaction From different combinations of reactants you will predict the maximum numbers of srsquomores which can be prepared and test your prediction Procedure There are six different srsquomore stations labeled ldquoArdquo through ldquoFrdquo Be sure that all the reactants for each bag at each station are put back into the bag before proceeding to the next station Recall the proportions of reactants which follow the balanced equation above Record your results in Table 1 on pg 55
1 First use to srsquomore station A From the above proportions determine how many srsquomores
you can make from the reactants provided Write a balanced equation for the reactants in this bag including leftovers Test your prediction by assembling the reactants into srsquomores
2 Using the reactants in station B predict the maximum number of srsquomores which you will be able to prepare Again write the equation and test
3 Repeat Step 2 using the reactants in the stations C D and E
819
Table 1 Srsquomores reactions
Reactants present predicted yield actual yield
A
B
C
D
E
F
4 Write a unit conversion Reactant
moresS for each reactant
5 Predict the maximum number of srsquomores which can be prepared using the reactants in
station F Unit conversion calculations for Station F
Identify the limiting reactant in station F
820
Lab 6 Sedimentary Rock Identification
Part A ndash Overview of Minerals in Sedimentary Rocks As noted in the introduction a small number of minerals are commonly associated with sedimentary rocks including quartz (SiO2) potassium feldspar (KAlSi3O8) plagioclase feldspar (Na AlSi3O8 CaAl2Si2O8) mica (muscovite and biotite) calcite (CaCO3) halite (NaCl) and gypsum (CaSO4H2O) Table 2 is a summary of the diagnostic (ie distinguishing) physical properties that are used to identify these minerals Use the set of mineral identification tools (Table 2 nails pennies dilute HCl your eyes and intellect) and identify the names of the set of unknown mineral samples provided List your results in Table 1 (NOTE There is one example of each mineral so use the process of elimination to your advantage) Table 1 Identification of minerals commonly associated with sedimentary rocks
Sample Number
List of Diagnostic Properties(Used to Identify Each Mineral) Mineral Name
3
5
6
8
10
13
14
15
821
Table 2 Common sedimentary minerals and their diagnostic physical properties ____________________________________________________________________________ Mineral Name Diagnostic Physical Properties Quartz Harder than glass (specimen will scratch glass) SiO2 Glassy to waxy surface appearance (luster) Various colors of milky white clear smoky gray rose Potassium Feldspar Harder than glass (specimen will scratch glass) KAlSi3O8 Breaks into blocky angular pieces
(two directions of cleavage at 90o) Common varieties are salmon pink or white in color Plagioclase Feldspar Harder than glass (specimen will scratch glass) NaAlSi3O8CaAl2Si2O8 Breaks into blocky angular pieces (two directions of cleavage at 90o) Whitish to medium gray in color Parallel striations (lines) commonly visible Mica Softer than fingernail (fingernail will scratch specimen) K[Al2(Mg3 Fe3)](AlSi3O10)(OH)2 Breaks into thin sheetsflakes book-like occurrence Muscovite Mica Clear to silvery in color Breaks into thin silvery flakes
Biotite Mica Brown to black in color Breaks into thin dark flakes Calcite Softer than a penny harder than fingernail CaCO3 Breaks into rhombohedra (three directions of cleavage) Whitish in color Fizzes in dilute hydrochloricacid
(the ldquofizzingrdquo is the result of CO2 release) Halite Softer than a penny harder than fingernail NaCl Breaks into cubes (three directions of cleavage) Clear in color tastes salty (Donrsquot lick lab samples) Gypsum Very soft scratches easily with fingernail CaSO4H2O Clear to white to pink in color
May show three directions of cleavage
822
Figure 1 Environments in which sediments are deposited The diagram is not to scale
1 Abyssal Fan 9 River Channel 2 Deep Sea Floor 10 Delta 3 Reef 11 Lagoon 4 Beach 12 Barrier Island 5 Sand Dunes 13 Continental Shelf 6 Glaciers 14 Submarine Canyon 7 Alluvial Fans 15 Continental Slope 8 Flood Plain 16 Lake
You will refer to this diagram in the post-lab exercise Concentrate on the energy of the environment and the characteristics of the rocks that would form there Think about the way the environment would transport sediment grains the size sorting and shape of the grains the surface features that may be preserved etc You may want to look up some of the terms listed in the diagram in your textbook or from other sources
823
1 Study Figure 1 (previous page) and list at least two environments where the following sedimentary rocks would be deposited Think about the energy necessary to transport the grains Describe the overall characteristic of the depositional environment for each rock type
a SANDSTONE b SHALE
c LIMESTONE
824
d Lab 7Rivers and Topographic Maps Acitivity 1 The Willamette River 1 Describe stream gradient in your own words 2 How can you determine the stream gradient from a topographic map What information do
you need to know Express stream gradient mathematically 3 On the Chucksney Mountain OR Quadrangle determine the gradient of a tributary of the
North Fork of the Middle Fork of the Willamette River Look in the southwest corner of the map and find a stream that drains into the fork of the Willamette Show your calculations Also state the type of channel (see previous page for channel descriptions)
4 Determine the gradient of the Willamette River on the Salem OR Quadrangle between
Beardsley Bar and Doves Bar Show your calculations and describe the channel type 5 Use information on the Sauvie Island OR Quadrangle to determine the gradient of the
Columbia River between the mouth of the Willamette River and the point where it enters the Pacific Ocean Assume the distance between these locations is 100 hundred miles (Hint what is the elevation of the mouth of the Columbia River) Show your calculations
6 Study the gradient channel type and channel size of the three segments of the
WillametteColumbia River system Write a brief paragraph summarizing how these variables change as you move downstream in a river system
825
Activity 2 River Features Examine the Monmouth Oregon Quadrangle which shows many features associated with a moderately large river and answer the following questions
1 Locate the area along the Willamette River east of Independence What is name given to this river-formed feature (HINT Refer to the discussion of channel features earlier in lab)
2 Is this feature likely to change its shapeposition in the future In which direction will it
migrate and how can you tell Should folks in Independence be worried 3 Where would you expect an oxbow lake to form on the Luckiamute River in the near future
Describe location with direction and distance from landmarks Why did you pick this location
4 Several stream terraces are located along the course of the Willamette River associated
with periods of deposition and incision of the valley floor during the Quaternary Using the Monmouth quadrangle try to locate at least two (there are more) of these terraces by stating their general location and an approximate elevation
5 Sketch a topographic profile (cross section) from the top of Davidson Hill southwest across
the valley of the Luckiamute River (south central portion of map) Indicate the type of materials (solid bedrock and alluvial sediment) you would expect to find underlying various portions of your cross section based on their relative elevation slope and position with respect to the Luckiamute River
826
Lab 8 Stream Table Experiment on Sediment Transport Determine Effect of Flow Velocity on Mode of Sediment Transport and Stream Competence Visible sediment grains move through a channel as either bed load (rolling sliding or saltation (ie bouncing like a jumping bean)) or suspended load Reduce the discharge to a minimum by pinching the tube so the current is moving only a few grains
In the table below record how the sand-sized sediment is being transported under Low flow conditions Use some chalk dust to observe suspended load transport under Low flow conditions Increase the discharge to a Medium flow by squeezing the tube about half way Again record your observations for how the sand-sized sediment moving Increase the discharge to High flow by releasing the tube completely Once again record on the table how the sand-sized grains are moving
Table 1 Sediment Transport Record how the sand-sized sediment is being transport for each condition
Discharge Condition
Sand-Sized Bed Load
Sliding Rolling Saltation
LOW
MEDIUM
HIGH
Question 1 Describe how the transport mode and behavior of sand changed under each new flow
condition Consider the amount of grains moving and how the transport mode changed with increasing discharge
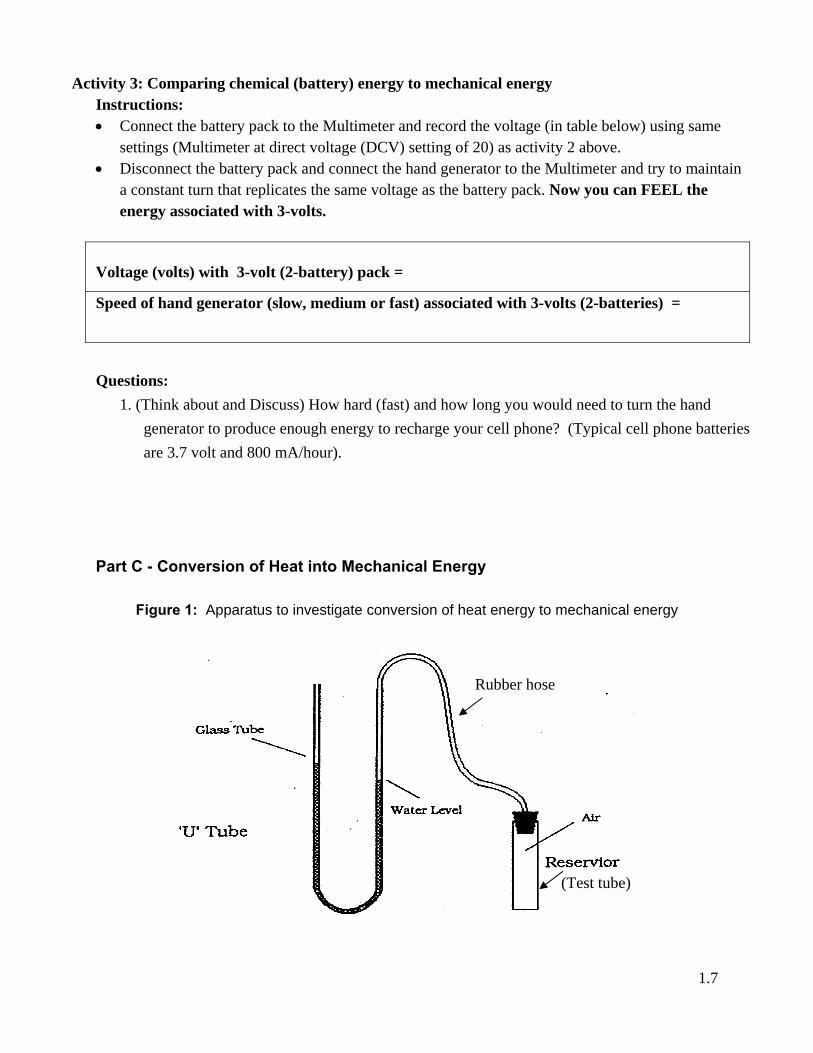
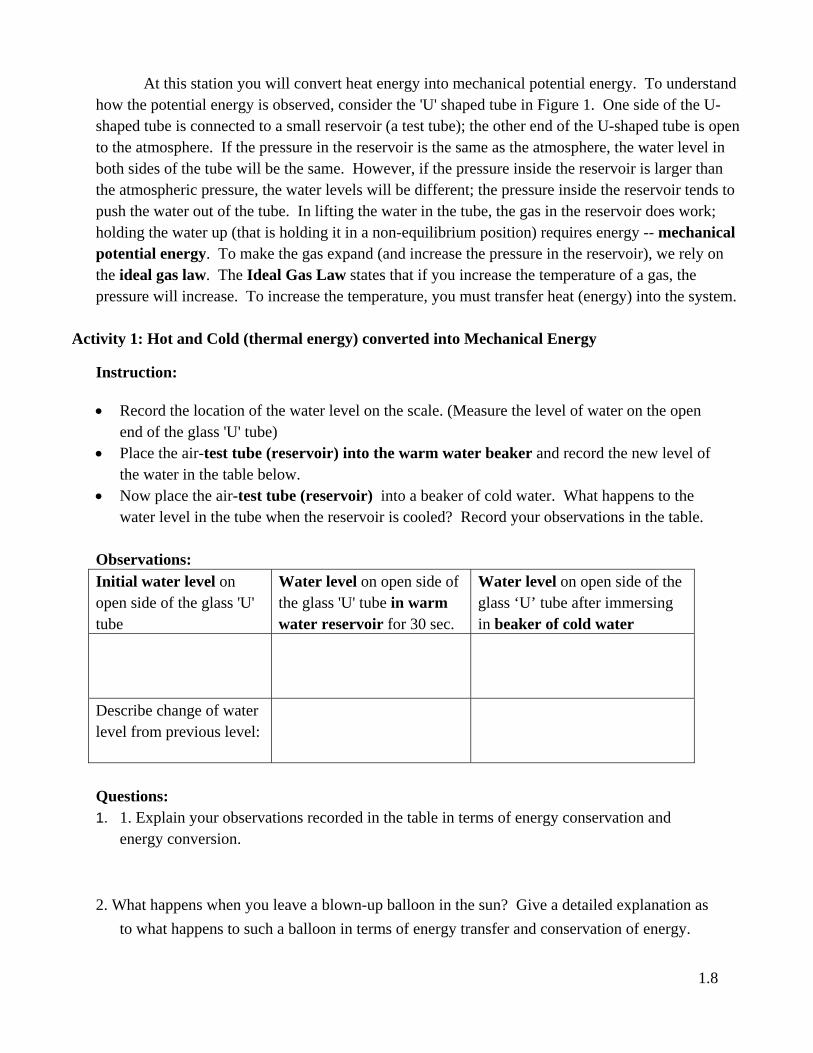
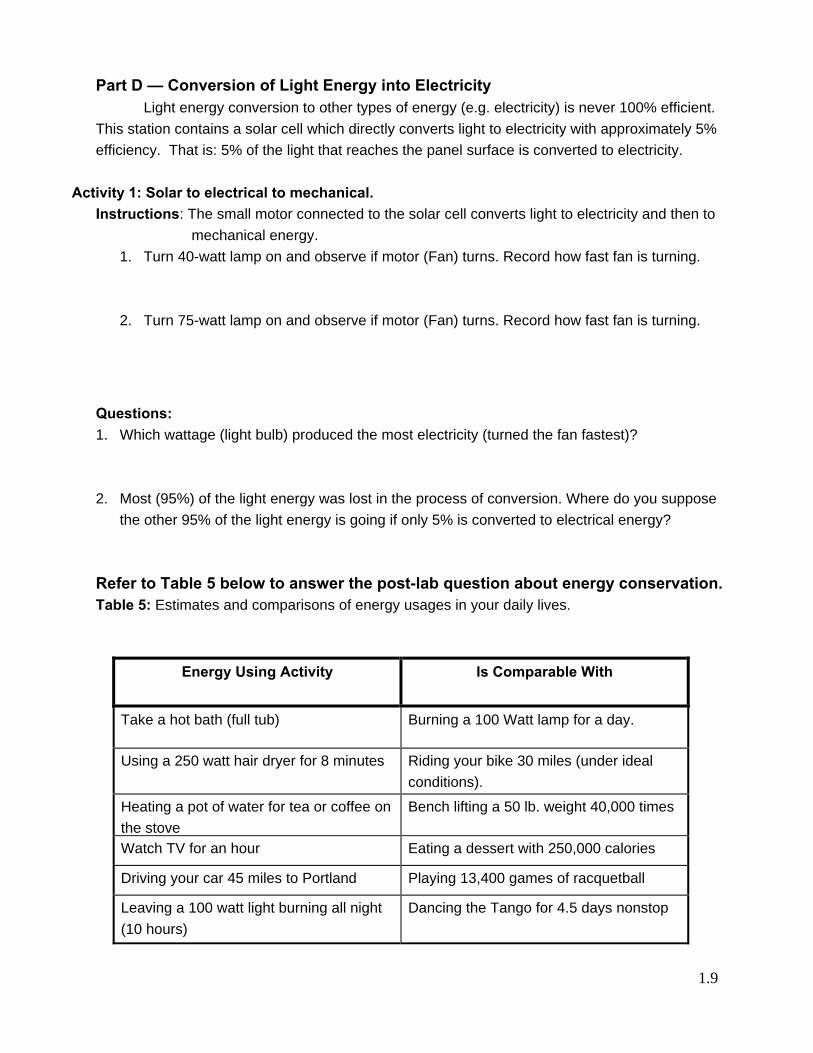
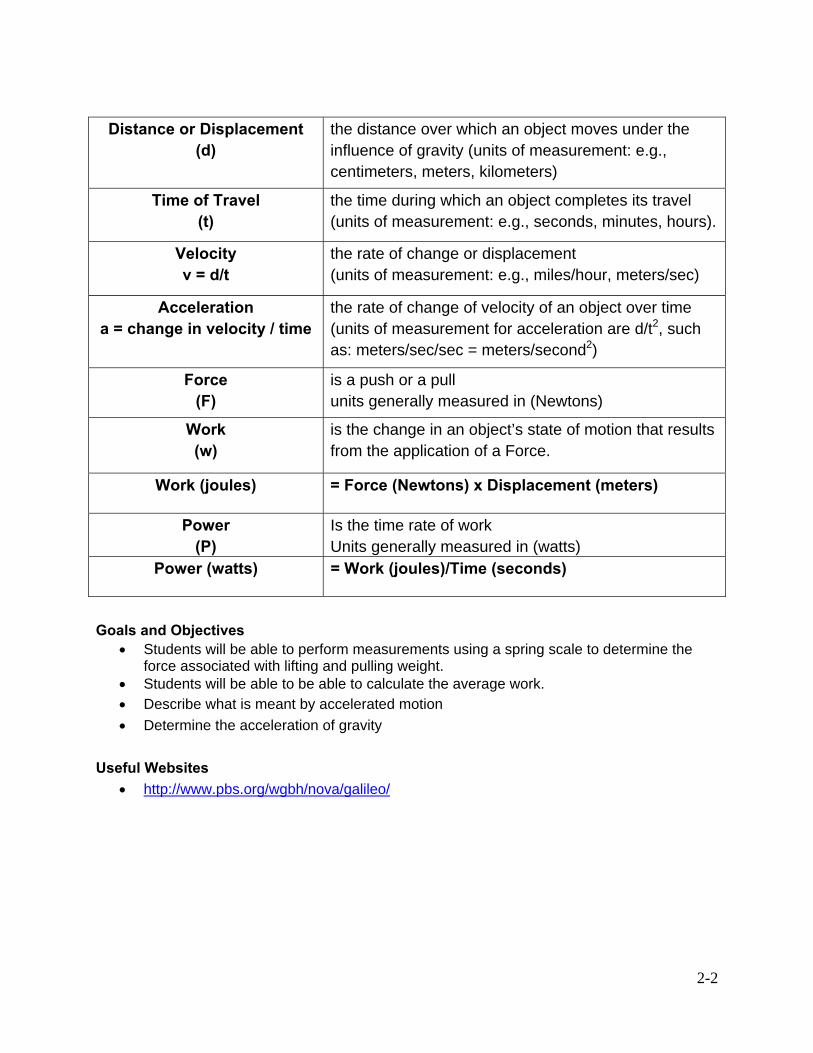