Earth Observation & forecasting Storm Surges in … · Earth Observation & forecasting Storm Surges...
26
Earth Observation & forecasting Storm Surges in the North Western Pacific Mr. Nadao Kohno Japan Meteorological Agency
Transcript of Earth Observation & forecasting Storm Surges in … · Earth Observation & forecasting Storm Surges...
Earth Observation & forecasting Storm Surges in the North Western Pacific
Mr. Nadao Kohno Japan Meteorological Agency

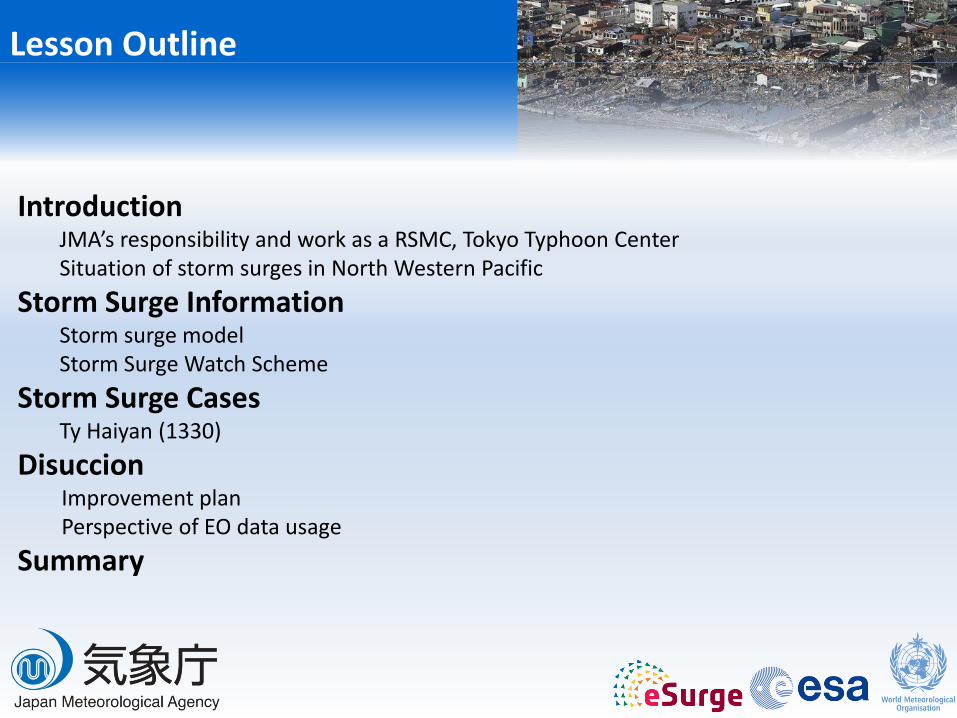
Lesson Outline
Introduction JMA’s responsibility and work as a RSMC, Tokyo Typhoon Center Situation of storm surges in North Western Pacific
Storm Surge Information Storm surge model Storm Surge Watch Scheme
Storm Surge Cases Ty Haiyan (1330)
Discussion Improvement plan Perspective of EO data usage
Summary

RSMC Tokyo - Typhoon Center
Typhoon Center: a Regional Specialized Meteorological Centre (RSMC) To carry out specialized activities in analysis and forecasting of western North Pacific tropical cyclones (TCs) ( within the framework of the World Weather Watch (WWW) Programme of the WMO.) The Center was established in July 1989, following a designation by the WMO Executive Council at its 40th session (Geneva, June 1988). The Center conducts the following operations : Preparation of information on the formation, movement and development of tropical cyclones and associated meteorological phenomena Preparation of information on synoptic-scale atmospheric situations that affect the behavior of tropical cyclones Dissemination of the above information to National Meteorological Services (NMSs), in particular to the Members of the ESCAP/WMO Typhoon Committee.

Tropical Cyclones in NW Pacific
The NW Pacific is the most active region for tropical cyclones (typhoons).

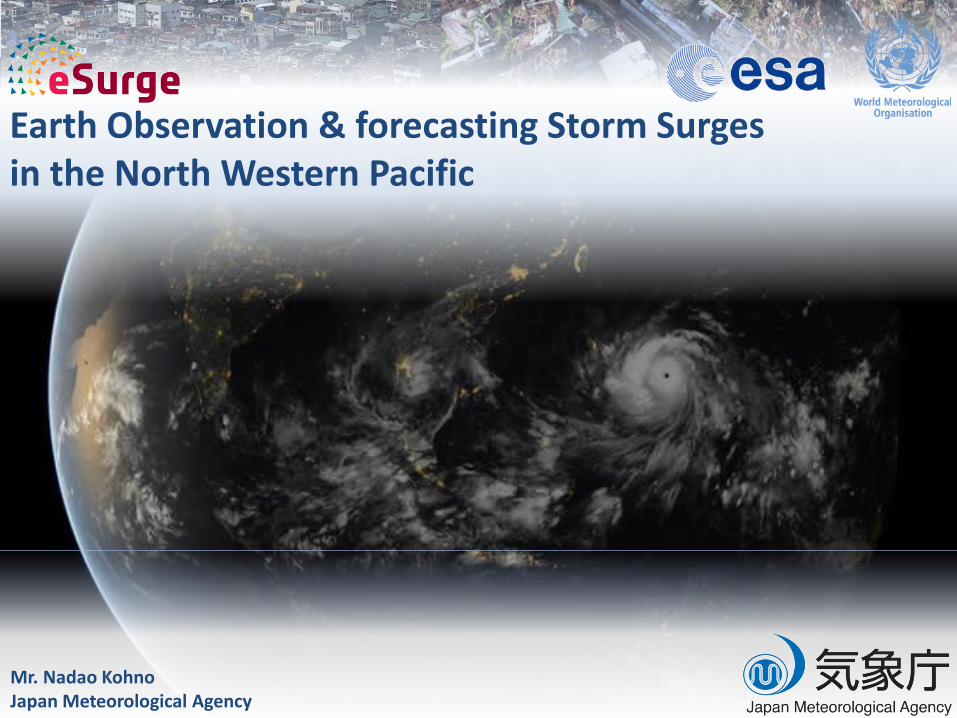
Geographic condition

Geographic condition
The area vulnerable to storm surge
large storm surge
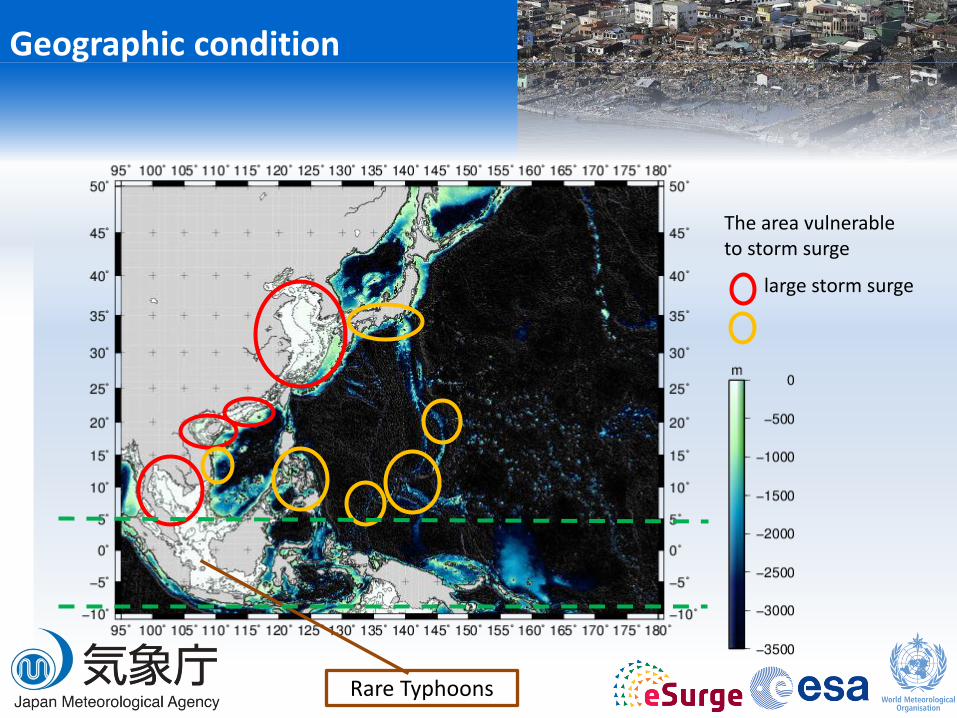
Geographic condition
The area vulnerable to storm surge
large storm surge
Rare Typhoons
Geographic condition
The area vulnerable to storm surge
large storm surge
Typhoons
Mid-latitude lows
Rare Typhoons
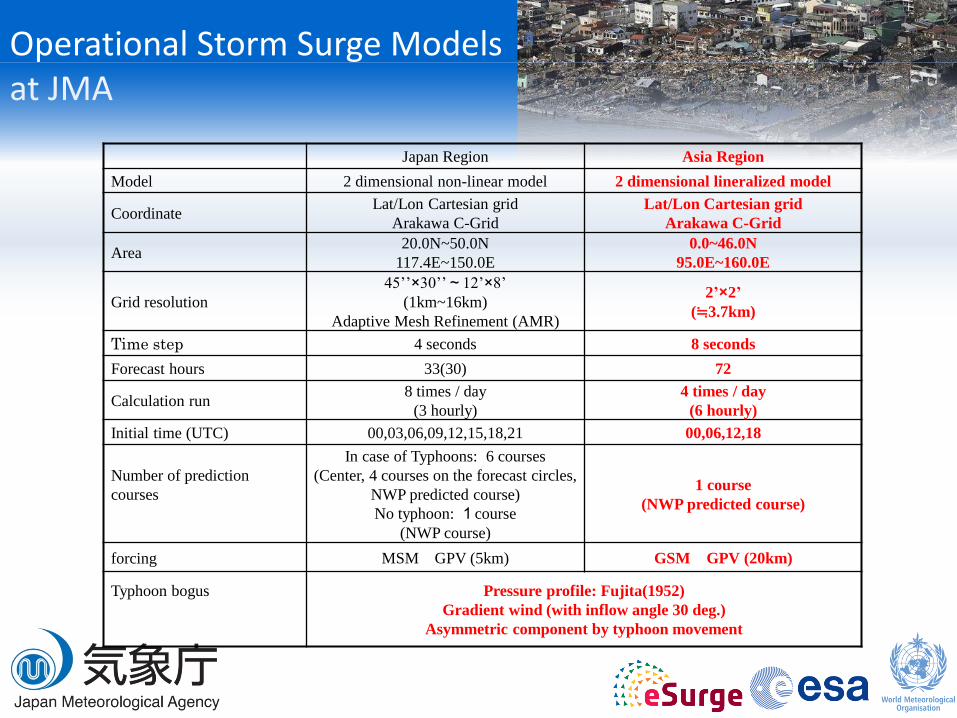
Operational Storm Surge Models at JMA
Japan Region Asia Region
Model 2 dimensional non-linear model 2 dimensional lineralized model
Coordinate Lat/Lon Cartesian grid
Arakawa C-Grid
Lat/Lon Cartesian grid
Arakawa C-Grid
Area 20.0N~50.0N
117.4E~150.0E
0.0~46.0N
95.0E~160.0E
Grid resolution
45’’×30’’~12’×8’
(1km~16km)
Adaptive Mesh Refinement (AMR)
2’×2’
(≒3.7km)
Time step 4 seconds 8 seconds
Forecast hours 33(30) 72
Calculation run 8 times / day
(3 hourly)
4 times / day
(6 hourly)
Initial time (UTC) 00,03,06,09,12,15,18,21 00,06,12,18
Number of prediction
courses
In case of Typhoons: 6 courses
(Center, 4 courses on the forecast circles,
NWP predicted course)
No typhoon: 1course
(NWP course)
1 course
(NWP predicted course)
forcing MSM GPV (5km) GSM GPV (20km)
Typhoon bogus
Pressure profile: Fujita(1952)
Gradient wind (with inflow angle 30 deg.)
Asymmetric component by typhoon movement

WMO Storm Surge Watch Scheme (SSWS)
Real-time storm surge information issued for TC Members by the RSMC Tokyo
Storm surge distribution maps (2011.6 -)
Storm surge time series charts (2012.6 -)
History 2008.6 60th WMO Executive Council (Geneva, 2008.6)
Request to WMO/SG to facilitate development of Storm Surge Watch Scheme.
2008.12 14th Regional Association II (Tashkent)
2009.1 41st Typhoon Committee (Chiang Mai)
plan for the establishment of a Regional Storm Surge Watch Scheme suitable for the TC region.
2010.1 42nd Typhoon Committee (Singapore)
request to Members of providing tidal data & bathymetric data to RSMC Tokyo.
(System development in JMA)
2011.6 RSMC Tokyo has started operation to provide storm surge distribution maps through its Numerical Typhoon Prediction (NTP) website.
2012.6 RSMC Tokyo has started to provide storm surge time series charts at one point for each TC Member (forecasting points to be increased in due course).
2013.6 RSMC Tokyo extended forecasting region and added seven stations for time series charts.
Global Spectral Model (GSM)
Typhoon Information
Asia Region Storm Surge Model
•2 min. resolution (3.7km) •72 hours forecast •3 hourly product •4 times run a day (00/06/12/18 UTC)
Sea Level Pressure winds
Locations, Central pressure, wind etc

Product examples(1)
Horizontal storm surge maps - Whole domain maps and enlarged ones around a typhoon (3hourly, up to 72 hours) are provided.
JMA Numerical Typhoon Prediction (NTP) Website
(Only TC members are available.)
(a) storm surge map (whole) (b) enlarged map
(a)
(b)
(The map data can be downloaded.)

Product examples(2)
Time series charts at selected stations -Predicted storm surges / tides, astronomical tides, sea level pressures and winds are provided
Current ten stations: 10 stations
Macao, Quarry Bay (Hong Kong), Hua Hin, Chum Phon (Thailand),
Incheon, Boryeong, Mokpo, Busan, Jeju, Sokcho (Korea)
9 stations (Philippines), 20 stations (Vietnam),
and 1 station (Guam) are going to be added in 2014.
Stations will further increase upon request from TC Members
Example of a time series data at Quarry Bay (Hong Kong)
(a)
(b)
(a) Predicted (red) and astronomical (blue) tides (b) Storm surges (green), surface pressure
(orange) and wind barbs

Summary (1)
• NW Pacific is one of the most active region TCs are active.
• In Northwestern Pacific, storm surges are generated by typhoons and mid-latitude lows. The typhoons in high latitude become Extra-Transitioning, whose structure (wind fields) are different from those of typical tropical cyclones.
• In Northwestern Pacific, many places are fear of storm surges. Those areas are classified to two groups:
(1) the coast where faces to large shallow water regions, such as East China Sea, East China Sea and so on (2) Islands or small bays but typhoons directly hit there and generate storm surges.

Storm surges by Typhoon Haiyan (1330)
Bathymetry of the Philippines
880
900
920
940
960
980
1000
1020
0
20
40
60
80
100
120
140
最大風速[kt]
暴風域[nm]
気圧
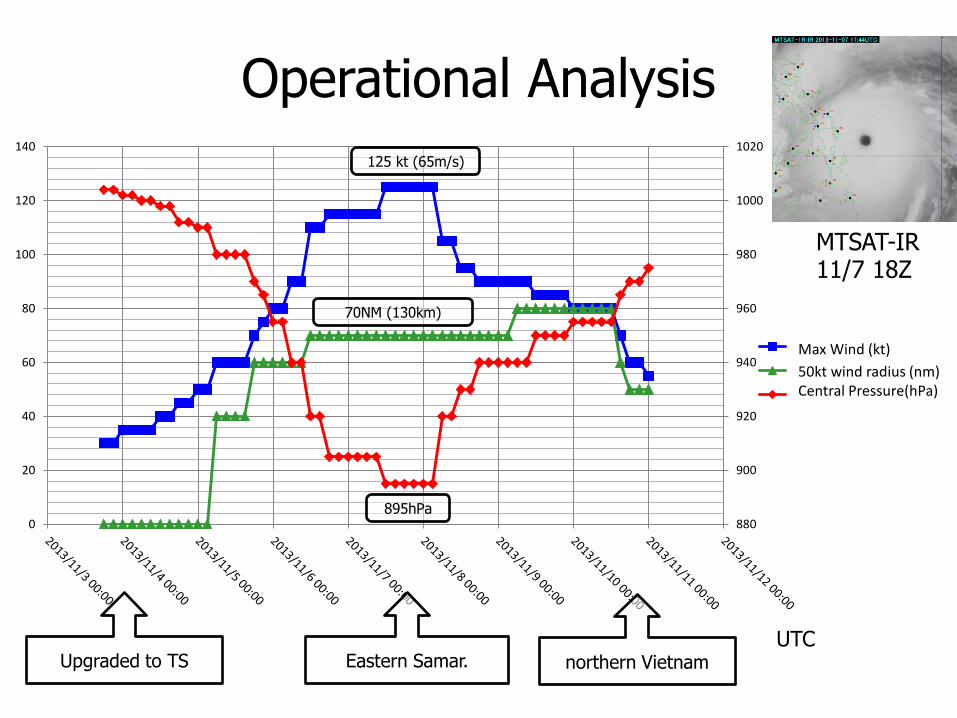
UTC Eastern Samar. northern Vietnam
895hPa
125 kt (65m/s)
70NM (130km)
Max Wind (kt)
50kt wind radius (nm) Central Pressure(hPa)
Upgraded to TS
Operational Analysis
MTSAT-IR 11/7 18Z

Storm surges in Philippines by Ty Haiyan
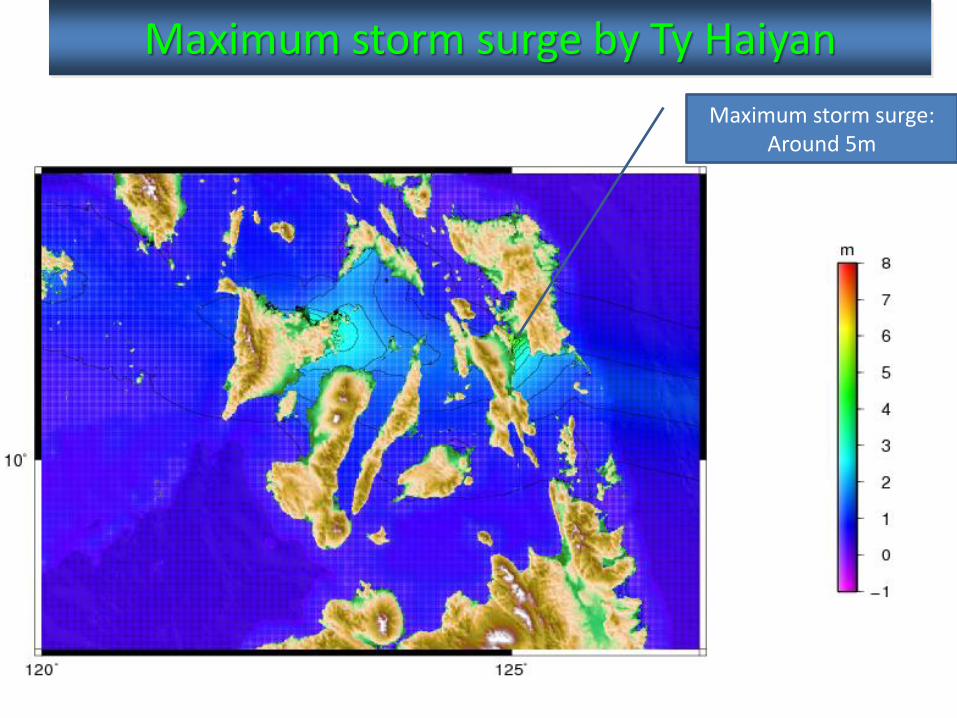
Maximum storm surge by Ty Haiyan
Maximum storm surge: Around 5m

Storm surges by Ty Haiyan
-2
-1
0
1
2
3
4
5
6
0 3 6 9 12 15 18 21 0 3 6 9 12
Leyte Gulf (Tacloban)
Date and Time (UTC) 7/NOV. 8/NOV.
-0.5
0
0.5
1
1.5
2
2.5
0 3 6 9 12 15 18 21 0 3 6 9 12
North of Negros Island
Date and Time 7/NOV. 8/NOV.
-1
0
1
2
3
4
0 3 6 9 12 15 18 21 0 3 6 9 12
North of Panay Island
Date and Time 7/NOV. 8/NOV.
-0.5
0
0.5
1
1.5
2
2.5
0 3 6 9 12 15 18 21 0 3 6 9 12
South of Masbate Island (Aside Gulf)
Date and Time (UTC) 7/NOV. 8/NOV.
-0.5
0
0.5
1
1.5
2
0 3 6 9 12 15 18 21 0 3 6 9 12
North of Cebu Island
Date and Time 7/NOV. 8/NOV.
Storm surge (m)

Ocean waves by Ty Haiyan
00UTC 07 NOV 2013
06UTC 08 NOV 2013 00UTC 08 NOV 2013 18UTC 07 NOV 2013
12UTC 07 NOV 2013 06UTC 07 NOV 2013
Significant wave heights (m)

Wave setup, wind
Wind setup
Wave setup, Winds
Wind setup
Wind setup, Winds
Wind setup

JMA issues storm surge distribution maps, but it becomes invisible when pressure contours are densely drawn.
SSWS Product for Ty Haiyan
Predicted maximum storm surge: 3.7m
Lesson Outline
Introduction JMA’s responsibility and work as a RSMC, Tokyo Typhoon Center Situation of storm surges in North Western Pacific
Storm Surge Information Storm surge model Storm Surge Watch Scheme
Storm Surge Cases Ty Haiyan (1330)
Disuccion Improvement plan Perspective of EO data usage
Summary

Discussion
Improvement plan To modify storm surge information (model products) To add more stations for time series To improve storm surge model accuracy (verification) Enhanced information (probabilistic / inundation)
Perspective of EO data usage Currently no EO data is directly used for storm surge information in JMA. However, EO data is used in Typhoon analyses etc (indirect usage). JMA would like to utilize EO data in monitoring of tide, wind and so on Bathymetry data will be also effective for high resolution modeling…
However… Accurate and Intensive storm surge information should be made and issued in local Meteorological Agencies (Capacity building is crucial).

JMA also trains staff of other National Met. / Hydro. Services and provides storm surge model for using their own operation.
• ESCAP/WMO Typhoon Committee Attachment Training at the RSMC Tokyo
• TCP/JCOMM Technical workshop
• JICA training course
• individual visits
(Recent one)
Training and Capacity building on Storm Surge Modeling and Risk Mapping (24-28, June, 2013, in Bangkok)
Organized by Asian Disaster Preparedness Center (ADPC), Supported by UNESCAP Trust Fund for Tsunami, Disaster and Climate
Preparedness and the MOFA (Norway) Participants: PAGASA(Philippines), DMH(Myanmar), DOM(Sri Lanka),
NHMS(Vietnam), and TMD(Thailand)
Capacity building
Example of storm surge prediction by Ty Haiyan, operationally simulated by PAGASA staff
(a) 03UTC (3 hours forecast)
(b) 06UTC (6 hours forecast)
Initial: 00UTC on NOV 08
(a) (b)

Perspective of EO data usage
Direct storm surge observation (storm tide, TWLE) tide information for large scale tidal motion monitor inundation area
Indirect Typhoon analyses Land data for precise topography Observation data for other related factors (wave, rain, river flow and so on)
Real time or non real time For operational purpose, EO data real time

Summary
• NW Pacific is one of the most active region TCs are active.
• JMA is responsible for TC related information in NW Pacific. • JMA has started to issuing storm surge information for NW Pacific region.
• The storm surge forecast is fair but it should be improved. • For useful information, tide information (observation) is necessary, but observation network is not satisfactory (Tide model and EO data).
• For accurate and intensive information, development of regional (local)
forecasting skill is indispensable.