Earth-Centric Business Plan
39
EARTH-CENTRIC, LLC EARTH-CENTRIC, LLC EARTH-CENTRIC, LLC EARTH-CENTRIC, LLC Business Plan 2008 6017 NE Sandy Boulevard Portland, OR 97213-3962 Bus: (503) 281-0307 Fax: (503) 961-7968
description
Provider of biodegradable and/or compostable products.
Transcript of Earth-Centric Business Plan

EARTH-CENTRIC, LLCEARTH-CENTRIC, LLCEARTH-CENTRIC, LLCEARTH-CENTRIC, LLC
Business Plan
2008
6017 NE Sandy Boulevard
Portland, OR 97213-3962
Bus: (503) 281-0307
Fax: (503) 961-7968

Confidentiality Agreement
The undersigned reader acknowledges that the information provided by _________________________ in this business plan is confidential; therefore, reader agrees not to disclose it without the express written permission of _________________________.
It is acknowledged by reader that information to be furnished in this business plan is in all respects confidential in nature, other than information which is in the public domain through other means and that any disclosure or use of same by reader, may cause serious harm or damage to _________________________.
Upon request, this document is to be immediately returned to _________________________.
___________________ Signature
___________________Name (typed or printed)
___________________Date
This is a business plan. It does not imply an offering of securities.
1.0 Executive Summary . . . . . . . . . . . . . . . . . . . . . . . . . . . . . . . . . . . . . . . . . . . . . . . . . . . . . . . . . . . . . 11.1 Objectives . . . . . . . . . . . . . . . . . . . . . . . . . . . . . . . . . . . . . . . . . . . . . . . . . . . . . . . . . . . . . . 21.2 Mission . . . . . . . . . . . . . . . . . . . . . . . . . . . . . . . . . . . . . . . . . . . . . . . . . . . . . . . . . . . . . . . . 21.3 Keys to Success . . . . . . . . . . . . . . . . . . . . . . . . . . . . . . . . . . . . . . . . . . . . . . . . . . . . . . . . . 3
2.0 Company Summary . . . . . . . . . . . . . . . . . . . . . . . . . . . . . . . . . . . . . . . . . . . . . . . . . . . . . . . . . . . . . 42.1 Company Ownership . . . . . . . . . . . . . . . . . . . . . . . . . . . . . . . . . . . . . . . . . . . . . . . . . . . . . . 42.2 Company History . . . . . . . . . . . . . . . . . . . . . . . . . . . . . . . . . . . . . . . . . . . . . . . . . . . . . . . . . 4
3.0 Products . . . . . . . . . . . . . . . . . . . . . . . . . . . . . . . . . . . . . . . . . . . . . . . . . . . . . . . . . . . . . . . . . . . . . . 6
4.0 Market Analysis Summary . . . . . . . . . . . . . . . . . . . . . . . . . . . . . . . . . . . . . . . . . . . . . . . . . . . . . . . . 164.1 Market Segmentation . . . . . . . . . . . . . . . . . . . . . . . . . . . . . . . . . . . . . . . . . . . . . . . . . . . . . 174.2 Target Market Segment Strategy . . . . . . . . . . . . . . . . . . . . . . . . . . . . . . . . . . . . . . . . . . . . 184.3 Industry Analysis . . . . . . . . . . . . . . . . . . . . . . . . . . . . . . . . . . . . . . . . . . . . . . . . . . . . . . . . . 18
4.3.1 Competition and Buying Patterns . . . . . . . . . . . . . . . . . . . . . . . . . . . . . . . . . . . . . . 18
5.0 Web Plan Summary . . . . . . . . . . . . . . . . . . . . . . . . . . . . . . . . . . . . . . . . . . . . . . . . . . . . . . . . . . . . . 185.1 Website Marketing Strategy . . . . . . . . . . . . . . . . . . . . . . . . . . . . . . . . . . . . . . . . . . . . . . . . 195.2 Development Requirements . . . . . . . . . . . . . . . . . . . . . . . . . . . . . . . . . . . . . . . . . . . . . . . . 19
6.0 Strategy and Implementation Summary . . . . . . . . . . . . . . . . . . . . . . . . . . . . . . . . . . . . . . . . . . . . . . 206.1 Competitive Edge . . . . . . . . . . . . . . . . . . . . . . . . . . . . . . . . . . . . . . . . . . . . . . . . . . . . . . . . 206.2 Marketing Strategy . . . . . . . . . . . . . . . . . . . . . . . . . . . . . . . . . . . . . . . . . . . . . . . . . . . . . . . 206.3 Sales Strategy . . . . . . . . . . . . . . . . . . . . . . . . . . . . . . . . . . . . . . . . . . . . . . . . . . . . . . . . . . . 21
6.3.1 Sales Forecast . . . . . . . . . . . . . . . . . . . . . . . . . . . . . . . . . . . . . . . . . . . . . . . . . . . . 216.4 Milestones . . . . . . . . . . . . . . . . . . . . . . . . . . . . . . . . . . . . . . . . . . . . . . . . . . . . . . . . . . . . . . 23
7.0 Management Summary . . . . . . . . . . . . . . . . . . . . . . . . . . . . . . . . . . . . . . . . . . . . . . . . . . . . . . . . . . 237.1 Personnel Plan . . . . . . . . . . . . . . . . . . . . . . . . . . . . . . . . . . . . . . . . . . . . . . . . . . . . . . . . . . 24
8.0 Financial Plan . . . . . . . . . . . . . . . . . . . . . . . . . . . . . . . . . . . . . . . . . . . . . . . . . . . . . . . . . . . . . . . . . . 248.1 Important Assumptions . . . . . . . . . . . . . . . . . . . . . . . . . . . . . . . . . . . . . . . . . . . . . . . . . . . . 248.2 Break-even Analysis . . . . . . . . . . . . . . . . . . . . . . . . . . . . . . . . . . . . . . . . . . . . . . . . . . . . . . 248.3 Projected Profit and Loss . . . . . . . . . . . . . . . . . . . . . . . . . . . . . . . . . . . . . . . . . . . . . . . . . . 268.4 Projected Cash Flow . . . . . . . . . . . . . . . . . . . . . . . . . . . . . . . . . . . . . . . . . . . . . . . . . . . . . . 288.5 Projected Balance Sheet . . . . . . . . . . . . . . . . . . . . . . . . . . . . . . . . . . . . . . . . . . . . . . . . . . . 308.6 Business Ratios . . . . . . . . . . . . . . . . . . . . . . . . . . . . . . . . . . . . . . . . . . . . . . . . . . . . . . . . . 30
Appendix . . . . . . . . . . . . . . . . . . . . . . . . . . . . . . . . . . . . . . . . . . . . . . . . . . . . . . . . . . . . . . . . . . . . . . . . . . 32
Table of Contents

1.0 Executive Summary
A Portland, Oregon based retail store, which opened its doors last December as the Trellis Earth Store, has changed its parent company name to Earth-Centric, LLC., located at 6017 NE Sandy Boulevard in Portland, Oregon sells corn-based biodegradable bioplastic bags, deli-ware and food service containers and supplies at competitive prices. As General Manager of Earth-Centric, Tom Smith has indicated that, with the introduction of many other biodegradable and compostable products coming on the market today, it was prudent to create a new business name which best described it’s focus on providing environmentally friendly biodegradable products for both the commercial and retail market. Earth-Centric is also in the planning stages of creating a "Full-Circle" revolution of not only selling all of its biodegradable product lines but developing a program to recycle and re-purpose it as well.
Together with Smith’s partners, Kay Wisner (CFO), and David Bouret, and other dedicated associates, they have formulated a strong, viable, and experienced team of earth-conscience and dedicated advocates.
"Environmental consciousness has reached a tipping point. Within the last few years, "green" choices like sustainable living, goods made from renewable and recyclable materials and products, stewardship have moved from the realm of study and debate to a point where they are capturing the imagination of the world on a very personal level. Earth-centric thinking is becoming a critical component in community, family, health, well-being and daily life, and it is driving product manufacturers and retailers to seek alternative materials."
We are definitely EARTH-CENTRIC!
Financing will come from the private investments of owner Tom Smith and other early investors. Mr. Smith has already donated equity of $40,000 that will be cleared at the end of 36 months. Dividends will be paid quarterly on the outstanding equity.
Earth-Centric, LLC, has been incorporated as an LLC-Corporation since April 16 2008 in the State of Oregon. This will shield the owners from issues of personal liability and double taxation. The investors will be treated as shareholders and therefore will not be liable for more than their personal investments such as $40,000. The majority owner Tom Smith, has contributed $40,000 of his personal savings toward this business venture. With an agressive marketing plan Earth-Centric expects to experience steady growth as it becomes more familiar to the general public.
With the financing in place Earth-Centric will be able to successfully open and maintain operations through year one. The large capital investments of the owner will provide the public with a unique and innovative store that will cater to the needs of many in all categories of income levels including those on fixed incomes such as low income families, the elderly, and the large student population and many others interested in our unique biodegradable products in the Portland area and within the world-wide-web. The successful operation of the Earth-Centric store will provide a customer base that will allow it to be self sufficient.
My Plan Title
Page 1

($100,000)
$0
$100,000
$200,000
$300,000
$400,000
$500,000
FY 2008 FY 2009 FY 2010
Sales
Gross Margin
Net Profit
Highlights
1.1 Objectives
1. To provide a wide range of corn-based bioplastic biodegradable products including bags, food service containers, and cutlery at reasonable prices.
2. To achieve a 50% profit margin within the first year. 3. To achieve a net profit of $30,000 by year two.4. To be an active and vocal member of the community, and provide continual re-
investment through participation in community activities and financial contributions.
5. Earth-Centric we want to provide an alternative to the entrenched problem of wasteful food containers. We believe that replacing toxic materials with sustainable, biodegradable materials is a good step in the right direction, on many levels.
1.2 Mission
The Earth-Centric store provides a variety of useful nature-based bioplastic biodegradable products including bags, food service cantainers and cutlery at competitive prices. Earth-Centric's product-line represent the true biodegradable alternative to toxic Styrofoam containers and polyethylene plastic bags.
Styrofoam™ containers leach toxic benzene into any food or liquid it touches. Plastic bags pollute our land and kill wildlife. Both use petroleum as their primary ingredient and both can take decades (or longer) to break down. Why would you use either of these products if you had any choice in the matter? Now you do!
My Plan Title
Page 2

By purchasing our products by the bulk carton, single sleeve, and now our featured smaller 100, 50, and 25 pack categories you would be helping to contribute making our world a little greener.
At the "brick & mortar" Earth-Centric storefront and online ecommerce websites we provide an alternative to the entrenched problem of wasteful styrofoam, polyethylene, and plastic bags, food containers, and cutlery. We believe that replacing toxic materials with sustainable, biodegradable materials is a good step in the right direction, on many levels.
Collectively we must find ways to consume less energy and fewer natural resources, and migrate towards a recycling-based economy that values and rewards good stewardship and lower consumption patterns above wastefulness and unchecked exploitation.
Together the sum of our incremental changes can alter the course of destiny, to where sustainability and ecological responsibility is neither a task nor a burden – it is the way for everyone on the planet to contribute to their own well being and that of each other (what we ultimately all depend on).
Please support our mission by purchasing from our storefront and our website and keep checking back regularly to see how together we can build a movement that realizes that consumption is just one half of a product’s lifecycle – reclamation and reuse, recycling and transformation are just as important.
But don't take our word for it, order one of our new Sample Packs. You'll be so amazed when you handle our products that you'll have to ask yourself "Is this really made from corn?" Yes, it is.
1.3 Keys to Success
To succeed in this business and community we must continue to:
• Sell a broad range of nature-based bioplastic biodegradable products.• provide an alternative to the entrenched problem of wasteful food containers. • Provide for the complete satisfaction of 100% of our commercial and retail
customers.• Be an active member of the community.• Encourage customer input.
• Collectively find ways to consume less energy and fewer natural resources, and migrate towards a recycling-based economy that values and rewards good stewardship and lower consumption patterns above wastefulness and unchecked exploitation.
My Plan Title
Page 3

2.0 Company Summary
In April of 2007, we were introduced to a new wholesale commercial local company called Trellis Earth Products, which sold corn-based bioplastic biodegradable products featuring bags, food service containers, and cutlery. Working as a sales contractor for commissions, Thomas Smith was appointed as a territory sales manager for Trellis Earth Products. In May 2007, Mr. Smith offered Trellis Earth the opportunity to reach the retail mrket with its initial design and formation of an online Trellis Earth eBay Store. This store has since generated many online retail customers from within the Continental United States and some areas of Canada.
Starting with our Grand Opening, December 1st, 2007, we opened our new first retail "brick & mortar" storefront called Trellis Earth Store, an online store and "brick & mortor" storefront for 100% biodegradable bioplastic packaging made from corn,
The Trellis Earth Store, a dba of Earth-Centric, LLC, sells nature-based bioplastic 100% biodegradable products including bags, food service containers and cutlery. All of our product-line is available for both of our commercial and retail customer base in cartons and sleeves, and also now in 100, 50 , and 25 pack formats.
In May of 2007, we setup our eBay Retail Store, called Trellis Earth Store and now Earth-Centric to create an opportunity for consumers to have access to our corn-based bioplastics rather than having to work with commercial outlets.
We have leased a retail store in November 2007, which we use to market and merchandise all of our products for both wholesale and retail clientele. It is located at 6017 NE Sandy Blvd., in Portland, Oregon.
2.1 Company Ownership
Earth-Centric, LLC - is a privately held limited liability Oregon corporation. It is registered as a LLC, with ownership Thomas Smith (60%), Kay Wisner (25%), David Bouret (10%).
2.2 Company History
The Trellis Earth Store is a dba Earth-Centric, LLC. We have already provided information on company history of Earth-Centric and its development towards starting both the online eBay store and then "brick and mortar" storefront of the Earth-Centric Store.
My Plan Title
Page 4

Table: Past Performance
Past PerformanceFY 2005 FY 2006 FY 2007
Sales $0 $0 $0Gross Margin $0 $0 $0Gross Margin % 0.00% 0.00% 0.00%Operating Expenses $0 $0 $0Collection Period (days) 0 0 0Inventory Turnover 0.00 0.00 0.00
Balance SheetFY 2005 FY 2006 FY 2007
Current AssetsCash $0 $0 $0Accounts Receivable $0 $0 $0Inventory $0 $0 $0Other Current Assets $0 $0 $0Total Current Assets $0 $0 $0
Long-term AssetsLong-term Assets $0 $0 $0Accumulated Depreciation $0 $0 $0Total Long-term Assets $0 $0 $0
Total Assets $0 $0 $0
Current LiabilitiesAccounts Payable $0 $0 $0Current Borrowing $0 $0 $0Other Current Liabilities (interest free) $0 $0 $0Total Current Liabilities $0 $0 $0
Long-term Liabilities $0 $0 $0Total Liabilities $0 $0 $0
Paid-in Capital $0 $0 $0Retained Earnings $0 $0 $0Earnings $0 $0 $0Total Capital $0 $0 $0
Total Capital and Liabilities $0 $0 $0
Other InputsPayment Days 0 0 0Sales on Credit $0 $0 $0Receivables Turnover 0.00 0.00 0.00
My Plan Title
Page 5

$0
$0
$0
$0
$0
$1
$1
$1
$1
$1
$1
FY 2005 FY 2006 FY 2007
Sales
Gross
Net
Past Performance
3.0 Products
Earth-Centric's product-line are the true biodegradable alternative to toxic Styrofoam™ containers and polyethylene plastic bags. But don't take our word for it; order one of our new Sample Packs. You'll be so amazed when you handle our products that you won't believe its made from corn.
Styrofoam™ containers leach toxic benzene into any food or liquid it touches. Plastic bags pollute our land and kill wildlife. Both use petroleum as their primary ingredient and both can take decades (or longer) to break down. Why would you use either of these products if you had any choice in the matter? Now you do! Purchase our products now through our Bulk Cartons or Single Sleeves category links and now our 100, 50, and 25 Packs and help us contribute making our world a little greener.
Our Complete Product line is as follows:
Biodegradable Bags
One of the greatest banes of our modern world is the ubiquitous polyethylene, or plastic, bag. They're so popular that four our of every five bags handed out at grocery stores are plastic. These little plastic devils are rarely recycled and don't degrade in the natural environment, much less in a landfill.
And don't even think about using paper bags! In many ways, paper bags are even worse than plastic bags. Paper sacks generate 70 percent more air and 50 times more water pollutants than plastic bags. It takes 91 percent less energy to recycle a pound of plastic than it takes to recycle a pound of paper. And paper bags can't even be used in composting programs and don't decompose any faster than plastic bags once they end up in a landfill.
But, there is a third option. Nature-based biodegradable bioplastic bags are made from the highest
My Plan Title
Page 6

quality corn polymers, starches and complimentary ingredients, for a completely earth-friendly solution. They can be disposed of with the knowledge that in the landfill they will naturally biodegrade with no toxic residues.
Earth-Centric, LLC carries a wide assortment of biodegradable bags, perfect for any retail or office need. All of our bags come labeled with their biodegradable qualities and the Trellis Earth Products, Inc. Logo, so your customers know they are getting a quality, earth-friendly product.
• Small Bioplastic Biodegradable Bag - WFB-01• Medium Bioplastic Biodegradable Bags - WFB-02• Large Bioplastic Biodegradable Bag - WFB-03• Grocery Bioplastic Biodegradable Bag - WFB-04* (Older)• Grocery Bioplastic Biodegradable Bag - WFB-04 (Newer)• Small Grocery Bioplastic Biodegradable Bag - WFB-05• Office Bioplastic Biodegradable Trash Bag - WFB-06• Tall Kitchen Bioplastic Biodegradable Trash Bag - WFB-07• Very Large Bioplastic Biodegradable T-shirt Bag - WFB-08• Commerical Bioplastic Biodegradable Trash Bag - WFB-09• Reusable Bioplastic Shopping Bag - WFB-15
My Plan Title
Page 7

My Plan Title
Page 8

Bioplastic Plates
You're catering a buffet-style fund-raiser for the local environmental group, do you think those petroleum based plates will go by unnoticed? How can your customers talk seriously about our growing environmental issues when they're eating off plates made from one of the biggest environmental threats of our time?
Earth-Centric plates shows your eco-friendliness in any situation. As for strength and durability; these bioplastic plates aren't just for rice cakes. Soy dogs, veggie burritos, humus, macaroni sald: these plates won't bend or fold under the weight of your culinary delights.
Earth-Centric bioplastic plates provide a viable, non-toxic, disposable alternative to plastic plates. Made from corn polymers, starches and complimentary ingredients, our plates are 100% biodegradable. Our supplier's unique blend even allows them to be taken straight from the fridge to the microwave for easy and efficient reheating.
• Bioplastic Deli Plate - WFD-06• Bioplastic Dinner Plate - WFD-03• Bioplastic 3 Section Heavy Duty Plate - WFD-07
My Plan Title
Page 9

Bioplastic Takeout Boxes
The takeout box is one of the last bastions of Styrofoam™ containers. You hated using them because they're so harmful to the environment, but they were the best container available for your food and your customers.
But now there is an alternative. Bioplastic takeout boxes hold takeout or leftovers in eco-friendly style.
Earth-Centric's bioplastic takeout boxes provide a viable, non-toxic, disposable alternative. Made from corn polymers, starches and complimentary ingredients, our takeout boxes are 100% biodegradable. Our unique blend even allows them to be taken straight from the fridge to the microwave for easy and efficient reheating.
• Bioplastic Small Clamshell Takeout Box - WFH-01• Bioplastic Medium Clamshell Takeout Box - WFH-02• Bioplastic Large Clamshell Takeout Box - WFH-10• Bioplastic Quad Takeout Box with Cover - WFH-07
My Plan Title
Page 10

Bioplastic Cups
Do your customers take styrene in their coffee?
The migration of styrene from a Styrofoam™ cup containing cold or hot beverages can be up to 0.025% for a single use. Did your customers order that as well?
Earth-Centric's cups are here and ready to replace that unhealthy, ubiquitous Styrofoam™ cup. Hot or cold liquids are no problem. These cups are even micro-waveable. And when your customers throw them in the trash, they can do so guilt (and styrene) free.
1. Bioplastic 6 oz Water Cup - WFP-01
2. Bioplastic 8 oz Water Cup - WFP-02
Bioplastic Cutlery
Why force your customers to put your healthy food in their mouth on the edge of a toxin-laden plastic fork?
Go that extra mile for your customers and offer them a complete eco-friendly dining experience. Made from corn polymers, starches and complimentary ingredients, our cutlery is 100% biodegradable -- and just as effective as conventional plastic cutlery.
Make the right decision and switch to Earth-Centric's nature-based bioplastic cutlery today!
• Bioplastic 3-Piece Utensil Set (bagged as set) - WFS-01• Bioplastic Fork (individually bagged) - WFS-02• Bioplastic Spoon (individually bagged) - WFS-03• Bioplastic Knife (individually bagged) - WFS-04
My Plan Title
Page 11

• Bulk Bioplastic Fork - WFS-05• Bulk Bioplastic Spoon - WFS-06• Bulk Bioplastic Knife - WFS-07• Bulk Bioplastic Soup Spoon - WFS-08• Bulk Bioplastic Spork - WFS-09
My Plan Title
Page 12

Bioplastic Food Trays
Why sell your customers quality meats or prepared deli foods on an eco-hostile Styrofoam™ tray?
Using Earth-Centric's bioplastic food trays tells your customers that you care so much about your food that you don't want it packaged in anything but the best packinging available.
These bioplastic trays are a viable, non-toxic, styrene-free, disposable alternative to conventional Styrofoam™ deli trays. Made from corn polymers, starches and complimentary ingredients, our trays are 100% biodegradable. Our unique blend even allows our trays to be microwaved safely for reheating prepared food.
• Bioplastic Small Food Tray - WFT-01• Bioplastic Medium Food Tray - WFW-02• Bioplastic Large Food Tray - WFW-03
My Plan Title
Page 13

Bioplastic Bowls
Waiter, there's styrene in my vegan corn chowder!
Styrene is a suspected human carcinogen and neurotoxin and is in every Styrofoam™ product. Styrene migration occurs when the styrene leaves the Styrofoam™ and actually enters the food that's being held in the container. Styrene is fat soluble and stays in the body, so each exposure increases the total amount of styrene hiding out in your customers.
And guess what? Hot liquids (like soup) increase the rate of migration. Styrene may not look as bad as a fly in the soup, but it's just as unhealthy.
Earth-Centric's bioplastic bowls provide a viable, non-toxic, styrene-free, disposable alternative. Made from corn polymers, starches and complementary ingredients, our bowls are 100% biodegradable. Our unique blend even allows our bowls to be microwaved safely for reheating.
Now there's a bowl of soup that looks pretty good.
• Bioplastic Small Bowl - WFW-02• Bioplastic Soup Bowl - WFW-03• Bioplastic Soup Bowl Lid - WFW-04
My Plan Title
Page 14

Bioplastic Sample Packs
No matter how much we tell you about the benefits of our products, it just won't compare to how impressed you'll be when you actually handle our products.
If you're intrigued by the possibility of switching your packaging to a more eco-friendly material but aren't ready to order a complete case, try ordering a Sample Pack.
After you test your products in our packaging, we're certain you'll see that Earth-Centric's nature-based products are the right choice for your business.
• Restaurant Solutions Sample Pack - SP-01• Plastic Bag Replacement Sample Pack - SP-02• Green Office Sample Pack - SP-03
My Plan Title
Page 15

Earth-Centric, LLC has since solicited other biodegradable and compostable products through other suppliers such as EPS, Excellent Packaging Services and ECO Products. With these many other diversified biodegradable products, Earth-Centric can now fill in all of the other missing gaps that consumers have been seeking to fill all of the many other biodegradable and composting needs.
SEE OUR ENTIRE ATTACHED PRODUCT PRICE CATALOGS!
4.0 Market Analysis Summary
We expect sales to increase steadily as consumers find that they can purchase a variety of quality items at bargin prices. We intend to tap into the retail market with pricing that will encourage quantity buying, and our pricing will attract consumers on fixed budgets.
Our three target markets are the following:
1. The individually to general household buyer market who are interested in promoting a "green" lifestyle and help in preserving and helping the environment. Our store provides an outlet for smaller portions of our corn-based
2. The commercial business entity which would include restaurants, grocery and general retail stores, offices, and any other types of business either working with the general public or wanting to promote a "green" style within the company employee structure.
3. eCommerce sales through the eBay Store or other online retail websites.
My Plan Title
Page 16
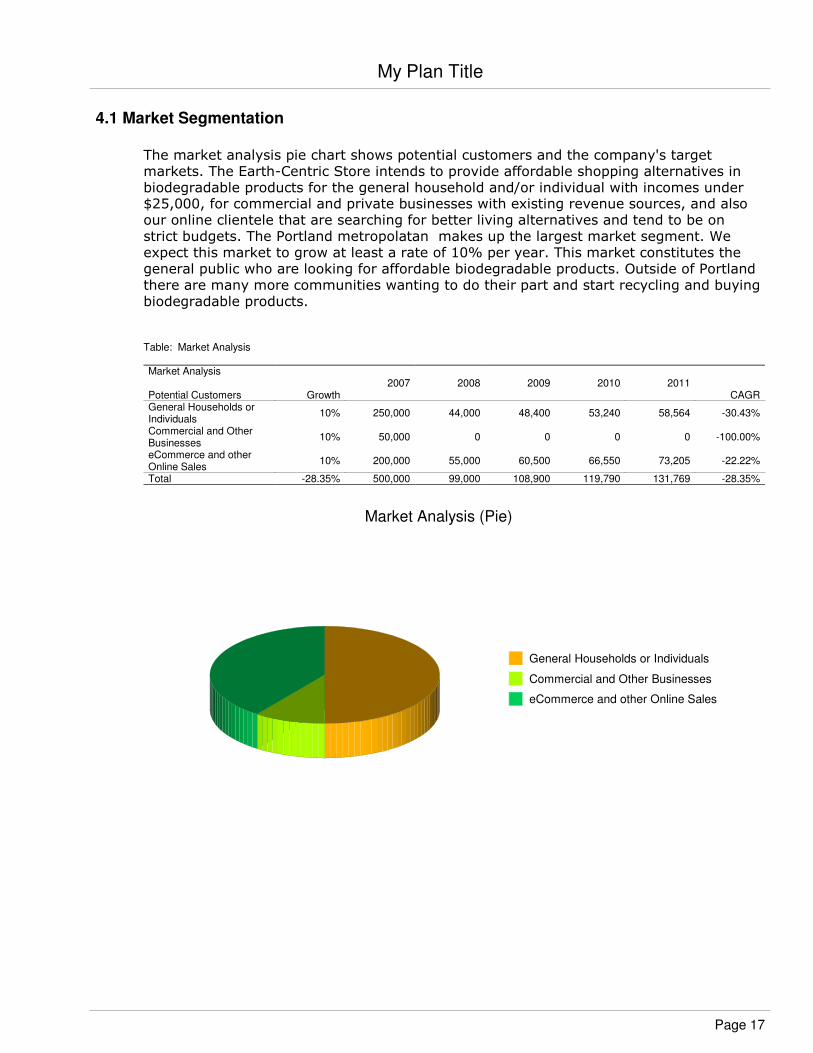
4.1 Market Segmentation
The market analysis pie chart shows potential customers and the company's target markets. The Earth-Centric Store intends to provide affordable shopping alternatives in biodegradable products for the general household and/or individual with incomes under $25,000, for commercial and private businesses with existing revenue sources, and also our online clientele that are searching for better living alternatives and tend to be on strict budgets. The Portland metropolatan makes up the largest market segment. We expect this market to grow at least a rate of 10% per year. This market constitutes the general public who are looking for affordable biodegradable products. Outside of Portland there are many more communities wanting to do their part and start recycling and buying biodegradable products.
Table: Market Analysis
Market Analysis2007 2008 2009 2010 2011
Potential Customers Growth CAGRGeneral Households or Individuals
10% 250,000 44,000 48,400 53,240 58,564 -30.43%
Commercial and Other Businesses
10% 50,000 0 0 0 0 -100.00%
eCommerce and other Online Sales
10% 200,000 55,000 60,500 66,550 73,205 -22.22%
Total -28.35% 500,000 99,000 108,900 119,790 131,769 -28.35%
General Households or Individuals
Commercial and Other Businesses
eCommerce and other Online Sales
Market Analysis (Pie)
My Plan Title
Page 17

4.2 Target Market Segment Strategy
We focus on the price conscious consumer who is looking for biodegradable products that have value as well as quality. If we can attract and keep these consumers the word will continue to spread about what our store has to offer and enabling us to consider other franchizes in more central locations.
4.3 Industry Analysis
In an ever changing economy the discount store model is becoming more popular with the consumer. Earth-Centric Store is another unique variation of this model but with a strong objective towards environmental issues and products to satisfy this goal. Providing a large selection of bargain-priced biodegradable items is our intended goal and purpose for both the general household or individual and the commercial business or restaurant.
4.3.1 Competition and Buying Patterns
Consumers demand quality customer service, fair pricing, and a convenient location.
Competition is very low with regard to durable biodegradable corn-based products. Our retail prices are very competitive to other polyetherine and styrofoam products on the market today. Our key components at this time, are our great customer service and storefront location together with the wide selection of durable biodegradable products we have currently available.
5.0 Web Plan Summary
Earth-Centric, LLC, is currently developing another main Web presentation separate from the eBay Store (www.Earth-Centric-eBay.com). The website, www.Earth-Centric.com, will be the main site listing of our entire product-line database.
This website along with our eBay store will generate a mailing list for future monthly newsletter mailings describing our current, new, and future products. We will also include feature news items on the environment and what other areas of the country are doing to help our communities to think more "Green". We are also developing our main website, www.Earth-Centric.com which has several suppliers in order to help diversify the product line to help satisfy the many unique demands in recycling and a biodegradable environmental lifestyle. This same website will also act as our clearinghouse of information on recycling and composting ideas and news for both the local Portland, Oregon area and national and international issues as well.
The website will mirror the look and feel of the eBay store's (www.Earth-Centric-eBay.com) branding and information so as to keep a seamless feel and look between the two websites.
My Plan Title
Page 18

5.1 Website Marketing Strategy
Our website and "Brick & Mortar" storefront will provide information about us and our products as well as order processing to purchase our products online or instore. We will include our web address in all of our advertising to reinforce to our customers how to find us online. Our company logo and motto will also need to be eye catching and easy to remember so that once our customers find us, they will remember us and suggest us to their friends and family and business associates.
5.2 Development Requirements
Initial Development
We will be working with both eBay and ProStores as well as outside consulting sources to help design the layout of the site. Initially, our site will provide an overview of the company, describe our products and services, and redirect visitors to our eBay store to purchase a shirt. The estimated costs for initial website development are listed in our start-up costs.
Good-quality pictures of our products will be available, so the customer can see what they will be getting.
Full website (including online ordering)
In the third month of the plan, when we have a better sense of customer preferences, we will finish the development of the site to include online order processing (via PayPal). Customers now have the choice of buying either directly from our websites, or via our eBay store or coming down to our "brick & mortar" storefront (if they live in the Portland, Oregon metropolitan area). Additional security functions are available for doing both PayPal sales and merchant account sales on both of our current active websites. Expenses for any further website development will be listed in our Profit and loss table. Our physical storefront is able to utilize all current forms of merchant account transactions with our Intuit Point of Sale (POS) application. We are then able to streamline our "End of Day", Profit & Loss, and billing statements more effectively through POS and our QuickBooks accounting package.
The order processing will include the ability to provide both a billing and an optional shipping address and will be able to process both credit card as well as payment by check (using Paypal).
My Plan Title
Page 19

6.0 Strategy and Implementation Summary
The Earth-Centric uses a strategy of total market service. Our promise is in our location and the products we sell, the people we attract, and the atmosphere we create.
We will present a store that is pleasant to shop in with a large variety of merchandise to choose from. We also provide two online ecommerce websites, our eBay Store (www.Earth-Centric-eBay.com) and our main website (www.Earth-Centric.com).
Ultimately, we are selling more than just merchandise. We are selling ourselves. We want to provide the kind of customer service that will provide an atmosphere that creates a positive shopping experience for our customers.
Strategic Assumptions:
1. Every person with income limitations or on fixed incomes is a potential customer.
2. Marketing to these segments of the population will lead to an expansion in overall market growth.
6.1 Competitive Edge
Our location is a very important competitive edge. We are located in the popular NE Sandy Boulevard in Portland Oregon which has a high appeal to many different kinds of consumers. There is a good mix of high and low end shops with several quality restaurants near by. With easy access from downtown to the east side from Hollywood District to Rose City Park and then to the Gresham area via the Banfield Freeway (or I-84). Sandy Blvd. is a popular destination not only for Portland residents, but for people commuting from west side or Beaverton area to even Vancoever Washington and the outlying areas.
Another competitive edge we will have over our competition is the large variety of nature-based biodegradable merchandise we will carry. With the sources we are working with it will be possible to carry many standard food containers to bags and many other deli-ware items, add a staff committed to providing great customer service and the Earth-Centric store will be an attractive stop for the consumer.
6.2 Marketing Strategy
The Earth-Centric store will benchmark our objectives for sales promotion and mass selling.
We are focusing our grass-roots marketing effort on the community of consumers that want a store which has an interesting variety of environmentally safe and biodegrdable merchandise at competitive prices. We will implement a strategy that treats these customers as a community. This means our marketing resources will be centered around both sales promotions (events, displays) and personal sales (customer service, friendly atmosphere).
• We will stay within our marketing budget.
• Marketing promotions will be consistent with the Mission Statement.
My Plan Title
Page 20

6.3 Sales Strategy
Currently, we have no employees, but once we are steadily bringing in sales, employees are paid a straight wage but can also acheive sales commissions on any new business clients with completed sales that they can bring in.
All potential sales will be attended to in a timely fashion and long-term salesperson-customer relationships will take precedence over sales closure.
We have set up a commissioned-based Sales Contractor program for anyone interested in marketing our many products for both the retail and wholesale markets.
6.3.1 Sales Forecast
The following table and chart give a run-down on forecasted sales. We expect sales to increase at a rate of 10% by April. We would like to see another increase of 10% by August.
We expect to experience a steady growth throughout our first year even though we are a new business enterprise. As we become more familiar to the public we expect to gain more market share and would like to see progressive growth as we head into the following year. The Earth-Centric store, with an aggressive marketing approach expects to increase its share of the market by offering a unique option to discount shopping.
Note: For company purchases, the per-unit price of inventory purchases does not include cost of shipping.
Table: Sales Forecast
Sales ForecastFY 2008 FY 2009 FY 2010
SalesPerishable Items $113,500 $136,200 $163,440Non-Perishible Items $212,000 $254,400 $305,280Total Sales $325,500 $390,600 $468,720
Direct Cost of Sales FY 2008 FY 2009 FY 2010Perishable Items $56,750 $68,100 $81,720Non-Perishable Items $106,000 $127,200 $152,640Subtotal Direct Cost of Sales $162,750 $195,300 $234,360
My Plan Title
Page 21

$0
$5,000
$10,000
$15,000
$20,000
$25,000
$30,000
$35,000
$40,000
$45,000
Oct Nov Dec Jan Feb Mar Apr May Jun Jul Aug Sep
Perishable Items
Non-Perishible Items
Sales Monthly
$0
$50,000
$100,000
$150,000
$200,000
$250,000
$300,000
$350,000
$400,000
$450,000
$500,000
FY 2008 FY 2009 FY 2010
Perishable Items
Non-Perishible Items
Sales by Year
My Plan Title
Page 22

6.4 Milestones
The milestone table shows how the responsibilities break down in the start up of our store. Tom Smith, General Manager, has headed up the drafting of the business plan and will conduct the drive to secure funding. Tom Smith has also worked to secure a site for the store and will handle the details with the personnel plan. Our accountant and CFO, Kay Wisner will set up our accounting and financial plan.
Table: Milestones
Milestones
Milestone Start Date End Date Budget Manager DepartmentBusiness Plan 12/1/2007 2/1/2008 $1,500 Tom Smith OwnerSecure Start Up Funding 2/1/2008 4/1/2008 $2,000 Tom Smith OwnerSite Selection 10/1/2007 12/1/2007 $2,500 Tom Smith ManagementPersonal Plan 11/1/2007 1/1/2008 $1,500 Tom Smith ManagementAccounting Plan 11/1/2007 1/1/2008 $2,500 Kay Wisner AccountingTotals $10,000
Oct Nov Dec Jan Feb Mar Apr
Business Plan
Secure Start Up Funding
Site Selection
Personal Plan
Accounting Plan
Milestones
7.0 Management Summary
The main partners of the Earth-Centric, LLC believe very strongly that relationships should be forthright, work should be structured with enough room for creativity, and pay should be fair and equitable in relation to what the industry is paying. With the right people in place, the Earth-Centric store will have the incentives to encourage quality people to stay.
Tom Smith and Key Wisner worked together as partners and managers of The TaJ Group, Inc. before starting Earth-Centric, LLC. Both bring extensive retail marketing and finance knowledge to the company. They have the knowledge, experience and contacts to make the company a success.
My Plan Title
Page 23
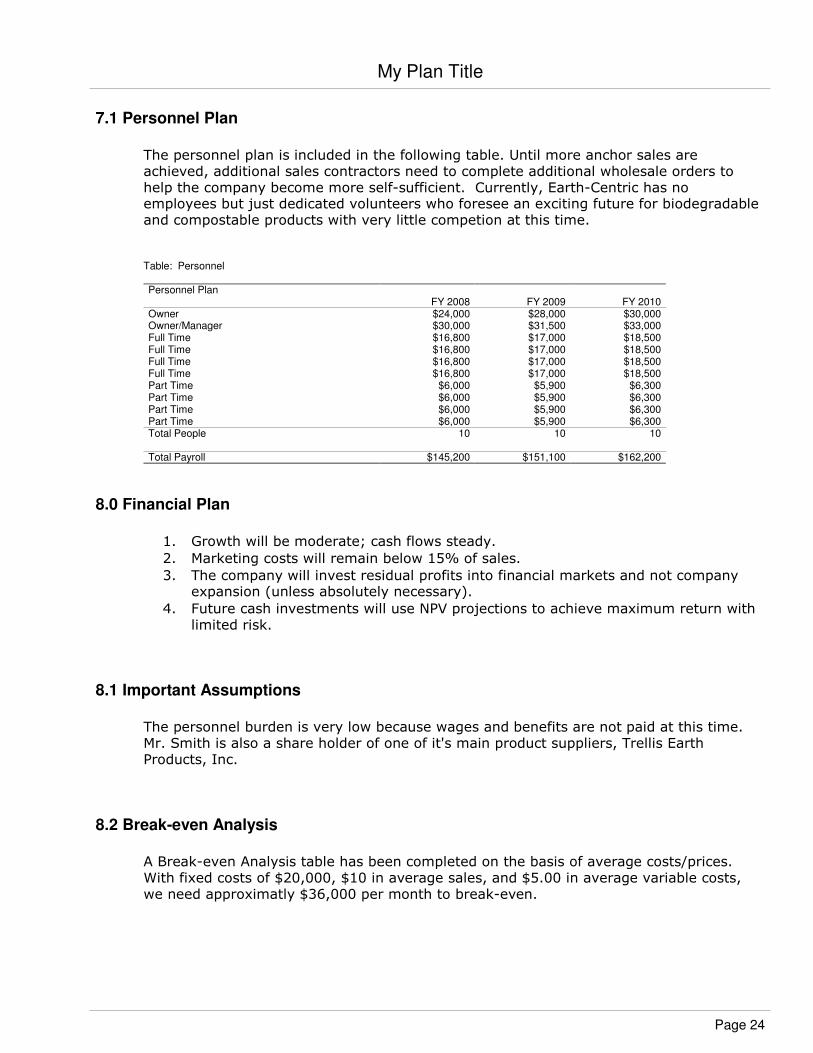
7.1 Personnel Plan
The personnel plan is included in the following table. Until more anchor sales are achieved, additional sales contractors need to complete additional wholesale orders to help the company become more self-sufficient. Currently, Earth-Centric has no employees but just dedicated volunteers who foresee an exciting future for biodegradable and compostable products with very little competion at this time.
Table: Personnel
Personnel PlanFY 2008 FY 2009 FY 2010
Owner $24,000 $28,000 $30,000Owner/Manager $30,000 $31,500 $33,000Full Time $16,800 $17,000 $18,500Full Time $16,800 $17,000 $18,500Full Time $16,800 $17,000 $18,500Full Time $16,800 $17,000 $18,500Part Time $6,000 $5,900 $6,300Part Time $6,000 $5,900 $6,300Part Time $6,000 $5,900 $6,300Part Time $6,000 $5,900 $6,300Total People 10 10 10
Total Payroll $145,200 $151,100 $162,200
8.0 Financial Plan
1. Growth will be moderate; cash flows steady.
2. Marketing costs will remain below 15% of sales.
3. The company will invest residual profits into financial markets and not company expansion (unless absolutely necessary).
4. Future cash investments will use NPV projections to achieve maximum return with limited risk.
8.1 Important Assumptions
The personnel burden is very low because wages and benefits are not paid at this time. Mr. Smith is also a share holder of one of it's main product suppliers, Trellis Earth Products, Inc.
8.2 Break-even Analysis
A Break-even Analysis table has been completed on the basis of average costs/prices. With fixed costs of $20,000, $10 in average sales, and $5.00 in average variable costs, we need approximatly $36,000 per month to break-even.
My Plan Title
Page 24

Table: Break-even Analysis
Break-even Analysis
Monthly Revenue Break-even $37,570
Assumptions:Average Percent Variable Cost 50%Estimated Monthly Fixed Cost $18,785
($20,000)
($15,000)
($10,000)
($5,000)
$0
$5,000
$10,000
$15,000
$0 $12,000 $24,000 $36,000 $48,000 $60,000
Monthly break-even point
Break-even point = where line intersects with 0
Break-even Analysis
My Plan Title
Page 25
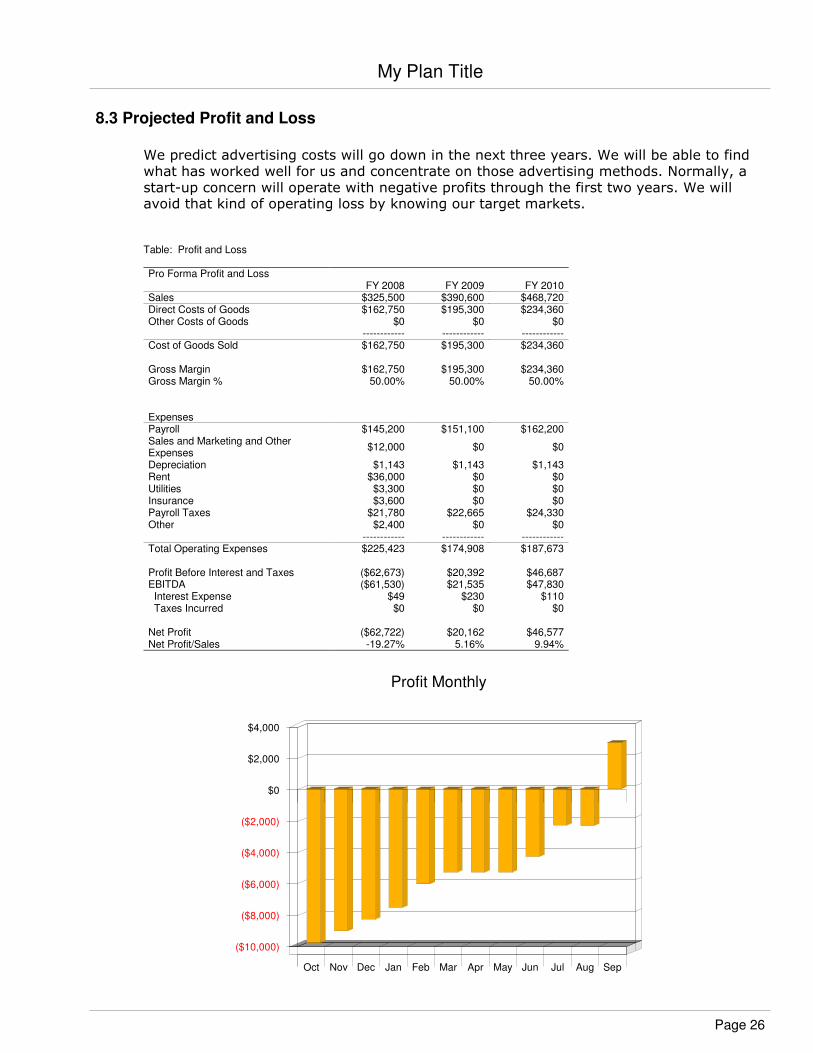
8.3 Projected Profit and Loss
We predict advertising costs will go down in the next three years. We will be able to find what has worked well for us and concentrate on those advertising methods. Normally, a start-up concern will operate with negative profits through the first two years. We will avoid that kind of operating loss by knowing our target markets.
Table: Profit and Loss
Pro Forma Profit and LossFY 2008 FY 2009 FY 2010
Sales $325,500 $390,600 $468,720Direct Costs of Goods $162,750 $195,300 $234,360Other Costs of Goods $0 $0 $0
------------ ------------ ------------Cost of Goods Sold $162,750 $195,300 $234,360
Gross Margin $162,750 $195,300 $234,360Gross Margin % 50.00% 50.00% 50.00%
ExpensesPayroll $145,200 $151,100 $162,200Sales and Marketing and Other Expenses
$12,000 $0 $0
Depreciation $1,143 $1,143 $1,143Rent $36,000 $0 $0Utilities $3,300 $0 $0Insurance $3,600 $0 $0Payroll Taxes $21,780 $22,665 $24,330Other $2,400 $0 $0
------------ ------------ ------------Total Operating Expenses $225,423 $174,908 $187,673
Profit Before Interest and Taxes ($62,673) $20,392 $46,687EBITDA ($61,530) $21,535 $47,830 Interest Expense $49 $230 $110 Taxes Incurred $0 $0 $0
Net Profit ($62,722) $20,162 $46,577Net Profit/Sales -19.27% 5.16% 9.94%
($10,000)
($8,000)
($6,000)
($4,000)
($2,000)
$0
$2,000
$4,000
Oct Nov Dec Jan Feb Mar Apr May Jun Jul Aug Sep
Profit Monthly
My Plan Title
Page 26

($80,000)
($60,000)
($40,000)
($20,000)
$0
$20,000
$40,000
$60,000
FY 2008 FY 2009 FY 2010
Profit Yearly
$0
$5,000
$10,000
$15,000
$20,000
$25,000
Oct Nov Dec Jan Feb Mar Apr May Jun Jul Aug Sep
Gross Margin Monthly
My Plan Title
Page 27

$0
$50,000
$100,000
$150,000
$200,000
$250,000
FY 2008 FY 2009 FY 2010
Gross Margin Yearly
8.4 Projected Cash Flow
We are positioning ourselves in the market as a medium risk concern with steady cash flows. Accounts payable is paid at the end of each month, while sales are in cash, through either Paypal or our Innovative Merchant Account POS, giving our store an excellent cash structure. Currently all income is maintaining almost all of our regular monthly overhead expenses.
My Plan Title
Page 28

Table: Cash Flow
Pro Forma Cash FlowFY 2008 FY 2009 FY 2010
Cash Received
Cash from OperationsCash Sales $292,950 $351,540 $421,848Cash from Receivables $29,683 $38,487 $46,184Subtotal Cash from Operations $322,633 $390,027 $468,032
Additional Cash ReceivedSales Tax, VAT, HST/GST Received $0 $0 $0New Current Borrowing $3,000 $0 $0New Other Liabilities (interest-free) $0 $0 $0New Long-term Liabilities $0 $0 $0Sales of Other Current Assets $0 $0 $0Sales of Long-term Assets $0 $0 $0New Investment Received $2,000 $0 $0Subtotal Cash Received $327,633 $390,027 $468,032
Expenditures FY 2008 FY 2009 FY 2010
Expenditures from OperationsCash Spending $145,200 $151,100 $162,200Bill Payments $348,301 $297,412 $296,177Subtotal Spent on Operations $493,501 $448,512 $458,377
Additional Cash SpentSales Tax, VAT, HST/GST Paid Out $0 $0 $0Principal Repayment of Current Borrowing $100 $1,200 $1,200Other Liabilities Principal Repayment $0 $0 $0Long-term Liabilities Principal Repayment $0 $0 $0Purchase Other Current Assets $0 $0 $0Purchase Long-term Assets $0 $0 $0Dividends $0 $0 $0Subtotal Cash Spent $493,601 $449,712 $459,577
Net Cash Flow ($165,968) ($59,685) $8,455Cash Balance ($165,968) ($225,653) ($217,198)
($180,000)
($160,000)
($140,000)
($120,000)
($100,000)
($80,000)
($60,000)
($40,000)
($20,000)
$0
$20,000
Oct Nov Dec Jan Feb Mar Apr May Jun Jul Aug Sep
Net Cash Flow
Cash Balance
Cash
My Plan Title
Page 29

8.5 Projected Balance Sheet
All of our tables will be updated monthly to reflect past performance and future assumptions. Future assumptions will not be based on past performance but rather on economic cycle activity, regional industry strength, and future cash flow possibilities. We expect solid growth in net worth beyond the year 2008.
Table: Balance Sheet
Pro Forma Balance SheetFY 2008 FY 2009 FY 2010
Assets
Current AssetsCash ($165,968) ($225,653) ($217,198)Accounts Receivable $2,867 $3,440 $4,128Inventory $172,000 $206,400 $247,680Other Current Assets $0 $0 $0Total Current Assets $8,899 ($15,813) $34,610
Long-term AssetsLong-term Assets $0 $0 $0Accumulated Depreciation $1,143 $2,286 $3,429Total Long-term Assets ($1,143) ($2,286) ($3,429)Total Assets $7,756 ($18,099) $31,181
Liabilities and Capital FY 2008 FY 2009 FY 2010
Current LiabilitiesAccounts Payable $65,578 $20,761 $24,664Current Borrowing $2,900 $1,700 $500Other Current Liabilities $0 $0 $0Subtotal Current Liabilities $68,478 $22,461 $25,164
Long-term Liabilities $0 $0 $0Total Liabilities $68,478 $22,461 $25,164
Paid-in Capital $2,000 $2,000 $2,000Retained Earnings $0 ($62,722) ($42,560)Earnings ($62,722) $20,162 $46,577Total Capital ($60,722) ($40,560) $6,017Total Liabilities and Capital $7,756 ($18,099) $31,181
Net Worth ($60,722) ($40,560) $6,017
8.6 Business Ratios
We expect our net profit margin and gross margin, to increase steadily over the three-year period. Our net working capital will increase to almost $228,000 by year three, proving that we have the cash flows to remain a going concern. The following table shows these important financial ratios.
My Plan Title
Page 30

Table: Ratios
Ratio AnalysisFY 2008 FY 2009 FY 2010 Industry Profile
Sales Growth 0.00% 20.00% 20.00% 6.98%
Percent of Total AssetsAccounts Receivable 36.96% -19.01% 13.24% 32.54%Inventory 2217.66% -1140.41% 794.33% 27.98%Other Current Assets 0.00% 0.00% 0.00% 22.49%Total Current Assets 114.73% 87.37% 111.00% 83.01%Long-term Assets -14.73% 12.63% -11.00% 16.99%Total Assets 100.00% 100.00% 100.00% 100.00%
Current Liabilities 882.91% -124.10% 80.70% 38.02%Long-term Liabilities 0.00% 0.00% 0.00% 15.41%Total Liabilities 882.91% -124.10% 80.70% 53.43%Net Worth -782.91% 224.10% 19.30% 46.57%
Percent of SalesSales 100.00% 100.00% 100.00% 100.00%Gross Margin 50.00% 50.00% 50.00% 6.54%Selling, General & Administrative Expenses 69.26% 46.12% 42.54% 2.73%Advertising Expenses 0.00% 0.00% 0.00% 0.15%Profit Before Interest and Taxes -19.25% 5.22% 9.96% 1.08%
Main RatiosCurrent 0.13 -0.70 1.38 1.93Quick -2.38 -9.89 -8.47 1.03Total Debt to Total Assets 882.91% -124.10% 80.70% 54.34%Pre-tax Return on Net Worth 103.29% -49.71% 774.08% 3.63%Pre-tax Return on Assets -808.70% -111.40% 149.38% 7.95%
Additional Ratios FY 2008 FY 2009 FY 2010Net Profit Margin -19.27% 5.16% 9.94% n.aReturn on Equity 0.00% 0.00% 774.08% n.a
Activity RatiosAccounts Receivable Turnover 11.35 11.35 11.35 n.aCollection Days 20 29 29 n.aInventory Turnover 1.50 1.03 1.03 n.aAccounts Payable Turnover 6.31 12.17 12.17 n.aPayment Days 27 62 28 n.aTotal Asset Turnover 41.97 0.00 15.03 n.a
Debt RatiosDebt to Net Worth 0.00 0.00 4.18 n.aCurrent Liab. to Liab. 1.00 1.00 1.00 n.a
Liquidity RatiosNet Working Capital ($59,579) ($38,274) $9,446 n.aInterest Coverage -1274.70 88.66 424.43 n.a
Additional RatiosAssets to Sales 0.02 -0.05 0.07 n.aCurrent Debt/Total Assets 883% 0% 81% n.aAcid Test -2.42 -10.05 -8.63 n.aSales/Net Worth 0.00 0.00 77.90 n.aDividend Payout 0.00 0.00 0.00 n.a
My Plan Title
Page 31

Table: Sales Forecast
Sales ForecastOct-07 Nov-07 Dec-07 Jan-08 Feb-08 Mar-08 Apr-08 May-08 Jun-08 Jul-08 Aug-08 Sep-08
SalesPerishable Items 0% $6,000 $6,500 $7,000 $7,500 $8,500 $9,000 $9,000 $9,000 $10,000 $12,000 $12,000 $17,000Non-Perishible Items 0% $12,000 $13,000 $14,000 $15,000 $17,000 $18,000 $18,000 $18,000 $19,000 $21,000 $21,000 $26,000Total Sales $18,000 $19,500 $21,000 $22,500 $25,500 $27,000 $27,000 $27,000 $29,000 $33,000 $33,000 $43,000
Direct Cost of Sales Oct-07 Nov-07 Dec-07 Jan-08 Feb-08 Mar-08 Apr-08 May-08 Jun-08 Jul-08 Aug-08 Sep-08Perishable Items $3,000 $3,250 $3,500 $3,750 $4,250 $4,500 $4,500 $4,500 $5,000 $6,000 $6,000 $8,500Non-Perishable Items $6,000 $6,500 $7,000 $7,500 $8,500 $9,000 $9,000 $9,000 $9,500 $10,500 $10,500 $13,000Subtotal Direct Cost of Sales $9,000 $9,750 $10,500 $11,250 $12,750 $13,500 $13,500 $13,500 $14,500 $16,500 $16,500 $21,500
Appendix
Page 32

Table: Personnel
Personnel PlanOct-07 Nov-07 Dec-07 Jan-08 Feb-08 Mar-08 Apr-08 May-08 Jun-08 Jul-08 Aug-08 Sep-08
Owner 0% $2,000 $2,000 $2,000 $2,000 $2,000 $2,000 $2,000 $2,000 $2,000 $2,000 $2,000 $2,000Owner/Manager 0% $2,500 $2,500 $2,500 $2,500 $2,500 $2,500 $2,500 $2,500 $2,500 $2,500 $2,500 $2,500Full Time 0% $1,400 $1,400 $1,400 $1,400 $1,400 $1,400 $1,400 $1,400 $1,400 $1,400 $1,400 $1,400Full Time 0% $1,400 $1,400 $1,400 $1,400 $1,400 $1,400 $1,400 $1,400 $1,400 $1,400 $1,400 $1,400Full Time 0% $1,400 $1,400 $1,400 $1,400 $1,400 $1,400 $1,400 $1,400 $1,400 $1,400 $1,400 $1,400Full Time 0% $1,400 $1,400 $1,400 $1,400 $1,400 $1,400 $1,400 $1,400 $1,400 $1,400 $1,400 $1,400Part Time 0% $500 $500 $500 $500 $500 $500 $500 $500 $500 $500 $500 $500Part Time 0% $500 $500 $500 $500 $500 $500 $500 $500 $500 $500 $500 $500Part Time 0% $500 $500 $500 $500 $500 $500 $500 $500 $500 $500 $500 $500Part Time 0% $500 $500 $500 $500 $500 $500 $500 $500 $500 $500 $500 $500Total People 10 10 10 10 10 10 10 10 10 10 10 10
Total Payroll $12,100 $12,100 $12,100 $12,100 $12,100 $12,100 $12,100 $12,100 $12,100 $12,100 $12,100 $12,100
Appendix
Page 33

Table: Profit and Loss
Pro Forma Profit and LossOct-07 Nov-07 Dec-07 Jan-08 Feb-08 Mar-08 Apr-08 May-08 Jun-08 Jul-08 Aug-08 Sep-08
Sales $18,000 $19,500 $21,000 $22,500 $25,500 $27,000 $27,000 $27,000 $29,000 $33,000 $33,000 $43,000Direct Costs of Goods $9,000 $9,750 $10,500 $11,250 $12,750 $13,500 $13,500 $13,500 $14,500 $16,500 $16,500 $21,500Other Costs of Goods 8.00% $0 $0 $0 $0 $0 $0 $0 $0 $0 $0 $0 $0
------------ ------------ ------------ ------------ ------------ ------------ ------------ ------------ ------------ ------------ ------------ ------------Cost of Goods Sold $9,000 $9,750 $10,500 $11,250 $12,750 $13,500 $13,500 $13,500 $14,500 $16,500 $16,500 $21,500
Gross Margin $9,000 $9,750 $10,500 $11,250 $12,750 $13,500 $13,500 $13,500 $14,500 $16,500 $16,500 $21,500Gross Margin % 50.00% 50.00% 50.00% 50.00% 50.00% 50.00% 50.00% 50.00% 50.00% 50.00% 50.00% 50.00%
ExpensesPayroll $12,100 $12,100 $12,100 $12,100 $12,100 $12,100 $12,100 $12,100 $12,100 $12,100 $12,100 $12,100Sales and Marketing and Other Expenses
$2.00 $1,000 $1,000 $1,000 $1,000 $1,000 $1,000 $1,000 $1,000 $1,000 $1,000 $1,000 $1,000
Depreciation $95 $95 $95 $95 $95 $95 $95 $95 $95 $95 $95 $95Rent $3,000 $3,000 $3,000 $3,000 $3,000 $3,000 $3,000 $3,000 $3,000 $3,000 $3,000 $3,000Utilities $300 $300 $300 $300 $300 $300 $300 $300 $300 $300 $300 $0Insurance $300 $300 $300 $300 $300 $300 $300 $300 $300 $300 $300 $300Payroll Taxes 15% $1,815 $1,815 $1,815 $1,815 $1,815 $1,815 $1,815 $1,815 $1,815 $1,815 $1,815 $1,815Other $200 $200 $200 $200 $200 $200 $200 $200 $200 $200 $200 $200
------------ ------------ ------------ ------------ ------------ ------------ ------------ ------------ ------------ ------------ ------------ ------------Total Operating Expenses $18,810 $18,810 $18,810 $18,810 $18,810 $18,810 $18,810 $18,810 $18,810 $18,810 $18,810 $18,510
Profit Before Interest and Taxes ($9,810) ($9,060) ($8,310) ($7,560) ($6,060) ($5,310) ($5,310) ($5,310) ($4,310) ($2,310) ($2,310) $2,990EBITDA ($9,715) ($8,965) ($8,215) ($7,465) ($5,965) ($5,215) ($5,215) ($5,215) ($4,215) ($2,215) ($2,215) $3,085 Interest Expense $0 $0 $0 $0 $0 $0 $0 $0 $0 $0 $25 $24 Taxes Incurred $0 $0 $0 $0 $0 $0 $0 $0 $0 $0 $0 $0
Net Profit ($9,810) ($9,060) ($8,310) ($7,560) ($6,060) ($5,310) ($5,310) ($5,310) ($4,310) ($2,310) ($2,335) $2,966Net Profit/Sales -54.50% -46.46% -39.57% -33.60% -23.77% -19.67% -19.67% -19.67% -14.86% -7.00% -7.08% 6.90%
Appendix
Page 34

Table: Cash Flow
Pro Forma Cash FlowOct-07 Nov-07 Dec-07 Jan-08 Feb-08 Mar-08 Apr-08 May-08 Jun-08 Jul-08 Aug-08 Sep-08
Cash Received
Cash from OperationsCash Sales $16,200 $17,550 $18,900 $20,250 $22,950 $24,300 $24,300 $24,300 $26,100 $29,700 $29,700 $38,700Cash from Receivables $600 $1,850 $2,000 $2,150 $2,350 $2,600 $2,700 $2,700 $2,767 $3,033 $3,300 $3,633Subtotal Cash from Operations $16,800 $19,400 $20,900 $22,400 $25,300 $26,900 $27,000 $27,000 $28,867 $32,733 $33,000 $42,333
Additional Cash ReceivedSales Tax, VAT, HST/GST Received 0.00% $0 $0 $0 $0 $0 $0 $0 $0 $0 $0 $0 $0New Current Borrowing $0 $0 $0 $0 $0 $0 $0 $0 $0 $0 $3,000 $0New Other Liabilities (interest-free) $0 $0 $0 $0 $0 $0 $0 $0 $0 $0 $0 $0New Long-term Liabilities $0 $0 $0 $0 $0 $0 $0 $0 $0 $0 $0 $0Sales of Other Current Assets $0 $0 $0 $0 $0 $0 $0 $0 $0 $0 $0 $0Sales of Long-term Assets $0 $0 $0 $0 $0 $0 $0 $0 $0 $0 $0 $0New Investment Received $0 $0 $0 $0 $0 $0 $0 $0 $0 $0 $2,000 $0Subtotal Cash Received $16,800 $19,400 $20,900 $22,400 $25,300 $26,900 $27,000 $27,000 $28,867 $32,733 $38,000 $42,333
Expenditures Oct-07 Nov-07 Dec-07 Jan-08 Feb-08 Mar-08 Apr-08 May-08 Jun-08 Jul-08 Aug-08 Sep-08
Expenditures from OperationsCash Spending $12,100 $12,100 $12,100 $12,100 $12,100 $12,100 $12,100 $12,100 $12,100 $12,100 $12,100 $12,100Bill Payments $2,921 $85,440 $22,390 $23,140 $24,115 $31,190 $25,915 $20,115 $20,415 $29,448 $38,583 $24,630Subtotal Spent on Operations $15,021 $97,540 $34,490 $35,240 $36,215 $43,290 $38,015 $32,215 $32,515 $41,548 $50,683 $36,730
Additional Cash SpentSales Tax, VAT, HST/GST Paid Out $0 $0 $0 $0 $0 $0 $0 $0 $0 $0 $0 $0Principal Repayment of Current Borrowing $0 $0 $0 $0 $0 $0 $0 $0 $0 $0 $0 $100Other Liabilities Principal Repayment $0 $0 $0 $0 $0 $0 $0 $0 $0 $0 $0 $0Long-term Liabilities Principal Repayment $0 $0 $0 $0 $0 $0 $0 $0 $0 $0 $0 $0Purchase Other Current Assets $0 $0 $0 $0 $0 $0 $0 $0 $0 $0 $0 $0Purchase Long-term Assets $0 $0 $0 $0 $0 $0 $0 $0 $0 $0 $0 $0Dividends $0 $0 $0 $0 $0 $0 $0 $0 $0 $0 $0 $0Subtotal Cash Spent $15,021 $97,540 $34,490 $35,240 $36,215 $43,290 $38,015 $32,215 $32,515 $41,548 $50,683 $36,830
Net Cash Flow $1,780 ($78,140) ($13,590) ($12,840) ($10,915) ($16,390) ($11,015) ($5,215) ($3,648) ($8,815) ($12,683) $5,503Cash Balance $1,780 ($76,361) ($89,951) ($102,791) ($113,706) ($130,096) ($141,111) ($146,326) ($149,974) ($158,789) ($171,471) ($165,968)
Appendix
Page 35

Table: Balance Sheet
Pro Forma Balance SheetOct-07 Nov-07 Dec-07 Jan-08 Feb-08 Mar-08 Apr-08 May-08 Jun-08 Jul-08 Aug-08 Sep-08
Assets Starting Balances
Current AssetsCash $0 $1,780 ($76,361) ($89,951) ($102,791) ($113,706) ($130,096) ($141,111) ($146,326) ($149,974) ($158,789) ($171,471) ($165,968)Accounts Receivable $0 $1,200 $1,300 $1,400 $1,500 $1,700 $1,800 $1,800 $1,800 $1,933 $2,200 $2,200 $2,867Inventory $0 $72,000 $78,000 $84,000 $90,000 $102,000 $108,000 $108,000 $108,000 $116,000 $132,000 $132,000 $172,000Other Current Assets $0 $0 $0 $0 $0 $0 $0 $0 $0 $0 $0 $0 $0Total Current Assets $0 $74,980 $2,940 ($4,551) ($11,291) ($10,006) ($20,296) ($31,311) ($36,526) ($32,041) ($24,589) ($37,271) $8,899
Long-term AssetsLong-term Assets $0 $0 $0 $0 $0 $0 $0 $0 $0 $0 $0 $0 $0Accumulated Depreciation $0 $95 $190 $286 $381 $476 $571 $667 $762 $857 $952 $1,048 $1,143Total Long-term Assets $0 ($95) ($190) ($286) ($381) ($476) ($571) ($667) ($762) ($857) ($952) ($1,048) ($1,143)Total Assets $0 $74,884 $2,749 ($4,836) ($11,671) ($10,482) ($20,867) ($31,977) ($37,287) ($32,898) ($25,541) ($38,319) $7,756
Liabilities and Capital Oct-07 Nov-07 Dec-07 Jan-08 Feb-08 Mar-08 Apr-08 May-08 Jun-08 Jul-08 Aug-08 Sep-08
Current LiabilitiesAccounts Payable $0 $84,695 $21,620 $22,345 $23,070 $30,320 $25,245 $19,445 $19,445 $28,145 $37,811 $22,369 $65,578Current Borrowing $0 $0 $0 $0 $0 $0 $0 $0 $0 $0 $0 $3,000 $2,900Other Current Liabilities $0 $0 $0 $0 $0 $0 $0 $0 $0 $0 $0 $0 $0Subtotal Current Liabilities $0 $84,695 $21,620 $22,345 $23,070 $30,320 $25,245 $19,445 $19,445 $28,145 $37,811 $25,369 $68,478
Long-term Liabilities $0 $0 $0 $0 $0 $0 $0 $0 $0 $0 $0 $0 $0Total Liabilities $0 $84,695 $21,620 $22,345 $23,070 $30,320 $25,245 $19,445 $19,445 $28,145 $37,811 $25,369 $68,478
Paid-in Capital $0 $0 $0 $0 $0 $0 $0 $0 $0 $0 $0 $2,000 $2,000Retained Earnings $0 $0 $0 $0 $0 $0 $0 $0 $0 $0 $0 $0 $0Earnings $0 ($9,810) ($18,870) ($27,181) ($34,741) ($40,801) ($46,111) ($51,422) ($56,732) ($61,042) ($63,352) ($65,688) ($62,722)Total Capital $0 ($9,810) ($18,870) ($27,181) ($34,741) ($40,801) ($46,111) ($51,422) ($56,732) ($61,042) ($63,352) ($63,688) ($60,722)Total Liabilities and Capital $0 $74,884 $2,749 ($4,836) ($11,671) ($10,482) ($20,867) ($31,977) ($37,287) ($32,898) ($25,541) ($38,319) $7,756
Net Worth $0 ($9,810) ($18,870) ($27,181) ($34,741) ($40,801) ($46,111) ($51,422) ($56,732) ($61,042) ($63,352) ($63,688) ($60,722)
Appendix
Page 36