
EARNINGS UPDATE New Flyer Industries...
14
Find CIBC research on Bloomberg, Reuters, firstcall.com CIBC World Markets Inc., P.O. Box 500, 161 Bay Street, Brookfield Place, Toronto, Canada M5J 2S8 (416) 594-7000 and ResearchCentral.cibcwm.com CIBC World Markets Corp., 425 Lexington Avenue, New York, NY 10017 (212)-856-4000 I NSTITUTIONAL E QUITY R ESEARCH Kevin Chiang, CFA 1 (416) 594-7198 [email protected] Khaled Omar, CFA 1 (416) 956-6807 [email protected] E ARNINGS U PDATE j New Flyer Industries Inc. Q3 Order And Backlog Update - A Sign Of Peak Earnings? All figures in US dollars, unless otherwise stated.(C$1.316:US$1) 16-144571 © 2016 CIBC World Markets Corp., the U.S. broker-dealer, and CIBC World Markets Inc., the Canadian broker-dealer (collectively, CIBC World Markets Corp./Inc.) do and seek to do business with companies covered in its research reports. As a result, investors should be aware that CIBC World Markets Corp./Inc. may have a conflict of interest that could affect the objectivity of this report. Investors should consider this report as only a single factor in making their investment decision. For required regulatory disclosures please refer to "Important Disclosures" beginning on page 10. Please see "Price Target Calculations" and "Key Risks to Price Target" information on page(s) 8. October 17, 2016 Capital Equipment Stock Rating: S ECTOR O UTPERFORMER Key Ratios and Statistics 12-18 mo. Price Target C$50.00 NFI-TSX (10/17/16) C$37.83 Key Indices: Toronto 3-5-Yr. EPS Gr. Rate (E) NM 52-week Range C$18.04-C$44.87 Shares Outstanding 59.0M Float 54.0M Shrs Avg. Daily Trading Vol. 38,000 Market Capitalization C$1,054.5M Dividend/Div Yield C$0.95 / 3.3% Fiscal Year Ends December Book Value $9.30 per Shr 2015 ROE (E) 16.1% LT Debt $476.5M Net Asset Value Common Equity $554.7M Convertible Available Yes EBITDA ($mln) 2014 2015 2016 2017 Current $107.4A $151.4A $288.9E $300.1E Prior $295.0E $307.8E Estimates (Dec. 31) Valuation (Dec. 31) EV/EBITDA-Curr 21.4X 14.3X 7.5X 7.8X EV/EBITDA-Prior 8.6X 8.3X Company Description New Flyer Industries Inc. is the largest North American manufacturer of heavy-duty transit buses supplying transit authorities in Canada and the U.S. as well as motor coach buses. www.newflyer.com What's The Event Key Takeaway: While the reduction in NFI's Aftermarkets 2016 revenue guidance was disappointing (from up 5% Y/Y to flat), we view this as a short-term bump in the road. Over the long term, we expect Aftermarkets to remain a source of growth, especially as NFI reaps the benefits of Project Convergence. Overall, we believe NFI continues to have room to expand earnings and we maintain our constructive view on the company. We maintain our Sector Outperformer rating, but reduced our price target from C$51 to C$50. Noisy Q3 Delivery Results: NFI reported noisy Q3 delivery results (777 EUs delivered) reflecting the impact of the NJ Transit funding issue, though this looks like it will be resolved shortly. The overall demand environment remains strong. The downward revision to Aftermarkets revenue growth was a negative surprise though the company was clear this was due to a "short-term dampening effect on the aftermarket parts business". A Sign Of Peak Earnings: In this report we address a key question post these Q3 delivery results which is whether NFI has hit peak earnings as bus demand is being driven by the replacement cycle and Aftermarkets growth will be flat this year. We do not believe that is the case. While we are forecasting $300 million in EBITDA in 2017E, using bottoms up analysis, we see an opportunity for NFI to drive ~$340+ million of EBITDA from its current revenue run rate. Specifically, we have built in some conservatism in our bus margin forecast (~$55,000 per EU in 2017E versus ~$59,000 in Q2), ongoing tailwind from MCI synergies, and expanding margins within Aftermarkets as NFI integrates recent acquisitions. Also, with NFI trading at 7.8x our 2017E EBITDA, the company is not trading at a significant premium relative its historic average given the step up in its FCF and earnings profile. Earnings Adjustments: We tweak our estimates as we actualize Q3 deliveries and take into consideration NFI's update guidance. Our 2016 EBITDA declines to $289 million from $295 million while our 2017 EBITDA estimate declines to $300 million from $308 million.
Transcript of EARNINGS UPDATE New Flyer Industries...
Find CIBC research on Bloomberg, Reuters, firstcall.com CIBC World Markets Inc., P.O. Box 500, 161 Bay Street, Brookfield Place, Toronto, Canada M5J 2S8 (416) 594-7000
and ResearchCentral.cibcwm.com CIBC World Markets Corp., 425 Lexington Avenue, New York, NY 10017 (212)-856-4000
IN S T I T U T I O N A L EQ U I T Y RE S E A R C H
Kevin Chiang, CFA 1 (416) 594-7198 [email protected]
Khaled Omar, CFA 1 (416) 956-6807 [email protected]
E A R N I N G S U P D A T E j
New Flyer Industries Inc.
Q3 Order And Backlog Update - A Sign Of Peak Earnings?
All figures in US dollars, unless otherwise stated.(C$1.316:US$1) 16-144571 © 2016
CIBC World Markets Corp., the U.S. broker-dealer, and CIBC World Markets Inc., the Canadian broker-dealer (collectively, CIBC World Markets Corp./Inc.) do and seek to do business with companies covered in its research reports. As a result, investors should be aware that CIBC World Markets Corp./Inc. may have a conflict of interest that could affect the objectivity of this report. Investors should consider this report as only a single factor in making their investment decision. For required regulatory disclosures please refer to "Important Disclosures" beginning on page 10. Please see "Price Target Calculations" and "Key Risks to Price Target" information on page(s) 8.
October 17, 2016
Capital Equipment
Stock Rating: S E C T O R O U T P E R F O R M E R
Key Ratios and Statistics
12-18 mo. Price Target C$50.00
NFI-TSX (10/17/16) C$37.83
Key Indices: Toronto
3-5-Yr. EPS Gr. Rate (E) NM
52-week Range C$18.04-C$44.87
Shares Outstanding 59.0M
Float 54.0M Shrs
Avg. Daily Trading Vol. 38,000
Market Capitalization C$1,054.5M
Dividend/Div Yield C$0.95 / 3.3%
Fiscal Year Ends December
Book Value $9.30 per Shr
2015 ROE (E) 16.1%
LT Debt $476.5M
Net Asset Value
Common Equity $554.7M
Convertible Available Yes
EBITDA ($mln) 2014 2015 2016 2017
Current $107.4A $151.4A $288.9E $300.1E
Prior $295.0E $307.8E
Estimates (Dec. 31)
Valuation (Dec. 31)
EV/EBITDA-Curr 21.4X 14.3X 7.5X 7.8X
EV/EBITDA-Prior 8.6X 8.3X
Company Description New Flyer Industries Inc. is the largest North American manufacturer of heavy-duty transit buses supplying transit authorities in Canada and the U.S. as well as motor coach buses. www.newflyer.com
What's The Event
Key Takeaway: While the reduction in NFI's Aftermarkets 2016 revenue guidance was disappointing (from up 5% Y/Y to flat), we view this as a short-term bump in the road. Over the long term, we expect Aftermarkets to remain a source of growth, especially as NFI reaps the benefits of Project Convergence. Overall, we believe NFI continues to have room to expand earnings and we maintain our constructive view on the company. We maintain our Sector Outperformer rating, but reduced our price target from C$51 to C$50. Noisy Q3 Delivery Results: NFI reported noisy Q3 delivery results (777 EUs delivered) reflecting the impact of the NJ Transit funding issue, though this looks like it will be resolved shortly. The overall demand environment remains strong. The downward revision to Aftermarkets revenue growth was a negative surprise though the company was clear this was due to a "short-term dampening effect on the aftermarket parts business". A Sign Of Peak Earnings: In this report we address a key question post these Q3 delivery results which is whether NFI has hit peak earnings as bus demand is being driven by the replacement cycle and Aftermarkets growth will be flat this year. We do not believe that is the case. While we are forecasting $300 million in EBITDA in 2017E, using bottoms up analysis, we see an opportunity for NFI to drive ~$340+ million of EBITDA from its current revenue run rate. Specifically, we have built in some conservatism in our bus margin forecast (~$55,000 per EU in 2017E versus ~$59,000 in Q2), ongoing tailwind from MCI synergies, and expanding margins within Aftermarkets as NFI integrates recent acquisitions. Also, with NFI trading at 7.8x our 2017E EBITDA, the company is not trading at a significant premium relative its historic average given the step up in its FCF and earnings profile. Earnings Adjustments: We tweak our estimates as we actualize Q3 deliveries and take into consideration NFI's update guidance. Our 2016 EBITDA declines to $289 million from $295 million while our 2017 EBITDA estimate declines to $300 million from $308 million.
Q3 Order And Backlog Update - A Sign Of Peak Earnings? - October 17, 2016
2
Source: Company reports and CIBC World Markets Inc.
New Flyer Industries Inc. Sector OutperformerNFI-TSX 10/17/16 C$37.83 Kevin Chiang, (416-594-7198) [email protected]
12- To 18- Month Price Target: C$50.00 Khaled Omar, (416-956-6807) [email protected]
Capital Equipment
All figures in US$ millions, except per share data.
EV/EBITDA Multiples 2015A 2016E 2017E
Consensus estimates except New Flyer
New Flyer Industries 15.4x 8.1x 7.8x
High-Yielding Industrials 13.5x 9.0x 8.3x
Commercial Vehicle & Parts 18.5x 22.9x 18.7x
Manufacturers
P/E Multiples 2015A 2016E 2017E
Consensus estimates except New Flyer
New Flyer Industries 22.8x 14.4x 13.0x
High-Yielding Industrials 14.7x 15.8x 12.4x
Commercial Vehicle & Parts 14.3x 16.9x 15.4x
Manufacturers
Key Financial Metrics 2014A 2015A 2016E 2017E
EBITDA Margin 7.4% 9.8% 12.9% 12.9%
Current Ratio 1.1x 1.1x 1.3x 1.3x
Debt/Equity 53.1% 148.2% 104.5% 96.9%
Debt/Total Capital 34.7% 59.7% 51.1% 49.2%
Income Statement 2014A 2015A 2016E 2017E
Bus Manufacturing Revenues $1,132 $1,217 $1,818 $1,900
Aftermarket Revenues $319 $322 $420 $422
Revenues - Consolidated $1,451 $1,539 $2,238 $2,322
Cost of Sales $1,313 $1,341 $1,866 $1,964
Gross Profit $138 $197 $372 $358
EBITDA $107 $151 $289 $300
EBIT $51 $90 $214 $231
EBT $38 $76 $179 $204
Net Income $27 $54 $116 $133
Balance Sheet Q2/16A
Current Assets 710
Total Assets 1,760
Current Liabilities 502
Total Liabilities 1,205
Shareholders' Equity 555
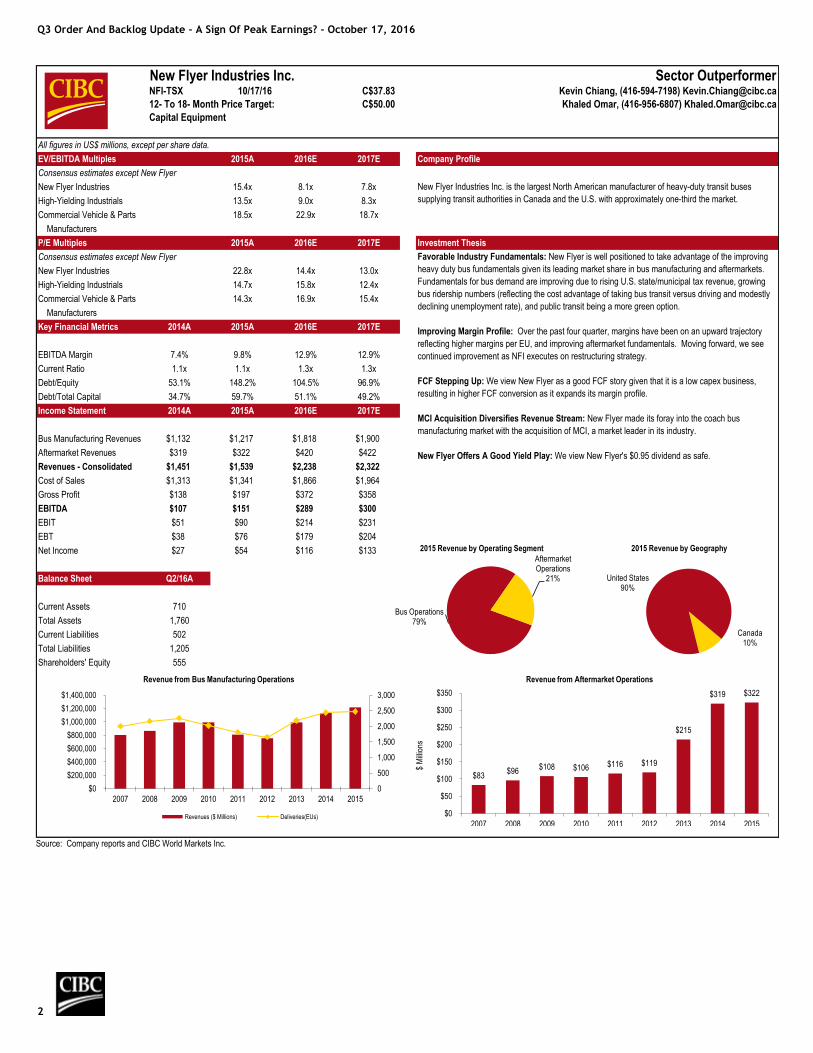
Company Profile
New Flyer Industries Inc. is the largest North American manufacturer of heavy-duty transit buses
supplying transit authorities in Canada and the U.S. with approximately one-third the market.
Investment Thesis
Favorable Industry Fundamentals: New Flyer is well positioned to take advantage of the improving
heavy duty bus fundamentals given its leading market share in bus manufacturing and aftermarkets.
Fundamentals for bus demand are improving due to rising U.S. state/municipal tax revenue, growing
bus ridership numbers (reflecting the cost advantage of taking bus transit versus driving and modestly
declining unemployment rate), and public transit being a more green option.
Improving Margin Profile: Over the past four quarter, margins have been on an upward trajectory
reflecting higher margins per EU, and improving aftermarket fundamentals. Moving forward, we see
continued improvement as NFI executes on restructuring strategy.
FCF Stepping Up: We view New Flyer as a good FCF story given that it is a low capex business,
resulting in higher FCF conversion as it expands its margin profile.
MCI Acquisition Diversifies Revenue Stream: New Flyer made its foray into the coach bus
manufacturing market with the acquisition of MCI, a market leader in its industry.
New Flyer Offers A Good Yield Play: We view New Flyer's $0.95 dividend as safe.
Canada10%
United States90%
2015 Revenue by Geography
Bus Operations79%
Aftermarket Operations
21%
2015 Revenue by Operating Segment
0
500
1,000
1,500
2,000
2,500
3,000
$0
$200,000
$400,000
$600,000
$800,000
$1,000,000
$1,200,000
$1,400,000
2007 2008 2009 2010 2011 2012 2013 2014 2015
Revenue from Bus Manufacturing Operations
Revenues ($ Millions) Deliveries(EUs)
$83 $96
$108 $106 $116 $119
$215
$319 $322
$0
$50
$100
$150
$200
$250
$300
$350
2007 2008 2009 2010 2011 2012 2013 2014 2015
$ M
illio
ns
Revenue from Aftermarket Operations
Q3 Order And Backlog Update - A Sign Of Peak Earnings? - October 17, 2016
3
A Sign Of Peak Earnings? New Flyer reported noisy Q3/16 delivery results and took down its revenue growth expectations in Aftermarkets, which was a negative surprise. We provide an update on New Flyer's deliveries and order environment below but the key question on the back of this release is whether the company has hit peak earnings. New Flyer has stated that bus deliveries currently reflect the replacement cycle (versus market growth) and total industry deliveries for heavy-duty buses and coach buses are expected to be steady at ~5,300 EUs and ~2,250 EUs, respectively, for the foreseeable future. The area of growth for New Flyer was in its Aftermarkets division, but here, the company has taken down its revenue growth guidance from up 5% Y/Y in 2016 to flat. So if we have hit peak earnings, the risk is that New Flyer's earnings multiple will contract.
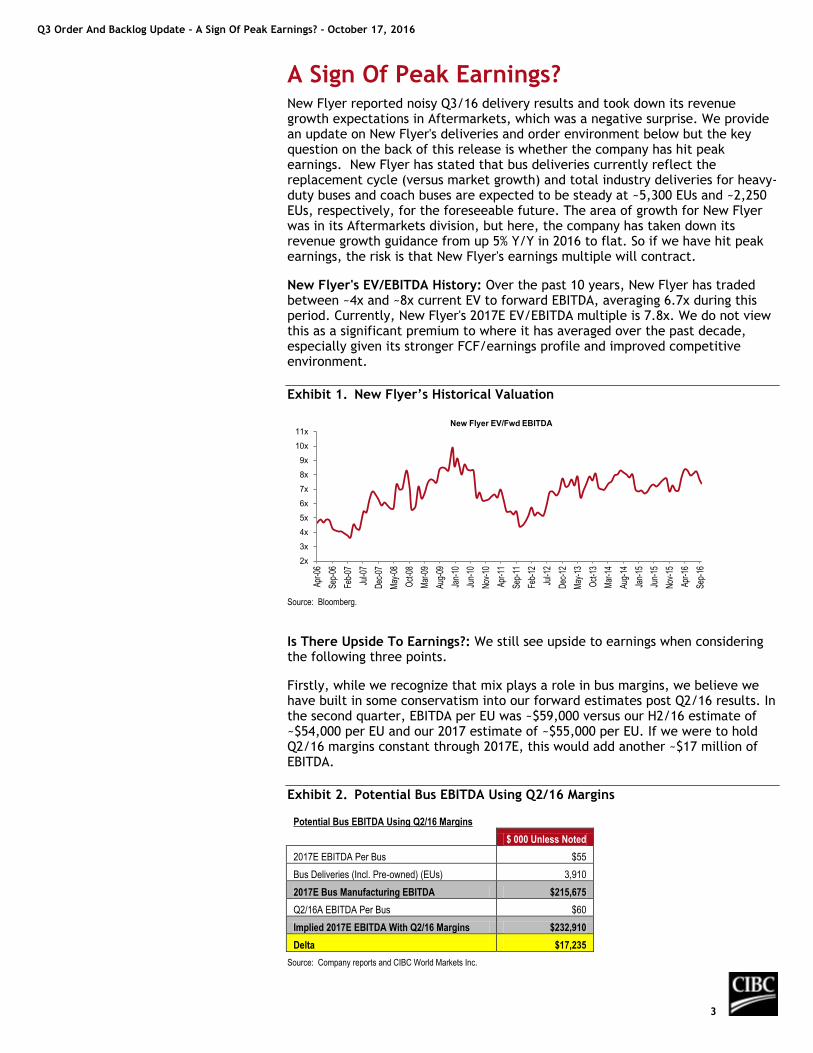
New Flyer's EV/EBITDA History: Over the past 10 years, New Flyer has traded between ~4x and ~8x current EV to forward EBITDA, averaging 6.7x during this period. Currently, New Flyer's 2017E EV/EBITDA multiple is 7.8x. We do not view this as a significant premium to where it has averaged over the past decade, especially given its stronger FCF/earnings profile and improved competitive environment.
Exhibit 1. New Flyer’s Historical Valuation
Source: Bloomberg.
Is There Upside To Earnings?: We still see upside to earnings when considering the following three points.
Firstly, while we recognize that mix plays a role in bus margins, we believe we have built in some conservatism into our forward estimates post Q2/16 results. In the second quarter, EBITDA per EU was ~$59,000 versus our H2/16 estimate of ~$54,000 per EU and our 2017 estimate of ~$55,000 per EU. If we were to hold Q2/16 margins constant through 2017E, this would add another ~$17 million of EBITDA.
Exhibit 2. Potential Bus EBITDA Using Q2/16 Margins
Potential Bus EBITDA Using Q2/16 Margins
$ 000 Unless Noted
2017E EBITDA Per Bus $55
Bus Deliveries (Incl. Pre-owned) (EUs) 3,910
2017E Bus Manufacturing EBITDA $215,675
Q2/16A EBITDA Per Bus $60
Implied 2017E EBITDA With Q2/16 Margins $232,910
Delta $17,235
Source: Company reports and CIBC World Markets Inc.
2x
3x
4x
5x
6x
7x
8x
9x
10x
11x
Apr-0
6
Sep-
06
Feb-
07
Jul-0
7
Dec
-07
May
-08
Oct
-08
Mar
-09
Aug-
09
Jan-
10
Jun-
10
Nov
-10
Apr-1
1
Sep-
11
Feb-
12
Jul-1
2
Dec
-12
May
-13
Oct
-13
Mar
-14
Aug-
14
Jan-
15
Jun-
15
Nov
-15
Apr-1
6
Sep-
16
New Flyer EV/Fwd EBITDA
Q3 Order And Backlog Update - A Sign Of Peak Earnings? - October 17, 2016
4
Secondly, we expect continued synergies from MCI. The MCI synergy target has been set to $10 million ($5 million run rate achieved) but we see an opportunity for this to increase to ~$25 million-$30 million but have only baked in the guided amount. If New Flyer achieves this level of synergies, we estimate that is an additional $23 million of EBITDA tailwind. Note, we have baked in New Flyer’s MCI synergies off of Q4/15 and Q1/16 bus EBITDA run rates, which were below that of Q2/16.
Exhibit 3. MCI Synergy Upside
MCI Synergy Upside
$ Mln Unless Noted Comment
MCI Targeted Synergies $10 Targeted synergies
Run Rate Annualized Synergies Achieved H1/16 $5 Run rate synergies achieved as of Q2/16
Actual Savings $3 Assume half of $5 mln saving booked in H1/16
Additional Synergy Savings $8
Potential Incremental Upside MCI Synergies $15 Assume total MCI synergies of $25-$30 mln
Additional Synergies From Acquisition Of MCI $23
Source: Company reports and CIBC World Markets Inc.
Thirdly, Aftermarkets margins should benefit from Project Convergence. In Q2/16, New Flyer noted that it had completed the primary milestone related to this initiative which was to integrate New Flyer's and NABI's aftermarkets operations. There is further opportunity for margin expansion as the company integrates MCI's aftermarkets business. Currently, we assume Aftermarkets margins are steady at ~20% and have not quantified this potential upside. But holding revenue flat, every 100 bps improvement in margins adds just over $4 million in EBITDA.
Exhibit 4. Opportunity For Margin Upside In Aftermarkets Business
Aftermarkets Operating Leverage
$ 000 Unless Noted
2017 Aftermarkets Revenue $422,150
Incremental Margin Lift 1.0%
Incremental EBITDA $4,222
Source: Company reports and CIBC World Markets Inc.
Overall, while we are forecasting $300 million of EBITDA in 2017E, we see New Flyer capable of squeezing out another $40+ million of earnings from its current revenue run rate. As such, while the updated Aftermarkets guidance was disappointing, we do not believe New Flyer has hit peak earnings. We see continued upward momentum in its EBITDA and FCF which is supportive of its multiple (and multiple expansion).
Exhibit 5. EBITDA Potential
EBITDA Potential
$ Mln Unless Noted
2017E EBITDA Estimate $300
Bus EBITDA Lift On Q2/16 Margins $17
Addiotional MCI Synergies $23
Aftermarkets - 100 bps Margin Improvement $4
Pro-forma EBITDA $344
Source: Company reports and CIBC World Markets Inc.

Q3 Order And Backlog Update - A Sign Of Peak Earnings? - October 17, 2016
5
Share Price Reaction Looks Overdone: On the back of New Flyer’s updated Aftermarkets guidance, its share price was down 5.8%. We view this as an overreaction. Even if we assume that Aftermarkets revenue is flat Y/Y in 2017E and margins hold at ~20%, this is a ~$7-$8 million hit to our EBITDA estimate. Applying a ~9x-10x EBITDA multiple to this (reflecting retail multiple), this suggests a ~4% hit all else equal. While there is an inherent volatility in New Flyer’s quarterly financial results given the impact of mix, we continue to see a positive long-term FCF trend. While this will be prioritized in the near-term to deleverage the balance sheet, we expect the company to look to return cash to shareholders (through dividend growth) and find tuck-in acquisitions. While New Flyer does compete in a mature market, we believe its margin expansion story and opportunities to acquire revenue will help bolster the bottom line.
Exhibit 6. Share Price Reaction Looks Overdone
Implied Share Price Impact Of Aftermarkets Guidance Adjustment
2017E
$000 Unless Noted Before After
Aftermarkets Revenue $460,615 $422,150
Aftermarkets EBITDA $84,430 $92,123
Delta $7,693
Multiple 9.5x
Implied Market Cap Impact $73,084
Shares Outstanding (000) 59,740
Implied Share Price Impact $1.22
Implied Share Price Impact (C$) $1.59
NFI Share Price (C$) (10/14/2016) $40.17
As A % Of Share Price 4.0%
Source: Company reports and CIBC World Markets Inc.
Q3 Order And Backlog Update Bus Deliveries: Bus deliveries came in weaker than expected at 777 EUs (excl. preowned) versus our estimate of 859 EUs, and up from 625 EUs last year. The variance versus our estimate mainly reflects our underestimation of the annual three-week summer shutdown at MCI. Q3/16 deliveries decreased 135 EUs Q/Q primarily as a result of MCI's scheduled shutdown and the impact of New Jersey Transit's contract suspension. We view this to be more of a timing issue as New Flyer maintained its annual delivery guidance at 3,450 EUs which essentially results in the shift out of deliveries from Q3/16 to Q4/16 in terms of our delivery assumption for the full year (inferred Q4/16 deliveries is 932 EUs). Total bus and coach inventory as of October 2 was 632 EUs, an increase of 73 EUs from the previous quarter mainly related to the New Jersey Transit contract suspension with MCI. Recall, New Flyer had noted that the ongoing delay in restarting the NJ Transit contract would result in $30-$35 million of incremental working capital this year.
New Orders And Backlog: New bus orders in Q3/16 totaled 585 EUs, a decline from 1,428 last quarter, and versus 1,133 last year but we are not concerned by this as orders tend to be lumpy throughout the year. 800 EUs of new firm and option orders are pending from customers as documentation had not been received by the company. As such, we expect these EUs will likely transition into the Q4/16 backlog. Order activity in Q3/16 included firm orders for 274 EUs (valued at $116M), option orders for 311 EUs (valued at $126M), and options for 288 EUs converted to firm orders (valued at $148M). The company's backlog remains healthy with the book-to-bill ratio sitting at 135% at the end of the
Q3 Order And Backlog Update - A Sign Of Peak Earnings? - October 17, 2016
6
quarter. The firm backlog at the end of Q3/16 totaled 2,820 EUs, down modestly Q/Q.
Bid Universe: In terms of the order pipeline, the total bid universe (excluding MCI) in Q3/16 totaled 23,735 EUS, a significant increase of 4,403 EUs Q/Q, attributed to both an overall increase in the number of procurements issue by customers, and a longer time period between proposal submittal and bid awards for the quarter. The total number of active EUs was 6,597, an increase of 2,399 EUs over the previous quarter. These results underscore the strong demand environment reflecting the increased need to replace ageing fleet and a more stable public funding environment.
Aftermarkets - The Negative Surprise: In Aftermarkets, management now expects its core revenues (excl. CTA contract) to be essentially flat Y/Y in 2016 which is a negative adjustment from its previous expectation of realizing 5% Y/Y growth. New Flyer noted that the increase in new bus and coach sales in recent years leading to increased fleet replacement has had a short-term dampening impact on the aftermarket parts business. As for the business' performance in the quarter, gross orders increased by 40% Y/Y and declined 0.9% sequentially. Total shipments increased by 50% Y/Y (down 0.5% Q/Q) with the completion of the CTA mid-life upgrade program partially offsetting increases related to the acquisition of MCI.
New Jersey Transit MCI Contract: The New Jersey Transportation Trust Fund Account (TTFA) has been re-authorized to provide $2 billion annually to the fund over the next eight years. The bill was signed into law by Governor Christie on October 14 which was immediately followed by the Governor issuing an Executive Order to lift the suspension of all work funded under the TTFA. Subsequently, the New Jersey State Treasurer, the Director of the Division of the Budget and Accounting and the Commissioner of the Department of Transportation were ordered to implement an interim funding solution in order to permit the immediate recommencement of transportation projects funded by the TTFA. New Flyer has noted that it now awaits instructions from NJ Transit to have completed coaches inspected, followed by an inspection by the New Jersey DOT, and then delivery to NJ Transit. New Flyer also noted that it is waiting for instruction from NJ Transit to commence the manufacturing of the remaining coaches under the first purchase order. Recall, back in July New Flyer announced that MCI received a notice from NJ Transit that required an orderly shutdown of all ongoing work under a contract to build commuter coaches. This arrived on the back of a delay in the replenishment of the TTFA. New Flyer had noted that the suspension of its contract would impact ~140 buses to be delivered in 2016 with the overall contract size totaling 772 commuter coaches and options for an additional 450 units over six years.
Adjusting Earnings Expectations And Q3/16 Preview
Q3/16 Preview – Reporting On November 9 We tweak our estimates as we actualize Q3/16 deliveries and take down our revenue growth assumptions in the aftermarkets business reflecting New Flyer’s updated guidance. For Q3/16, our EBITDA estimate declines to $64 million from $73 million previously, and up from $36 million last year. The decline in Q3/16 earnings reflects primarily the impact from deliveries shifting from Q3/16 to Q4/16 (reduction in Aftermarkets accounted for ~$2 million EBITDA hit in the third quarter).
With the release of Q3/16 results, which is scheduled for November 9, we look forward to gaining additional clarity on New Flyer’s outlook in the aftermarkets

Q3 Order And Backlog Update - A Sign Of Peak Earnings? - October 17, 2016
7
business given its guidance revision. While the company noted that increased fleet replacement had a short-term impact on the business, we will look to see whether this phenomenon has impacted the company’s view of this market longer-term. Separately, with the TTFA now re-authorized, we will look for an update on management’s expectations on the timing of the delivery ramp up for the New Jersey Transit contract. Finally, we look forward to receiving an update on overall industry fundamentals, progress being made on the integration of MCI , and the company’s view on the production rate heading into 2017.
Exhibit 7. Q3/16 Preview
Q3/16 Expectations ($ 000 Unless Noted)
Q3/16 E Q3/15 A Y/Y Q2/16 A Q/Q
Manufacturing
Revenue $399,868 $292,970 36% $480,911 -17%
EBITDA $43,610 $21,606 102% $60,640 -28%
Margin (%) 10.9% 7.4% 48% 12.6% -14%
Aftermarkets
Revenue $100,398 $71,713 40% $106,026 -5%
EBITDA $20,080 $14,671 37% $19,691 2%
Margin (%) 20.0% 20.5% -2% 18.6% 8%
Consolidated
Revenue $500,266 $368,683 36% $586,937 -15%
EBITDA $63,690 $36,277 76% $80,331 -21%
Margin (%) 12.7% 9.8% 29% 13.7% -7%
Source: Company reports and CIBC World Markets Inc.
Earnings Adjustments Our 2016 EBITDA declines to $289 million (from $295 million previously), while our 2017 EBITDA estimate declines to $300 million (from $308 million previously). Our reduced earnings estimates mainly reflect the negative aftermarkets business guidance as we now assume flat core aftermarkets revenue growth in 2016 versus 5% Y/Y previously and assume flat revenue growth in 2017 (versus ~5% Y/Y previously).
Exhibit 8. Summary Of Changes
2016E 2017E
$ Mln Unless Noted Before After % Before After %
Deliveries (EUs) 3,479 3,450 -1% 3,605 3,605 0%
Revenue 2,274 2,238 -2% 2,361 2,322 -2%
Bus 1,835 1,818 -1% 1,900 1,900 0%
Aftermarkets 439 420 -4% 461 422 -8%
EBITDA 295 289 -2% 308 300 -2%
Bus 209 206 -1% 216 216 0%
Aftermarkets 86 83 -4% 92 84 -8%
FCFPS 1.64 1.67 2% 3.06 2.97 -3%
Source: Company reports and CIBC World Markets Inc.

Q3 Order And Backlog Update - A Sign Of Peak Earnings? - October 17, 2016
8
Price Target Calculation We derive our C$50.00 price target by applying ~9x EV/EBITDA multiple to our 2017 EBITDA estimate and using pro-forma net debt. Our target multiple is at the upper end of NFI’s historical trading range given the longer-term positive impact of heavy-duty bus demand and the company’s leverage to an improving U.S. economy
Key Risks To Price Target
Key risks for New Flyer are competition from established players, government budget and funding concerns, labour agreements, foreign exchange risk, and input costs negatively impacting margins.
Exhibit 9. Income Statement
Source: Company reports and CIBC World Markets Inc.
F2014 Q1/F15 Q2/F15 Q3/F15 Q4/F15 F2015 Q1/F16 Q2/F16 Q3/F16E Q4/F16E F2016E F2017E
Income Statement (US$ 000)
Revenue $1,451,100 $380,301 $375,012 $364,683 $418,904 $1,538,900 $553,226 $586,937 $500,266 $597,286 $2,237,715 $2,322,223
Cost of Sales $1,312,817 $340,674 $326,581 $315,349 $358,848 $1,341,452 $456,715 $479,598 $424,070 $505,703 $1,866,086 $1,964,062
Gross Profit $138,283 $39,627 $48,431 $49,334 $60,056 $197,448 $96,511 $107,339 $76,196 $91,583 $371,629 $358,161
SGA $30,918 $8,213 $9,240 $13,057 $15,498 $46,008 $28,333 $27,008 $12,507 $14,932 $82,780 $58,056
EBITDA $107,365 $31,414 $39,191 $36,277 $44,558 $151,440 $68,178 $80,331 $63,690 $76,651 $288,850 $300,105
Amortization $35,837 $9,507 $9,845 $10,021 $8,685 $38,058 $14,809 $14,261 $17,842 $17,693 $64,605 $68,635
FX loss (gain) $1,547 ($1,455) $688 $628 ($626) ($765) $603 ($2,761) $0 $0 $0 $0
Operating Earnings $69,981 $23,362 $28,658 $25,628 $36,499 $114,147 $52,766 $68,831 $45,848 $58,958 $226,402 $231,470
EBIT $51,440 $18,239 $24,641 $23,999 $23,071 $89,950 $46,413 $63,222 $45,848 $58,958 $214,440 $231,470
Interest On Long-Term Debt $8,897 $2,334 $2,200 $2,161 $2,635 $9,330 $5,935 $4,334 $4,609 $4,571 $19,449 $17,910
Interest Expense $13,872 $4,131 $3,090 $3,488 $3,510 $14,219 $11,474 $10,193 $6,991 $6,953 $35,611 $27,438
EBT $37,568 $14,108 $21,551 $20,511 $19,561 $75,731 $34,939 $53,029 $38,857 $52,004 $178,829 $204,032
Income Tax Expense $10,849 $3,253 $9,181 $3,952 $5,451 $21,837 $12,351 $18,283 $13,600 $18,202 $62,435 $71,411
Net Income $26,719 $10,855 $12,370 $16,559 $14,110 $53,894 $22,588 $34,746 $25,257 $33,803 $116,394 $132,621
FD EPS (ex-unusuals) $0.83 $0.24 $0.29 $0.31 $0.43 $1.25 $0.52 $0.63 $0.42 $0.57 $1.98 $2.19
Q3 Order And Backlog Update - A Sign Of Peak Earnings? - October 17, 2016
9
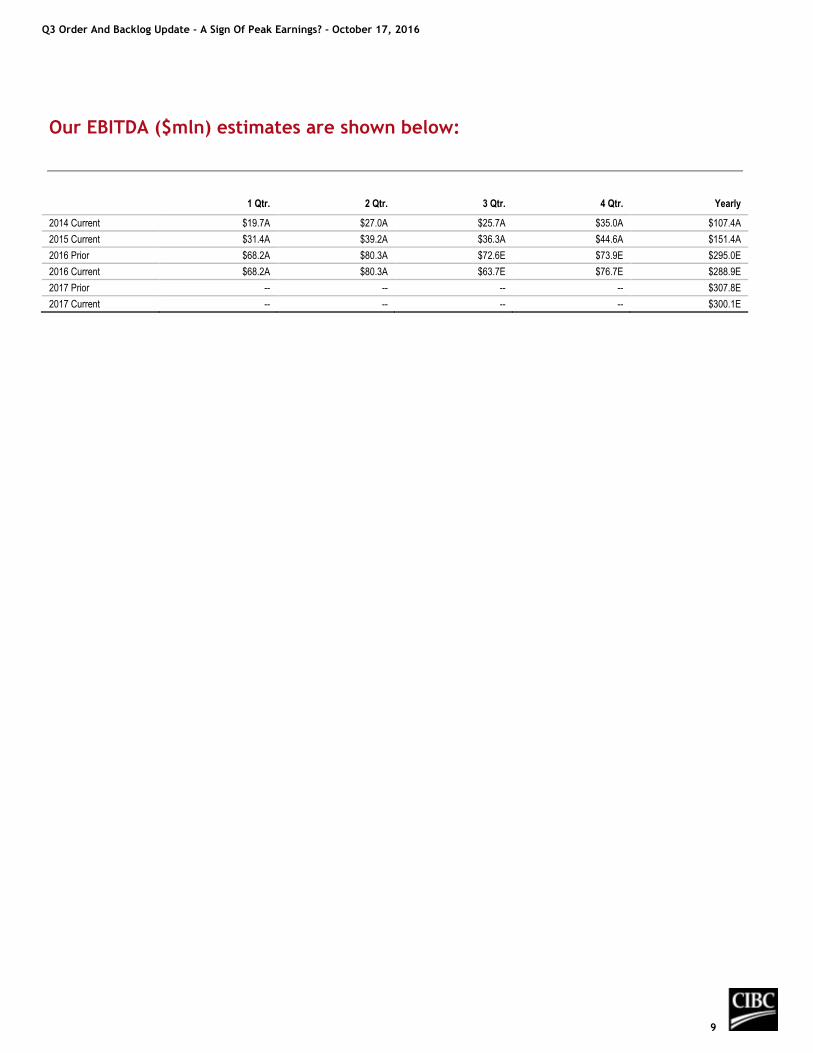
Our EBITDA ($mln) estimates are shown below:
1 Qtr. 2 Qtr. 3 Qtr. 4 Qtr. Yearly
2014 Current $19.7A $27.0A $25.7A $35.0A $107.4A
2015 Current $31.4A $39.2A $36.3A $44.6A $151.4A
2016 Prior $68.2A $80.3A $72.6E $73.9E $295.0E
2016 Current $68.2A $80.3A $63.7E $76.7E $288.9E
2017 Prior -- -- -- -- $307.8E
2017 Current -- -- -- -- $300.1E
Q3 Order And Backlog Update - A Sign Of Peak Earnings? - October 17, 2016
1 0
IMPORTANT DISCLOSURES:
Analyst Certification: Each CIBC World Markets Corp./Inc. research analyst named on the front page of this research report, or at the beginning of any subsection hereof, hereby certifies that (i) the recommendations and opinions expressed herein accurately reflect such research analyst's personal views about the company and securities that are the subject of this report and all other companies and securities mentioned in this report that are covered by such research analyst and (ii) no part of the research analyst's compensation was, is, or will be, directly or indirectly, related to the specific recommendations or views expressed by such research analyst in this report.
Analysts employed outside the U.S. are not registered as research analysts with FINRA. These analysts may not be associated persons of CIBC World Markets Corp. and therefore may not be subject to FINRA Rule 2241 restrictions on communications with a subject company, public appearances and trading securities held by a research analyst account.
Potential Conflicts of Interest: Equity research analysts employed by CIBC World Markets Corp./Inc. are compensated from revenues generated by various CIBC World Markets Corp./Inc. businesses, including the CIBC World Markets Investment Banking Department. Research analysts do not receive compensation based upon revenues from specific investment banking transactions. CIBC World Markets Corp./Inc. generally prohibits any research analyst and any member of his or her household from executing trades in the securities of a company that such research analyst covers. Additionally, CIBC World Markets Corp./Inc. generally prohibits any research analyst from serving as an officer, director or advisory board member of a company that such analyst covers.
In addition to 1% ownership positions in covered companies that are required to be specifically disclosed in this report, CIBC World Markets Corp./Inc. may have a long position of less than 1% or a short position or deal as principal in the securities discussed herein, related securities or in options, futures or other derivative instruments based thereon.
Recipients of this report are advised that any or all of the foregoing arrangements, as well as more specific disclosures set forth below, may at times give rise to potential conflicts of interest.
Important Disclosure Footnotes for New Flyer Industries Inc. (NFI)
New Flyer Industries Inc. is a client for which a CIBC World Markets company has performed investment banking services in the past 12 months.
CIBC World Markets Inc. has managed or co-managed a public offering of securities for New Flyer Industries Inc. in the past 12 months.
CIBC World Markets Inc. has received compensation for investment banking services from New Flyer Industries Inc. in the past 12 months.
CIBC World Markets Inc. expects to receive or intends to seek compensation for investment banking services from New Flyer Industries Inc. in the next 3 months.
Q3 Order And Backlog Update - A Sign Of Peak Earnings? - October 17, 2016
1 1
CIBC World Markets Corp./Inc. Stock Rating System
Abbreviation Rating Description
Stock Ratings
SO Sector Outperformer Stock is expected to outperform the sector during the next 12-18 months.
SP Sector Performer Stock is expected to perform in line with the sector during the next 12-18 months.
SU Sector Underperformer Stock is expected to underperform the sector during the next 12-18 months.
NR Not Rated CIBC World Markets does not maintain an investment recommendation on the stock.
R Restricted CIBC World Markets is restricted (due to potential conflict of interest) from rating the stock.
Sector Weightings (note: Broader market averages refer to S&P 500 in the U.S. and S&P/TSX Composite in Canada.)
O Overweight Sector is expected to outperform the broader market averages.
M Market Weight Sector is expected to equal the performance of the broader market averages.
U Underweight Sector is expected to underperform the broader market averages.
NA None Sector rating is not applicable.
"Speculative" indicates that an investment in this security involves a high amount of risk due to volatility and/or liquidity issues.
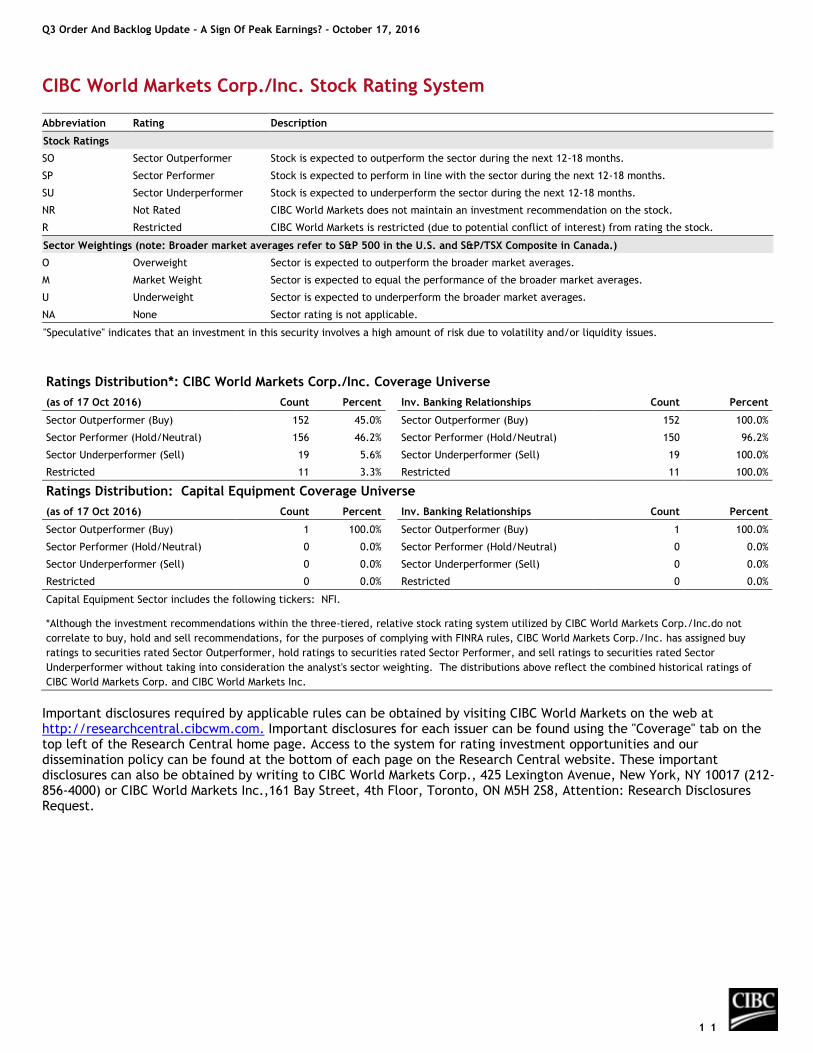
Ratings Distribution*: CIBC World Markets Corp./Inc. Coverage Universe
(as of 17 Oct 2016) Count Percent Inv. Banking Relationships Count Percent
Sector Outperformer (Buy) 152 45.0% Sector Outperformer (Buy) 152 100.0%
Sector Performer (Hold/Neutral) 156 46.2% Sector Performer (Hold/Neutral) 150 96.2%
Sector Underperformer (Sell) 19 5.6% Sector Underperformer (Sell) 19 100.0%
Restricted 11 3.3% Restricted 11 100.0%
Ratings Distribution: Capital Equipment Coverage Universe
(as of 17 Oct 2016) Count Percent Inv. Banking Relationships Count Percent
Sector Outperformer (Buy) 1 100.0% Sector Outperformer (Buy) 1 100.0%
Sector Performer (Hold/Neutral) 0 0.0% Sector Performer (Hold/Neutral) 0 0.0%
Sector Underperformer (Sell) 0 0.0% Sector Underperformer (Sell) 0 0.0%
Restricted 0 0.0% Restricted 0 0.0%
Capital Equipment Sector includes the following tickers: NFI.
*Although the investment recommendations within the three-tiered, relative stock rating system utilized by CIBC World Markets Corp./Inc.do not
correlate to buy, hold and sell recommendations, for the purposes of complying with FINRA rules, CIBC World Markets Corp./Inc. has assigned buy
ratings to securities rated Sector Outperformer, hold ratings to securities rated Sector Performer, and sell ratings to securities rated Sector
Underperformer without taking into consideration the analyst's sector weighting. The distributions above reflect the combined historical ratings of
CIBC World Markets Corp. and CIBC World Markets Inc.
Important disclosures required by applicable rules can be obtained by visiting CIBC World Markets on the web at http://researchcentral.cibcwm.com. Important disclosures for each issuer can be found using the "Coverage" tab on the top left of the Research Central home page. Access to the system for rating investment opportunities and our dissemination policy can be found at the bottom of each page on the Research Central website. These important disclosures can also be obtained by writing to CIBC World Markets Corp., 425 Lexington Avenue, New York, NY 10017 (212-856-4000) or CIBC World Markets Inc.,161 Bay Street, 4th Floor, Toronto, ON M5H 2S8, Attention: Research Disclosures Request.
Q3 Order And Backlog Update - A Sign Of Peak Earnings? - October 17, 2016
12
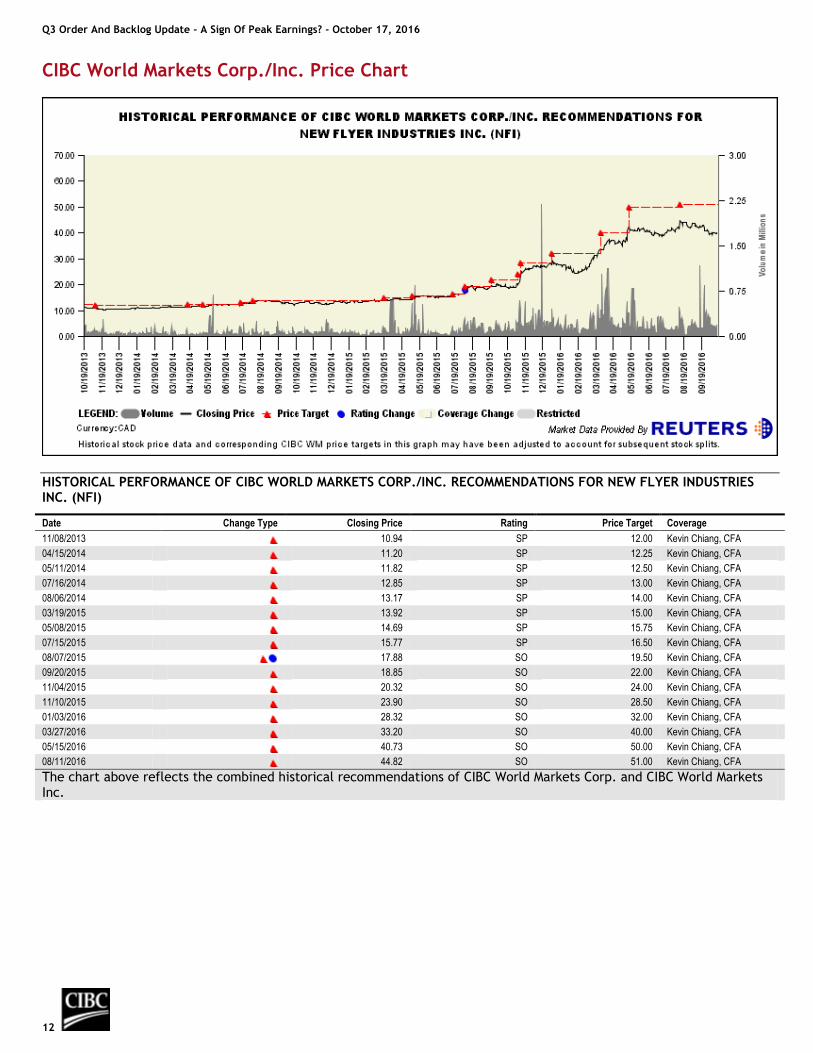
CIBC World Markets Corp./Inc. Price Chart
HISTORICAL PERFORMANCE OF CIBC WORLD MARKETS CORP./INC. RECOMMENDATIONS FOR NEW FLYER INDUSTRIES INC. (NFI)
Date Change Type Closing Price Rating Price Target Coverage
11/08/2013 10.94 SP 12.00 Kevin Chiang, CFA
04/15/2014 11.20 SP 12.25 Kevin Chiang, CFA
05/11/2014 11.82 SP 12.50 Kevin Chiang, CFA
07/16/2014 12.85 SP 13.00 Kevin Chiang, CFA
08/06/2014 13.17 SP 14.00 Kevin Chiang, CFA
03/19/2015 13.92 SP 15.00 Kevin Chiang, CFA
05/08/2015 14.69 SP 15.75 Kevin Chiang, CFA
07/15/2015 15.77 SP 16.50 Kevin Chiang, CFA
08/07/2015 17.88 SO 19.50 Kevin Chiang, CFA
09/20/2015 18.85 SO 22.00 Kevin Chiang, CFA
11/04/2015 20.32 SO 24.00 Kevin Chiang, CFA
11/10/2015 23.90 SO 28.50 Kevin Chiang, CFA
01/03/2016 28.32 SO 32.00 Kevin Chiang, CFA
03/27/2016 33.20 SO 40.00 Kevin Chiang, CFA
05/15/2016 40.73 SO 50.00 Kevin Chiang, CFA
08/11/2016 44.82 SO 51.00 Kevin Chiang, CFA
The chart above reflects the combined historical recommendations of CIBC World Markets Corp. and CIBC World Markets Inc.
Q3 Order And Backlog Update - A Sign Of Peak Earnings? - October 17, 2016
1 3
Legal Disclaimer
This report is issued and approved for distribution by (a) in Canada, CIBC World Markets Inc., a member of the Investment Industry Regulatory Organization of Canada (“IIROC”), the Toronto Stock Exchange, the TSX Venture Exchange and a Member of the Canadian Investor Protection Fund, (b) in the United Kingdom, CIBC World Markets plc, is Authorised by the Prudential Regulation Authority and regulated by the Financial Conduct Authority and the Prudential Regulation Authority, (c) in Australia to wholesale clients only, CIBC Australia Ltd, a company regulated by the ASIC with AFSL license number 240603 and ACN 000 067 256, and (d) in Japan, CIBC World Markets (Japan) Inc., a registered Type 1 Financial product provider with the registration number Director General of Kanto Finance Bureau #218 (collectively, “CIBC World Markets”) and (e) in the United States either by (i) CIBC World Markets Inc. for distribution only to U.S. Major Institutional Investors (“MII”) (as such term is defined in SEC Rule 15a-6) or (ii) CIBC World Markets Corp., a member of the Financial Industry Regulatory Authority (“FINRA”). U.S. MIIs receiving this report from CIBC World Markets Inc. (the Canadian broker-dealer) are required to effect transactions (other than negotiating their terms) in securities discussed in the report through CIBC World Markets Corp. (the U.S. broker-dealer). CIBC World Markets Corp. accepts responsibility for the content of this research report.
This report is provided, for informational purposes only, to institutional investor and retail clients of CIBC World Markets in Canada, and does not constitute an offer or solicitation to buy or sell any securities discussed herein in any jurisdiction where such offer or solicitation would be prohibited. This document and any of the products and information contained herein are not intended for the use of Retail investors in the United Kingdom. Such investors will not be able to enter into agreements or purchase products mentioned herein from CIBC World Markets plc. The comments and views expressed in this document are meant for the general interests of wholesale clients of CIBC Australia Ltd.
This report has been prepared by the CIBC group and is issued in Hong Kong by Canadian Imperial Bank of Commerce, Hong Kong Branch, a registered institution under the Securities and Futures Ordinance, Cap 571 (the “SFO”). This report is intended for “professional investors” only (within the meaning of the SFO) and has been prepared for general circulation and does not take into account the objectives, financial situation or needs of any recipient. Any recipient in Hong Kong who has any questions or requires further information on any matter arising from or relating to this report should contact Canadian Imperial Bank of Commerce, Hong Kong Branch at Suite 3602, Cheung Kong Centre, 2 Queen's Road Central, Hong Kong (telephone number: +852 2841 6111). Orders for Hong Kong listed securities will be executed by Canadian Imperial Bank of Commerce, Hong Kong Branch. Canadian Imperial Bank of Commerce, Hong Kong Branch has entered into an arrangement with its broker-dealer affiliates worldwide to execute orders for securities listed outside of Hong Kong for Hong Kong clients.
This report is intended for distribution in Singapore solely to “institutional investors” (within the meanings of the Financial Advisers Act (Chapter 110 of Singapore)).
The securities mentioned in this report may not be suitable for all types of investors. This report does not take into account the investment objectives, financial situation or specific needs of any particular client of CIBC World Markets. Recipients should consider this report as only a single factor in making an investment decision and should not rely solely on investment recommendations contained herein, if any, as a substitution for the exercise of independent judgment of the merits and risks of investments. The analyst writing the report is not a person or company with actual, implied or apparent authority to act on behalf of any issuer mentioned in the report. Before making an investment decision with respect to any security recommended in this report, the recipient should consider whether such recommendation is appropriate given the recipient's particular investment needs, objectives and financial circumstances. CIBC World Markets suggests that, prior to acting on any of the recommendations herein, Canadian retail clients of CIBC World Markets contact one of our client advisers in your jurisdiction to discuss your particular circumstances. Non-client recipients of this report who are not institutional investor clients of CIBC World Markets should consult with an independent financial advisor prior to making any investment decision based on this report or for any necessary explanation of its contents. CIBC World Markets will not treat non-client recipients as its clients solely by virtue of their receiving this report.
Past performance is not a guarantee of future results, and no representation or warranty, express or implied, is made regarding future performance of any security mentioned in this report. The price of the securities mentioned in this report and the income they produce may fluctuate and/or be adversely affected by exchange rates, and investors may realize losses on investments in such securities, including the loss of investment principal. CIBC World Markets accepts no liability for any loss arising from the use of information contained in this report, except to the extent that liability may arise under specific statutes or regulations applicable to CIBC World Markets.
Information, opinions and statistical data contained in this report were obtained or derived from sources believed to be reliable, but CIBC World Markets does not represent that any such information, opinion or statistical data is accurate or complete (with the exception of information contained in the Important Disclosures section of this report provided by CIBC World Markets or individual research analysts), and they should not be relied upon as such. All estimates, opinions and recommendations expressed herein constitute judgments as of the date of this report and are subject to change without

Q3 Order And Backlog Update - A Sign Of Peak Earnings? - October 17, 2016
14
Legal Disclaimer (Continued)
notice.
Nothing in this report constitutes legal, accounting or tax advice. Since the levels and bases of taxation can change, any reference in this report to the impact of taxation should not be construed as offering tax advice on the tax consequences of investments. As with any investment having potential tax implications, clients should consult with their own independent tax adviser.
This report may provide addresses of, or contain hyperlinks to, Internet web sites. CIBC World Markets has not reviewed the linked Internet web site of any third party and takes no responsibility for the contents thereof. Each such address or hyperlink is provided solely for the recipient's convenience and information, and the content of linked third party web sites is not in any way incorporated into this document. Recipients who choose to access such third-party web sites or follow such hyperlinks do so at their own risk.
Although each company issuing this report is a wholly owned subsidiary of Canadian Imperial Bank of Commerce (“CIBC”), each is solely responsible for its contractual obligations and commitments, and any securities products offered or recommended to or purchased or sold in any client accounts (i) will not be insured by the Federal Deposit Insurance Corporation (“FDIC”), the Canada Deposit Insurance Corporation or other similar deposit insurance, (ii) will not be deposits or other obligations of CIBC, (iii) will not be endorsed or guaranteed by CIBC, and (iv) will be subject to investment risks, including possible loss of the principal invested. The CIBC trademark is used under license.
© 2016 CIBC World Markets Inc. and CIBC World Markets Corp. All rights reserved. Unauthorized use, distribution, duplication or disclosure without the prior written permission of CIBC World Markets is prohibited by law and may result in prosecution.


![OIL CAPITAL 27th MARCH 2019 - cluffnaturalresources.com · Located close to BP operated ETAP infrastructure Oil and condensate –diversifies the portfolio Contains the Tesla [Pentland]](https://static.fdocuments.us/doc/165x107/5e0167ed8a3d9d0d2258ff76/oil-capital-27th-march-2019-c-located-close-to-bp-operated-etap-infrastructure.jpg)


![[22] W. Beirl and B. Berg, Nucl. Phys. B452 (1995) …h whic in real space b ecomes the wn ell-kno w Liouville action I ef f (') = D 96 Z d 2 x h @ + ( c e ' i: (3 94) One therefore](https://static.fdocuments.us/doc/165x107/5e3eed3131e5af7591491932/22-w-beirl-and-b-berg-nucl-phys-b452-1995-h-whic-in-real-space-b-ecomes.jpg)


