
Earnings surprises and prior insider trading: Tests of joint informativeness
27
Eamings surprises and prior insider trading: Tests of joint informativeness* STEVEN ALLEN University of Cincinnati RAMACHANDRAN RAM AN AN University of North Carolina Abstract. Building on the notion that both earnings surprises and the level of insider trad- ing are noisy signals of future prospects of the firm, this paper empirically investigates joint informativeness of the two signals surrounding eamings announcements. Classifi- cation of a large sample of firms in the time period 1977-81 based both on the levels of eamings surprise and insider trading results in a finer partition informationally, compared to using just one signal. Both additive and interactive effects are observed while analysing the security market response during the three trading days centered on the day of eamings announcements. Over a 19-day postannouncement period, the results are less pronounced. The overall pattem of results implies that each signal may contain information not contained in the other, and/or some of the noise associated with each signal may be interactively resolved at the time of eamings announcements. This inference is robust under many measurement alternatives. Resume. A partir du principe voulant que les benefices imprevus ainsi que l'importance des operations d'inities soient des indicateurs manifestes des perspectives futures de l'entreprise, les auteurs proeedent a une etude empirique de la qualite informative con- jointe des deux indicateurs dans le cadre des avis de benefices. La classification d'un vaste echantillon d'entreprises pendant la periode 1977-1981 en fonction a la fois du niveau des benefices imprevus et de l'importance des operations d'inities permet un decoupage plus subtil sur le plan informationnel que l'utilisation d'un indicateur unique. Les auteurs observent les effets tant additifs qu'interactifs de cette classification dans l'analyse de la reponse du marche boursier au cours des trois jours de bourse centres sur le jour de la communication des avis de benefices. Pour la periode de 19 jours suivant la periode d'avis, les resultats sont moins accuses. Le modele global des resultats suppose que chaque indicateur peut livrer de l'information que 1'autre ne livre pas et qu'une partie de ce que manifeste chaque indicateur peut etre resolue de fafon interactive au moment EDITOR s NOTE: An earlier draft of this paper and the discussions by Dan Givoly (pp. 544-546) and Clarence Kwan (pp. 547-549) were presented at the 1988 CAR Conference on Accounting Infonnation and Its Verification - Implication for the Management of Organizations at McMaster University. * The authors wish to acknowledge the helpful suggestions of Larry Brown, Mark Flannery, Dan Givoly, Clarence Kwan, David Ravenscraft, Dick Rendleman, Dan Thomton, and par- ticipants at the finance workshop at Chapel Hill and at the CAR conference at McMaster University. The authors are also grateful to Messrs. Lynch, Jones, and Ryan for permission to use the LB.E.S. analysts' forecasts of earnings. Contemporary Accounting Research Vol. 6 No. 2 - 1 pp 518-543
-
Upload
steven-allen -
Category
Documents
-
view
212 -
download
0
Transcript of Earnings surprises and prior insider trading: Tests of joint informativeness

Eamings surprises and prior insider trading:Tests of joint informativeness*
STEVEN ALLEN University of Cincinnati
RAMACHANDRAN RAM AN AN University of North Carolina
Abstract. Building on the notion that both earnings surprises and the level of insider trad-ing are noisy signals of future prospects of the firm, this paper empirically investigatesjoint informativeness of the two signals surrounding eamings announcements. Classifi-cation of a large sample of firms in the time period 1977-81 based both on the levels ofeamings surprise and insider trading results in a finer partition informationally, comparedto using just one signal.
Both additive and interactive effects are observed while analysing the security marketresponse during the three trading days centered on the day of eamings announcements.Over a 19-day postannouncement period, the results are less pronounced. The overallpattem of results implies that each signal may contain information not contained in theother, and/or some of the noise associated with each signal may be interactively resolvedat the time of eamings announcements. This inference is robust under many measurementalternatives.
Resume. A partir du principe voulant que les benefices imprevus ainsi que l'importancedes operations d'inities soient des indicateurs manifestes des perspectives futures del'entreprise, les auteurs proeedent a une etude empirique de la qualite informative con-jointe des deux indicateurs dans le cadre des avis de benefices. La classification d'un vasteechantillon d'entreprises pendant la periode 1977-1981 en fonction a la fois du niveaudes benefices imprevus et de l'importance des operations d'inities permet un decoupageplus subtil sur le plan informationnel que l'utilisation d'un indicateur unique.
Les auteurs observent les effets tant additifs qu'interactifs de cette classification dansl'analyse de la reponse du marche boursier au cours des trois jours de bourse centres surle jour de la communication des avis de benefices. Pour la periode de 19 jours suivant laperiode d'avis, les resultats sont moins accuses. Le modele global des resultats supposeque chaque indicateur peut livrer de l'information que 1'autre ne livre pas et qu'une partiede ce que manifeste chaque indicateur peut etre resolue de fafon interactive au moment
EDITOR s NOTE: An earlier draft of this paper and the discussions by Dan Givoly (pp. 544-546)and Clarence Kwan (pp. 547-549) were presented at the 1988 CAR Conference on AccountingInfonnation and Its Verification - Implication for the Management of Organizations at McMasterUniversity.* The authors wish to acknowledge the helpful suggestions of Larry Brown, Mark Flannery,
Dan Givoly, Clarence Kwan, David Ravenscraft, Dick Rendleman, Dan Thomton, and par-ticipants at the finance workshop at Chapel Hill and at the CAR conference at McMasterUniversity. The authors are also grateful to Messrs. Lynch, Jones, and Ryan for permission touse the LB.E.S. analysts' forecasts of earnings.
Contemporary Accounting Research Vol. 6 No. 2 - 1 pp 518-543

Eamings Surprises and Prior Insider Trading 519
de la communication des avis de benfices. Cette induction resiste a l'epreuve de plusieurstechniques de mesure.
IntroductionAlthough the reasons why corporate insiders' choose to trade or not to tradein their firm's securities remain unclear,^ the conclusion that insiders on aver-age eam superior retums on their trading activity is well documented (Fowlerand Rorke, 1988; Seyhun, 1986; Givoly and Palmon, 1985; Finnerty, 1976; andJaffe, 1974). This result suggests that trading by insiders, on average, is based onsuperior information about their firms. However, as a practical matter, the legalrestrictions placed on trading related to privileged information perhaps preventinsiders from routinely exploiting foreknowledge of identifiable corporate infor-mation events. Instead, it is likely that insiders trade on the basis of superiorexpectations about the long-term future prospects of their firms. Based on suchpremise. Penman (1985) and Givoly and Palmon (1985) argued that outsidersmay use insider trading events as noisy signals about the future prospects of thefirm.
Given the pervasive evidence that the surprise in annual eamings announce-ments is also a noisy signal about the future prospects of the firm, it is plausiblethat both insider trading and eamings signals are jointly informative; each maycontain information not contained in the other. Further, some of the uncertaintyassociated with each signal may be interactively resolved following eamingsannouncements. Indeed, Lev and Ohlson (1982) speculate that observed cross-sectional differences in the market's reactions to eamings announcements maybe associated with differences in the levels of insider trading activity. This pa-per empirically examines the joint effects, both additive and interactive, of thesurprise in annual eamings announcements and prior levels of insider tradingsurrounding eamings announcements.
The pattem of the results is consistent with an inference that these signalsare jointly informative. During the three-day period surrounding eamings an-nouncement, this joint effect contains both a strong interactive component anda weak additive insider trading signal component. However, during the postan-nouncement period, the joint informativeness of the signals appears essentiallyadditive in nature. Specifically, when the pairing of the signals jointly implieseither "good news" or "bad news" for the firms, market reaction subsequent
1 We restrict our definition of "insiders" to those individuals who, as the result of their beingan officer, director, or owner of 10 percent or more of a class of equity securities, are definedas insiders by the Securities and Exchange Act and who, therefore, must report all of theirtransactions in the firm's securities to the SEC. We thus preclude consideration of the broaderclass of persons who are frequently referred to as insiders as a result of their possession ofproprietary information about the firm. Although prior research suggests that market effectsassociated with reported insider trading activity differs with the relation of the insider's cate-gory (Baesel and Stein, 1979; Seyhun, 1986), in this preliminary study we do not differentiateamong trades by officers, director, and beneficial owners.
2 Detailed discussions of this issue are contained in Beaver (1981, pp. 184-188), Dye (1984),Kripke (1979, pp. 96-116 and 292-297), and Trueman (1983). Ronen [1977] contains a directexamination of the interaction between managerial trading and accounting disclosure.

520 S. Allen R. Ramanan
to eamings announcements is larger than that for each marginal group and issignificantly positive or negative, respectively. In contrast, in the postannounce-ment period when the pair of signals has conflicting implications, the marketreaction is not significant.
The rest of the paper is organized as follows. The informativeness of eachsignal, eamings surprises, and insider trading, as documented in related priorresearch, is briefly reviewed in the next section. The notion of joint informative-ness between the two signals is discussed in the context of the research designin the third section. Measurement issues and sample selection procedures aresubsequently outlined, and the results are presented and discussed in the fourthsection. The concluding section offers interpretations and discusses limitationsof the study.
Informativeness of earnings surprises and prior insider tradingExtant empirical evidence suggests that both the direction and magnitude ofeamings surprises are highly correlated with security price revisions (e.g.. Balland Brown, 1968; Beaver, Clarke, and Wright, 1979). More importantly, eamingssurprises have been shown to be positively related to contemporaneous andsubsequent market reactions to eamings announcements (e.g., Foster, Olsen, andShevlin, 1984). Gonedes (1975) theorizes that eamings surprises are informativebecause accounting net income numbers are mappings from the same set ofeconomic factors that generate the actual signals used by the market to formexpectations about the amounts, timing, and uncertainty of future cash flowsof the firm. Consequently, an unexpected change in reported eaming (i.e., aneamings surprise) may signal an unexpected change in the long-term prospectsof the firm.
Among-others Lev and Ohlson (1982) note, however, that although cross-sectional differences in eamings surprise are associated with contemporaneouscross-sectional differences in market reactions, the level of this association is"quite modest and much of the stock-retum distribution remains to be explained"(p. 263). They argue that the information content of eamings announcementsmay be conditioned by idiosyncratic differences in the firm's information en-vironment. They conjecture that two variables, firm size and insider trading,may proxy for these effects. Although the former association has been studied(Atiase, 1985; Grant, 1980), the latter has not.
It is well established that the trading activity of corporate officials is as-sociated with systematic abnormal security retum performance by their firms.The nature of the relationship among insiders' trading activity, the special in-formation that managers possess, and the abnormal security price performanceof their firms is, however, not well established. Accordingly, it is difficult tospecify theoretically the nature of the relationship between managerial tradingactivity and eamings surprises.
One conjecture that has received attention in the literature is that insiders

Eamings Surprises and Prior Insider Trading 521
trade in anticipation of the market's reaction to prominent public informationevents that may occur in the immediate future.^ Based on the classical spec-ulative trading model"* (Hirshleifer and Rubenstein, 1976), Elliott, Morse, andRichardson (1984) and Givoly and Palmon (1985) attempt to test the hypothesisthat insiders purchase (sell) securities in advance of the public disclosure of"good (bad)" news by the firm. The results reported in these studies providelittle or at-best very weak support to this hypothesis.
One explanation for this apparent lack of association is that current securitieslaws have effectively eliminated speculative trading by corporate insiders. Asan altemative explanation, Givoly and Palmon (1985) suggest that the observedprofitability of insider trading derives from the security market response to eitheror both the (1) information revealed through the trades themselves and/or (2)longer-term developments not revealed by specific information events subsequentto these trades.^
The supposition that the market uses trading activity as an informative signalis consistent with the fact that such trading is closely monitored by the financialcommunity. In fact, there exist several newsletters solely devoted to the dis-semination of data about insider trading activity and its implication for tradingstrategies. This supposition is also consistent with prior empirical research. Sey-hun's (1986) results suggest that the information revealed by trading is perhapsattributable to the ability of insiders to time their trades to take advantage ofthe general trends in corporate performance. First, insiders appear to sell andpurchase shares at the peak and trough points respectively of their firm's secu-rity price performance. Second, the market adjustments immediately subsequentto trading events is not dramatic. Instead, it appears that the market takes timeto resolve the uncertainty associated with the trading signal and impound itsinformation content.* This suggests that the information underlying the tradepercolates into the marketplace over time.
Adoption of a financial signalling perspective on insider trading logicallyleads to the proposition that a relationship exists between trading signals andeamings surprise signals. At one extreme, if trading signals and eamings signals
3 The information events considered include eamings, dividend, and merger announcements.4 The classical speculative trading model assumes that upon receipt of private information,
the speculator assesses whether the expected gains to trading exceed the expected costs.If a net gain is expected, the speculator then trades away from an optimal "buy and hold"portfolio position to a new position designed to maximize the profits from the subsequentpublic revelation of the private information. Once the information is impounded into prices,the speculator then trades away from the speculative position and reestabhshes an optimal"buy and hold" portfolio. In the case of corporate insiders, the expected costs include theprobability of being caught violating the securities laws.
5 A further interpretation is that such profitability could capture the market's perception of theinsider's ability to assess more accurately the firm's affairs that will unfold in the longer term.
6 Based on an extensive study of insider trading in Canada (securities traded on the TorontoStock Exchange), Fowler and Rorke (1988) find similar results. They document that excessretums persisted for as long as 12 months subsequent to the trade and that insiders tend totrade at tuming points of security price performance.

522 S. Allen R. Ramanan
are mappings from the same set of economic factors, it could be conjecturedthat trading by managers results in more timely revelation of the informationcontent of eamings. Accordingly, prior trading could reduce or eliminate theinformativeness of eamings surprise signals. Altematively, if trading signalsand eamings signals are each noisy signals about the long-term prospects ofthe firm but mappings from different underlying economic factors, then theirjoint availability may have a noise reduction effect. It could be conjectured,for example, that prior trading activity discriminates among otherwise qualityequivalent eamings surprise signals.^
In a related paper. Penman (1985) compares the informativeness of insidertrading to that of voluntary announcements of management's forecasts of eam-ings. Most of the trading measures that he examines do not appear to conveyinformation beyond that contained in the eamings forecasts. However, a mea-sure refiecting the relative strength of pre- and postannouncement trading activityprovides additional discriminatory power among firms' realized retums. Basedon this result. Penman concludes that trading activity and managerial eamingsforecasts are jointly informative. This finding applies only to a subset of pub-licly traded firms because voluntary forecast of eamings by managers is not apervasive activity. However, Penman's analysis represents an initial attempt toidentify the informational properties of insider trading. The present study is afurther attempt to explore the informational relationships among annual eamingsannouncements, prior insider trading, and security market reactions.
Research design, measurement issues and sample
Additive and interactive informativenessExtant empirical inquiry is consistent with the inference that the revelation ofeamings surprise and managerial trading activity are both noisy signals thatdiscriminate among the long-term prospects of firms and, consequently, of firmvalues. Based on this inference, we consider the logical follow-up question ofwhether these signals are jointly informative. The current study focuses on Levand Ohlson's (1982) conjecture that the informativeness of eamings surprisesignals is conditioned by the levels of prior insider trading. Accordingly, werestrict our attention to the relationship among prior trading by insiders, eamingssurprise announcements, and market reactions concurrent with and subsequentto annual eamings announcements.
In the absence of well-specified theory, we address the issue of the jointinformativeness of these signals at a general," descriptive level. The researchapproach involves cross-sectional comparisons of the market reaction surround-
For example, Ross (1979) argues that managers have incentives to take actions that helpoutsiders to discriminate among the value of firms. Following the notion of a separatingsignaling equilibrium, it is possible that the failure of a firm's management to "go long" in thefirm's shares prior to the announcement of a positive eamings surprise may indicate that thesurprise is transitory.
Eamings Surprises and Prior Insider Trading 523
ing eamings announcement. Sample firms are first assigned to groups based oncoarse rankings of levels of eamings surprises and levels of insider trading. Wethen test for the presence of additive and/or interactive effects among the pair ofsignals in the context ofthe security market reaction to eamings announcements.
By joint informativeness, we refer to the total information revealed to themarket by the availability of both an eamings surprise and a trading signal. Atthe extremes, a pair of signals may be either perfect complements or perfectsubstitutes with respect to their joint information content (see Gonedes, 1978).When two signals are perfect complements, both signals must be known if thesignals are to be useful; knowing one, but not both, reveals no informationabout the future prospects of the firm. At the other end of the continuum, whenthe two signals are perfect substitutes, knowing one signal perfectly reveals theinformation content of the other and vice versa.* As Gonedes (1978) pointsout, the actual relationship between a pair of signals is likely to be somewherebetween perfect substitutability and perfect complementarity.
Given that the signals are not perfect substitutes, the question of interest ishow much more information is revealed by both signals beyond that revealedby either signal individually. This incremental (joint) effect can be thought ofas having two components, additive and interactive informativeness. When onesignal reveals information not contained in the other, the signals are additivelyinformative. To the extent that the uncertainty associated with each signal isinteractively resolved with the other and unique pairings of the signals containunique information, the signals are interactively informative.'
Research designWe seek to analyze and identify the nature of the relationship between eam-ings surprise and trading activity signals. Initially, we address the question ofwhether both signals are equivalent mappings from the same set of underly-ing economic factors by evaluating the perfect substitution hypothesis: eamings(trading) signals convey no information beyond that conveyed by prior trading(eamings) signals. Conditional on the rejection of this hypothesis, we then test,in order, the hypothesis that the two signals are interactively informative andthe hypothesis that the two signals are additively informative.
Assuming linear relationships, we test the interactive and additive informa-tiveness hypotheses using an analysis of covariance (ANCOVA) design withtwo classificatory (main) effects, eamings surprises and insiders' trading activ-ity, each at three levels. Firm size, as measured by the market value of equityat the beginning of the firm's fiscal year (shares outstanding x opening shareprice), is used in the analysis as a covariate.
8 This precludes those cases where one signal is a proper subset of the other.9 Prior investigations (see for example, Hoskin, Hughes, and Ricks, 1987; Kane, Lee, and
Marcus, 1984) of the market reaction to multiple signals, have addressed either or both of therelationships between the signals.

524 S. Allen R. Ramanan
Firms are assigned to eamings surprise categories based on rank order ofestimated eamings forecast error [E+ most positive one-third of forecast errors,E— the most negative third, and Em the remainder]. Eamings forecast errors arecomputed by comparing the actual to an expectation of eamings. The reportedinsider trades prior to eamings announcements are suitably standardized, rank-ordered, and the sample firms independently assigned to one of three groups(buy, neutral, and sell) based on 33 percent cutoffs.'" It may be noted that theabove terminology for the groups should not be interpreted literally because theyare used only for ease of exposition. For example, the "neutral" trading categorymay have both net buying and selling but refers to the middle one third of therank-ordered trading signals.
The security market response, as a surrogate for the joint informativenessof the signals, is measured by market model forecast errors." Forecast errorsare computed for two event periods; the first an announcement period coveringtrading days —1 to H-1 where day 0 corresponds to eamings announcement;and the second a postannouncement period covering trading days -\-2 to -i-20.Conditional on the joint assumption that the market is informationally efficientand that managerial trading signals are known as of the actual date that theyoccur, the first interval is the appropriate interval to assess the Lev and Ohlsonconjecture.
However, existing empirical evidence indicates that the market does not ap-pear to immediately and completely respond to trading signals. Moreover, exist-ing empirical evidence suggests that the market's adjustment to eamings surprisesignals is also not instantaneous (Foster, Olsen, and Shevlin, 1984). Given thesefindings, the second interval allows us to assess whether the uncertainty sur-rounding either/or both signal(s) is resolved, in part, in the period immediatelysubsequent to eamings announcements.
The empirical support for the proposition that firm size conditions the relationbetween information events and unexpected changes in price is strong (Barryand Brown, 1984; Atiase, 1985; Grant, 1980).'2 Moreover, Seyhun (1986) findsthat firm size also conditions the association between the unexpected retums andinsider trading events. Taken together, these results suggest that a relationshipexists between unexpected eamings and size, which could adversely affect the
10 The classification of the firms into three levels represents a trade-off between exploiting boththe direction and magnitude of the two signals and reducing the effect of measurement errorsin the proxies used for these signals. Obviously, this choice is arbitrary. Grouping the firmsinto five levels of each classificatory effect was also employed in the study with no noticeabledifference in the basic pattem of results.
11 Seyhun [ 1986] argues that use of market model forecast errors is preferable to CAPM basedmeasures because of an association between firm size and insider trading activity. The param-eters of the market model were estimated over the interval —230 to —30 days using the CRSPequally weighted index.
12 Brown. Hagerman, Griffin, and Zmijewski (1987) find "that the relation between abnormalretums and unexpected eamings is better specified for small than for large firms" (p. 179).They offer the conjecture that new information about eamings performance tends to be lessreadily available for and disclosed less rapidly by small firms.
Eamings Surprises and Prior Insider Trading 525
ability of an analysis of variance (ANOVA) procedure to identify the hypothe-sized treatment effect. Firm size is introduced into the model as a concomitantvariable, as opposed to an experimental variable, to reduce the variability of theerror term in the model.
The ANCOVA procedure is essentially a cross-sectional comparison of themarket reaction among and across the two signals, with firm size as a covariate.If both the main effects are significant, then the two signals are neither perfectcomplements nor perfect substitutes.'^ In this case, further inferences concemingadditive and interactive informativeness will depend on the significance of themain and interaction effects respectively.Measurement issuesTwo proxies for the market's eamings expectations are used to measure theunexpected component of the eamings announcement. The first is the meananalyst forecast of eamings in the month immediately prior to the announcementevent as reported in the I.B.E.S. tape.'"* We also examine the sensitivity of theresults to the choice of the eamings expectation proxy by using a mechanicaleamings forecast model.'^ We chose to compute a time series model of thefourth-quarter eamings using the following linear aggregation model, for firm ;':
£^5, , = a + b*EPSSi,-\ +c*
where t is the event quarter
Sit^i the seasonal random walk with drift estimate of EPSi, as estimatedover the prior five years,
EPSQi,-A the quarterly random walk with drift estimate of EPSu as estimatedover the prior five years,
a, b, c the intercept and linear weighting coefficients estimated from a cross-sectional regression of the seasonal and quarterly random walk with
13 Note that if only one of the main effects is significant and the interaction is not significant,this may or may not imply perfect substitutability because one of the signals may be a propersubset of the other with regard to informativeness. We do not develop any precise testingof the notion of perfect substitutability, because, based on our priors conditioned by extantempirical findings, we expect to find at least an additive informativeness effect.
14 O'Brien (1988) finds that the mean analyst forecast data are not consistently less accurate inpredicting actual eamings numbers over short horizons than other altemative measures, suchas the most current analyst's forecast. We also used the following classification scheme tocapture the variance among the individual analysts' forecasts. Firms were classified as E+when their actual eamings were greater than the highest forecast; they were grouped underE— when the actuals were lower than the lowest forecast; and all the remaining classified Em.The results corresponding to these classifications were very similar to the relative rankingadopted and are not reported in the interests of brevity.
15 Ajinkya and Gift (1986) suggest that a relationship exists between managerial informationactivities, such as the release of eamings forecasts and management's perception of analyst'smis-estimation of their firm's eamings performance. Following this same line of reasoning, itis possible that a casual relation exists between analyst forecast errors and managerial tradingactivity. The eamings surprises computed using a mechanical model are not subject to thispotential confounding effect.

526 S. Allen R. Ramanan
drift estimates of the prior years' fourth-quarter eamings number onthe prior fourth quarters.actual eamings number.'*'
The eamings surprise metric for each announcement event is the ratio of theforecast error to the actual eamings, calculated as follows:
Eamings surprise = (Actual — Forecast)/Absolute value of actual
In the model of analyst forecasts, the annual eamings numbers of the eventyear are used; in the case of the time series model of eamings expectation, thecorresponding fourth-quarter eamings numbers are used.
There is little theory to indicate what aspects of insiders' trades are related tothe information they possess. Ostensibly, insiders buy when they have "favor-able" information and sell when they have "unfavorable" information. However,insiders also trade for portfolio adjustment and liquidity reasons and acquireand dispose of shares other than through direct purchase or sale (for exam-ple, trade options and futures). From a pure research design standpoint, it isdesirable to reduce the measurement error in the trading signal by eliminatingnoninformation trading events from the sample. Several altemative metrics forthe information content of insider trading events have been employed in previ-ous research. Seyhun (1986) finds, however, that no one trading event metric isconsistently associated with larger or smaller unexpected retums.
Initially, we measure the signaling properties of trading activity by the ratioof the net number of shares transacted by all of the reportable insiders of a tinn(total shares purchased — total shares sold) over the 75 calender days precedingannual eamings announcement, divided by the total trading activity of the insid-ers ofthe firm during the sample period (1977-81). This procedure reflects ourbelief that trading by the insiders of firms with historically high levels of tradingwill be less likely to be interpreted as information signals; even moderate levelsof trading by the insiders would be interpreted as an informative signal whenthe managers of the firm trade infrequently. Thus, conditional on the assump-tion that managerial trading activity is known to the market at or near the actualdate of trade, this procedure results in a rough ranking of the unexpectednessof insider trading in the period preceding the eamings announcement.''^
16 The superiority of analyst-based eamings prediction models over mechanical models is stillan unresolved issue, at least with respect to the association of the prediction errors and un-expected retums around announcement dates (see O'Brien. 1988). The two most commonnon-Box-Jenkins type mechanical models have been a seasonal random walk with drift anda quarter-by-quarter random walk with drift model. The bootstrapping approach taken in thisstudy generally produces smaller mean square error forecasts than either of these modelstaken individually. The use of Box-Jenkins type models was viewed as too data-intensive forthe purposes of this paper. O'Brien's Table 1 (1988. p. 58) is an excellent example of thesample size reduction necessary when parameters for even a simple ARIMA model must beestimated.
17 As a control we also use an altemative metric in which the total number of outstanding sharesat the beginning of each year is used as the denominator in expressing the net purchases asa proportion thereof. No striking differences in the pattem of results was noticed when thismetric was employed.
Eamings Surprises and Prior Insider Trading 527
Exact specification of the date at which trading signals become available tothe market is problematic. Existing empirical evidence suggests that the marketbegins to respond to managerial trading events, particularly purchase events, inclose proximity to the actual day of trade (Seyhun, 1986; Givoly and Palmon,1985). In addition. Lee and Soit (1986) find that the Vickers Stock ResearchCompany disseminates insider trading activity data to its subscribers in as fewas 17 and no more than 50 days of the transaction. Given this evidence, itis probable that information about insider trading activity is available to themarket well in advance of the publication of the Official Summary of InsiderTransactions and Holdings by the Securities and Exchange Commission (SEC).Accordingly, in our basic set of tests, we assume that substantially all insidertrading signals are known to the market no later than 20 days following the dateof eamings announcement.
Seyhun (1986) provides data on the outside limits of the interval betweenpublication of insider trading activity data by the SEC and the actual date of thetrade. He finds that "the delay between the insider trading day and the availabilityof the Official Summary exceeds 90 days for 31 percent of the transactions and60 days for 84 percent of the transaction" [p. 208]. Consequently, widespreadpublic knowledge of trading activity prior to the date of eamings announcementmay occur only well after the eamings announcement date. In order to assess thesensitivity of our results to the assumption of availability of trading signals, theanalyst forecasts results are replicated for the three 25-day sub-intervals prior toeamings announcement. Comparison of results between these subintervals pro-vides additional descriptive evidence about the nature of the additive/interactiverelationship between the pairs of signals.
SampleThe sample consists of all the firms listed in the 1982 COMPUSTAT QuarterlyIndustrial Tape that satisfied the following three criteria:
1 Between July 1977 and June 1982, the firm's annual primary eamings pershare number, its announcement date, and fourth-quarter eamings per sharenumber were reported on the tape. Attention was restricted to annual andfourth-quarter announcement dates because the LB.E.S. data reports only an-alyst forecast of EPS numbers during our sample period.
2 For each announcement date, quarterly data for the third and fourth quartersof each of the five years prior to the event year were available.
3 Security retum data were available on the daily CRSP tape for the period from230 days prior to 20 days subsequent to the eamings announcement date.'^
18 In addition, an announcement event was excluded from the sample if any retums were notreported during the interval —30 to +20 days surrounding the announcement date. This screenwas imposed to eliminate announcement periods that included suspensions of trading and/ordays in which the firm's shares did not trade. Either of these conditions implies that theannouncement period was not typical.

528 S. Allen R. Ramanan
This search yielded an initial sample of 4664 announcement events satisfyingcriteria 1 and 2 above. An availability of security retums reduced the sample to4026 events.
The next stage of sample selection involved the collection of insider tradingdata. The Official Summary of Security Transactions and Holdings, publishedmonthly by the SEC, reports the transactions disclosed by corporate insiders andbeneficial owners under the provisions of the Securities Exchange Act of 1934.The data for this study come from a computer-readable compilation of this docu-ment (SEC insider trading tape) for the five-year period 1977-82. Using this datasource, we identified all reported open market purchase and sales transactions bythe insiders of a firm during the 75 calender days prior to announcement of thefirm's annual eamings number. About 53 percent, 2168, of the announcementevents were preceded by at least one reportable trading event in the 75 dayspreceding eamings announcements. The sample was further reduced to 1611firms that had analysts forecasts on the I.B.E.S. data base.
ResultsTable 1 includes mean levels of analyst forecast errors and trading intensity forthe sample of 1611 events. Results are reported for the three marginal eamingssurprise categories, (E—, Em, and E+), for the three trading categories (sell, neu-tral, and buy), and for the nine pair-wise cross-classification (joint) categories.In general, the ranking procedures ordered the marginal classification groups inaccordance with intuition. The E— group had, on average, a negative eamingssurprise of about 7 percent, and the E+ group had a larger positive eamingssurprise of about 16 percent. The moderate eamings surprise group, the Emclassification, also had positive eamings surprise on average, although the mag-nitude was smaller (about 1.5 percent). The marginal trading activity rangedfrom about —9 percent for the sell group to about +5 percent for the buy group.On average, mean eamings surprise did not differ widely across marginal tradinggroups. In contrast, the Em category had larger levels of net shares sold thaneither of the other two eamings surprise categories. Further examination of thedata established that instances of large outliers in eamings surprises (negativeand positive) or trading activity (net selling and net purchasing) were rare.
Consistent with Seyhun's (1986) results, the insiders of the sample firmswere net sellers of shares during the sample period. Only the three pair-wisegroupings within the buy category experienced, on average, net purchase activity.The three cross-classifications within the neutral category had modest net salesactivity, and the remaining three sell categories had relatively large net sales.Within all three marginal trading categories average eamings surprises were inthe neighborhood of 3 percent. Thus, in general, selling (buying) activity didnot preceed negative (positive) eamings surprises.
Because we assigned firms to eamings and trading categories independently,we did not expect joint-classifications by pairs of signals to have equal numbers

Eamings Surprises and Prior Insider Trading 529
TABLE 1Descriptive statistics on marginal and joint sample classiftcations'
(Analyst forecasts)
Sell
Neutral
Buy
Marginaleamingscategories
Mean trading activity^Mean eamings surprise'
N ( # of firms)
Mean trading activityMean eamings surprise
N ( # of firms)
Mean trading activityMean eamings surprise
N ( # of firms)
Mean trading activityMean eamings surprise
N (# of firms)
E -
-0.0915-0.0643167
-0.0049-0.0749188
0.0602-0.0706182
-0.0098-0.0701
537
Em
-0.09340.0141
208
-0.00530.0151
167
0.04620.0155
162
-0.02390.0148
537
E+
-0.09010.1703
162
-0.00560.1618
182
0.04570.1513
193
-0.01270.1606
537
Marginal tradingcategories
-0.09180.0369
537
-0.00530.0333
537
0.05080.0351
537
1611*
The sample firms are ratiked in ascending order of eamings surprise and classified as E - , bottomone-third; Em, middle one-third; and E+ top one-third. The sample firms are independently rankedin ascending order of trading activity and classified as sell, bottom one-third; neutral, middle one-third; and buy, top one-third. The nine joint classifications are obtained by combining these twosets of marginal classifications.Level of trading activity is defined as [Total purchases - Total sales/total insider trading in1977-81].Eamings surprise is defined as [Actual - Expected/Actual] for each firm, where expected eamingsis the analyst forecast from the LB.E.S. data base for the event year.A Chi-square test of the hypothesis that trading activity group membership is independent ofeamings surprise group membership resulted in rejection of the null at the 0.95 confidence level(Chi-square statistic of 11.18 with 4 df).
of firms. The number of firms in each pair-wise classification group ranged froma minimum of 162 firms (E-i-, sell; Em, buy), to a maximum of 208 (Em, sell).A Chi-square goodness of fit test of the frequency in each of the joint classi-fications, resulted in rejection of the hypothesis of independence. Interestingly,a relatively small number of firms were classified as jointly "bad news" (E—,sell) or jointly "neutral news" (Em, neutral), and a relatively large number offirms were classified as jointly "good news" (E+, buy). In fact, sales activitymost frequently preceded moderate (Em) eamings surprise signals, and purchaseactivity was relatively rare prior to such signals. Based on this analysis of thefrequencies in each cell, although it appears that the occurence of the two sig-nals was not entirely independent, the pattem also indicates that the two signalswere not perfect substitutes during our sample period.
Announcement period resultsTable 2 presents a breakdown of the security market response during the pe-riod — 1 to +1 days surrounding eamings announcement by marginal and joint

530 S. Allen R. Ramanan
TABLE 2Market retums to marginal and joint classifications'
(Analyst forecasts)Eamings announcement period (Days -
Sell
Neutral
Buy
Eamingssurprisecategories
Analysiscovariance results
OverallEamingsTradeEamings x TradeSize"Size X EamingsSize X Trade
Three-day CAR^t-Statistic'
Three-day CARt-Statistic
Three-day CARt-Statistic
Three-day CARt-Statistic
Degrees offreedom
224122
Size X Eam x Trade 4
1 to +1)
E-
-0.01066-4.10
-0.00791-2.50
-0.00275-1.59
-0.00702-4.70
F-Stat
3.8817.412.552.651.070.390.590.48
Em
-0.00150-0.72
0.005612.49
0.000830.68
0.001411.25
prob.
0.0010.0010.0780.0320.3010.6790.5520.751
E-l-
0.007732.64
0.001100.76
0.010964.04
0.006644.45
Tradingcategories
-0.00157-1.22
-0.00065-0.02
0.003262.09
1611
The sample classification procedures are detailed in note 1, Table I.Three-day CAR refers to the cumulative market model forecast error for days — 1 to + 1 . where day0 is eamings announcement day.The t-statistics are computed using the cross-sectional variance within the classification group andthe standardized CARs.Size is measured by the market value of the firm's equity (number of outstanding shares multipliedby price at the beginning of fiscal year).
classifications using analysts' forecast error to classify firms into eamings sur-prise groups. The resuhs of the ANCOVA test found that each main effect,trading and eamings, was significant, a finding inconsistent with the hypothe-sis that the signals are perfect substitutes. Consistent with previous research,the mean cumulative abnormal retums (CARs) associated with the E— and E-Hmarginal groups were significantly different from zero and signed in accordancewith the implications of the eamings surprise signal. Although less dramatic,a clearly identifiable trading effect was also present. The three-day excess re-tums associated with each of the marginal trading classifications were signedin accordance with the expected implications of the signals. However, only thepurchase category was statistically significant at conventional levels.
The additive effect of the two signals was most pronounced when the impli-

Eamings Surprises and Prior Insider Trading 531
cations of trading signals were consistent with those of the eamings signal (i.e.,jointly "good news" [E+, buy] and jointly "bad news" [E—, sell]. In these twocases, the market's reaction to eamings announcements was extremely large,over 1 percent in three days and correctly signed. In contrast, when purchaseactivity preceded the eamings announcements of firms categorized as E—, al-though negative, the market's reaction was not significantly different from zero.Thus, in this case, the additive effect of one signals appears to have reduced orcanceled out the effect of the other.
The ANCOVA analysis also found a strong interaction between the signalscoincident with the announcement of annual eamings numbers. This effect wasevidenced by the difference in pattems between excess retums within the subsetof firms classified as E— and those within the E+ category. In the case of the E—category, prior insider trading ordered the magnitude of the market's reaction toeamings announcements." In the case of the E+ category, no difference appearsto have existed between firms experiencing prior purchase or sales activity.Instead, it appears that low levels of net shares traded by insiders differentiatedfirms reporting positive eamings surprises.^" These results thus provide someevidence in support of Lev and Ohlson's (1982) conjecture that trading activityis useful in resolving some of the uncertainty associated with eamings surprisesat the time of eamings announcements.2'
Given the possibility of (1) a potential interaction between prior insider trad-ing and revisions in analysts' forecasts in response to this activity and (2) thefact that 557 observations were lost because of unavailability of analysts' fore-casts on the LB.E.S. tape, we repeated the above analysis using a mechanicaltime-series model of eamings expectations (see previous section). For the iden-tical sample of 1611 firms, the results were virtually identical to those reportedin Table 2, suggesting that the inferences are not sensitive, in general, to thechoice of eamings expectation metrics.
The results for the expanded sample of 2168 firms are reported in Table 3.When the non-I.B.E.S. firms were included in the analysis, the interaction effectof the two signals was once again statistically significant. In this case, however,prior trading activity appears to have ordered the market reactions associated
19 The statistical significance of the difference in three day excess retum between the E—. .selland the E—, buy categories is at best marginal. Using a two-sample t-test. the hypothesis ofequal CAR'S is rejected, at least at the 95 per cent level. Using a Tukey pair-wise comparisontest as part of the ANCOVA analysis, the above hypothesis is not rejected even at the 90percent level.
20 Using the Bonferroni (Neter, Wasserman, and Kutner [1985, pp. 725-731] for equal and [pp.754—758] unequal sample sizes) tnethod of pair-wise comparisons, the difference betweenmean excess retums for the E-t-/buy and E+/neutral categories is significant at the 90 percentconfidence if fewer than 16 pair-wise comparisons are of interest.
21 As a further test we compared excess retum by level of trading activity holding levels ofeamings surprise constant. To do this, the sample was first ranked by eamings surprise andthen ranked by trading activity within eamings surprise categories. These tests were consistentwith the conclusion that within that subset of firms reporting negative eamings surprises, thosefirms experiencing prior sales activity had larger, negative excess retums.

532 S. Allen R. Ramanan
TABLE 3Market retums to marginal and joint classifications'
(Mechanical forecasts)Eamings announcement period (Days -
Sell
Neutral
Buy
Eamingssurprisecategories
Analysis
Three-day CAR^t-Statistic'No. of firms
Three-day CARt-StatisticNo. of firms
Three-day CARt-StatisticNo. of firms
Three-day CARt-StatisticNo. of finns
Degrees ofcovariance results freedom
OverallEamingsTrade
22
Eamings x Trade 4Size" 1Size X Eamings 2Size X TradeSize X Eam x '
2Frade 4
-1 to +1)
E -
-0.00861-3.75248
-0.00727-2.29
231
-0.00891-3.97244
-0.00828-5.78
723
F-Stat
6.7342.53
2.073.001.071.530.941.36
Em
-0.00191-0.89241
-0.00139-0.63251
0.006912.90
231
0.001090.81
723
prob.
0.0010.0010.1270.0180.3010.2170.3930.247
E+
0.009623.81
234
0.006322.84
241
0.013775.77
247
0.009947.25
722
Tradingcategories
-0.00048-0.63723
-0.00070-0.13723
0.003912.83
722
2168
The sample classification procedures are detailed in note 1, Table 1.•^•* See footnotes 2, 3, 4 Table 2.
within the moderate (Em) eamings surprise signals rather than "bad news" eam-ing signals. In particular, when prior purchase activity as paired with a moderate(Em) eamings signal, the three day CARs were significantly larger than zero.Once again, the market reaction to positive eamings surprises was significantlyless positive when paired with neutral trading. In contrast to the analyst forecastresults, the ANCOVA partial F-test results for the mechanical forecast samplefound that additive effect of marginal trading signals was not significant aftercontrolling for the main effect on eamings signals and the interaction betweenthe two signals.
Post announcement period resultsThe results in the postannouncement period for the analyst forecast sample,reported in Table 4, failed to identify a significant interactive effect. The tradingactivity main effect was highly significant, and after controlling for the effect of
Earnings Surprises and Prior Insider Trading 533
TABLE4Market retums to marginal and joint classifications'
(Analyst forecasts)Postannouncement period (Days +2 to +20)
Sell
Neutral
Buy
Eamingssurprisecategories
Analysiscovariance results
OverallEamingsTradeEamings x TradeSize"Size X EamingsSize X Trade
19-day CAR^t-Statistic^
19-day CARt-Statistic
19-day CARt-Statistic
19-day CARt-Statistic
E -
-0.01477-2.91
0.00136-0.02
-0.00246-0.19
-0.00495-1.76
Degrees offreedom F-Stat
224122
Size X Eam x Trade 4
1.812.054.440.652.560.850.780.75
Em
-0.01217-2.49
0.004380.44
0.005420.85
-0.00172-0.79
prob.
0.0220.1300.0120.6260.1200.4300.4570.558
E+
-0.00254-0.02
0.002410.65
0.012452.59
0.004531.93
Tradingcategories
-0.01007-3.11
0.002650.59
0.005272.01
1611
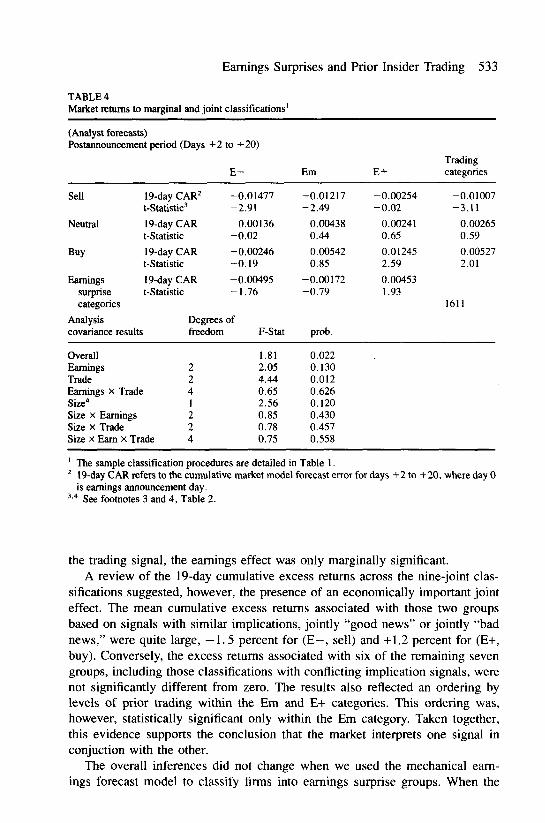
The sample classification procedures are detailed in Table 1.19-day CAR refers to the cumulative market model forecast error for days +2 to +20. where day 0is eamings announcement day.
•'' See footnotes 3 and 4, Table 2.
the trading signal, the eamings effect was only marginally significant.A review of the 19-day cumulative excess retums across the nine-joint clas-
sifications suggested, however, the presence of an economically important jointeffect. The mean cumulative excess retums associated with those two groupsbased on signals with similar implications, jointly "good news" or jointly "badnews," were quite large, —1.5 percent for (E—, sell) and -1-1.2 percent for (E-H,buy). Conversely, the excess retums associated with six of the remaining sevengroups, including those classifications with conflicting implication signals, werenot significantly different from zero. The results also reflected an ordering bylevels of prior trading within the Em and E+ categories. This ordering was,however, statistically significant only within the Em category. Taken together,this evidence supports the conclusion that the market interprets one signal inconjuction with the other.
The overall inferences did not change when we used the mechanical eam-ings forecast model to classify firms into eamings surprise groups. When the

534 S. Allen R. Ramanan
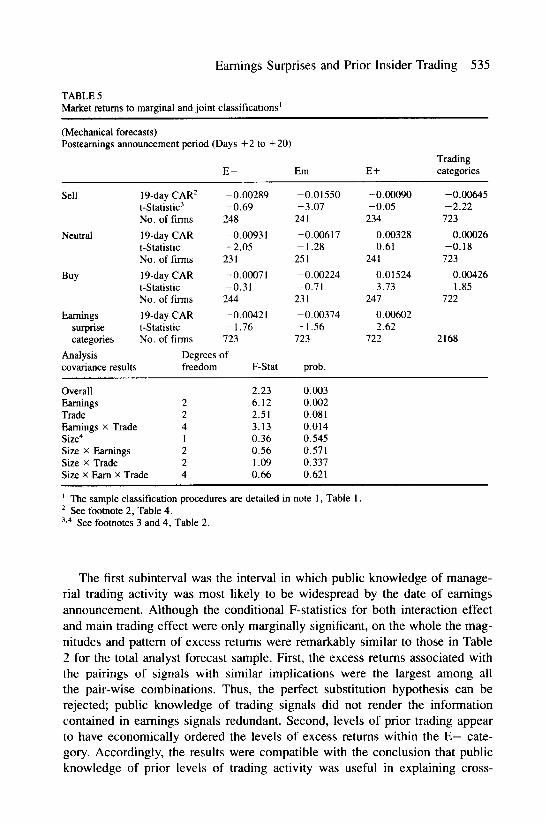
I.B.E.S. only sample was used, the results differed only minimally from the an-alyst forecast results. Expansion of the sample to include the subsample of firmsnot available on the I.B.E.S. data base changed the nature of the results, but notthe inference drawn from them. As reported in Table 5, both main effects andthe interaction effect were significant for this sample. To some extent this differ-ence in results is attributable to shifts in significance within the E— categories.However, similar to the results for the analyst forecast sample, the difference in19-day CARs across the E— categories were not significant. The striking featureof this analysis related to the postannouncement CARs for the E+ categories. Onaverage, it appears that firms that were not included in the I.B.E.S. sample andthat experienced positive unexpected eamings had larger 19-day CARs. More-over, within this group, the size of the CAR differed significantly by the levelof prior managerial trading activity. In summary, the behavior of excess retumsin the postannouncement period is consistent with the inference that the marketdoes not appear to instantaneously resolve the joint implications of trading andearnings signals at the time of earnings announcement.
Public availability of trading signals: A closer lookThe preceding analysis underscores the robustness of the basic pattem of resultsto two altemative specifications of expected eamings. However, a major limita-tion of the analysis was our inability to specify the timing of public availabilityof insider trading activity. Although some outsiders may leam about managerialtrading very quickly, widespread public knowledge may occur some 60 to 90days after the date of the trade. This possibility raises the question of whether theinference that we drew from the previous results are sensitive to our assumptionthat trading activity is known at the date of trade.
The sample of 1611 events was further examined with regard to the timing ofthe trade within the 75 days preceding annual eamings announcements. Specif-ically, three subintervals were examined; the first, where the trade occurred inthe interval between days —75 and —51; the second, in the interval days —50to —26; and the third, in the most recent 25 days preceding eamings announce-ments. This categorization gave rise to 903 events in the first group, 948 in thesecond, and 810 in the third. Given that we find repeated trading by insiders be-longing to the same firm in each of these three 25-day intervals, an aggregationof the above events corresponds to our sample of 1611.
The sample for each subinterval was subsequently grouped into nine jointclassifications using the procedures outlined earlier and an analysis of covarianceconducted. Results by subinterval for the three-day announcement period (days— 1 to +1) are reported in Table 6. As would be expected, across all threesub-intervals the main effect corresponding to eamings surprise was significant.More importantly, as shown in Panel B, a weak, but identifiable incrementaleffect of the trading signal on the levels of three-day CARs was found in thefirst (—75 to —51) and last (^25 to —1) subintervals.
Eamings Surprises and Prior Insider Trading 535
TABLE 5Market retums to marginal and joint classifications'
(Mechanical forecasts)Posteamings announcement period (Days +2 to +20)
Sell
Neutral
Buy
Eamingssurprisecategories
Analysiscovariance results
OverallEamingsTradeEamings x TradeSize*Size X EamingsSize X Trade
19-day CAR^t-Statistic^No. of firms
19-day CARt-StatisticNo. of firms
19-day CARt-StatisticNo. of firms
19-day CARt-StatisticNo. of firms
E -
-0.00289-0.69248
-0.00931-2.05231
-0.00071-0.31244
-0.00421-1.76
723
Degrees offreedom F-Stat
224122
Size X Eam x Trade 4
2.236.122.513.130.360.561.090.66
Em
-0.01550-3.07241
-0.00617-1.28251
-0.00224-0.71231
-0.00374-1.56
723
prob.
0.0030.0020.0810.0140.5450.5710.3370.621
E+
-0.00090-0.05234
0.003280.61
241
0.015243.73
247
0.006022.62
722
Tradingcategories
-0.00645-2.22723
0.00026-0.18723
0.004261.85
722
2168
The sample classification procedures are detailed in note 1, Table I.See footnote 2, Table 4.
•* See footnotes 3 and 4, Table 2.
The first subinterval was the interval in which public knowledge of manage-rial trading activity was most likely to be widespread by the date of eamingsannouncement. Although the conditional F-statistics for both interaction effectand main trading effect were only marginally significant, on the whole the mag-nitudes and pattem of excess retums were remarkably similar to those in Table2 for the total analyst forecast sample. First, the excess retums associated withthe pairings of signals with similar implications were the largest among allthe pair-wise combinations. Thus, the perfect substitution hypothesis can berejected; public knowledge of trading signals did not render the informationcontained in eamings signals redundant. Second, levels of prior trading appearto have economically ordered the levels of excess retums within the E— cate-gory. Accordingly, the results were compatible with the conclusion that publicknowledge of prior levels of trading activity was useful in explaining cross-

536 S. Allen R. Ramanan
TABLE 6Market retums to joint portfolios:' Comparisons across 25-day trading activity intervals
Eamings announcement period (Days — 1 to — 1)(Analyst forecasts)Panel A: Three-day cumulative retumsDays prior to announcement day
Insidertrading
periodPortfoliotype
E-/Sell
E-/Neutral
E-/Buy
Em/Sell
Em/Neutral
Em/Buy
E-I-/Sell
E-l-/Neutral
E-f/Buy
No. of firms
Panel B: ANCOVA
1 - 7 5 t o - 5 1CAR"(t-stat)
-0.01136- 2 . 8 2 '-0.00517-1.16-0.00251-0.65
-0.00228-0.52
O.(X)4111.420.005011.72
0.008962.45
-0.00186-0.49
O.(X)9532.45
903
StatisticsDays Prior to announcement day
Insidertradingperiod - 7 5 t o - 5 1
- 5 0 t o - 2 6CAR(t-stat)
-0.01412-4.72-0.00425-0.97-0.00306-1.04
0.004591.300.001040.22
-0.00163-0.32
0.003891.050.006442.080.012363.16
948
- 5 0 t o - 2 6
- 2 5 to - 1CAR(t-stat)
-0.01131-3.10-0.00384-0.55-0.00536-2.17
-O.(K)321-1.16
0.002000.790.003911.70
O.(X)2330.99O.(X)5I61.090.005752.09
810
- 2 5 to - 1
Overall FSig. Level
Eamings FSig. Level
Trading FSig. Level
Eam X Trade FSig. Level
Size" FSig. Level
2.18O.CX)6.580.002.190.111.770.130.270.60
3.220.00
11.980.000.350.701.670.150.590.44
1.740.035.200.012.190.110.620.650.010.91
The portfolios are formed as described in note 1, Table I, except trading activity ranks are basedon net shares traded within the portfolio formation interval.CAR refers to the cumulative abnormal retums for days — 1 to + 1 , where day 0 is eamings an-nouncement day. CARS are computed using the market model. See the section beginning on p. 522.t-statistics are computed using standardized daily retums.See footnote 4, Table 2.

Eamings Surprises and Prior Insider Trading 537
sectional differences in level of excess retums associated with eamings surpriseannouncements.
The results corresponding to the second subinterval provided no support forthe inference that the two signals had a joint effect at the time of eamings an-nouncement. Surprisingly, the third subinterval, the interval in which the proba-bility of widespread public knowledge of trading activity was low, also exhibiteda marginally significant additive trading effect. Inspection of the results acrossthe pair-wise combinations suggests that this effect was attributable to the ten-dency of levels of trading activity to order market reactions within the moderate(Em) and positive (E+) eamings surprise categories.
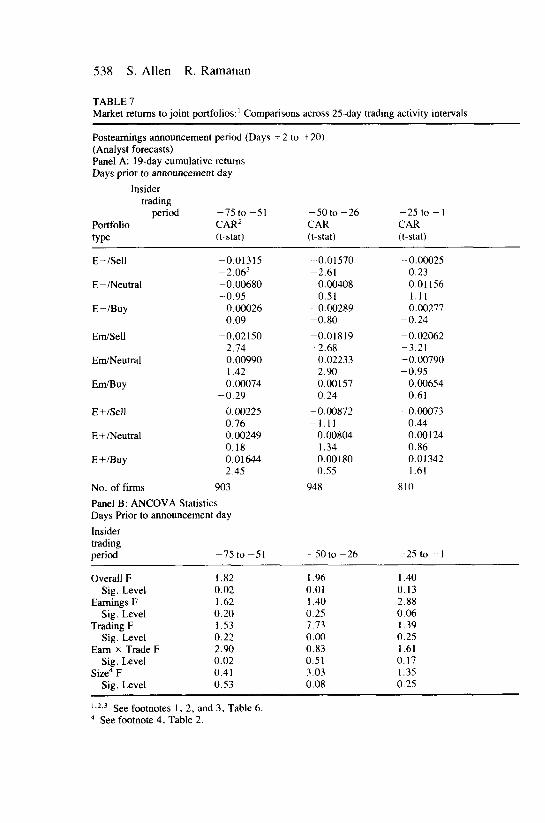
The results by subintervals for the post announcement period are reportedin Table 7. Only the first two groups had statistically significant ANCOVA fits,and the third, corresponding to the most recent trades, was only marginallysignificant. As was the case with the total analyst sample results previouslyreported, the conditional main effect of eamings surprise was not significant ineither the first or second subinterval. The major finding from the subintervalanalysis was that sales activity in either first or second interval was predictive ofsignificant postannouncement declines in the value of firms reporting negative ormoderate eamings surprises. It may be noted that in the first subinterval, wherethe trading activity was most likely to be public knowledge, purchase activity wasassociated with significant postannouncement increases in firm value for thosefirms reporting positive eamings surprises. In the second and the third intervals,purchase activity signals were not associated, either additively or interactively,with significant postannouncement changes in firm value.
Although the results of the third (the most recent 25 days) subinterval areperhaps somewhat puzzling, the overall findings from the analysis of these threesubintervals document the fact that the results in Tables 2 and 4 are not substan-tially driven by the trades occuring in the most recent 25 days. Eurther, althoughthere are no significant joint effects for the second subinterval, the pattem ofresults were not counterintuitive either. For the first subinterval, with a highprobability of public availability of insider trades, the pattem of results was verysimilar to that of the entire sample. This clearly indicates that controlling forthe timing of public availability of the trading signals is important.
Classification of trading signalsThe trading signal classification scheme employed to this point assumes thattrading signals are informative only if and when managers actually transact intheir firm's shares. Based on the assumption that only affirmative action by themanagers is informative, we excluded observations when no trading was ob-served in the 75 days prior to eamings announcements. As noted earlier, onlyslightly more than 53 percent (2168 of 4026) of our sample were preceded bymanagerial trading activity. Given the large number of "no trade" observations.
538 S. Allen R. Ramanan
TABLE 7Market retums to joint portfolios:' Comparisons across 25-day trading activity intervals
Posteamings announcement(Analyst forecasts)Panel A: 19-day cumulative
period (Days
retumsDays prior to announcement day
Insidertrading
periodPortfoliotype
E-/Sell
E-/Neutral
E-/Buy
Em/Sell
Em/Neutral
Em/Buy
E+/Sel]
E+/Neutral
E-H/Buy
No of firms
- 7 5 t o -51CAR^(t-stat)
-0.01315-2.06-'-0.00680-0.95
0.000260.09
-0.02150-2.74
0.009901.420.00074
-0.29
0.002250.760.002490.180.016442.45
903
+ 2 to -1-20)
-50 t o - 2 6CAR(t-stat)
-0.01570-2.61
0.004080.51
-0.00289-0.80
-0.01819-2.68
0.022332.900.001570.24
-0.00872-1.11
0.008041.340.001800.55
948
-25 to - 1CAR(t-stat)
-0.000250.23
-0.01156-1.11-0.00277-0.24
-0.02062-3.21-0.00790-0.95
0.006540.61
-0.000730.440.001240.860.013421.6!
810
Panel B: ANCOVA StatisticsDays Prior to announcement day
Insidertradingperiod - 7 5 t o - 5 1 - 5 0 t o - 2 6 -25 to - 1
Overall FSig. Level
Eamings FSig. Level
Trading FSig. Level
Eam X Trade FSig. Level
Size"FSig. Level
1.820.021.620.201.530.222.900.020.410.53
1.960.011.400.257.730.000.830.513.030.08
1.400.132.880.061.390.251.610.171.350.25
•" See footnotes 1, 2, and 3, Table 6.See footnote 4, Table 2.

Eamings Surprises and Prior Insider Trading 539
it is possible that the results reported were sensitive to omission of the aboveobservations.
At least two arguments can be made for including the no trade observationsin the analysis. Eirst, it is possible that both low levels of actual trading andno prior trading are equivalent signals that managers possess relatively littlespecial information; in other words, these are "neutral" signals. If this conjectureis descriptively valid, no difference in unexpected retums should be observedbetween pairings of our original "neutral" trading signal group and the aboveno-trade observations both with equivalent eamings surprise signals. Second,in contrast to the above conjecture, the market may have an expectation thatmanagers will trade prior to eamings announcements.^-^ In this scenario, it ispossible that the absence of an expected level of purchase (sales) activity maybe interpreted by the market as "bad (good)" news signals. If this conjecture isdescriptively valid, pairings of no-trade observations with eamings signals willhave different joint implications compared to pairings of low levels of actualtrading with equivalent eamings signals.
In order to assess the effects of these no-trade observations, the analysis forthe announcement period (Table 2) and postannouncement period (Table 4) werereplicated with the appropriate no-trade observations included. An examinationofthe 1858 observations of no trade in the 75 days preceding eamings announce-ment resulted in 634 observations for which (1) there was at least one insidertrading transaction reported in the five-year sample period and (2) eamings fore-casts were available on I.B.E.S. tape. These 634 observations were added to theearlier sample of 1611, and this expanded sample of 2245 observations wasranked by eamings surprises and classified into three categories. This expandedsample also corresponds to four levels of trading activity with the inclusion of634 no-trade observations. The ANCOVA procedure was repeated for these 12joint classifications, with eamings at three levels, trading at four levels, and sizeas a covariate.
The announcement period results are reported in Table 8. The two maineffects and the interaction effect were once again significant. This suggeststhat our inference that the two signals were jointly informative at the time ofeamings announcement is not sensitive to the exclusion of no trade observations.However, it is not clear whether the market views no-trade observations similarto neutral trading as in our relative classification. Eor example, the pairing ofno trade with either E— or Em resulted in statistically equivalent excess retumsas compared to the pairing of neutral trade with E— or Em. However, no tradepaired with E+ had excess retums that were significantly positive compared toneutral trade paired with E-n. Perhaps no trading when the market expected large
22 It may be noted that some evidence exists that levels of trading are generally elevated and takeplace on a recurring basis around calender year end (Seyhun, 1988). Thus, although tradingactivity by managers is generally infrequent, for firms with fiscal years ending December 31,it is even likely that some level of trading activity is expected by the market.

540 S. Allen R. Ramanan
TABLE 8Market returns to marginal and joint elassifications' including no-trading events
(Analyst forecasts)Eamings announcement period (Days -
Sell
Neutral
Buy
No trade
Eamingssurprisecategories
Analysis
Three-day CAR^t-Statistic'No. of firms
Three-day CARt-StatisticNo. of firms
Three-day CARt-StatisticNo. of firms
Three-day CARt-StatisticNo. of firms
Three-day CARt-StatisticNo. of firms
Degrees ofcovariance results freedom
OverallEamingsTrade
23
Eamings x Trade 6Size" 1
1 to +1)
E -
-0.01073-4.09165
-0.00791-2.50188
-0.00295-1.64180
-0.00840-4.13215
-0.00748-6.18748
F-Stat
5.6144.49
4.042.492.01
Em
-0.00154-0.75210
0.005192.32
169
0.000900.71
165
0.010664.63
205
0.003863.45
749
prob.
0.0010.0010.0010.0290.156
E+
0.007732.64
162
0.001440.91
180
0.011094.06
192
0.012615.04
214
0.008486.54
748
Tradingcategories
-0.00157-1.22537
-0.00065-0.02537
0.003262.09
537
0.004863.06
634
2245
The sample classification procedures are detailed in note 1, Table 1.•^•'' See footnotes 2, 3, and 4, Table 2.
sales by insiders resulted in such "good news." These conflicting results can beaddressed only in the context of developing a better proxy for the market'sexpectation of trading by insiders which is a topic for further research.
The results for the post-announcement period, reported in Table 9, were dif-ferent from those in Table 4 by the finding that the eamings main effect wassignificant. Otherwise, the basic pattem of results was observationally indistin-guishable. This reinforced our inference that the two signals had a joint effectin the postannouncement period.
ConclusionsThe results of this study support the notion that the surprise in eamings an-nouncements and trading activity preceding this announcement are jointly infor-mative. This joint effect, during the three days surrounding eamings announce-ments, seems to contain both additive and interactive components, suggesting

Eamings Surprises and Prior Insider Trading 541
TABLE 9Market returns to marginal and joint classifications' including no-trading events
(Analyst forecasts)Posteamings announcement period (Days -t-2 to +20)
Sell
Neutral
Buy
No trade
Eamingssurprisecategories
19-day CAR^t-Statistic'No. of firms
19-day CARt-StatisticNo. of firms
19-day CARt-StatisticNo. of firms
19-day CARt-StatisticNo. of firms
19-day CARt-StatisticNo. of firms
Analysis Degrees ofcovariance results freedom
OverallEamings 2Trade 3Eamings x Trade 6Size" 1
E -
-0.01447-2.87165
0.00136-0.02188
-0.00274-0.23180
-0.00449-1.36215
-0.00480-2.21748
F-Stat
1.614.344.910.422.04
Em
-0.01242-2.53210
0.004480.48
169
0.006300.94
165
-0.00100-0.43205
-0.00136-0.86
749
prob.
0.0330.0010.0020.8350.153
E+
-0.00254-0.02162
0.002290.62
180
0.011902.53
192
0.001740.77
214
0.003552.01
748
Tradingcategories
-0.01007-3.11
537
0.002660.59
537
0.005272.01
537
-0.00126-0.66634
2245
' The sample classification procedures are detailed in note 1, Table 1.^ See footnote 2, Table 4.^•* See foomotes 3 and 4, Table 2.
that each signal is not redundant when the other is publicly available. Indeed,it appears that each signal may contain information about the future prospectsof the firm not contained in the other and/or the interaction helps in resolv-ing some of the uncertainty associated with each signal. The results during thepostannouncement period are less pronounced.
One potential limitation could be related to when the information about in-sider trading becomes public. We have examined the severity of this problemby analyzing three subsamples based on the timing of the trade. It would appearthat the most recent trades, which are the least likely to be public knowledge,do not drive the main results. Indeed, the results corresponding to the trades inthe interval days —75 to —51 lead to inferences very similar to those for theentire sample. This analysis increases our confidence in inferring joint informa-tion content for eamings surprises and prior insider trading. At the same time.

542 S. Allen R. Ramanan
this analysis underscores the importance of capturing the timing of public avail-ability of insider trading. Future research may be oriented toward taking intoaccount sources other than the insider filings with the SEC, such as some tradepublications, in identifying the timing of public availability of insider trading.
The inference of joint informativeness between the two signals was supportedeven when the no-trade observations were included in the analysis. However, itis not clear as to how the market perceives these no trades vis-a-vis the neutraltrade categories. This suggests the need for developing better expectations oftrading by insiders in order to capture the surprise in trading and its informa-tiveness. In this context, no trading in a particular period could potentially beinformative when the market is expecting the insiders to be either selling orbuying significantly.
Regardless of the limitations, the pattem of results from this rather pre-liminary analysis is encouraging enough to warrant further exploration of theinformational properties of insider trading. One potential line of inquiry wouldbe to document any special information contained in insider trading, which isnot contained in other recurring and routine information events. Toward thatend, the results of this study suggest that the market's response to eamings an-nouncements may be one important control factor in one's attempts to isolateany idiosyncratic information content underlying the insider's trade.
ReferencesAjinkya, B. and M. Gift, "Corporate Managers' Earnings Forecasts and Symmetrical
Adjustments of Market Expectations," Journal of Accounting Research (Autumn1984) pp. 425^44,
Atiase, R.K., "Predisclosure Information, Firm Capitalization, and Security Price Be-havior around Eamings Announcements," Journal of Accounting Research (Spring1985) pp. 21-36.
Ball, R. and P. Brown, "An Empirical Evaluation of Accounting Income Numbers,"Journal of Accounting Research (Autumn 1968) pp. 159-178.
Barry, Christopher B. and Stephen J. Brown, "Differential Information and the SmallFirm Effect," Journal of Financial Economics (June 1984) pp. 283-294.
Brown, L.D., R.L. Hagerman, P.A. Griffin, and M.E. Zmijewski, "An Evaluation ofAltemative Proxies for the Markets' Assessments of Unexpected Eamings" Journalof Accounting and Economics (July 1987) pp. 159-194.
Beaver, W., Financial Reporting: An Accounting Revolution (Englewood Cliffs, N.J.:1981).
, R. Clarke, and W. Wright, "The Association between Unsystematic SecurityRetums and the Magnitude of Eaming Forecast Errors," Journal of AccountingResearch (Autumn 1979) pp. 316-340.
Dye, R.. "Inside Trading and Incentives," Journal of Business (July 1984) pp. 295-313.Elliott, J., D. Morse, and G. Richardson, "The Association between Insider Trading
and Information Announcements, The Rand Journal of Economics (Winter 1984)pp. 521-536.
Finnerty, J., "Insiders and Market Efficiency," The Journal of Finance (September1976) pp. 1141-1148.
Foster, G., C. Olsen, and T. Shevlin, "Eamings Releases, Anomalies, and the Behaviorof Security Retums." The Accountinfi Review (October 1984) pp. 574-603.

Eamings Surprises and Prior Insider Trading 543
Fowler, David J. and C. Harvey Rorke, "Insider Trading Profits on the Toronto StockExchange, 1967-1977," Canadian Journal of Administrative Sciences (March 1988)pp. 13-25.
Givoly, D. and D. Palmon, "Insider Trading and the Exploitation of Inside Information:Some Empirical Evidence," Journal of Business (January 1985) pp. 69-87.
Gonedes, N.J., "Risk, Information, and the Effects of Special Accounting Items onCapital Market Equilibrium," Journal of Accounting Research (Autumn 1975) pp.220-256.
, "Corporate Signaling, Extemal Accounting, and Capital Market Equilibrium:Evidence on Dividends, Income, and Extraordinary Items," Journal of AccountingResearch (Spring 1978) pp. 26-79.
Grant, Edward B. "Market Implications of Differential Amounts of Interim Informa-tion," 7oMrna/ of Accounting Research (Spring 1980) pp. 255-268.
Hirshleifer, J. and M. Rubenstein, "Speculation and Information in Securities Markets,"Proceedings—XX. The Institute of Management Science (1976) pp. 799-802.
Hoskin, R.E., J.S. Hughes, and W.E. Ricks, "Evidence on the Incremental Contentof Additional Firm Disclosures Made Concurrently with Eamings," Journal ofAccounting Research (Supplement 1986) pp. 1-36.
Jaffe, J., "Special Information and Insider Trading," Journal of Business (July 1974)pp 410-428.
Kane, A., Y.K. Lee, and A. Marcus, "Eamings and Dividend Announcements: Is therea Corroboration Effect?" Journal of Finance (September 1984) pp. 1091-1100.
Kripke, H., The SEC and Corporate Disclosure: Regulation in Search of a Purpose(New York: Law & Business, Inc., 1979).
Lee, W. and M.E. Soit, "Insider Trading: A Poor Guide to Market Timing," TheJournal of Portfolio Management (Summer 1986) pp. 65- 71.
Lev, B. and J.A. Ohlson, "Market-Based Empirical Research in Accounting: A Review,Interpretation, and Extension," Journal of Accounting Research, (Supplement 1982)pp. 249-322.
Neter, J., W. Wasserman, and M. Kutner, Applied Linear Statistical Models: Regres-sion. Analysis of Variance and Experimental Design (Homewood, 111.; Richard D.Irwin, 1985).
O'Brien, P.C., "Analysts' Forecasts as Eamings Expectations," Journal of Accountingand Economics (January 1988) pp. 53-83.
Penman, S.H., "A Comparison of the Information Content of Insider Trading andManagement Eamings Forecasts," Journal of Financial and Quantitative Analysis(March 1985) pp. 1-18.
Ronen, J., "Effect of Insider Trading Rules on Information Generation and Disclosureby Corporations," The Accounting Review (April 1977) pp. 438—449.
Ross, S., "Disclosure Regulation in Financial Markets: Implications of Modem Financeand Signalling Theory," in F.R. Edwards (ed.). Issues in Financial Regulation (NewYork: McGraw-Hill, 1979) pp. 177-202.
Seyhun, H.N., "Insiders' Profits, Costs of Trading and Market Efficiency," Journal ofFinancial Economics (June 1986) pp 189-212.
, " The January Effect and Aggregate Insider Trading," The Journal of Finance(March 1988) pp. 129-141.
Trueman, B., "Motivating Managers to Reveal Inside Information," The Journal ofFinance (September 1983) pp. 1253-1269.