Earnings Results for the 9-month Period ... - group.softbank · Neither Sprint nor SoftBank...
56
Earnings Results for the 9-month Period Ended December 31, 2014 SoftBank Corp. February 10, 2015
Transcript of Earnings Results for the 9-month Period ... - group.softbank · Neither Sprint nor SoftBank...
Earnings Results for the 9-month Period
Ended December 31, 2014
SoftBank Corp.February 10, 2015
Disclaimer This material was prepared based on information available and views held at the time it was made. Statements in this material that are not historical facts, including, without limitation, plans, forecasts and strategies are “forward-looking statements”. Forward-looking statements are by their nature subject to various risks and uncertainties, including, without limitation, a decline in general economic conditions, general market conditions, technological developments, changes in customer demand for products and services, increased competition, risks associated with international operations, and other important factors, each of which may cause actual results and future developments to differ materially from those expressed or implied in any forward-looking statement. With the passage of time, information in this material (including, without limitation, forward-looking statements) could be superseded or cease to be accurate. SoftBank Corp. disclaims any obligation or responsibility to update, revise or supplement any forward-looking statement or other information in any material or generally to any extent. Use of or reliance on the information in this material is at your own risk. Information contained herein regarding companies other than SoftBank Corp. and other companies of the SoftBank Group is quoted from public sources and others. SoftBank Corp. has neither verified nor is responsible for the accuracy of such information. Any statements made herein regarding Sprint Corporation (“Sprint”) are made by SoftBank solely in its capacity as an investor in Sprint. None of such statements are made on behalf of or attributable to Sprint. Any information contained herein regarding Sprint is subject to any and all subsequent disclosures made by Sprint on its own behalf. Neither Sprint nor SoftBank undertakes any obligation to update the information contained herein in connection with any subsequent disclosures made by Sprint, or to reflect any other subsequent circumstances or events. Nothing contained herein may be construed as an obligation on the part of Sprint to provide disclosures or guidance on its own behalf.
2
Consolidated Results of Operations
2003 ’04 ’05 ’06 ’07 ’08 ’09 ’10 ’11 ’12 ’13 ’14
(JPY)
3
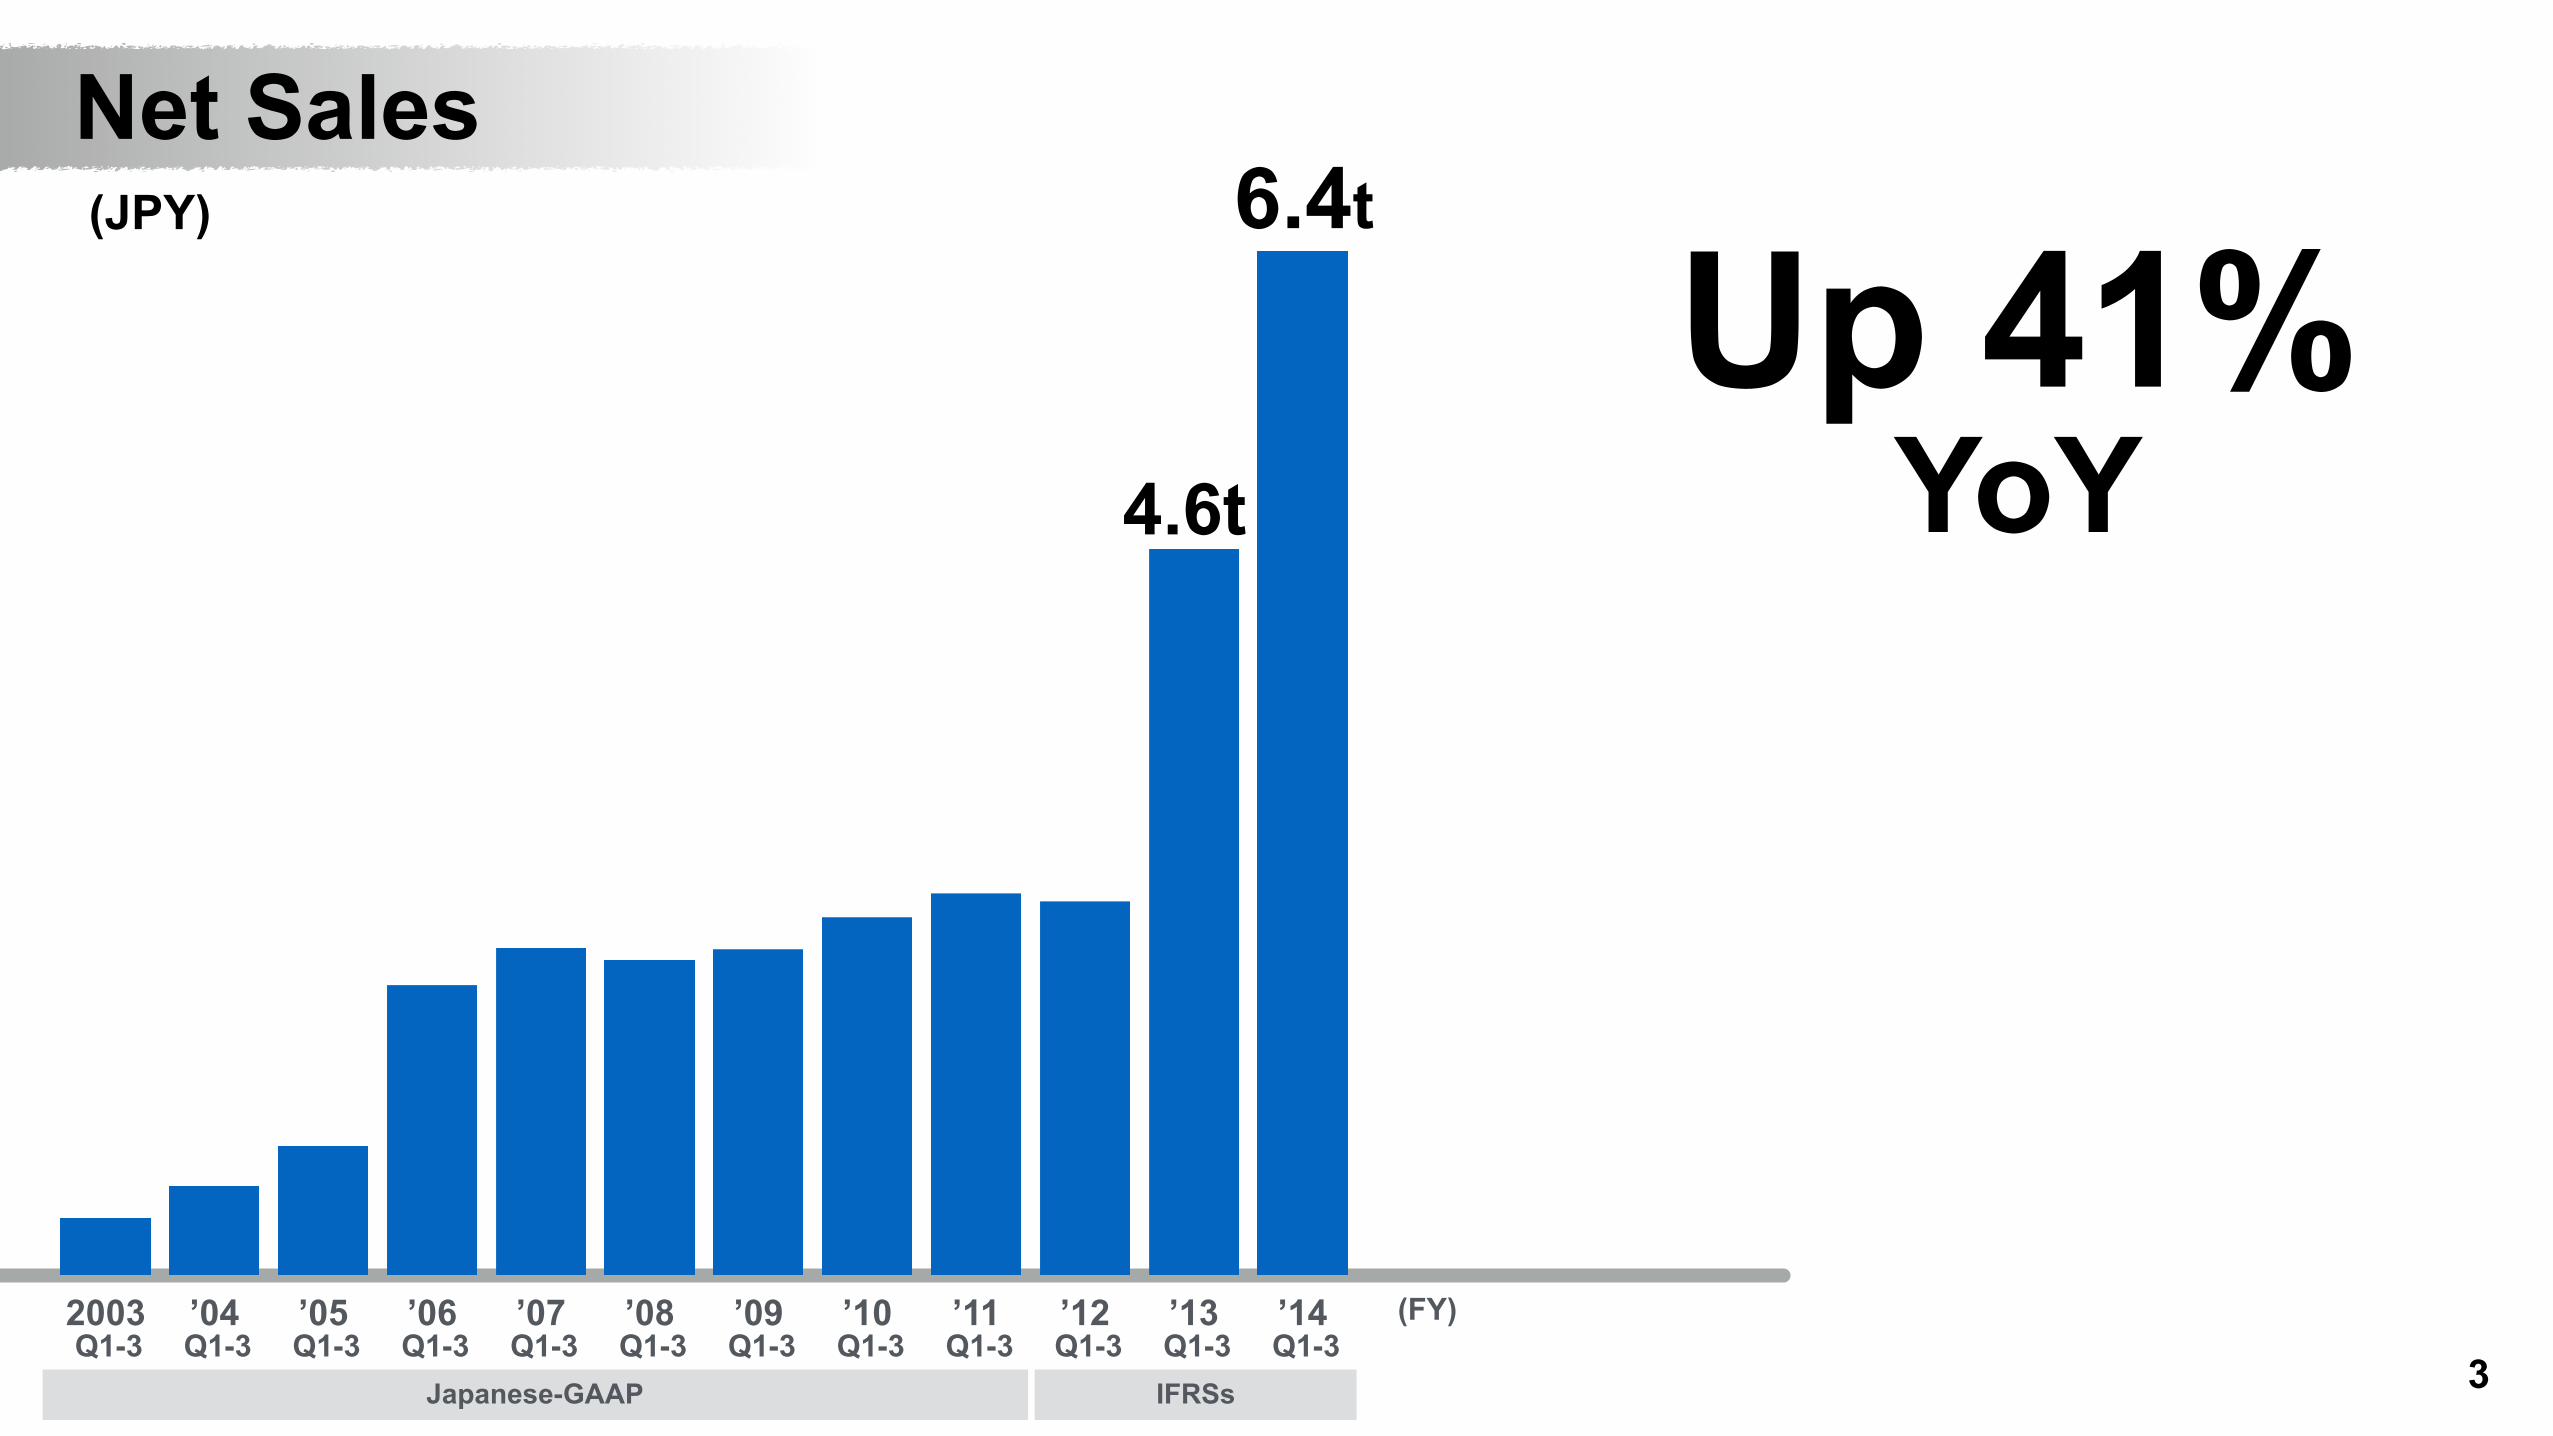
Net Sales
Japanese-GAAP IFRSsQ1-3 Q1-3 Q1-3 Q1-3 Q1-3 Q1-3 Q1-3 Q1-3 Q1-3 Q1-3 Q1-3 Q1-3
(FY)
6.4t
Up 41% YoY4.6t
2003 ’04 ’05 ’06 ’07 ’08 ’09 ’10 ’11 ’12 ’13 ’144
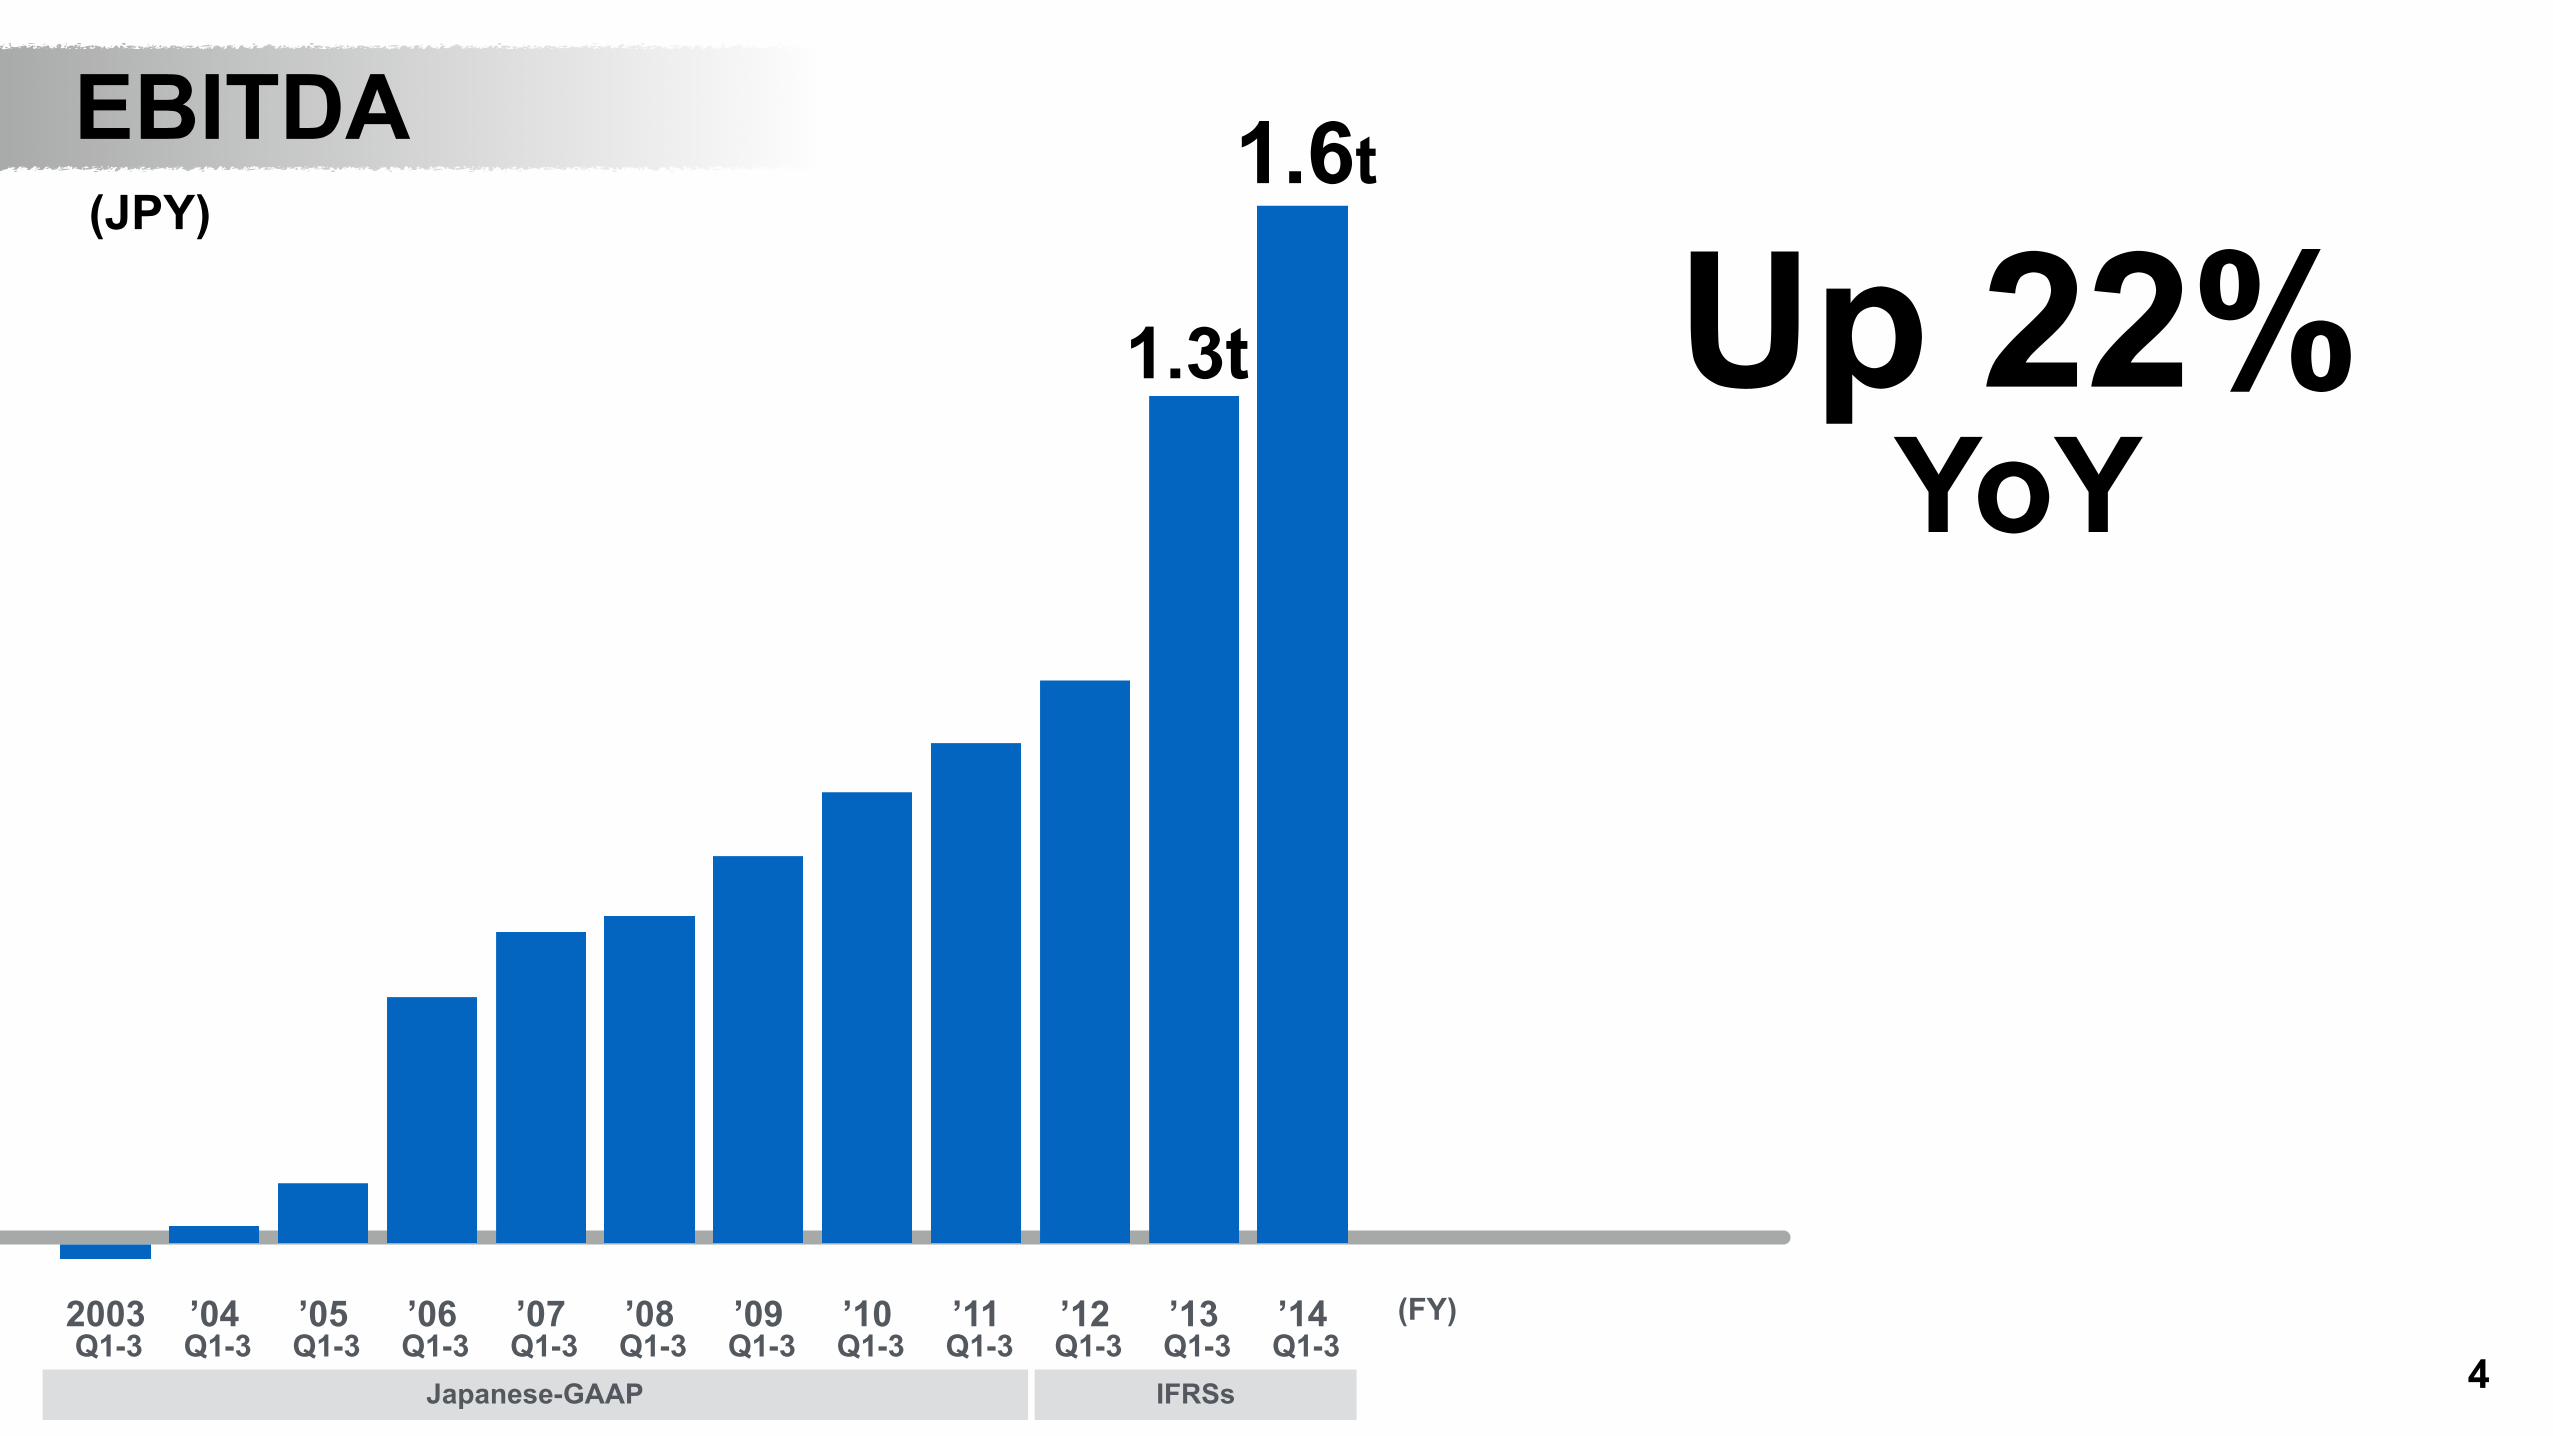
EBITDA 1.6t
Japanese-GAAP IFRSsQ1-3 Q1-3 Q1-3 Q1-3 Q1-3 Q1-3 Q1-3 Q1-3 Q1-3 Q1-3 Q1-3 Q1-3
(FY)
(JPY)
Up 22% YoY
1.3t

2003 ’04 ’05 ’06 ’07 ’08 ’09 ’10 ’11 ’12 ’13 ’14
5Japanese-GAAP IFRSsQ1-3 Q1-3 Q1-3 Q1-3 Q1-3 Q1-3 Q1-3 Q1-3 Q1-3 Q1-3 Q1-3 Q1-3
(FY)
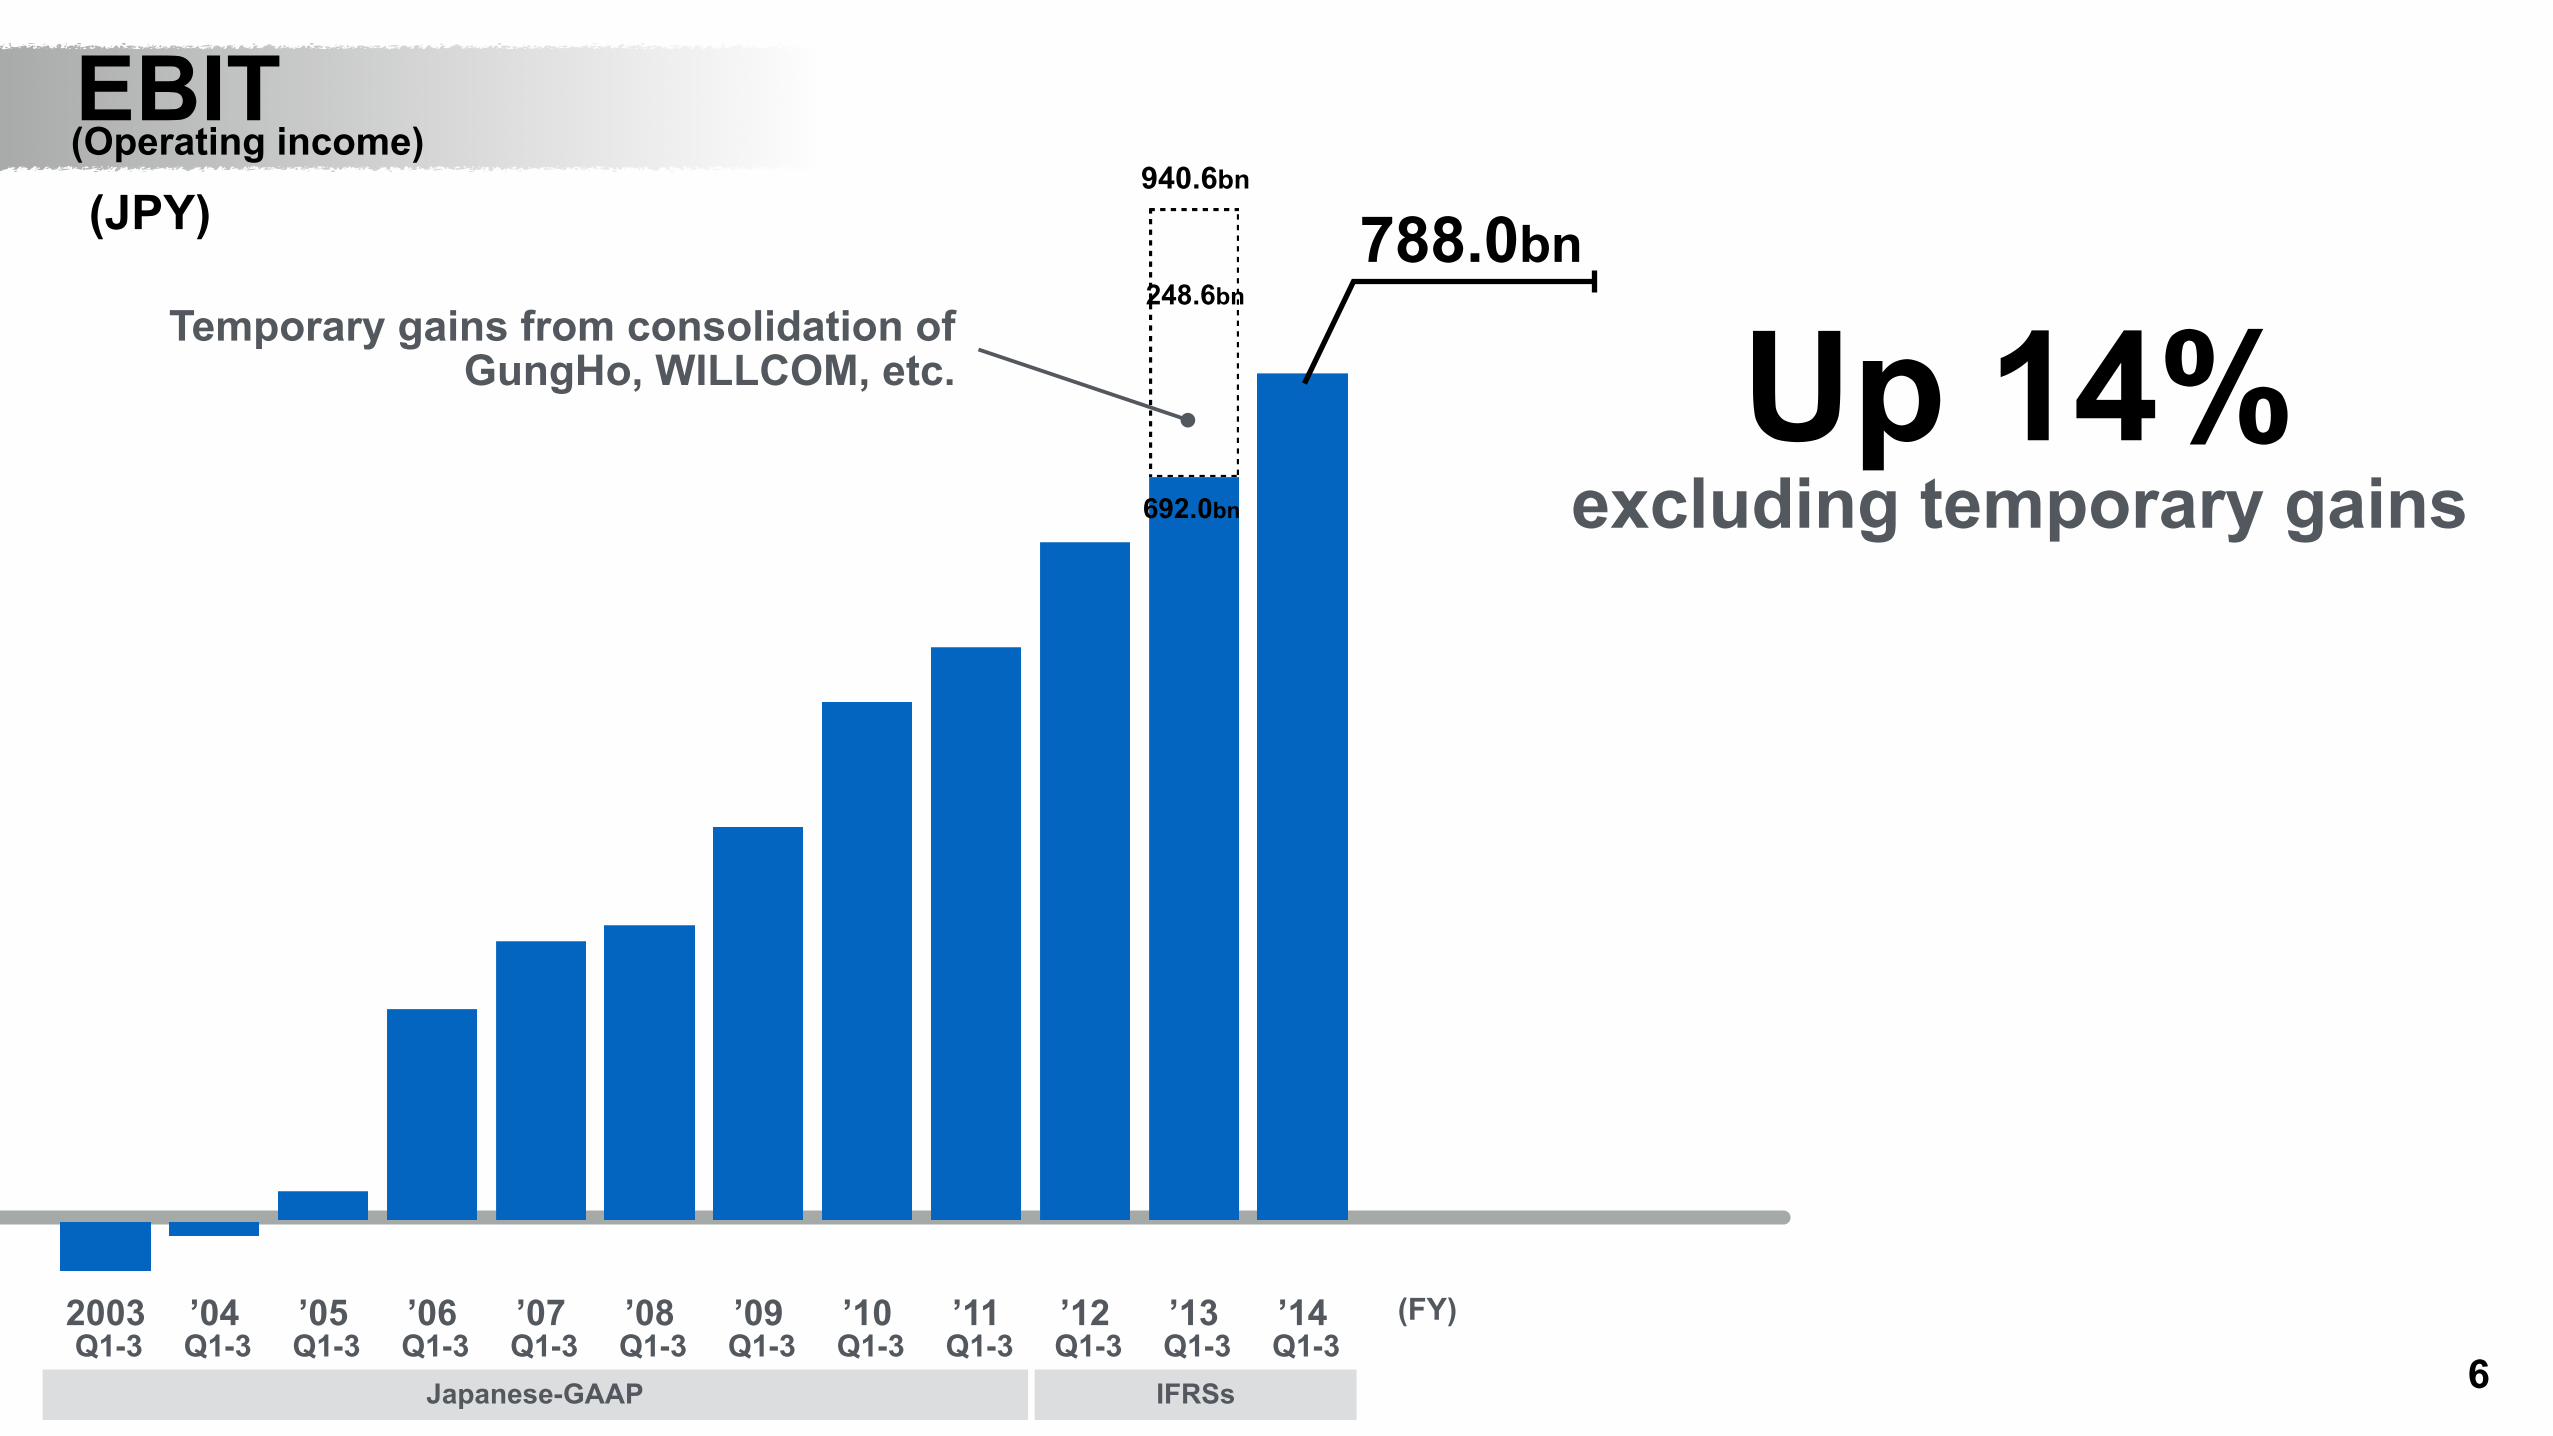
248.6bn
788.0bnTemporary gains from consolidation of
GungHo, WILLCOM, etc. Down 16%
940.6bn(JPY)
EBIT(Operating income)
2003 ’04 ’05 ’06 ’07 ’08 ’09 ’10 ’11 ’12 ’13 ’14
6Japanese-GAAP IFRSs
(FY)
692.0bn
Up 14%excluding temporary gains
Q1-3 Q1-3 Q1-3 Q1-3 Q1-3 Q1-3 Q1-3 Q1-3 Q1-3 Q1-3 Q1-3 Q1-3
(JPY)940.6bn
Temporary gains from consolidation of GungHo, WILLCOM, etc.
EBIT(Operating income)
788.0bn248.6bn
2003 ’04 ’05 ’06 ’07 ’08 ’09 ’10 ’11 ’12 ’13 ’14
7Japanese-GAAP IFRSsQ1-3 Q1-3 Q1-3 Q1-3 Q1-3 Q1-3 Q1-3 Q1-3 Q1-3 Q1-3 Q1-3 Q1-3
(FY)
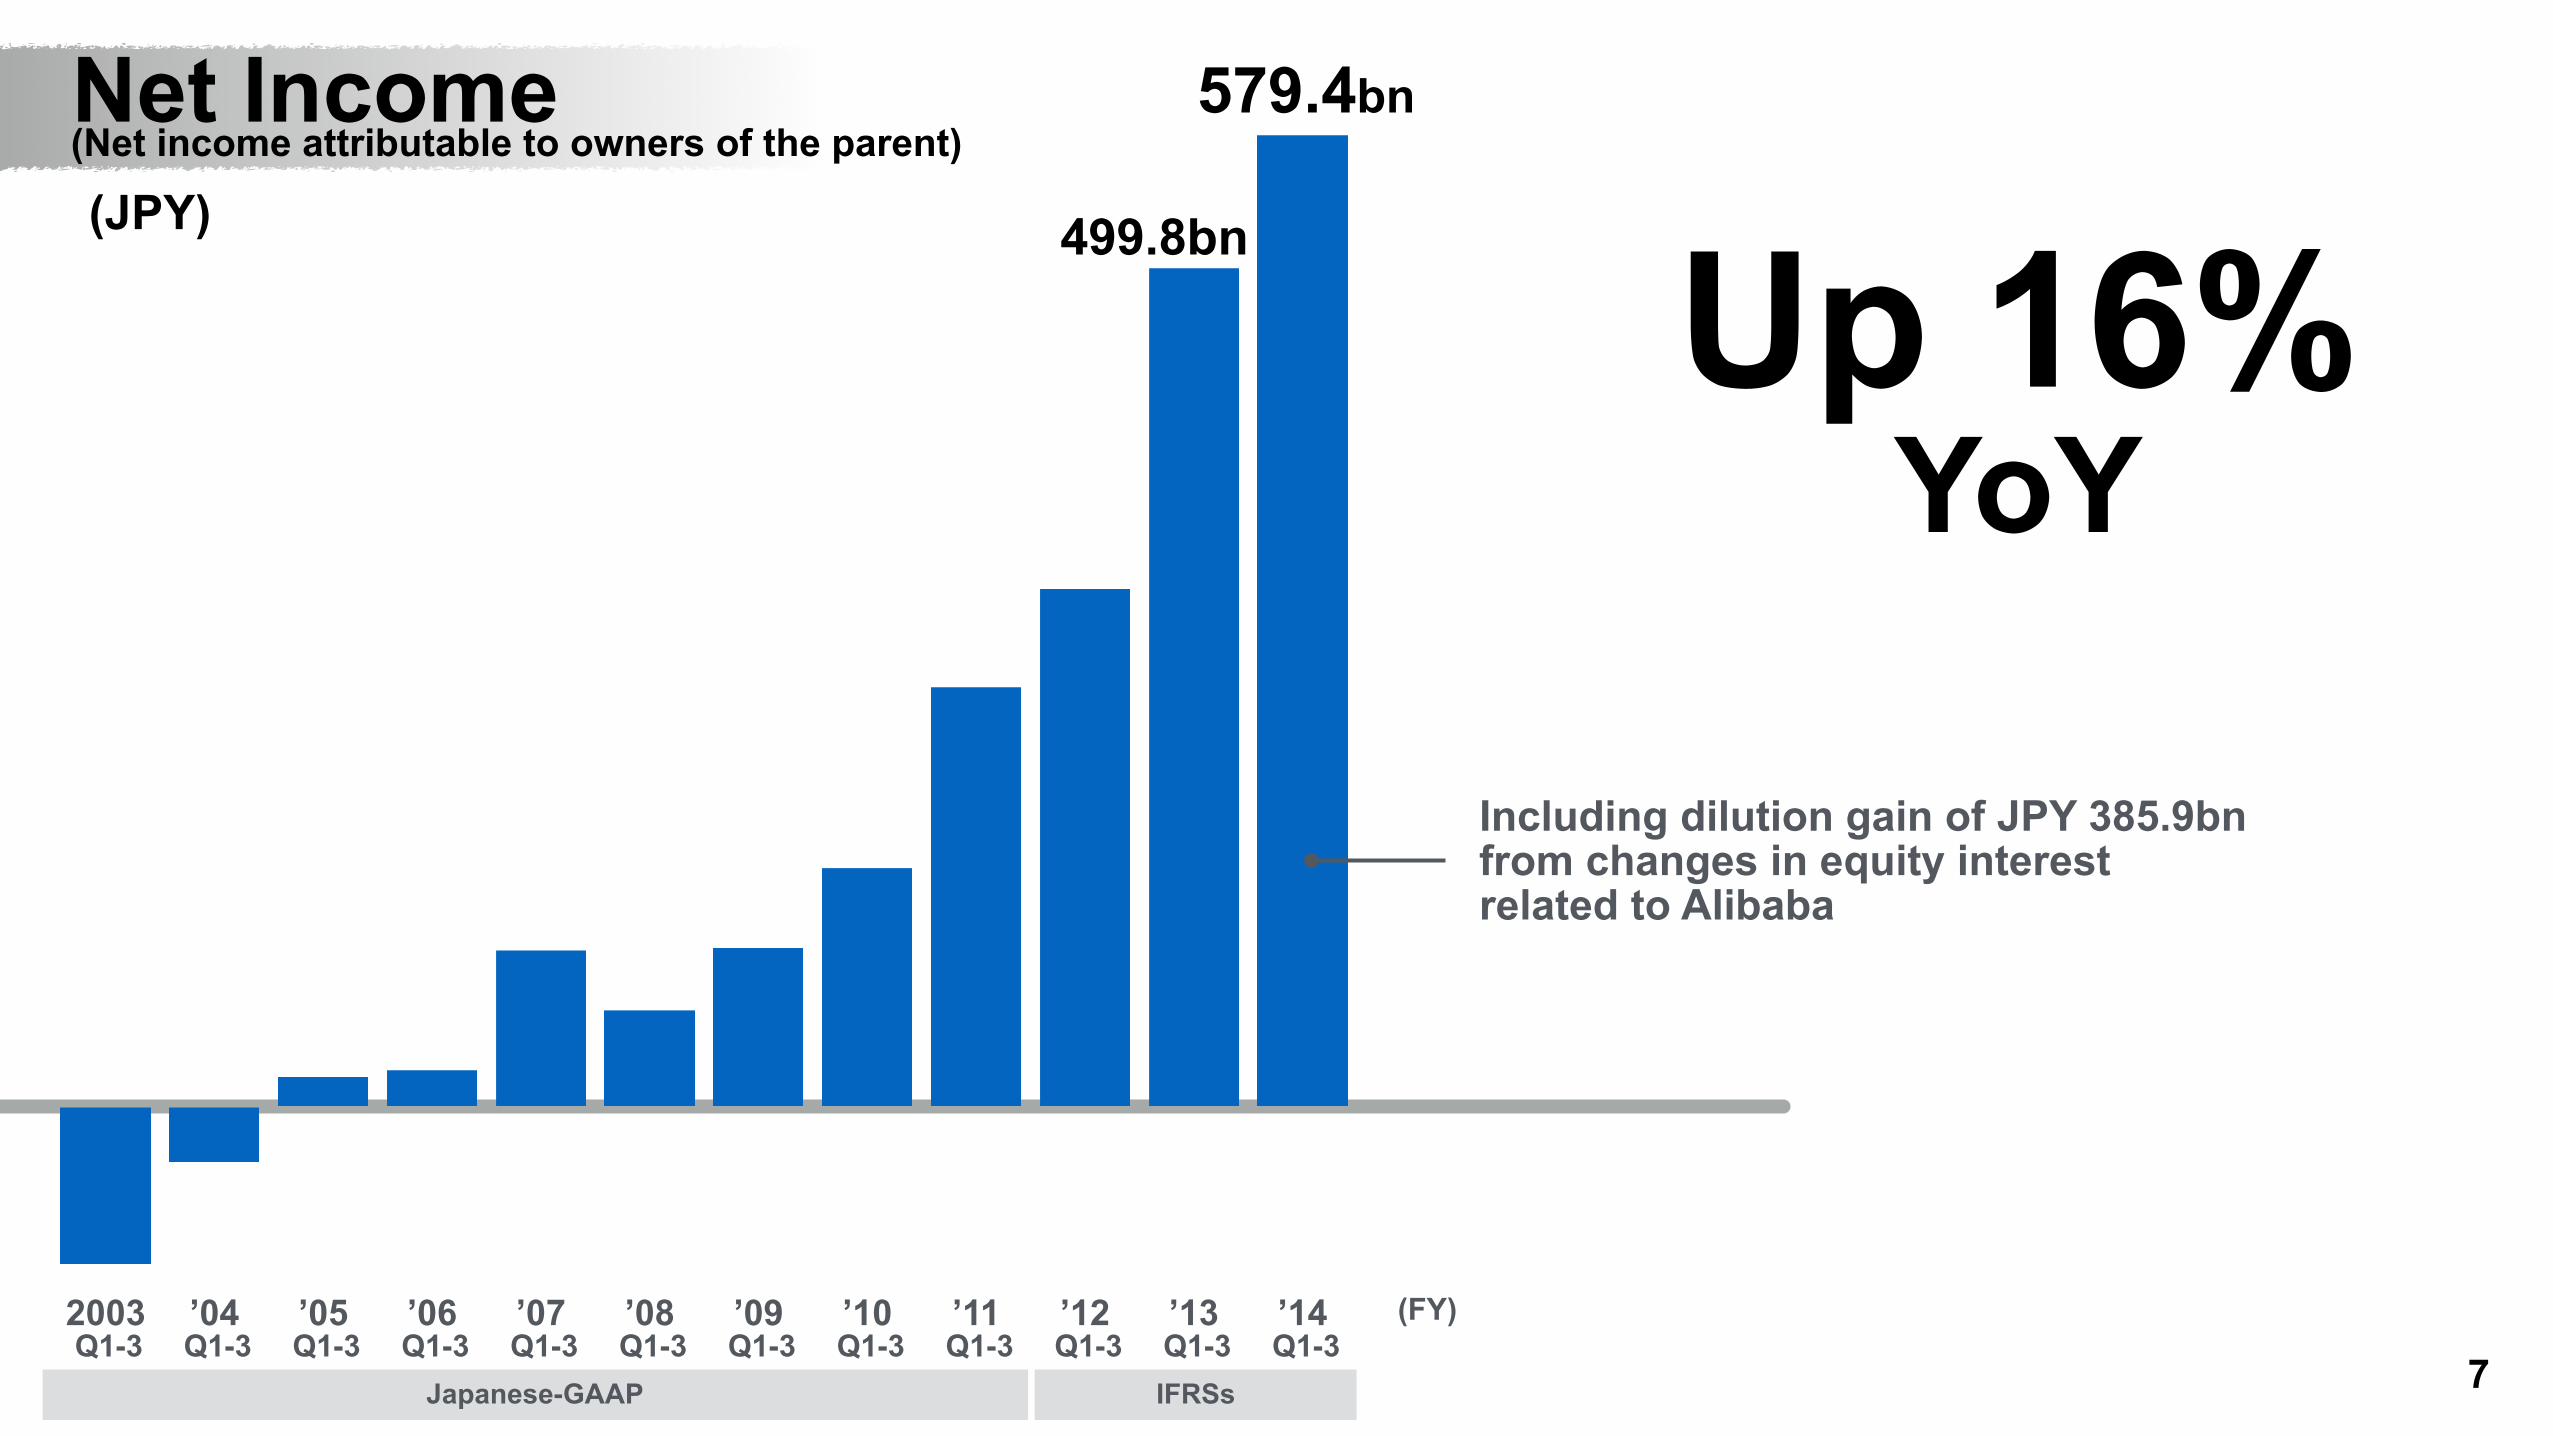
579.4bn
(JPY)
Including dilution gain of JPY 385.9bn from changes in equity interest related to Alibaba
Net Income(Net income attributable to owners of the parent)
Up 16% YoY
499.8bn
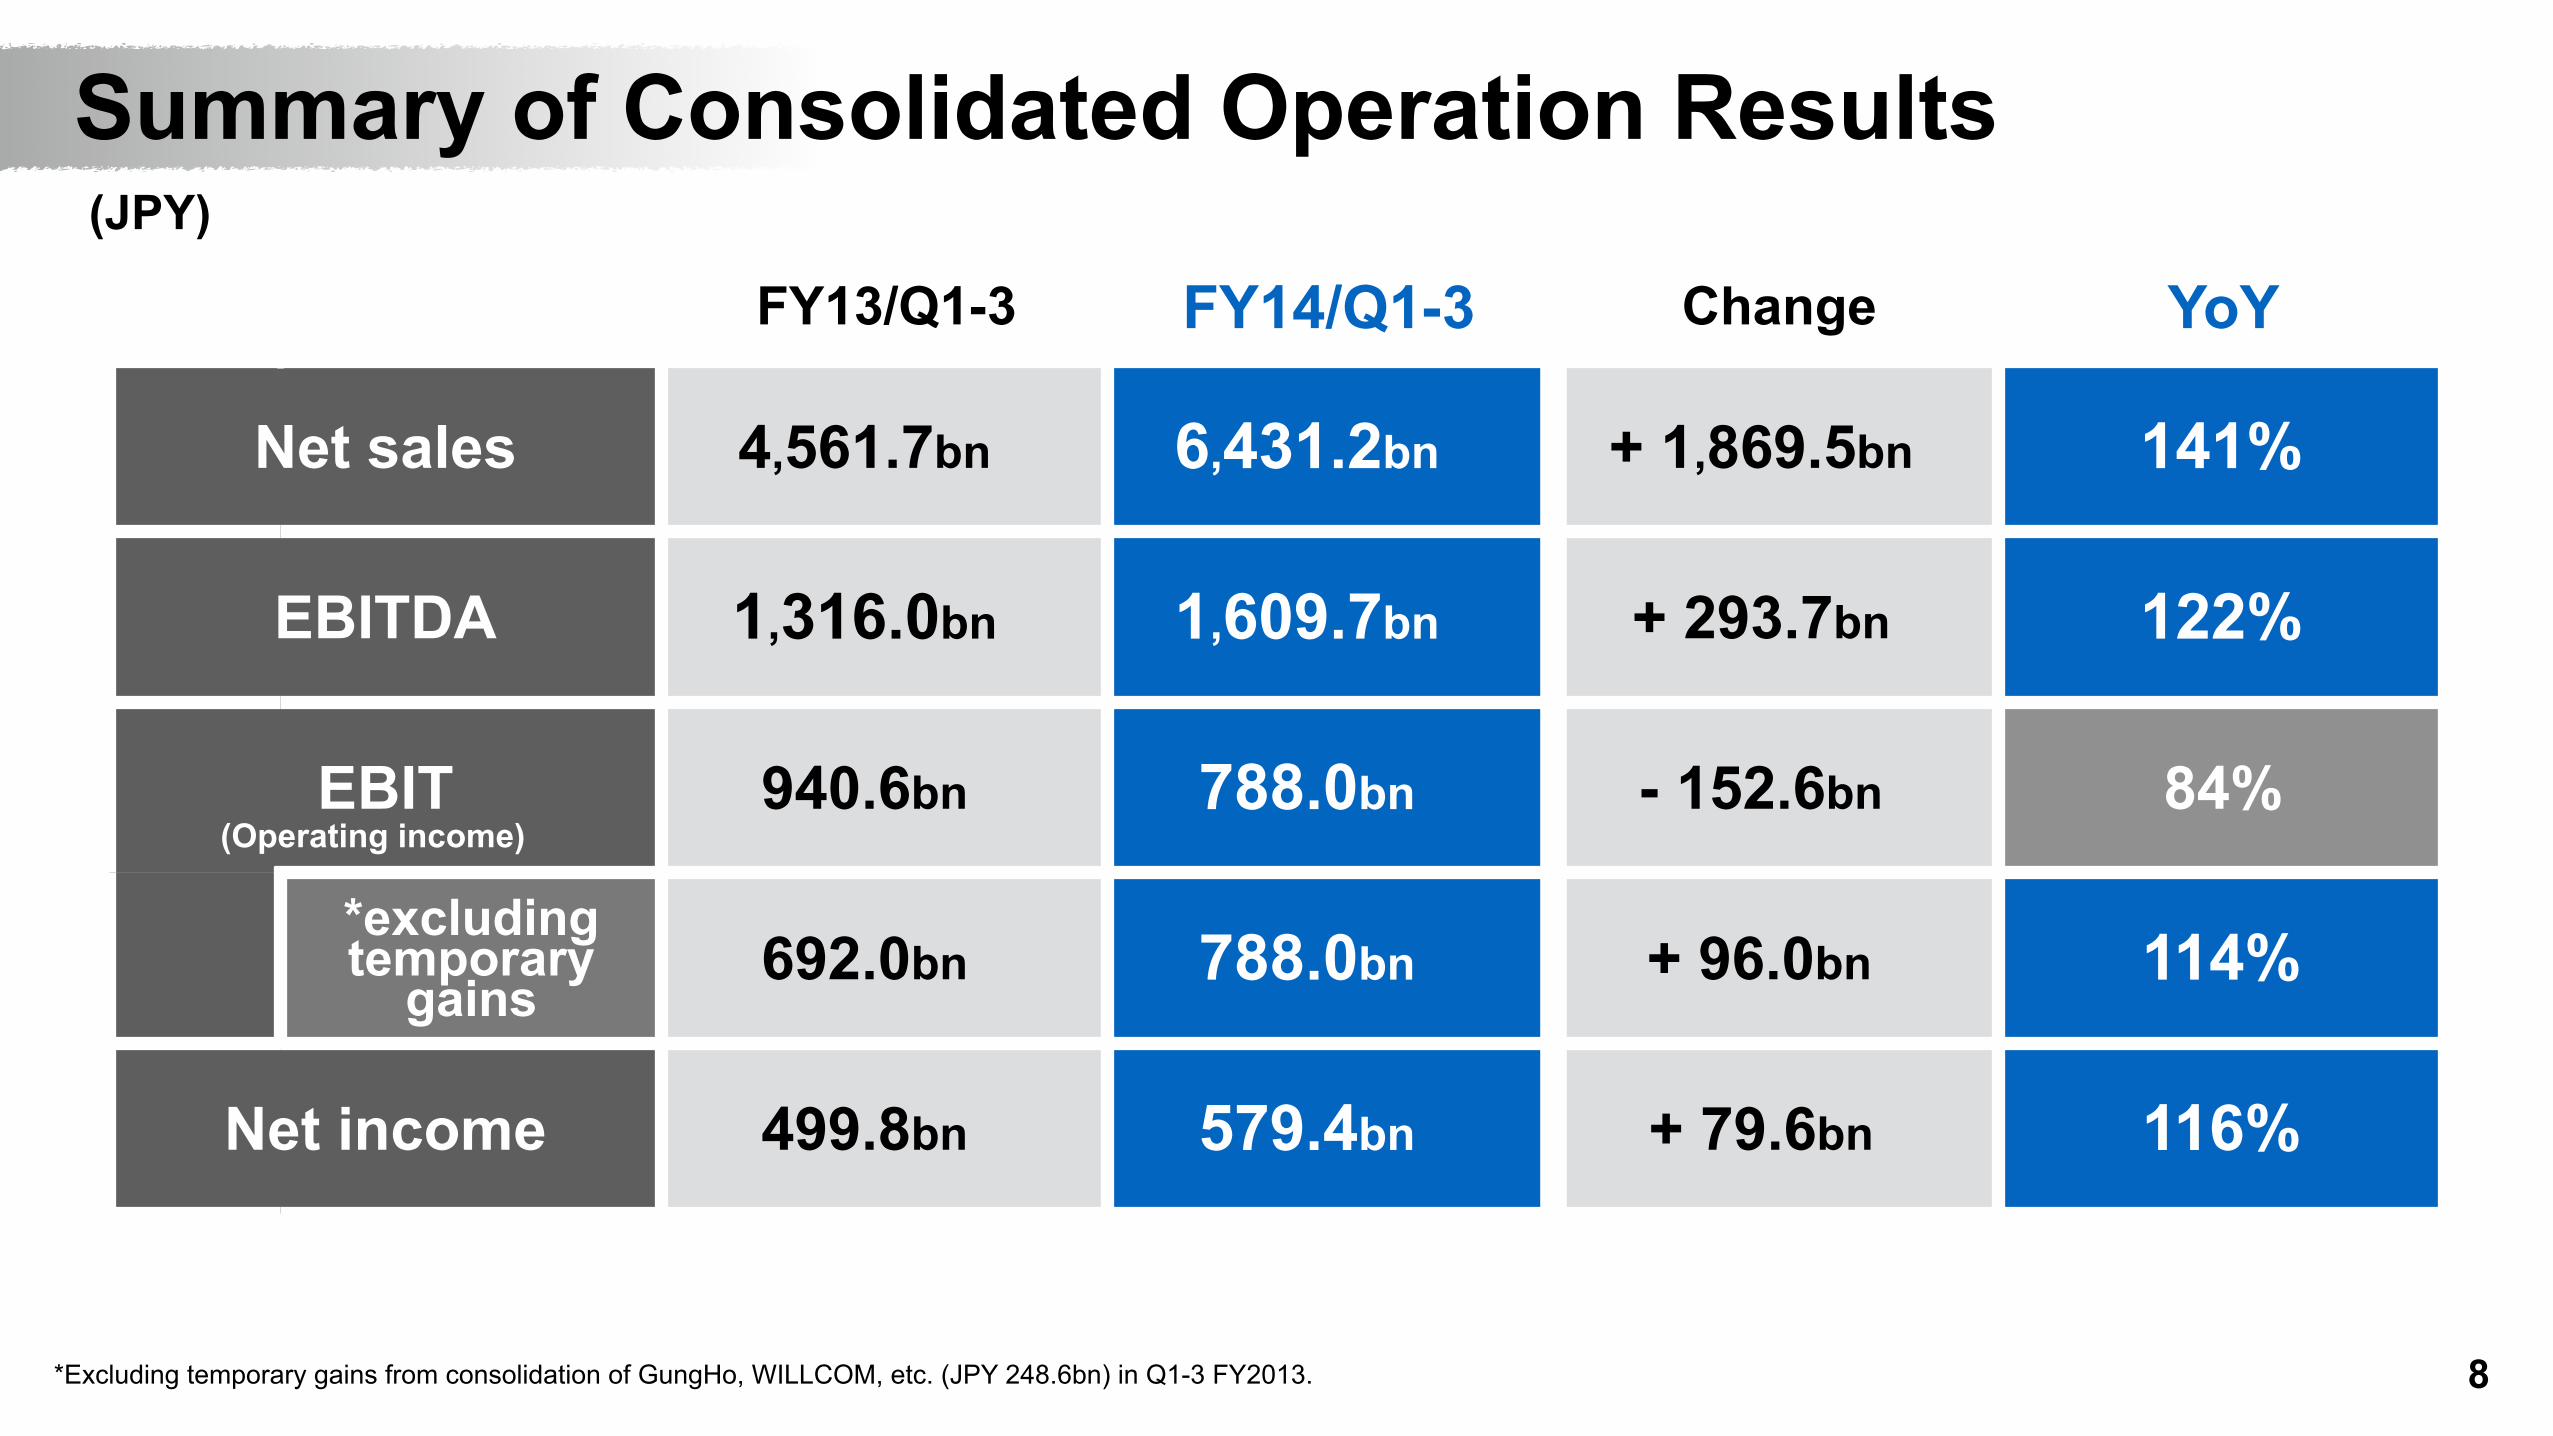
FY13/Q1-3 FY14/Q1-3 Change YoY
Net sales 4,561.7bn 6,431.2bn + 1,869.5bn 141%
EBITDA 1,316.0bn 1,609.7bn + 293.7bn 122%
EBIT 940.6bn 788.0bn - 152.6bn 84%
*excluding temporary
gains692.0bn 788.0bn + 96.0bn 114%
Net income 499.8bn 579.4bn + 79.6bn 116%
8*Excluding temporary gains from consolidation of GungHo, WILLCOM, etc. (JPY 248.6bn) in Q1-3 FY2013.
Summary of Consolidated Operation Results(JPY)
(Operating income)
9
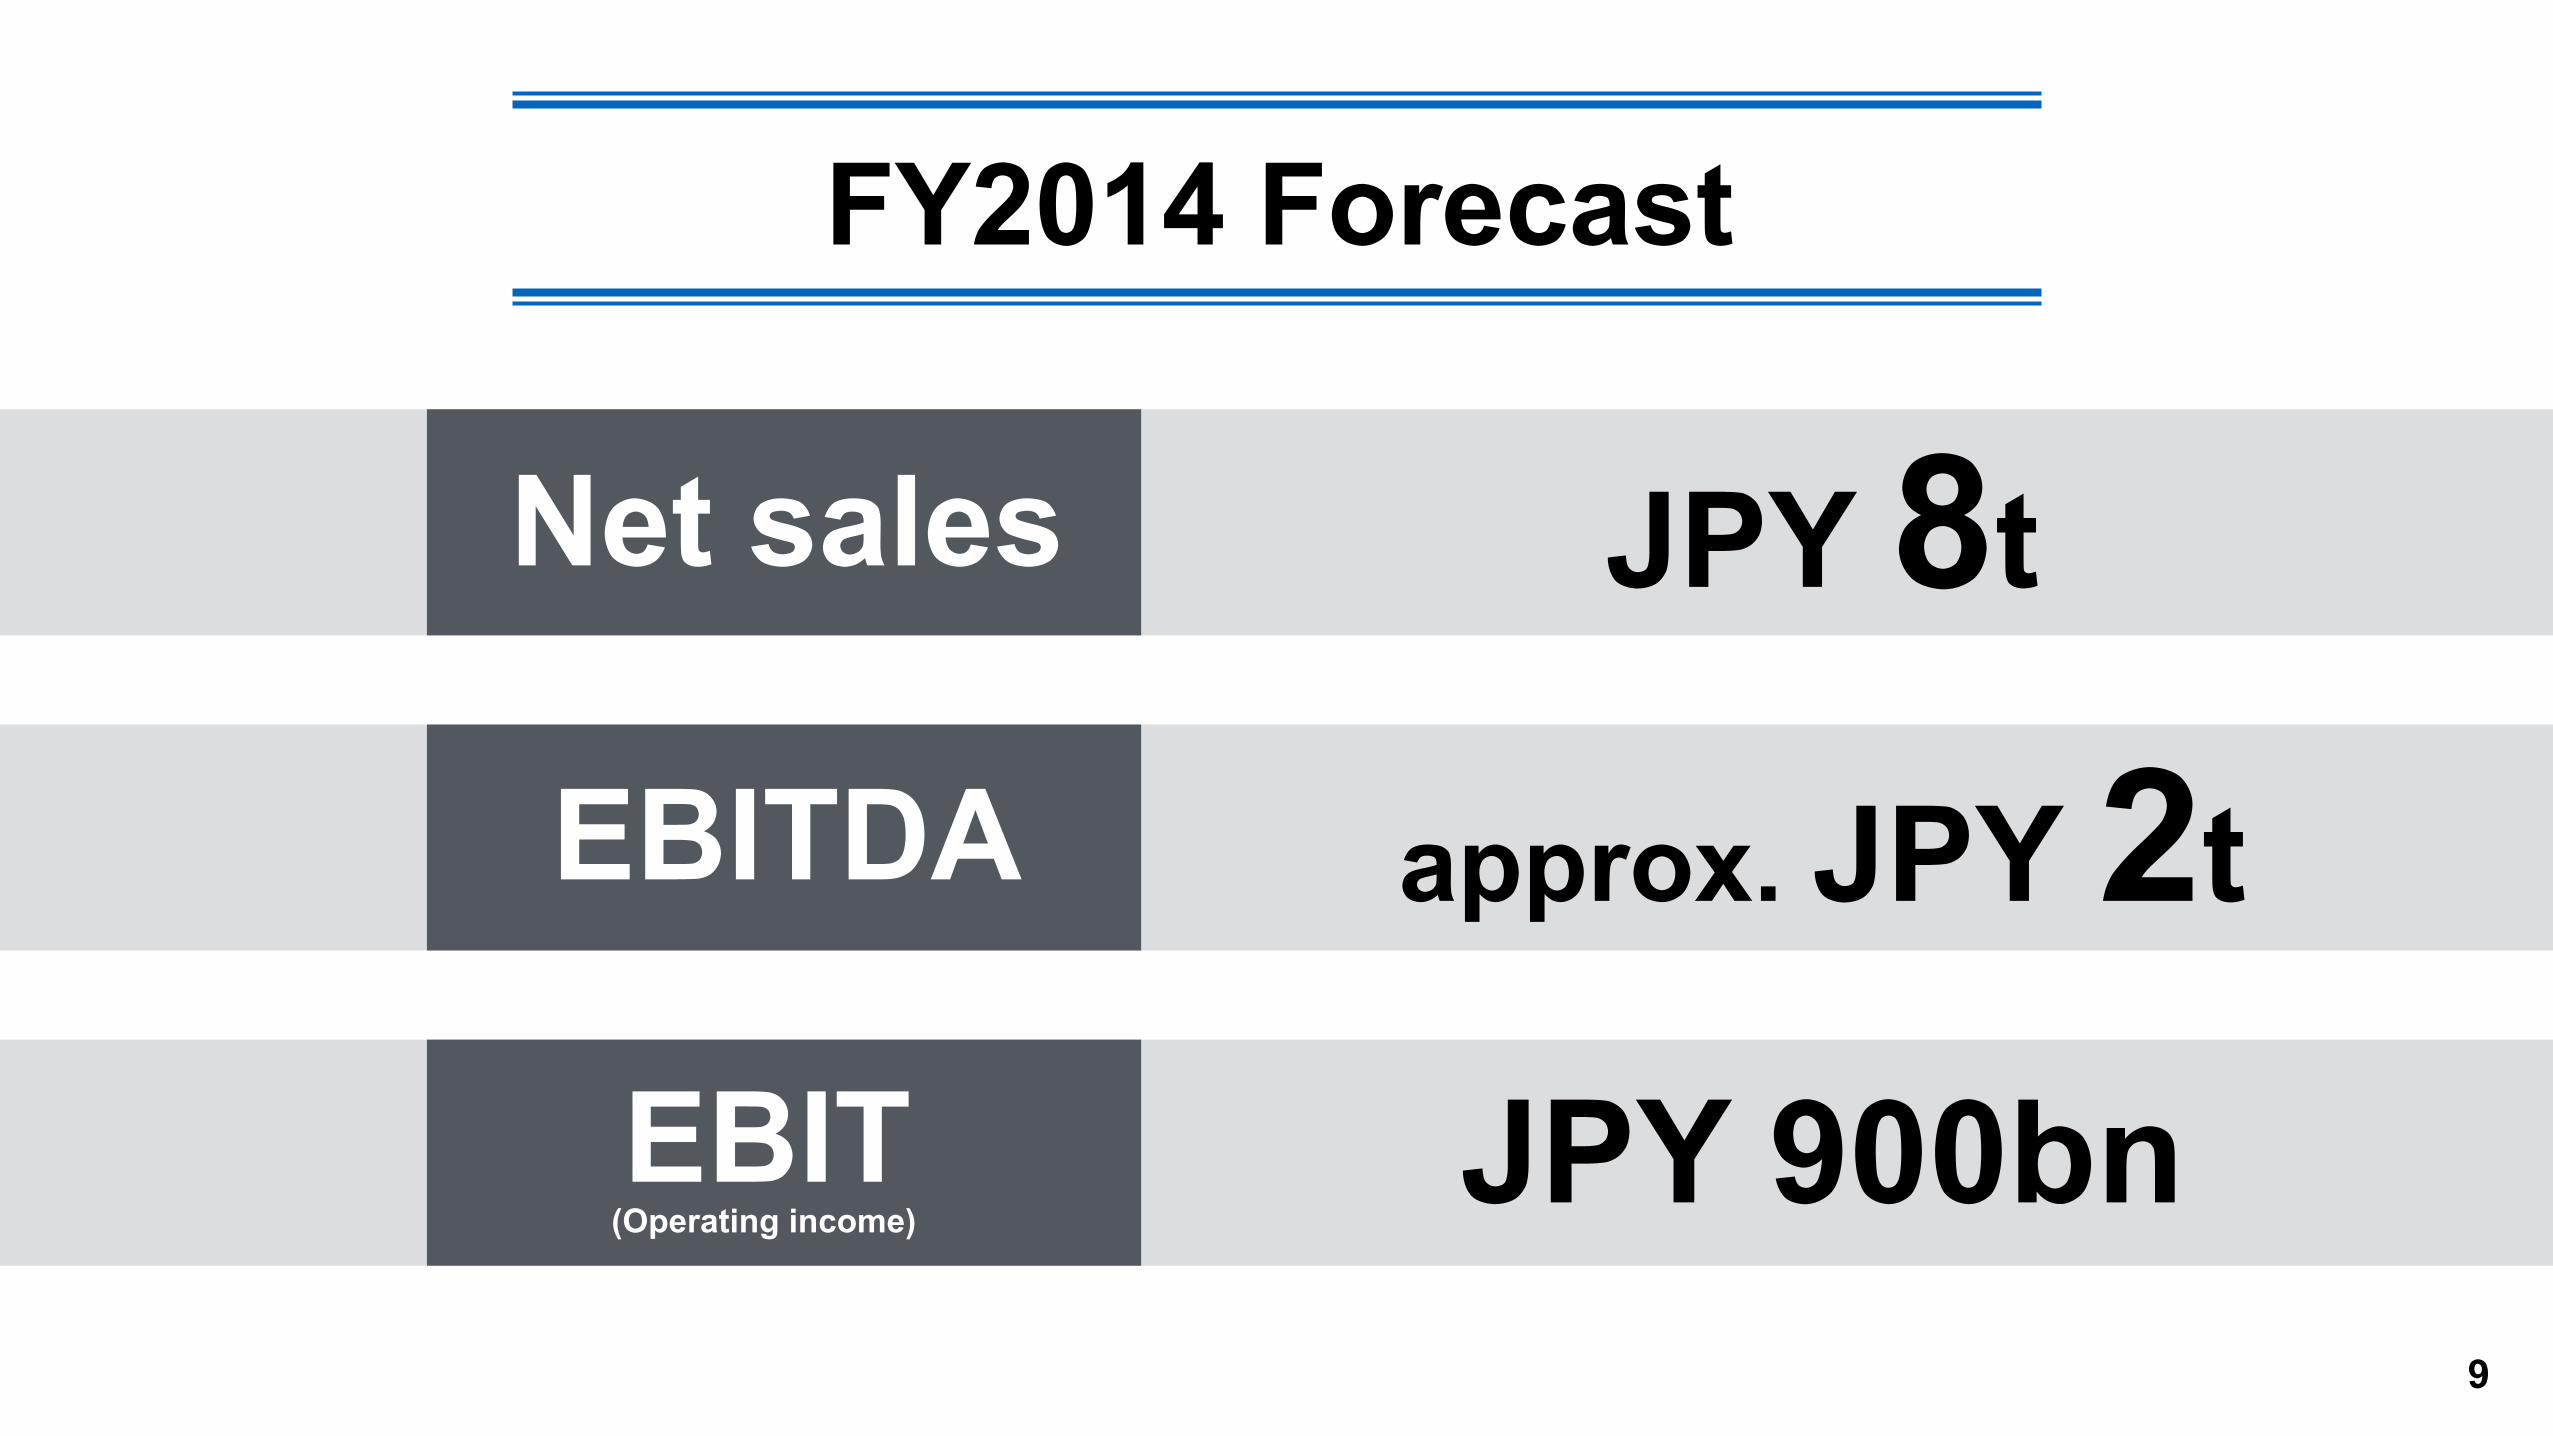
FY2014 Forecast
Net sales
EBITDA
EBIT(Operating income)
JPY 8t
approx. JPY 2t
JPY 900bn
10
SoftBank Business Domains
Communications Internet
11
Communications Internet
SoftBank Business Domains
2003 ’04 ’05 ’06 ’07 ’08 ’09 ’10 ’11 ’12 ’13 ’14
Japanese-GAAP IFRSsQ1-3 Q1-3 Q1-3 Q1-3 Q1-3 Q1-3 Q1-3 Q1-3 Q1-3 Q1-3 Q1-3
(FY)
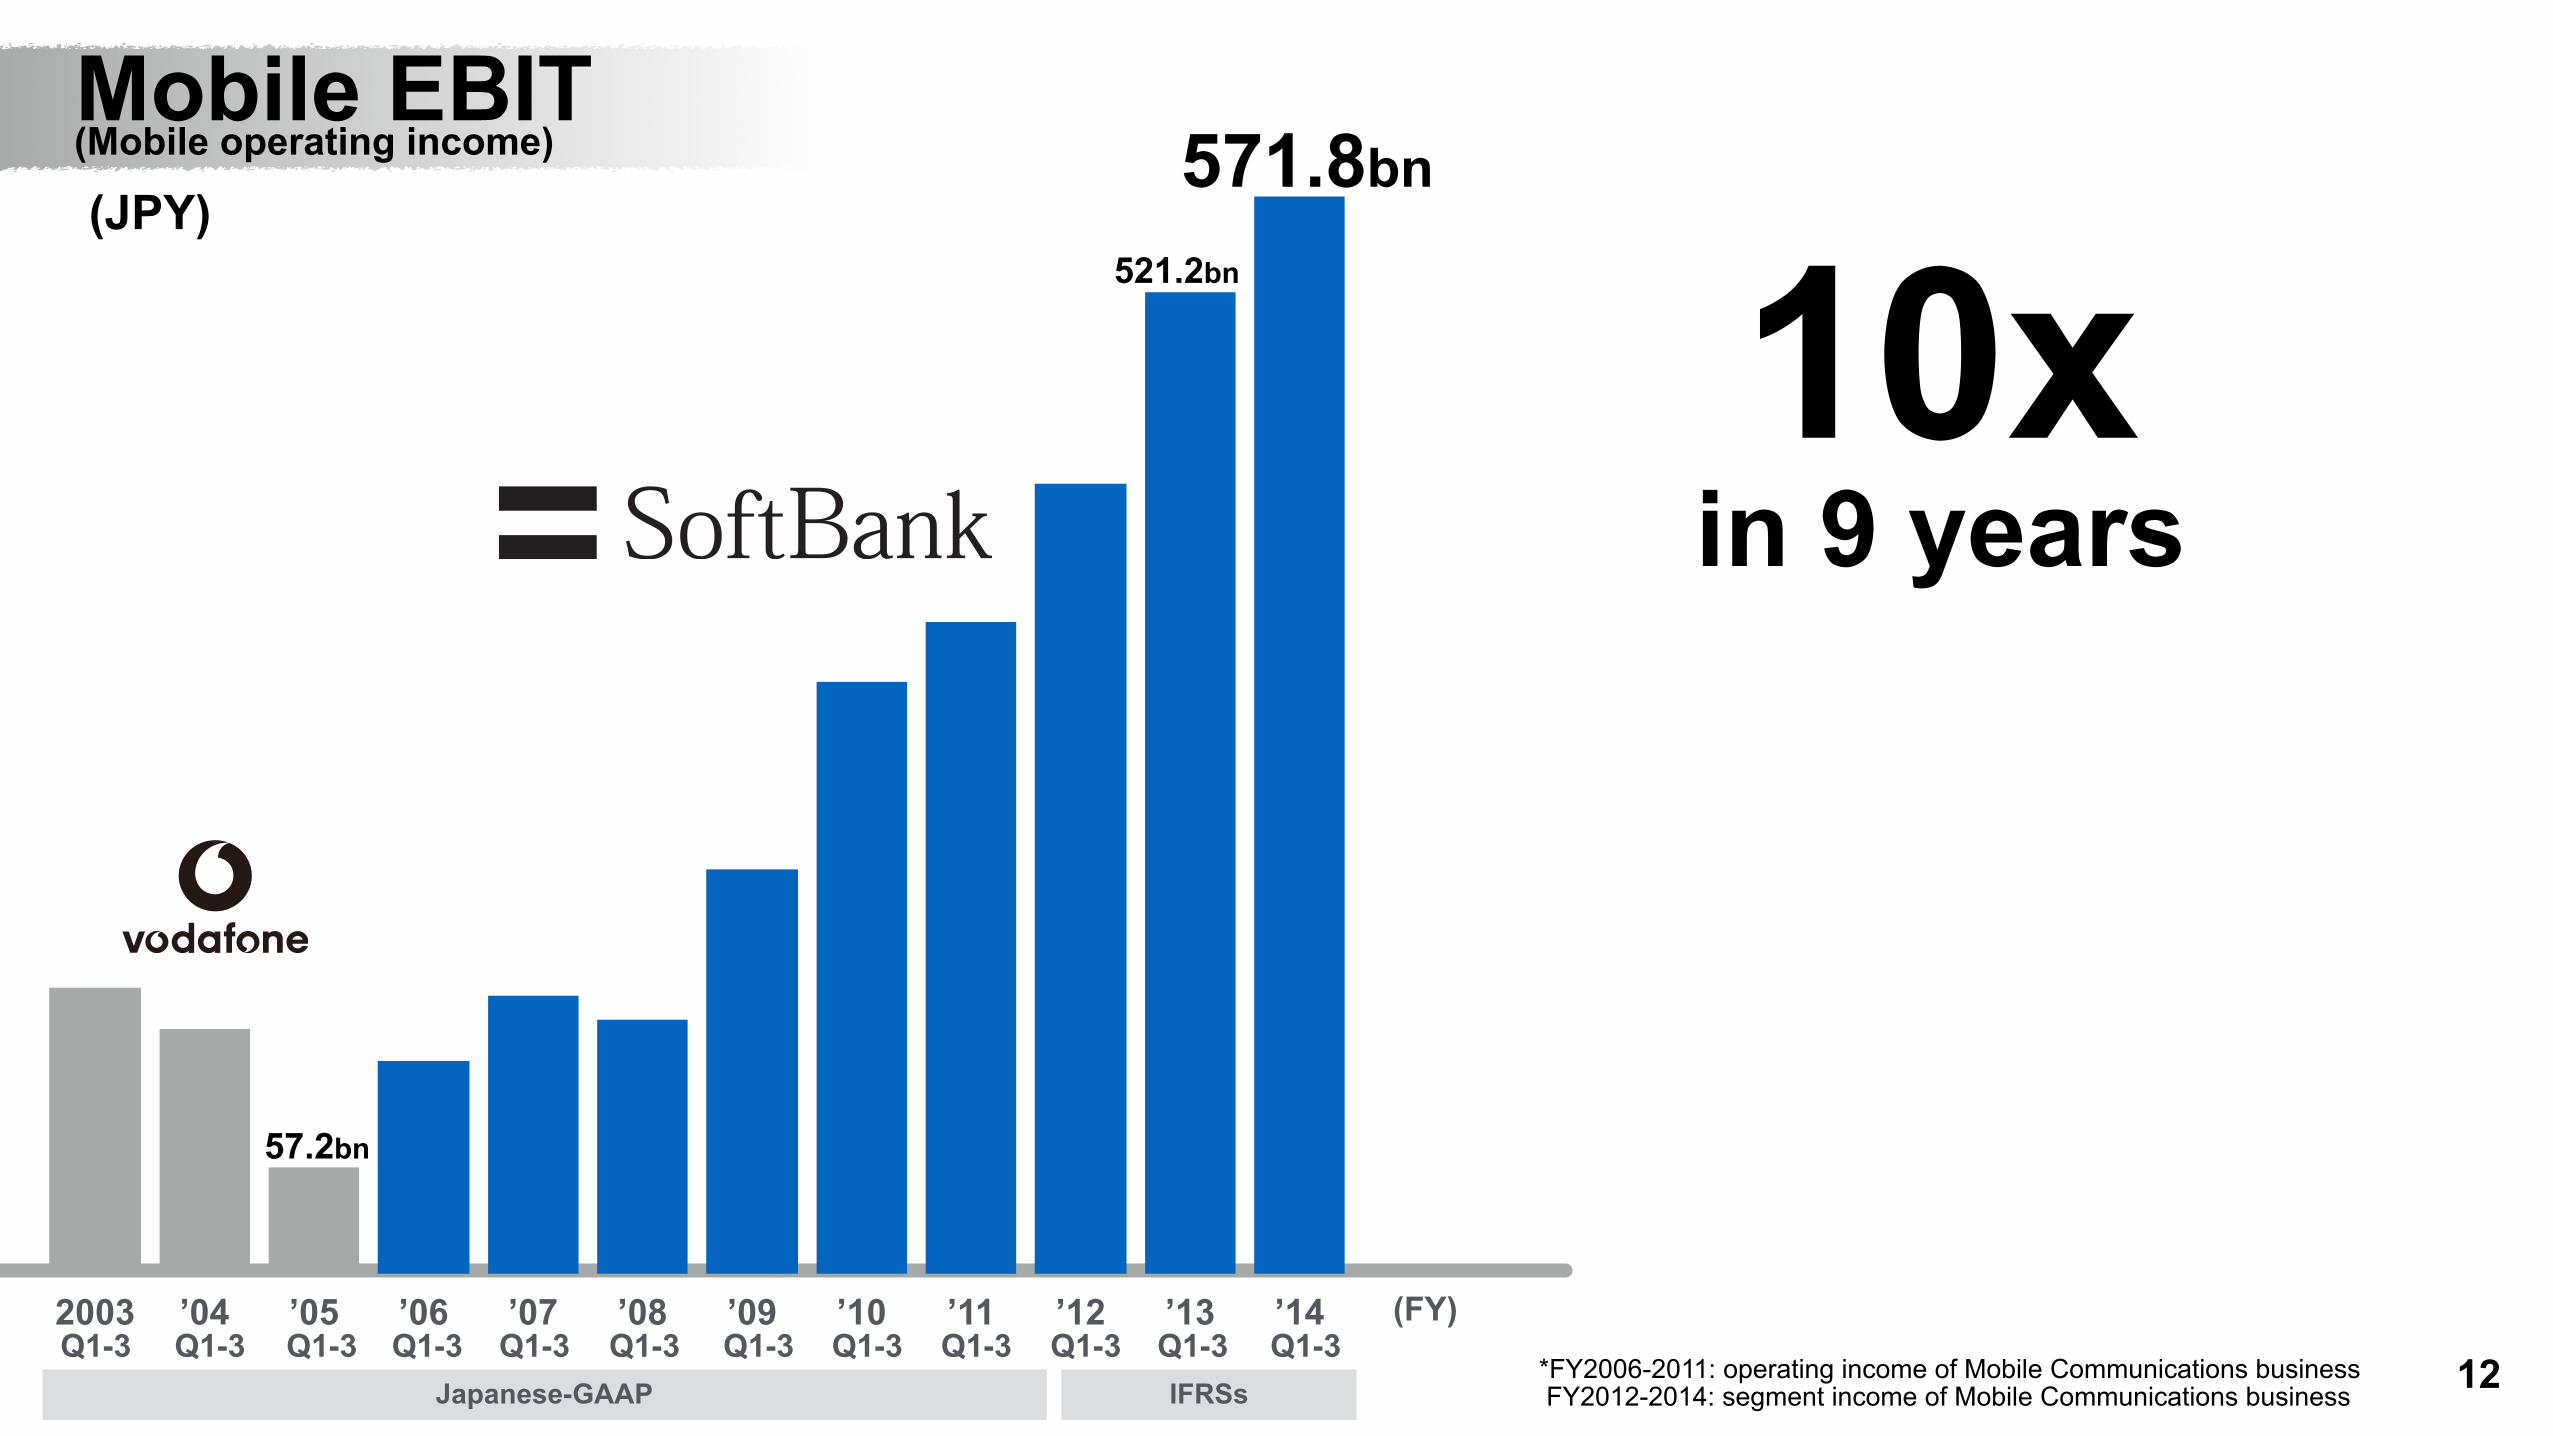
521.2bn
571.8bn
*FY2006-2011: operating income of Mobile Communications business FY2012-2014: segment income of Mobile Communications business
12Q1-3
(JPY)
10x in 9 years
Mobile EBIT(Mobile operating income)
57.2bn
13
95%
96%
97%
98%
99%
2013 Jan. 13
2015 Feb. 1
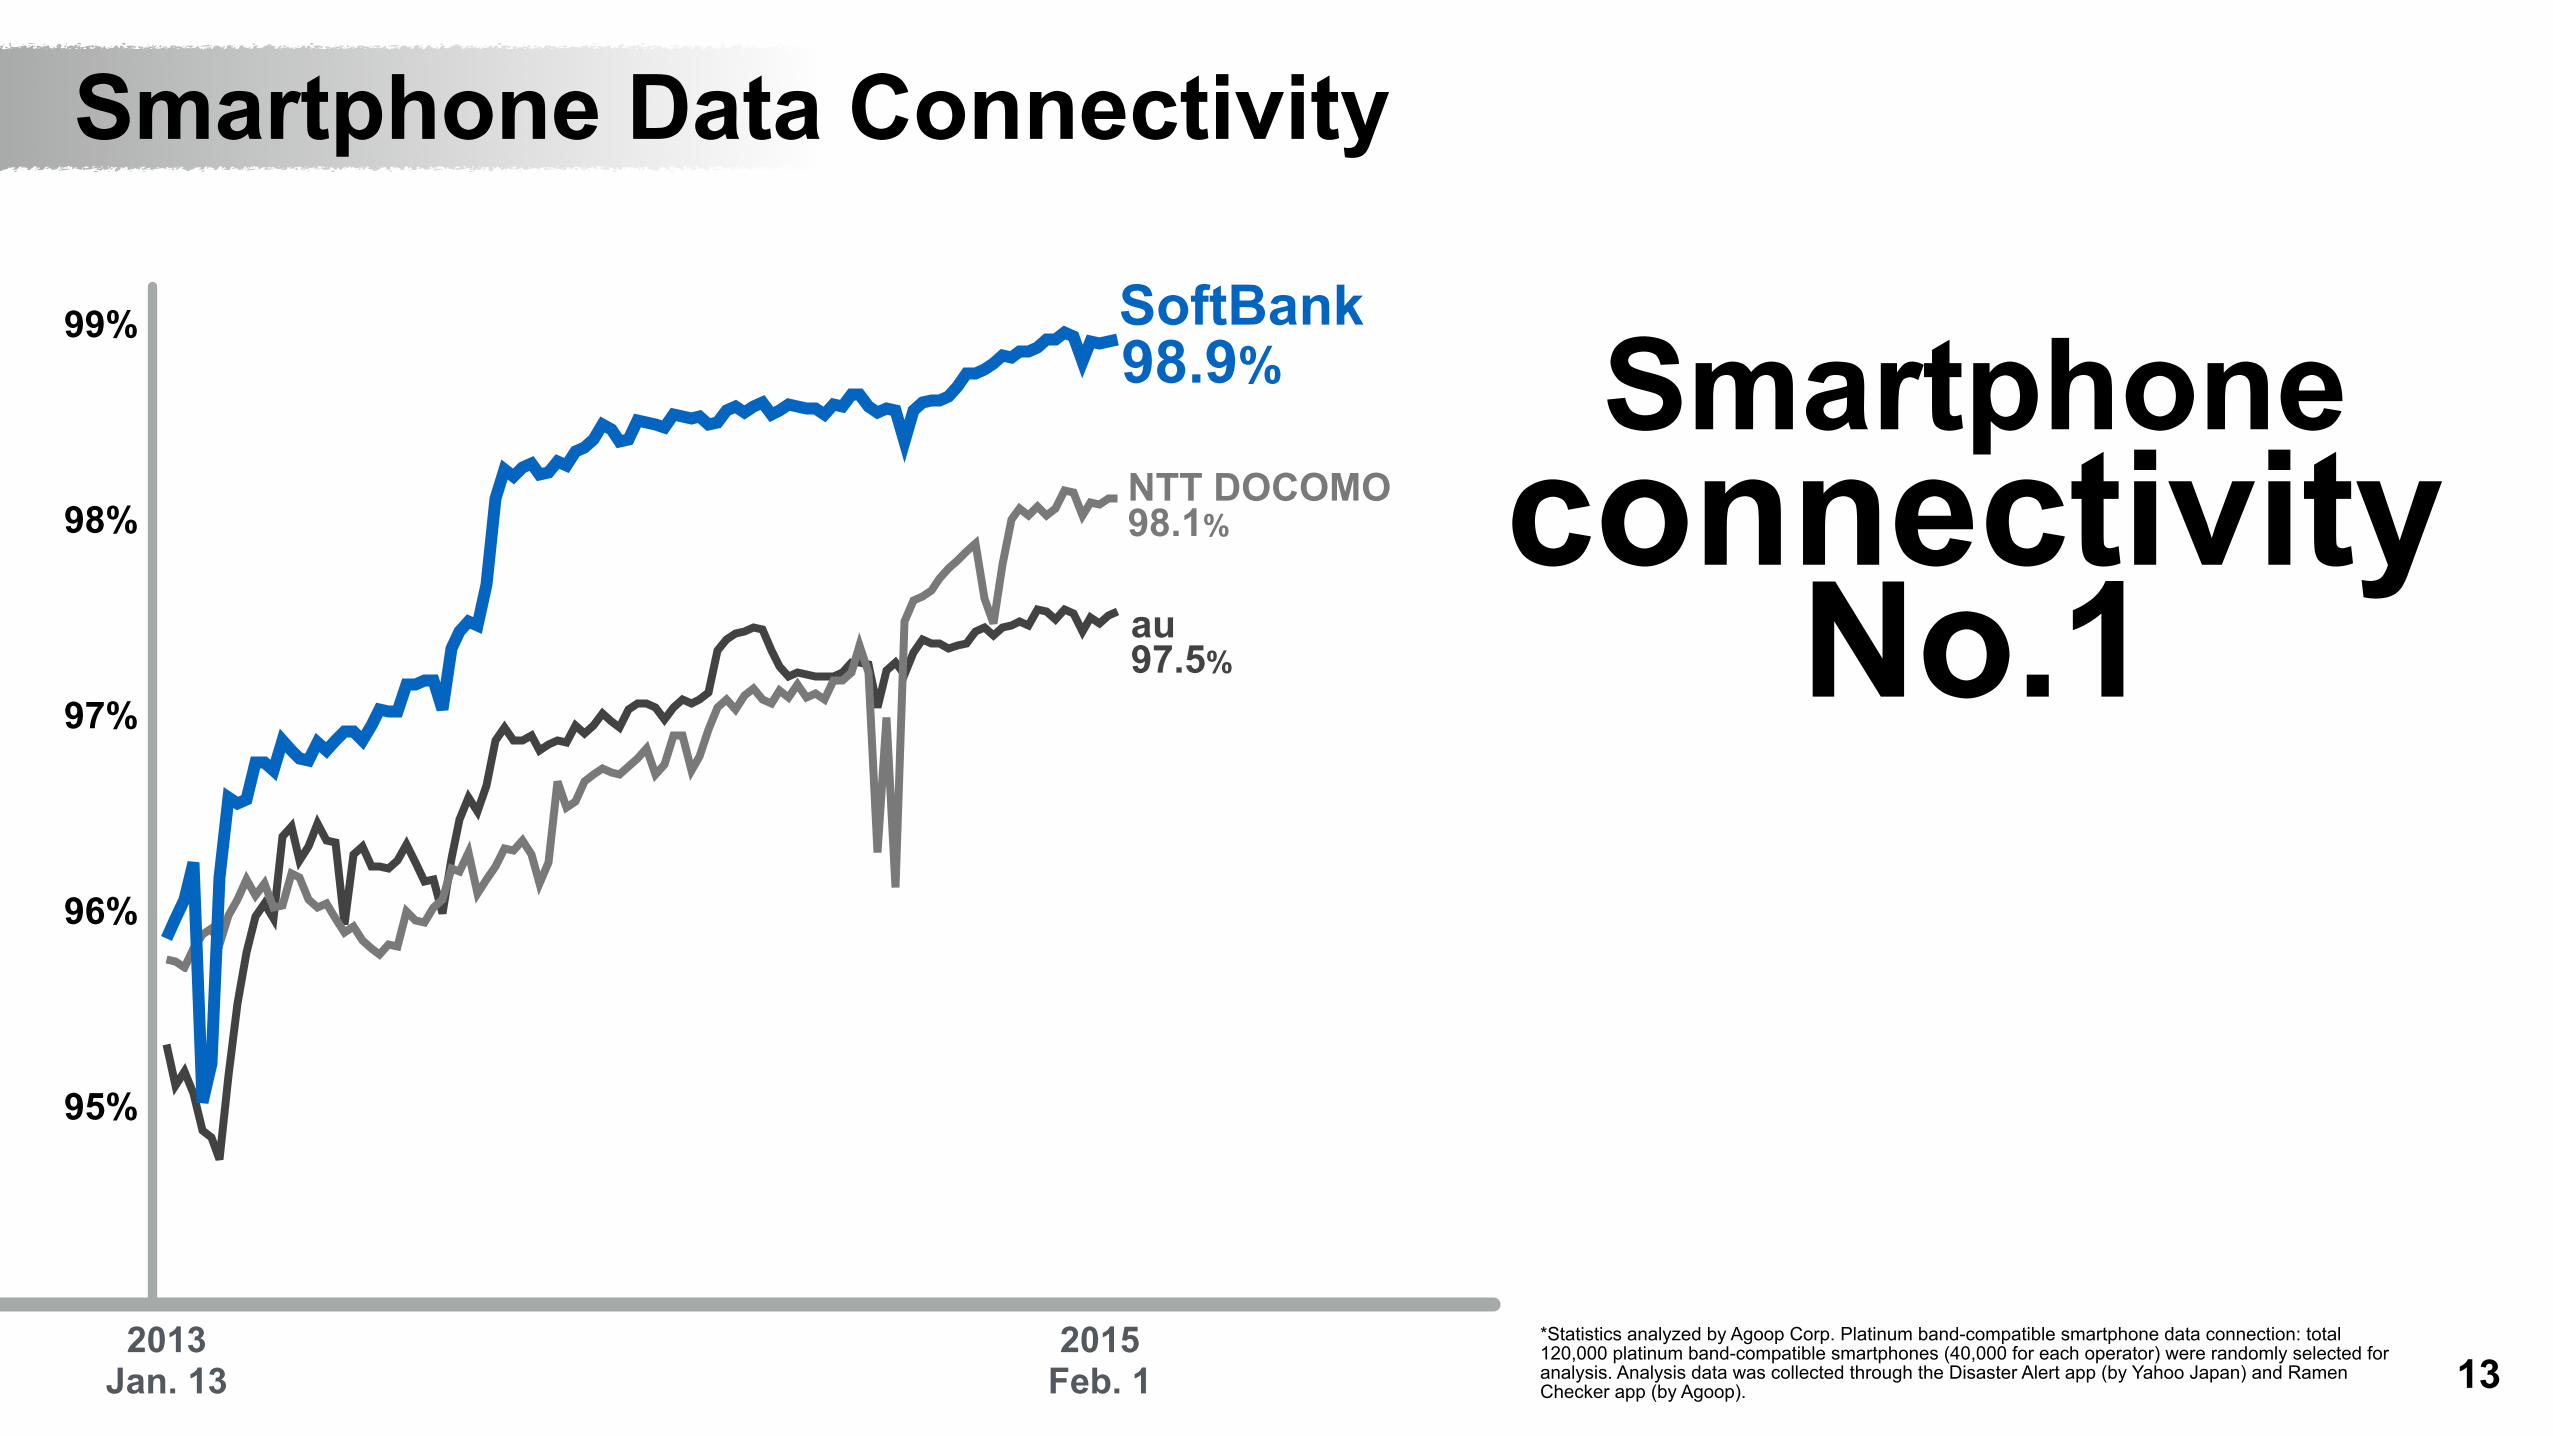
Smartphone Data Connectivity
Smartphone connectivity
No.1
SoftBank
au 97.5%
NTT DOCOMO 98.1%
98.9%
*Statistics analyzed by Agoop Corp. Platinum band-compatible smartphone data connection: total 120,000 platinum band-compatible smartphones (40,000 for each operator) were randomly selected for analysis. Analysis data was collected through the Disaster Alert app (by Yahoo Japan) and Ramen Checker app (by Agoop).
14
37.5 Mbps
33.1 Mbps
28.0 Mbps
SoftBank
au
NTT DOCOMO
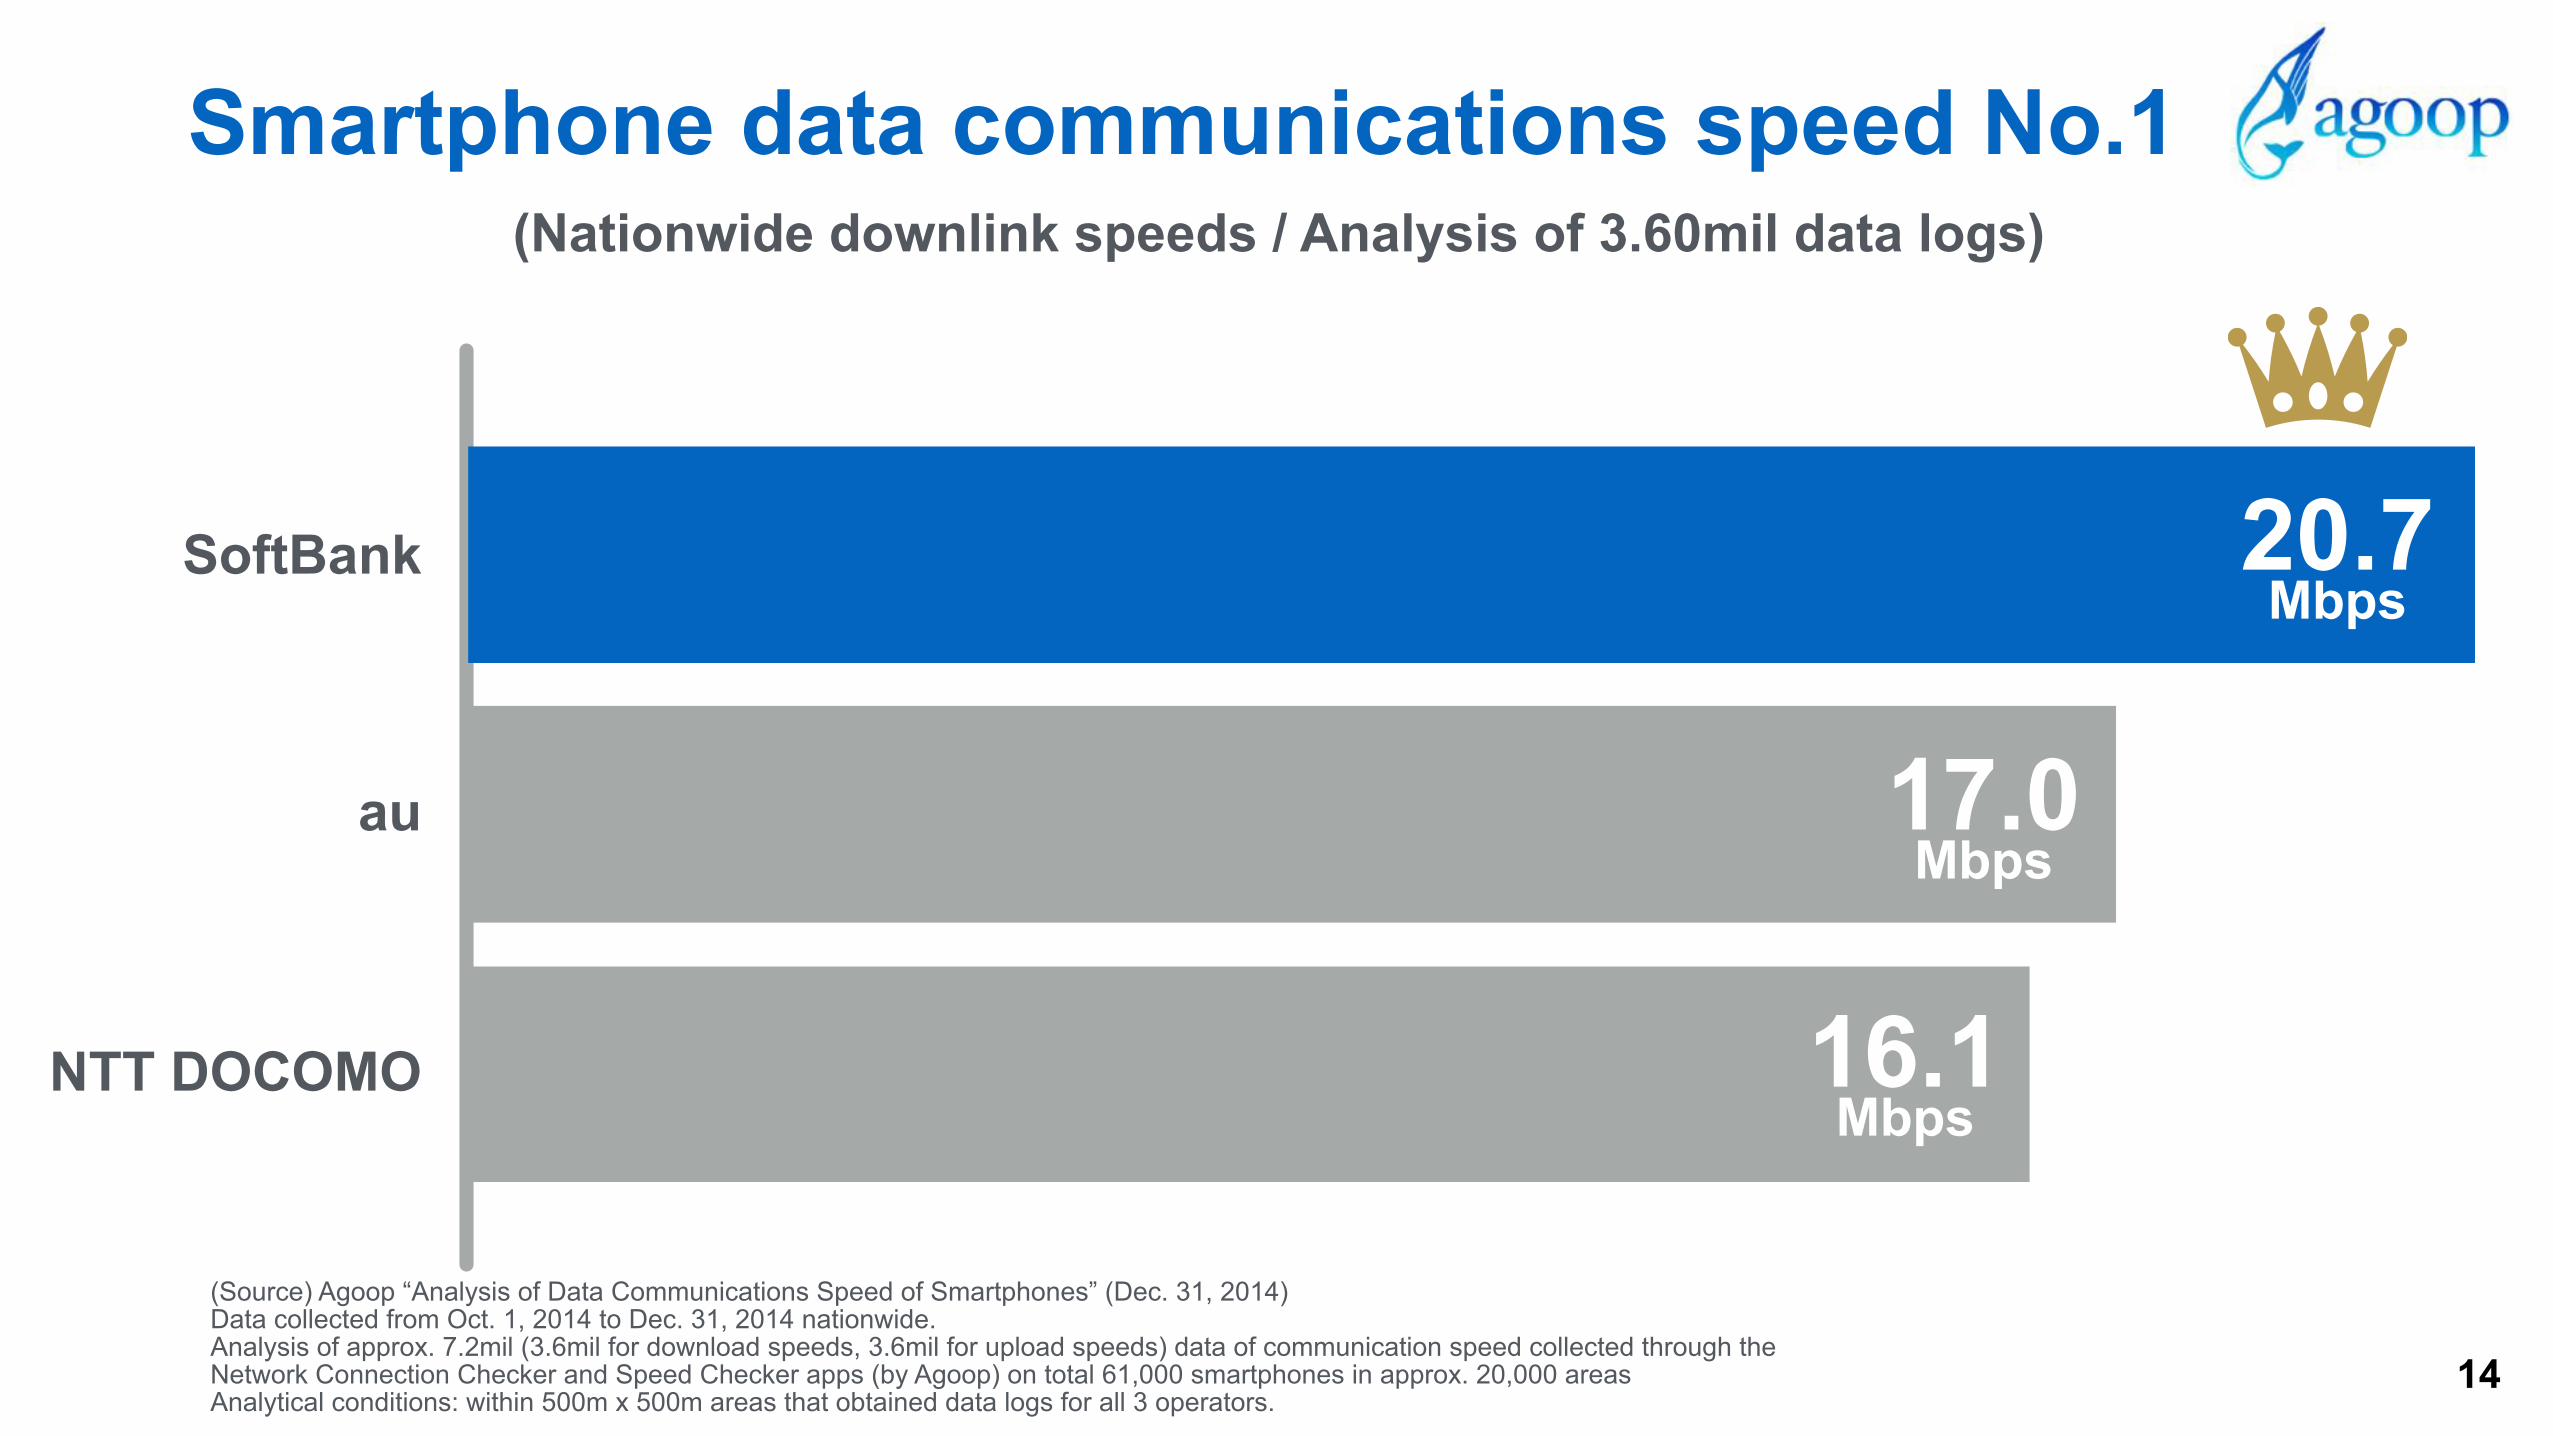
20.7 Mbps
Smartphone data communications speed No.1
(Source) Agoop “Analysis of Data Communications Speed of Smartphones” (Dec. 31, 2014) Data collected from Oct. 1, 2014 to Dec. 31, 2014 nationwide. Analysis of approx. 7.2mil (3.6mil for download speeds, 3.6mil for upload speeds) data of communication speed collected through the Network Connection Checker and Speed Checker apps (by Agoop) on total 61,000 smartphones in approx. 20,000 areas Analytical conditions: within 500m x 500m areas that obtained data logs for all 3 operators.
(Nationwide downlink speeds / Analysis of 3.60mil data logs)
17.0 Mbps
16.1 Mbps

15
×
Jointly promote work style revolution
20,000+ iPads introduced
SB innovation know-how
*Actual number introduced throughout Mizuho Financial Group as of Dec. 2014.
16
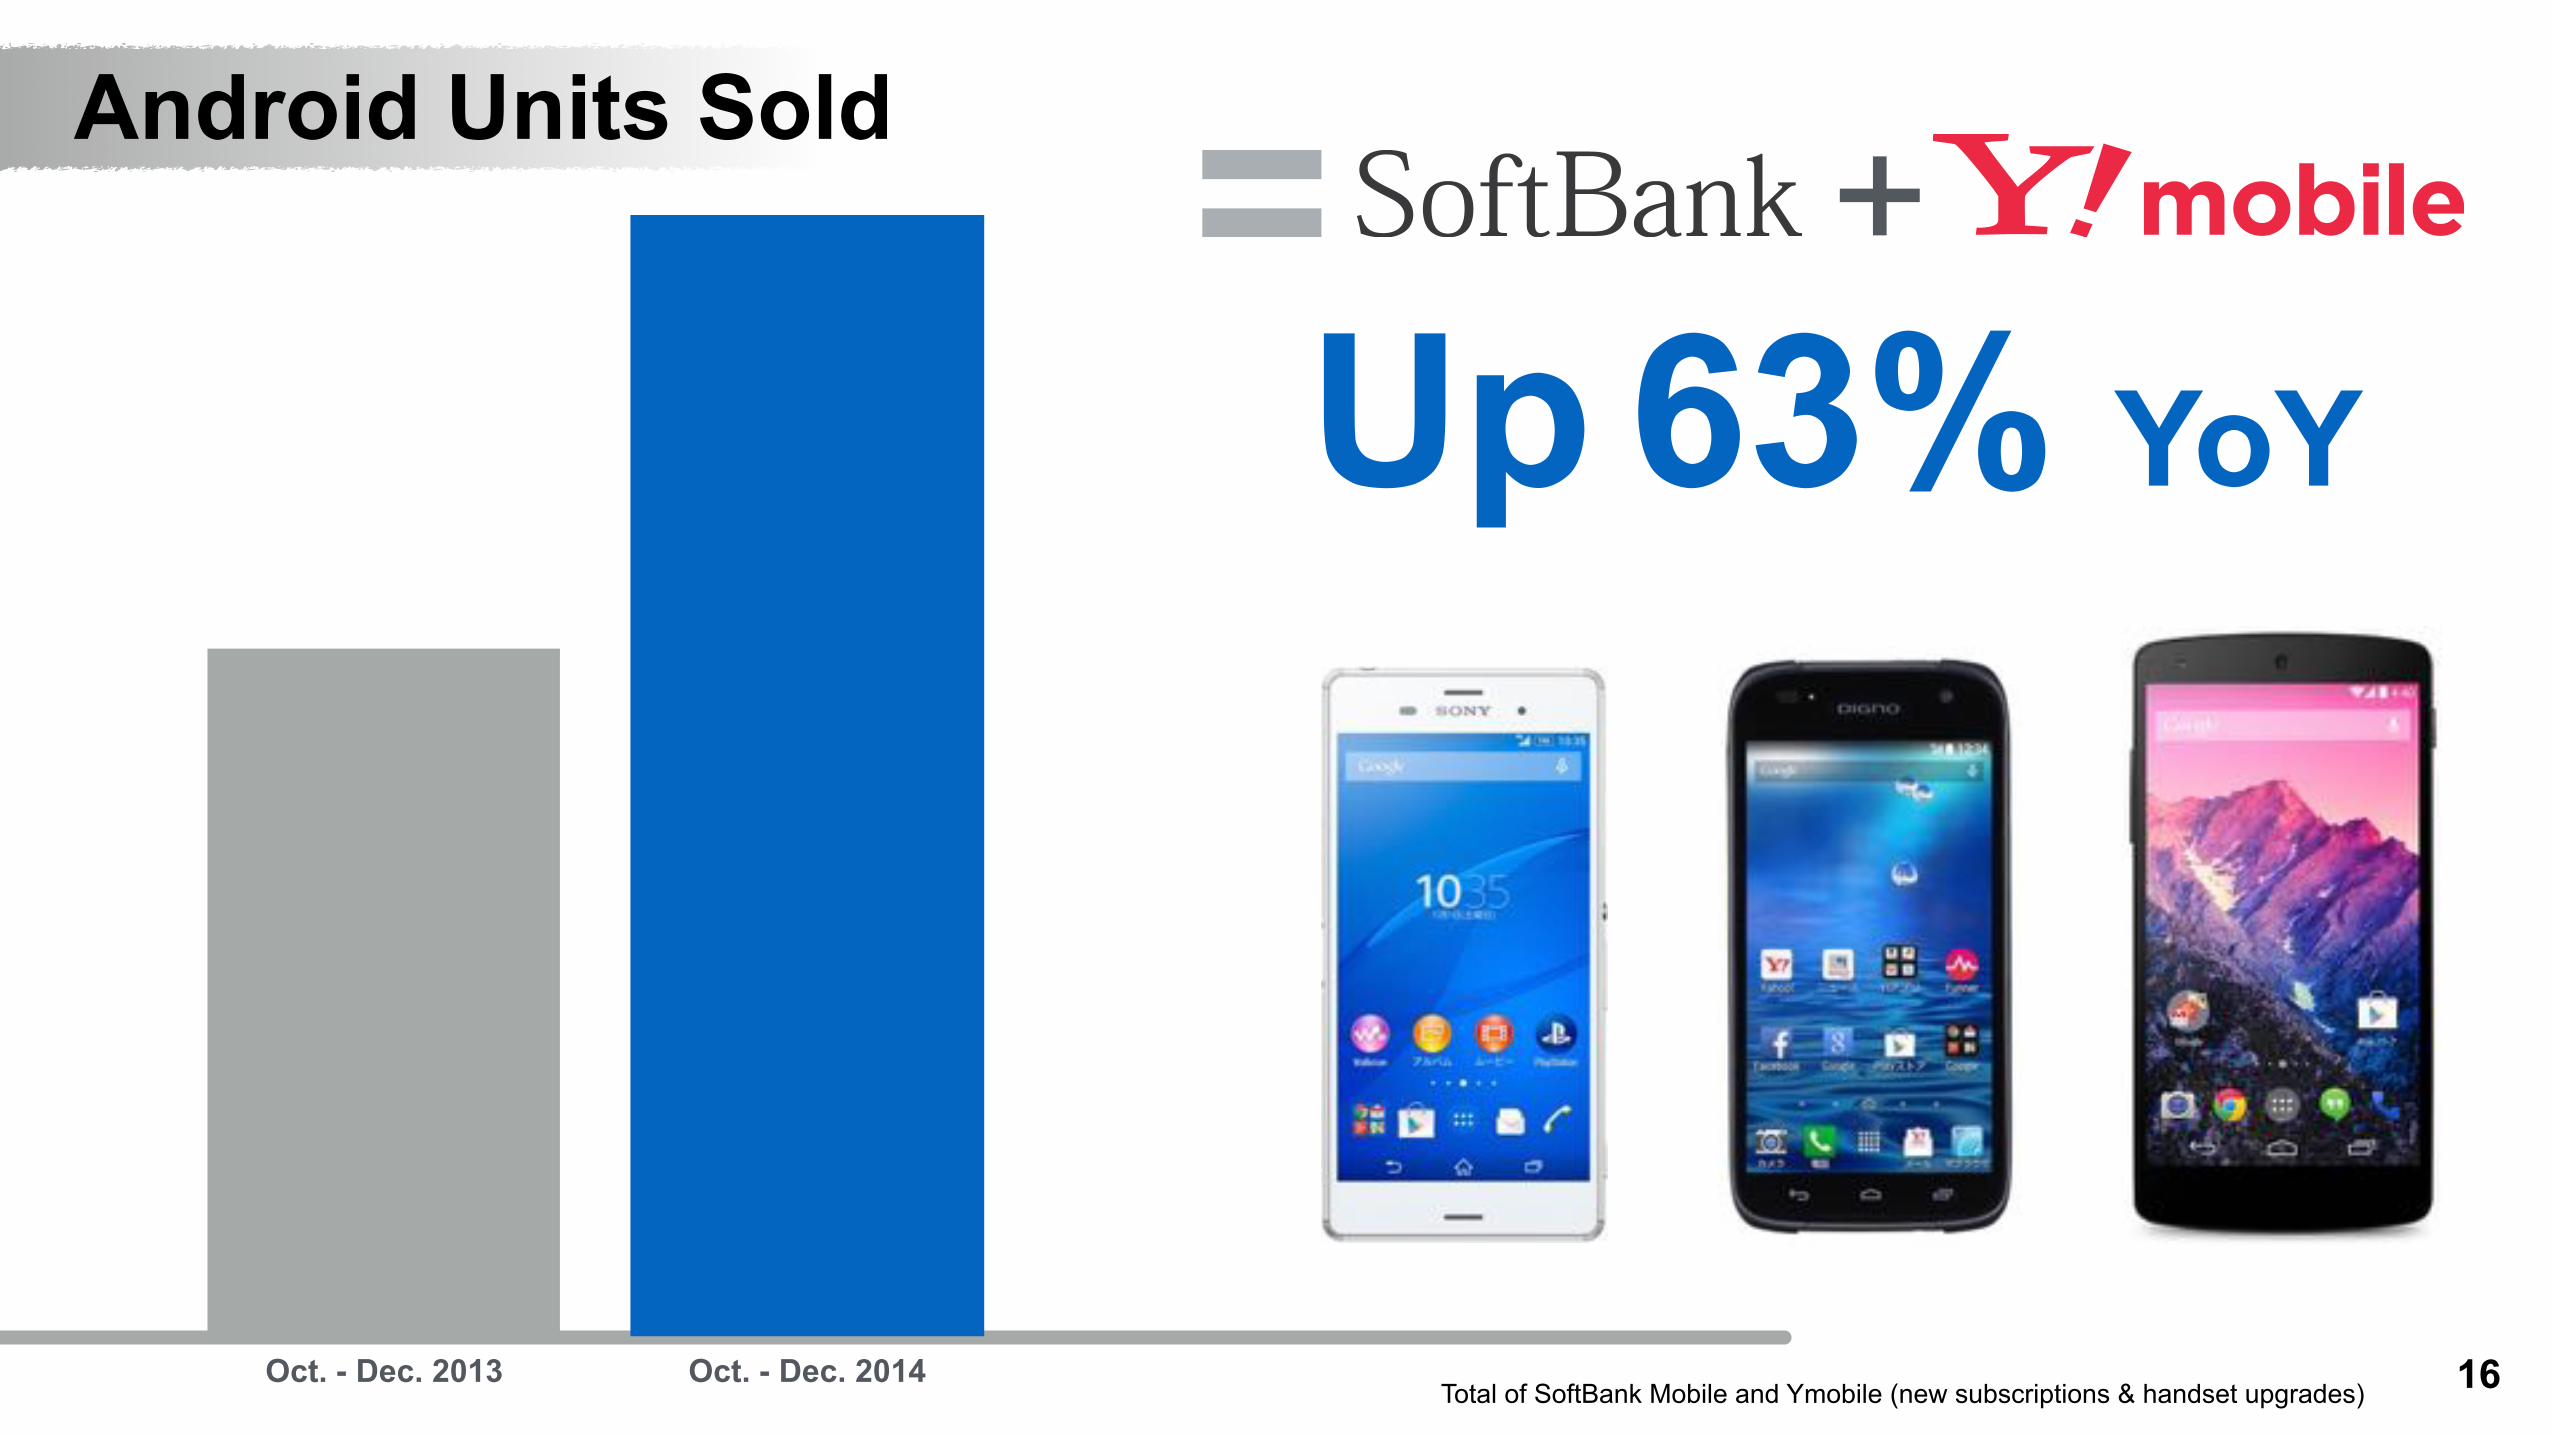
Android Units Sold
Up 63% YoY
Total of SoftBank Mobile and Ymobile (new subscriptions & handset upgrades)
+
Oct. - Dec. 2013 Oct. - Dec. 2014
17
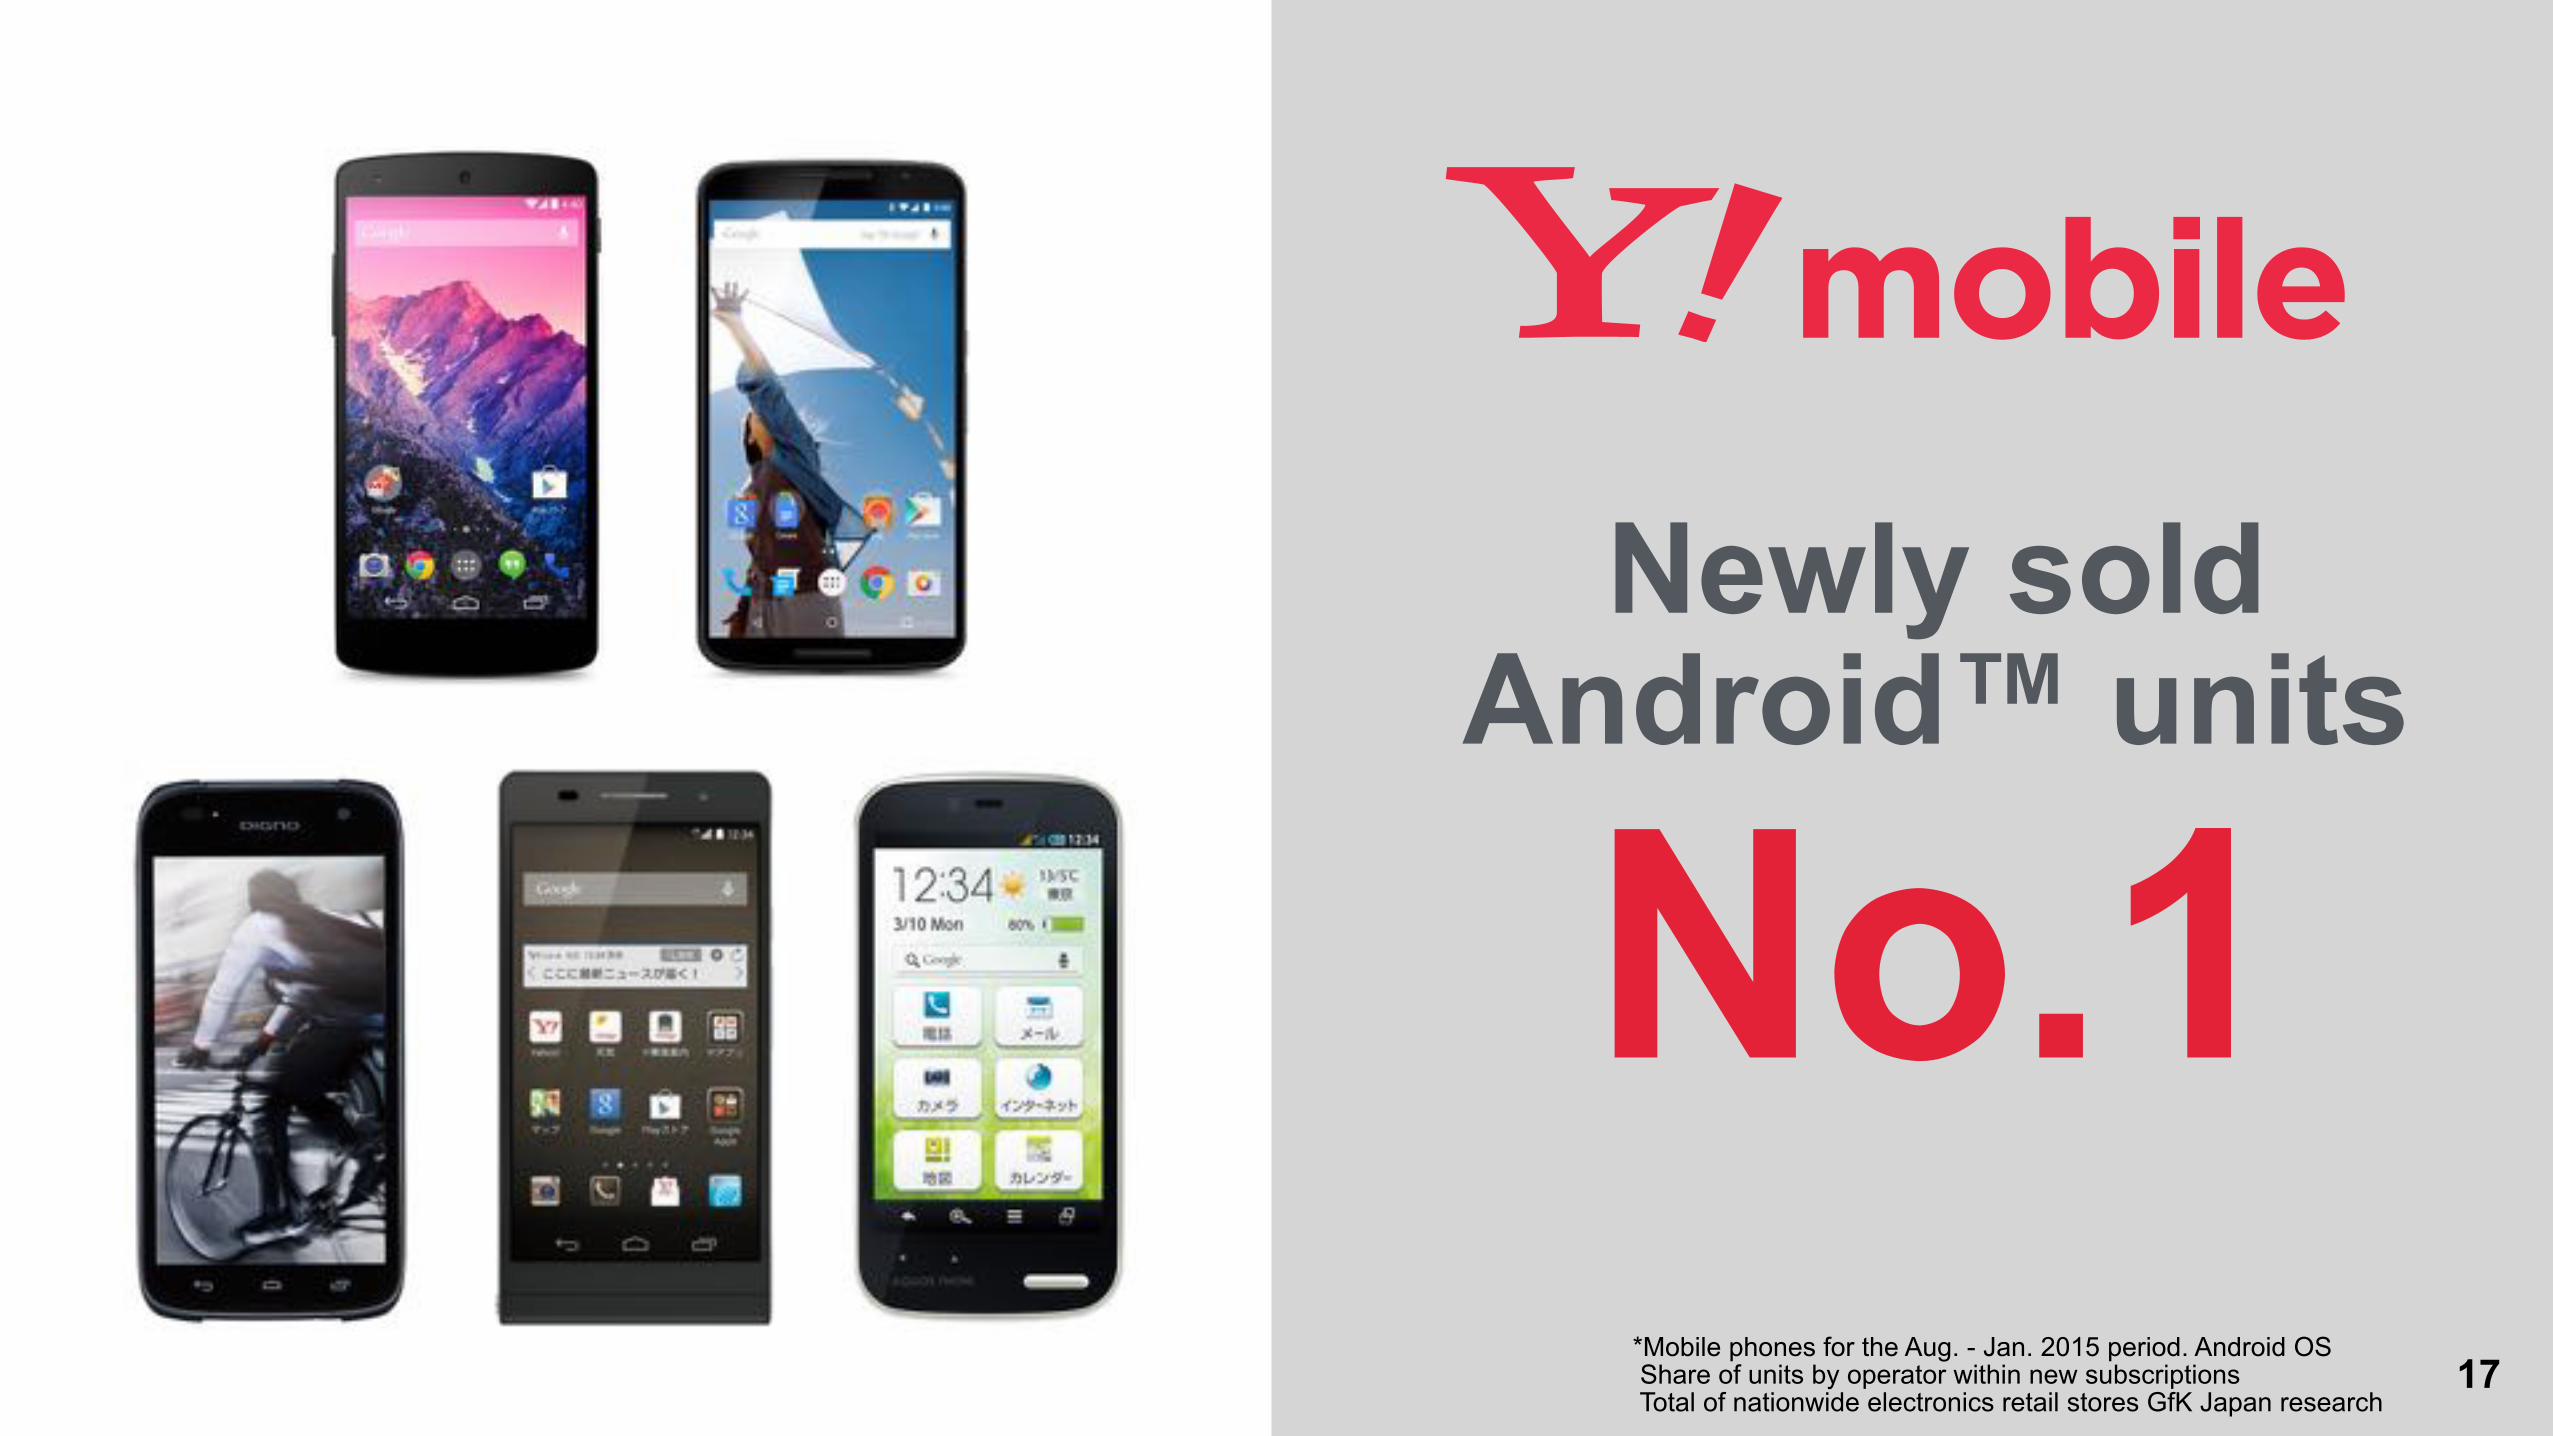
No.1*Mobile phones for the Aug. - Jan. 2015 period. Android OS Share of units by operator within new subscriptions Total of nationwide electronics retail stores GfK Japan research
Newly sold Android™ units

Discount on mobile monthly usage charge when
combined with fixed-line
18
Smartphone & Internet Bundle Discount
Max. JPY 2,000 discount/line
*Applicable to customers subscribing to SoftBank mobile phones and fixed-line services designated by SoftBank who apply to Smartphone & Internet Bundle Discount. Cannot be combined with certain services. Refer to SoftBank Mobile’s website for details.
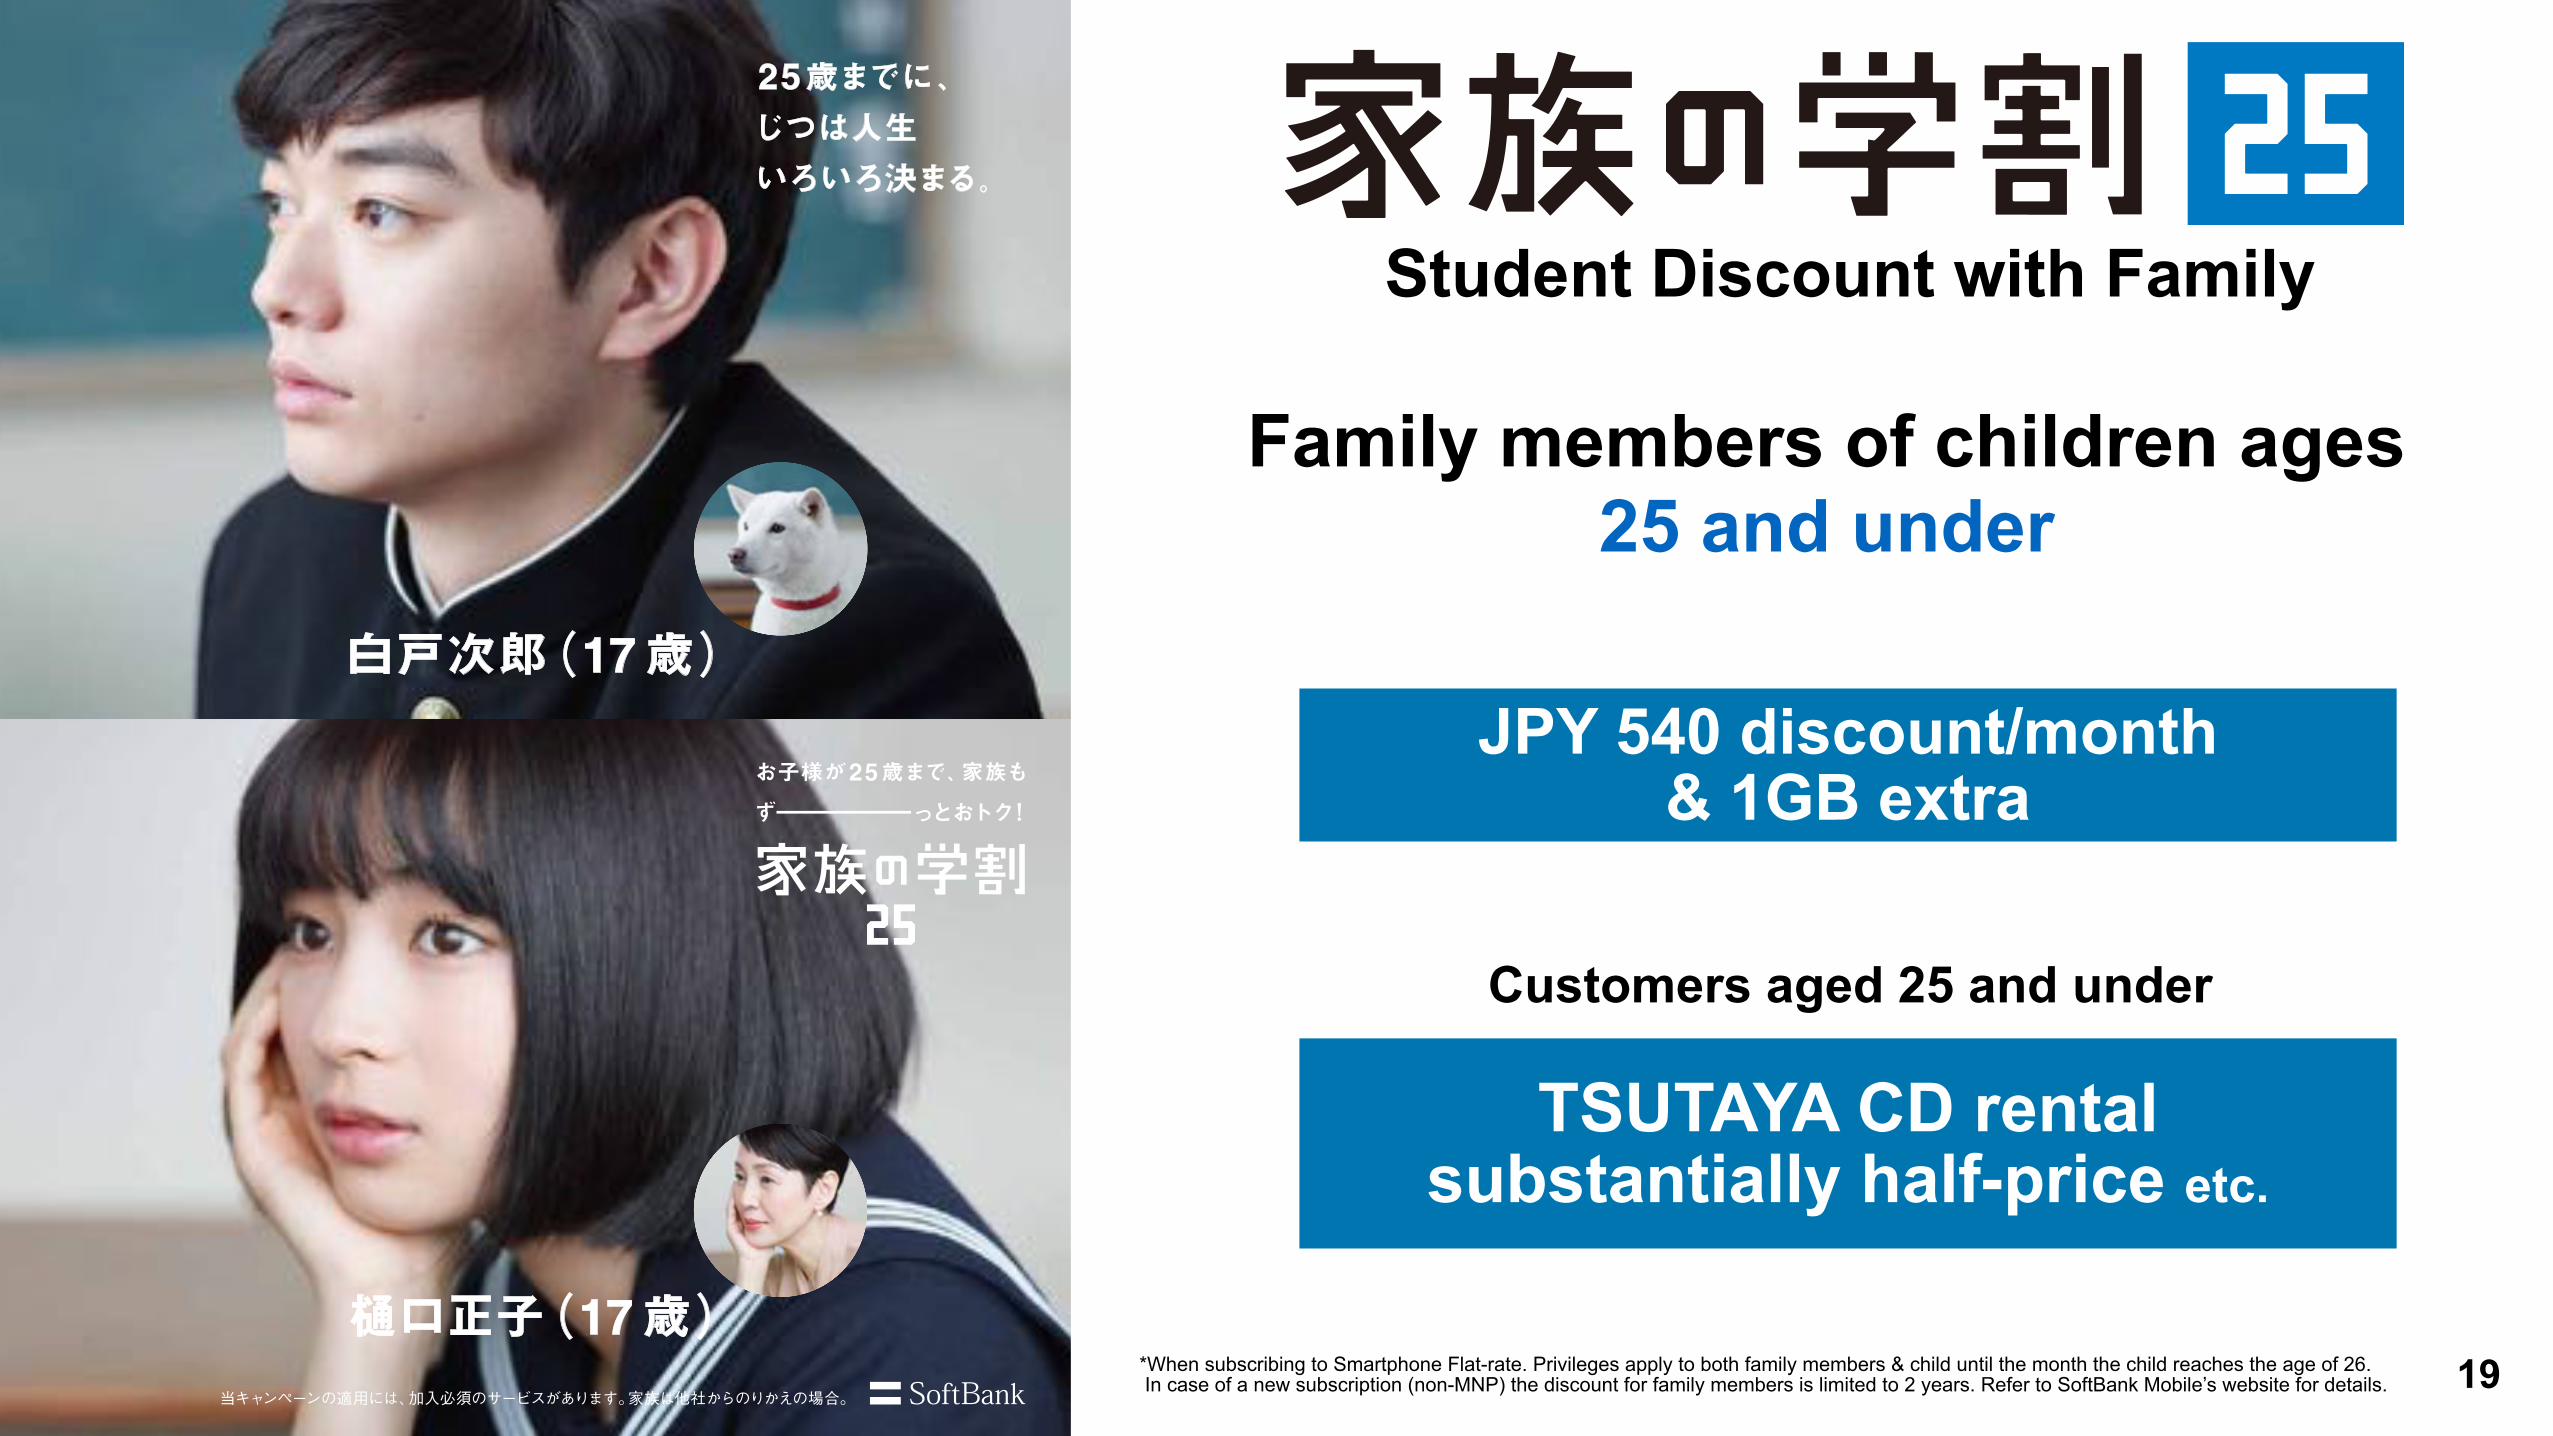
JPY 540 discount/month & 1GB extra
19
TSUTAYA CD rental substantially half-price etc.
Customers aged 25 and under
*When subscribing to Smartphone Flat-rate. Privileges apply to both family members & child until the month the child reaches the age of 26. In case of a new subscription (non-MNP) the discount for family members is limited to 2 years. Refer to SoftBank Mobile’s website for details.
Student Discount with Family
Family members of children ages 25 and under
20
×
Agreement on Development of Japanese-enabled IBM Watson
Jointly createthe cognitive technology market
IBM Japan and SoftBank Telecom announced the agreement “IBM, SoftBank Alliance to Bring Watson to All of Japan.”For details, please refer to IBM’s news release issued on Feb. 10, 2015.
2121
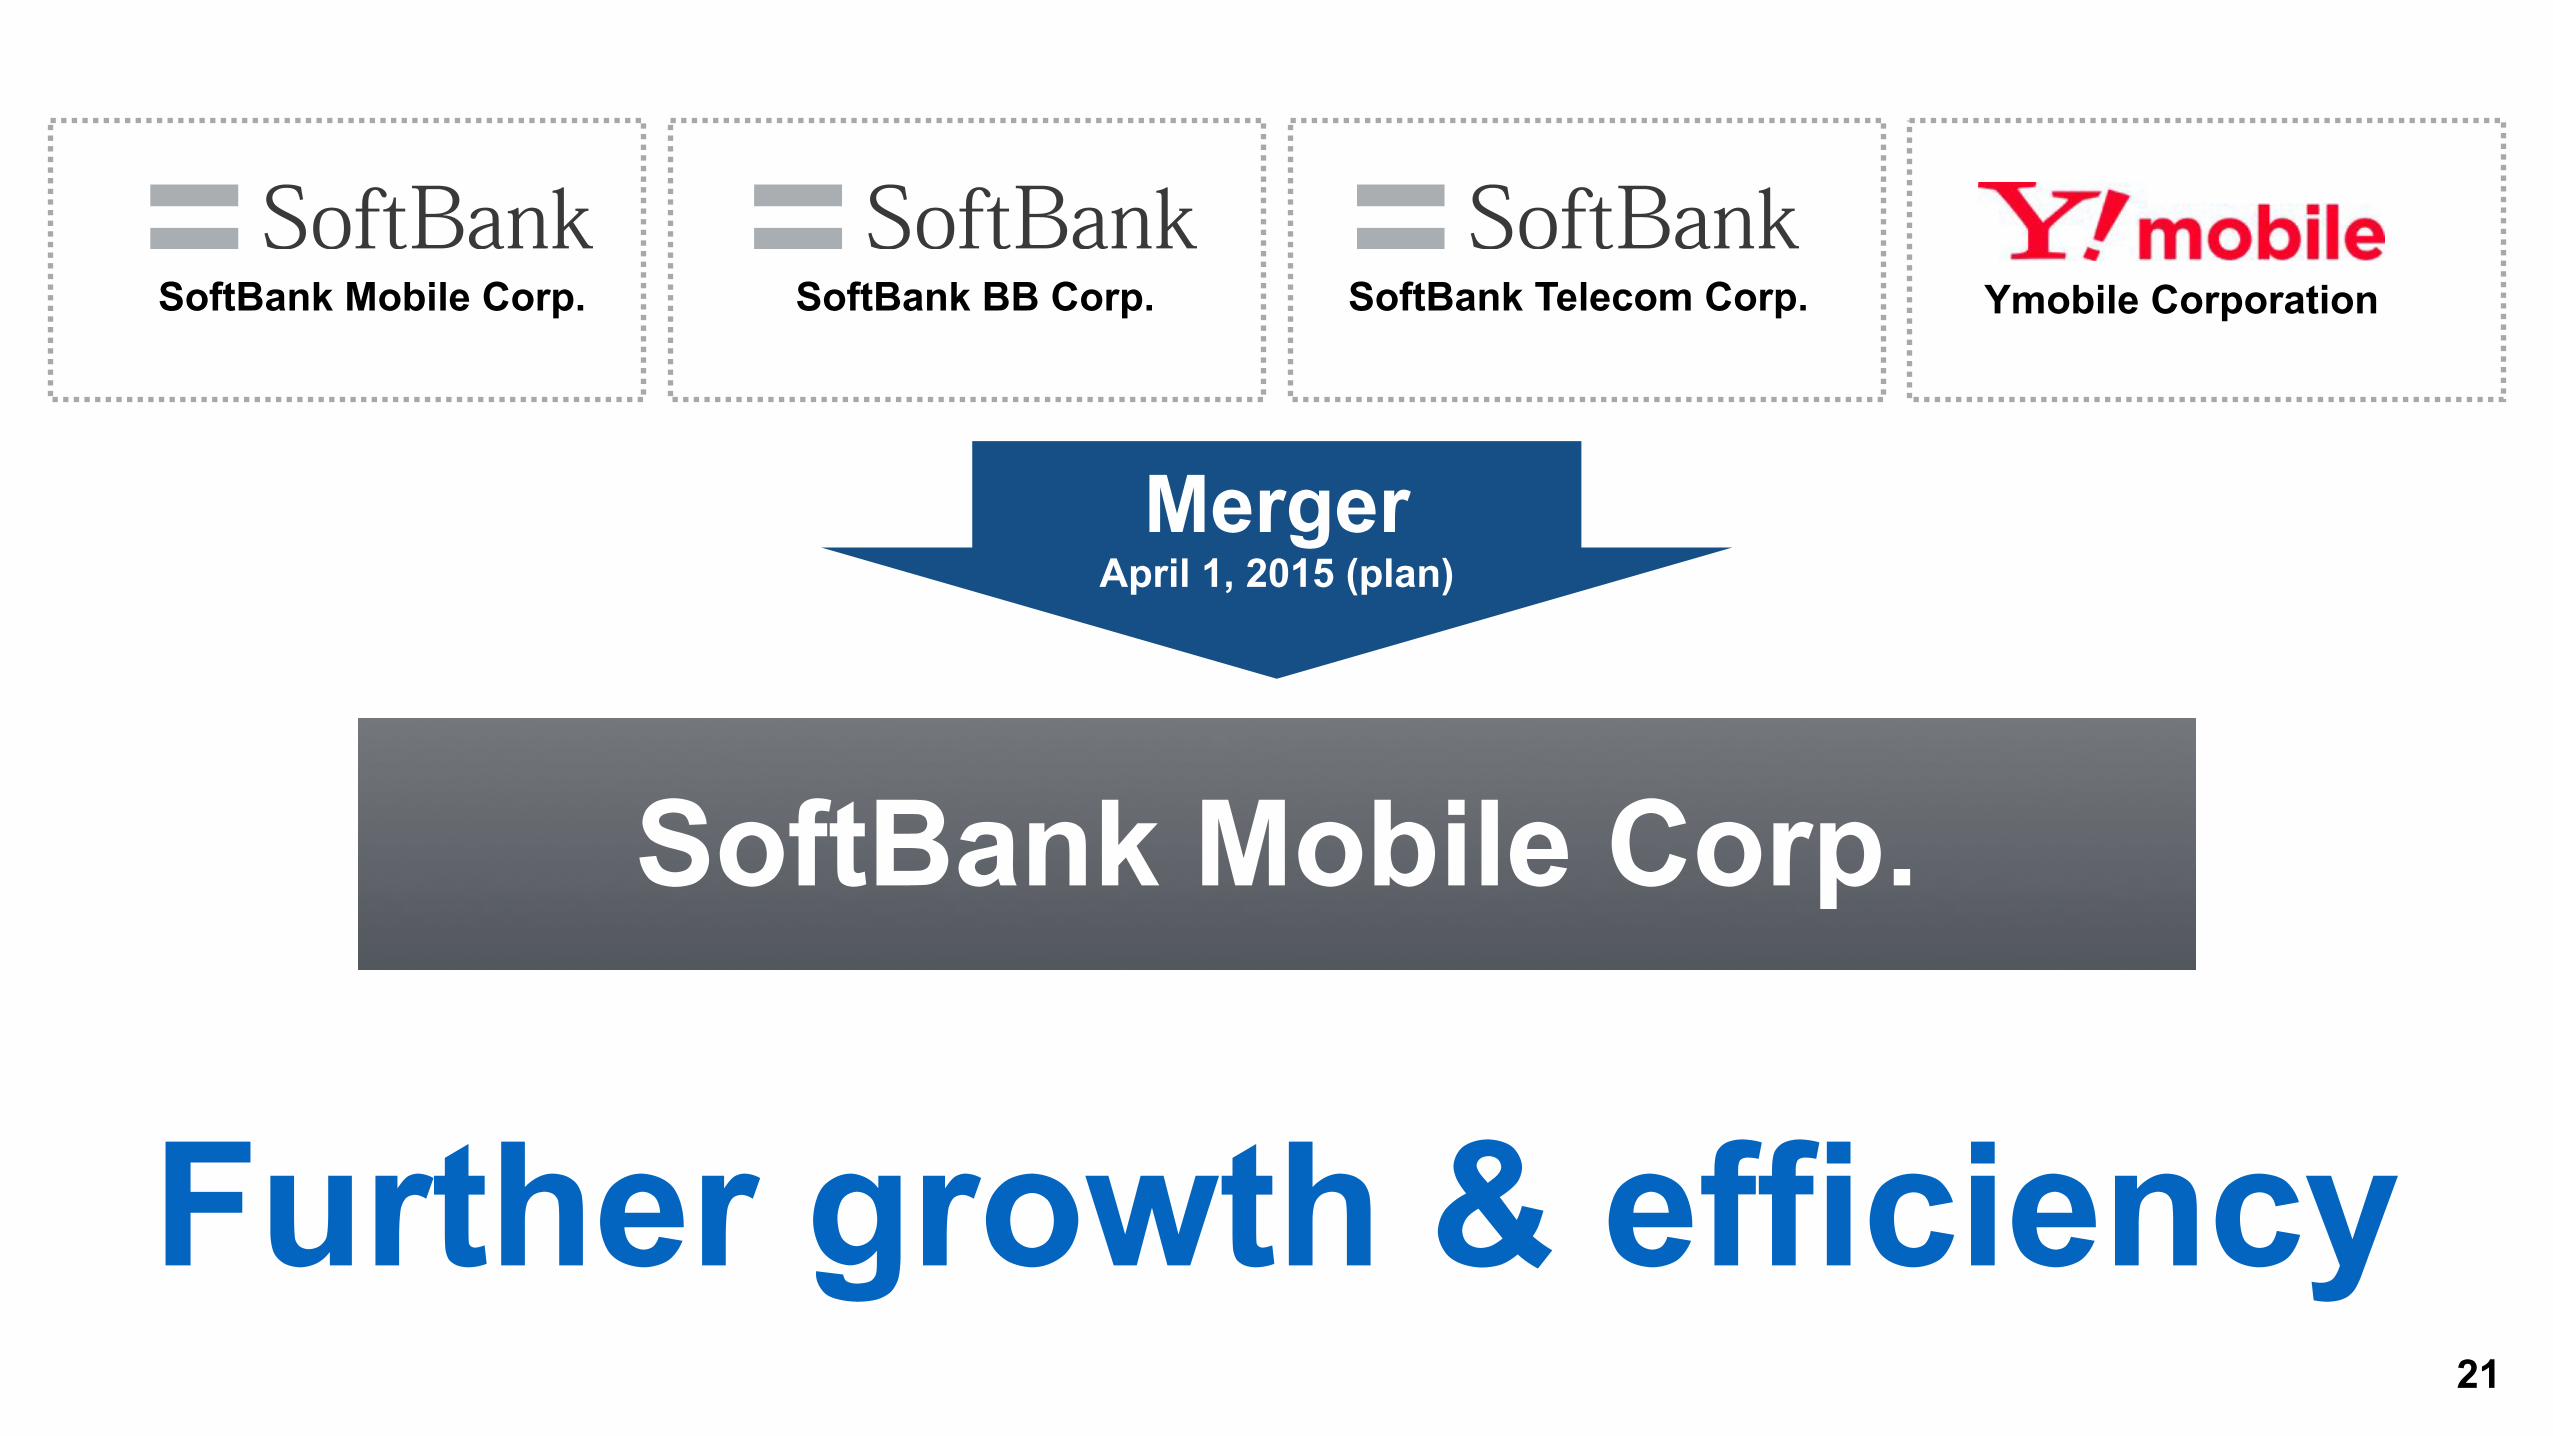
Further growth & efficiency
SoftBank BB Corp.SoftBank Mobile Corp. SoftBank Telecom Corp. Ymobile Corporation
Merger April 1, 2015 (plan)
SoftBank Mobile Corp.
22
23
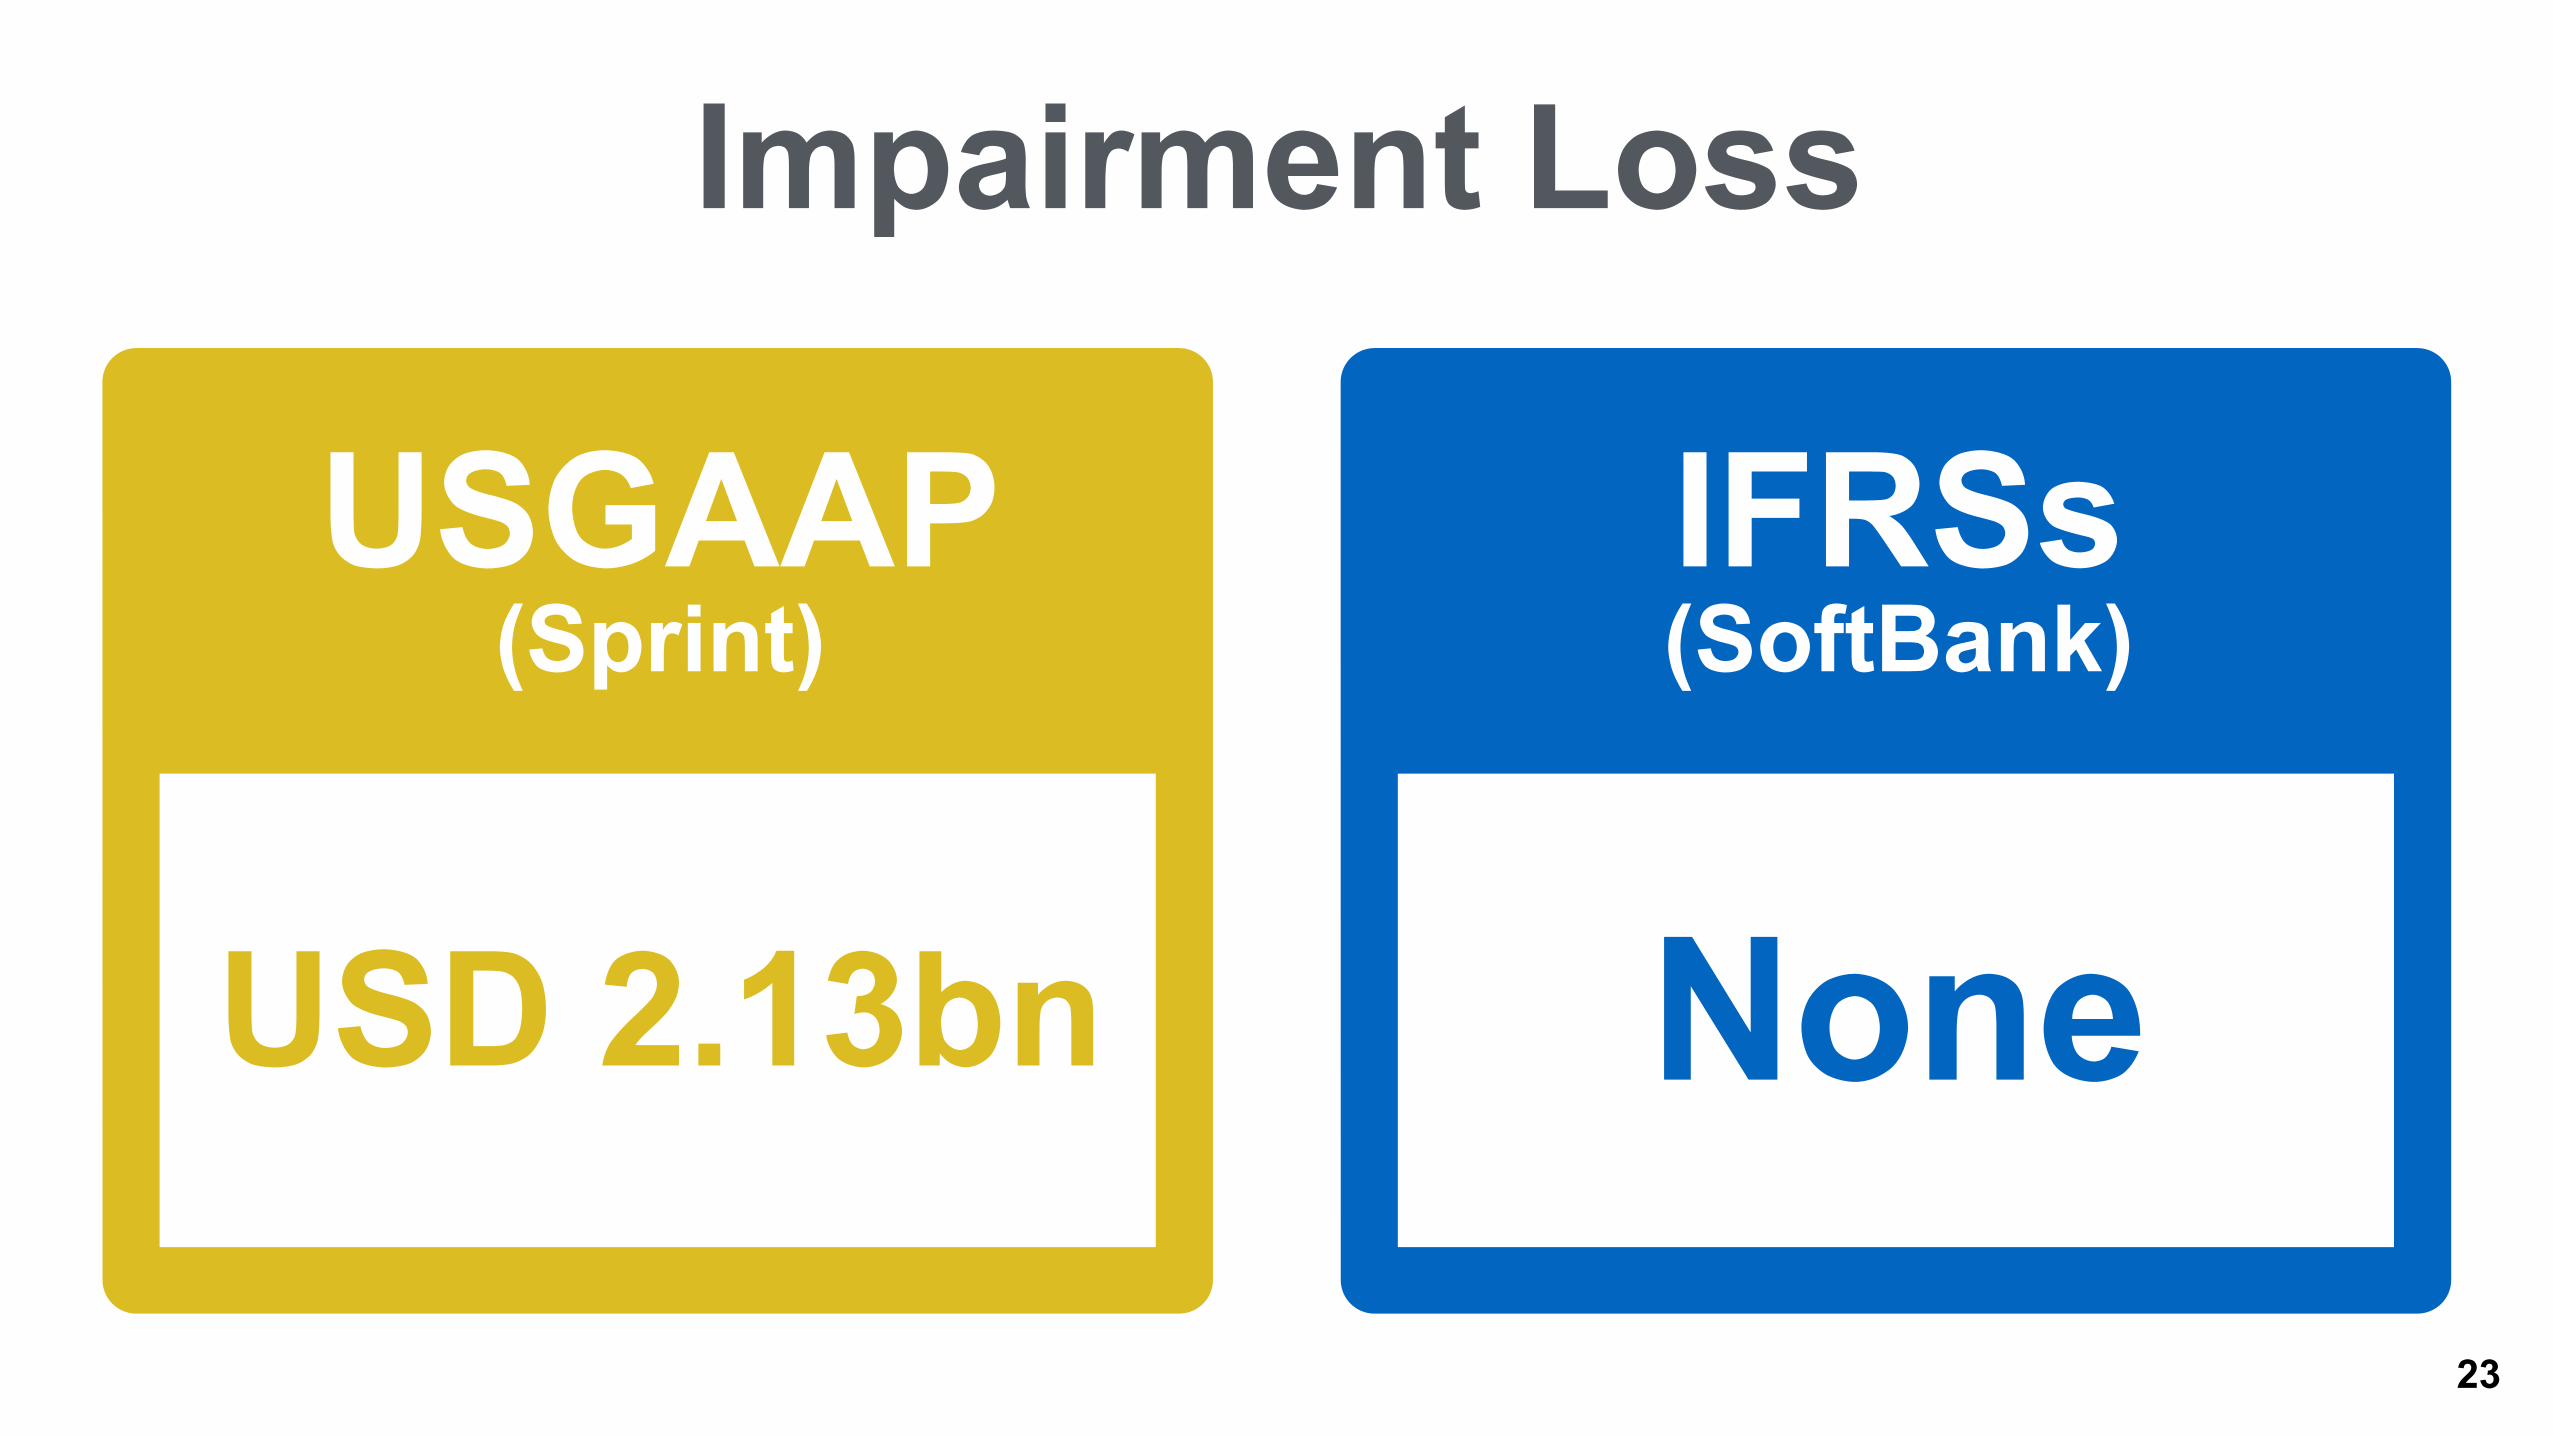
USD 2.13bn None
Impairment Loss
USGAAP (Sprint)
IFRSs (SoftBank)
24
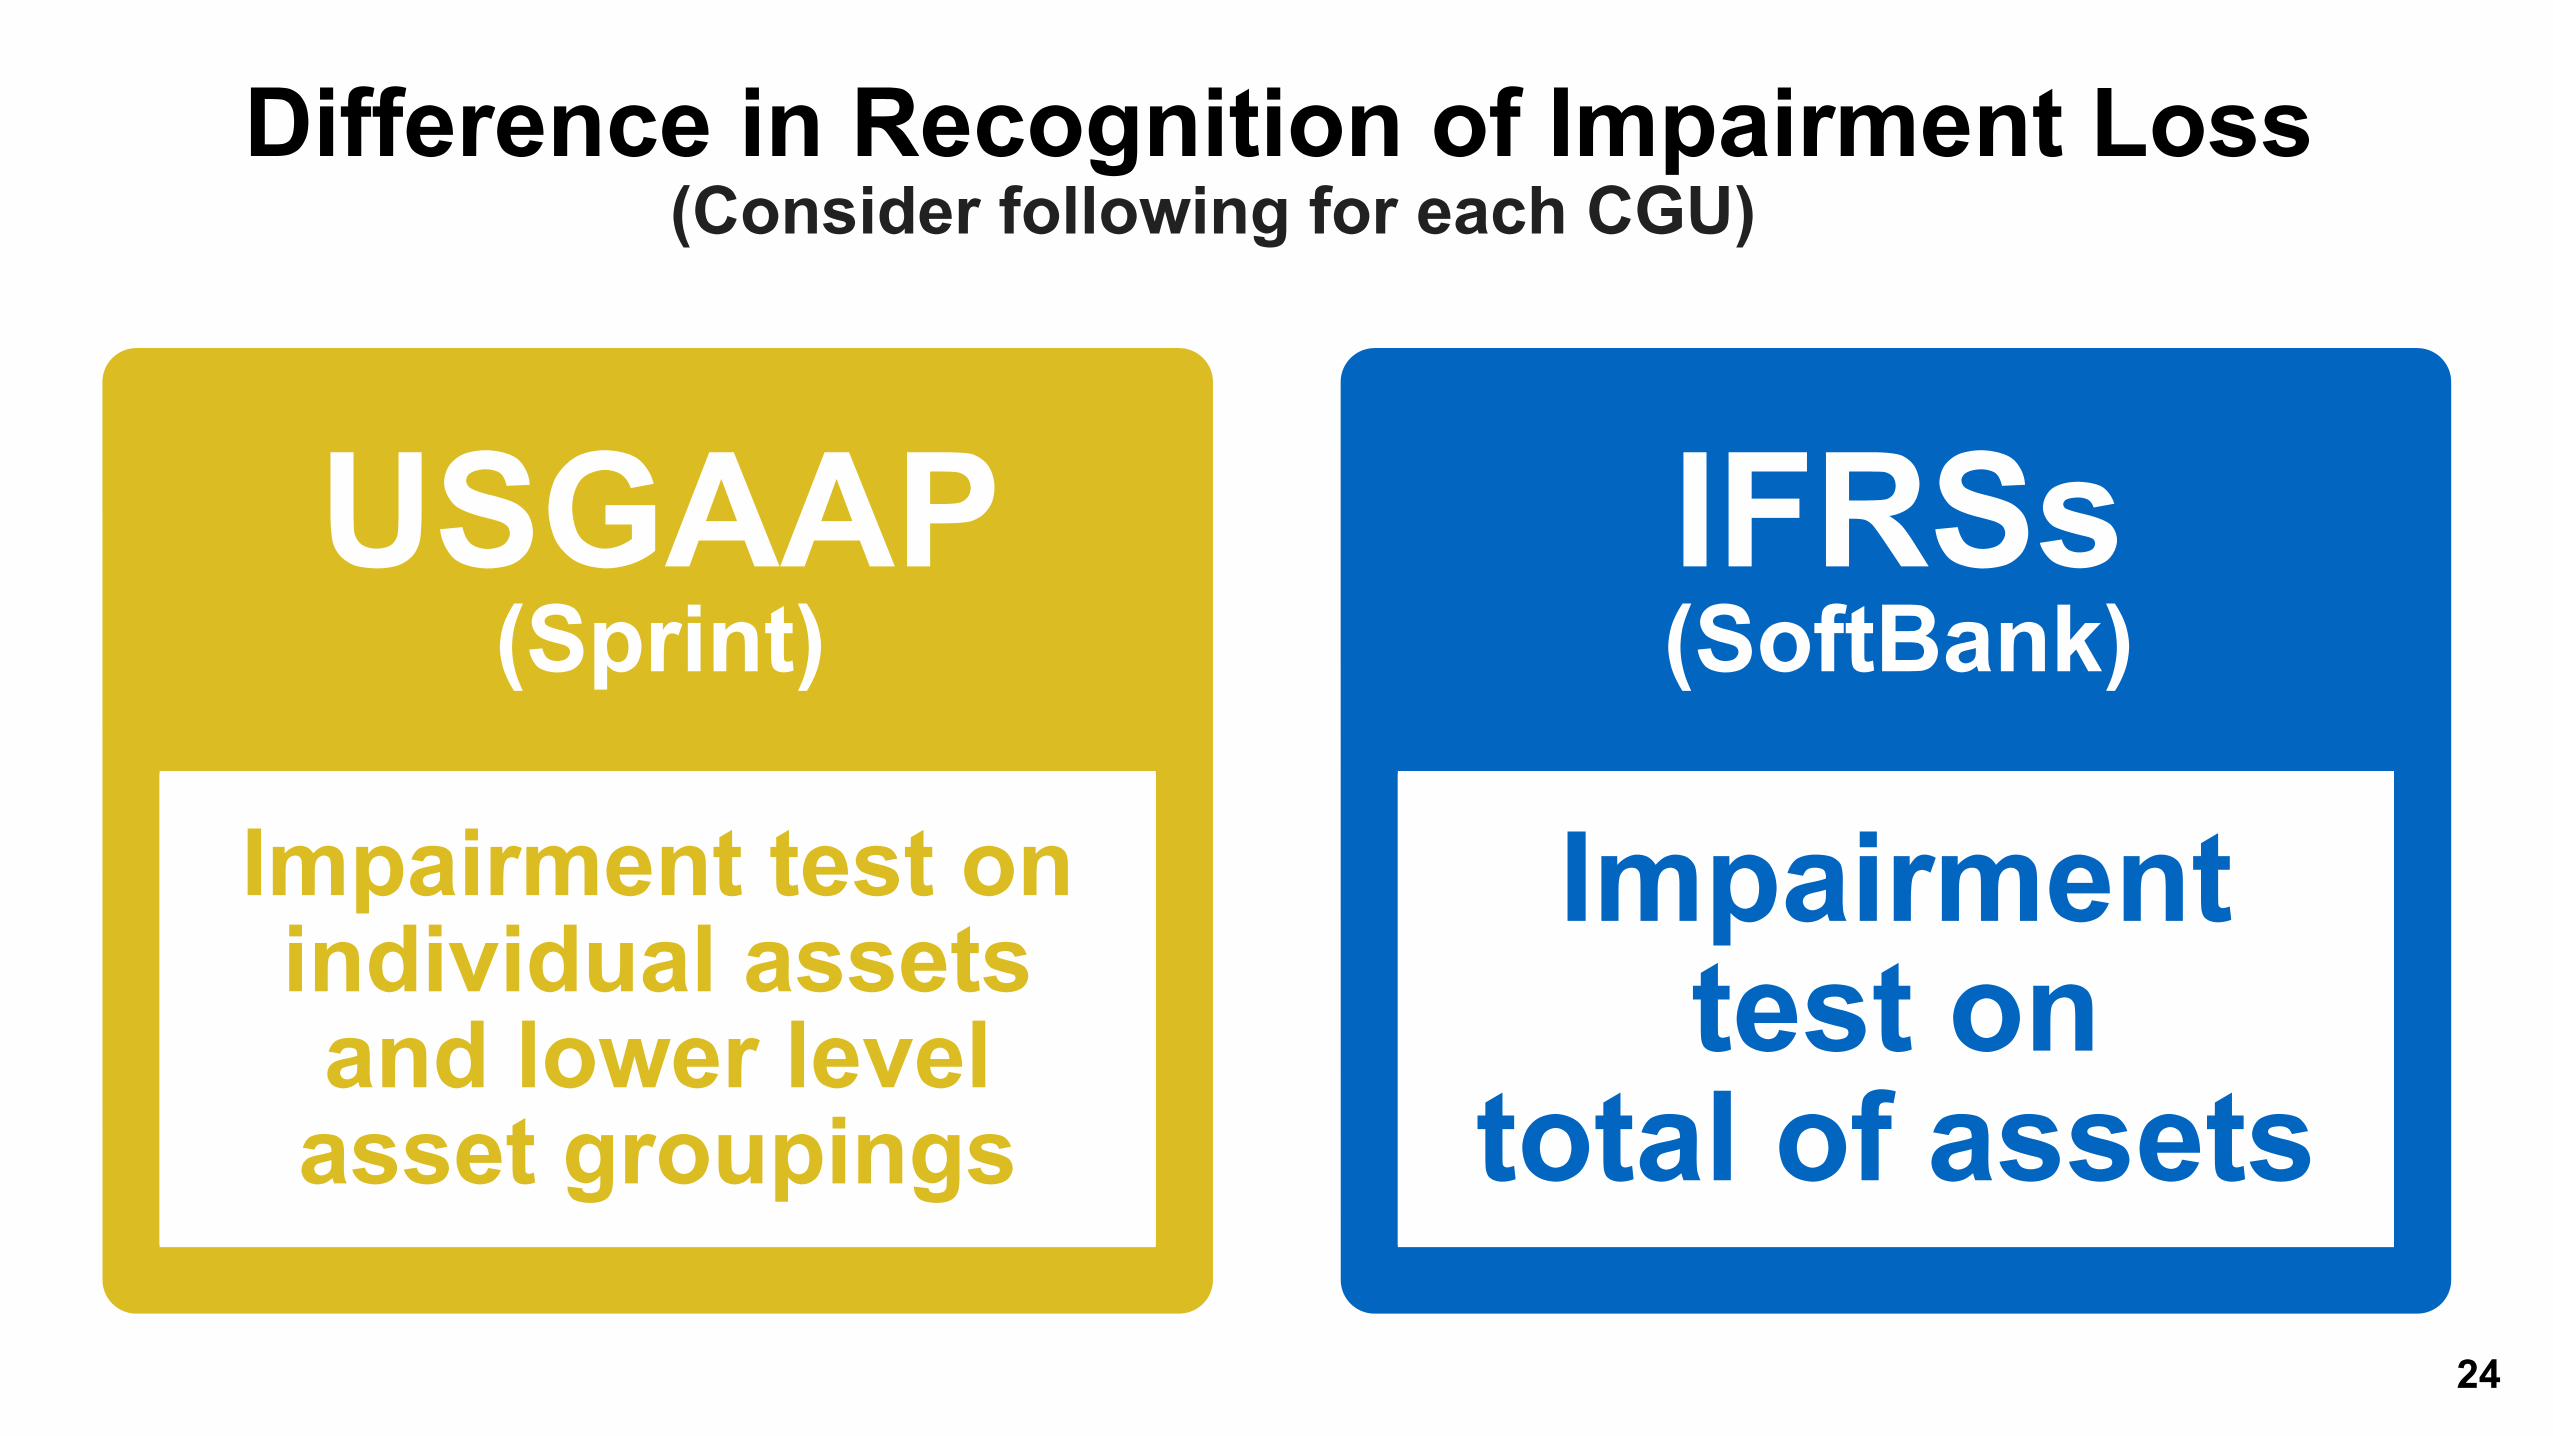
(Consider following for each CGU)Difference in Recognition of Impairment Loss
Impairment test on individual assets and lower level asset groupings
Impairment test on
total of assets
USGAAP (Sprint)
IFRSs (SoftBank)
25
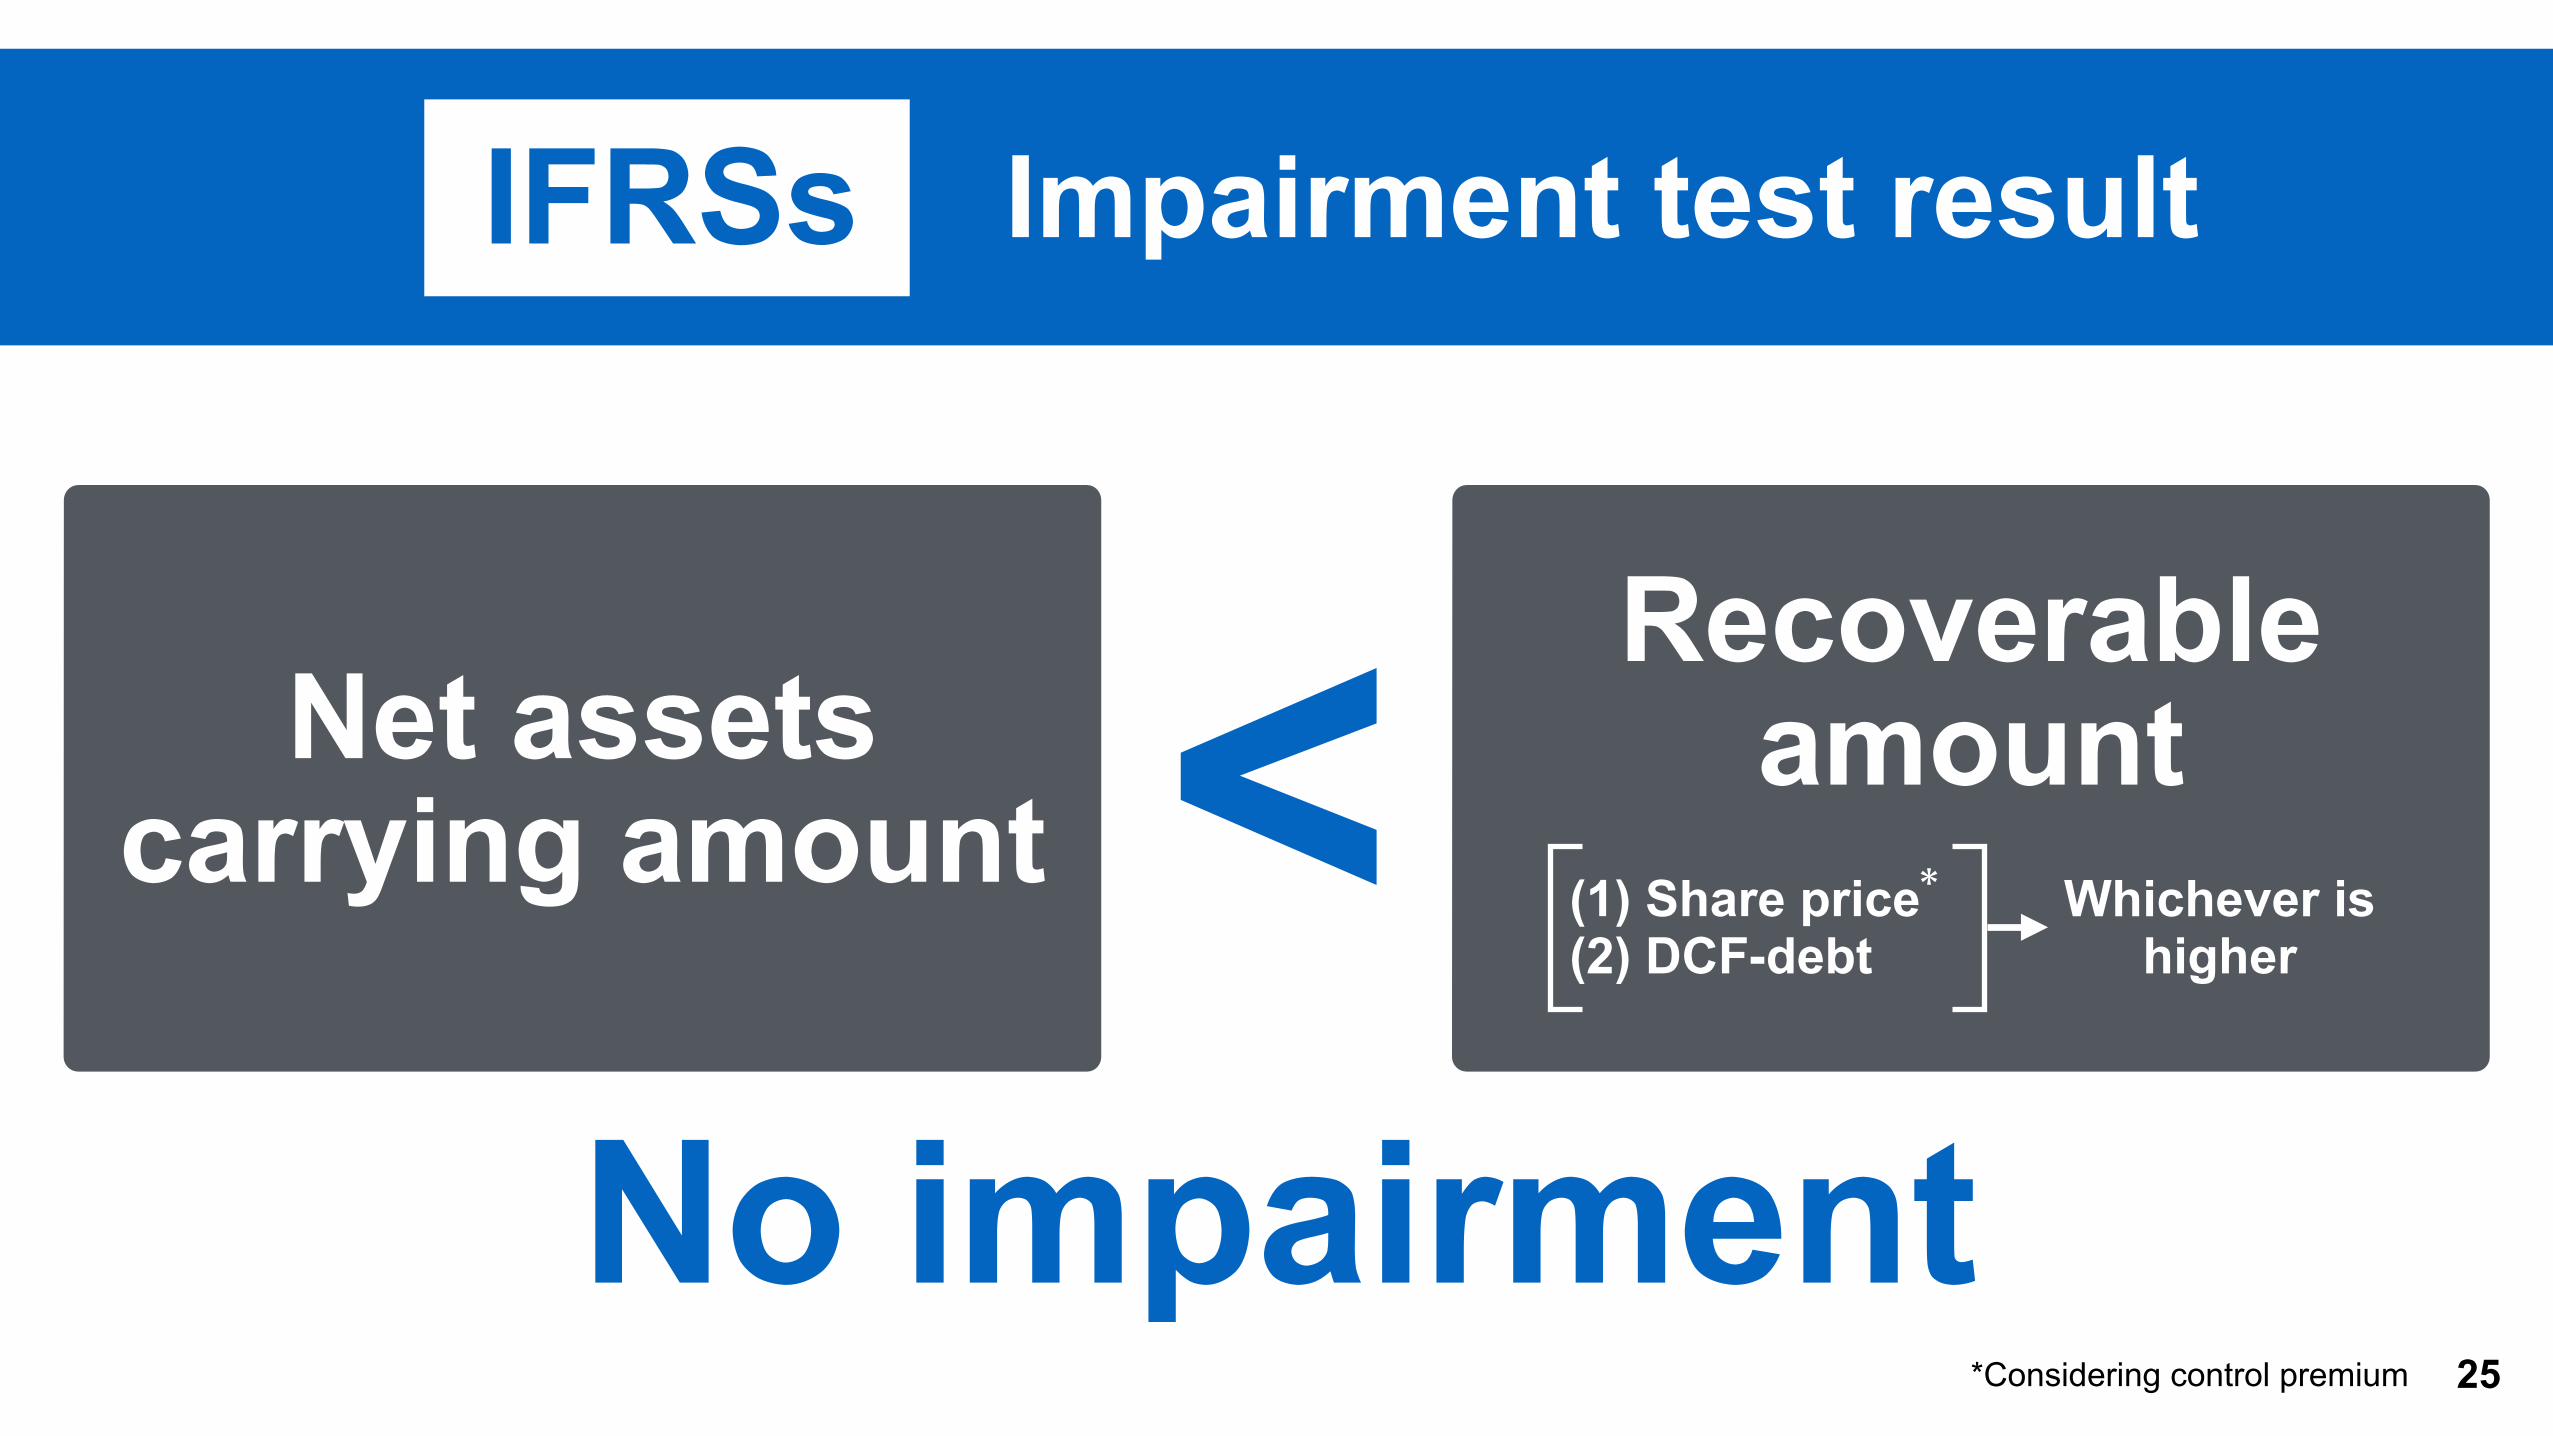
IFRSs
No impairment
Recoverable amount< *(1) Share price
(2) DCF-debt
*Considering control premium
Net assets carrying amount Whichever is
higher
Impairment test result
2010 Jan. - Dec.
’11 Jan. - Dec.
’12 Jan. - Dec.
’13 Jan. - Dec.
’14 Jan. - Dec.
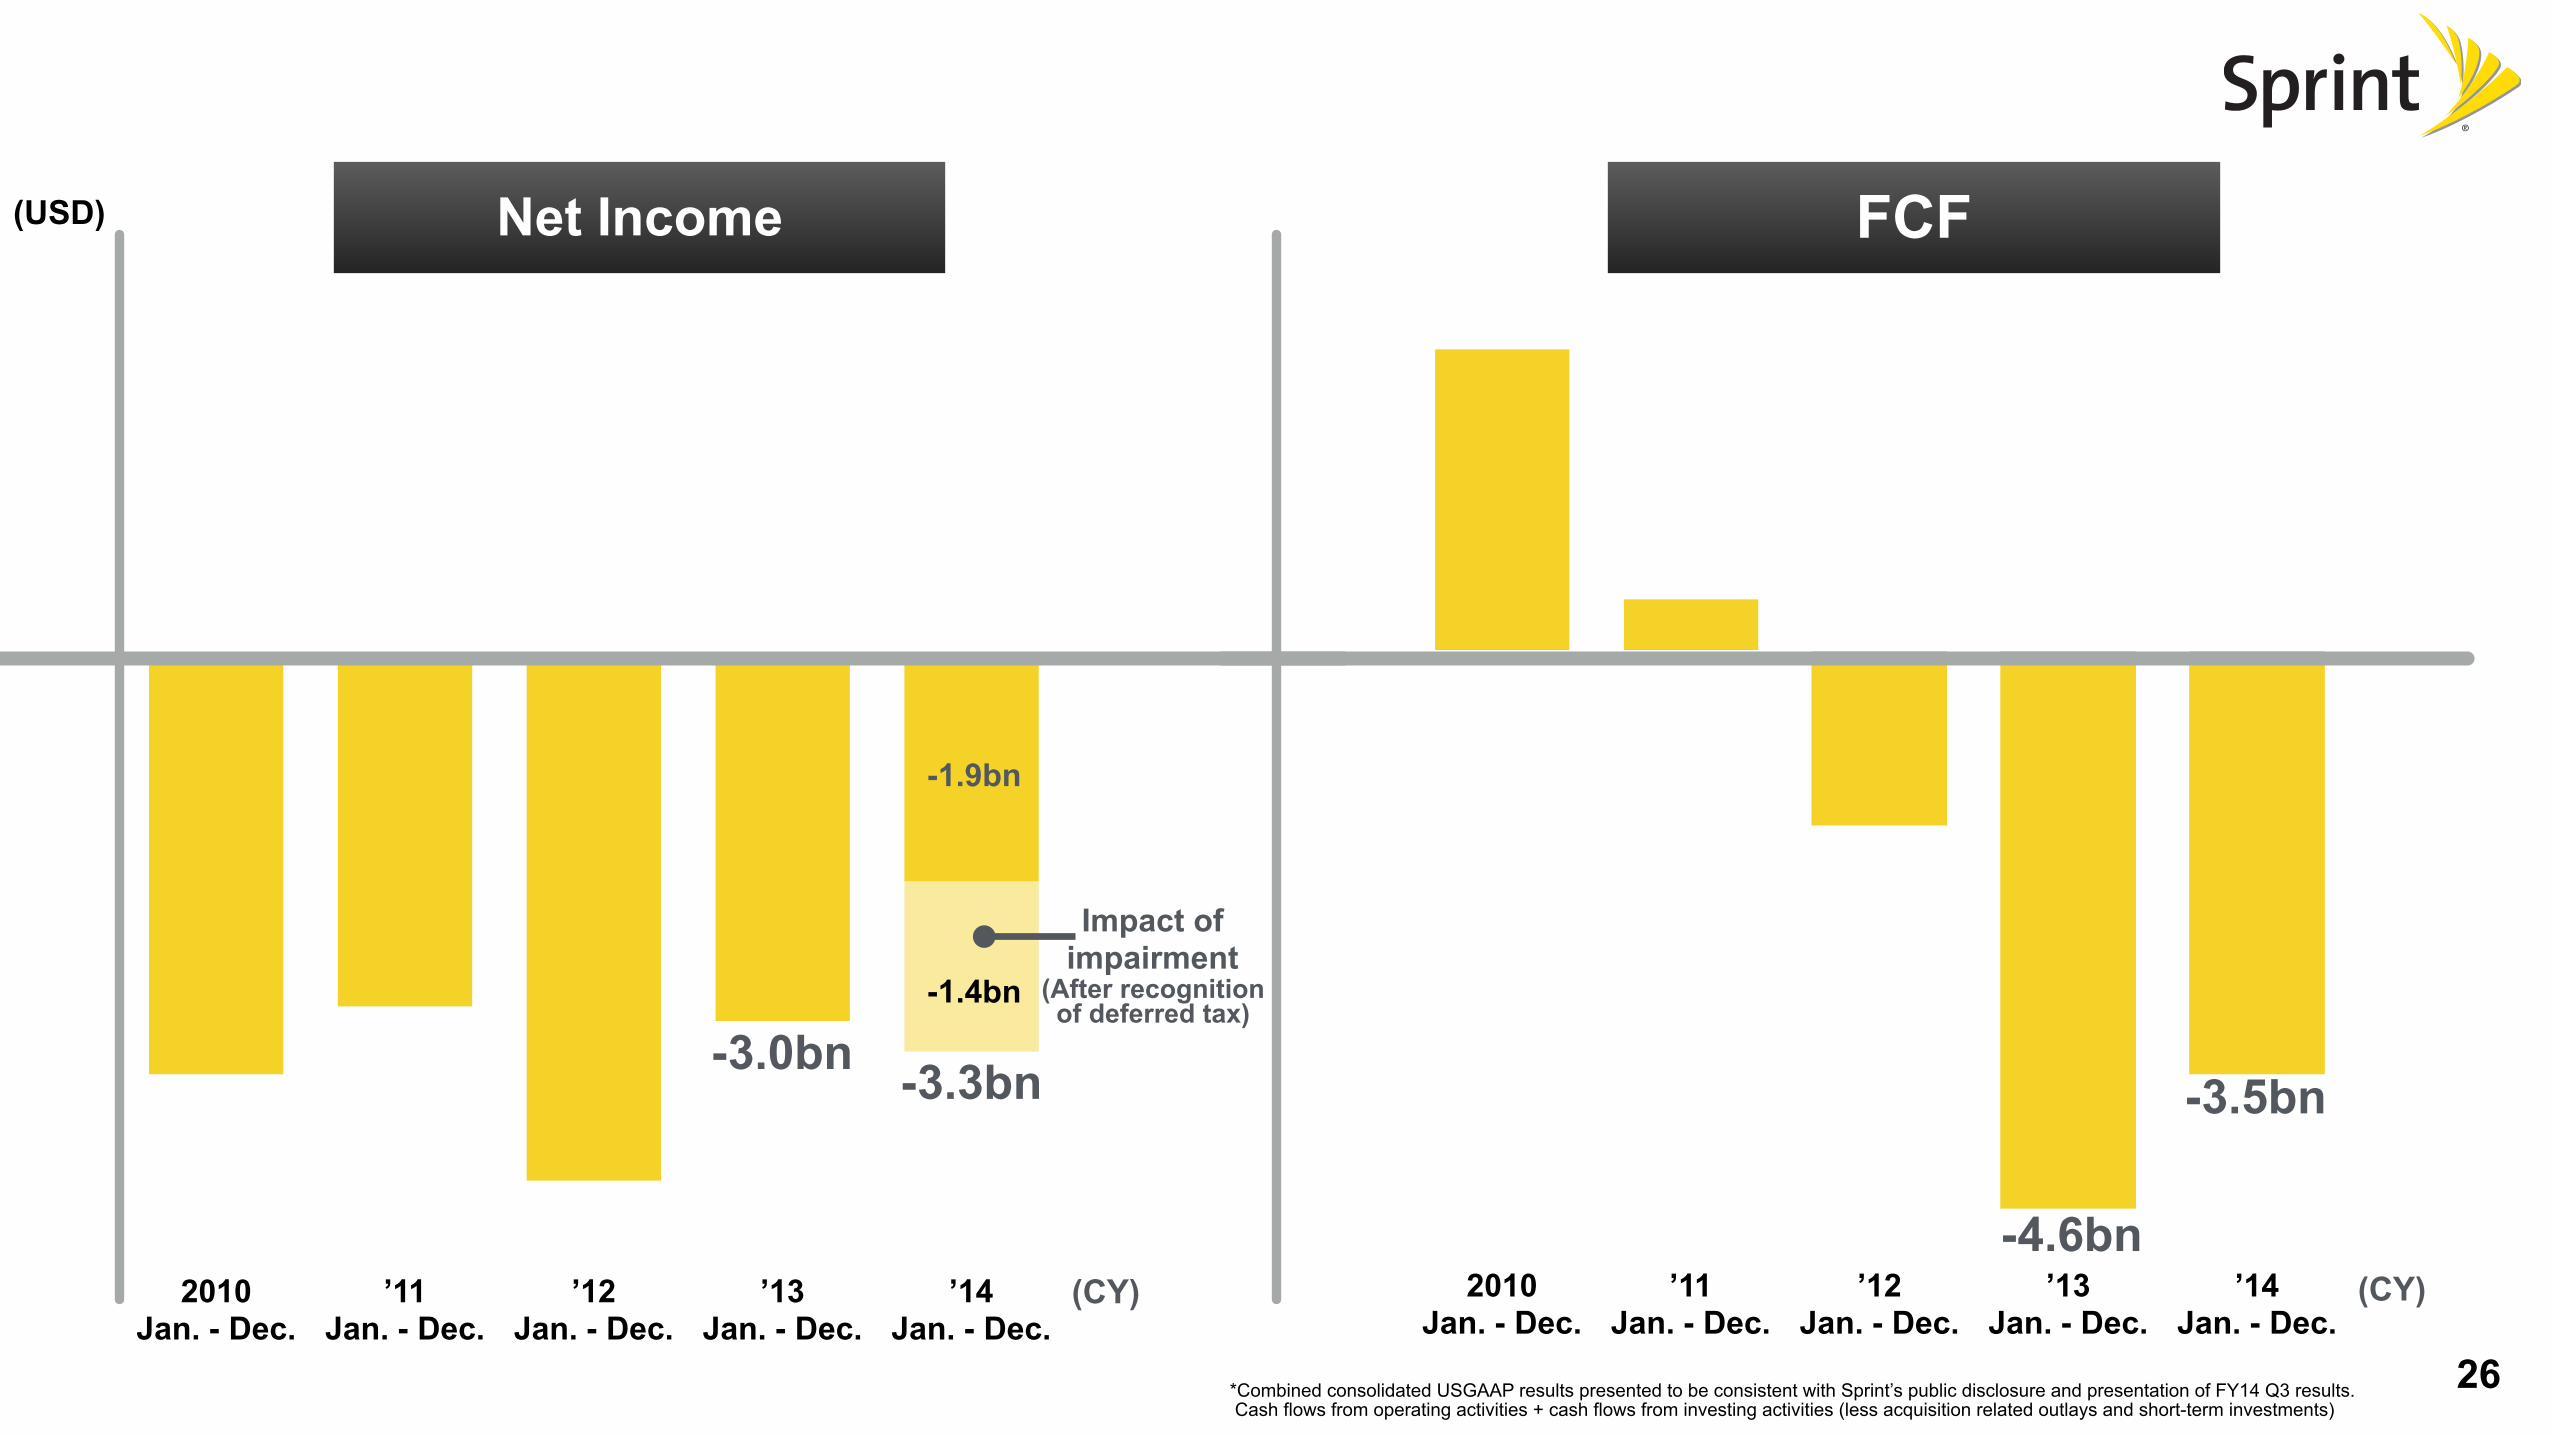
26
2010 Jan. - Dec.
’11 Jan. - Dec.
’12 Jan. - Dec.
’13 Jan. - Dec.
’14 Jan. - Dec.
(After recognition of deferred tax)
Net Income FCF
-1.9bn
-3.0bn -3.3bn
-1.4bn
Impact of impairment
(CY) (CY)-4.6bn
-3.5bn
(USD)
*Combined consolidated USGAAP results presented to be consistent with Sprint’s public disclosure and presentation of FY14 Q3 results. Cash flows from operating activities + cash flows from investing activities (less acquisition related outlays and short-term investments)

Status after Marcelo’s appointment
27
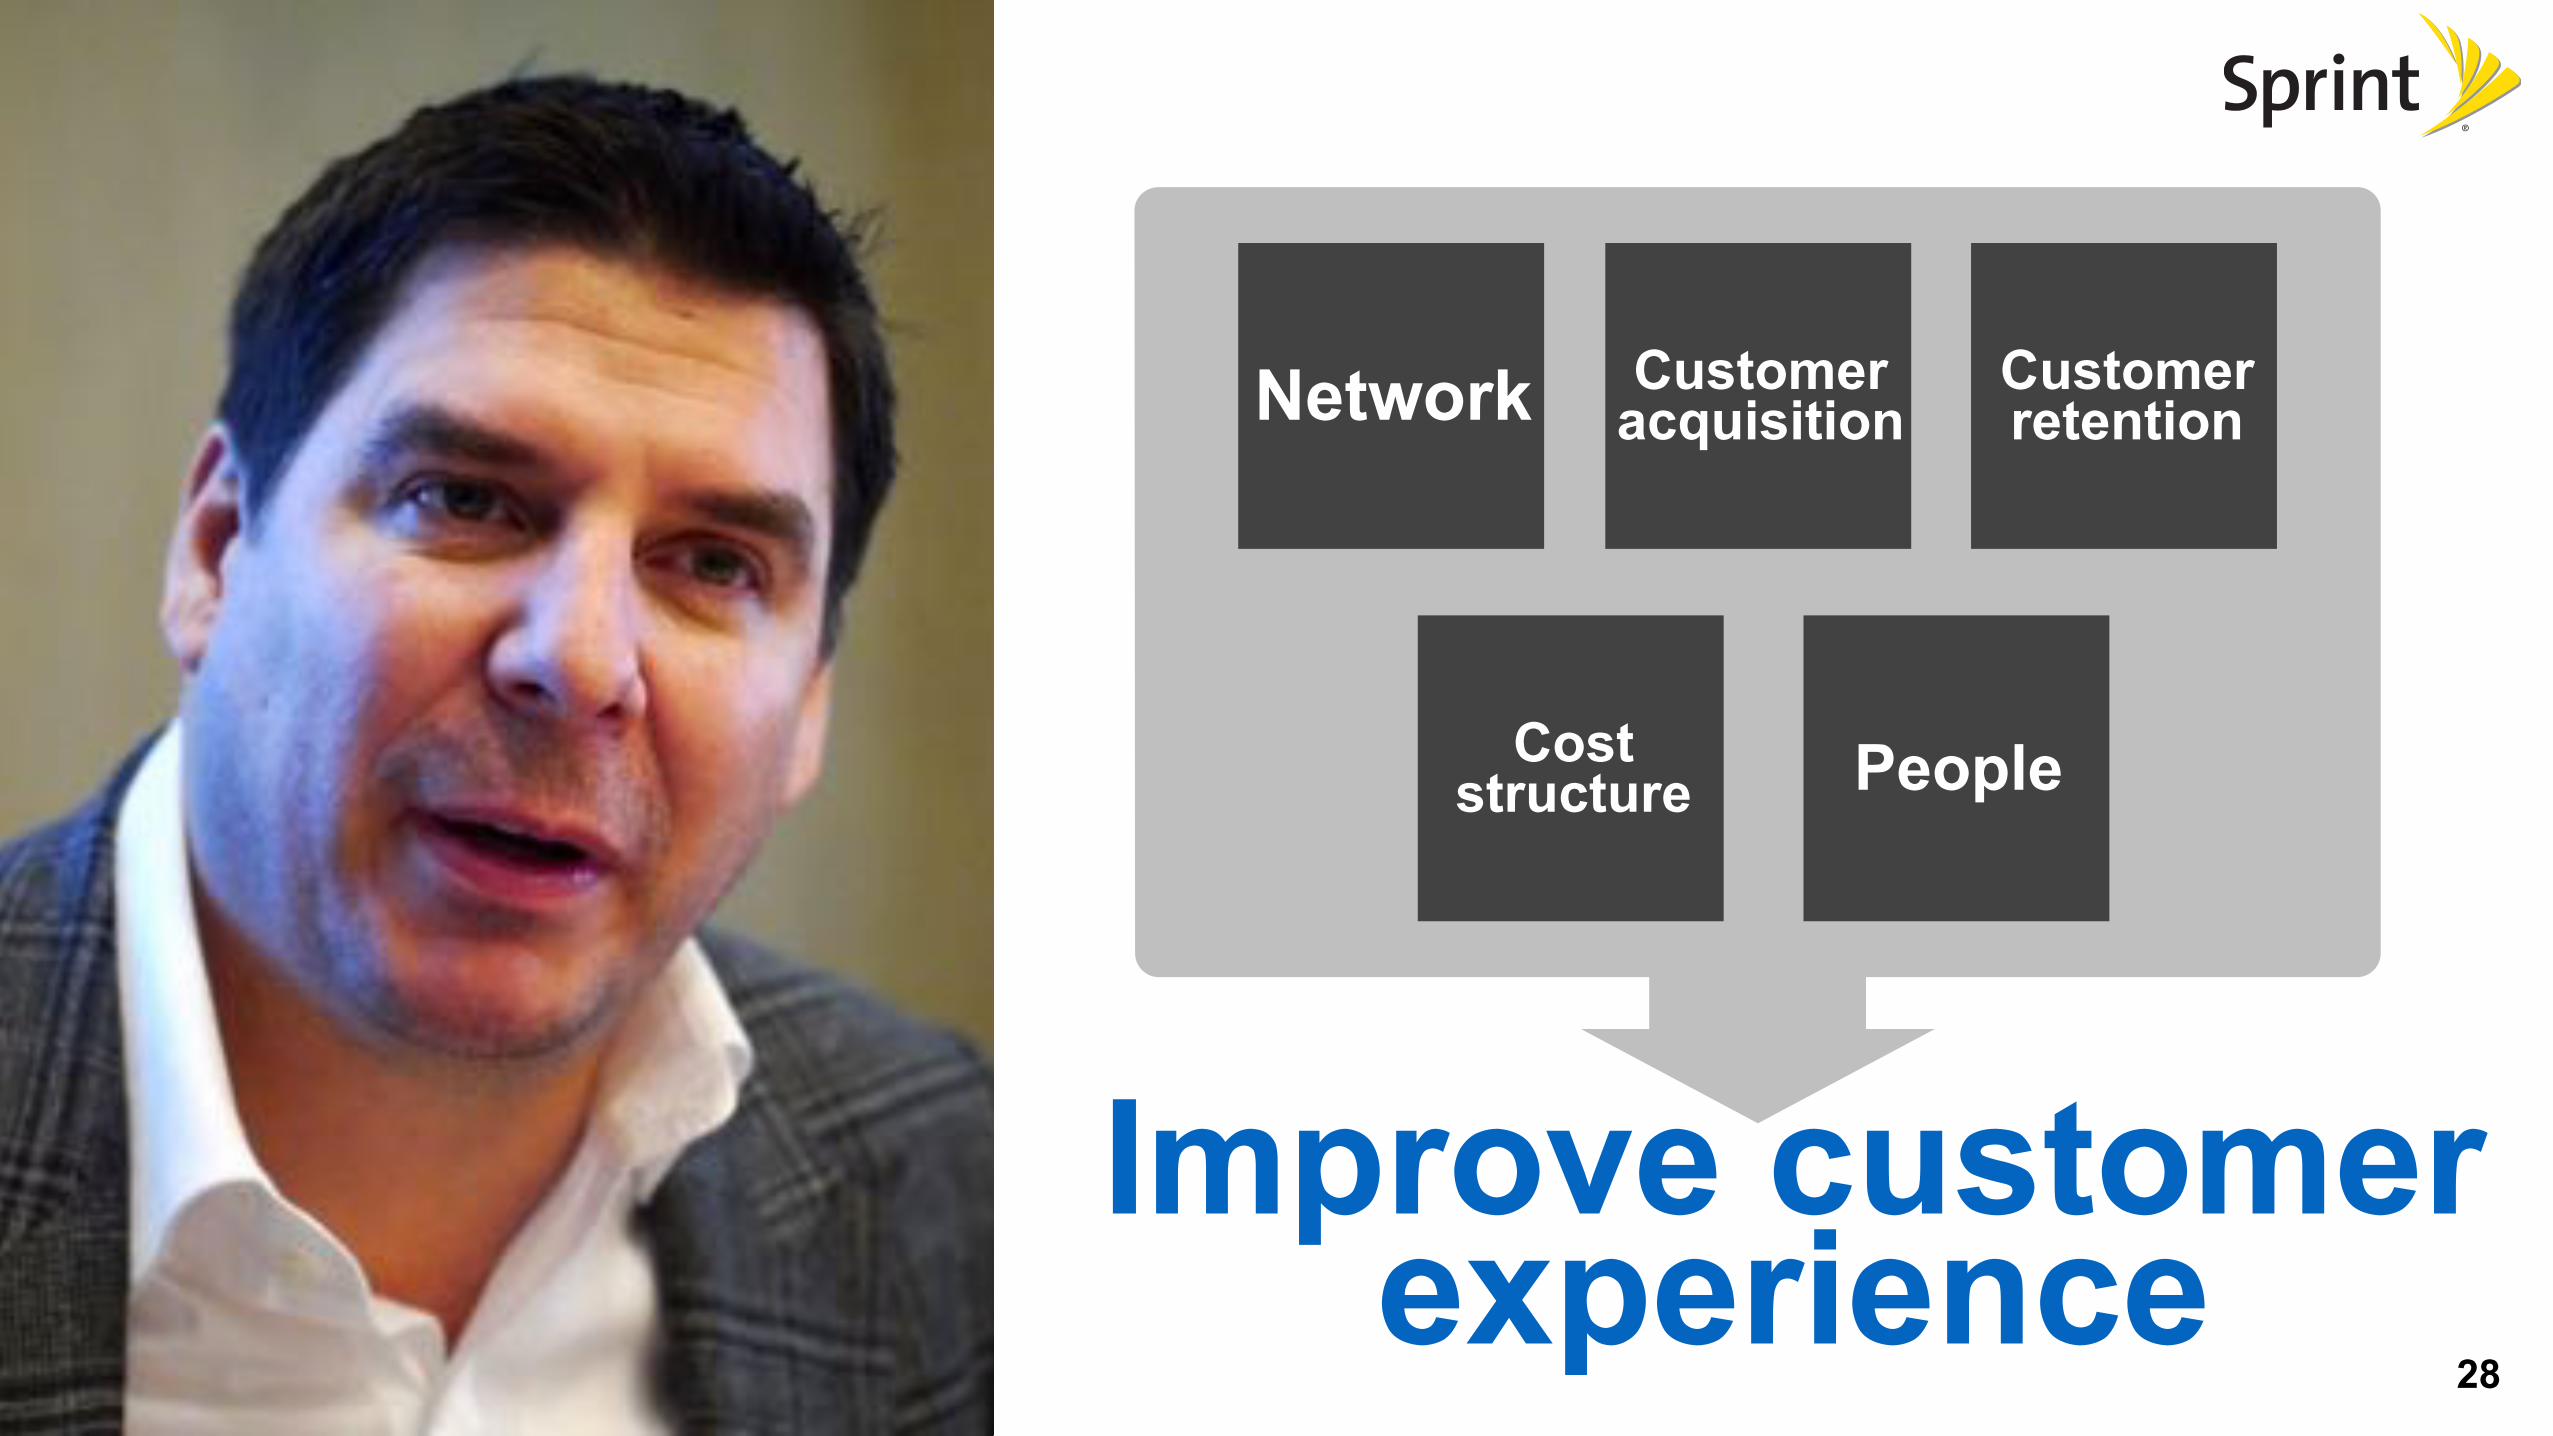
Customer acquisition
Customer retentionNetwork
PeopleCost structure
Improve customer experience
28
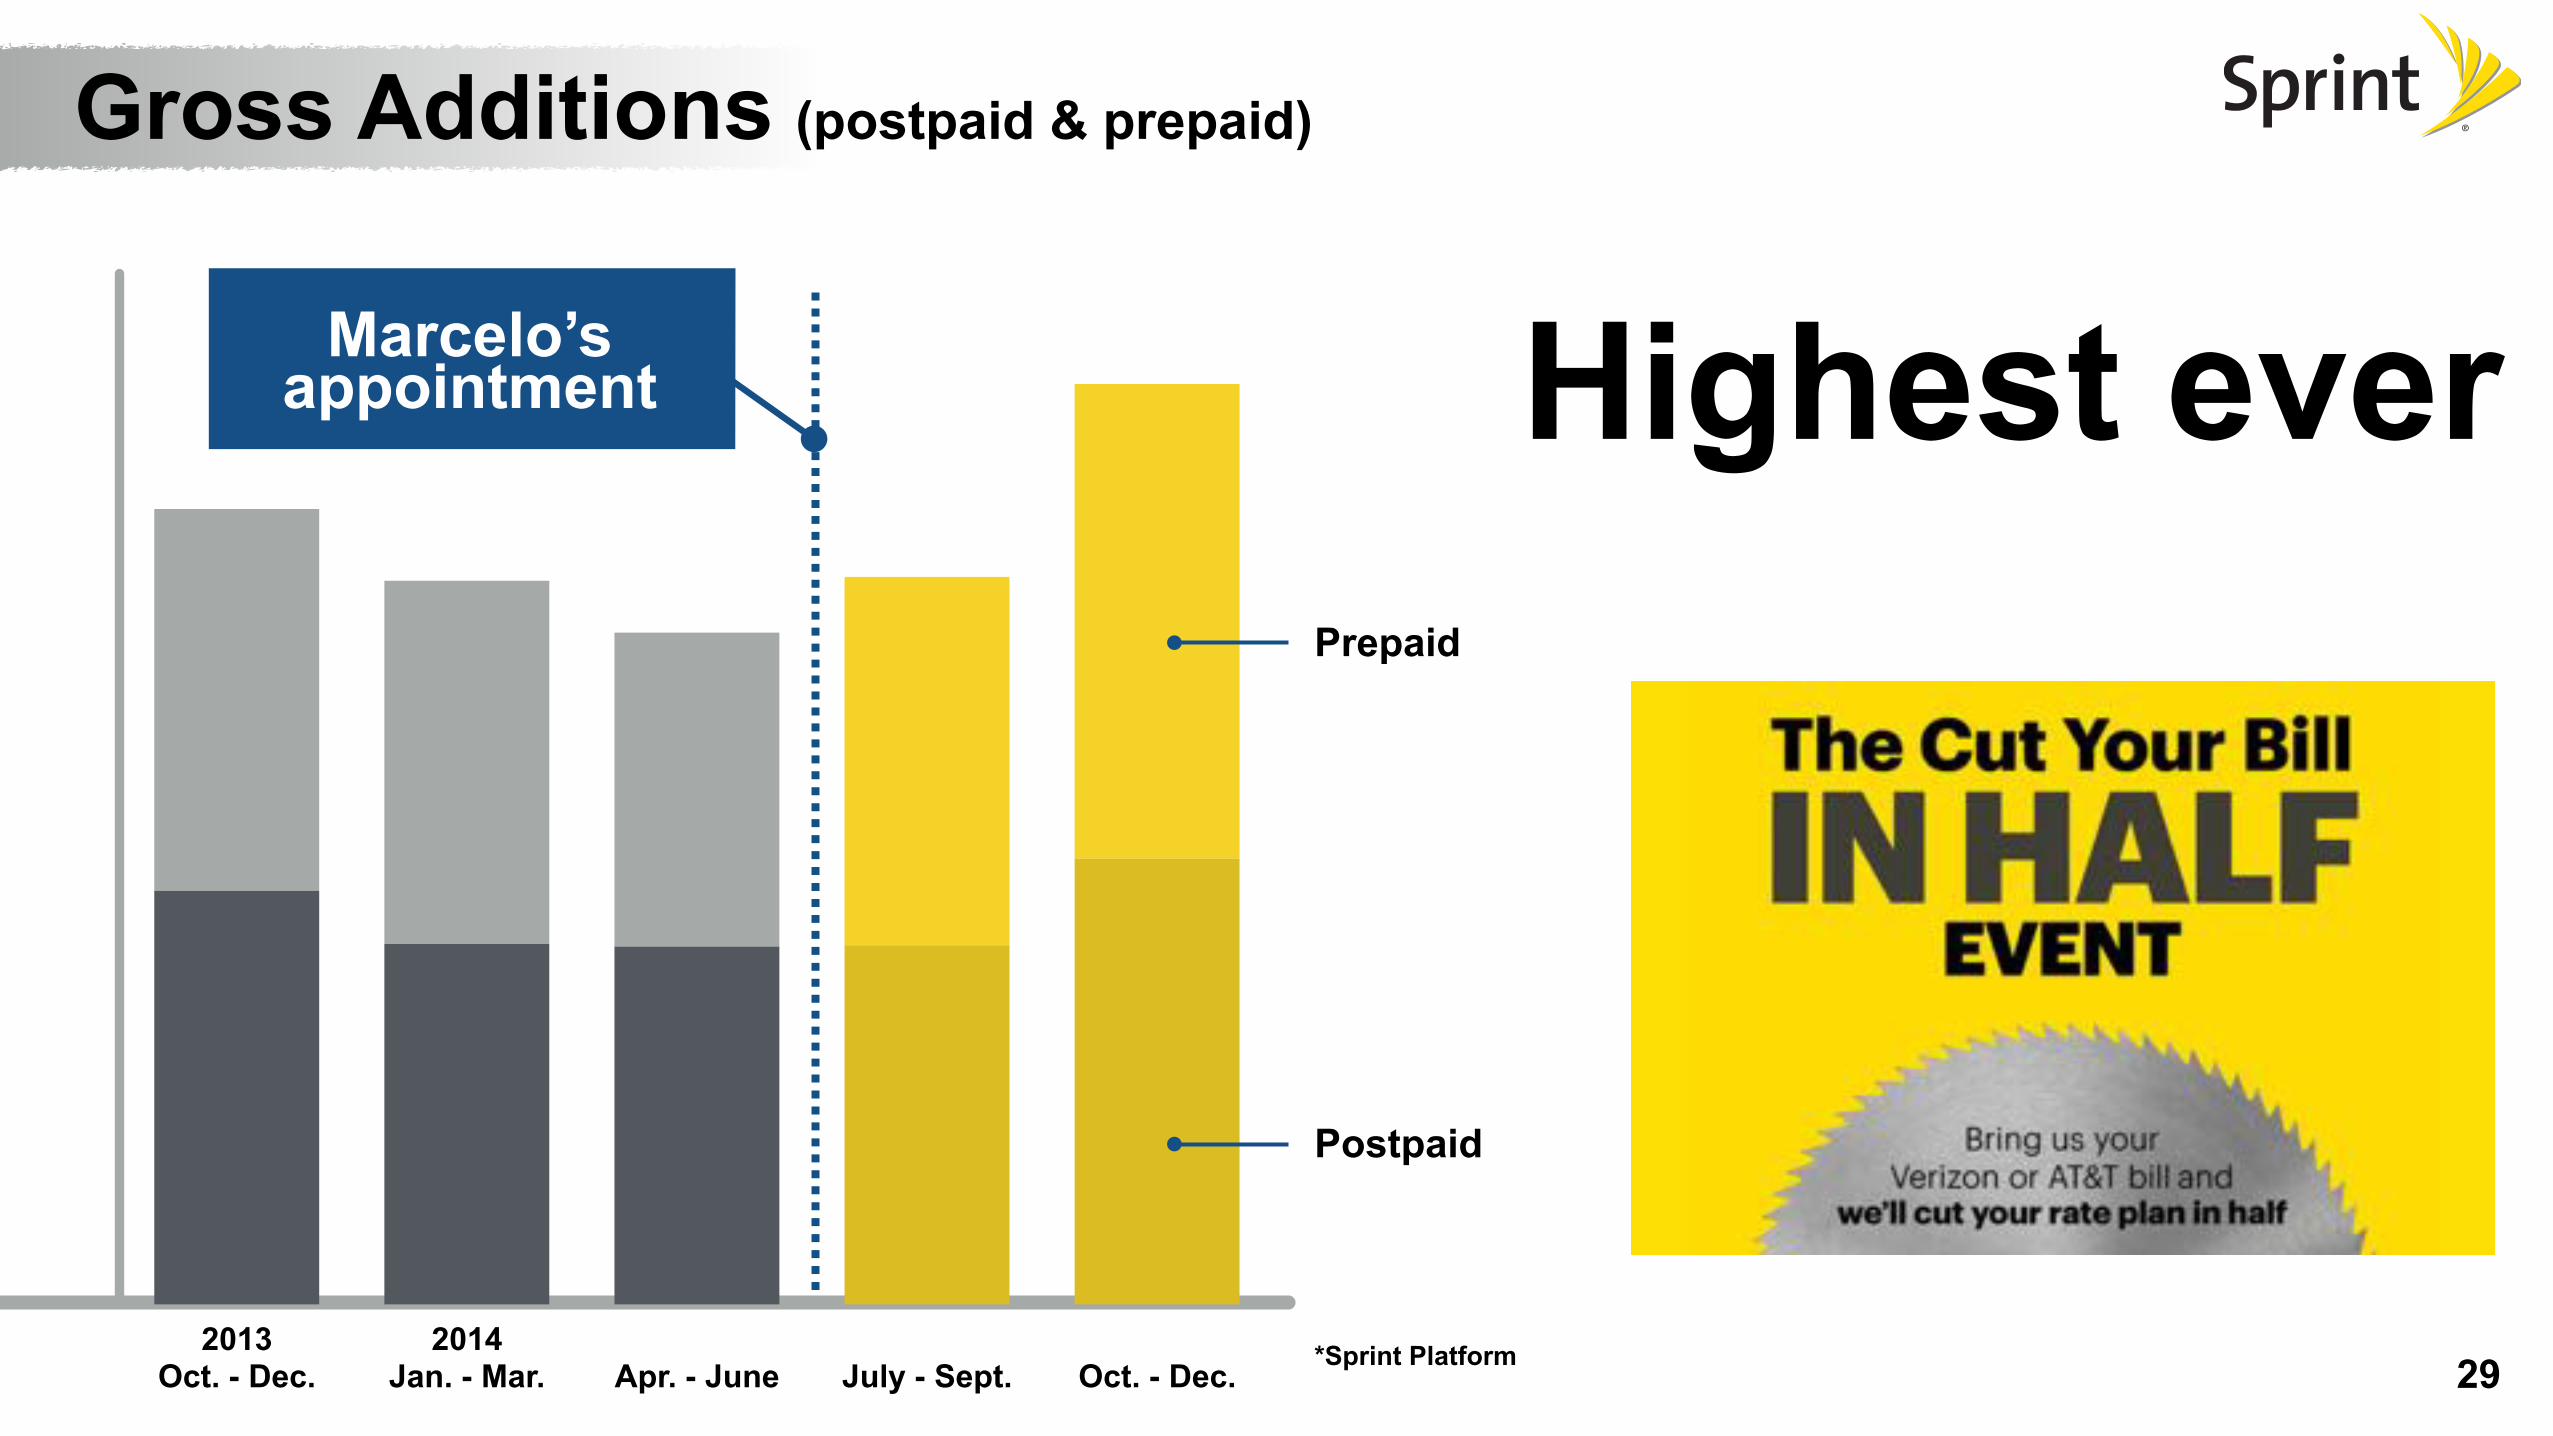
2013 Oct. - Dec.
2014 Jan. - Mar. Apr. - June July - Sept. Oct. - Dec. 2929
Highest ever
*Sprint Platform
Postpaid
Prepaid
Gross Additions (postpaid & prepaid)
Marcelo’s appointment
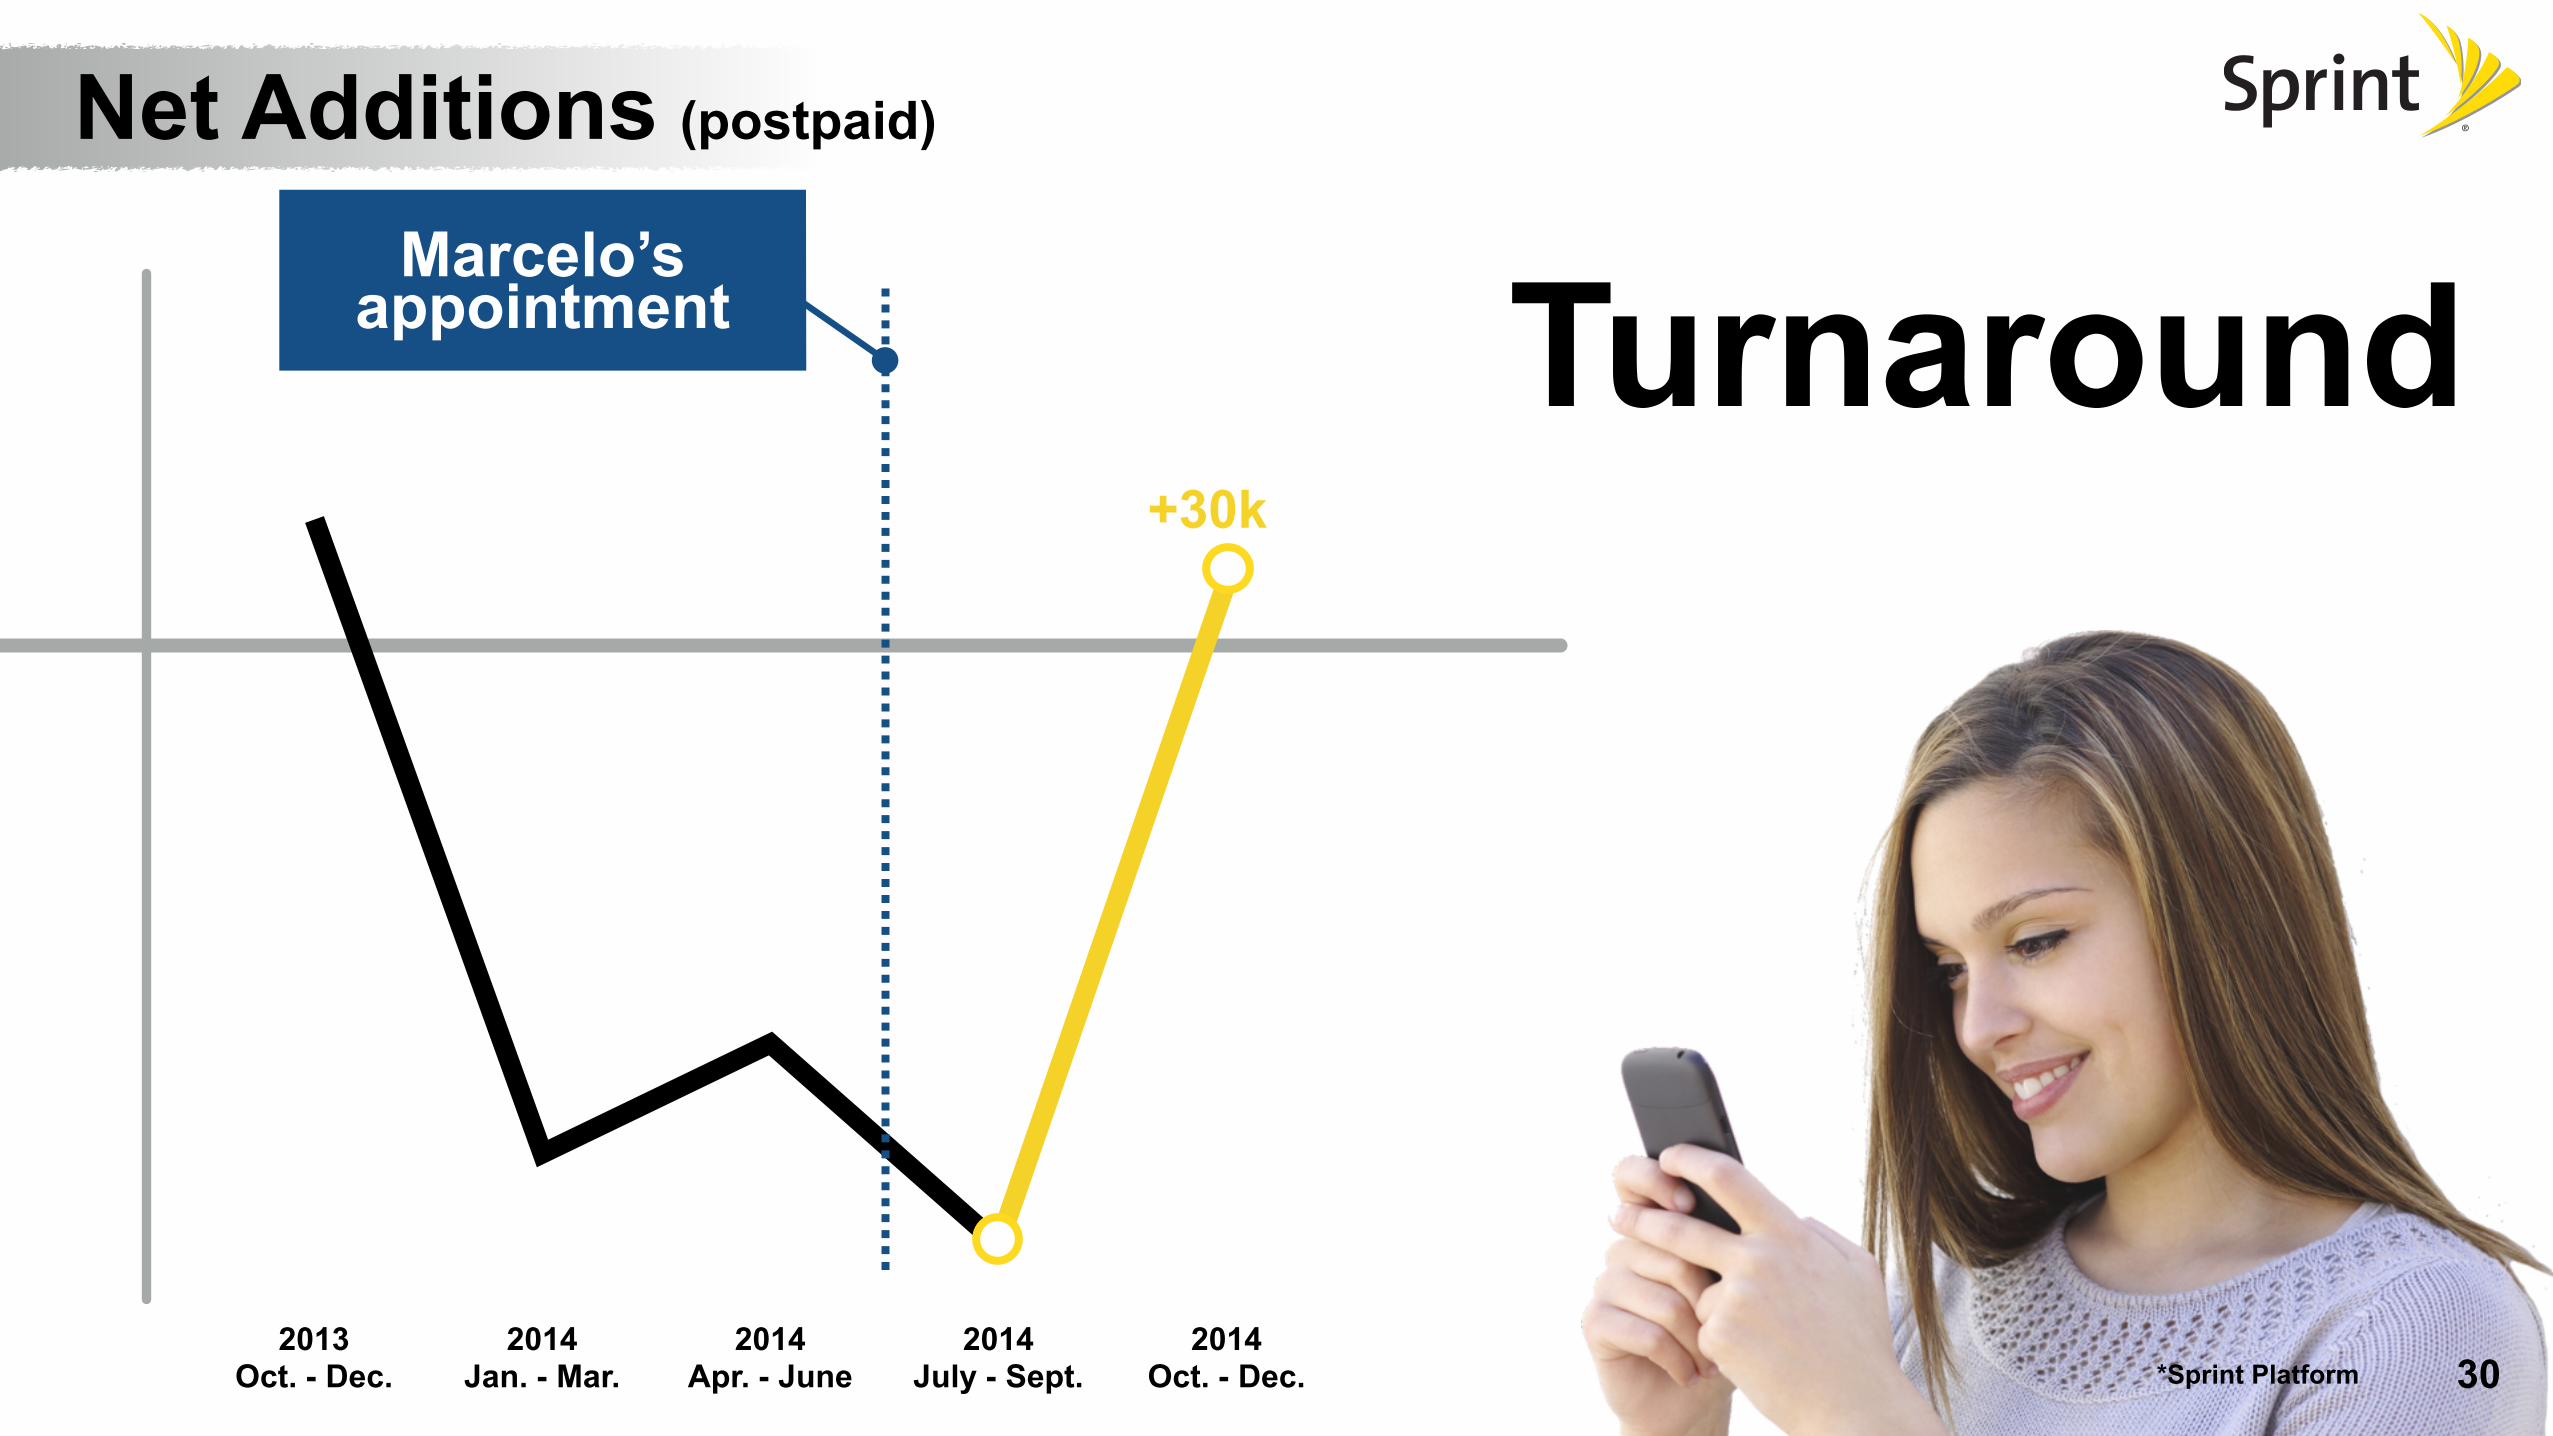
2013 Oct. - Dec.
2014 Jan. - Mar.
2014 Apr. - June
2014 July - Sept.
2014 Oct. - Dec. 30*Sprint Platform
Marcelo’s appointment
Net Additions (postpaid)
Turnaround+30k

31
Dropped Call Index [Sprint vs. Competitors]
2007
*Based on analysis by Sprint using syndicated independent, 3rd party field drive test information supplied by Nielsen 2007-2014 as of Dec. 31, 2014. Historical drop call data based on top 50 most populous markets (2007-2010) & top 100 most populous markets (2011-2014). Quarter index values are based on market results reported within each period; not all Markets are reported each quarter. For the 2013 for 2014 year over year improvement, Sprint created National values using an average of reported Market-level drop call rates for the top 100 most populous Markets tested at the end of 2013 compared to the end of 2014.
Sprint
’08 ’09 ’10 ’11 ’12 ’13 ’14 (CY)
Sprint Network Quality
ImprovedDropped call rate
32
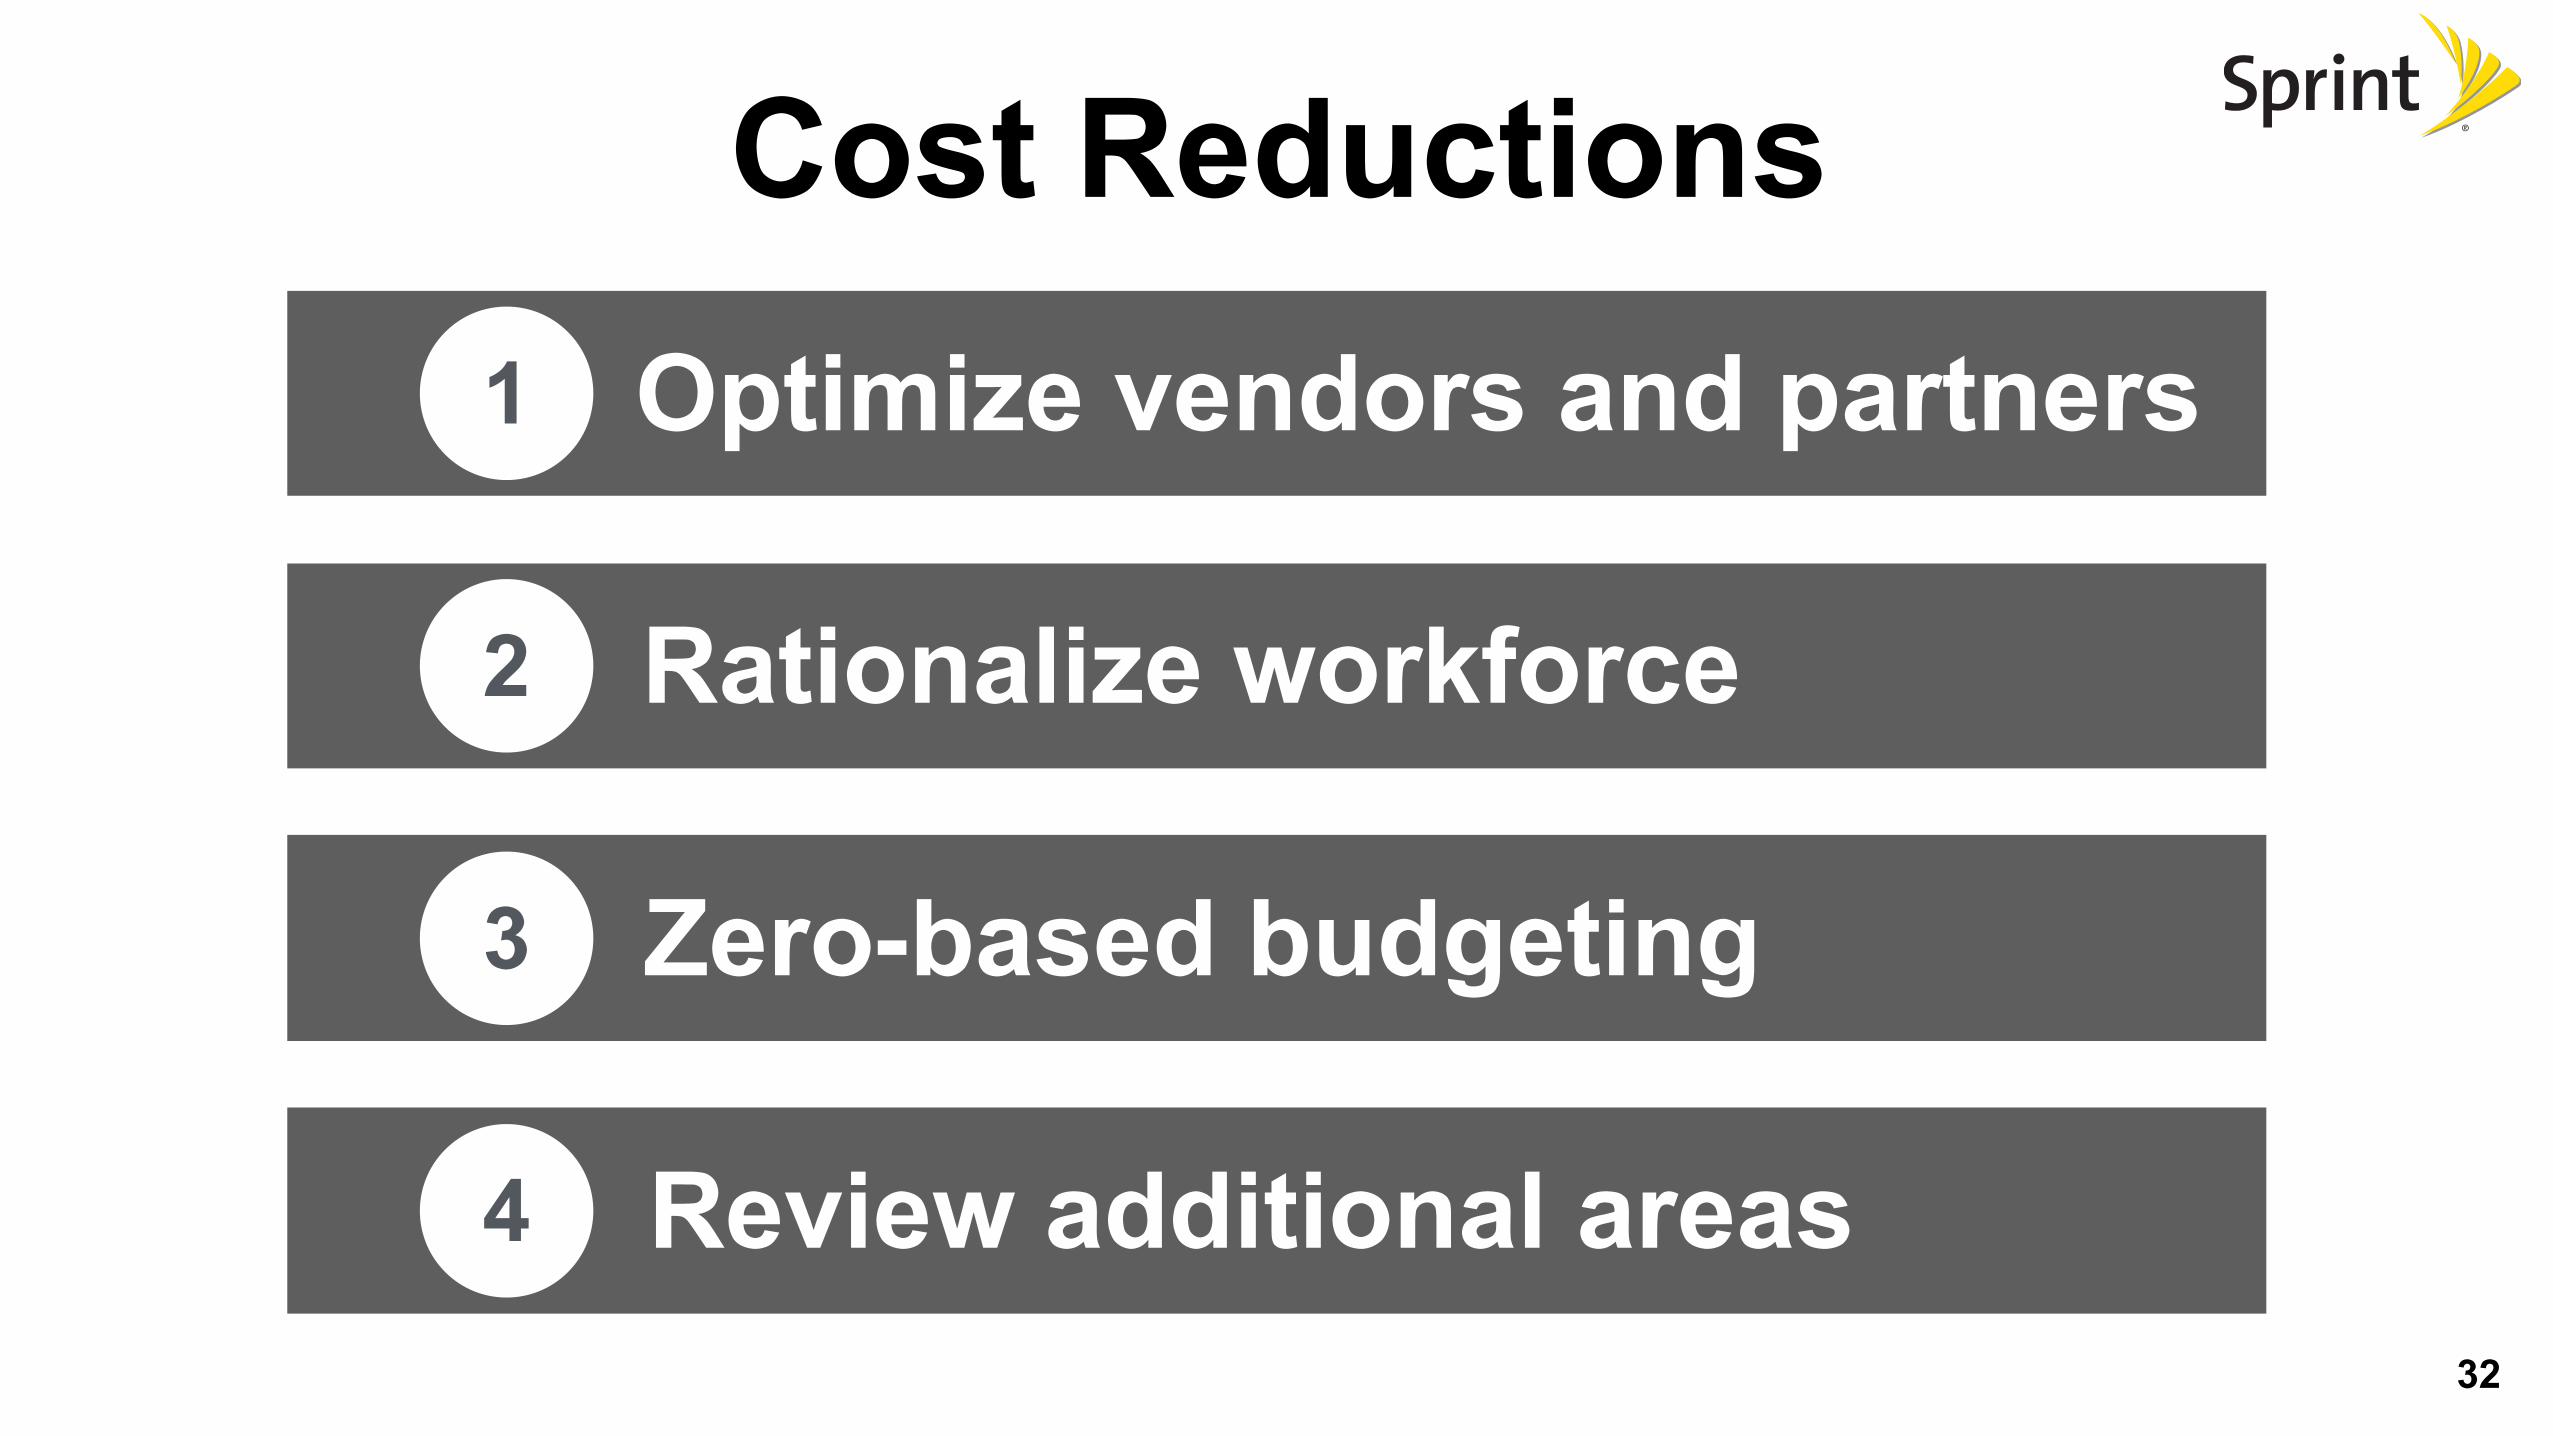
Cost ReductionsOptimize vendors and partners1
Rationalize workforce2
Zero-based budgeting3
Review additional areas4

33
Communications Internet
SoftBank Business Domains
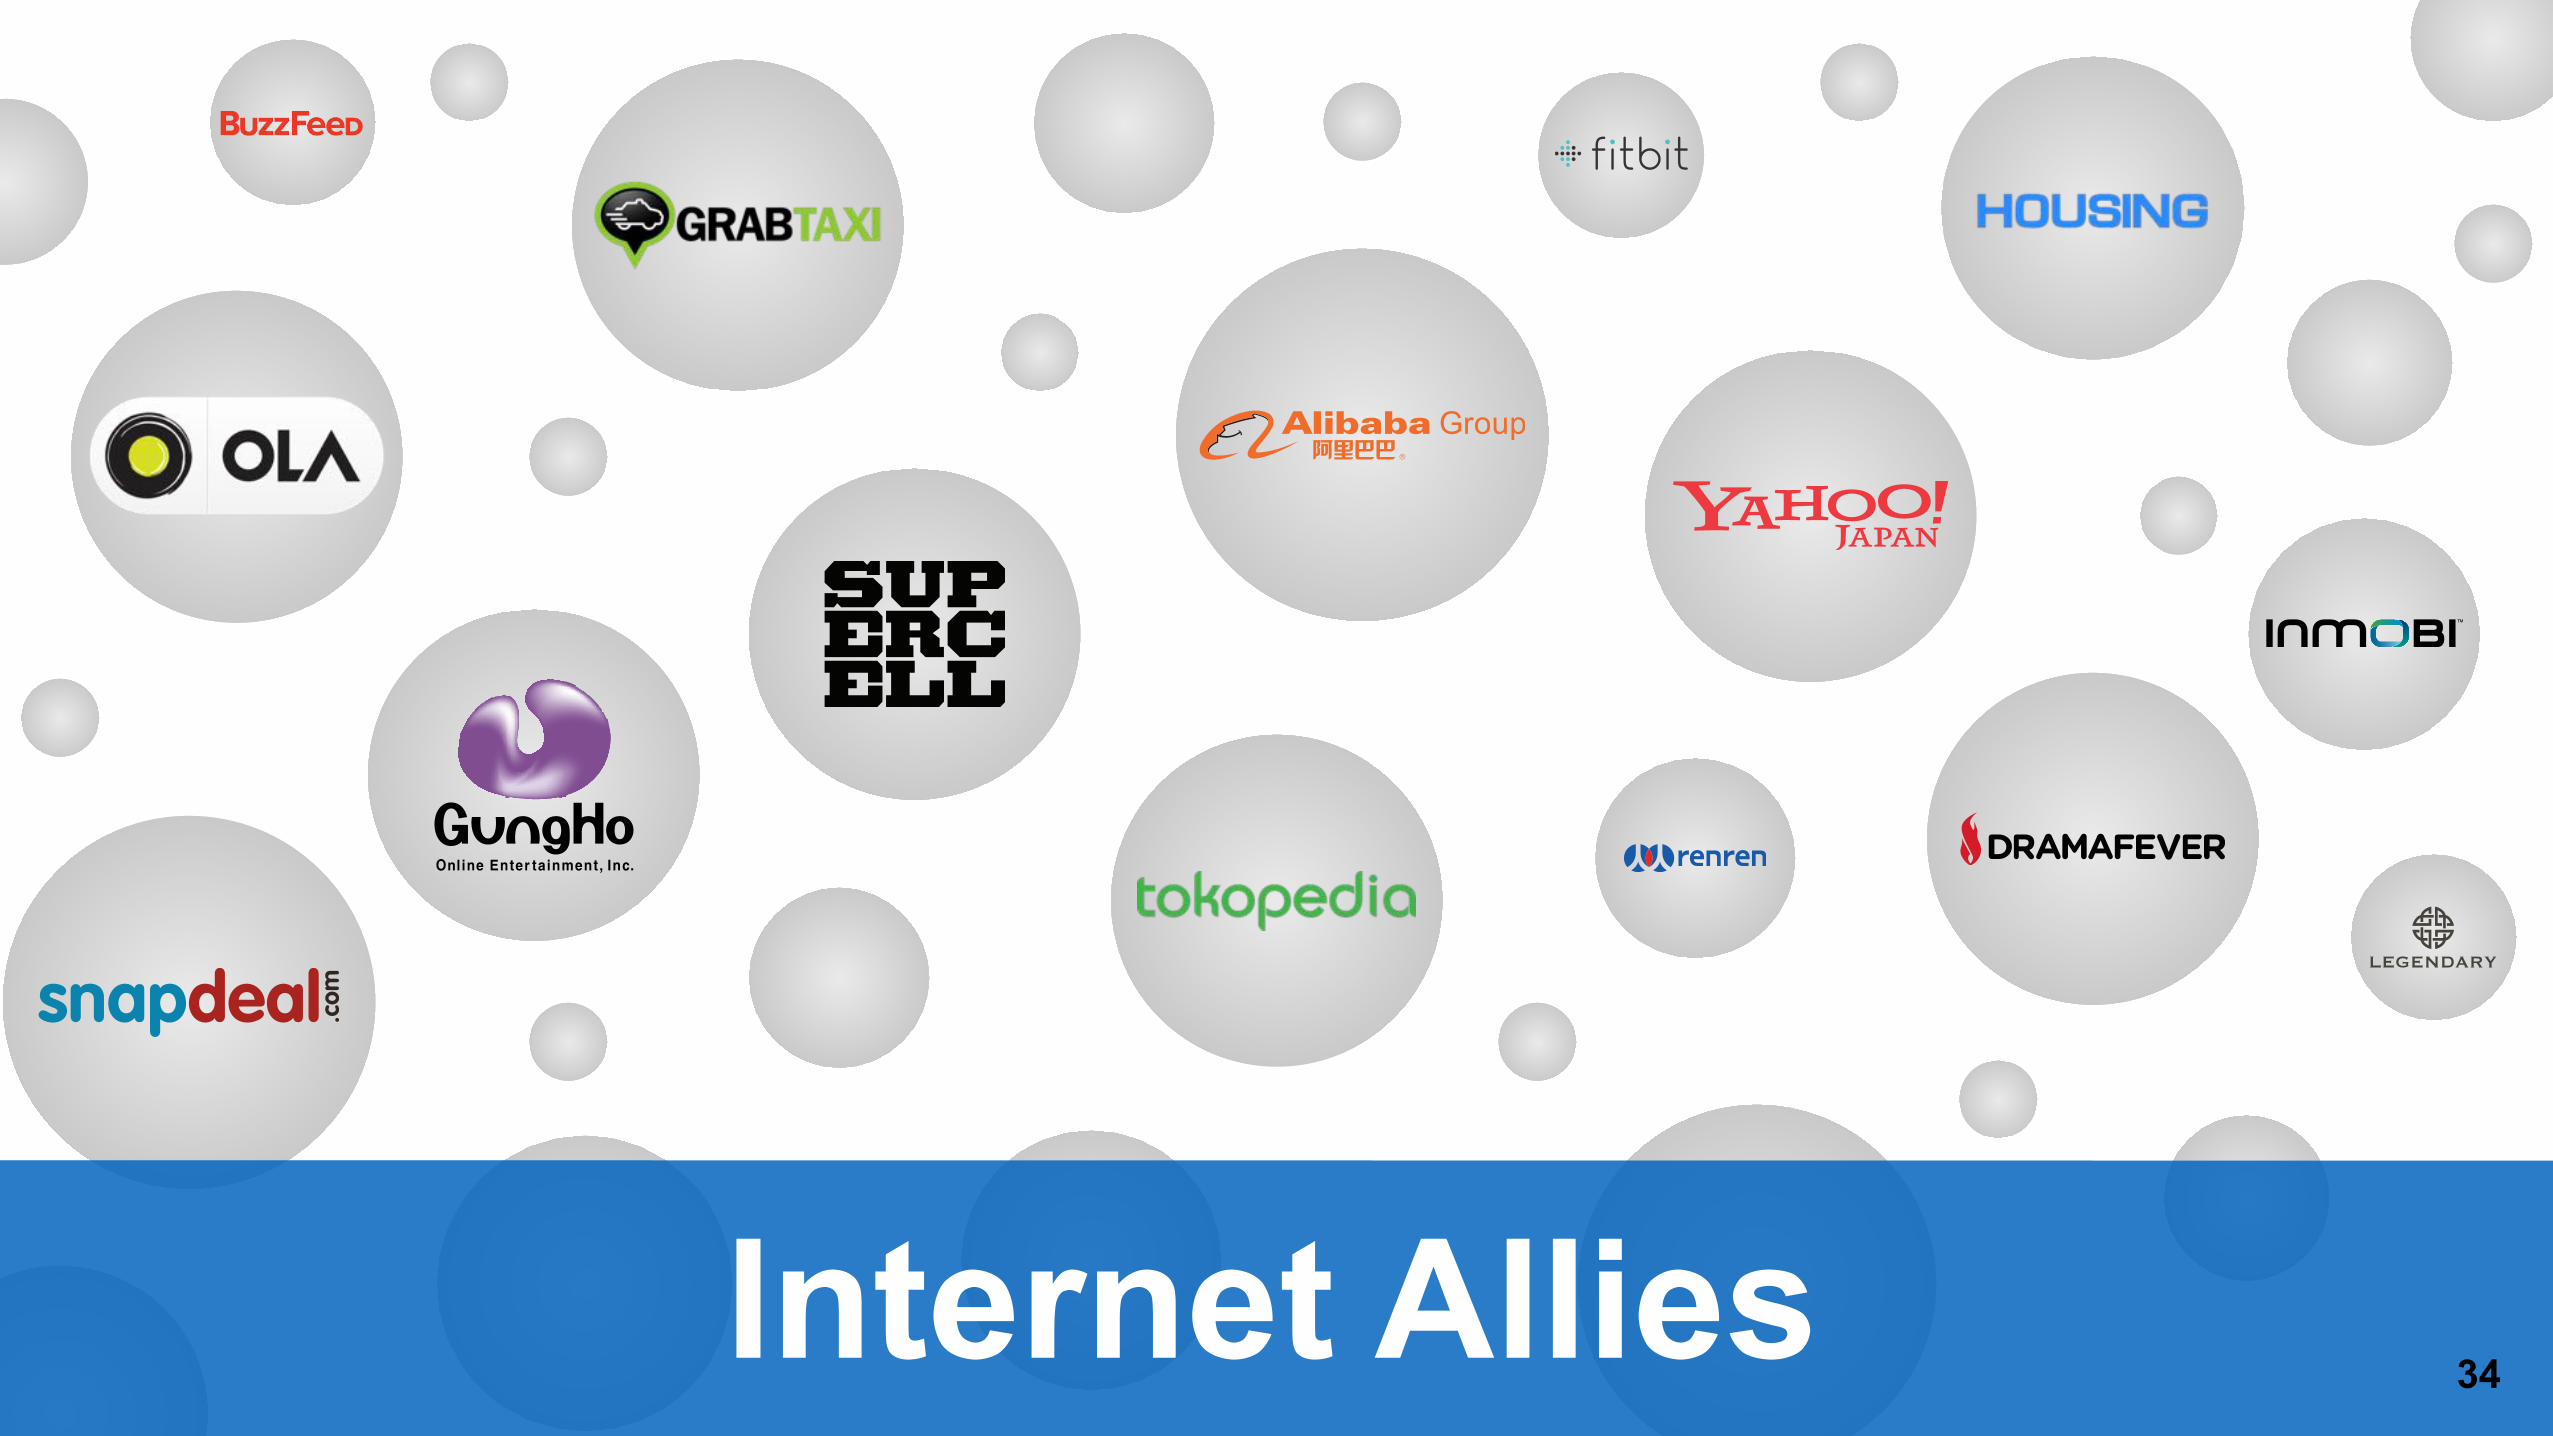
Internet Allies34
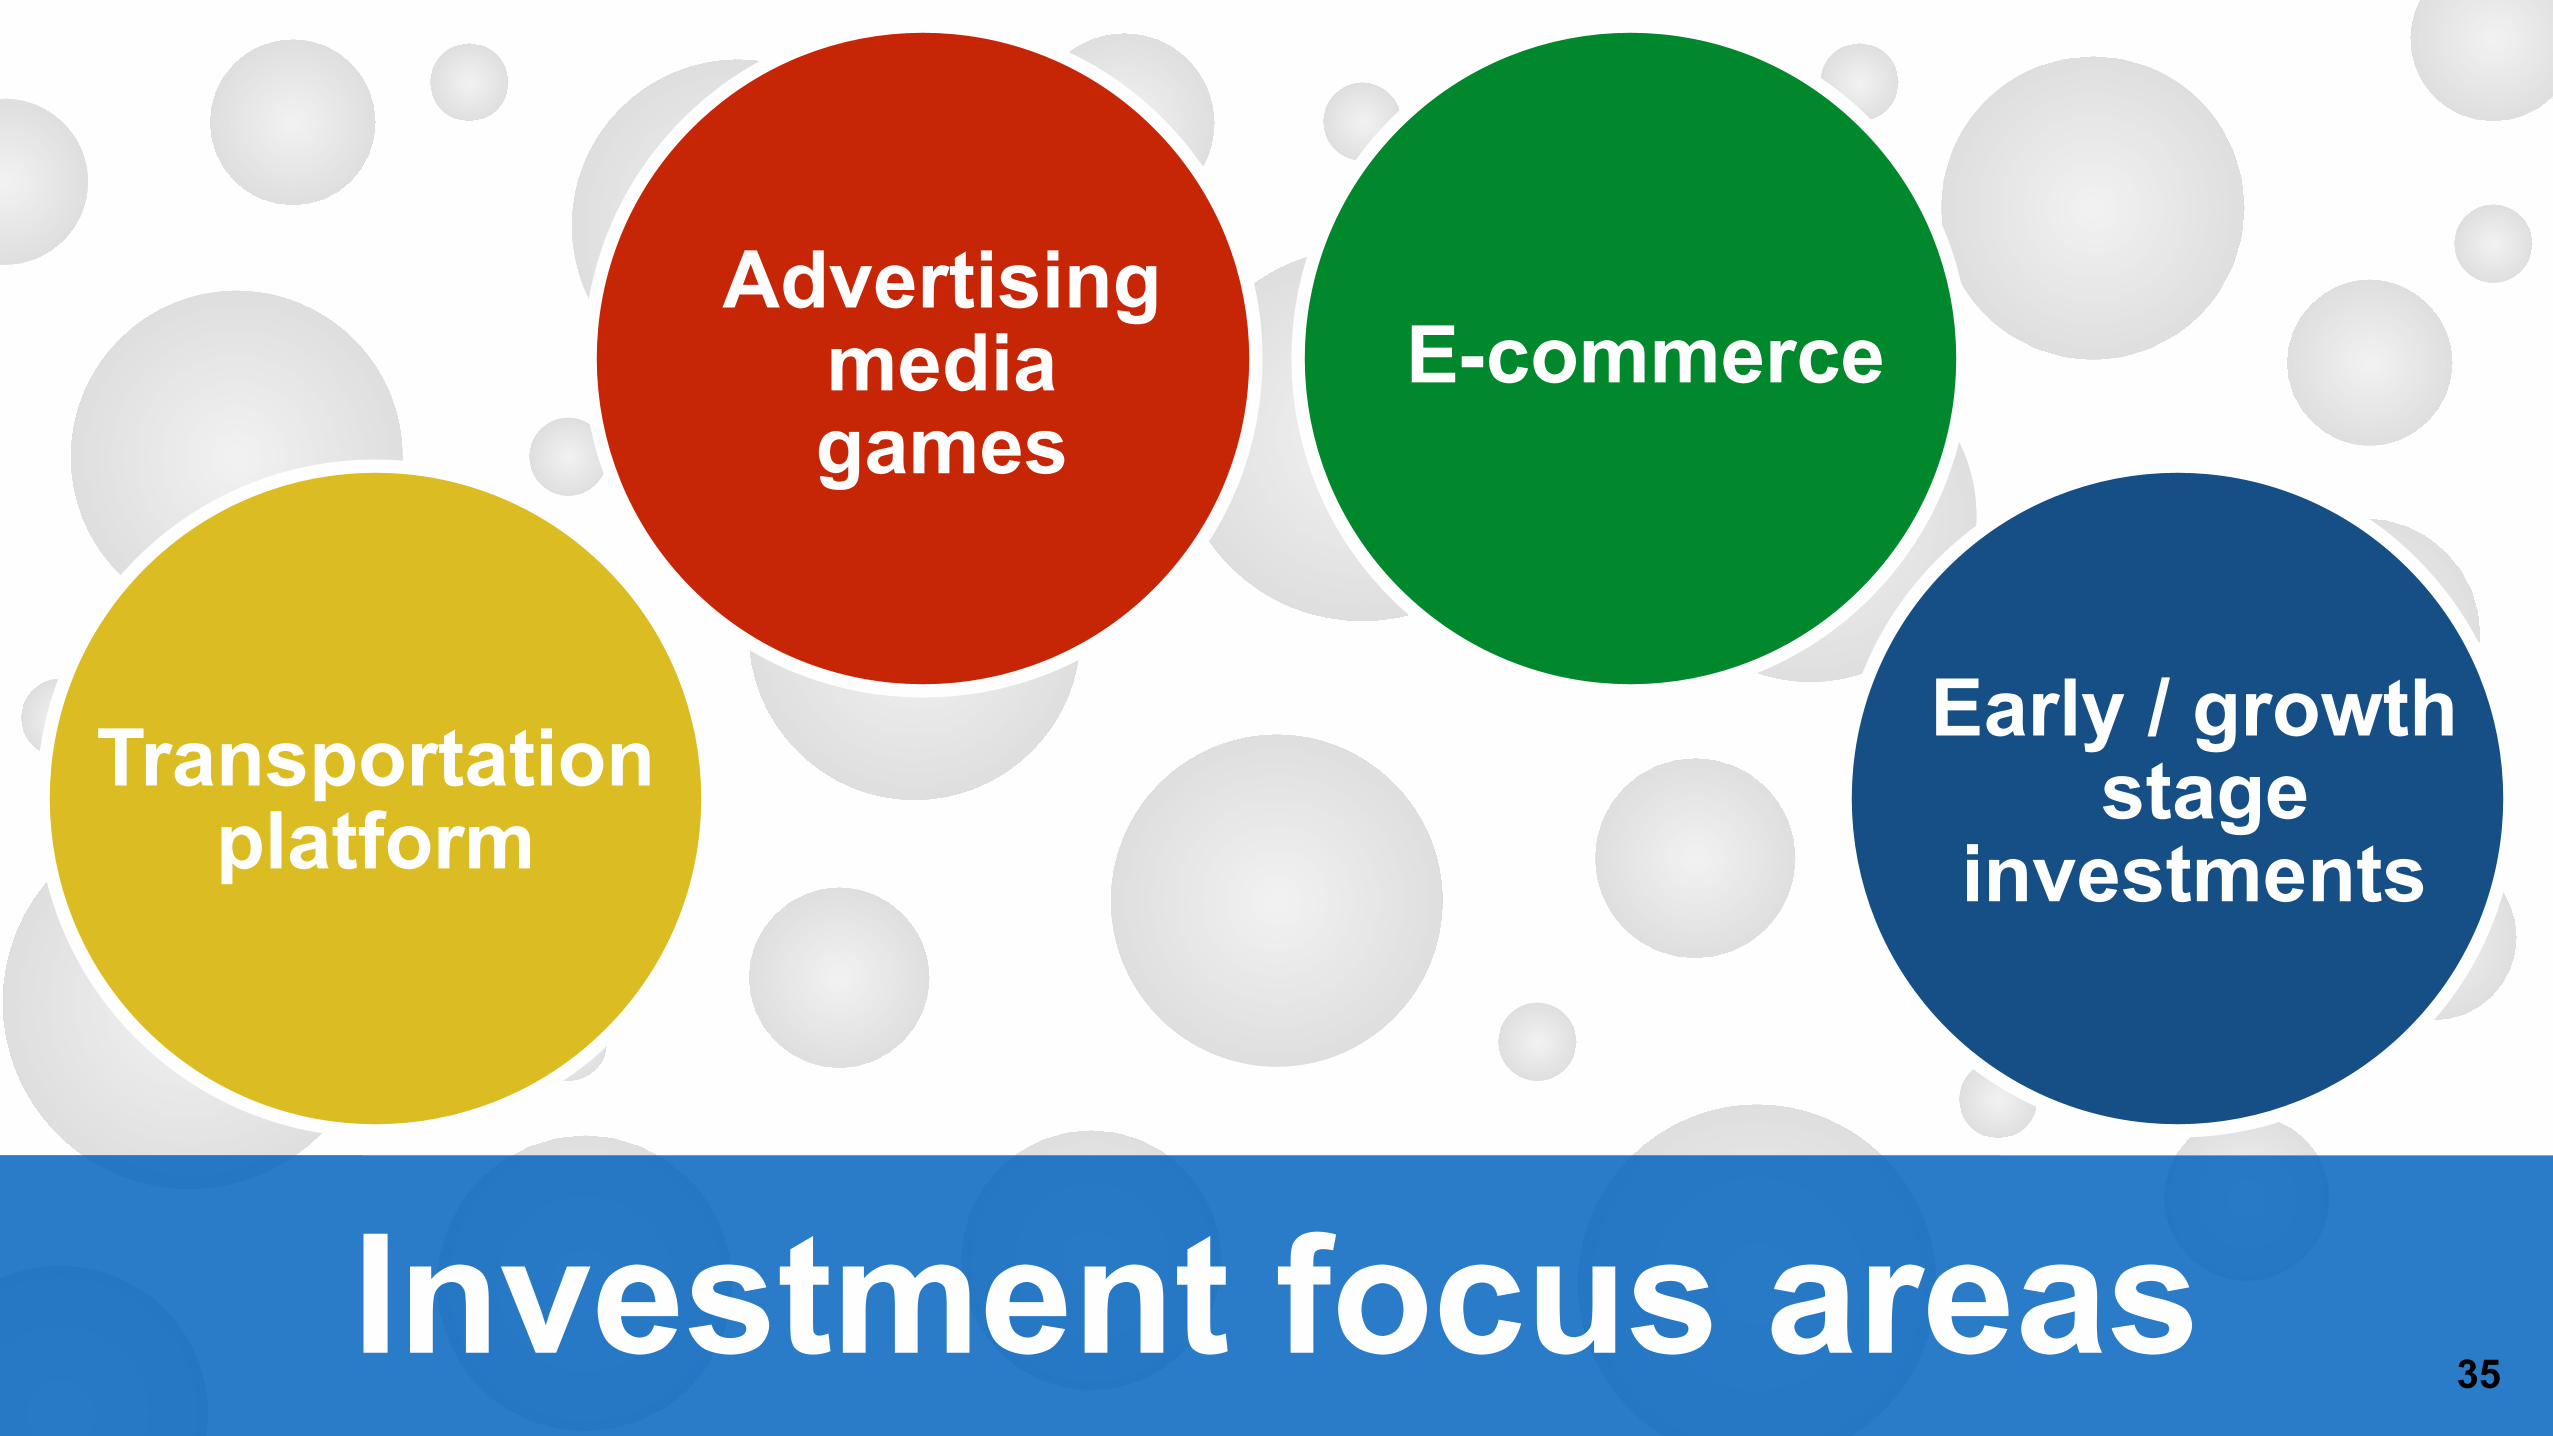
Transportation platform
Advertising media games
E-commerce
Early / growth stage
investments
Investment focus areas35

E-commerce
36Invest in growth regions
10t
20t
30t
40t
2007 Jan. - Dec.
’08 Jan. - Dec.
’09 Jan. - Dec.
’10 Jan. - Dec.
’11 Jan. - Dec.
’12 Jan. - Dec.
’13 Jan. - Dec.
’14 Jan. - Dec.
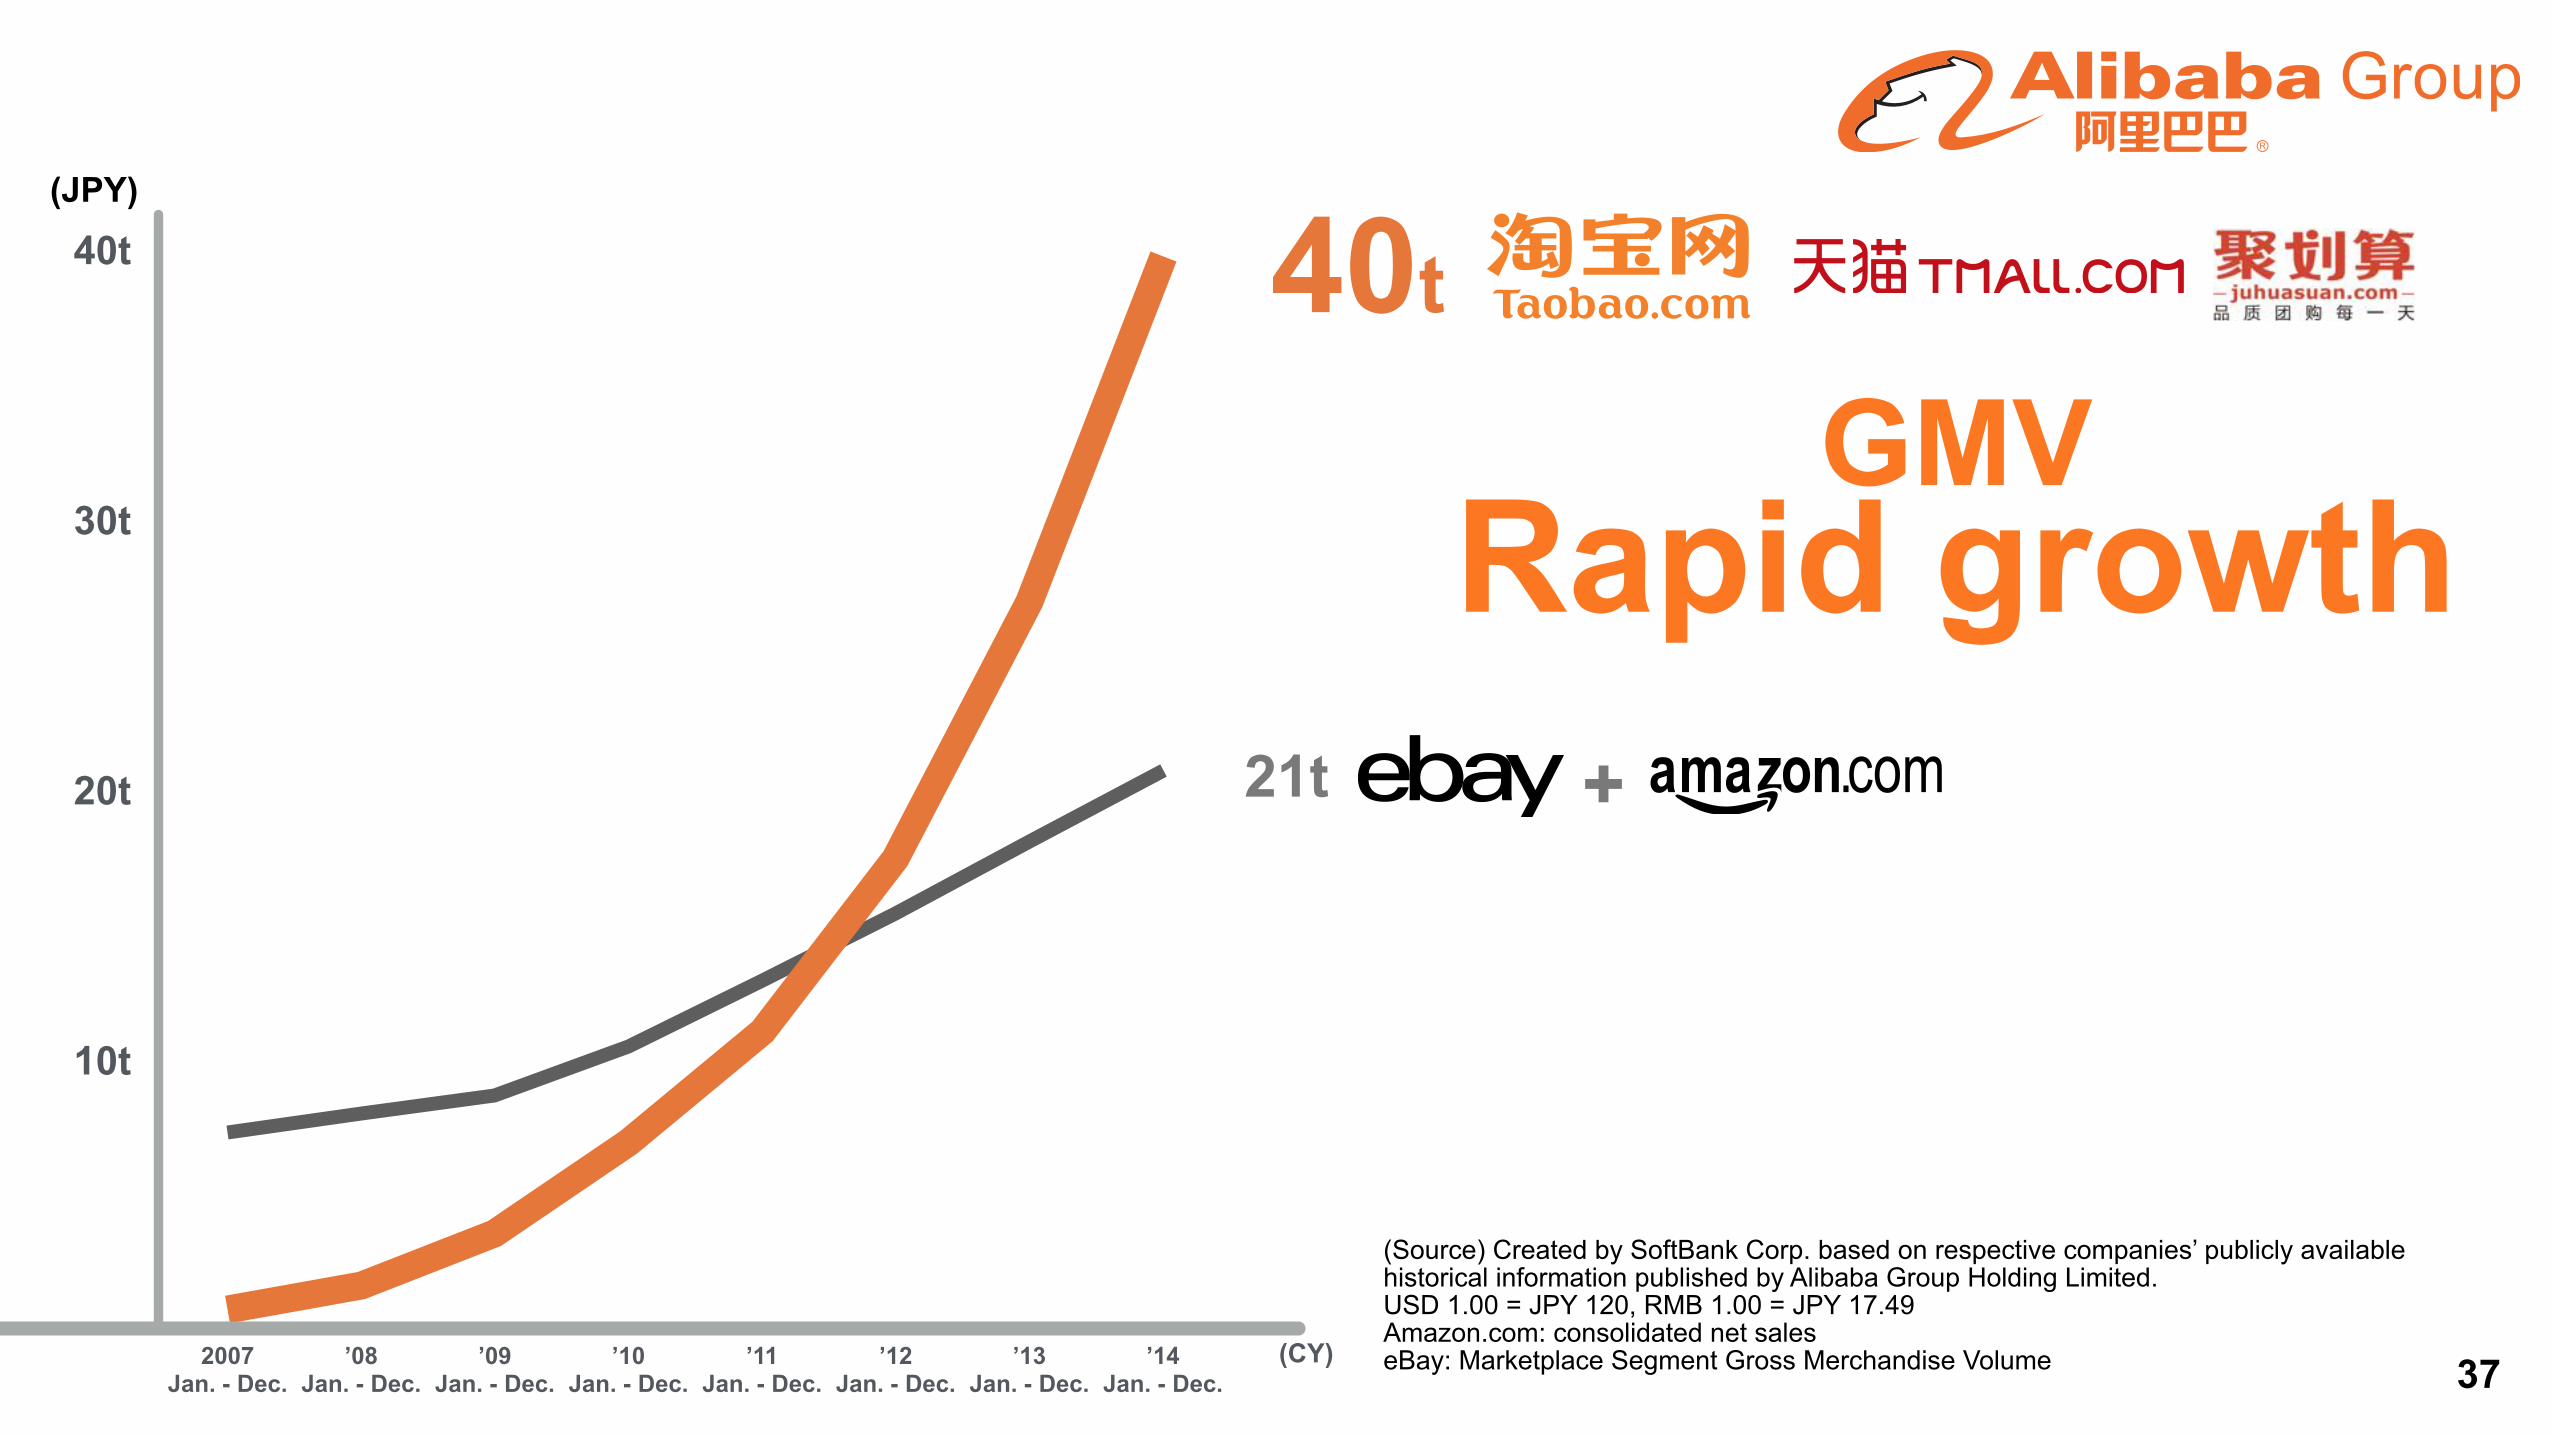
21t +
37
(Source) Created by SoftBank Corp. based on respective companies’ publicly available historical information published by Alibaba Group Holding Limited. USD 1.00 = JPY 120, RMB 1.00 = JPY 17.49 Amazon.com: consolidated net sales eBay: Marketplace Segment Gross Merchandise Volume(CY)
GMVRapid growth
40t(JPY)
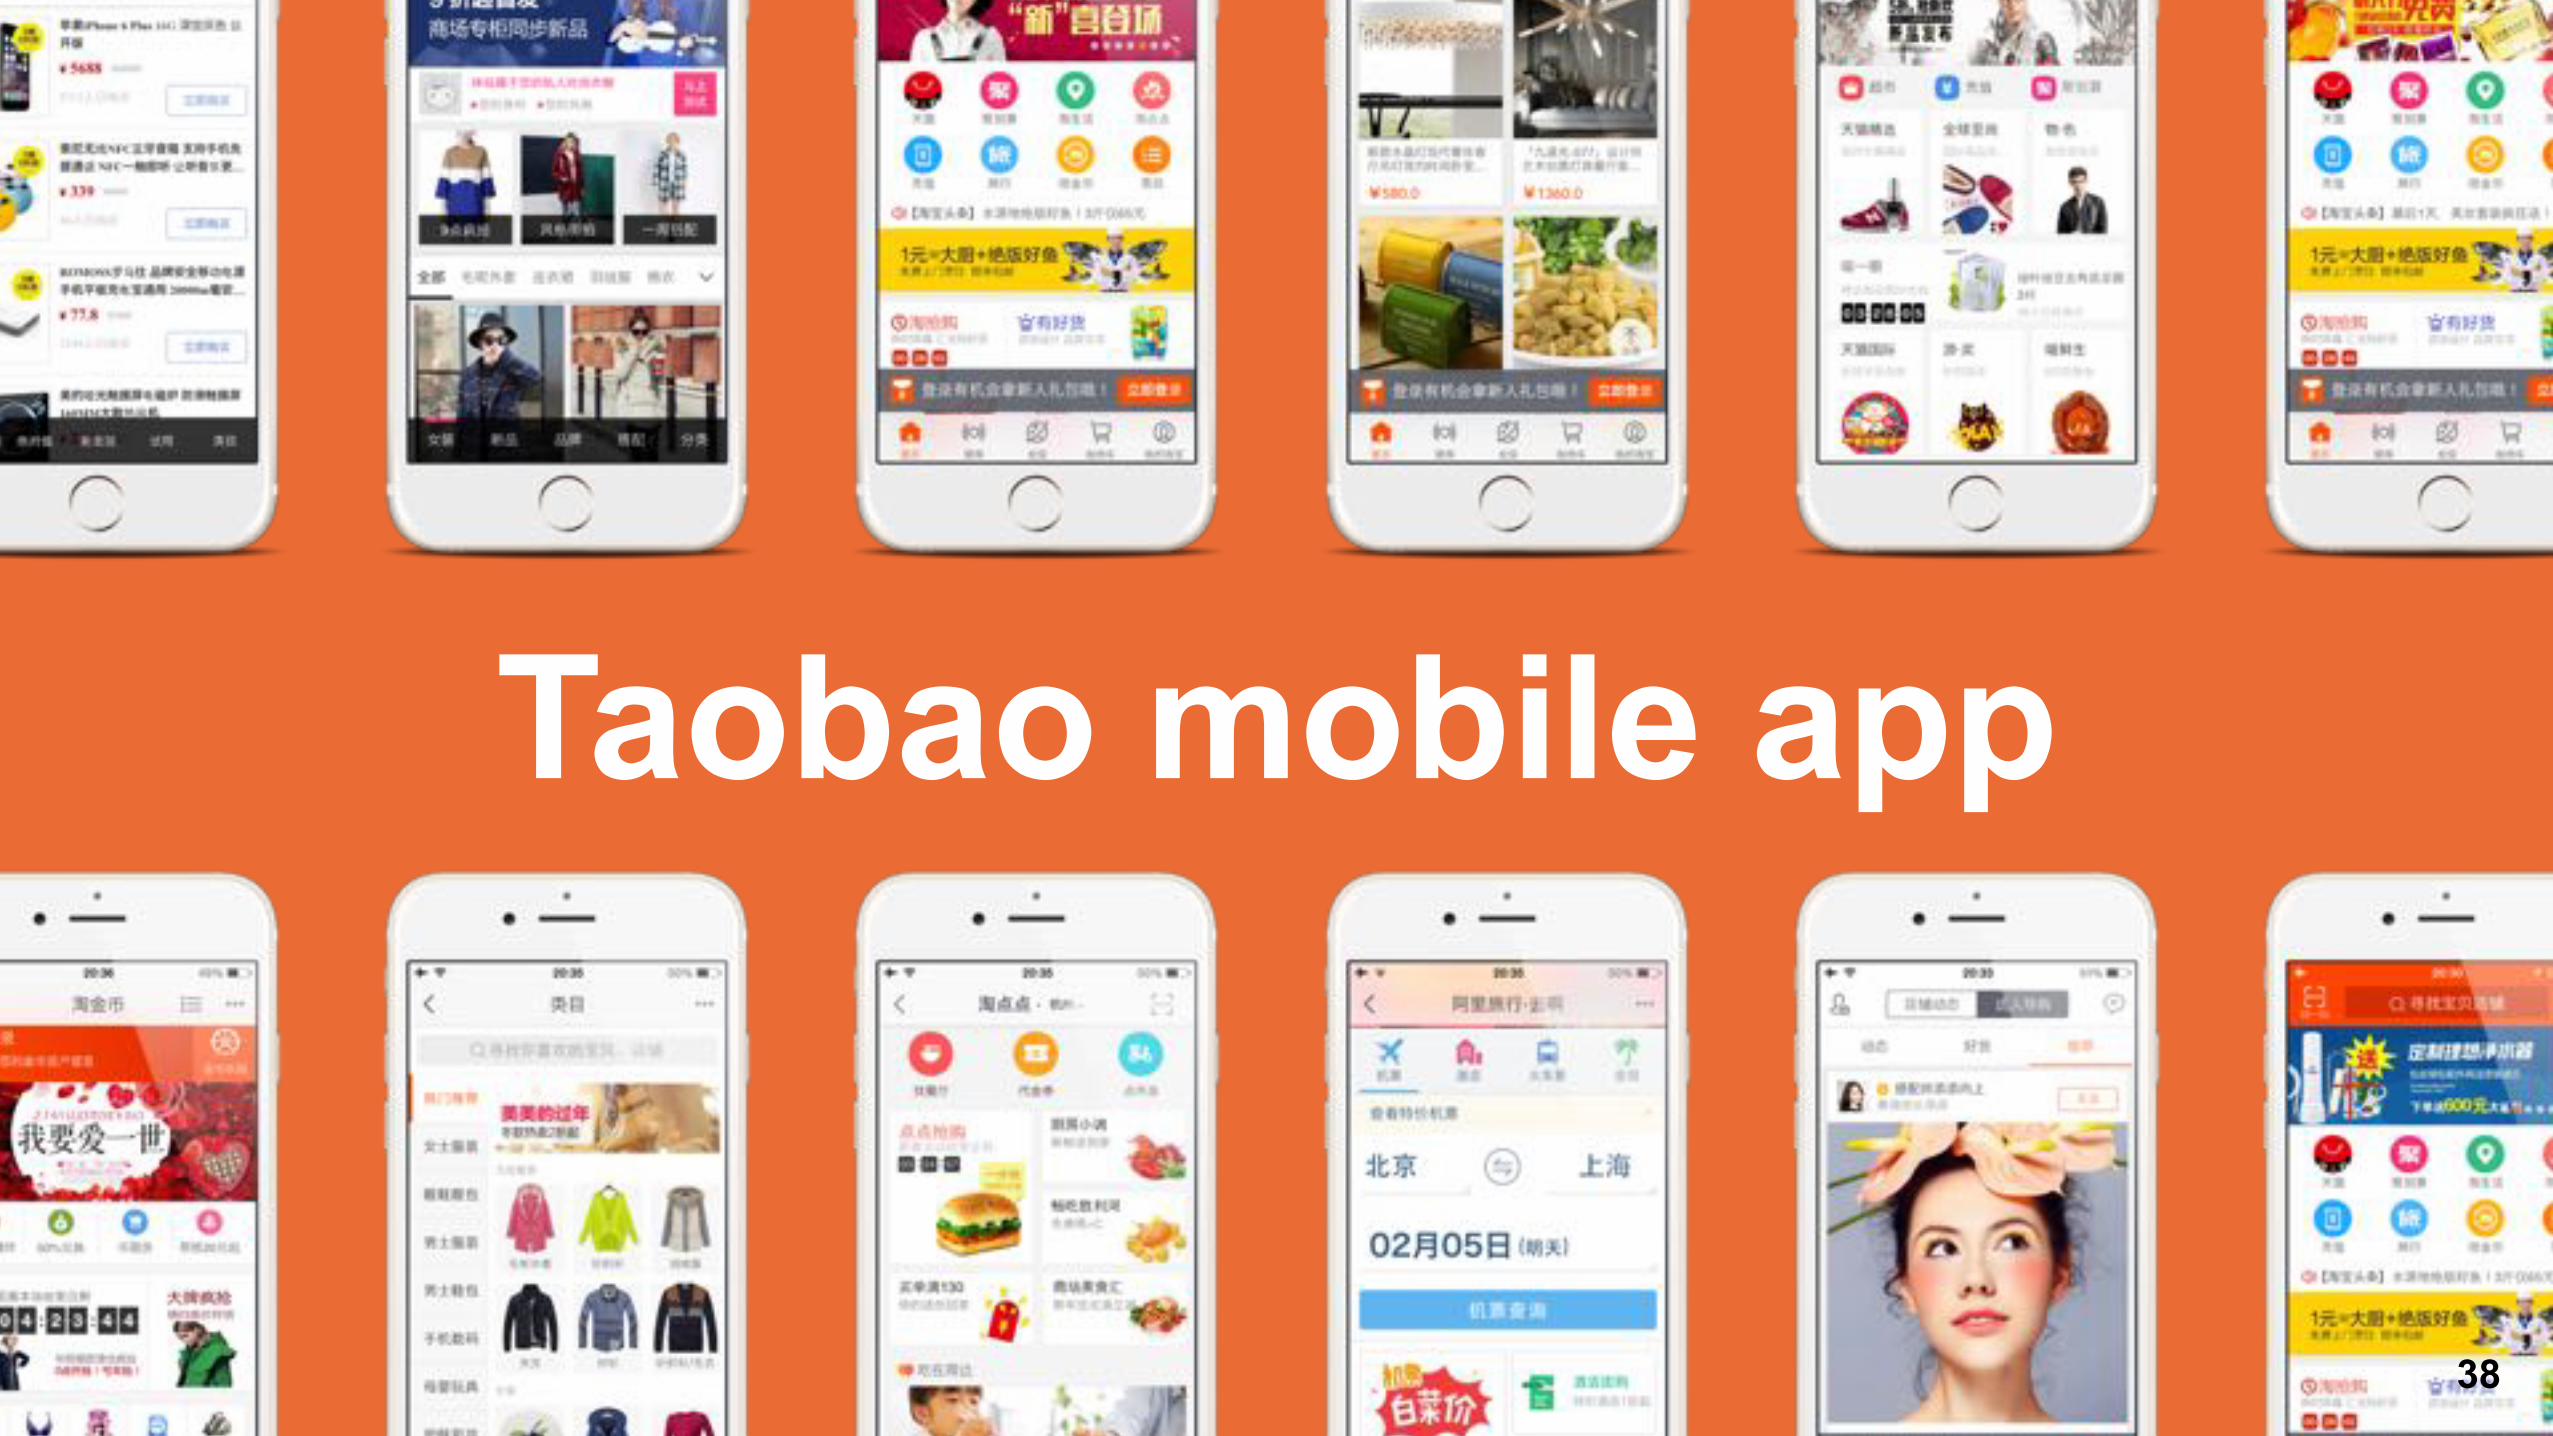
Taobao mobile app
38
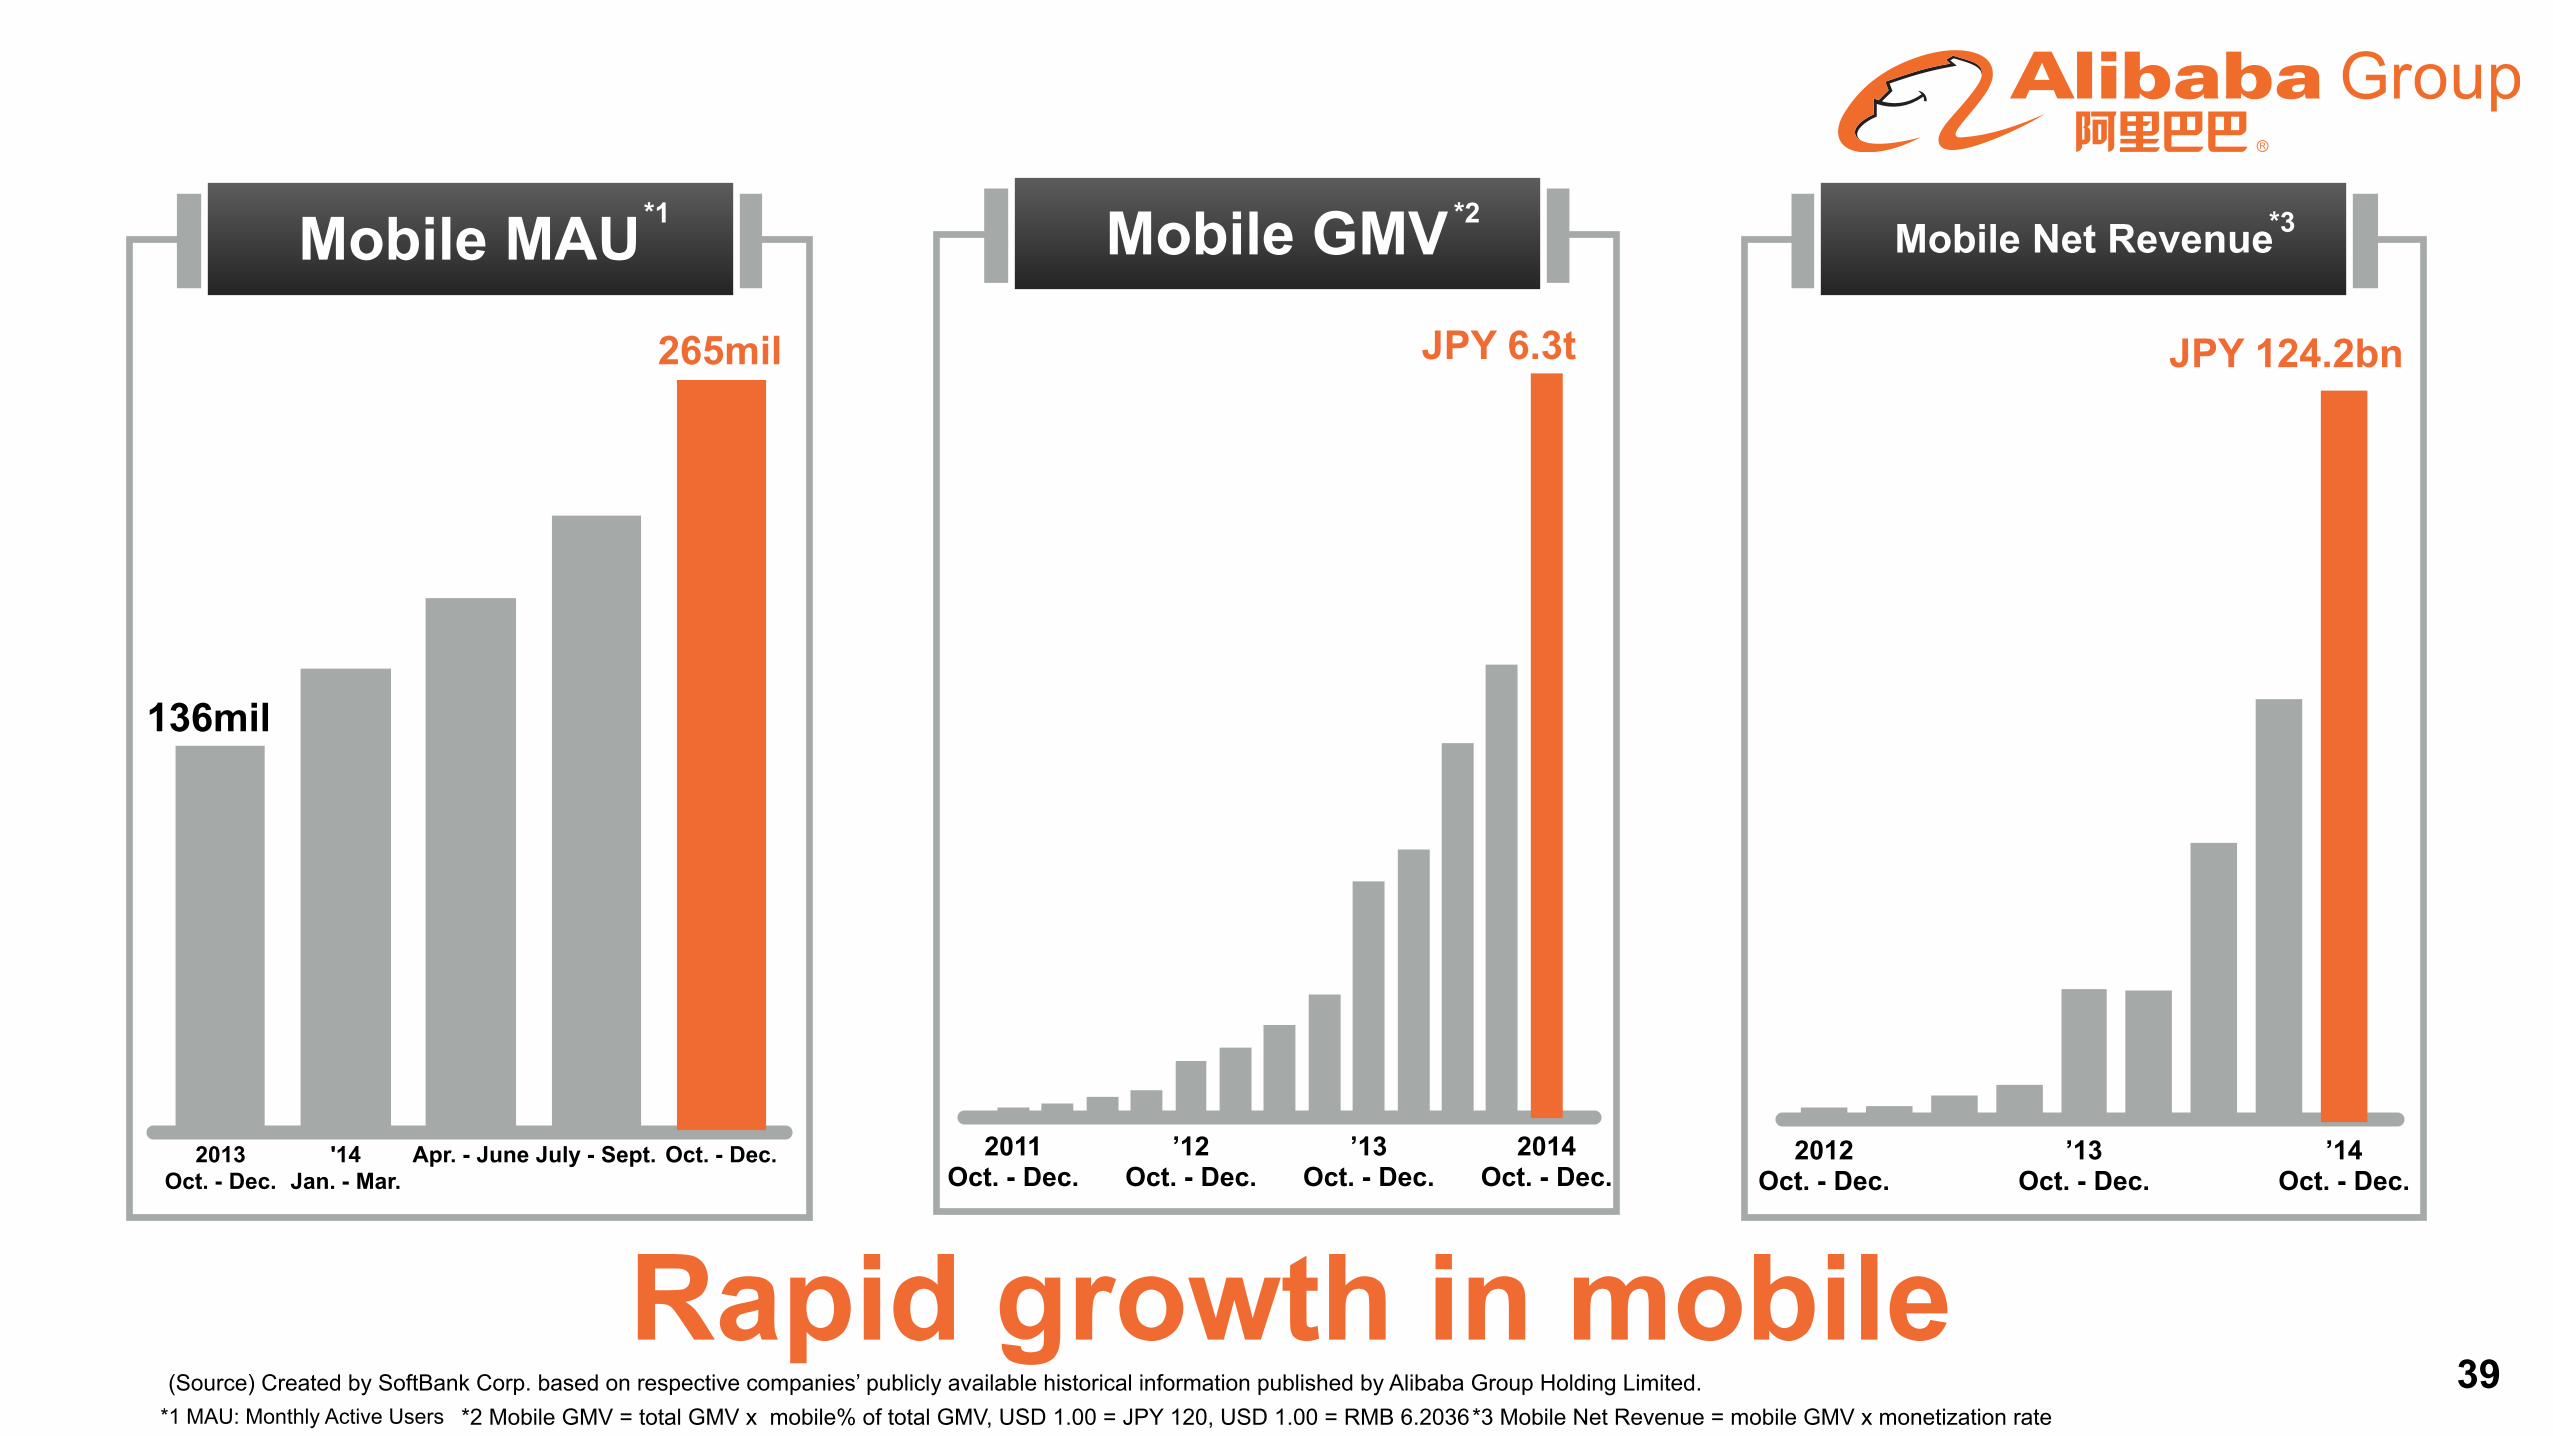
39Rapid growth in mobile
*2 Mobile GMV = total GMV x mobile% of total GMV, USD 1.00 = JPY 120, USD 1.00 = RMB 6.2036*1 MAU: Monthly Active Users *3 Mobile Net Revenue = mobile GMV x monetization rate
*3
2011 Oct. - Dec.
’12 Oct. - Dec.
’13 Oct. - Dec.
2014 Oct. - Dec.
Mobile GMV*2
JPY 6.3t
2013 Oct. - Dec.
'14 Jan. - Mar.
Apr. - June July - Sept. Oct. - Dec.
*1Mobile MAU*1
265mil
136mil
2012 Oct. - Dec.
’13 Oct. - Dec.
’14 Oct. - Dec.
*3
Mobile Net Revenue
JPY 124.2bn
*3
(Source) Created by SoftBank Corp. based on respective companies’ publicly available historical information published by Alibaba Group Holding Limited.

40
No.1 online marketplace
in India

41
No.1 online marketplace in Indonesia
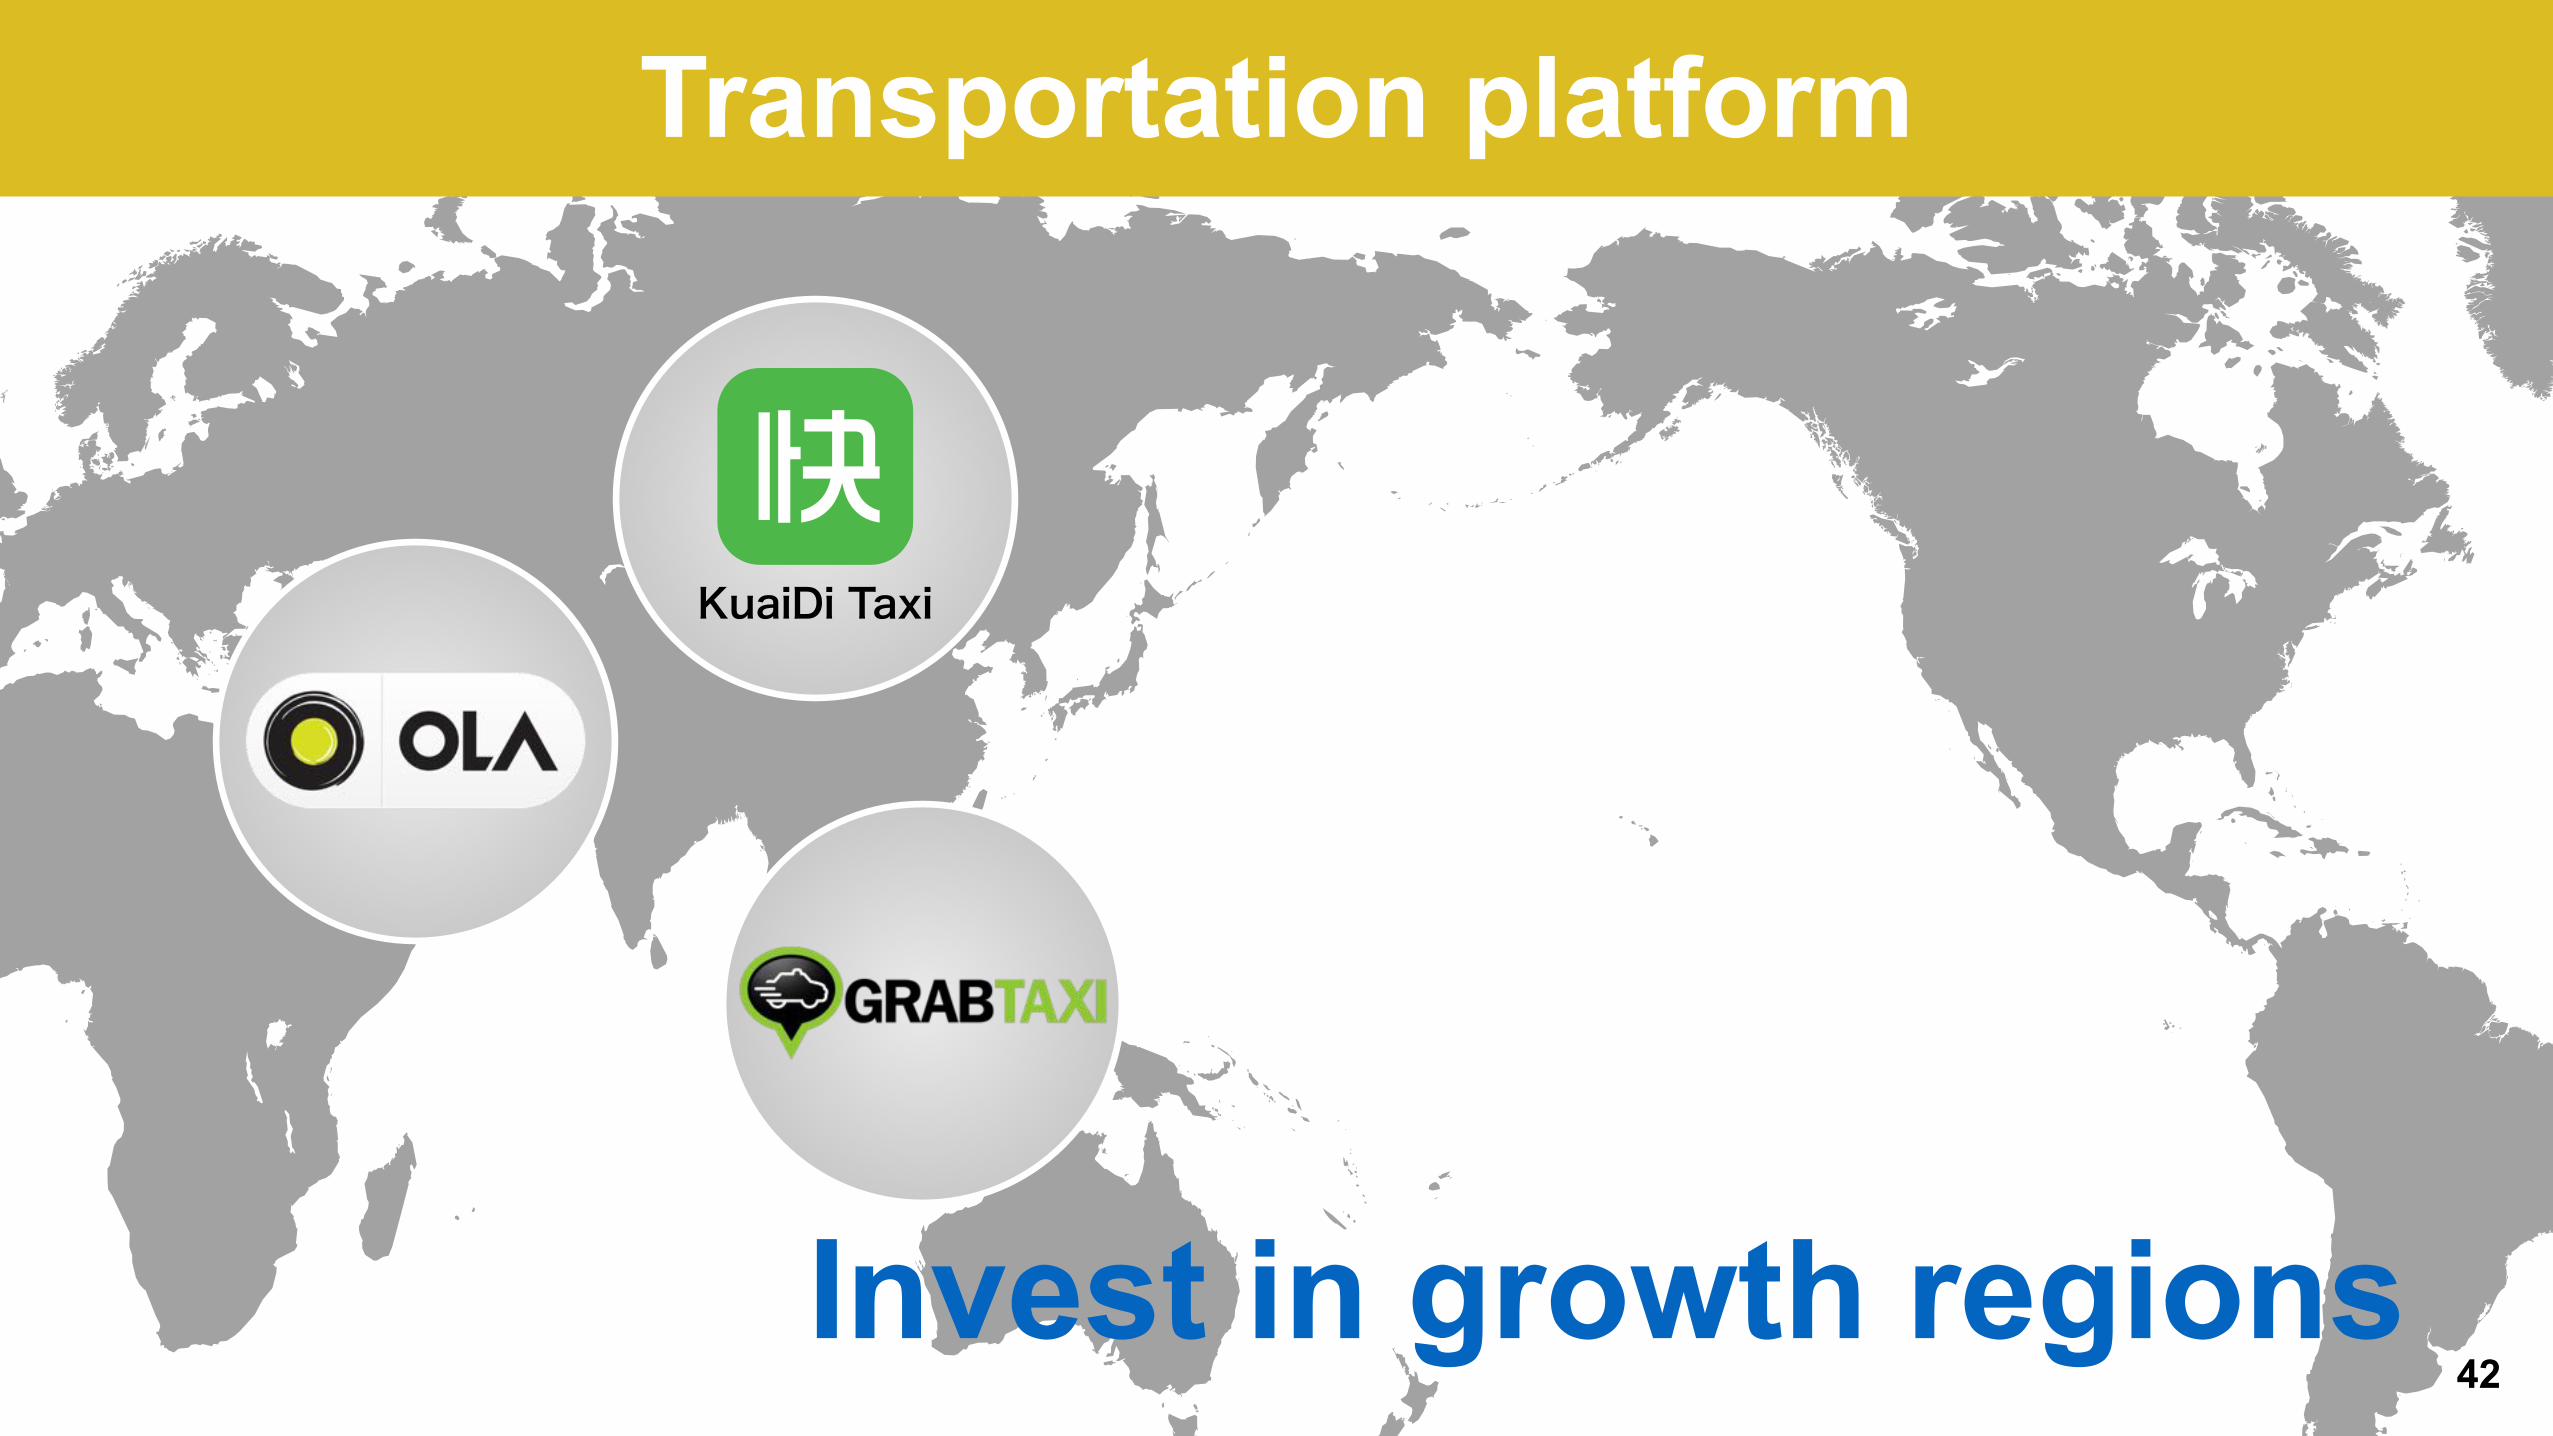
Transportation platform
42
KuaiDi Taxi
Invest in growth regions
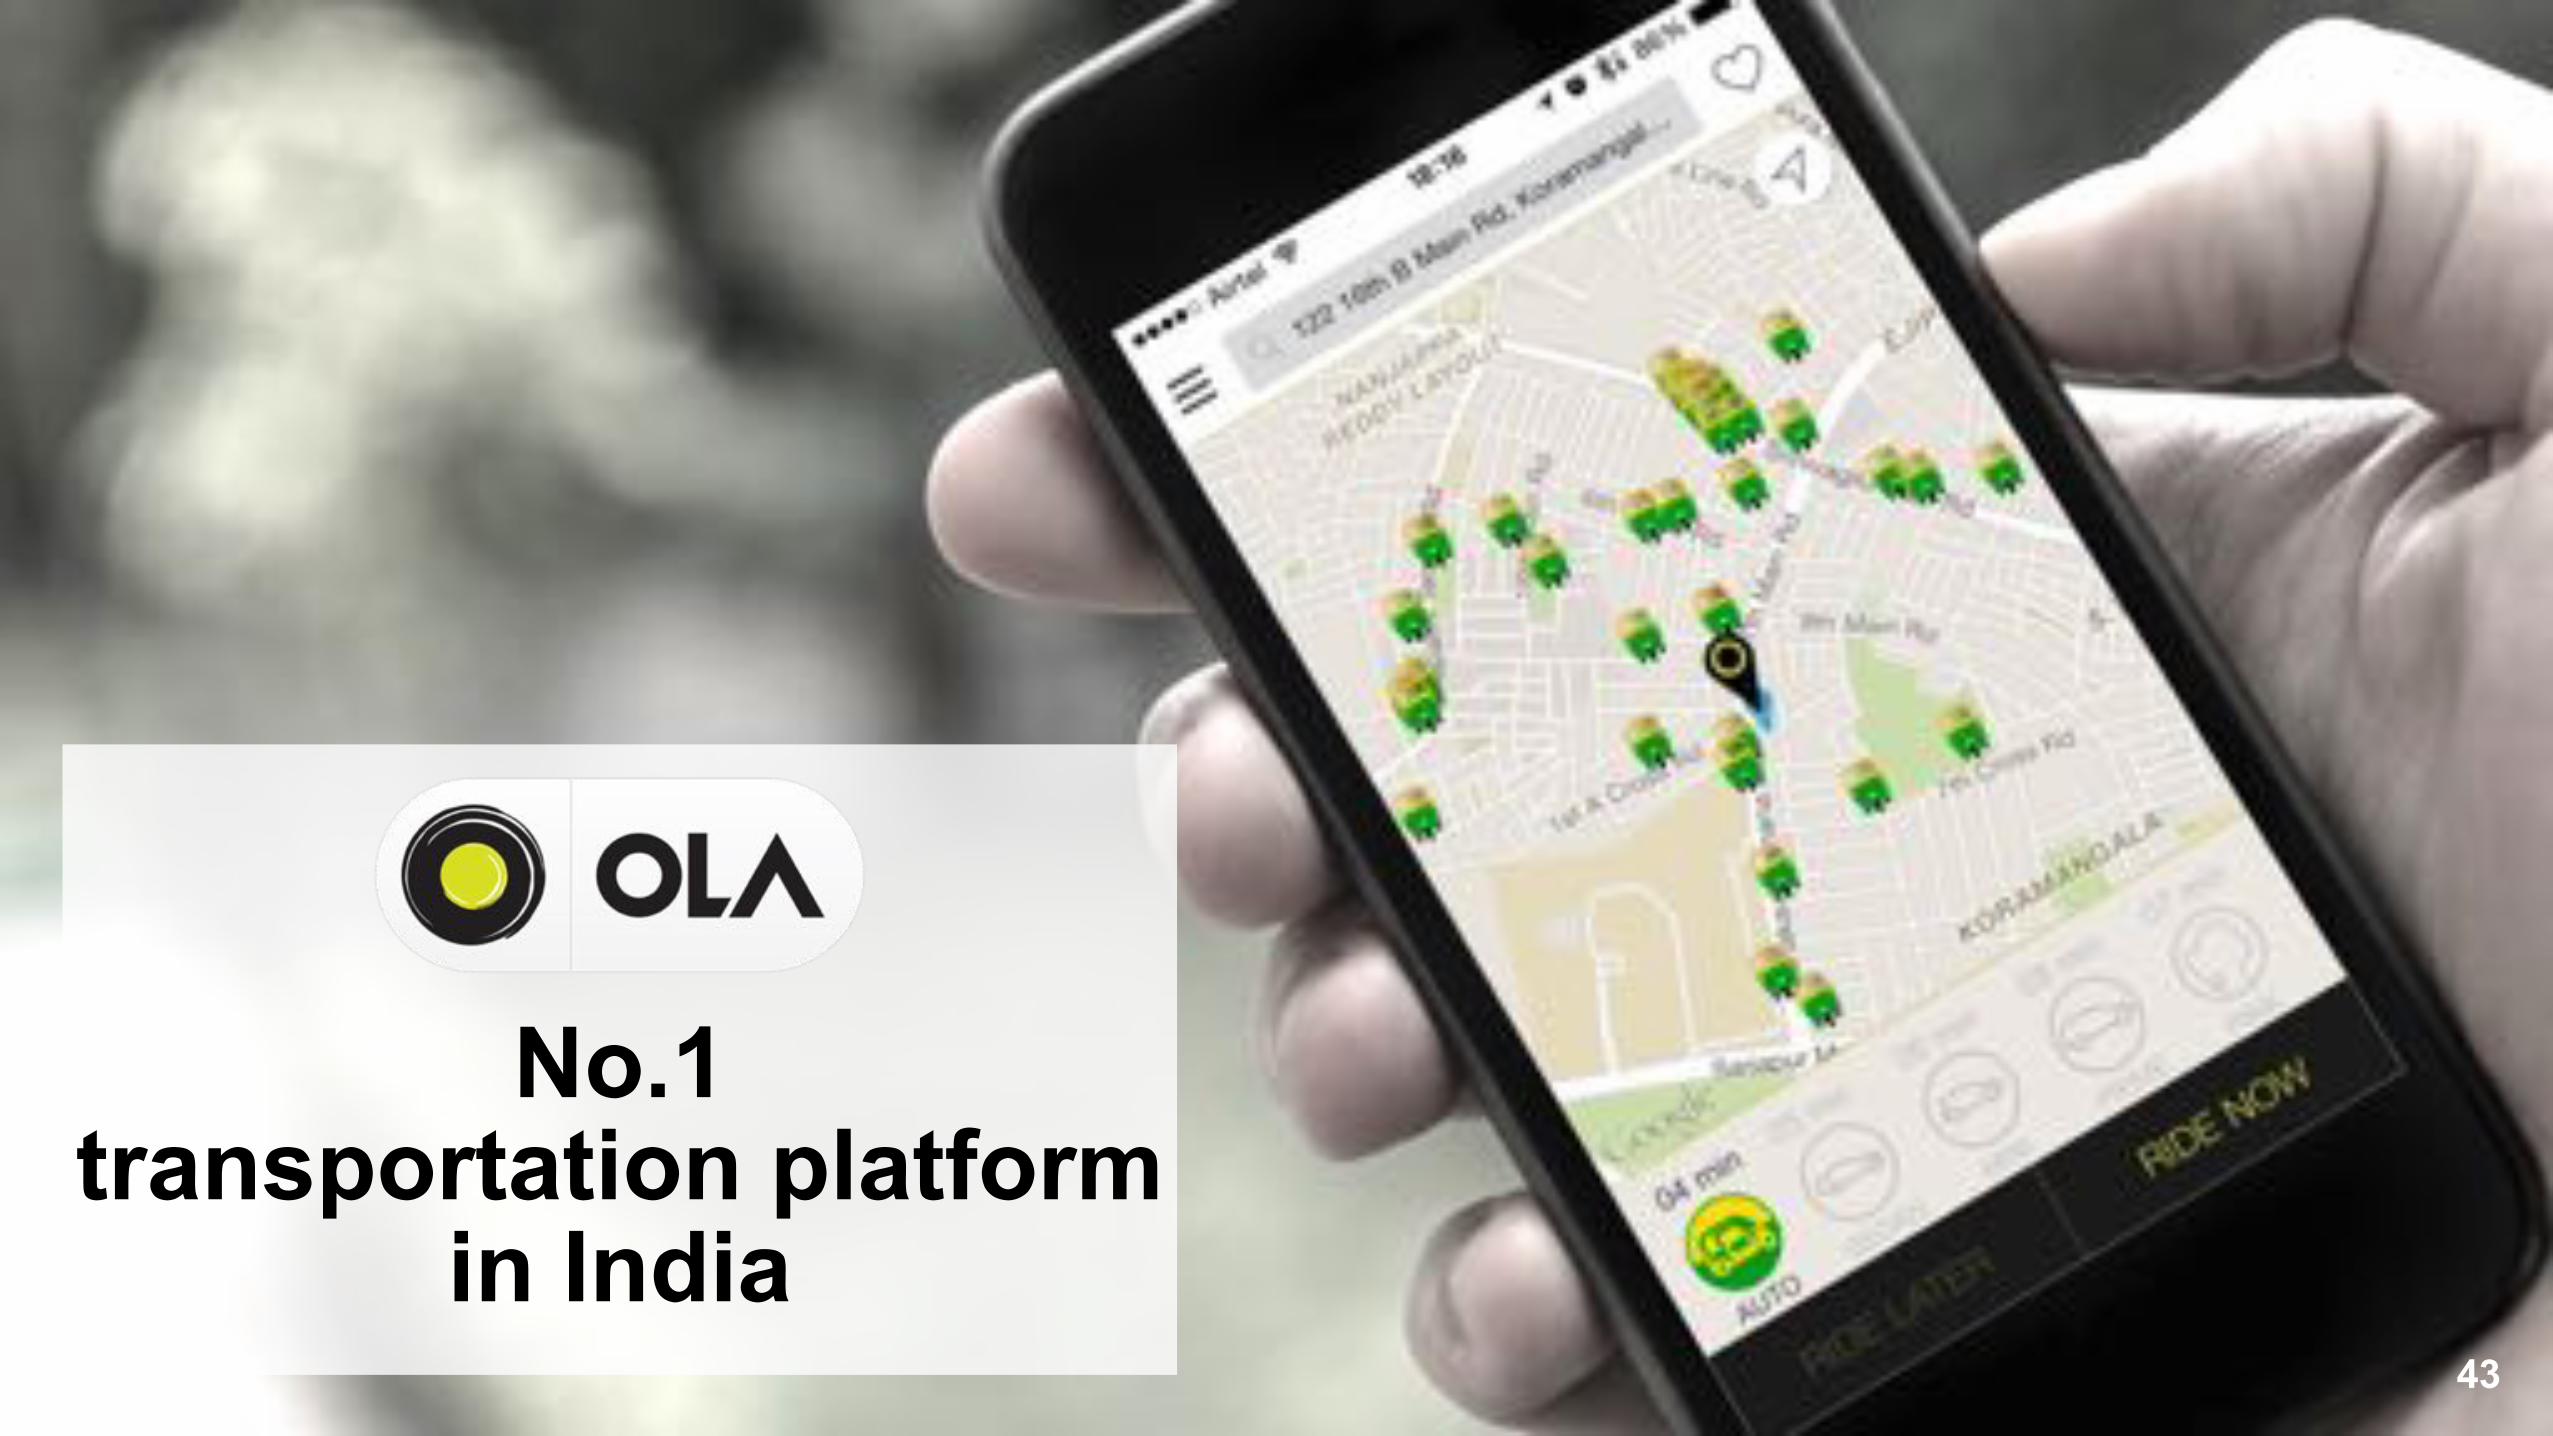
43
No.1 transportation platform
in India

44
No.1 transportation platform
in Southeast Asia

45
KuaiDi Taxi
No.1 transportation platform
in China
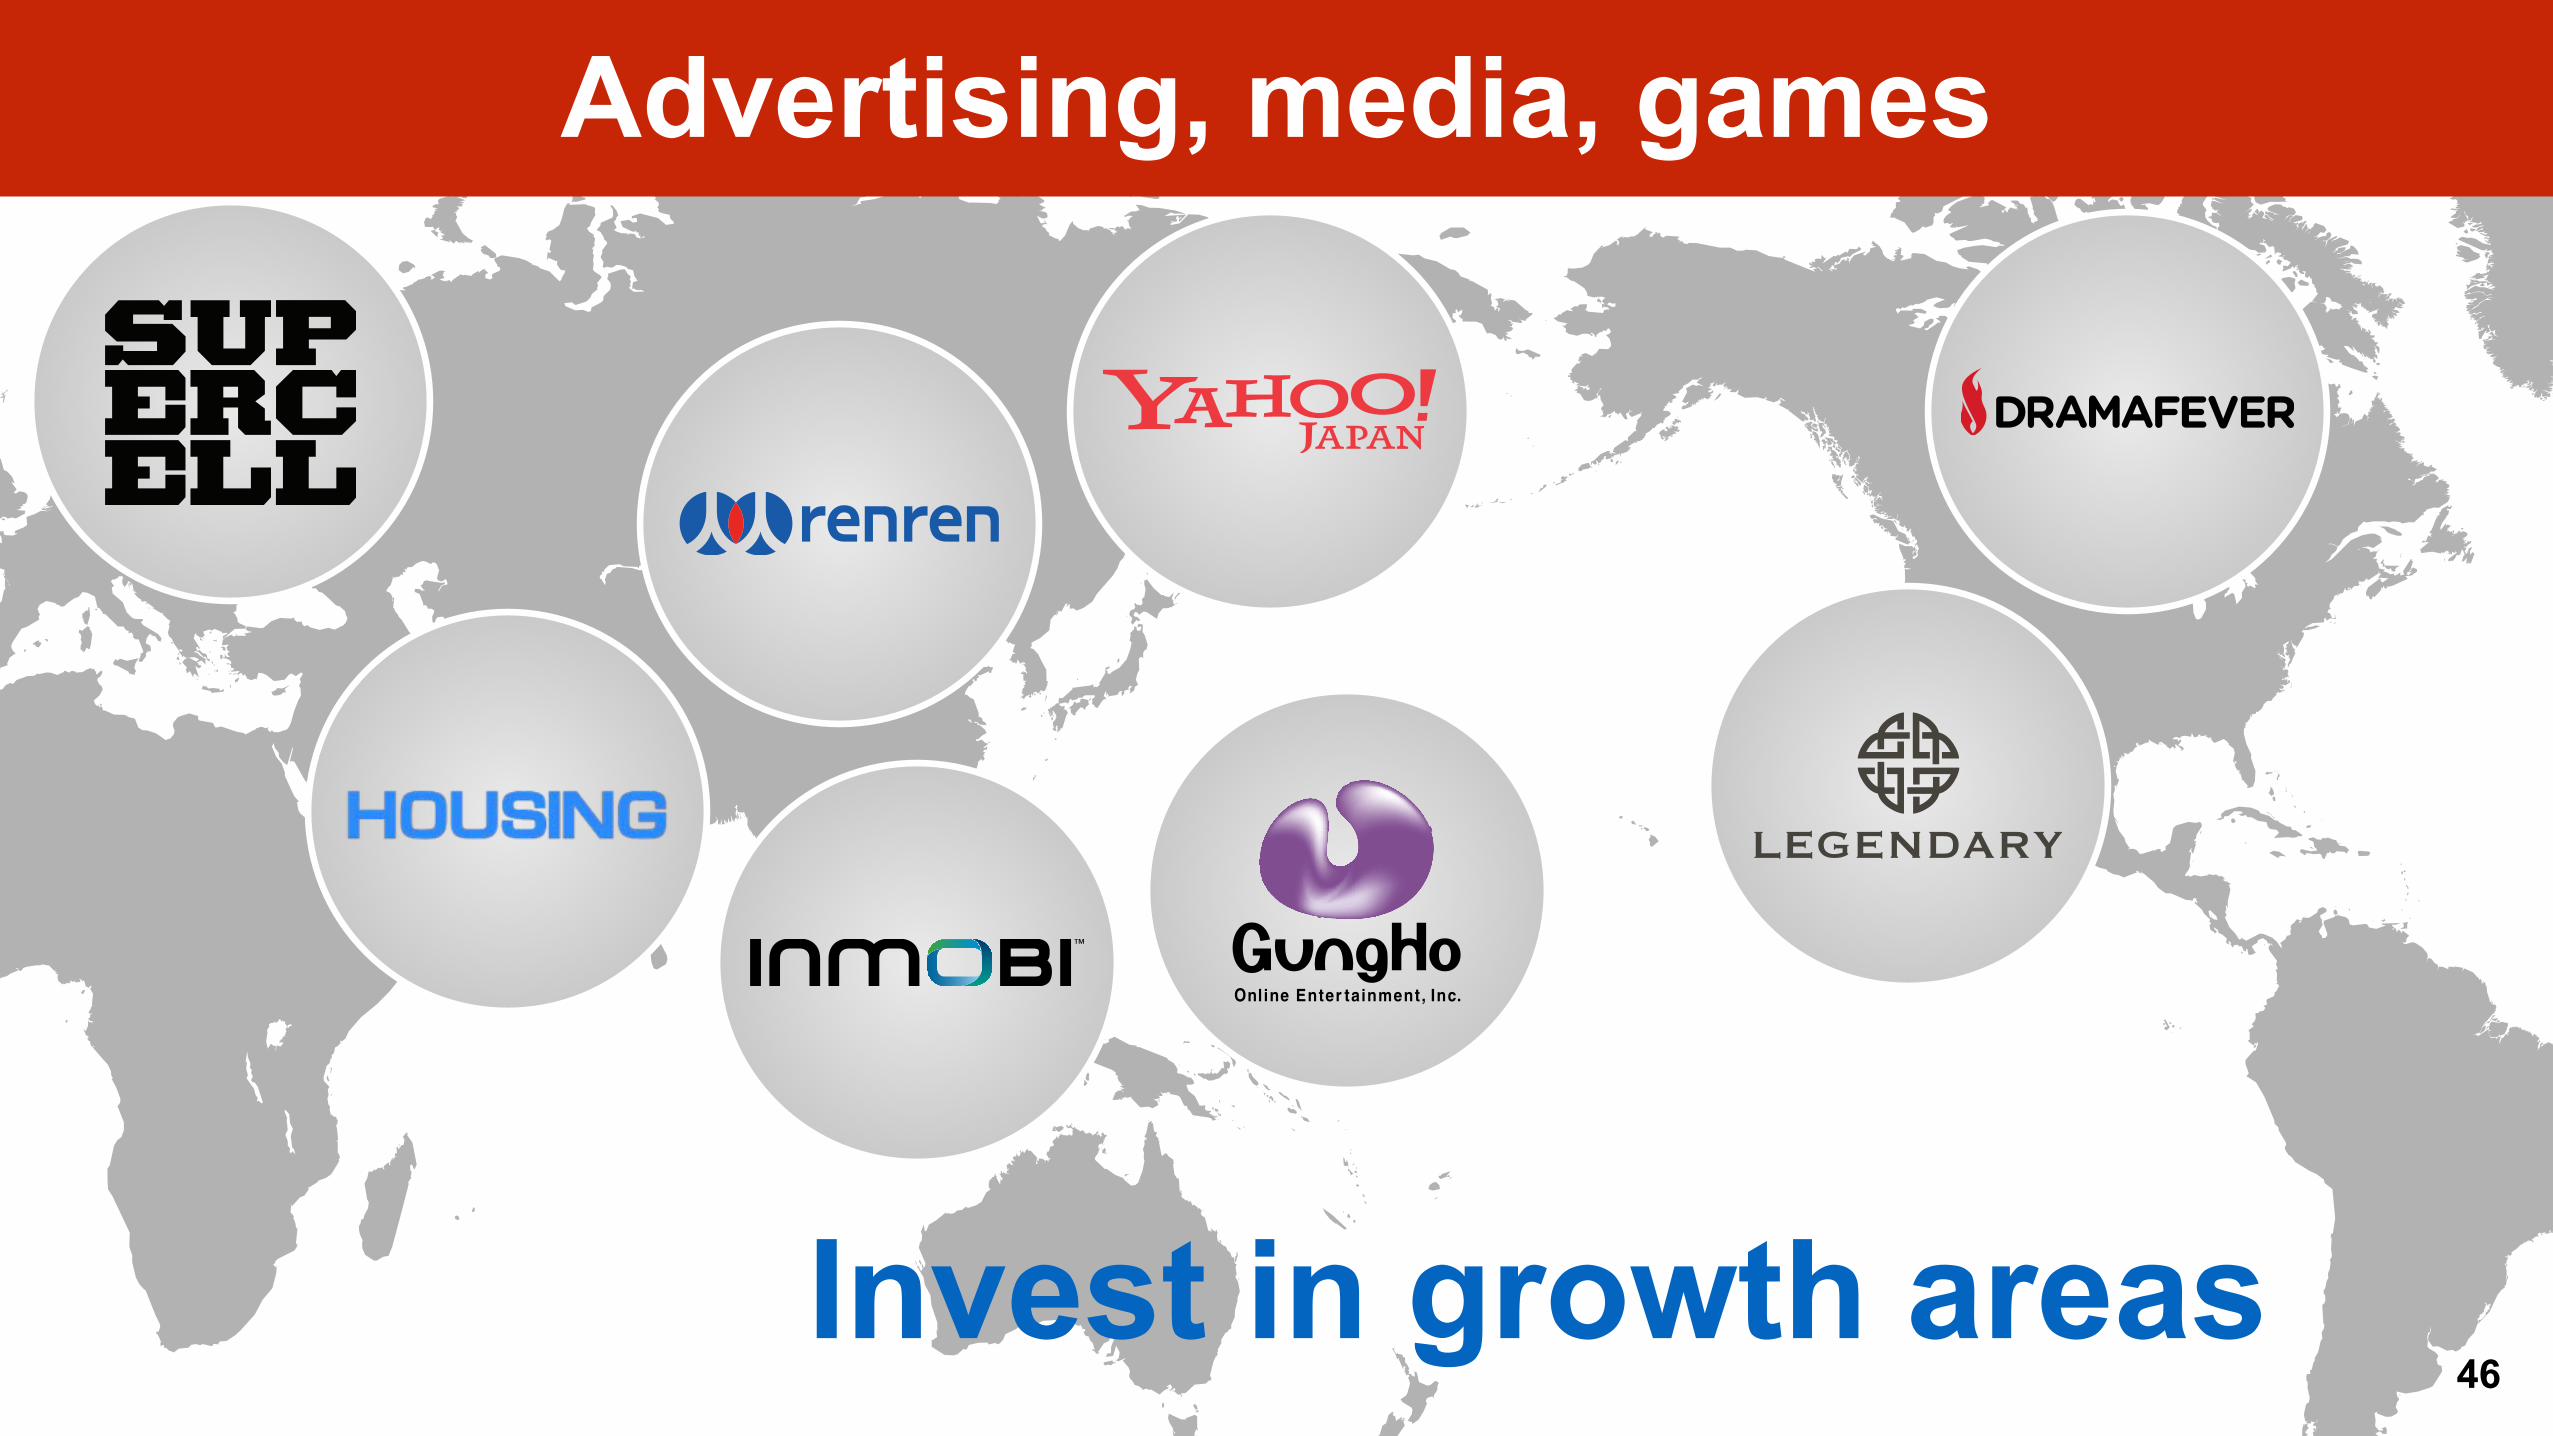
Advertising, media, games
46Invest in growth areas

47
House hunting platform in India
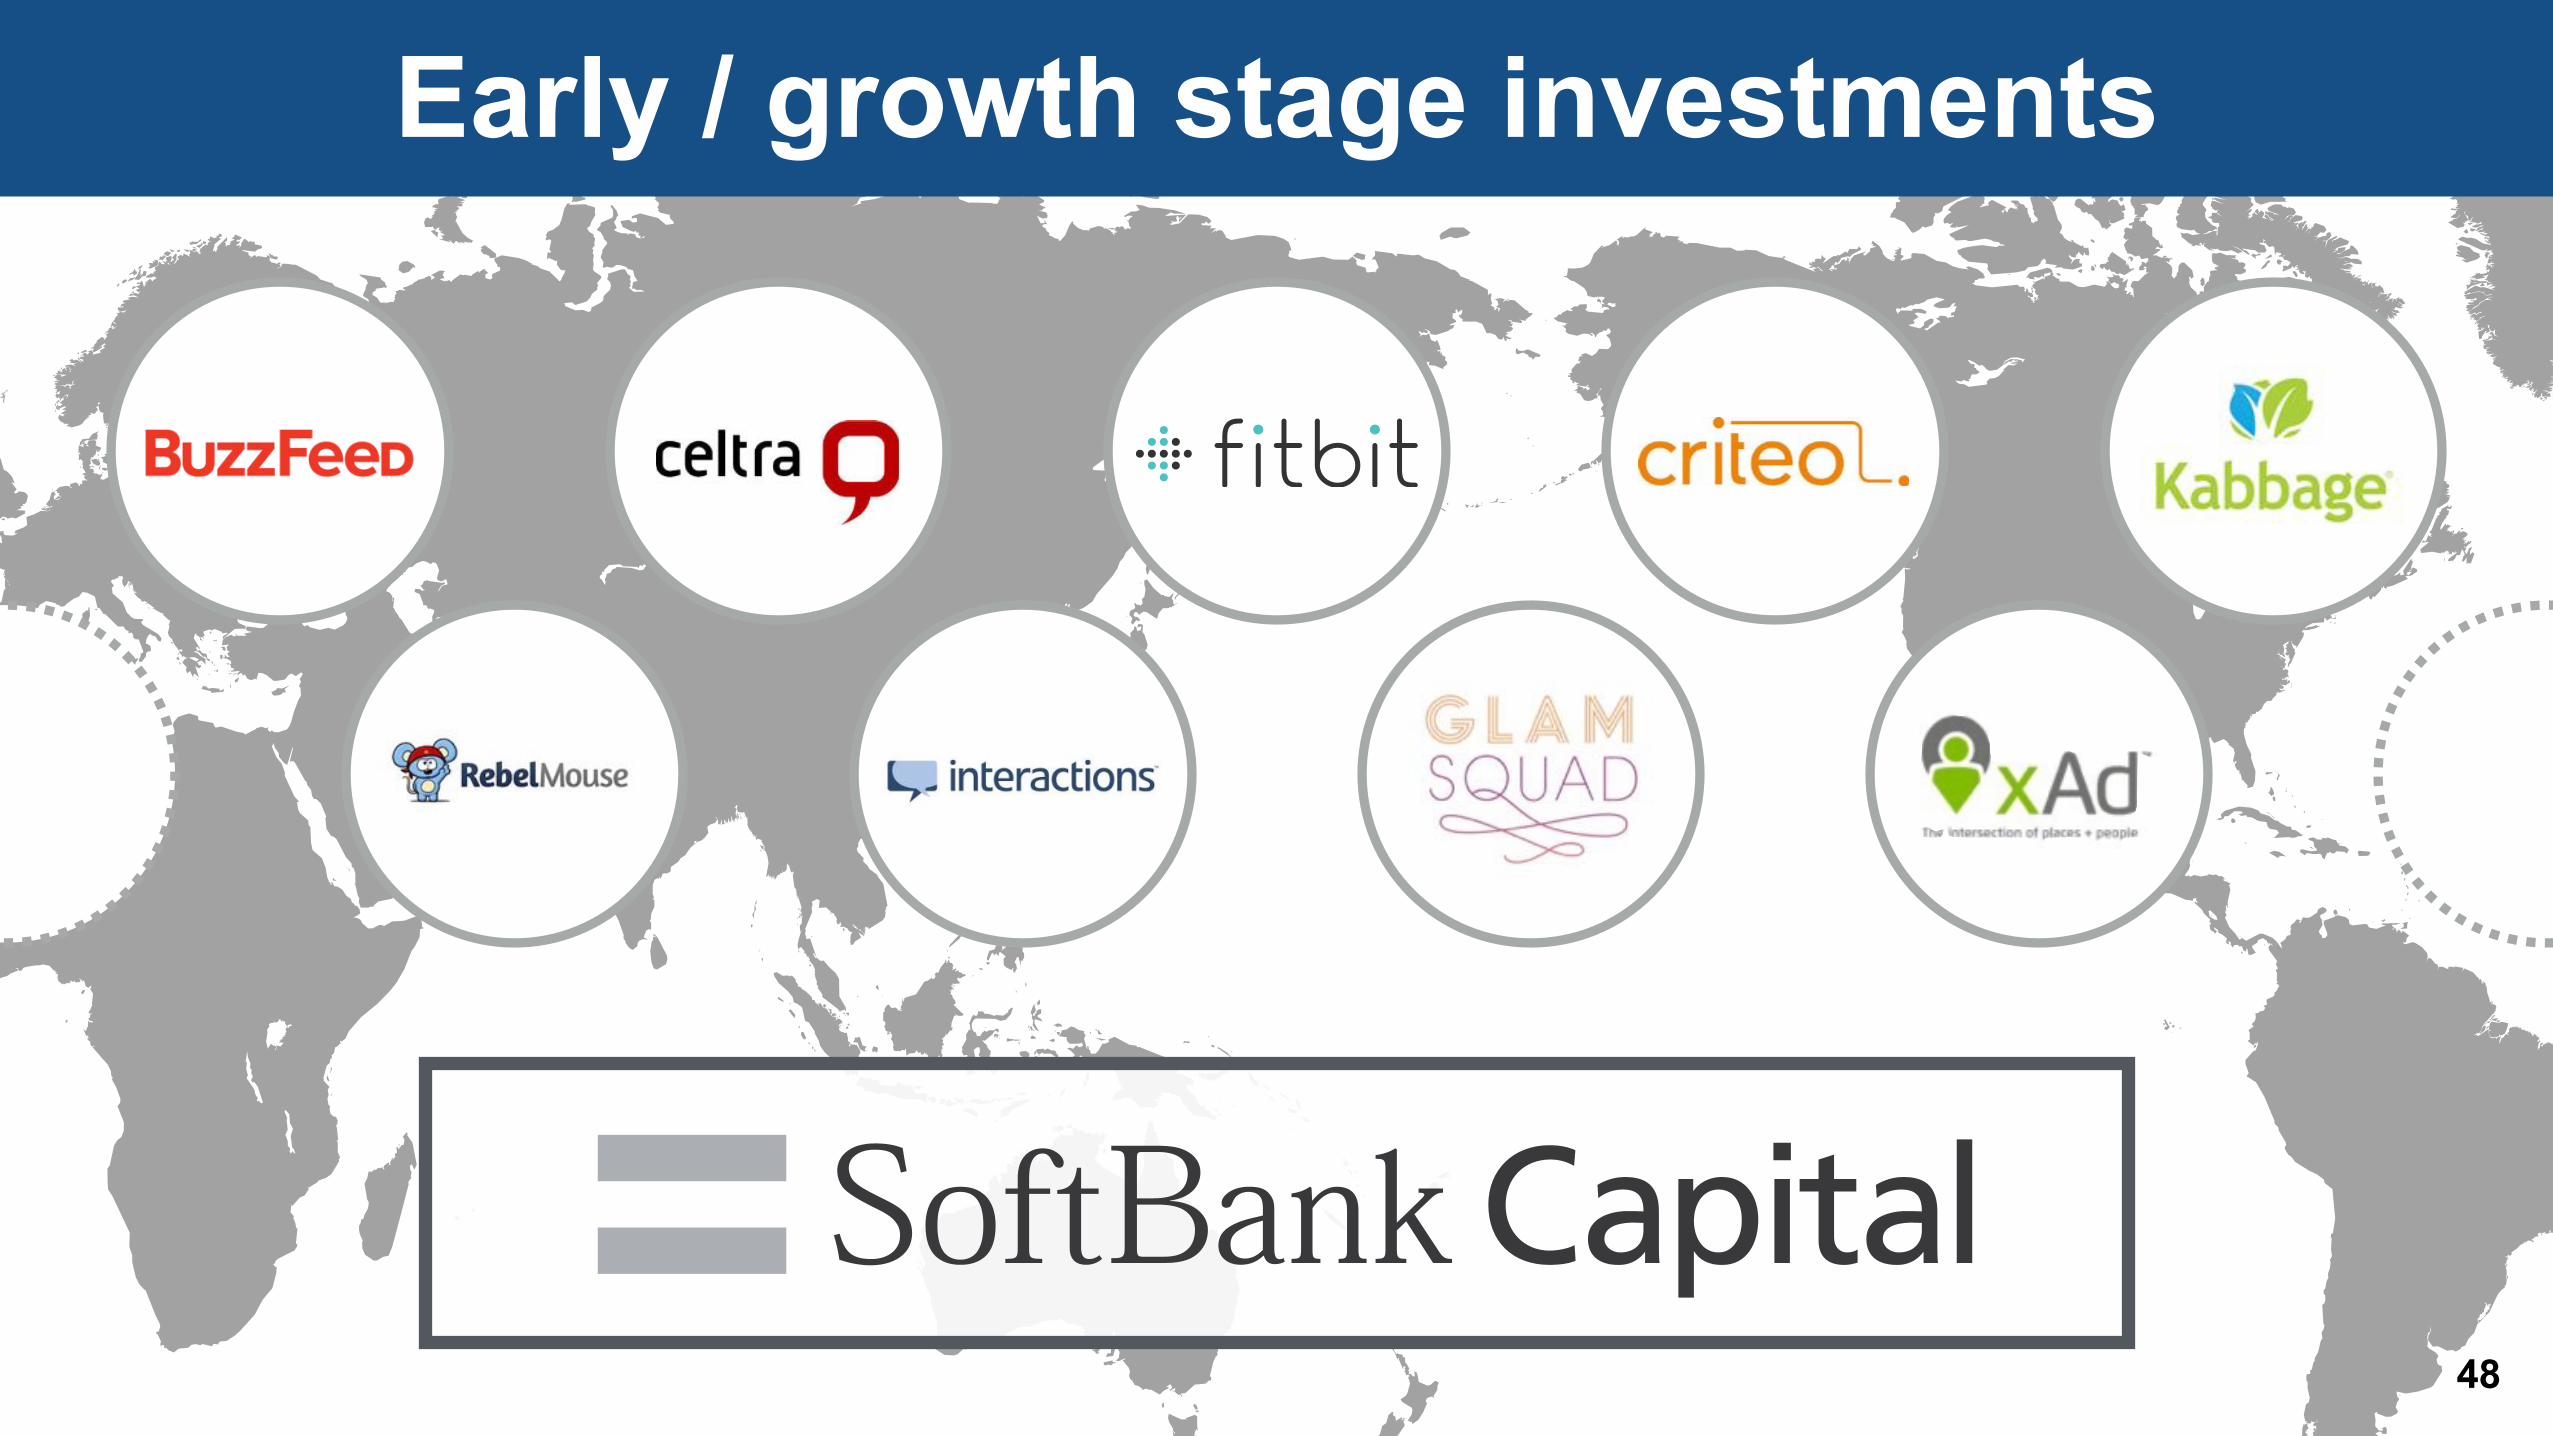
Early / growth stage investments
48
49
Communications Internet
SoftBank Business Domains
49

50
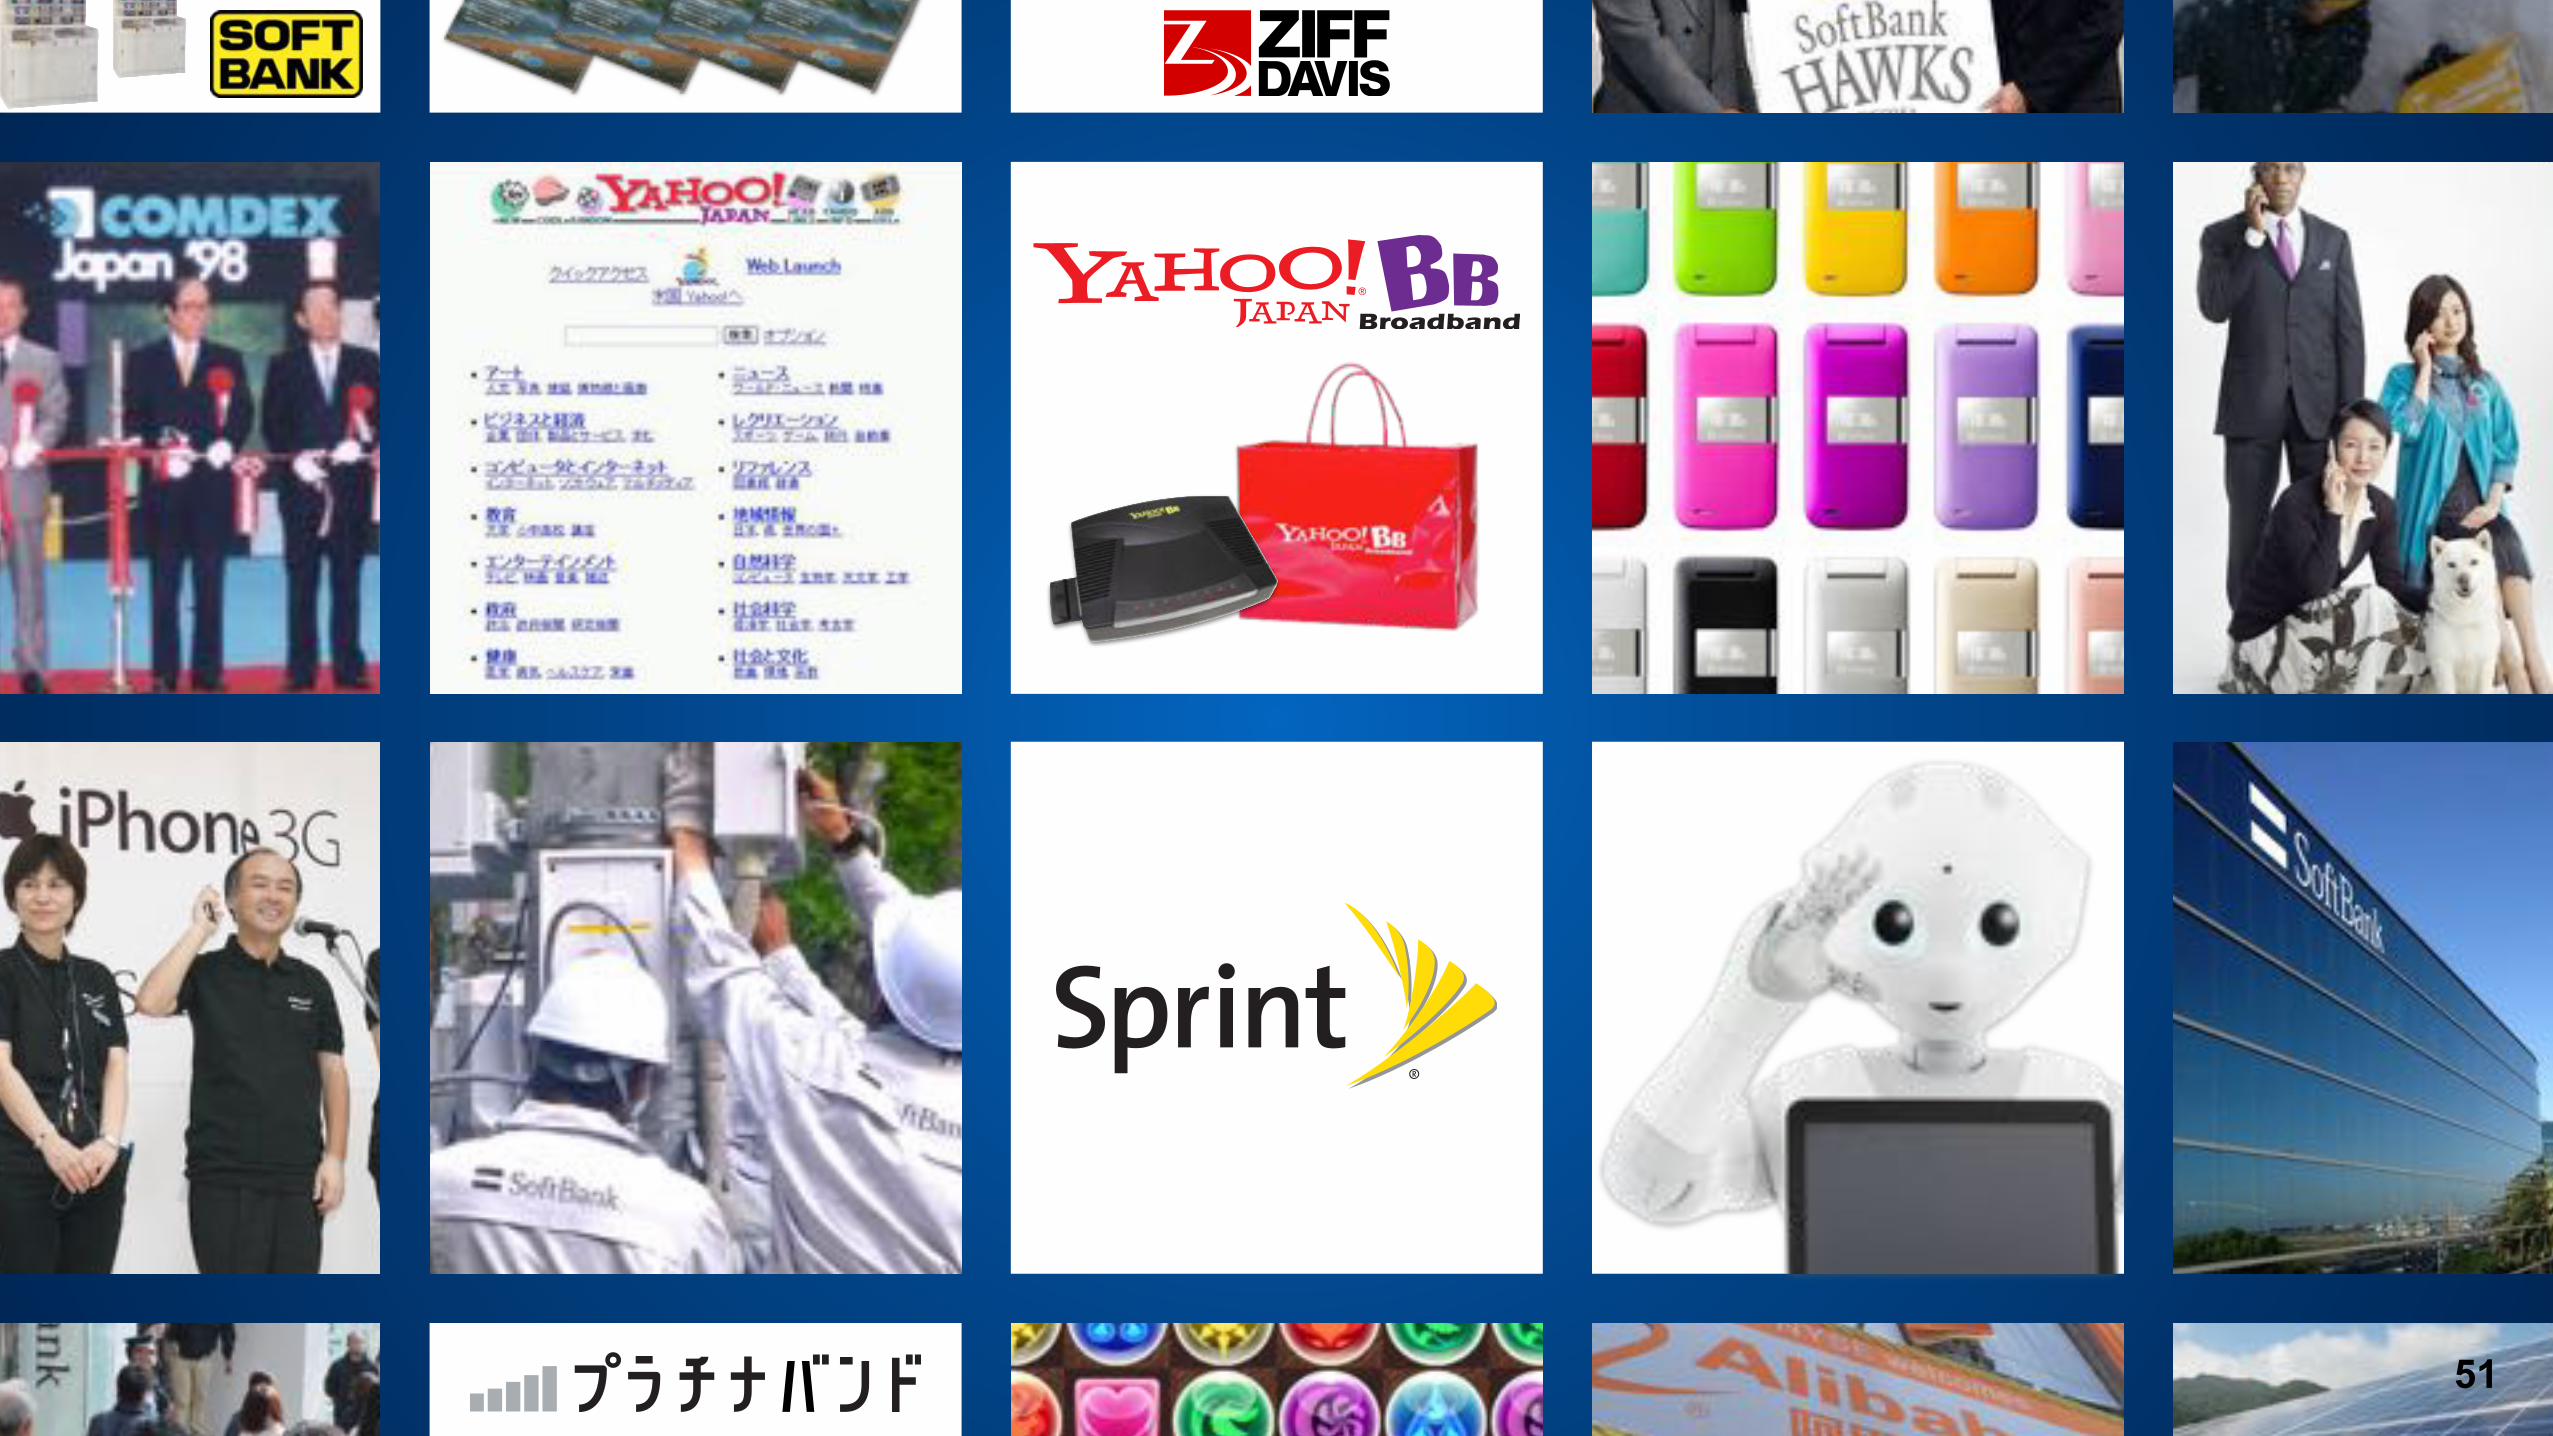
34 Years Since Foundation
51

52
when you challenge yourself
Masayoshi Son
The view is different

Information Revolution - Happiness for everyone
53
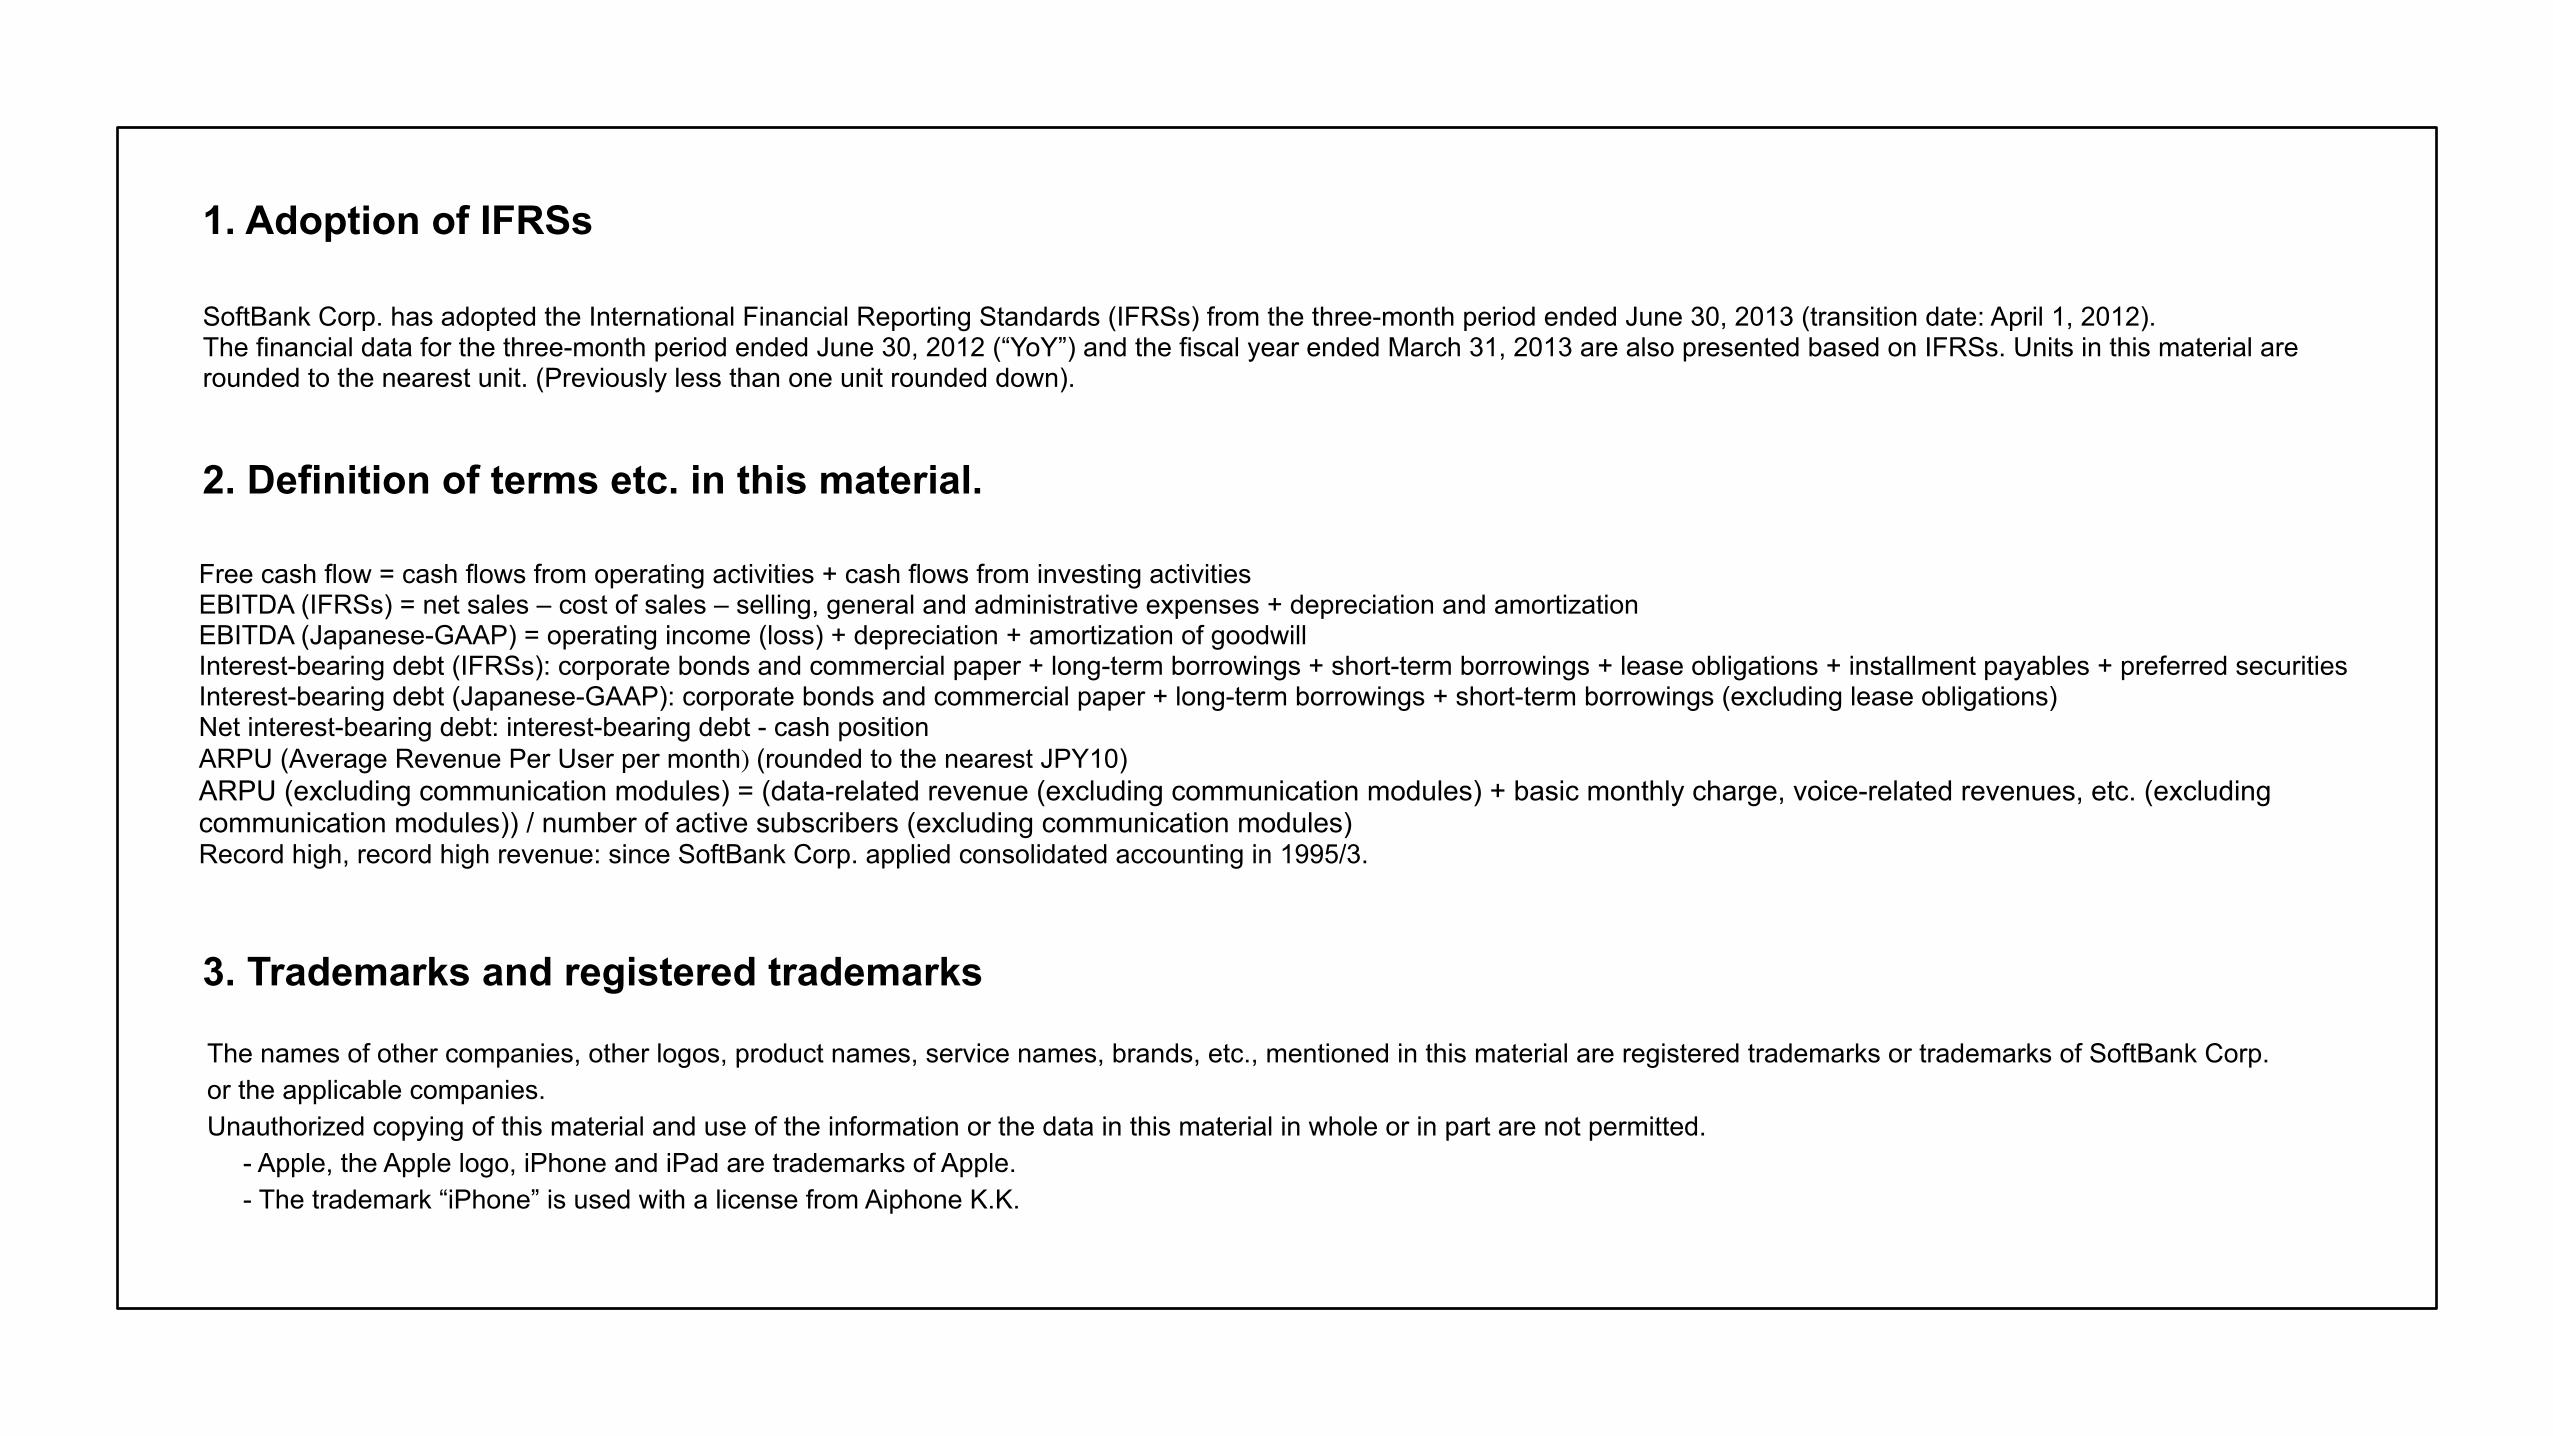
1. Adoption of IFRSs
SoftBank Corp. has adopted the International Financial Reporting Standards (IFRSs) from the three-month period ended June 30, 2013 (transition date: April 1, 2012).The financial data for the three-month period ended June 30, 2012 (“YoY”) and the fiscal year ended March 31, 2013 are also presented based on IFRSs. Units in this material are rounded to the nearest unit. (Previously less than one unit rounded down).
2. Definition of terms etc. in this material.
Free cash flow = cash flows from operating activities + cash flows from investing activitiesEBITDA (IFRSs) = net sales – cost of sales – selling, general and administrative expenses + depreciation and amortizationEBITDA (Japanese-GAAP) = operating income (loss) + depreciation + amortization of goodwillInterest-bearing debt (IFRSs): corporate bonds and commercial paper + long-term borrowings + short-term borrowings + lease obligations + installment payables + preferred securitiesInterest-bearing debt (Japanese-GAAP): corporate bonds and commercial paper + long-term borrowings + short-term borrowings (excluding lease obligations)Net interest-bearing debt: interest-bearing debt - cash positionARPU (Average Revenue Per User per month) (rounded to the nearest JPY10)ARPU (excluding communication modules) = (data-related revenue (excluding communication modules) + basic monthly charge, voice-related revenues, etc. (excluding communication modules)) / number of active subscribers (excluding communication modules)Record high, record high revenue: since SoftBank Corp. applied consolidated accounting in 1995/3.
3. Trademarks and registered trademarks
The names of other companies, other logos, product names, service names, brands, etc., mentioned in this material are registered trademarks or trademarks of SoftBank Corp. or the applicable companies. Unauthorized copying of this material and use of the information or the data in this material in whole or in part are not permitted.
- Apple, the Apple logo, iPhone and iPad are trademarks of Apple. - The trademark “iPhone” is used with a license from Aiphone K.K.