Earnings Presentation - Welspun India Ltd
28
Earnings Presentation Q3 FY21 January 2021 Welspun India Limited NSE: WELSPUNIND Bloomberg: WLSI:IN Reuters: WLSP.NS Home Textile | Advance Textile | Flooring
Transcript of Earnings Presentation - Welspun India Ltd
Earnings Presentation
Q3 FY21January 2021
W e l s p u n I n d i a L i m i t e d
NSE: WELSPUNINDBloomberg: WLSI:INReuters: WLSP.NS
H o m e T e x t i l e | A d v a n c e T e x t i l e | F l o o r i n g
Inside this Presentation
Executive Summary 03Management Commentary 04Key Highlights 05Quarterly Highlights 06Operational Highlights 10Enhancing Capacity; Catering to Growing Demand 11Quarterly Profit & Loss 12Quarterly Segment Results 13Summary of Financial Statements 14ESG at Welspun 18Share Holding Summary 21Annexures 24
w e l s p u n i n d i a . c o m
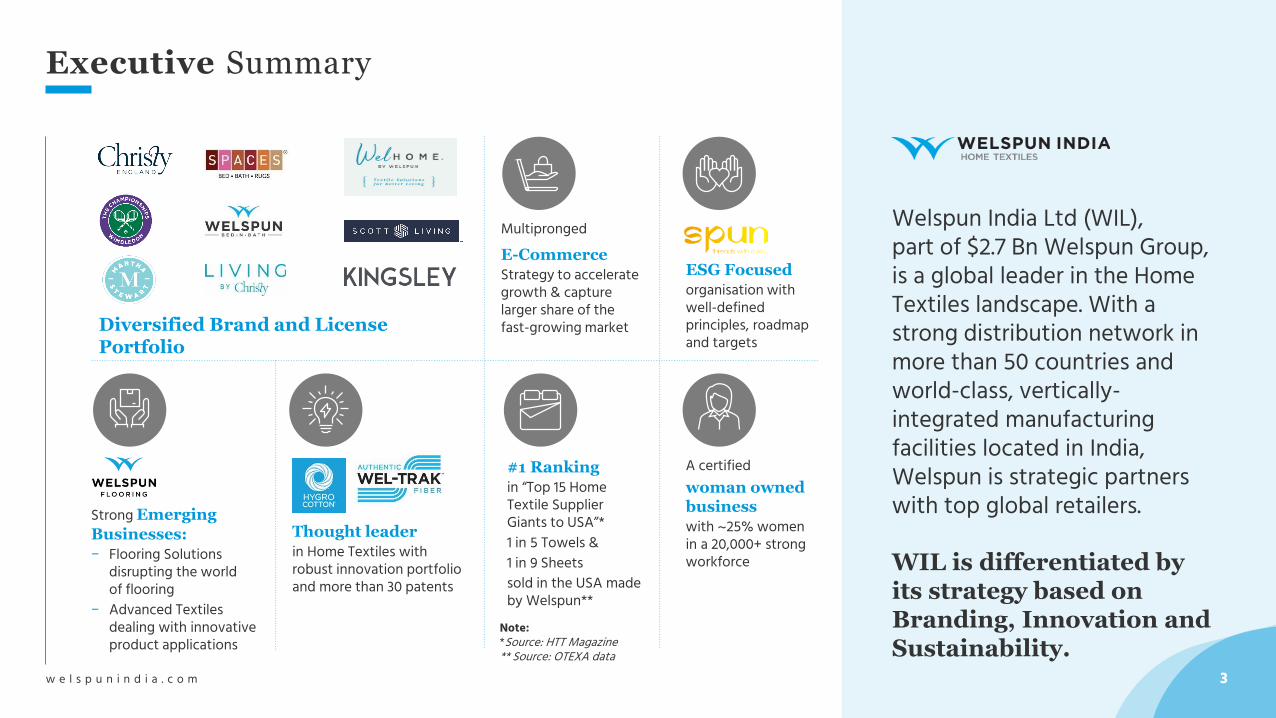
Executive Summary
3
Diversified Brand and LicensePortfolio
Strong Emerging
Businesses:
− Flooring Solutions disrupting the worldof flooring
− Advanced Textiles dealing with innovative product applications
A certifiedwoman owned business
with ~25% womenin a 20,000+ strong workforce
Thought leader
in Home Textiles with robust innovation portfolio and more than 30 patents
ESG Focused
organisation with well-defined principles, roadmap and targets
Welspun India Ltd (WIL),part of $2.7 Bn Welspun Group, is a global leader in the Home Textiles landscape. With a strong distribution network in more than 50 countries and world-class, vertically-integrated manufacturing facilities located in India, Welspun is strategic partners with top global retailers.
WIL is differentiated by its strategy based on Branding, Innovation and Sustainability.
MultiprongedE-Commerce
Strategy to accelerate growth & capture larger share of the fast-growing market
#1 Ranking
in “Top 15 HomeTextile SupplierGiants to USA”*1 in 5 Towels &1 in 9 Sheetssold in the USA made by Welspun**
Note:*Source: HTT Magazine** Source: OTEXA data
4
With emergence of homebody economy, there is a visible structural shift in consumers’ spending for home products.We delivered solid performance despite seasonally weak quarter, clocking highest ever quarterly revenue in the history of the company. Our Branded business delivered 28% growth YoY & Innovation portfolio contributed 45% to the total home textile export sales.With increased focus on Innovation, ESG and fast growing E-Commerce channel we continue to advance our operating models to the rapidly changing business landscape while increasing our capacities to cater to the growing demand.Ms. Dipali GoenkaCEO & Joint Managing Director, Welspun India Limited
w e l s p u n i n d i a . c o m
Management Commentary
Q3FY21
5w e l s p u n i n d i a . c o m
Key Highlights
Q3FY21
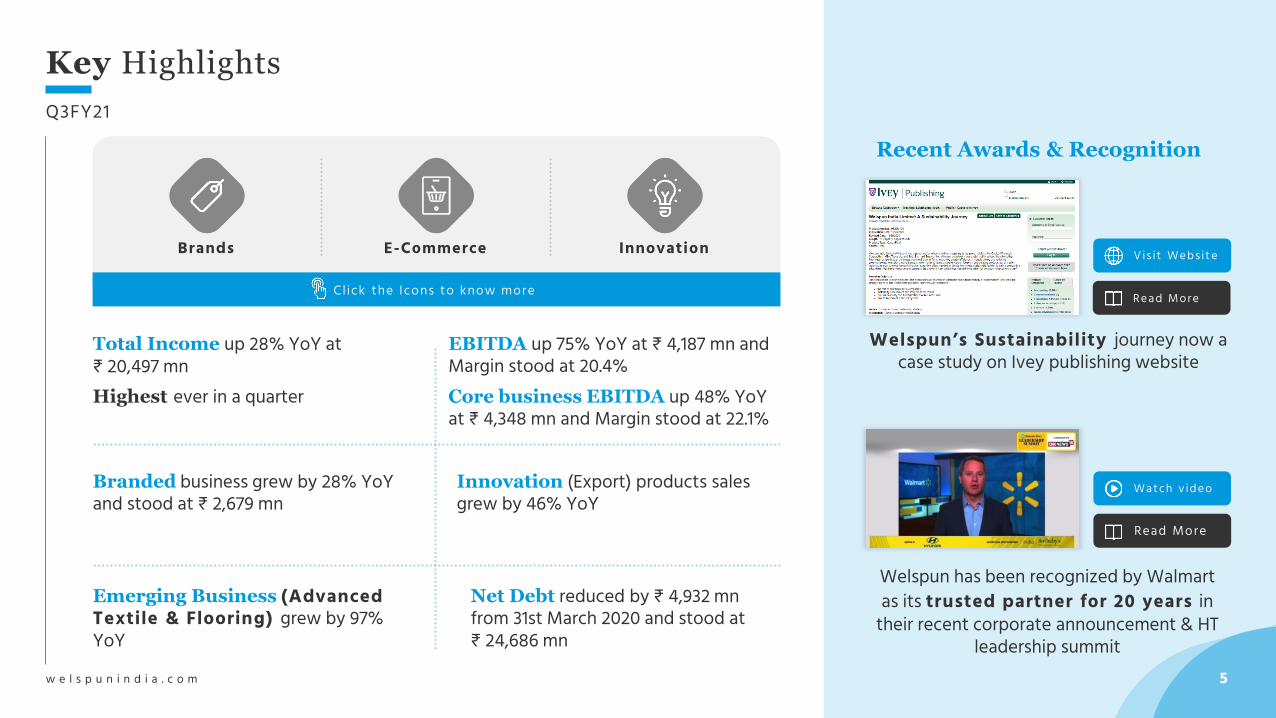
Branded business grew by 28% YoYand stood at ₹ 2,679 mn
Emerging Business (Advanced Textile & Flooring) grew by 97% YoY
Total Income up 28% YoY at ₹ 20,497 mnHighest ever in a quarter
Innovation (Export) products sales grew by 46% YoY
EBITDA up 75% YoY at ₹ 4,187 mn and Margin stood at 20.4%Core business EBITDA up 48% YoYat ₹ 4,348 mn and Margin stood at 22.1%
Net Debt reduced by ₹ 4,932 mnfrom 31st March 2020 and stood at ₹ 24,686 mn
Read More
Vis it Website
Welspun’s Sustainability journey now a case study on Ivey publishing website
Recent Awards & Recognition
Welspun has been recognized by Walmart as its trusted partner for 20 years in
their recent corporate announcement & HT leadership summit
Read More
Watch video
Click the Icons to know more
Brands E-Commerce Innovation
6w e l s p u n i n d i a . c o m
Q3FY21
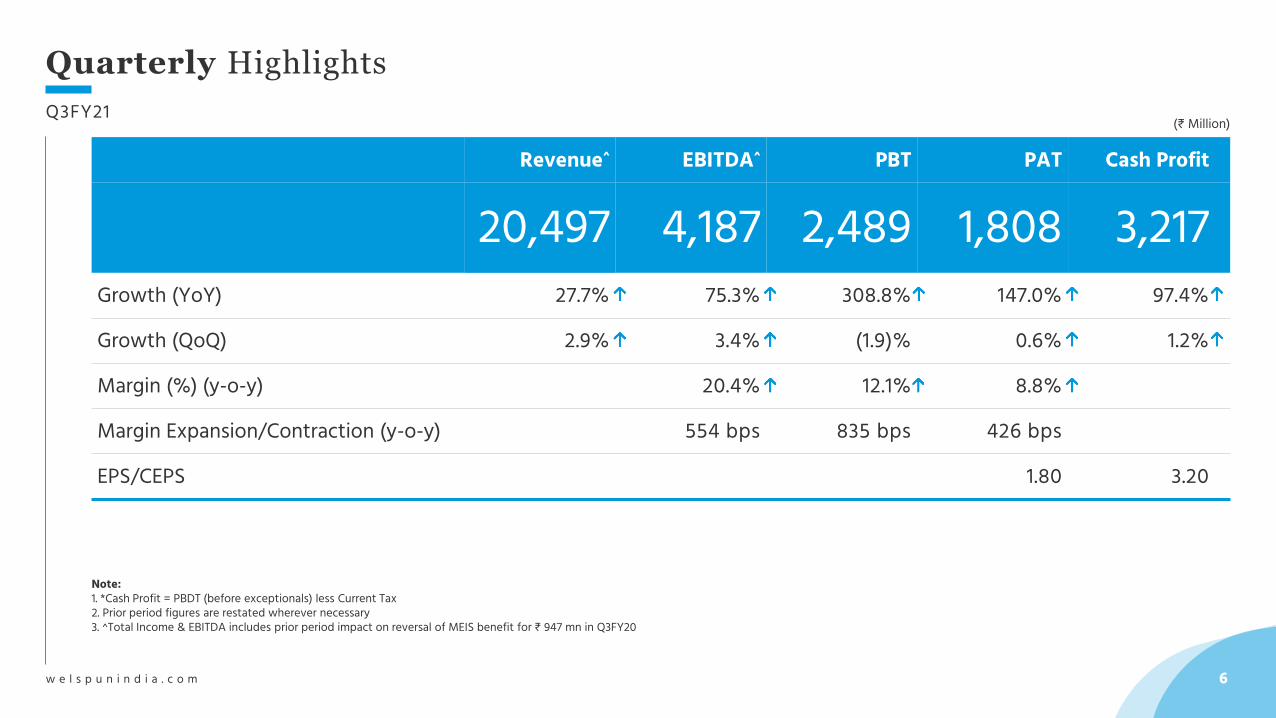
Revenue^ EBITDA^ PBT PAT Cash Profit
20,497 4,187 2,489 1,808 3,217Growth (YoY) 27.7% 75.3% 308.8% 147.0% 97.4%
Growth (QoQ) 2.9% 3.4% (1.9)% 0.6% 1.2%
Margin (%) (y-o-y) 20.4% 12.1% 8.8%
Margin Expansion/Contraction (y-o-y) 554 bps 835 bps 426 bps
EPS/CEPS 1.80 3.20
Note:1. *Cash Profit = PBDT (before exceptionals) less Current Tax2. Prior period figures are restated wherever necessary3. ^Total Income & EBITDA includes prior period impact on reversal of MEIS benefit for ₹ 947 mn in Q3FY20
Quarterly Highlights
(₹ Million)
w e l s p u n i n d i a . c o m
Q3FY21
Quarterly Highlights (Cont.)
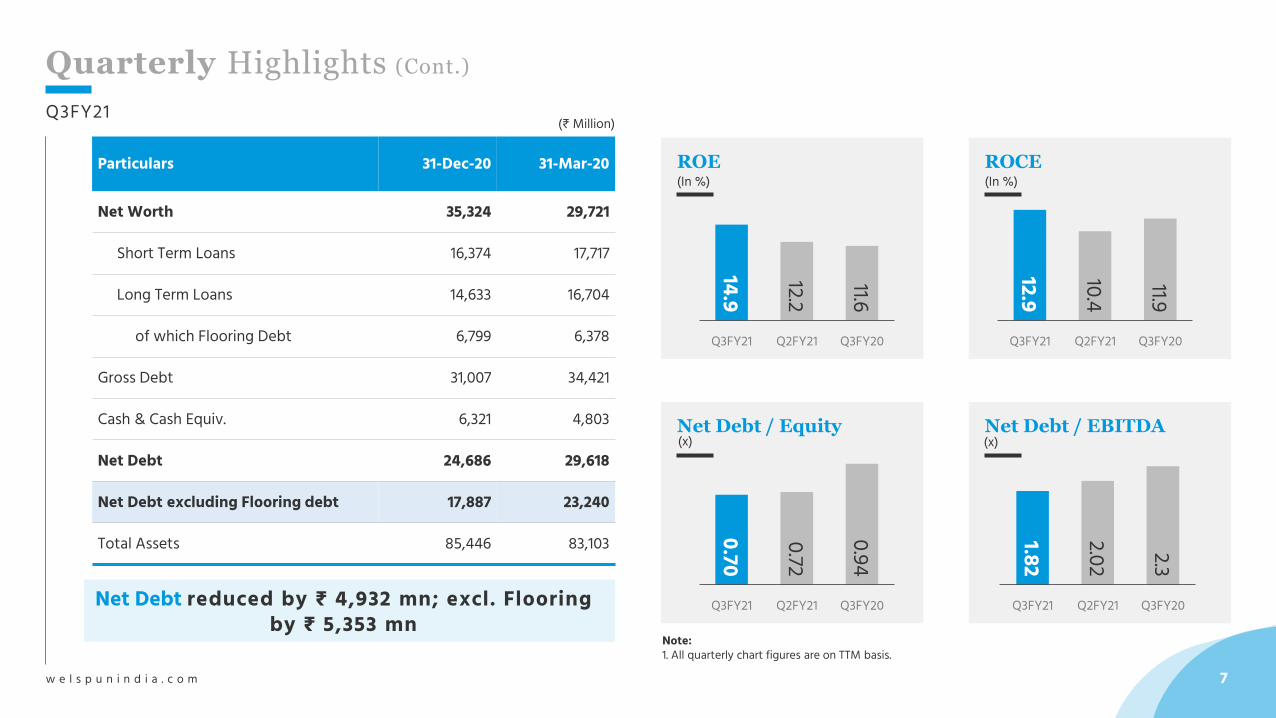
Particulars 31-Dec-20 31-Mar-20
Net Worth 35,324 29,721
Short Term Loans 16,374 17,717
Long Term Loans 14,633 16,704
of which Flooring Debt 6,799 6,378
Gross Debt 31,007 34,421
Cash & Cash Equiv. 6,321 4,803
Net Debt 24,686 29,618
Net Debt excluding Flooring debt 17,887 23,240
Total Assets 85,446 83,103
(₹ Million)
Note:1. All quarterly chart figures are on TTM basis.
7
ROE(In %)
14.9
12.2
11.6
0.0
5.0
10.0
15.0
20.0
Q3FY21 Q2FY21 Q3FY20
ROCE(In %)
12.9
10.4
11.9
0
5
10
15
Q3FY21 Q2FY21 Q3FY20
Net Debt / Equity
0.70
0.72
0.94
0.00
0.20
0.40
0.60
0.80
1.00
Q3FY21 Q2FY21 Q3FY20
Net Debt / EBITDA
1.82
2.02 2.3
0
0.5
1
1.5
2
2.5
Q3FY21 Q2FY21 Q3FY20
(x) (x)
Net Debt reduced by ₹ 4,932 mn; excl. Flooring by ₹ 5,353 mn
8w e l s p u n i n d i a . c o m
Q3FY21
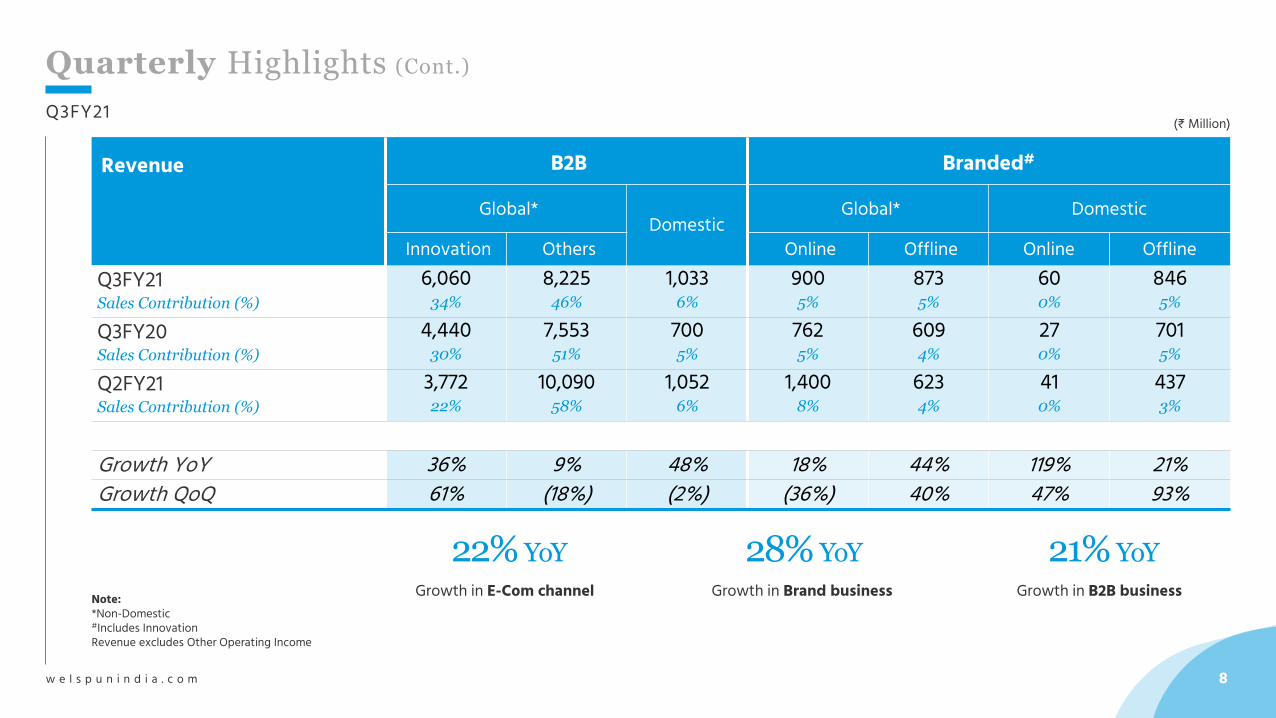
Revenue B2B Branded#
Global*Domestic
Global* Domestic
Innovation Others Online Offline Online OfflineQ3FY21Sales Contribution (%)
6,06034%
8,22546%
1,0336%
9005%
873 5%
600%
8465%
Q3FY20Sales Contribution (%)
4,44030%
7,55351%
7005%
7625%
6094%
270%
7015%
Q2FY21Sales Contribution (%)
3,77222%
10,09058%
1,0526%
1,400 8%
623 4%
410%
4373%
Growth YoY 36% 9% 48% 18% 44% 119% 21%Growth QoQ 61% (18%) (2%) (36%) 40% 47% 93%
Quarterly Highlights (Cont.)
(₹ Million)
Note:*Non-Domestic#Includes InnovationRevenue excludes Other Operating Income
22% YoY
Growth in E-Com channel
28% YoY
Growth in Brand business
21% YoY
Growth in B2B business
9w e l s p u n i n d i a . c o m
Q3FY21
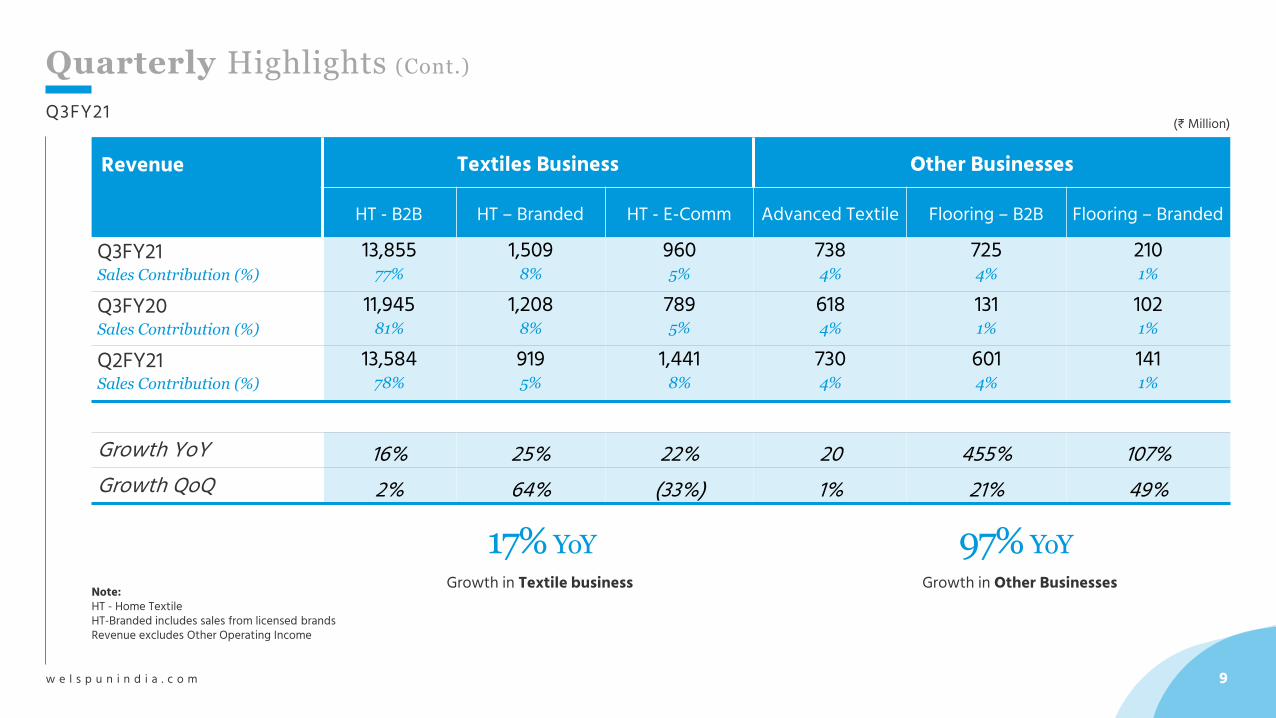
Revenue Textiles Business Other Businesses
HT - B2B HT – Branded HT - E-Comm Advanced Textile Flooring – B2B Flooring – Branded
Q3FY21Sales Contribution (%)
13,85577%
1,5098%
9605%
7384%
7254%
2101%
Q3FY20Sales Contribution (%)
11,94581%
1,2088%
7895%
6184%
1311%
1021%
Q2FY21Sales Contribution (%)
13,58478%
9195%
1,441 8%
7304%
6014%
1411%
Growth YoY 16% 25% 22% 20 455% 107%Growth QoQ 2% 64% (33%) 1% 21% 49%
Quarterly Highlights (Cont.)
(₹ Million)
Note:HT - Home Textile HT-Branded includes sales from licensed brandsRevenue excludes Other Operating Income
97% YoY
Growth in Other Businesses
17% YoY
Growth in Textile business
10w e l s p u n i n d i a . c o m
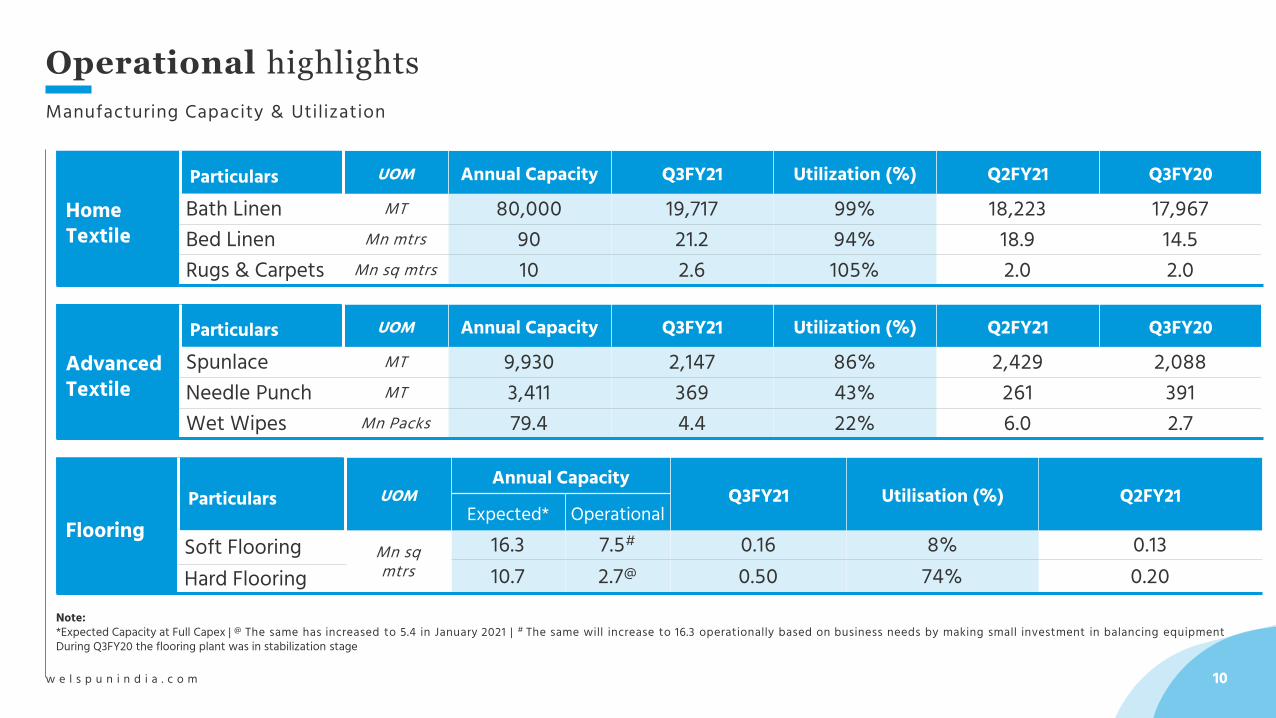
Operational highlights
Manufacturing Capacity & Utilization
Advanced Textile
Particulars UOM Annual Capacity Q3FY21 Utilization (%) Q2FY21 Q3FY20
Spunlace MT 9,930 2,147 86% 2,429 2,088Needle Punch MT 3,411 369 43% 261 391Wet Wipes Mn Packs 79.4 4.4 22% 6.0 2.7
Home Textile
Particulars UOM Annual Capacity Q3FY21 Utilization (%) Q2FY21 Q3FY20
Bath Linen MT 80,000 19,717 99% 18,223 17,967Bed Linen Mn mtrs 90 21.2 94% 18.9 14.5Rugs & Carpets Mn sq mtrs 10 2.6 105% 2.0 2.0
Note:*Expected Capacity at Full Capex | @ The same has increased to 5.4 in January 2021 | # The same will increase to 16.3 operationally based on business needs by making small investment in balancing equipment During Q3FY20 the flooring plant was in stabilization stage
FlooringParticulars UOM
Annual CapacityQ3FY21 Utilisation (%) Q2FY21
Expected* OperationalSoft Flooring Mn sq
mtrs16.3 7.5# 0.16 8% 0.1310.7 2.7@ 0.50 74% 0.20Hard Flooring
11w e l s p u n i n d i a . c o m
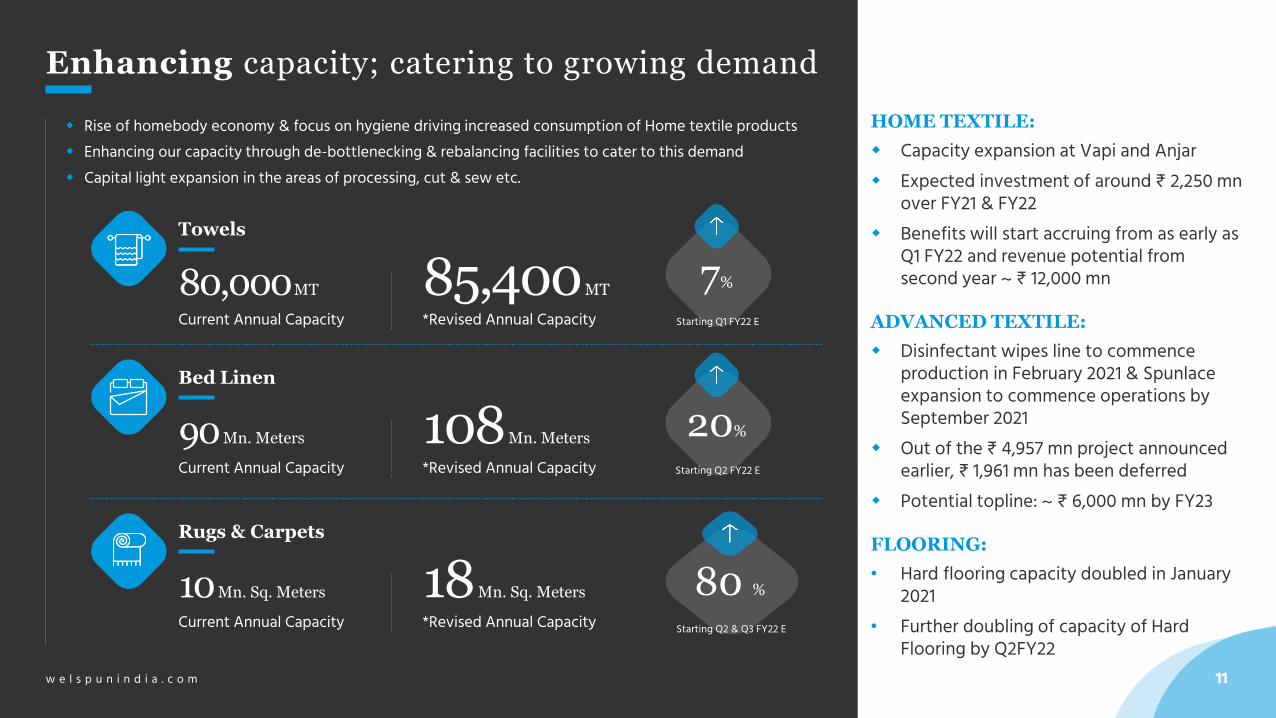
Enhancing capacity; catering to growing demand
HOME TEXTILE:
Capacity expansion at Vapi and Anjar Expected investment of around ₹ 2,250 mn
over FY21 & FY22 Benefits will start accruing from as early as
Q1 FY22 and revenue potential from second year ~ ₹ 12,000 mn
ADVANCED TEXTILE:
Disinfectant wipes line to commence production in February 2021 & Spunlace expansion to commence operations by September 2021
Out of the ₹ 4,957 mn project announced earlier, ₹ 1,961 mn has been deferred
Potential topline: ~ ₹ 6,000 mn by FY23
FLOORING:
• Hard flooring capacity doubled in January 2021
• Further doubling of capacity of Hard Flooring by Q2FY22
Rise of homebody economy & focus on hygiene driving increased consumption of Home textile products Enhancing our capacity through de-bottlenecking & rebalancing facilities to cater to this demand Capital light expansion in the areas of processing, cut & sew etc.
Towels
80,000MT
Current Annual Capacity85,400MT
*Revised Annual Capacity
Bed Linen
90Mn. Meters
Current Annual Capacity108Mn. Meters
*Revised Annual Capacity
Rugs & Carpets
10Mn. Sq. Meters
Current Annual Capacity18Mn. Sq. Meters
*Revised Annual Capacity
Starting Q1 FY22 E
7%
Starting Q2 FY22 E
20%
Starting Q2 & Q3 FY22 E
80 %
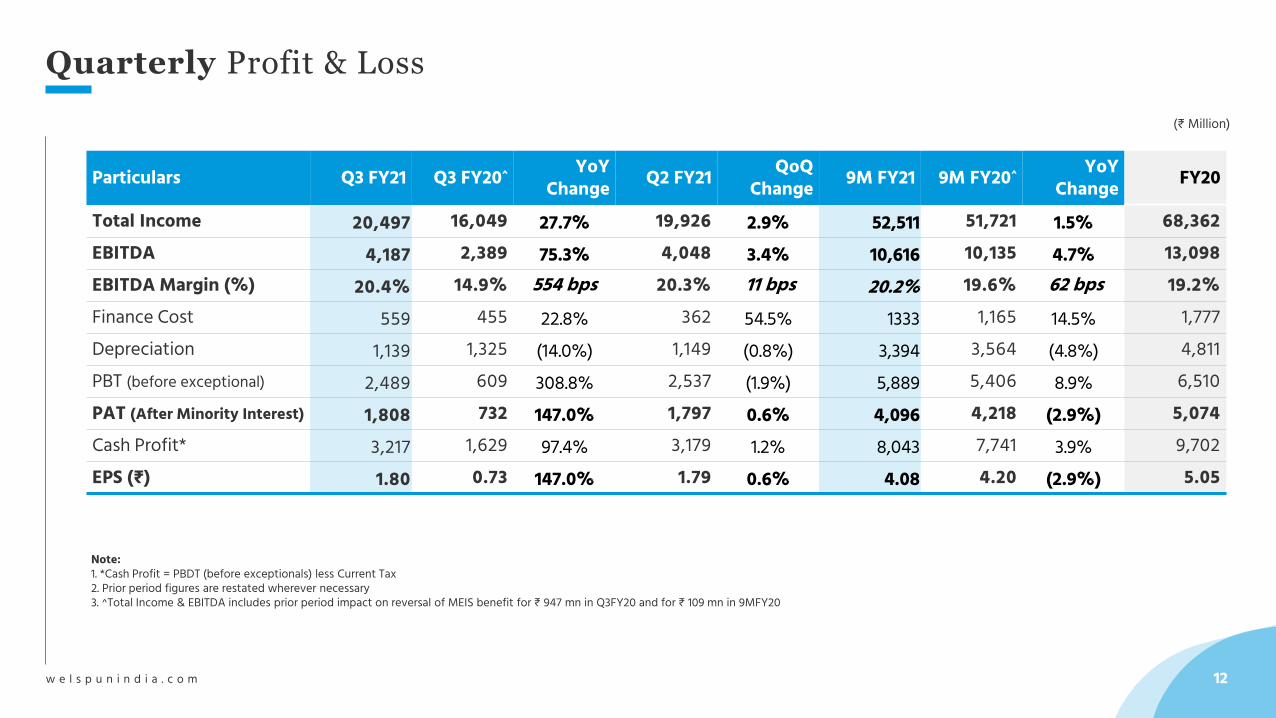
Particulars Q3 FY21 Q3 FY20^ YoY Change Q2 FY21 QoQ
Change 9M FY21 9M FY20^ YoY Change FY20
Total Income 20,497 16,049 27.7% 19,926 2.9% 52,511 51,721 1.5% 68,362EBITDA 4,187 2,389 75.3% 4,048 3.4% 10,616 10,135 4.7% 13,098EBITDA Margin (%) 20.4% 14.9% 554 bps 20.3% 11 bps 20.2% 19.6% 62 bps 19.2%Finance Cost 559 455 22.8% 362 54.5% 1333 1,165 14.5% 1,777Depreciation 1,139 1,325 (14.0%) 1,149 (0.8%) 3,394 3,564 (4.8%) 4,811PBT (before exceptional) 2,489 609 308.8% 2,537 (1.9%) 5,889 5,406 8.9% 6,510PAT (After Minority Interest) 1,808 732 147.0% 1,797 0.6% 4,096 4,218 (2.9%) 5,074Cash Profit* 3,217 1,629 97.4% 3,179 1.2% 8,043 7,741 3.9% 9,702EPS (₹) 1.80 0.73 147.0% 1.79 0.6% 4.08 4.20 (2.9%) 5.05
Note:1. *Cash Profit = PBDT (before exceptionals) less Current Tax2. Prior period figures are restated wherever necessary3. ^Total Income & EBITDA includes prior period impact on reversal of MEIS benefit for ₹ 947 mn in Q3FY20 and for ₹ 109 mn in 9MFY20
(₹ Million)
12w e l s p u n i n d i a . c o m
Quarterly Profit & Loss
13w e l s p u n i n d i a . c o m
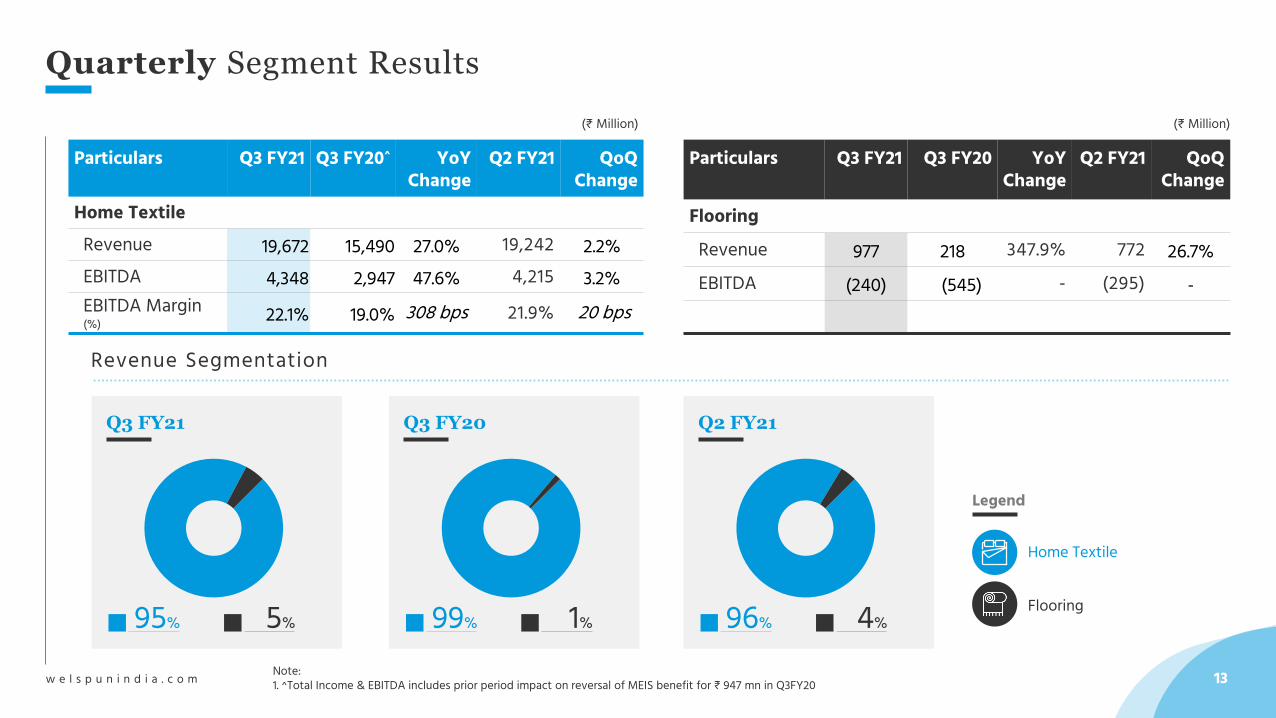
Quarterly Segment Results
Particulars Q3 FY21 Q3 FY20^ YoYChange
Q2 FY21 QoQChange
Home TextileRevenue 19,672 15,490 27.0% 19,242 2.2%EBITDA 4,348 2,947 47.6% 4,215 3.2%EBITDA Margin (%) 22.1% 19.0% 308 bps 21.9% 20 bps
Particulars Q3 FY21 Q3 FY20 YoYChange
Q2 FY21 QoQChange
FlooringRevenue 977 218 347.9% 772 26.7%EBITDA (240) (545) - (295) -
(₹ Million)(₹ Million)
Q3 FY21
95% 5%
Q3 FY20
99% 1%
Q2 FY21
96% 4%
Home Textile
Flooring
Legend
Revenue Segmentation
Note:1. ^Total Income & EBITDA includes prior period impact on reversal of MEIS benefit for ₹ 947 mn in Q3FY20
Summary of Financial Statements
W e l s p u n E x p e r i e n c e C e n t r e , H y d e r a b a d
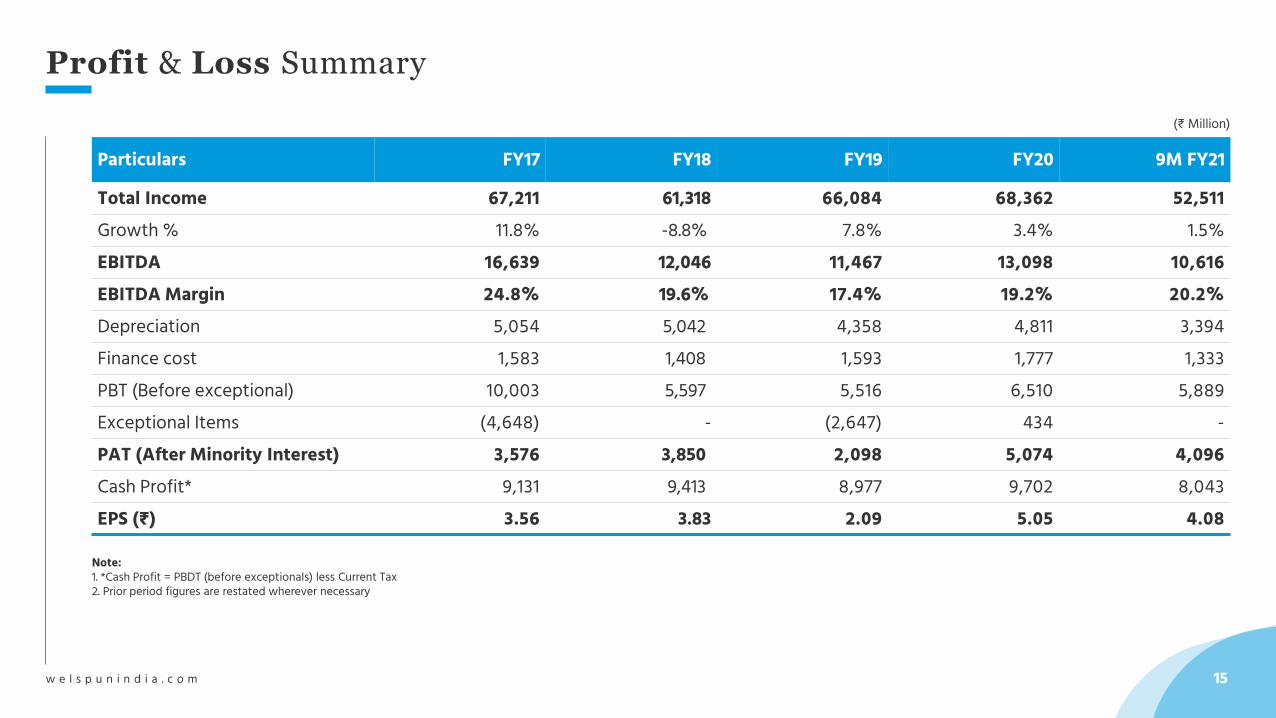
Particulars FY17 FY18 FY19 FY20 9M FY21
Total Income 67,211 61,318 66,084 68,362 52,511Growth % 11.8% -8.8% 7.8% 3.4% 1.5%EBITDA 16,639 12,046 11,467 13,098 10,616EBITDA Margin 24.8% 19.6% 17.4% 19.2% 20.2%Depreciation 5,054 5,042 4,358 4,811 3,394Finance cost 1,583 1,408 1,593 1,777 1,333PBT (Before exceptional) 10,003 5,597 5,516 6,510 5,889Exceptional Items (4,648) - (2,647) 434 -PAT (After Minority Interest) 3,576 3,850 2,098 5,074 4,096Cash Profit* 9,131 9,413 8,977 9,702 8,043EPS (₹) 3.56 3.83 2.09 5.05 4.08
Note:1. *Cash Profit = PBDT (before exceptionals) less Current Tax2. Prior period figures are restated wherever necessary
(₹ Million)
15w e l s p u n i n d i a . c o m
Profit & Loss Summary
16w e l s p u n i n d i a . c o m
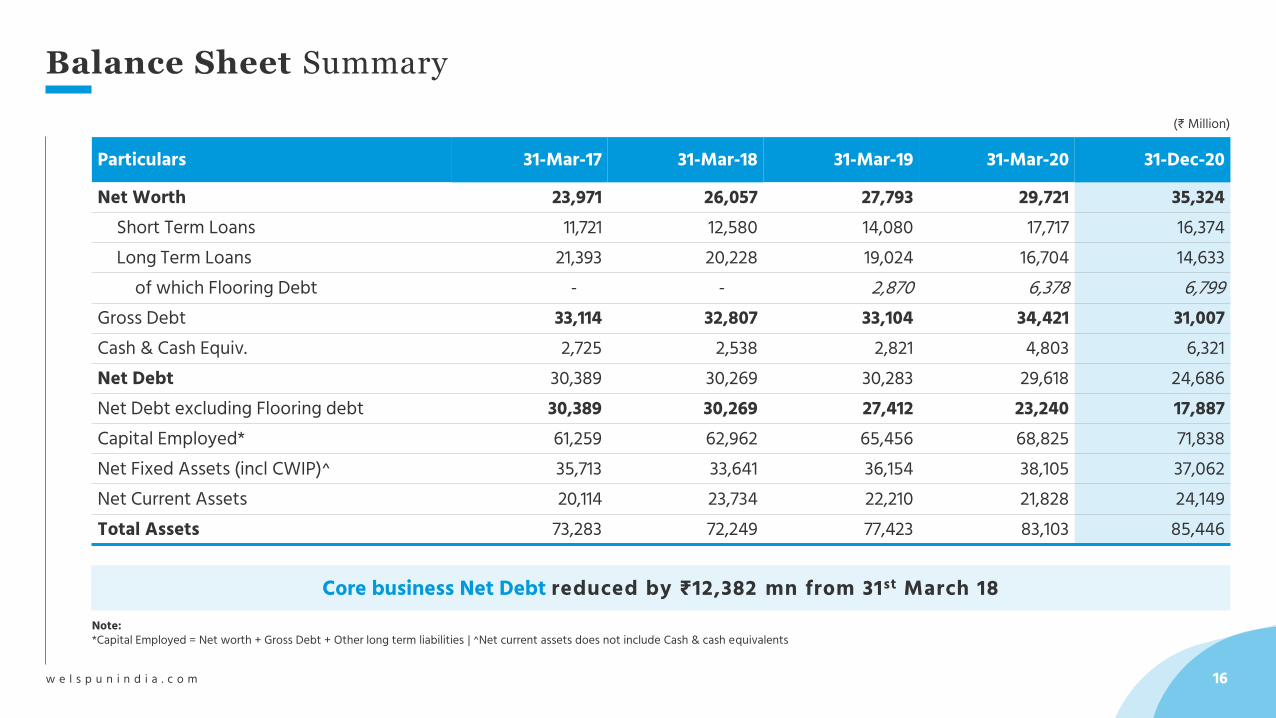
Balance Sheet Summary
Note:*Capital Employed = Net worth + Gross Debt + Other long term liabilities | ^Net current assets does not include Cash & cash equivalents
Particulars 31-Mar-17 31-Mar-18 31-Mar-19 31-Mar-20 31-Dec-20
Net Worth 23,971 26,057 27,793 29,721 35,324Short Term Loans 11,721 12,580 14,080 17,717 16,374Long Term Loans 21,393 20,228 19,024 16,704 14,633
of which Flooring Debt - - 2,870 6,378 6,799Gross Debt 33,114 32,807 33,104 34,421 31,007Cash & Cash Equiv. 2,725 2,538 2,821 4,803 6,321Net Debt 30,389 30,269 30,283 29,618 24,686Net Debt excluding Flooring debt 30,389 30,269 27,412 23,240 17,887Capital Employed* 61,259 62,962 65,456 68,825 71,838Net Fixed Assets (incl CWIP)^ 35,713 33,641 36,154 38,105 37,062Net Current Assets 20,114 23,734 22,210 21,828 24,149Total Assets 73,283 72,249 77,423 83,103 85,446
Core business Net Debt reduced by ₹12,382 mn from 31st March 18
(₹ Million)
17w e l s p u n i n d i a . c o m
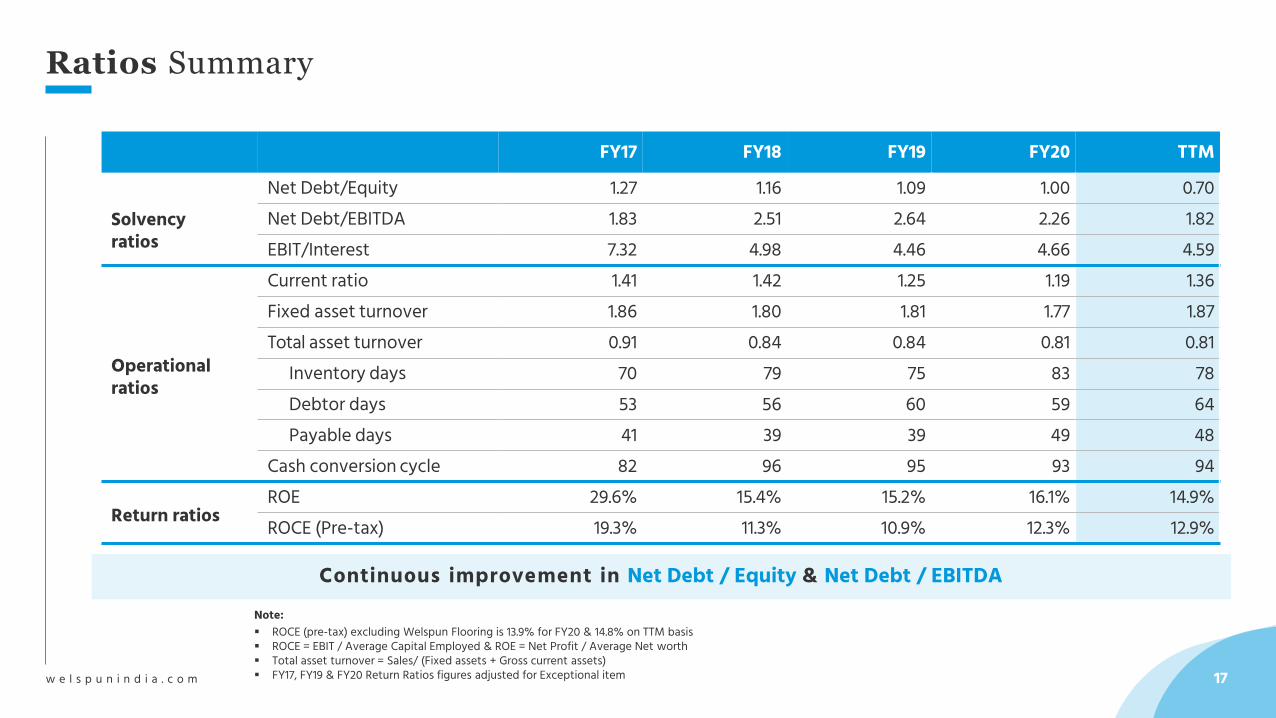
Ratios Summary
FY17 FY18 FY19 FY20 TTM
Solvencyratios
Net Debt/Equity 1.27 1.16 1.09 1.00 0.70Net Debt/EBITDA 1.83 2.51 2.64 2.26 1.82EBIT/Interest 7.32 4.98 4.46 4.66 4.59
Operationalratios
Current ratio 1.41 1.42 1.25 1.19 1.36Fixed asset turnover 1.86 1.80 1.81 1.77 1.87Total asset turnover 0.91 0.84 0.84 0.81 0.81
Inventory days 70 79 75 83 78Debtor days 53 56 60 59 64Payable days 41 39 39 49 48
Cash conversion cycle 82 96 95 93 94
Return ratiosROE 29.6% 15.4% 15.2% 16.1% 14.9%ROCE (Pre-tax) 19.3% 11.3% 10.9% 12.3% 12.9%
Continuous improvement in Net Debt / Equity & Net Debt / EBITDANote: ROCE (pre-tax) excluding Welspun Flooring is 13.9% for FY20 & 14.8% on TTM basis ROCE = EBIT / Average Capital Employed & ROE = Net Profit / Average Net worth Total asset turnover = Sales/ (Fixed assets + Gross current assets) FY17, FY19 & FY20 Return Ratios figures adjusted for Exceptional item
18w e l s p u n i n d i a . c o m
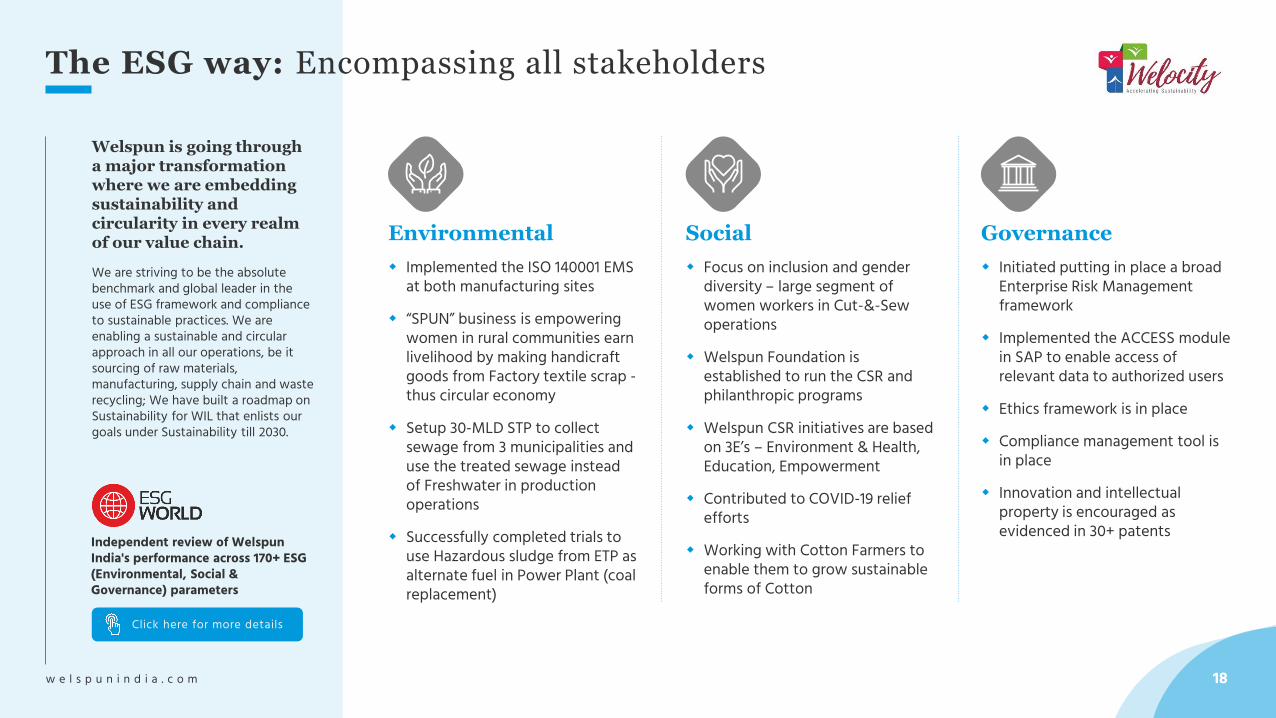
The ESG way: Encompassing all stakeholders
Environmental
Implemented the ISO 140001 EMS at both manufacturing sites
“SPUN” business is empowering women in rural communities earn livelihood by making handicraft goods from Factory textile scrap -thus circular economy
Setup 30-MLD STP to collect sewage from 3 municipalities and use the treated sewage instead of Freshwater in production operations
Successfully completed trials to use Hazardous sludge from ETP as alternate fuel in Power Plant (coal replacement)
Social
Focus on inclusion and gender diversity – large segment of women workers in Cut-&-Sew operations
Welspun Foundation is established to run the CSR and philanthropic programs
Welspun CSR initiatives are based on 3E’s – Environment & Health, Education, Empowerment
Contributed to COVID-19 relief efforts
Working with Cotton Farmers to enable them to grow sustainable forms of Cotton
Governance
Initiated putting in place a broad Enterprise Risk Management framework
Implemented the ACCESS module in SAP to enable access of relevant data to authorized users
Ethics framework is in place
Compliance management tool is in place
Innovation and intellectual property is encouraged as evidenced in 30+ patents
Welspun is going througha major transformation where we are embedding sustainability and circularity in every realm of our value chain.
We are striving to be the absolute benchmark and global leader in the use of ESG framework and compliance to sustainable practices. We are enabling a sustainable and circular approach in all our operations, be it sourcing of raw materials, manufacturing, supply chain and waste recycling; We have built a roadmap on Sustainability for WIL that enlists our goals under Sustainability till 2030.
Independent review of Welspun India's performance across 170+ ESG (Environmental, Social & Governance) parameters
Click here for more details
19w e l s p u n i n d i a . c o m
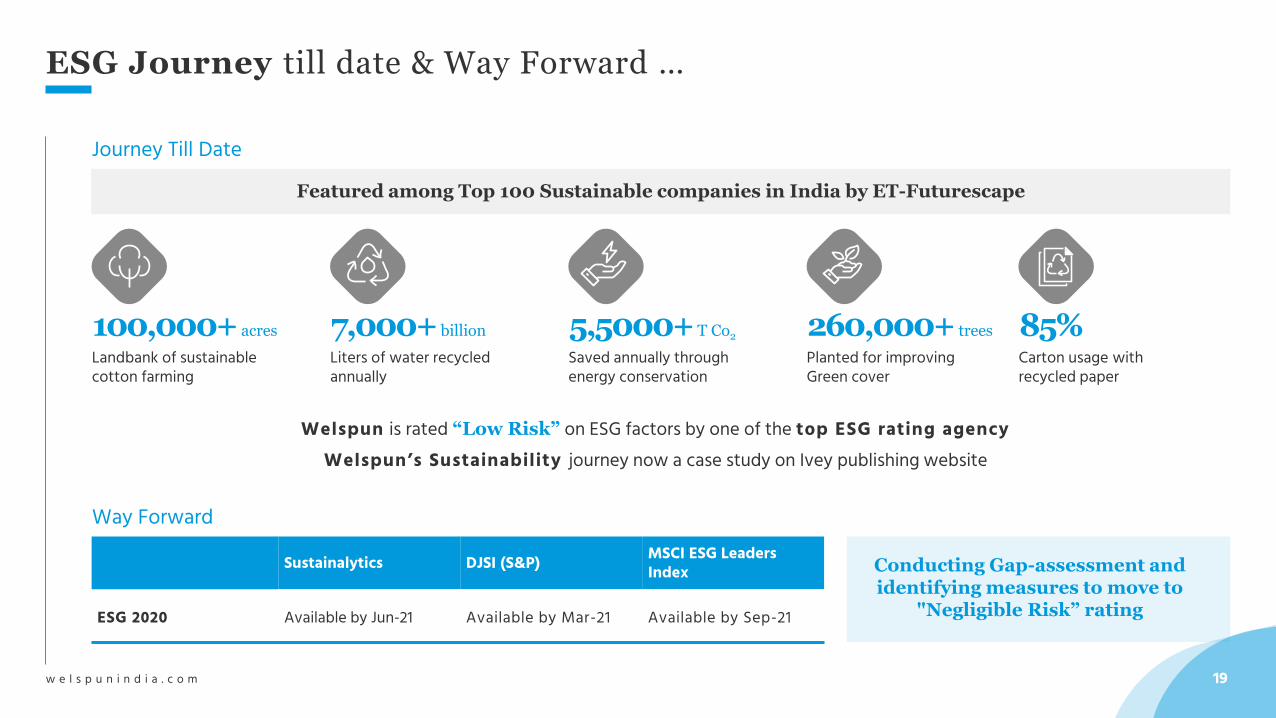
ESG Journey till date & Way Forward …
Conducting Gap-assessment and identifying measures to move to
"Negligible Risk” rating
Featured among Top 100 Sustainable companies in India by ET-Futurescape
260,000+ trees
Planted for improvingGreen cover
Sustainalytics DJSI (S&P) MSCI ESG Leaders Index
ESG 2020 Available by Jun-21 Available by Mar-21 Available by Sep-21
85%Carton usage withrecycled paper
7,000+billion
Liters of water recycled annually
5,5000+T Co2
Saved annually through energy conservation
100,000+ acres
Landbank of sustainable cotton farming
Welspun is rated “Low Risk” on ESG factors by one of the top ESG rating agency
Journey Till Date
Way Forward
Welspun’s Sustainability journey now a case study on Ivey publishing website
20w e l s p u n i n d i a . c o m
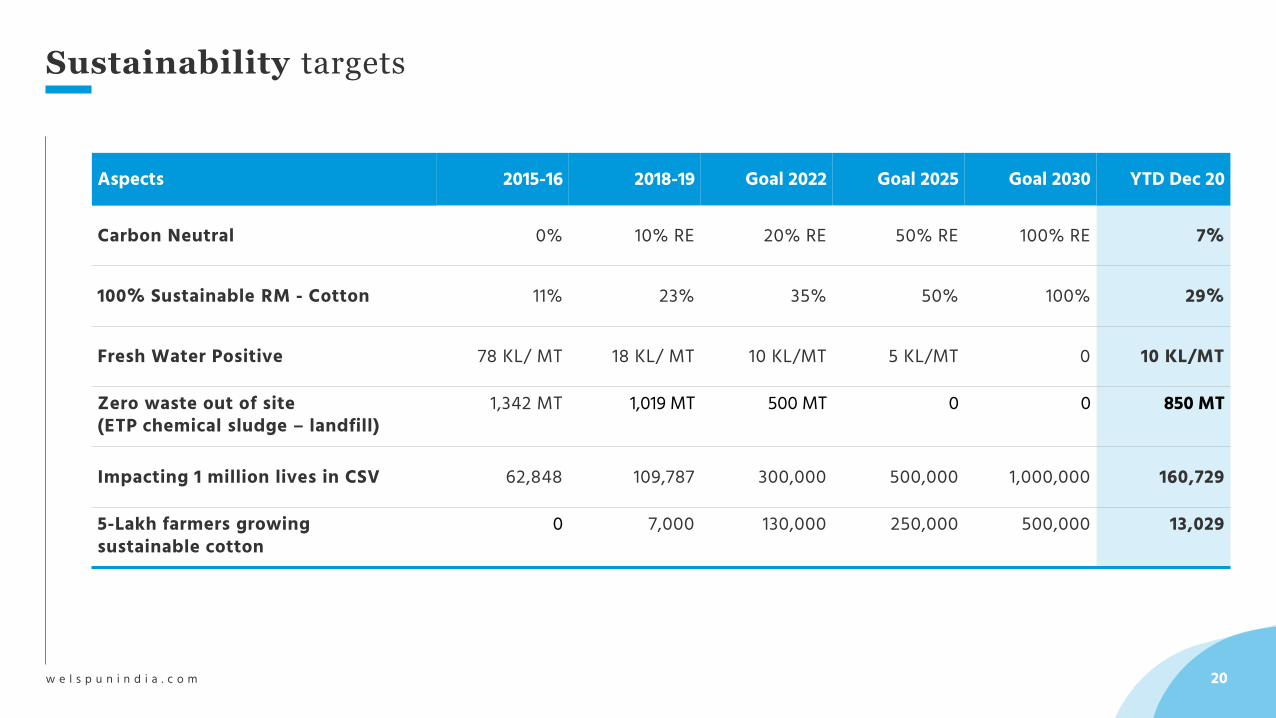
Sustainability targets
Aspects 2015-16 2018-19 Goal 2022 Goal 2025 Goal 2030 YTD Dec 20
Carbon Neutral 0% 10% RE 20% RE 50% RE 100% RE 7%
100% Sustainable RM - Cotton 11% 23% 35% 50% 100% 29%
Fresh Water Positive 78 KL/ MT 18 KL/ MT 10 KL/MT 5 KL/MT 0 10 KL/MT
Zero waste out of site(ETP chemical sludge – landfill)
1,342 MT 1,019 MT 500 MT 0 0 850 MT
Impacting 1 million lives in CSV 62,848 109,787 300,000 500,000 1,000,000 160,729
5-Lakh farmers growing sustainable cotton
0 7,000 130,000 250,000 500,000 13,029
21w e l s p u n i n d i a . c o m
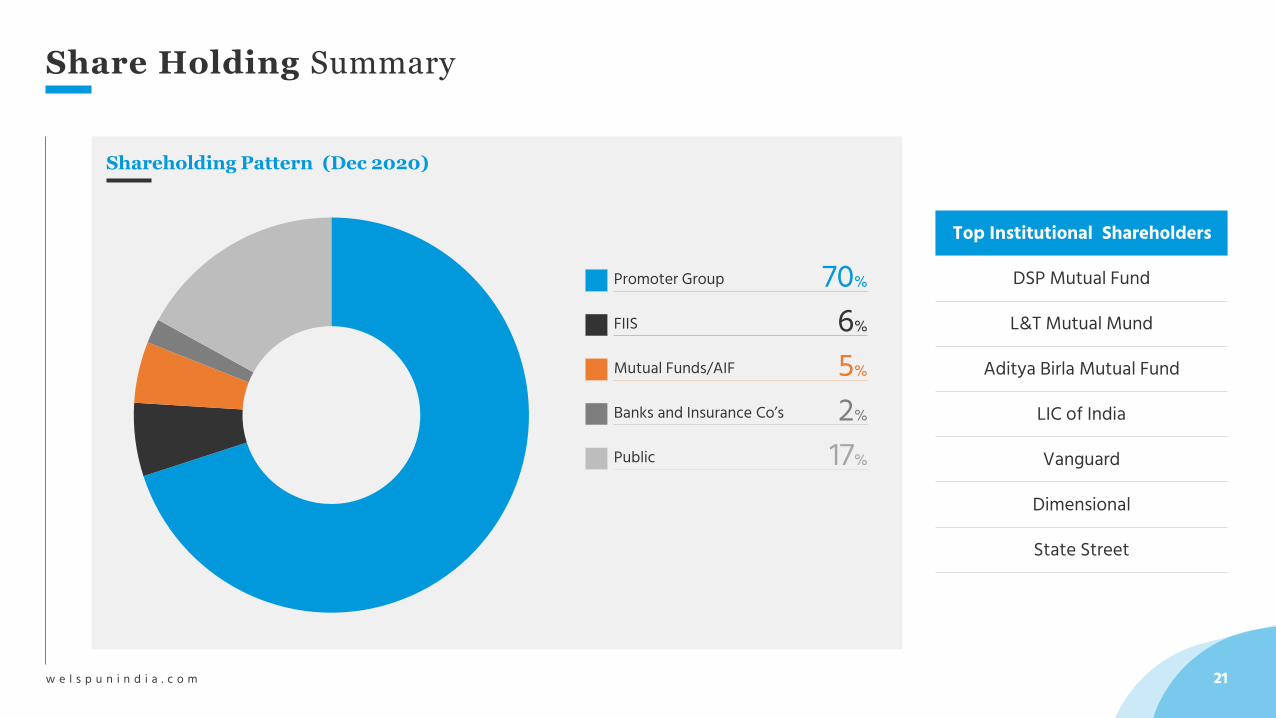
Share Holding Summary
Shareholding Pattern (Dec 2020)
Top Institutional Shareholders
DSP Mutual Fund
L&T Mutual Mund
Aditya Birla Mutual Fund
LIC of India
Vanguard
Dimensional
State Street
70%Promoter Group
6%FIIS
5%Mutual Funds/AIF
2%Banks and Insurance Co’s
17%Public
22w e l s p u n i n d i a . c o m
Disclaimer
The information contained in this presentation is provided by Welspun India Limited (the “Company”), although care has been taken to ensure that the information in this presentation is accurate, and that the opinions expressed are fair and reasonable, the information is subject to change without notice, its accuracy, fairness or completeness is not guaranteed and has not been independently verified and no express or implied warranty is made thereto. You must make your own assessment of the relevance, accuracy and adequacy of the information contained in this presentation and must make such independent investigation as you may consider necessary or appropriate for such purpose. Neither the Company nor any of its directors assume any responsibility or liability for, the accuracy or completeness of, or any errors or omissions in, any information or opinions contained herein. Neither the Company nor any of its directors, officers, employees or affiliates nor any other person accepts any liability (in negligence, or otherwise) whatsoever for any loss howsoever arising from any use of this presentation or its contents or otherwise arising in connection therewith.
The statements contained in this document speak only as at the date as of which they are made, and the Company expressly disclaims any obligation or undertaking to supplement, amend or disseminate any updates or revisions to any statements contained herein to reflect any change in events, conditions or circumstances on which any such statements are based. By preparing this presentation, none of the Company, its management, and their respective advisers undertakes any obligation to provide the recipient with access to any additional information or to update this presentation or any additional information or to correct any inaccuracies in any such information which may become apparent. This document is for informational purposes and does not constitute or form part of a prospectus, a statement in lieu of a prospectus, an offering circular, offering memorandum, an advertisement, and should not be construed as an offer to sell or issue or the solicitation of an offer or an offer document to buy or acquire or sell securities of the Company or any of its subsidiaries or affiliates under the Companies Act, 2013, the Securities and Exchange Board of India (Issue of Capital and Disclosure Requirements) Regulations, 2009, both as amended, or any applicable law in India or as an inducement to enter into investment activity. No part of this document should be considered as a recommendation that any investor should subscribe to or purchase securities of the Company or any of its subsidiaries or affiliates and should not form the basis of, or be relied on in connection with, any contract or commitment or investment decision whatsoever. This document is not financial, legal, tax, investment or other product advice.
This presentation contains statements of future expectations and other forward-looking statements which involve risks and uncertainties. These statements include descriptions regarding the intent, belief or current expectations of the Company or its officers with respect to the consolidated results of operations and financial condition, and future events and plans of the Company. These statements can be recognized by the use of words such as “expects,” “plans,” “will,” “estimates,” or words of similar meaning. Such forward-looking statements are not guarantees of future performance and actual results, performances or events may differ from those in the forward-looking statements as a result of various factors and assumptions. You are cautioned not to place undue reliance on these forward looking statements, which are based on the current view of the management of the Company on future events. No assurance can be given that future events will occur, or that assumptions are correct. The Company does not assume any responsibility to amend, modify or revise any forward-looking statements, on the basis of any subsequent developments, information or events, or otherwise.
Any reference herein to "the Company" shall mean Welspun India Limited, together with its consolidated subsidiaries.
Let’s connect
For further details please contactMr. Sanjeev SanchetiPresident (Finance) & CFOWelspun India [email protected]
Mr. Vipul GargGroup Finance & Strategy (Investor Relations)Welspun India [email protected]
welspunindia.com TheWelspunGroup welspungroup
Annexure
25w e l s p u n i n d i a . c o m
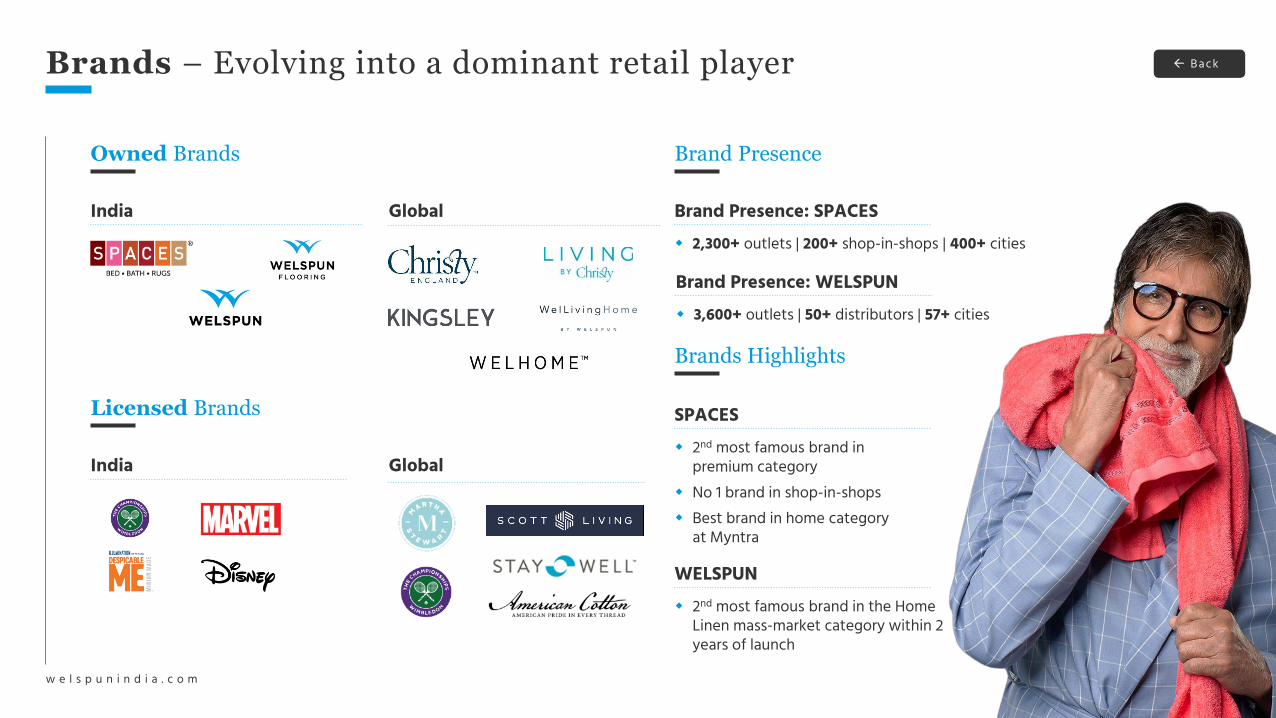
Brands – Evolving into a dominant retail player Back
Owned Brands
Licensed Brands
Brand Presence
Brand Presence: SPACES 2,300+ outlets | 200+ shop-in-shops | 400+ cities
India
India
Global
Global
Brands Highlights
SPACES 2nd most famous brand in
premium category No 1 brand in shop-in-shops Best brand in home category
at Myntra
WELSPUN
Brand Presence: WELSPUN 3,600+ outlets | 50+ distributors | 57+ cities
2nd most famous brand in the Home Linen mass-market category within 2 years of launch
26w e l s p u n i n d i a . c o m
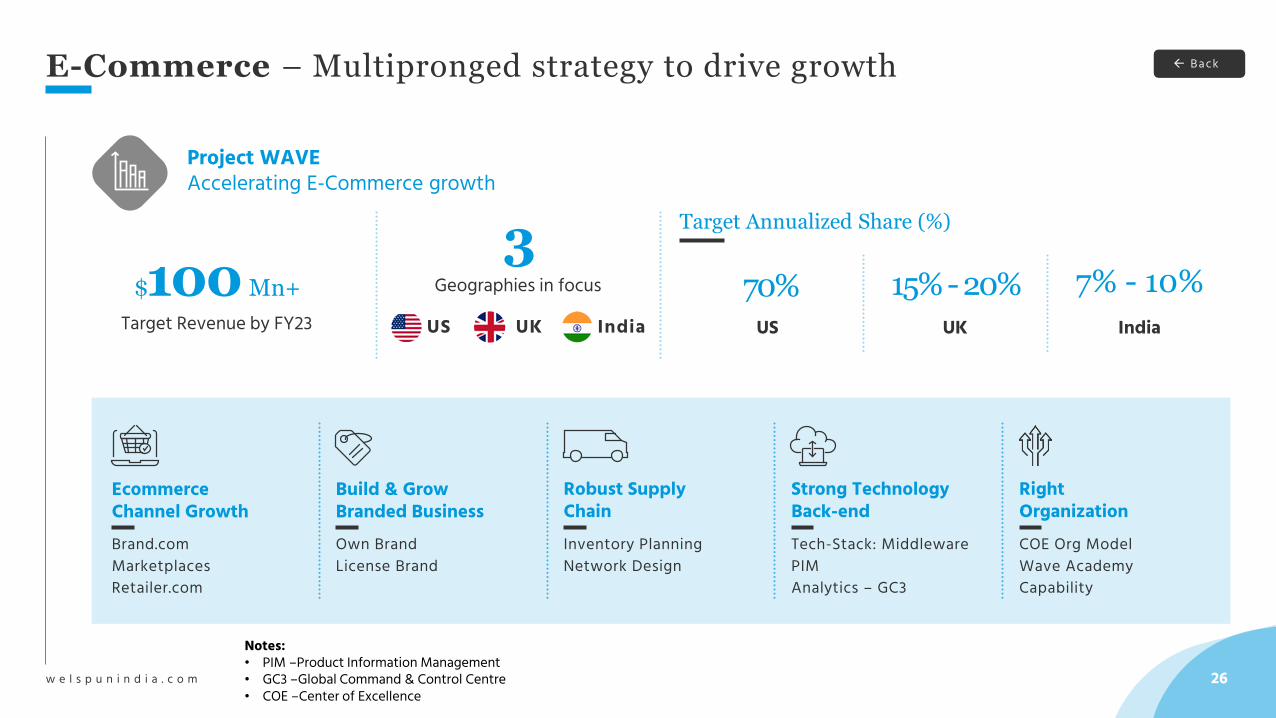
Back
Project WAVEAccelerating E-Commerce growth
$100 Mn+
Target Revenue by FY23
3Geographies in focus
Target Annualized Share (%)
70%US
15% -20%UK
7% - 10%
India
Ecommerce Channel GrowthBrand.com Marketplaces Retailer.com
Build & GrowBranded BusinessOwn Brand License Brand
Robust SupplyChain Inventory PlanningNetwork Design
Strong Technology Back-endTech-Stack: MiddlewarePIMAnalytics – GC3
Right OrganizationCOE Org ModelWave AcademyCapability
US IndiaUK
E-Commerce – Multipronged strategy to drive growth
Notes:• PIM –Product Information Management• GC3 –Global Command & Control Centre• COE –Center of Excellence
27w e l s p u n i n d i a . c o m
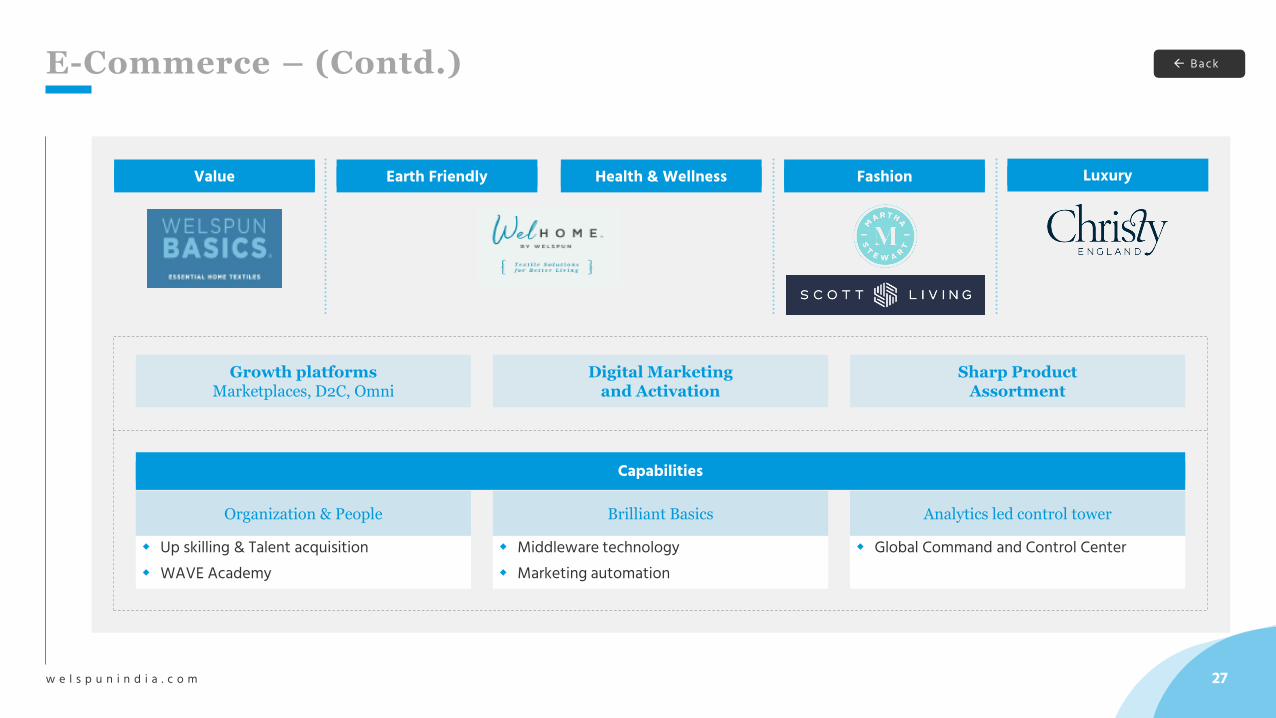
Capabilities
Up skilling & Talent acquisition WAVE Academy
Organization & People
Value Earth Friendly Health & Wellness Fashion Luxury
Middleware technology Marketing automation
Brilliant Basics
Global Command and Control Center
Analytics led control tower
Growth platforms Marketplaces, D2C, Omni
Digital Marketing and Activation
Sharp ProductAssortment
BackE-Commerce – (Contd.)
28w e l s p u n i n d i a . c o m
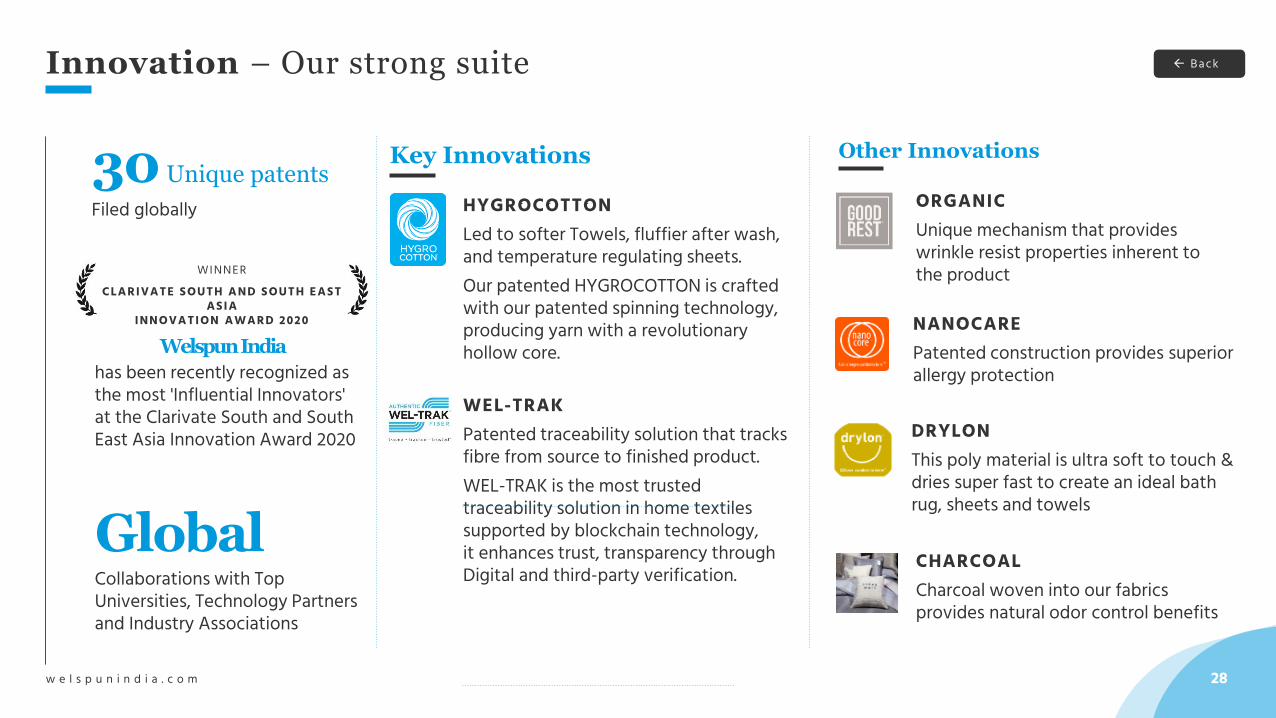
Innovation – Our strong suite Back
Other Innovations
ORGANICUnique mechanism that provides wrinkle resist properties inherent tothe product
DRYLONThis poly material is ultra soft to touch & dries super fast to create an ideal bath rug, sheets and towels
NANOCAREPatented construction provides superior allergy protection
CHARCOALCharcoal woven into our fabrics provides natural odor control benefits
Key Innovations
HYGROCOTTONLed to softer Towels, fluffier after wash, and temperature regulating sheets. Our patented HYGROCOTTON is crafted with our patented spinning technology, producing yarn with a revolutionary hollow core.
WEL-TRAKPatented traceability solution that tracks fibre from source to finished product.WEL-TRAK is the most trusted traceability solution in home textiles supported by blockchain technology,it enhances trust, transparency through Digital and third-party verification.
30 Unique patents
Filed globally
GlobalCollaborations with Top Universities, Technology Partners and Industry Associations
Welspun India
has been recently recognized as the most 'Influential Innovators' at the Clarivate South and South East Asia Innovation Award 2020
CLARIVATE SOUTH AND SOUTH EAST ASIA
INNOVATION AWARD 2020
WINNER