Earnings Presentation Third Quarter 2016
31
1 Earnings Presentation Third Quarter 2016 10 November 2016 12:00 noon UK time
Transcript of Earnings Presentation Third Quarter 2016

1
Earnings Presentation
Third Quarter 2016 10 November 2016
12:00 noon UK time

2
Forward-looking statements
Certain statements made in this announcement may include ‘forward-looking statements’. These statements may be identified by the use of words like ‘anticipate’, ‘believe’, ‘could’, ‘estimate’, ‘expect’, ‘forecast’, ‘intend’, ‘may’, ‘might’, ‘plan’, ‘predict’, ‘project’, ‘scheduled’, ‘seek’, ‘should’, ‘will’, and similar expressions. The forward-looking statements reflect our current views and are subject to risks, uncertainties and assumptions. The principal risks and uncertainties which could impact the Group and the factors which could affect the actual results are described but not limited to those in the ‘Risk Management’ section in the Group’s Annual Report and Consolidated Financial Statements for the year ended 31 December 2015. These factors, and others which are discussed in our public announcements, are among those that may cause actual and future results and trends to differ materially from our forward-looking statements: actions by regulatory authorities or other third parties; our ability to recover costs on significant projects; the general economic conditions and competition in the markets and businesses in which we operate; our relationship with significant clients; the outcome of legal and administrative proceedings or governmental enquiries; uncertainties inherent in operating internationally; the timely delivery of vessels on order; the impact of laws and regulations; and operating hazards, including spills and environmental damage. Many of these factors are beyond our ability to control or predict. Other unknown or unpredictable factors could also have material adverse effects on our future results. Given these factors, you should not place undue reliance on the forward-looking statements.

3
Jean Cahuzac CEO

4
Q3 2016 highlights
OPERATIONAL FINANCIAL
ORDER INTAKE OUTLOOK
• Revenue $928m • Adjusted EBITDA $289m
margin 31.2% • Diluted EPS $0.44 • Net cash $943m
• Good execution and successful project outcomes
• Vessel Utilisation Active: 91% Total: 75%
• New-build PLSV, Seven Sun, commenced operations
• Industry conditions remained challenging
• Subdued market activity and low order intake
• Order backlog $6.2 billion
• Cause to believe in an improvement in SURF project award activity within 18 months
• 2016 guidance raised to reflect year-to-date performance

5
Operational highlights
• Good execution sustained across the project portfolio • Successful application of market leading technology
Catcher (UK)
Aasta Hansteen (Norway)
TEN (Ghana)
Martin Linge (Norway)
WND Ph. 1 (Egypt)
Maria (Norway)

6
2016 $0.9bn (15%)
2017 $3.0bn (48%)
2018+ $2.3bn (37%)
Corporate(3)
$1.3bn (21%)
Backlog by segment
i-Tech Services
0.6bn (9%)
Backlog by Execution Date
Q3 Backlog and order intake
• Backlog of $6.2 billion(1), as at 30 September 2016 • Low order intake with no announced awards in the third
quarter
(1) Minimal impact from foreign currency movements in the quarter (2) Included $1.9 billion related to 9 long-term contracts for PLSVs in Brazil, approximately 75% of which
related to the four 550t PLSVs (Seven Waves, Seven Rio, Seven Sun and Seven Cruzeiro) (3) Corporate includes Renewables and Heavy Lift
Southern and Global Projects
SURF and Conventional(2)
$4.3bn (70%)
• 2017 and 2018+ backlog phasing adjusted to reflect a change in project scheduling

7
Ricardo Rosa CFO

8
Income statement – key highlights
Three months ended
In $ millions, unless otherwise indicated 30 September 16
Unaudited 30 September 15
Unaudited
Revenue 928 1,200
Net operating income (NOI) 195 214
Income before taxes 186 241
Taxation (37) (96)
Net income 149 145
Adjusted EBITDA(1) 289 351
Adjusted EBITDA margin 31% 29%
Diluted earnings per share $ 0.44 0.46
Weighted average number of shares (millions) 343 347
(1) Adjusted EBITDA defined in Appendix

9
Business Unit performance
Corporate Net Operating loss included: • Restructuring charges of $52 million in Q3 2016 (Q3 2015: $36 million) in relation to the resizing programmes • An impairment charge of nil in Q3 2016 (Q3 2015: $37 million)
$204m $253m
$19m
$12m
2016 2015
$195m $214m
NOI Q3 2016
$801m
$97m
$111m
$30m
$20m
2016 2015
$928m
Revenue Q3 2016
$1,200m
SURF & Conventional
i-Tech Services
Corporate (includes Renewables and Heavy Lift)
$1,068m
$(28)m $(51)m

10
Our Adjusted EBITDA margin performance
• 2015 and 2016 Adjusted EBITDA margins enhanced by – Early implementation of cost reduction measures – Consistently good execution and project de-risking – Successful completions of peak-cycle projects
Historical performance Adjusted EBITDA margin
2014 2015Vessels and other costs
Depreciation and amortisation
People
Procurement and other direct project costs
$6.0bn
$4.2bn
Operating expenses
2016 expected
annualised savings $550m
2017 expected additional annualised
savings $350m
18% 18% 21%
26%
32%
2011 2012 2013 2014 2015 YTD2016
2017e
16%

11
Summary of year to date 2016 cash flow
$ millions
Cash and cash equivalents at 31 Dec 2015 947
Net cash generated from operating activities 713 Decrease of $12 million in net operating liabilities
Net cash flow used in investing activities (186) Included capital expenditure of $276 million mainly on new-build vessel programme
Net cash flow used in financing activities (85) Included $76 million repurchase of convertible bonds
Other movements 8
Cash and cash equivalents at 30 Sep 2016 1,397
• In the third quarter $234 million net cash generated from operating activities and $71 million invested in capital expenditure
• Investment activities included $18 million cash outflow in the quarter relating to the acquisition of Swagelining
• Net cash of $943 million as at 30 September 2016 compared to $423 million at 31 December 2015

12
New-build vessels programme
Amounts include an estimate for interest to be capitalised during construction. E = estimated
557 544 499
219
31
75 Upto 31 Dec
20132014 2015 2016 E 2017 E
Capital expenditure ($ millions) Forecast
Actual spend to date
Seven Waves Seven Rio Seven Cruzeiro Seven Sun Seven Arctic
Operational 2014
Operational 2015
Operational Q4 2016
Scheduled H1 2017
Scheduled H1 2017
Scheduled H1 2017
Seven Kestrel
Estimated total spend: $1.9bn
13
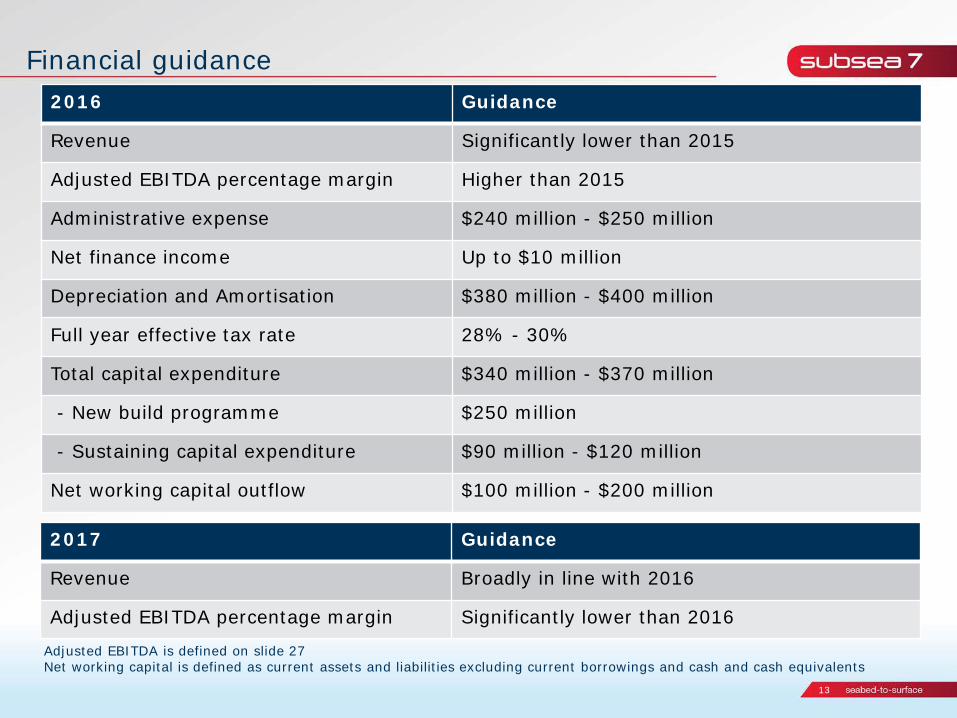
Financial guidance 2016 Guidance
Revenue Significantly lower than 2015
Adjusted EBITDA percentage margin Higher than 2015
Administrative expense $240 million - $250 million
Net finance income Up to $10 million
Depreciation and Amortisation $380 million - $400 million
Full year effective tax rate 28% - 30%
Total capital expenditure $340 million - $370 million
- New build programme $250 million
- Sustaining capital expenditure $90 million - $120 million
Net working capital outflow $100 million - $200 million
Adjusted EBITDA is defined on slide 27 Net working capital is defined as current assets and liabilities excluding current borrowings and cash and cash equivalents
2017 Guidance
Revenue Broadly in line with 2016
Adjusted EBITDA percentage margin Significantly lower than 2016

14
Jean Cahuzac CEO

15
A leading strategic partner
• Executing complex projects in challenging environments
• Working collaboratively to deliver superior results
• Providing cost-effective technical solutions
• Engaging early to identify cost reductions and Subsea Integration Alliance opportunities
• Leveraging our global presence and extensive experience
Subsea 7 A leading strategic partner in offshore energy
16
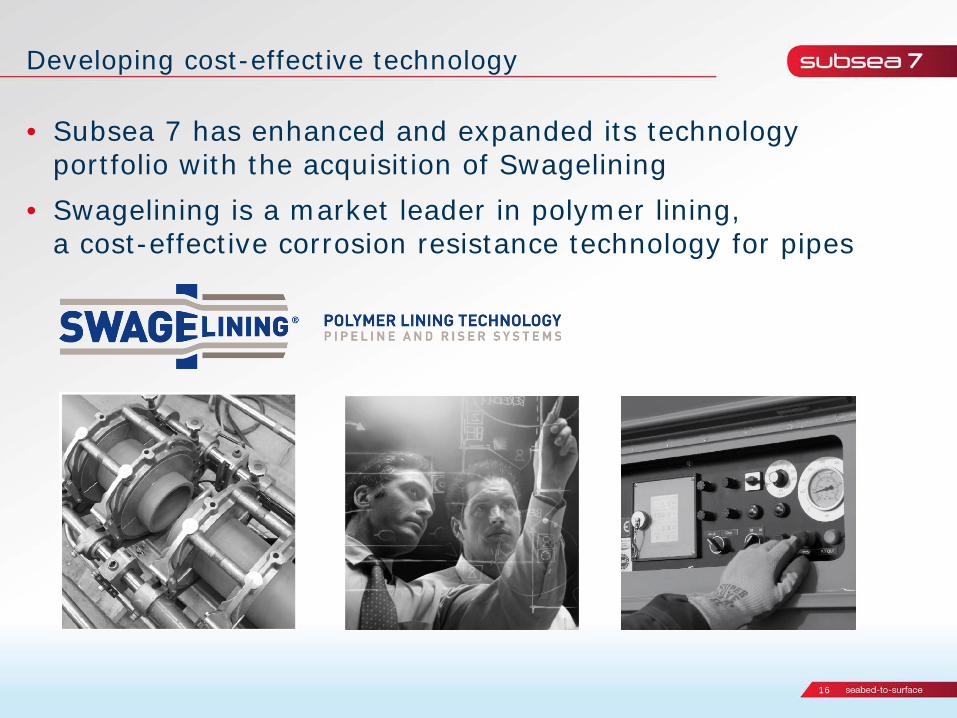
Developing cost-effective technology
• Subsea 7 has enhanced and expanded its technology portfolio with the acquisition of Swagelining
• Swagelining is a market leader in polymer lining, a cost-effective corrosion resistance technology for pipes

17
Working collaboratively: Subsea Integration Alliance
• Subsea Integration Alliance: Subsea 7 and OneSubsea unite to deliver integrated subsea oil and gas projects world-wide
• 8 paid engineering studies 30 client engagements
• Growing client interest worldwide; tendering for project awards on an integrated basis

18
Working collaboratively: Our Partnerships
• New partnership with Aker BP: – innovative contractual model
– offshore Norway
– integrated partnership basis
– three way risk/reward agreement
• Partnerships are an extension of our collaborative approach to client engagement
• Engage early and develop long-term collaborative relationships with mutual benefits

19
Market outlook
• Industry conditions are still challenging at present
• Oil price has improved over the last nine months and there is evidence that supply and demand are becoming more balanced
• Sustainable savings are lowering costs for our clients on new projects
• We have cause to believe that there could be an increase in SURF project awards in the market within the next 18 months
0
20
40
60
80
100
120
140
2013 2014 2015 2016
0123456789
10
2013 2014 2015 2016 YTD
Oil and gas Renewables
Brent oil price
Subsea 7 order intake
$
$ billion

20
Business Unit outlook
SURF and Conventional • Remaining competitive, but with the right project risk profile
• Active SURF project tenders include:
• Fortuna (Equatorial Guinea) • Golfinho (Mozambique) • KG-DWN, block 98/2 (India) • Zinia (Angola)
• Mad Dog 2 (US GoM) • Platina (Angola) • KG-D6, R-Cluster (India) • Skarfjell (Norway) • Pil (Norway)
i-Tech Services • Focusing on expanding activities worldwide
Renewables and Heavy Lift • Sustaining tender activity level

21
Q&A

22 22
Appendix
• Our global presence • Major project progression • Our fleet • Adjusted EBITDA • Segmental analysis • Supplementary Income Statement • Balance Sheet summary

23
Our global presence
• Catcher, Premier • Culzean, Maersk • Callater, Apache • Western Isles, Dana • Montrose, Talisman • USC & Pipelay, Shell • SCIRM, BP • DSVi, Various
• Stampede, Hess • Coulomb Ph2, Shell • Holstein Deep, Freeport McMoran
• PLSVs, Petrobras
• T.E.N., Tullow (JV Partner) • West Nile Delta Phase 1, BP • West Nile Delta Phase 2, BP • West Nile Delta, Burullus • East Nile Delta, Pharonic • Atoll, Pharonic • Lianzi, Chevron
• EPRS, INPEX/Chevron • Persephone, Woodside
• Martin Linge, Total • Aasta Hansteen, Statoil • Maria, Wintershall • Mariner, Statoil
• Beatrice wind farm, BOWL

24
Major project progression
Continuing projects >$100m between 5% and 95% complete as at 30 September 2016 excluding PLSV and Life of Field day-rate contracts
0% 10% 20% 30% 40% 50% 60% 70% 80% 90% 100%
Lianzi Topside (Angola)
Mariner (UK/Norway)
Clair Ridge (UK)
Persephone Ph 2 (Australia)
Aasta Hansteen (Norway)
Catcher (UK)
SLMP (Norway)
Western Isles (UK)
Sonamet (Angola)
Stampede (GOM)
West Nile Delta P1 (Egypt)
Maria (Norway)
Culzean (UK)
Sizeable ($50-$150m)
Substantial ($150-$300m)
Large ($300-$500m)
Very Large ($500-$750m)
Major (Over $750m)
Announced size of project

25
Our fleet as at 30 September 2016
• 29 vessels in the active fleet 22 Owned: Seven Borealis Seven Oceans Seven Condor Seven Rio Seven Seas Sapura 3000 (1) Oleg Strashnov (1) Stanislav Yudin (1)
Rockwater 2 Seven Atlantic Seven Falcon Seven Osprey Seven Pelican Kommandor 3000 Seven Eagle Seven Mar Simar Esperança
7 Chartered: Skandi Acergy Grant Candies Normand Subsea Siem Stingray Subsea Viking Normand Oceanic (2) Seven Viking (2)
• 4 vessels stacked
• Changes during the third quarter
Seven Navica Seven Discovery Rockwater 1 Seven Inagha
Seven Arctic Seven Kestrel Seven Cruzeiro
- Scheduled to commence operations H1 2017 - Scheduled to commence operations H1 2017 - Scheduled to commence operations H1 2017
(1) Owned and operated by a joint venture (2) Long-term charter from a vessel-owning joint venture
Seven Antares Seven Waves Seven Pacific Seven Phoenix Seven Sun
• 3 under construction
Seven Petrel Normand Seven Seven Sun
- Sold - Returned to owner - Delivered from shipyard in Q3 2016 and scheduled to commence operations Q4 2016

26
Adjusted EBITDA
• Adjusted earnings before interest, taxation, depreciation and amortisation (‘Adjusted EBITDA’) is a non-IFRS measure that represents net income before additional specific items that are considered to impact the comparison of the Group’s performance either period-on-period or with other businesses. The Group defines Adjusted EBITDA as net income adjusted to exclude depreciation, amortisation and mobilisation costs, impairment charges or impairment reversals, finance income, other gains and losses (including gain on disposal of subsidiary and gain on distribution), finance costs and taxation. Adjusted EBITDA margin is defined as Adjusted EBITDA divided by revenue, expressed as a percentage.
• The items excluded from Adjusted EBITDA represent items which are individually or collectively material but which are not considered representative of the performance of the business during the periods presented. Other gains and losses principally relate to disposals of investments, property, plant and equipment and net foreign exchange gains or losses. Impairments of assets represent the excess of the assets’ carrying amount over the amount that is expected to be recovered from their use in the future or their sale.
• Adjusted EBITDA and Adjusted EBITDA margin have not been prepared in accordance with IFRS as adopted by the EU. These measures exclude items that can have a significant effect on the Group’s income or loss and therefore should not be considered as an alternative to, or more meaningful than, net income (as determined in accordance with IFRS) as a measure of the Group’s operating results or cash flows from operations (as determined in accordance with IFRS) as a measure of the Group’s liquidity.
• Management believes that Adjusted EBITDA and Adjusted EBITDA margin are important indicators of the operational strength and the performance of the business. These non-IFRS measures provide management with a meaningful comparative for its Business Units, as they eliminate the effects of financing, depreciation and taxation. Management believes that the presentation of Adjusted EBITDA is also useful as it is similar to measures used by companies within Subsea 7’s peer group and therefore believes it to be a helpful calculation for those evaluating companies within Subsea 7’s industry. Adjusted EBITDA margin may also be a useful ratio to compare performance to its competitors and is widely used by shareholders and analysts following the Group’s performance. Notwithstanding the foregoing, Adjusted EBITDA and Adjusted EBITDA margin as presented by the Group may not be comparable to similarly titled measures reported by other companies.

27
For the period (in $millions)
Three Months Ended 30 September 2016
Three Months Ended 30 September 2015
Net operating income 195 214
Depreciation, amortisation and mobilisation 94 100
Impairment of property, plant and equipment - 37
Impairment of intangibles 1 -
Adjusted EBITDA 289 351
Revenue 928 1,200
Adjusted EBITDA % 31% 29%
Reconciliation of Adjusted EBITDA
Net operating income to Adjusted EBITDA
For the period (in $millions)
Three Months Ended 30 September 2016
Three Months Ended 30 September 2015
Net income 149 145
Depreciation, amortisation and mobilisation 94 100
Impairment of property, plant and equipment - 37
Impairment of intangibles 1 -
Finance income (1) (3)
Other gains and losses 8 (25)
Finance costs 2 1
Taxation 37 96
Adjusted EBITDA 289 351
Revenue 928 1,200
Adjusted EBITDA % 31% 29%
Net income to Adjusted EBITDA

28
In $ millions (unaudited) SURF & Conventional i-Tech Services Corporate TOTAL
Revenue 1,068 111 20 1,200
Net operating income 253 12 (51) 214
Finance income 3
Other gains and losses 25
Finance costs (1)
Income before taxes 241
In $ millions (unaudited) SURF & Conventional i-Tech Services Corporate TOTAL
Revenue 801 97 30 928
Net operating income 204 19 (28) 195
Finance income 1
Other gains and losses (8)
Finance costs (2)
Income before taxes 186
Segmental analysis
For the three months ended 30 September 2016
For the three months ended 30 September 2015
29
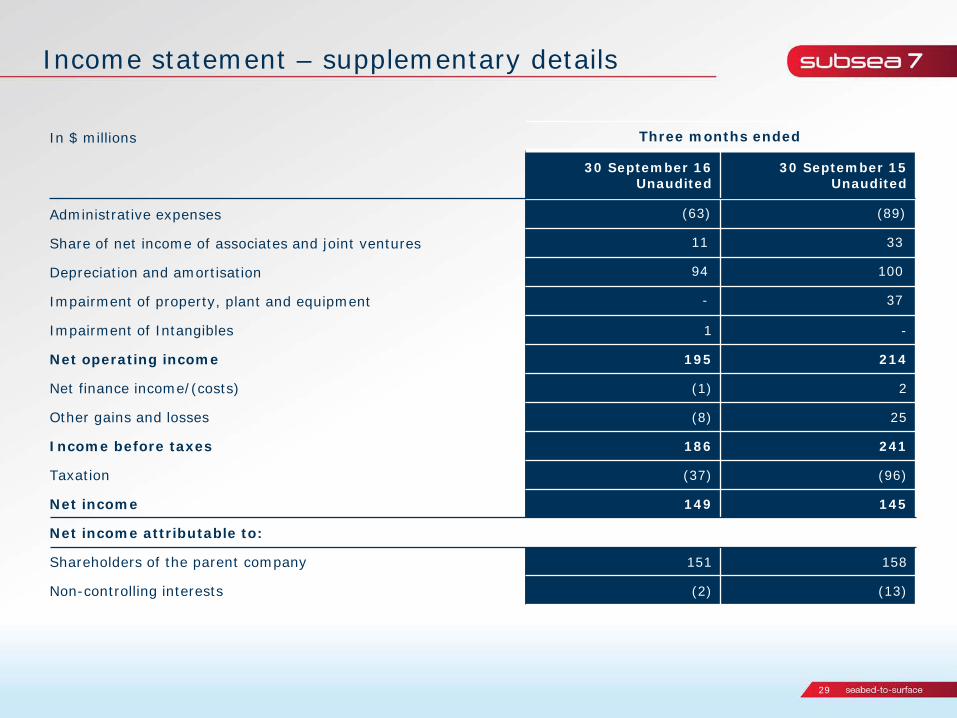
Income statement – supplementary details
In $ millions Three months ended
30 September 16 Unaudited
30 September 15
Unaudited
Administrative expenses (63) (89)
Share of net income of associates and joint ventures 11 33
Depreciation and amortisation 94 100
Impairment of property, plant and equipment - 37
Impairment of Intangibles 1 -
Net operating income 195 214
Net finance income/(costs) (1) 2
Other gains and losses (8) 25
Income before taxes 186 241
Taxation (37) (96)
Net income 149 145
Net income attributable to:
Shareholders of the parent company 151 158
Non-controlling interests (2) (13)

30
Summary balance sheet
In $ millions
30 Sep 2016
Unaudited
31 Dec 2015
Audited
Assets
Non-current assets
Goodwill 731 767
Property, plant and equipment 4,432 4,559
Other non-current assets 519 502
Total non-current assets 5,682 5,828
Current assets
Trade and other receivables 583 584
Construction contracts - assets 146 278
Other accrued income and prepaid expenses 171 152
Cash and cash equivalents 1,397 947
Other current assets 93 65
Total current assets 2,390 2,026
Total assets 8,072 7,854
In $ millions
30 Sep 2016
Unaudited
31 Dec 2015
Audited
Equity & Liabilities
Total equity 5,634 5,346
Non-current liabilities
Non-current portion of borrowings 454 524
Other non-current liabilities 211 210
Total non-current liabilities 665 734
Current liabilities
Trade and other liabilities 988 1,123
Construction contracts – liabilities 423 459
Deferred revenue 7 10
Other current liabilities 355 182
Total current liabilities 1,773 1,774
Total liabilities 2,437 2,508
Total equity & liabilities 8,072 7,854

31