
EARNINGS MANAGEMENT AND FIRM VALUE: THE …libdcms.nida.ac.th/thesis6/2012/b180280.pdf · This...
130
EARNINGS MANAGEMENT AND FIRM VALUE: THE ROLE OF INVESTOR PROTECTION AND CORPORATE GOVERNANCE Nopphon Tangjitprom A Dissertation Submitted in Partial Fulfillment of the Requirements for the Degree of Doctor of Philosophy (Finance) School of Business Administration National Institute of Development Administration 2012
Transcript of EARNINGS MANAGEMENT AND FIRM VALUE: THE …libdcms.nida.ac.th/thesis6/2012/b180280.pdf · This...
EARNINGS MANAGEMENT AND FIRM VALUE:
THE ROLE OF INVESTOR PROTECTION
AND CORPORATE GOVERNANCE
Nopphon Tangjitprom
A Dissertation Submitted in Partial
Fulfillment of the Requirements for the Degree of
Doctor of Philosophy (Finance)
School of Business Administration
National Institute of Development Administration
2012


ABSTRACT
Title of Dissertation Earnings Management and Firm Value: The Role
of Investor Protection and Corporate Governance
Author Mr. Nopphon Tangjitprom
Degree Doctor of Philosophy (Finance)
Year 2012
Earnings management usually refers to the efforts of firm managers or
executives to manipulate the earning figures in financial reporting. In general, these
activities can be perceived negatively, as they can stem from managerial opportunism.
Managers can use earnings management to report earnings for their own benefit, e.g.
to get advantage from their compensation plans. However, some may argue that
managers can use earnings management techniques to communicate or convey certain
information and to smooth the earnings to reduce volatility. Therefore, earnings
management can be both beneficial and harmful to firm value based on how managers
employ it.
Previous studies have shown evidence to support the role of investor
protection and corporate governance in reducing the level of earnings management.
However, if both investor protection and corporate governance can help to restrain
managerial opportunism, they should reduce only the negative earnings management
but not positive management. This study examines whether investor protection and
corporate governance can reduce the negative effect of earnings. Using both firm-
level analysis in the United States and Thailand, and country-level analysis from 31
countries, the results support the fact that the effect of earnings management is more
positive, or at least less negative, for firms with a higher level of corporate
governance and for countries with a higher level of investor protection.

iv
The evidence from this study shows that managerial discretion, such as
earnings management, is not actually unfavorable. Therefore, encouraging good
governance or improving investor protection is as important as improving accounting
rules and standards in order to restrain negative earnings management.

ACKNOWLEDGEMENTS
I would like offer my sincerest gratitude to many people supporting my
dissertation. First of all, I would like to thank my advisor, Asst. Prof. Dr. Kanogporn
Narktabtee, for her great advice in this dissertation. Without her this dissertation
would not have been completed. I also need to thank the dissertation committee
members, Assoc. Prof. Dr. Pornsit Jiraporn and Assoc. Prof. Dr. Kamphol
Panyagometh, for their constructive comments and suggestion so that my dissertation
can become more competent.
I would like to thank Dr. Pathathai Sinliamthong who is my first teacher in
finance and my current supervisor. Without her support, it is impossible for me to
complete this dissertation. I thank Dr. Tareque Nasser who has given me most of my
financial background in bachelor degree. I also need to thank all my finance teachers
at Assumption University, Dr. Cherdpong Siboonruang, Brother Simeon Anupatt
Petchara-Yuttachai, Dr. Radha Sirianukul, Dr. Wiyada Nittayakasetwat, Dr. Jiroj
Buranasiri, and A. Annop Peungchuer, to introduce me to the world of finance. I also
need to thank my best friend Dr. Vesarach Aumebooksuke for her support in my job
and my studying.
I also thank my other teachers at NIDA Business School,
Assoc. Prof. Dr. Aekkachai Nittayagasetwat, Assoc. Prof. Dr. Arthur Lance Dryver,
Assoc. Prof. Dr. Sasatra Sudsawasd, Asst. Prof. Dr. Prasopchoke Mongsawad,
Asst. Prof. Dr. Yuthana Sethapramote, Asst. Prof. Dr. Anukal Chiralaksanakul,
Assoc. Prof. Dr. Chanthika Pornpitakpan, Asst. Prof. Dr. Thawatchai Jittrapanun,
Assoc. Prof. Dr. Charlie Charoenwong, Asst. Prof. Dr. Anchada Charoenrook, and
Asst. Prof. Dr. Viput Ongsakul, for the great knowledge in finance and research area.
I would like to acknowledge the financial support from Assumption University
in my Ph.D. study. I also need to thank to my family, my Ph.D. classmates, and my
colleagues at Assumption University for all of their support in my study.
Nopphon Tangjitprom
July 2013

TABLE OF CONTENTS
Page
ABSTRACT iii
ACKNOWLEDGEMENTS v
TABLE OF CONTENTS vi
LIST OF TABLES viii
LIST OF FIGURES xiii
CHAPTER 1 INTRODUCTION 1
CHAPTER 2 REVIEW OF LITERATURE 4
2.1 Earnings Management Literatures 4
2.2 Corporate Governance Literatures 11
2.3 Investor Protection Literatures 13
2.4 Previous Studies about Earnings Management and 15
Corporate Governance or Investor Protection
CHAPTER 3 THEORITICAL FRAMEWORK AND HYPOTHESES 19
3.1 Theoretical Framework 19
3.2 Hypothesis Development 27
CHAPTER 4 RESEARCH DESIGN 29
4.1 Empirical Data 29
4.1.1 Firm-Level Analysis 29
4.1.2 Country-Level Analysis 32
4.2 Research Methodology 38
4.2.1 Firm-Level Analysis 39
4.2.2 Country-Level Analysis 41
CHAPTER 5 ANALYSIS AND RESULTS 44
5.1 Descriptive Statistics 44
5.1.1 Firm-Level Analysis For United States 44

vii
5.1.2 Firm-Level Analysis For Thailand 46
5.1.3 Country-Level Analysis 48
5.2 Inferential Statistics 52
5.2.1 Firm-Level Analysis For United States 53
5.2.2 Firm-Level Analysis For Thailand 64
5.2.3 Country-Level Analysis 77
CHAPTER 6 CONCLUSION AND RECOMMENDATION 103
6.1 Conclusion 103
6.2 Implication and Recommendation 107
6.3 Future Researches 109
BIBLIOGRAPHY 111
BIOGRAPHY 117

viii
LIST OF TABLES
Tables Page
4.1 Anti-director Rights Score for each country 33
4.2 Legal Enforcement Score for each country 35
4.3 Public enforcement of securities law 36
5.1 Descriptive Statistics of Sample Firms in United States 45
5.2 Summary of ASSET4’s Corporate Governance Score in United States 46
5.3 Descriptive Statistics of Sample Firms in Thailand 47
5.4 Descriptive Statistics of Sample Firms in Thailand based on CG-star 48
5.5 Descriptive Statistics of Sample Firms in 31 Countries 49
5.6 Investor Protection Score for 31 Countries 50
5.7 The Effect of Earnings Management on Firm Value in United States 53
(No Control Variable)
5.8 The Effect of Earnings Management on Firm Value in United States 54
(With Control Variables)
5.9 The Effect of Corporate Governance on the Relation between 55
Earnings Management and Firm Value in United States
5.10 The Effect of Earnings Management on Firm Value for High-CG 56
Firm and Low-CG Firms in United States
5.11 The Effect of Corporate Governance on the Relation between 57
Earnings Management and Firm Value using Dummy Variable
in United States
5.12 The Effect of Shareholders’ Rights on the Relation between 58
Earnings Management and Firm Value in United States
5.13 The Effect of Shareholders’ Rights on the Relation between 58
Earnings Management and Firm Value using Dummy Variable
in United States
ix
5.14 The Effect of Corporate Governance on the Relation between 59
Earnings Management and Firm Value in United States using
the Robust Standard Error
5.15 The Effect of Corporate Governance on the Relation between 60
Earnings Management and Firm Value in United States using
Fama-MacBeth Regression
5.16 The Effect of Corporate Governance on the Relation between 61
Earnings Management and Firm Value in United States using
Year Dummy Variables
5.17 The Effect of Absolute Discretionary Accruals on Firm Value in 62
United States
5.18 The Effect of Corporate Governance on the Relation between 62
Absolute Discretionary Accruals and Firm Value in United States
5.19 The Effect of Corporate Governance on the Relation between 63
Absolute Discretionary Accruals and Firm Value using Dummy
Variable in United States
5.20 The Level of Earnings Management on Each CG-star Group 65
in Thailand
5.21 The Effect of Earnings Management on Firm Value in Thailand 66
(No Control Variable)
5.22 The Effect of Earnings Management on Firm Value in Thailand 66
(With Control Variables)
5.23 The Effect of Earnings Management on Firm Value for Firms with 67
and without CG-Star in Thailand
5.24 The Effect of Corporate Governance on the Relation between 68
Earnings Management and Firm Value using CG-Star Dummy
Variable in Thailand
5.25 The Effect of Corporate Governance on the Relation between 69
Earnings Management and Firm Value using Each CG-Star Dummy
Variable in Thailand
5.26 The Effect of Earnings Management on Firm Value for Firms in 70
Different CG-Star Group in Thailand

x
5.27 The Effect of Corporate Governance on the Relation between 71
Earnings Management and Firm Value using CG-Star Dummy
Variable in Thailand (Only Firms with CG-Star)
5.28 The Effect of Corporate Governance on the Relation between 72
Earnings Management and Firm Value in Thailand using the Robust
Standard Error
5.29 The Effect of Corporate Governance on the Relation between 73
Earnings Management and Firm Value in Thailand using
Fama-MacBeth Regression
5.30 The Effect of Corporate Governance on the Relation between 74
Earnings Management and Firm Value in Thailand using
Year Dummy Variables
5.31 The Effect of Total Accruals on Firm Value in Thailand 75
5.32 The Effect of Corporate Governance on the Relation between 76
Total Accruals and Firm Value in United States
5.33 The Effect of Earnings Management on Firm Value Based on 78
International Evidence (No Control Variable)
5.34 The Effect of Earnings Management on Firm Value Based on 79
International Evidence (With Control Variables)
5.35 The Effect of Investor Protection on the Relation between 80
Earnings Management and Firm Value using Shareholders Rights
5.36 The Effect of Investor Protection on the Relation between 81
Earnings Management and Firm Value using Legal Enforcement
5.37 The Effect of Investor Protection on the Relation between 82
Earnings Management and Firm Value using Public Enforcement
5.38 The Effect of Investor Protection on the Relation between 83
Earnings Management and Firm Value using Aggregate Investor
Protection
5.39 The Effect of Earnings Management on Firm Value in Different 85
Overall Investor Protection Group (Two Groups)
5.40 The Effect of Investor Protection on the Relation between 86
Earnings Management and Firm Value using Dummy Variable
(Two Groups)

xi
5.41 The Effect of Earnings Management on Firm Value in Different 87
Overall Investor Protection Group (Three Groups)
5.42 The Effect of Investor Protection on the Relation between 88
Earnings Management and Firm Value using Dummy Variable
(Three Groups)
5.43 The Effect of Investor Protection on the Relation between Earnings 89
Management and Firm Value using the Robust Standard Error
5.44 The Effect of Investor Protection on the Relation between Earnings 90
Management and Firm Value using the Robust Standard Error
(Two Groups)
5.45 The Effect of Investor Protection on the Relation between Earnings 90
Management and Firm Value using the Robust Standard Error
(Three Groups)
5.46 The Effect of Investor Protection on the Relation between Earnings 91
Management and Firm Value using Fama-MacBeth Regression
5.47 The Effect of Investor Protection on the Relation between Earnings 92
Management and Firm Value using Fama-MacBeth Regression
(Two Groups)
5.48 The Effect of Investor Protection on the Relation between Earnings 92
Management and Firm Value using Fama-MacBeth Regression
(Three Groups)
5.49 The Effect of Investor Protection on the Relation between Earnings 93
Management and Firm Value using Year Dummy Variables
5.50 The Effect of Total Accruals on Firm Value Based on International 94
Evidence
5.51 The Effect of Investor Protection on the Relation between 95
Total Accruals and Firm Value
5.52 The Effect of Investor Protection on the Relation between 96
Earnings Management and Firm Value (Firm-level)
5.53 The Effect of Investor Protection on the Relation between 97
Earnings Management and Firm Value with Interaction Effect
of Country Dummy Variables (Firm-level)

xii
5.54 The Effect of Investor Protection on the Relation between 98
Earnings Management and Firm Value between Low-IP and
High-IP Group (Firm-level)
5.55 The Effect of Earnings Management on Firm Value for Some 99
Countries with High Level of Investor Protection
5.56 The Effect of Earnings Management on Firm Value for Some 100
Countries with Low Level of Investor Protection

xiii
LIST OF FIGURES
Figures Page
3.1 Original Level of Earnings Management and Its Effect (Bad) 24
3.2 Both Good EM and Bad EM Have Reduced Similarly 25
3.3 The Effect of Earnings Management is Less Negative 25
3.4 Original Level of Earnings Management and Its Effect (Good) 26
3.5 The Effect of Earnings Management is More Positive 26

CHAPTER 1
INTRODUCTION
Earnings management usually refers to the efforts of firm managers or
executives to manipulate the earning figures in financial reporting. Even though these
activities may not be illegal, they can arise from managerial opportunism in terms of
taking advantage of compensation plans (Healy, 1985; Baker, Collins and Reitenga,
2003; Bregstresser and Philipon, 2006; Kuang, 2008). For example, managers can
overstate the reported profit in order to demonstrate the firm’s performance and obtain
incentive payments, such as bonuses. This managerial opportunism arises with the
popularity of pay-for-performance compensation plan. Another way of using earnings
management is to understate the reported earnings in order to reduce the current
market price of the common stock. Reporting lower earnings will suppress the stock
price, which can lead to the lower exercise price of stock options (Baker, Collins, and
Reitenga, 2003). For this reason, managers will get more benefits from the employee
stock ownership plan (ESOP)
Even though many studies have mentioned the negative side of earnings
management, some have argued that managers can use earnings management
techniques in a positive way. For example, they can use earnings management as a
tool to communicate or convey certain information that is not included in the reported
earnings figures (Dutta and Gigler, 2002). Another example of using earnings
management positively in relation to firm value is to smooth the reported earnings in
order to reduce volatility (Magrath and Weld, 2002).
Therefore, earnings management can be beneficial or harmful for the firm’s
value based on how managers employ it. In general, earnings management consists of
both positive and negative earnings management. Positive earnings management is
the use of earnings management in a way that benefits firm value. Meanwhile,
negative earnings management is the use of earnings management for private benefit
that can be harmful to the firm’s value.

2
There is no simplified way to determine which component of earnings
management is harmful or beneficial. However, if there were a mechanism that could
help to restrain managerial opportunism, the existence of such a mechanism would be
helpful in reducing negative earnings management but not positive earnings
management. Examples of such a controlling mechanism are corporate governance
and investor protection.
Corporate governance can act as a mechanism to restrain managerial
opportunism. Firms with poor corporate governance are more vulnerable to
managerial opportunism. Therefore, earnings management is likely to be for private
benefit and could be harmful to the firm’s value. However, firms with good corporate
governance can reduce their managerial opportunism and mitigate these problems. In
this case, earnings management is less harmful or of more benefit regarding firm
value.
Investor protection is about how well the rights of investors can be protected
based on a country’s law and legal system. While corporate governance is about how
outside shareholders’ rights (minority shareholders rights) are protected by the firm’s
regulation and behavior, investor protection is about how shareholders’ rights are
protected by the country’s law. Therefore, corporate governance is measured based on
firm-level analysis, while investor protection can be measured based on country-level
analysis.
Based on the above discussion, if corporate governance or investor protection
is effective in controlling managerial opportunism or negative earnings management,
the effect of earnings management on firm value will be more positive or less
negative. Therefore, the main research question for this study is whether corporate
governance or investor protection can affect the relation between earnings
management and firm value.
The impact of corporate governance can be examined based on firm-level
analysis. In this study, firm-level analysis is performed based on the empirical
evidence from two countries, the United States and Thailand. In the United States, the
information about corporate governance is based on the ESG score (Environmental,
Social and Governance score) provided by ASSET4, the affiliate of Thomson Reuters.
The corporate governance score for ASSET4 includes board structure, compensation
policy, board function, vision & strategies, and shareholders’ rights.
3
In Thailand, corporate governance data in Thailand are provided by the Thai
Institute of Directors (Thai IOD). The Thai IOD has collected data about the corporate
governance of firms listed on the Stock Exchange of Thailand. Instead of reporting
numerical CG scores, the Thai IOD reports CG performance in terms of number of
stars. Each firm is classified as 5-star, 4-star, or 3-star based on their corporate
governance performance.
The impact of investor protection is examined based on country-level analysis.
Investor protection measurement is based on three dimensions, which are outside
investor rights or shareholders’ rights, legal enforcement, and public enforcement.
Outside investor rights or minority shareholder rights are based on the anti-director
rights index provided by La Porta et al. (1998). Legal enforcement is the measurement
of how well the country’s law is enforced, which is based on the efficiency of the
judicial system, assessment of the rule of law, and the corruption index (Leuz, Nanda
and Wysocki, 2003; La Porta et al., 1998). Public enforcement of security law is
based on La Porta et al. (2006). The index of public enforcement includes five
dimensions: the characteristics of the supervisor of the security law, the power of the
supervisor to issue rules, the investigation power of the supervisor of securities
markets, the order index, and the criminal index.

CHAPTER 2
REVIEW OF LITERATURE
This chapter summarizes related literatures about earnings management,
corporate governance, and investor protection. The first section is literatures about
earnings management. It provides an overview concept of earnings management and
discusses about how to measure the level of earnings management empirically. The
following sections discuss about the background of corporate governance and investor
protection, which can be the good controlling mechanism to restrain managerial
opportunism. Finally, the previous studies about the relation between earnings
management and corporate governance or investor protection are discussed.
2.1 Earnings Management Literatures
Earnings management usually refers to the situation where managers use their
own discretion in financial reporting in order to alter the reported number (Healy and
Wahlen, 1999). There are numerous studies about earnings management in accounting
and financial research. In those studies, the different measurements of earnings
management are used in the analysis. One of the most popular measurements is
known as discretionary accruals that are used to measure management discretion in
earnings reporting using the accrual accounting technique. The use of accrual-based
earnings management in accounting and financial literatures becomes well-known
since Healy’s (1985) paper. Many researchers have used this accrual-based earnings
management measurement in their finance and accounting researches. Thereafter, the
original total accruals has modified until it is known as modified Jones’ discretionary
accrual model (Jone, 1991; Dechow, Sloan and Sweeney, 1995).
Besides using managerial discretions, like accruals, to manipulate the reported
earnings, firms may engage in earnings management by avoiding reporting losses or
earnings decrease. Burstahler and Dichev (1997) find that there is abnormally low
number of firms reporting small losses or small decreases in their earnings, whereas
5
there is abnormally high number of firms reporting small positive earnings or small
increases in their earnings.
Another recent popular measurement of earnings management is called ‘Real
earnings management’. Real earnings management is when managers use their
discretion to manipulate firm’s real activities instead of financial reporting. One of the
important examples of this real activities manipulation is about the research and
development (R&D) expenses (Baber, Farefield and Haggard, 1991; Bushee, 1998).
Other examples of real earnings management activities are sale manipulation,
discretionary expenditure reduction, and overproduction (Sugata Roychowdhury,
2006).
For accruals-based earnings management, Healy (1985) has studied about the
use of managerial accounting decision to take advantages of higher managerial
compensation. Using earnings-based bonuses encourages managers or executives to
report higher earnings and get more benefits in their compensation plan. He finds that
there is strong association between this earnings-based bonuses scheme and the size
of accounting accruals that is the proxy of earnings management. Managers use
accruals to increase reported earnings when the bonuses scheme allow them to get
higher benefits and managers also use accruals to decrease report earnings when their
bonuses have reached the bound. The use of accounting accruals as the proxy to
capture management discretion over earnings becomes popular in later research about
earnings management. However, total accruals consist of discretionary and non-
discretionary accruals. Using total accruals to measure earnings management implies
that non-discretionary accruals are constant overtime. DeAngelo (1986) studies the
use of earnings management for the benefit in management buyout. Managers may
use their discretions in order to manipulate the reported earnings, which may alter a
stock price. This earnings manipulation can help them to purchase common stocks
with lower price. He finds that managers have understated firm’s earnings and
successfully achieve the management buyout at the lower price. In this study, the
change in total accruals from previous period is used as the proxy of discretionary
accruals. However, this implies that the past accruals are used as the normal level of
total accruals. The change of total accruals from previous period will reflect the
deviation from the normal level.

6
Jones (1991) studies about the use of earnings management during the
investigation for import relief supporting. During the period of study in United States,
the government has granted the import relief subsidy in order to support the local
business. Firms applying for this support needs to prove that they are damaged from
the imports during that period. Jones finds that firms have used the accruals to reduce
their earnings during the investigation. The accrual-based earnings management is
measured by discretionary accruals, which is the difference between total accruals and
non-discretionary accruals (normal level of accruals). The linear regression technique
is applied in order to measure the expected normal level of total accruals instead of
using previous accruals. The total accruals are regressed on the factors that affect the
level of accruals, which are the change in revenues and the level of property, plant,
and equipment. The residual terms from this regression is the part of total accruals
that cannot be explained by the above factors and will be used as the proxy for
discretionary accruals. The Jones model becomes the most popular model that is
commonly used in the literature about earnings management (McNichols, 2000).
DeFond and Jiambalvo (1994) have proposed the use of cross-sectional
regression to estimate the discretionary accruals. The cross-sectional regression is
estimated for each industry. The deviation of firm’s accruals from the normal level of
accruals estimated by all firms within the industry is used as discretionary accruals.
Dechow, Sloan, and Sweeney (1995) have proposed the modification to the original
Jones model. The Jones model uses the change in revenue as one factor to determine
the normal level of accruals or non-discretionary accruals. However, the modified
Jones model will exclude the change in net accounts receivable from the change in
revenues in order to include the effect of change in net account receivable in the
discretionary accruals. In the other word, the modified Jones model uses the change in
cash revenue instead of the change in total revenues as in the original Jones model.
The use of Jone’s discretionary accrual model. Discretionary accruals are estimated
from the deviation from the normal level of accruals, which is estimated from time-
series regression. This estimation implies that the accruals are stationary over time
Bartov, Gul and Tsui (2001) have evaluated various discretionary accruals
model to see their ability to detect earnings management. They use both univariate
test and multiple logistics regression in order to justify which model can distinguish
between firms with unqualified audit report and firms with qualified audit report (that

7
is the sign of managerial earnings management). They find that most of time-series
models, including original Jones model and modified Jones model, cannot
significantly distinguish between those firms. However, cross-sectional Jones model
and cross-sectional modified Jones model can successfully distinguish those firms
with qualified audit report from those with unqualified audit report.
Dechow and Dechev (2002) study about the quality of accruals and earnings.
They discuss that the quality of accruals is associated with the estimation error of
accruals. In order to capture this estimation error, the regression model on the accruals
is estimated using past, present, and future operating cash flow as explanatory
variables. The residuals from this regression reflect the quality of accruals. Kothari,
Leone, and Wasley (2005) introduce the performance-matched discretionary accruals.
The deviations from the normal level of accruals or non-discretionary accruals based
on Jones and modified Jones model may not be totally from the management
discretion but from the change in firm performance. Therefore, the discretionary
accruals computed from modified Jones model will be subtracted by the discretionary
accruals of matching firms in order to control the effect of performance change. The
matching firm is another firm in the same industry with the closest return on assets
(ROA).
In the recent paper, Dechow, Hutton, Kim and Sloan (2012) have improved
the accrual-based earnings management model by including the information about the
reversal of accruals. Previous researches have shown that the accruals from one
period will reverse in another period in another period. Accrual-based earnings
management measurement usually requires the regression model to estimate the
normal level of accruals. Discretionary accruals are the deviation from this normal
level, which can be measured by the residual from the regression. Therefore,
including these reversals in the regression can significantly improve the power of test.
Another measurement of earnings management level as the variation from
accrual-based model is aggregate earnings management measurement proposed by
Leuz, Nanda and Wysocki (2003) in their study about investor protection. They use
aggregate earnings management to capture the earning management level of each
country and they find that there is a relation between country investor protection level
and aggregate earnings management. This aggregate earnings management
measurement is the country measurement that combines both earnings smoothing

8
measures and earnings discretion measures. Aggregate earnings management is the
combination of four earnings management measurement, which are the ratio of
standard deviation between reported earnings and cash flow from operation, the
correlation between accruals and operating cash flows, the magnitude of accruals, and
the ratio of small reported profits and small reported losses. The country median level
of each measurement will represent the country level and they will be ranked among
countries in each measurement. The aggregate earnings management is the average of
the ranks of these four measurements.
For real earnings management, Baber, Fairfield and Haggard (1991) study
about managerial discretion in R&D expenditure for United States industrial firms.
They find that the R&D expenditures are significantly lower when firms would like to
report positive earnings or higher earnings from previous year. This evidence implies
that manager tries to manipulate the reported earnings by cutting R&D expenses if
they want to increase reported earnings to meet some target level of profit. Bushee
(1998) has examined the effect of stock trading turnovers and the role of institutional
investors on the reduction of R&D to reach higher reported earnings. If investors
concerns about long-run performance of firms, it should be less incentives for
managers to cut the investment in R&D in order to report higher current earnings. The
results show that the likelihood of cutting R&D is lower when there are higher portion
of institutional ownership. However, if those institutional investors engage more in
momentum trading strategy, the probability of R&D reduction will be higher. This
implies that managers have more incentive to reduce R&D investment if investors
have concerned on short-term trading, like higher trading turnover or using
momentum trading strategy, rather than long-term performance.
Sugata Roychowdhury (2006) has studied about manager’s manipulation on
real activities in order to avoid reporting negative earnings. He has used three
manipulation methods to figure out the level of earnings management. First, sales
manipulation can be done by extending credit term or giving high price discounts. If
managers would like to manipulate the reported earnings, they can use sale
manipulation to generate unsustainable sales and boost up the reported revenues. The
second manipulation is the reduction of discretionary expenditures. Discretionary
expenditures are expenses that can be influences by managers like R&D expenses or
9
advertising expenses. Managers can manipulate reported earnings by reducing these
discretionary expenses. The third one is overproduction. Managers can increase the
production level intentionally in order to reduce the fixed overhead costs and lower
reported cost of goods sold.
Cohen and Zarowin (2010) study about the use of earnings management of
firms involving with seasoned equity offerings (SEOs). The earnings management in
this study includes both real earnings management and accrual-based earnings
management. They find the strong evidence that SEOs firms highly involve with
earnings management in both real and accrual ones. They also find that the
performance of post-SEO declines for firms using earnings management during SEO.
However, firms using real earnings management face severely declining in their post-
SEO operating performance rather than firms using accrual-based earnings
management.
Many studies about earnings management have pointed out that earnings
management are from the opportunistic behavior of managers. In the other word,
managers use earnings management as a tool in order to transfer wealth to themselves,
for example in form of compensation plan. Healy (1985) shows that managers use
earnings management to increase reported earnings in order to get more bonuses in
their compensation plan. DeAngelo (1986) reports that managers use income-
decreasing accruals to understate reported earnings so that they can implement the
management buyout program with cheaper stock price.
Baker, Collins, and Reitenga (2003) examine and report that stock options
compensation plan can creates an incentive for managers to use discretionary accruals
to decrease reported earnings and stock price in order to get stock options with lower
exercise price in their compensation plan. Cheng and Warfield (2005) propose that the
equity incentives for managers are also the incentives for them to engage in earnings
management. These managers have stock-based compensation and their wealth links
to future stock performance. Therefore, they use earnings management to adjust the
reported earnings to meet market expectation in order to maintain the stock price
level.
Bregstresser and Philipon (2006) have discussed that pay-per-performance
compensation plan provides the incentives for mangers to do earnings management.
In the firm with CEO compensation is tied to the value of common stock or stock

10
options, there will be more use of discretionary accruals to manipulate reported
earnings. Kuang (2008) also finds that performance-vested stock options (PVSOs) in
United Kingdom are also the incentive for managers to manipulate reported earnings.
Managers whose compensation plan is closely related to PVSOs have engaged more
in earnings managements.
However, there are some studies that provide the argument to support earnings
management. Sometimes, accounting reports are not effective enough to communicate
information to investors (Healy and Palepu, 1995). Therefore, earnings management
can be used as a tool to communicate additional information about expected future
earnings. Dutta and Gigler (2002) have developed the model in order to justify the
benefit of earnings management. In the model, they show that the shareholders wealth
could be lower if the potential of earnings management is restricted by accounting
standard and auditing process. Therefore, under the restriction, the benefit of earnings
management is reduced as it is more costly for the manager to communicate trustful
forecasting.
Watts and Zimmerman (1990) have discussed about how managers use their
discretions in earnings reports. Managers can exercise their discretions for their own
benefits but as costs for other parties. This situation is known as opportunistic
behavior. However, managers can also exercise their discretions on accounting reports
for benefits of firms and shareholders. For example, they use income-increasing
report in order to avoid debt covenant problems and reduce cost of technical default.
Magrath and Weld (2002) discussed the benefit of earnings management to the
firm value. Managers can use earning management to reduce the volatility of earning.
This can help to reduce the level of firm perceived risks by investors and increase the
value of the firm. Therefore, managers who have engages in earnings management
have followed the value maximization principal. Ning (2006) has also argued that
earnings management is not fraud because it is done within legitimate constraint.
Moreover, the earnings management may create the misrepresentation of earnings
reporting but it does not misrepresent the firm economic value in terms of total value
of asset, liabilities, and equity. Pornsit Jiraporn, Miller, Yoon and Kim (2008) have
studied about earnings management, corporate governance, and firm value in United
States. They provide the empirical evidence using the data of United States firms and
find that earnings management is not negative to firm value.

11
In summary, there are two broad measurements of earnings management
activities, which are accrual-based earnings management and real earnings
management. Moreover, earnings management is perceived negatively in many
previous studies as it is usually from managerial opportunism. Managers can use their
discretions to manipulate reported earnings for their own benefits e.g. to secure their
position, or to earn more benefits from a compensation plan. However, some papers
have argued that some earnings management can be informative and positive to firm
value. In this perspective, managers use earnings management for a benefit of firm or
to communicate some earnings forecasting to public.
2.2 Corporate Governance Literatures
Jensen and Meckling (1976) propose principal-agency relationship within a
firm to understand the agency problems. Managers can take their private benefits out
of firms’ asset by consuming perquisites. They show that the levels of perquisites
taken as private benefits by managers are related to their fraction of ownerships. If
managers hold less fraction of the firm, they will take more private benefits because
they have less incentive to maximize shareholders’ wealth. There will be the costs
incurring from this conflicts in principal-agency relationship between managers and
shareholders, which is known as agency costs. These agency costs have included
monitoring costs, bonding costs and residual losses.
Fama and Jensen (1983) discuss this agency problem more in the perspective
of the separation between ownership and control. The firm controlling is in the hand
of managers whereas ownership belongs to shareholders. When managers make
decision for the firms, their decisions may be different from the goal of the firms to
maximize shareholder wealth because managers do not share the wealth with
shareholders. In this situation, the agency problem is arising and there is a need for
the effective controlling of managerial decisions like corporate governance
mechanism. La Porta, Lopez-de-Silanes, Shleifer and Vishny (2000) also discuss about
the problem that the benefits of outside shareholders are expropriated by inside or
controlling shareholders. Corporate governance is the mechanism for outside
investors to protect themselves from this appropriation. Legal investor protections are
also needed in order to make this appropriation become more difficult.

12
Johnson, Boone, Breach and Friedman (2000) use the period during Asian
financial crisis to show that the significant decrease in asset prices and exchange rate
is partly from the effect of weak corporate governance. During worse expectation
about future economies, the countries with low corporate governance mechanism and
shareholder rights protection are more vulnerable to the problem of managerial
expropriation of private benefits. This results in decreasing of asset prices dramatically in
those countries. Therefore, the corporate governance can play the important role to
determine the extent of economic problems during the crisis period.
Gomper, Ishii and Metrick (2003) have developed Governance Index or G-
index from each firm provision about shareholder rights. If the firm has more
provision to restrict shareholder rights, the governance index will be higher.
Therefore, firms with higher G-index are the firms with weaker shareholder rights and
are named as Dictatorship firms. Firms with lower G-index have stronger
shareholders rights and classified as Democracy firms. They find out that there are
strong negative relationship between firm values and G-index. This means the firms
with higher G-index (weaker shareholder rights) will have lower firm value measured
by Tobin’s Q ratio.
Beside shareholders rights, another important aspect about corporate
governance is about the structure of board of director. In Beasley’s (1996) study how
the board composition helps in controlling accounting fraud, the board composition
has included the presence of audit committee in board of director and the proportions
of outside directors. Other board structures in the studies about corporate governance
are financial expertise of outside director (Park and Shin, 2004) and frequency of
board meetings (Xie, Davidson and DaDalt, 2003).
Nowadays, there are many organizations have provide the proprietary data
about the corporate governance in both firm level and country level. Examples of
these corporate governance score are Standard and Poor (S&P)’s GAMMA score or
Environmental, Social, and Governance (ESG) score provided by ASSET4, which si
an affiliate of Thomson Reuter.
Ioannou and Serafeim (2010) investigated the impact of firm factors, industry
factors and institutional factors to corporate social performance by using ASSET4’s
environmental, social and governance or ESG scores. They find out that country
institutional factors are the most important determinant of governance performance.

13
The corporate governance component of ASSET4’s ESG scores consists of 5 aspects,
which are board structure, compensation policy, board functions, vision and strategy,
and shareholders rights. Eccles, Ioannou, and Serafeim (2011) have studied the
impact of environmental and social policies adoption to the performance of firm based
on ESG performance score. Firms who are classified as high sustainability can
outperform their matched firms in low sustainability group. Therefore, adoption of
these policies does not deteriorate shareholders’ value.
In conclusion, corporate governance (CG) has provided the important role to
reduce managerial opportunism. Therefore, corporate governance can be the good
controlling mechanism to reduce the negative earnings management, which arise from
managerial opportunism.
2.3 Investor Protection Literatures
La Porta, Lopez-de-Silane, Shleifer and Vishny (1998) have studied the
investor protection in the view of shareholders rights and legal enforcement. They
have studied about the company laws in many countries in order to figure out the
level of shareholder rights in each country. They found that the difference in the level
of shareholder rights depends on the difference in law system and law origin. The law
system can be classified into common and code law. The law origin in their study is
classified into English-origin, German-origin, French-origin, and Scandinavian-origin.
The legal enforcement can be the substitute for the protection of shareholder rights as
specified by law. Although the law has not included much of shareholder rights, the
strong legal enforcement will lead the active court system to help investors from
management abuses. After the publication of this study, the role of investor protection
becomes popular area of studying in finance and accounting research.
Furthermore, the studies about investor protection can help us to understand
about the difference in corporate governance across countries (La Porta, Lopez-de-
Silane, Shleifer and Vishny, 2000). Klapper and Love (2004) find that firms in the
country with weaker investor protection will have lower average corporate
governance score. Furthermore, they find the positive relationship between corporate
governance and firm value and this relationship will be stronger in the country with
14
weaker investor protection. Therefore, the corporate governance is more important for
the country that there is lower level of investor protection by law.
La Porta, Lopez-de-Silane and Shleifer (2006) have extended their previous
studies about investor protection. They studied the role of security law and investor
protection in two main aspects, private enforcement and public enforcement. Private
enforcement is the law that is related to the parties who are directly related to the
issuance transaction. This includes the disclosure requirements that are related to
which extend the issuers need to disclose the information and liability standard of
issuers, distributors, and accountants. The public enforcement is related to the role of
regulator or supervisor of securities market. This can be measured by the
characteristics of supervisor and the power of supervisor to make a rule or perform
investigation.
Leuz, Narda and Wysocki (2003) studied about the role of investor protection
towards the earning management across countries. They used country-level analysis
and measure the investor protection based on outside investor’s rights and legal
enforcement based on La Porta et al. (1998). Country-level earnings management is
measured by aggregate earnings management, which consists of smoothing reported
operating earnings using accruals, the correlation between changes in accounting
accruals and operating cash flows, the magnitude of accruals, and the avoidance of
small losses. They find that the country with strong investor protection in either
outside investor rights or legal enforcement will have lower level of aggregate
earnings management measures.
Defond, Hung and Trezevant (2007) have examined the role of investor
protection and information contents in earnings announcements. The earnings
announcements will be more informative in the country with better investor
protection. Cheng and Shiu (2007) find that firms in the country with better
shareholder protection will use more equity funds. This evidence shows the effect of
investor protection on the capital structure decisions.
Rossi and Volpin (2004) find that investor protection is related to merger and
acquisition activities. They studies the cross-border deals and find that the target firms
will be from the country with less investor protection whereas the acquirers will be in
the country with better investor protection. Bris and Carbolis (2008) studied the cross-
border merger to examine the effect of investor protection towards the premium in

15
merger activities. The result reveals that when the firms from the country with higher
investor protection acquire the target firms from the country with lower investor
protection, the premiums in acquisition will be higher than the acquisition of similar
domestic firms. These results show indirect effect of investor protection on firm value
based on the transfer of corporate governance mechanism to the target firms in merger
and acquisition activities.
Francis and Wang (2008) find that the relationship of investor protection and
earnings quality depends on the auditors. The positive effect of investor protection
and earnings quality is prominent only for firms with Big4 auditors. The earning
quality of firms with non-Big4 auditors is not related to the level of investor
protection. This result implies that the accounting practices depend on the country
investor protection.
Therefore, investor protection also plays the important role in restricting some
opportunistic behavior. Managers can do to take private benefits from firm value and
take advantages of shareholders.
2.4 Previous Studies about Earnings Management and Corporate
Governance or Investor Protection
Beasley (1996) study the role of board director composition in controlling
accounting fraud. The logit regression is used to distinguish between fraud and non-
fraud firms. The result reveals that audit committee does not help to reduce the
likelihood of accounting frauds, whereas outside directors can do. Larger proportions
of outside board members can reduce the chance of accounting frauds significantly.
Moreover, the likelihood of frauds is lower for firms with more tenure of outside
directors. Park and Shin (2004) examine the effect of board composition on earnings
management in Canada. They find that outside directors cannot help to restrain
earnings management but firms whose directors are from financial institutions have
the lower level of abnormal accruals. Moreover, firms with representation from
institutional shareholders also have lower abnormal accruals. This evidence suggests
that, in general, outside directors cannot help to reduce earnings management.
However, board members from financial institution or institutional shareholders can
effectively help to restrain the earnings management activities.

16
Peasnell, Pope and Young (2005) study the role of board monitoring on
earnings management for firms in United Kingkom. They find no direct effect of the
role of outside director or audit committee to the level of earnings management.
However, the interaction between outside director and audit committee is statistically
significant. Therefore, the effectiveness of board monitoring of outside director
depends on the role of audit committee.
Xie, Davidson and DaDalt (2003) study the role of board of directors and audit
committee to restrict the level of earnings management. They find that the current
discretionary accruals are smaller for firms having board members with financial
backgrounds and firms whose board and audit committee have meetings more
frequently. This evidence supports the role of board and audit committee to constrain
managerial opportunism with earnings management.
Ahmed, Hossain and Adams (2006) perform the analysis about the effect on
corporate governance on annual accounting earnings informativeness using the data
from New Zealand. The result reveals that the earning informativeness is inversely
related to board size but is not related to outside directors.
Abdul Rahman and Ali (2006) have studied the relation between board size
and earnings management for firms listed in Malaysian stock market. They use cross-
sectional modified Jones model to estimate discretionary accruals as the measurement
of earnings management. They find the positive association between the size of
earnings management and the size of the board of directors. This evidence implies the
ineffectiveness of larger-size board.
Shen and Chih (2007) study the effect of corporate governance and earnings
management in Asian countries. They find that firms with good corporate governance
have engaged less in earnings management activities. Moreover, firms with larger size
and higher growth have engaged more in earnings management for both earnings
smoothing and earnings aggressiveness. However, good corporate governance can
help to mitigate these effects in earnings management.
Abed, Al-Attar and Suwaidan (2012) have studied the effect of corporate
governance and earnings management in Amman Stock Exchange (Jordan). They also
use modified Jones model to estimate discretionary Accruals. The result is different
from other countries because there is no association between earnings management

17
and corporate governance mechanism. They explain this result as the unique
characteristics of Jordanian firms where the majority of firms are owned by
identifiable group. Therefore, the agency problem is not pronounced and the role of
corporate governance mechanism is less necessary in this situation.
Mohamad, Abdul Rashid and Shawtari (2012) examine the role of corporate
governance in reducing earnings management in Malaysian government-linked
companies. They find that some corporate governance aspect has the impact to the
level of earnings management. The duality role in the company whose CEO and
Chairman are the same can lead to the opportunistic behavior and higher earnings
management activities. Firms with non-duality have lower level of discretionary
accruals. Moreover, more number of board meeting also help to reduce earnings
management.
Wang, Sheu and Chung (2011) study the role of corporate governance to
reduce earnings management as the result of Sarbanes-Oxley Act. The results reveal
that the implementation of Sarbanes-Oxley Act can help to increase the integrity of
reported financial statements. Cornett, McNutt, and Tehranian (2009) have shown the
evidence that the corporate governance can significantly affect the level of earnings
management for large U.S. banks. Some corporate governance mechanism like board
independence can help to reduce the earnings management because managers have
lower ability to influence over the board. However, performance pays can motivate
the CEO to manage earnings to get higher compensations.
Hazarika, Karpoff and Nahata (2012) show the role of internal corporate
governance to restrict managers’ behavior in earnings management. They find the
evidence that earnings management is positively related to CEO’s forced turnover.
They conclude their result as the reaction of the board of director to prevent too-
aggressively earnings management before further external consequence arise.
For the role of investor protection on reported earnings, Leuz, Nanda and
Wysocki (2003) studied about the role of investor protection towards the earning
management across countries. They find that the country with strong investor
protection in either outside investor rights or legal enforcement will have lower level
of aggregate earnings management measures.
Shen and Chih (2005) have studied about earnings management activities in
the banking industry based on international sample of 48 countries. They find that

18
two-third of sample firms have engaged in earnings management. They also find that
the strong investor protection can reduce the level of earnings management within the
banking industry. Moreover, the level of earnings management is low during the
period of higher real GDP per capita. Defond, Hung and Trezevant (2007) also report
the empirical evidences from 26 countries to support that earnings announcements are
more informative in the country with better investor protection.
In conclusion, the previous studies have shown the evidence to support the
role of corporate governance and investor protection in reducing managerial
opportunism to manipulate reported earnings. Most of these studies use accrual-based
earnings management, which is usually based on modified Jones model. Both
corporate governance and investor protection have played the important role in
reducing the level of earnings management based on previous researches. The general
explanation is both corporate governance and investor protection can help to restrain
managerial opportunism.
However, the previous studies have focused on the role of corporate
governance or investor protection to reduce the level of earnings management. If there
are both good earnings management and bad earnings management, both corporate
governance and investor protection should help in reducing bad earnings management
rather than good earnings management.

CHAPTER 3
THEORITICAL FRAMEWORK AND HYPOTHESES
From the literature review discussed earlier, earnings management can be
structured into good or informative earnings management and bad or opportunistic
earnings management. It is difficult to clarify which earnings management is
informative or adverse. However, if there is a mechanism that can help to control the
opportunistic behaviors, it should be able to reduce the bad earnings management.
The earnings management will be more informative and beneficial to firm value.
Investor protection and Corporate Governance is about how the rights of
investors are protected by firm commitment, law or legal enforcement. They can be
the good proxy for the mechanism to reduce managerial opportunism. If corporate
governance works well to reduce bad earnings management, the relation between
earnings management and firm value should be more positive or less negative in firms
with better corporate governance. In addition, if investor protection also works well to
reduce bad earnings management, the relation between earnings management and
firm value should also be more positive or less negative in the countries with higher
level of investor protection.
3.1 Theoretical Framework
Conceptually, the firm value is the present value of expected future cash flow
discounted by appropriate discount rate (William, 1938). Based on this viewpoint, the
firm value is the function of future cash flow and discount rate. The discount rate is
known as the cost of capital that reflects the risk of the firms, as follows;
),(
)1( 01
rCFfV
dteCFr
CFV rt
tt
tt
(1)

20
From the above equation, V represent the current firm value. CFt is the cash
flow at time t in the future and r is the cost of capital of the firm. Therefore,
overstating or understating the current income through earnings management should
have no direct effect on firm value. However, Dechow, Kothari and Watts (1998)
have proposed and provided evidence to support that current earnings are a good
forecast of future cash flows based on the cross-correlation and serial correlation
structure between earnings and cash flows. This evidence provides the hint that
managers can use their discretions in order to improve earnings in formativeness
(Watt and Zimmerman, 1986). This will make earnings management become
desirable and beneficial to firm value. However, it is also possible that managers use
their discretions in reporting earnings so that they can take private benefits. For
example, managers may overstate the earnings so that they can get more performance-
based compensation like bonuses (Healy, 1985; Baker, Collins and Reitenga, 2003).
In this viewpoint, earnings management will be negative to firm value.
Therefore, earnings management can be characterized by both good and bad
perspective. Although earnings management is usually from opportunistic behavior of
managers, it is possible that earnings management can be value-added. Earnings
management is composed of good earnings management and bad earnings
management.
BG EMEMEM (2)
From the above equation, EM is earnings management. EMB is bad earnings
management that is usually from opportunistic behaviors of managers. Manager have
involved in this kind of earnings management for their own benefit. Therefore, firms
with high earnings management can be perceived as the riskier firms and risk-averse
investors will require more expected return to compensate, which results in higher
cost of capital for the firm and finally deteriorate firm value. EMG is good earnings
management or management that creates value for firms, which can be called
informative EM or value-added EM. In this case, managers will use earnings
management to communicate some private information to the public. Even though
there might be a cost of signaling this information, the benefit from signaling is higher
and will result in the improvement of firm value.

21
Then, suppose that there are controlling mechanisms that can help to reduce
bad earnings management. In another word, the existence of controlling mechanism
will reduce the opportunistic behavior of managers in managing the earnings.
Therefore, the level of bad earnings management should be lower under this
controlling mechanism as follows;
XEMEM
XEMfEM
BB
BB
*
* ),( (3)
EMB* is the level of bad earnings management in the absence of controlling
mechanism. X is the controlling mechanism. β represents the relationship between
controlling mechanism and bad earnings management, which β is always negative,
meaning that higher controlling level will help to reduce bad earnings management. In
the same way, the good earnings management can be characterized as follows;
*
*
* ),(
GG
GG
GG
EMEM
XEMEM
XEMfEM
(4)
EMG* is the level of good earnings management in the absence of controlling
mechanism. γ represents the relationship between controlling mechanism and good
earnings management. Because good earnings management should not be affected by
the controlling mechanism, the existence of controlling mechanism will not alter good
earnings management; so γ equals to zero. Combining equation 2-4, it can be shown
relationship between earnings management and controlling mechanism as follows.
XEMEM
XEMEMEM
EMEMEM
BG
BG
*
** (5)
EM* is the level of earnings management in the absence of controlling
mechanism. This equation shows the relationship between earnings management and

22
controlling mechanism, which is expected to be negative. La Porta et al. (2000) have
discussed about the important of corporate governance to reduce the managerial
opportunism to expropriate private benefits from firms. They also mentioned that
legal investor protection is like external corporate governance mechanism. Leuz et al.
(2003) have studied and provided the evidence that investor protection can reduce the
earnings management aggregate. Therefore, corporate governance and investor
protection should provide the important role in a firm as controlling mechanism to
reduce managerial opportunism to do earnings management that deteriorate firm’s
value.
Based on the definition of good earnings management and bad earnings
management, the relationship between firm value and the level of earnings
management can be as follows.
BG
BG
EMEMV
EMEMfV
EMfV
210
),(
)(
(6)
V represents firm value. α0 is the mean level of firm value based on other
factors beside earnings management. α1 is the relationship between good earnings
management and firm value, which is positive by definition. α2 is the relationship
between bad earnings management and firm value, which is negative.
In order to show the linkage between the role of controlling mechanism and
firm value, the different scenarios about the level of controlling mechanism are
established. The first scenario is when there is no controlling mechanism at all.
Therefore, the value of firm will depend on the original level of good and bad
earnings management as follows.
*2
*101
*
*
BG
BB
GG
EMEMV
EMEM
EMEM
(7)

23
The second scenario is the situation that the controlling mechanism has existed
and helped to reduce the level of bad earnings management. The value of firm will be
as follows.
)( *2
*102
*
*
XEMEMV
XEMEM
EMEM
BG
BB
GG
(8)
The third scenario has assumed that the controlling mechanism is very
effective so that all bad earnings management is eliminated. The value of firm will
depend solely on the good earnings management as follows.
*103
*
0
G
B
GG
EMV
EM
EMEM
(9)
From above three scenarios, they can be summarized in equation 9. The firm
value in the third scenario (V3) is highest as there is no presence of bad earnings
management because it is totally eliminated by the existence of the controlling
mechanism.
*103
*2
*102
*2
*101
)(
G
BG
BG
EMV
XEMEMV
EMEMV
(10)
The firm value in the first scenario (V1) is lower from the negative effect of
bad earnings management (α2<0). The firm value in the second scenario (V2) is
between V1 and V3 because the interaction effect from corporate governance or
investor protection (βX) helps to reduce the bad earnings management (β<0) and
increase firm value.
Leuz et al. (2003) have provided the evidence that investor protection can
effectively reduce the level of aggregate earnings management. In the countries with

24
the high level of investor protection, the aggregate earnings management is relatively
lower compared to the countries with lower level of investor protection. Investor
protection is how investor rights are protected by law and legal enforcement and can
be the good example of controlling mechanism. However, if there are both good
earnings management and bad earnings management, there is no logical explanation
why investor protection should reduce good earnings management. Good earnings
management is informative and not from managerial opportunism. Investor protection
should be help in reducing only bad earnings management because firm managers are
beware of legal obligation if they decide to use earnings management for their own
benefit. Therefore, investor protection should help in reducing bad earnings
management that is from managerial opportunism rather than reducing good or
informative earnings management.
Let illustrate the above arguments in the following figures.
Figure 3.1 Original Level of Earnings Management and Its Effect (Bad)
In the figure 3.1, it shows the original level of earnings management and its
effect on firm value. Let assume that bad earnings management is more likely than
good earnings management. The effect of earnings management on firm value should
be relatively negative as in the right panel of the figure 3.1.
Thereafter, the corporate governance or investor protection is introduced and it
helps in reducing the level of earnings management. However, if both good earnings
management and bad earnings management reduced similarly, both corporate
governance and investor protection do not act as the effective controlling mechanism
to reduce managerial opportunism. The result is shown as follows.
25
Figure 3.2 Both Good EM and Bad EM Have Reduced Similarly
In the figure 3.2, it shows that the level of both good earnings management
and bad earnings management have reduced similarly. In this case the effect of
earnings management on firm value should be similarly negative as shown in the right
panel of the figure 3.2.
However, if corporate governance or investor protection can effectively act as
the good controlling mechanism to reduce managerial opportunism in earnings
management, it should help in reducing bad earnings management rather than the
good one. In this case, the effect of earnings management on firm value should be less
negative. This result is shown as follows.
Figure 3.3 The Effect of Earnings Management is Less Negative
In the figure 3.3, it shows that only bad earnings management has reduced
from the original case. In this case the effect of earnings management on firm value
should be less negative as shown in the right panel of the figure 3.3.

26
However, the effect of earnings management can be originally positive. In this
situation, the good earnings management can dominate the bad earnings management.
The level of earnings management and its effect on firm value can be shown in figure 3.4
Figure 3.4 Original Level of Earnings Management and Its Effect (Good)
In the figure 3.4, it shows the situation that the level of good earnings
management dominates bad earnings management and the effect of earnings
management on firm value is generally positive. If corporate governance or investor
protection can effectively reduce managerial opportunism in earnings management,
the bad earnings management should be lower. In this case, the effect of earnings
management on firm value should be more positive as follows.
Figure 3.5 The Effect of Earnings Management is More Positive

27
3.2 Hypothesis Development
Some previous researches have shown the evidence that earnings management
is from managerial opportunism whereas some studies have argued that it can be
beneficial and managers use it to communicate some information about the future
earning forecasting. Therefore, earnings management can both positively and
negatively affect to the firm value. Nowadays, most firms deploy the performance-
based compensation plan for firm executives and this compensation plan motivates
firm executives to manipulate earnings for their own benefit (Kolb, 2006). Therefore,
in general, earnings management should be negatively affect to firm value because
managers tend to use it for their own private benefits rather than to communicate
information.
However, if there are good controlling mechanisms, this should help to reduce
managerial opportunism. Fama and Jensen (1983) proposed that firms need to have
such a good controlling mechanism in order to reduce the agency problem when there
is the separation between ownership and control. This controlling mechanism can be
gauged internally in each firm based on the level of their corporate governance or CG.
Firms with good governance give the importance to the transparency and shareholder
rights. In such firms, managerial opportunism is less likely because managers are
restricted by the corporate governance scheme. Therefore, the first hypothesis for this
study is as follows.
Hypothesis I: The relation between earnings management and firm
value should be more positive (or less negative) for the firm with
higher level of corporate governance.
The above hypothesis can be examined by testing the interaction term between
the effect of earnings management and the level of corporate governance. This
interaction term should be positive in order to support the first research hypothesis.
Furthermore, La Porta et al. (2000) have discuss about the role of investor
protection as the external corporate governance to control the firm’s managers or
insiders from taking private benefit from firm value. Investor protection is about how
investors’ rights are protected law and legal enforcement in each country. Therefore,

28
this investor protection can be a good controlling mechanism to reduce managerial
opportunism because managers should be afraid of legal enforcement if they perform
opportunistic behavior for their own benefits and harmful to the value of shareholders.
The second hypothesis is constructed as follows.
Hypothesis II: The relation between earnings management and firm
value should be more positive (or less negative) in the country with
higher level of investor protection.

CHAPTER 4
RESEARCH DESIGN
From the theoretical model and research hypotheses discussed in previous
chapter, the empirical research design is required to provide the evidence to support
that model and examine the research hypotheses. In this chapter, the research design
including empirical data and research methodology about how to test the research
hypothesis are discussed in details.
4.1 Empirical Data
The data used in this research is mainly collected from Datastream on
WorldScope database. The data is collected based on both firm level and country level
according to the research hypotheses.
4.1.1 Firm-Level Analysis
For firm-level analysis, it is used to examine the first research hypothesis. The
firm-level data is collected from two countries, which are United States and Thailand.
The firm value is measured by Tobin’s Q (Yermack, 1996; Jiraporn Pornsit,
Miller, Yoon and Kim, 2008), which is the ratio between the market value of a firm
and the book value of a firm. In the other word, Tobin’s Q is the market value of a
firm scaled down by its book value. More of this ratio implies the firm can create
more value added to its book value.
The accrual-based earnings management measurement is used in this research.
The discretionary accruals are used as the measurement of earnings management in
this study. First, the total accruals are calculated by
iiiiiii DEPTPSTDCLCashCAAccruals (11)

30
Accrual or total accrual is computed from a change in non-cash current assets
less a change in non-debt liabilities and deducted by depreciation expenses. Healy
(1985) has proposed that this total accrual can be used as a proxy for earnings
management level. The discretionary accruals are computed from the cross-sectional
modified Jones model. Jones (1991) has introduced the way to measure discretionary
accruals as the difference between expected accruals and actual accruals. Thereafter,
total accrual is used to estimate the discretionary accrual based on the following
regression.
itt
t
t
tt
tt
i
Asset
PPE
Asset
RECREV
AssetAsset
Accrual
1
21
11
01
1 (12)
From the above equation, Asset is total assets, REV is total revenue, REC is
the receivables and PPE is property, plant, and equipment. Accrual is computed based
on equation 11. The regression based on equation 12 is estimated based on cross-
section basis for each industry to minimize the effect of time-series variation in
accounting data (DeFond and Jiambalvo, 1994). The residuals from the above
regression are used as discretionary accruals.
Therefore, there are two measurements of earnings management used in the
firm level analysis. The first measurement is the absolute total accruals (ATA) scaled
down by operating cash flow (Leuz et al., 2003) where the total accruals are based on
Healy (1985). The second measurement is the absolute discretionary accruals (ADA)
based on cross-sectional modified Jones model. The absolute form is used because it
is only the magnitude, but not the sign, of these accruals that can measure the earnings
management level.
The controlling factors that may affect the firm market value are capital
structure, firm size, and firm growth. Capital structure is a factor that may affect firm
value. Although there are a numerous arguments about the effect of capital structure
to firm value, many theories support that the financing decisions can affect the value
of firms. Those theories include agency theory (Jensen and Meckling, 1976),
signaling theory (Ross, 1977), and trade-off theory (Bradley, Jarrell and Kim, 1984).
The capital structure will be measured by the leverage or debt ratio, which is the ratio
between total debt and total asset.

31
Firm size can also affect the firm value. Hirschey and Spencer (1992) have
provided the evidence for the important of the size effect to market valuation of
fundamental factors. The logarithm of total asset is used as the control variable for the
size effect in the regression model.
Firm growth affects the market value of firm as the investors will include the
growth rate into the stock value as in the constant-growth dividend discount model
(Gordon, 1959). The firm growth rate is computed by the percentage change of firm
total asset.
For United States, the data used in this research include all firms traded on the
New York Stock Exchange (NYSE) or NASDAQ during 2002-2010. The accounting
data is from the WorldScope Database. The Corporate Governance Score is provided
by ASSET4, an affiliate of Thomson Reuters, that provides Environmental, Social,
and Governance (ESG) data for worldwide firms. The firms whose information is not
available in WorldScope or Asset4 were excluded from the analysis. Finally, there are
5,153 firm-year observations included in the analysis for the firm-level analysis of
United States.
ASSET4’s ESG score is composed of three pillars, which are Corporate
Environmental Practice, Corporate Social Responsibility, and Corporate Governance.
The score on corporate governance pillar is focused. Corporate governance score in
ASSET4 has included Board Structure, Compensation Policy, Board Function, Vision
& Strategies, and Shareholders Rights.
For Thailand, the data used in the research is collected from all firms listed in
the Stock Exchange of Thailand during 2008-2011. The accounting data used in this
study includes total asset, total equity, total debt, market value of equity or market
capitalization, total revenue, property plant and equipment, total current assets, total
current liabilities, cash and equivalent, short-term debts, and total depreciations. Firms
in financial industries and firms with incomplete data are excluded from the analysis.
Finally, there are 1,748 firm-year observations.
Corporate governance data in Thailand is provided by Thai Institute of
Director (Thai IOD). Thai IOD has collected the data about the corporate governance
of firms listed in the Stock Exchange of Thailand. Instead of reporting CG score, Thai
IOD has reported the CG performance in term of a number of stars. The firms in the
best group of corporate governance are classified as 5-star group. The following
32
group is reported as 4-star and 3-star respectively. None of firm is reported as 1-star
or 2-star. However, there are some firms where data is reported as “Not Available”.
4.1.2 Country-Level Analysis
For the country-level analysis, the data are collected from 31 countries during
the year 2002-2011, including only firms whose accounting data are available in
WorldScope Database. There are finally 155,622 firm-year observations in this
country-level analysis.
The firm value is measured by Tobin’s Q ratio. Tobin’s Q is the ratio between
the market value of firm asset and the book value of firm asset. The country-level firm
value is from the average of firm value in each country year-by-year during 2002-
2011. The country-level earnings management is the average of earnings management
measurement for all firms in each year. There are also two measurements of earnings
management used in country-level analysis. The first earnings management is the
absolute discretionary accruals (ADA). The second measurement is the absolute total
accruals (ATA) scaled down by operating cash flow, which is one component of
aggregate earnings management proposed by Leuz et al. (2003).
The same set of control variables as in firm-level analysis is used. Country-
level debt ratio and growth is the average of debt ratio and growth rate in each country
year-by-year during 2002-2011. The size effect is measured by the natural logarithm
of country aggregate output or gross domestic product (GDP) in each year during
2002-2011.
Investor protection will be measured based on the outside investor rights, legal
enforcement, and security law enforcement. Outside investor rights or minority shareholder
rights are based on the anti-director rights index provided by La Porta et al. (1998).
The anti-director rights score is computed by adding one point if that country
1) has oppressed minority mechanism.
2) has pre-emptive rights that can be waived by shareholders’ vote
only.
3) allows for mail proxy.

33
4) allows for cumulative voting.
5) does not allow firm to require shareholders to deposit their shares
before general shareholders meeting.
6) has the minimum percentage of ownership to call for Extraordinary
shareholders meeting less than or equal to ten percent.
Table 4.1 Anti-director Rights Score for Each Country
Country Oppressed Minority
Pre-emptive
Mail Proxy
Cum. Voting
No Block Extra-
Meeting Anti-
Director
Australia 1 0 1 0 1 5% 4
Austria 0 1 0 0 0 5% 2
Belgium 0 0 0 0 0 20% 0
Canada 1 0 1 1 1 5% 5
Denmark 0 0 0 0 1 10% 2
Finland 0 1 0 0 1 10% 3
France 0 1 1 0 0 10% 3
Germany 0 0 0 0 0 5% 1
Greece 0 1 0 0 0 5% 2
Hong Kong 1 1 1 0 1 10% 5
India 1 1 0 1 1 10% 5
Indonesia 0 0 0 0 1 10% 2
Ireland 1 1 0 0 1 10% 4
Italy 0 1 0 0 0 20% 1
Japan 1 0 0 1 1 3% 4
Korea 1 0 0 0 0 5% 2
Malaysia 1 1 0 0 1 10% 4
Netherlands 0 1 0 0 0 10% 2
Norway 0 1 1 0 1 10% 4
Pakistan 1 1 0 1 1 10% 5
Philippines 1 0 0 1 1 No 3
Portugal 0 1 0 0 1 5% 3
Singapore 1 1 0 0 1 10% 4
South Africa 1 1 1 0 1 5% 5
Spain 1 1 0 1 0 5% 4
Sweden 0 1 0 0 1 10% 3

34
Table 4.1 (Continued)
Country Oppressed Minority
Pre-emptive
Mail Proxy
Cum. Voting
No Block Extra-
Meeting Anti-
Director
Spain 1 1 0 1 0 5% 4
Sweden 0 1 0 0 1 10% 3
Switzerland 0 1 0 0 0 10% 2
Taiwan 1 0 0 1 0 3% 3
Thailand 0 0 0 1 1 20% 2
UK 1 1 1 0 1 10% 5
US 1 0 1 1 1 10% 5
Source: La Porta et al., 1998.
Note: 1) Oppressed Minority equals to one if that country grants shareholders either a judicial venue to challenge the decisions of management or the rights to step out by requiring the firm to purchase their shares when they object to the important fundamental change, and equals to zero otherwise.
2) Pre-emptive equals to one if that country’s law grants shareholders pre-emptive rights that can be waived by only shareholders’ vote, and equals to zero otherwise.
3) Mail Proxy equals to one if that country allows shareholders to use their rights in proxy voting my mail, and equals to zero otherwise.
4) Cum. Voting equals to one if that country’s law allows shareholders to accumulate their voting rights for board of director election, and equals to zero otherwise.
5) No Block equals to one if that country’s law does not allow firm to require shareholders to deposit their shares before the general shareholders meeting, and equals to zero otherwise.
6) Extra- Meeting specifies the minimum percentage of ownership required for shareholders to call for an Extraordinary shareholders’ meeting.
7) Anti-Director is anti-director rights that represents minority shareholders rights.
From table 4.1, the score on anti-director rights ranges from zero to five. The
low score means minority shareholders have lower rights against firm directors or
controlling shareholders whereas higher score means minority shareholders’ rights are
protected well by law.

35
Legal enforcement is the measurement of how well the country’s law is
enforced, which is based on the efficiency of juridical system, an assessment of rule
of law, and the corruption index. Table 4.2 reports the score on three dimension of
legal enforcement based on La Porta et al. (1998). The legal enforcement is the mean
score on efficiency of juridical system, rule of law, and corruption index (Leuz et al.,
2003). The score on legal enforcement has ranged from zero to ten. Higher score on
legal enforcement means the law can be enforced well and more effectively in that
country.
Table 4.2 Legal Enforcement Score for Each Country
Country Efficiency of
Judicial System Rule of Law Corruption
Legal Enforcement
Australia 10.00 10.00 8.52 9.5
Austria 9.50 10.00 8.57 9.4
Belgium 9.50 10.00 8.82 9.4
Canada 9.25 10.00 10.00 9.8
Denmark 10.00 10.00 10.00 10.0
Finland 10.00 10.00 10.00 10.0
France 8.00 8.98 9.05 8.7
Germany 9.00 9.23 8.93 9.1
Greece 7.00 6.18 7.27 6.8
Hong Kong 10.00 8.22 8.52 8.9
India 8.00 4.17 4.58 5.6
Indonesia 2.50 3.98 2.15 2.9
Ireland 8.75 7.80 8.52 8.4
Italy 6.75 8.33 6.13 7.1
Japan 10.00 8.98 8.52 9.2
Korea 6.00 5.35 5.30 5.6
Malaysia 9.00 6.78 7.38 7.7
Netherlands 10.00 10.00 10.00 10.0
Norway 10.00 10.00 10.00 10.0

36
Table 4.2 (Continued)
Country Efficiency of Judicial System Rule of Law Corruption Legal
Enforcement
Pakistan 5.00 3.03 2.98 3.7
Philippines 4.75 2.73 2.92 3.5
Portugal 5.50 8.68 7.38 7.2
Singapore 10.00 8.57 8.22 8.9
South Africa 6.00 4.42 8.92 6.4
Spain 6.25 7.80 7.38 7.1
Sweden 10.00 10.00 10.00 10.0
Switzerland 10.00 10.00 10.00 10.0
Taiwan 6.75 8.52 6.85 7.4
Thailand 3.25 6.25 5.18 4.9
UK 10.00 8.57 9.10 9.2
US 10.00 10.00 8.63 9.5
Source: La Porta et al., 1998. Note: 1) Efficiency of Judicial System is the score based on the assessment of
“efficiency and integrity of the legal environmental as it affects business, particularly foreign firms” produced by country-risk rating agency, Business International Corporation. Lower score means less efficiency in their legal system. 2) Rule of Law is the score based on the assessment of law and order tradition in the country, which is produced by country-risk rating agency, International Country Risk. Lower score means less tradition for law and order. 3) Corruption is the score based on the assessment of the corruption in government, which is produced by country-risk rating agency, International Country Risk. Lower score means higher level of corruption activities by government officers. 4) Legal Enforcement is the mean score on the above three dimensions.
Public enforcement of security law is based on La Porta et al. (2006). The
index of public enforcement has included five dimensions, which are the
characteristics of supervisor of security law, the power of supervisor to issue rules, the

37
investigation power of the supervisor of securities markets, the order index, and the
criminal index.
Table 4.3 Public Enforcement of Securities Law
Country Agency Rule Investigate Order Criminal Public
Enforcement
Australia 0.67 1.00 1.00 1.00 0.83 0.90
Austria 0.33 0.00 0.00 0.00 0.50 0.17
Belgium 0.00 0.00 0.25 0.00 0.50 0.15
Canada 0.67 0.50 1.00 1.00 0.83 0.80
Denmark 0.00 1.00 0.50 0.33 0.00 0.37
Finland 0.67 0.00 0.25 0.17 0.50 0.32
France 1.00 0.50 1.00 1.00 0.33 0.77
Germany 0.33 0.00 0.25 0.00 0.50 0.22
Greece 0.67 0.00 0.25 0.17 0.50 0.32
Hong Kong 0.33 1.00 1.00 1.00 1.00 0.87
India 0.33 0.50 1.00 0.67 0.83 0.67
Indonesia 0.33 1.00 1.00 0.25 0.50 0.62
Ireland 0.00 1.00 0.00 0.00 0.83 0.37
Italy 0.67 1.00 0.25 0.00 0.50 0.48
Japan 0.00 0.00 0.00 0.00 0.00 0.00
Korea 0.33 0.00 0.50 0.08 0.33 0.25
Malaysia 0.33 0.50 1.00 1.00 1.00 0.77
Netherlands 0.33 1.00 0.50 0.00 0.50 0.47
Norway 0.00 0.00 0.25 0.33 1.00 0.32
Pakistan 0.67 1.00 1.00 0.17 0.08 0.58
Philippines 0.67 1.00 1.00 1.00 0.50 0.83
Portugal 0.67 1.00 1.00 0.25 0.00 0.58
Singapore 0.33 1.00 1.00 1.00 1.00 0.87
South Africa 0.33 0.00 0.50 0.00 0.42 0.25
Spain 0.67 0.00 0.50 0.00 0.50 0.33
Sweden 0.00 1.00 0.25 0.67 0.58 0.50
Switzerland 0.33 1.00 0.00 0.00 0.33 0.33

38
Table 4.3 (Continued)
Country Agency Rule Investigate Order Criminal Public
Enforcement
Taiwan 0.33 1.00 0.25 0.17 0.83 0.52
Thailand 0.67 1.00 1.00 0.33 0.58 0.72
UK 0.00 1.00 1.00 1.00 0.42 0.68
US 1.00 1.00 1.00 1.00 0.50 0.90
Source: La Porta et al., 2006.
Note: 1) Agency represents how the supervisors of securities market are characterized including how the members of supervisors is selected and the power to dismiss by appointing authority
2) Rule represents the level of supervisor power to issue regulations about securities. This power also depends on whether the prior government approval is required.
3) Investigate represents the power of supervisor to investigate the case when the securities law is violated.
4) Order represents the power of supervisor to order securities issuers, distributors, or accountants to stop or do specific activities.
5) Criminal represents the criminal sanction of securities issuers, distributors, or accountants when some important information is omitted from disclosure.
6) Public Enforcement is the overall public enforcement of securities law, which is computed from the average score of five dimensions.
Table 4.3 reports the score on each dimension of public enforcement of
securities law based on La Porta et al. (2006). The score on public enforcement is the
average score on five dimensions and ranges from zero to one. Higher score means
that country can enforce its securities law more effectively.
In order to combine the effect of investor protection, the aggregate investor
protection score is created based on the above three dimensions, which are minority
shareholders rights, legal enforcement, and pubic enforcement of security law.
However, these three measurements are based on different scale. Shareholders rights
score ranges from zero to five. Legal enforcement score ranges from zero to ten.
Public enforcement of securities law ranges from zero to one. Therefore, the score in

39
each measurement is adjusted into the same scale, which ranges from zero to ten.
Then, the mean of the re-scaled score is computed and used as aggregate investor
protection score.
4.2 Research Methodology
In this section, the statistical method used to test the research hypothesis is
discussed in detail. The main statistical technique is this research is the multiple linear
regression models. In order to test the different in the effect of earnings management
on firm value for various level of corporate governance or investor protection, the
regression analysis with the interaction term is used. The first research hypothesis
regarding to the effect of corporate governance is examined based on firm-level
analysis. This is because the corporate governance can be measured as a firm-level
variable. Each firm has different corporate governance practice. The second research
hypothesis about the effect of investor protection is examined based on country-level
analysis. The investor protection is about law and legal system and could be measured
as a country-level analysis.
4.2.1 Firm-Level Analysis
For firm-level analysis, it is used to examine the first research hypothesis
about the effect of corporate governance. Due to the availability of firm-level CG
data, this hypothesis can be examined based on firm-level basis.
The effect of earnings management to firm value is examined based on the
following regression model.
it
m
jitjiti CONTROLEMFV
110
itititititi GROWTHSIZEDREMFV 32110 (13)
where FV is the value of the firm i at time t, which is measured by Tobin’s Q ratio or
the ratio between the market value of the firm and its book value. EM is the earnings
management measurement, which is measured by the absolute total accruals and the

40
absolute discretionary accruals. CONTROL is a set of control variables that can affect
to the firm value, which are DR, SIZE and GROWTH. DR is the firm’s debt ratio
representing the leverage or capital structure of the firm. SIZE is the firm size
measured by the natural logarithm of firm’s total assets. GROWTH is the firm’s
growth rate of total assets.
In order to examine the effect of corporate governance in the relationship
between earnings management and firm value, corporate governance score is included
in the above equation as the interaction effect as follows.
it
m
jitjitititi CONTROLCGEMEMFV
1210 (14)
CG is the Corporate Governance Score. The interaction effect between
earnings management and corporate governance is expected to be positive. If, the
coefficient of interaction term (β2) is significantly positive, it means that the effect of
earnings management on firm value for the firms with a higher CG score is less
negative (or even become positive) than for firms with a lower CG score.
In general, investors may not concern about the level of firm’s corporate
governance as a continuous measurement like CG score. They may perceive firms in
terms of a group based on firms’ corporate governance performance like good
governance or poor governance firms. Moreover, in some countries like Thailand, the
CG data is not widely available in the numerical score but in the categorical data
instead. Therefore, another way to examine the effect of CG on the relationship
between firm value and earnings management is to categorize all firms based on the
CG score in United States. Each firm is classified into two groups based on the
median. Firms having a CG score above the median are named high-CG or good-
governance firms, whereas firms with a CG score lower than median are classified as
low-CG or poor-governance firms.
it
m
jitjitititi CONTROLDHIGHEMEMFV
1210 (15)
41
DHIGH is the dummy variable that equals one if that firm has a CG score
above the median in that fiscal year or zero otherwise. The coefficient of the
interaction term (β2) can be interpreted as the difference between high-CG firms (CG
score higher than median) and low-CG firms (CG score lower than median) in the
relationship between their firm value and earnings management. This coefficient is
expected to be positive to show that the effect of earnings management is less
negative (or even positive) for high-CG firms.
In Thailand, corporate governance data is provided by Thai IOD in form of
categorical data known as CG-star. In each year, firms are classified as 5-star, 4-star,
or 3-star by Thai IOD based on their criteria to score firms’ corporate governance
practice. Firms without CG-star are classified as another separate group and are used
as base group. To examine the role of corporate governance on the effect of earnings
management, the regression model with interaction techniques is used as follow.
it
m
jitj
m
jitjiiiti CONTROLEMDEMFV
1110 (16)
From equation 16, the coefficient β1 will represent the effect of earnings
management for firms without CG-star. Dj is the dummy variable that equals to one if
that firm is in j-star group. There are only three star groups, which are five-star, four-
star, and three-star. Therefore, δj will represent the differential effect of earnings
managements between firms without star and firms in j-star group. If corporate
governance can act as the effective controlling mechanism to restrict opportunistic
earnings management, the coefficient δj should be positive and statistically significant
at convention level. This means the relationship between earnings management and
firm value is more positive (or less negative) for firms in higher CG-star than those
firms without CG-star.
Beside the regression analysis for the main analysis discussed earlier, some
other supplement analyses are included in order to ensure the robustness of the result.
First, the presence of heteroskedasticity can alter the result of hypothesis test of
significance discussed earlier. Heteroskedasticity can result in overestimating or
underestimating of the standard error of regression. Therefore, the robust standard
42
error is used instead of the normal one to mitigate the impact of the heteroskedasticity
presence in the regression analysis.
Another robustness check is to use the Fama-MacBeth regression technique.
The data used in this report is collected from many firms in different years. This
combination of data creates a panel of data and another possible problem known as
cross-sectional correlation can arise.
The last robustness check is about the measurement of earnings management.
The popular measurement of accrual-based earnings management is the discretionary
accruals based on modified Jones model. However, other measurements like total
accruals are also used in order to see the robustness of the reported results.
4.2.2 Country-Level Analysis
For the country-level analysis, it is used to examine the second research
hypothesis about the effect of investor protection. Investor protection is based on
country’s law and legal enforcement and available based on country-level. The same
statistical method that is the multiple regression models with interaction effect is used
on the country-level data. The regression model is as follows.
it
m
jitjitititi CONTROLIPEMEMFV
1210 (17)
FV is the country-average firm value of country i at time t, which is measured
by Tobin’s Q ratio or the ratio between the market value of the firm and its book
value. EM is country-average earnings management measurement. The earnings
management is measured by the absolute discretionary accruals and the absolute total
accruals for each country independently. The country-average is computed from the
mean level of that variable for each country and each year. CONTROL is a set of
control variables, which are country-average debt ratio and country-average growth
rate of assets, the natural logarithm of total stock market capitalization of the country.
IP is the measurement of investor protection. This includes the minority
shareholders rights, legal enforcement, and public enforcement of securities law.
Minority shareholders rights are based on the anti-director rights, which are supported
43
or included in the country’s code of law. Legal enforcement represents the
effectiveness of legal system in that country. Public enforcement is based on the
power of supervisor to enforce the securities law.
The coefficient of the interaction term between earnings management and
investor protection is expected to be positive. It will support the role of investor
protection towards the relationship between earnings management and firm value. For
the country with better investor protection, the relationship between earnings
management and firm value is relatively more positive than the country with lower
investor protection level.
In the similar way, investors may perceive the countries in terms of good or
poor investor protection rather their numerical score. Therefore, each country is
classified into two groups based on the median. A country having an investor
protection index above the median are named high-IP country, whereas a country with
an investor protection index lower than median is classified as low-IP country.
it
m
jitjitititi CONTROLDHIGHIPIPFV
1210 (18)
DHIGH is the dummy variable that equals one if that country has an investor
protection index above the median or zero otherwise. The coefficient of the
interaction term (β2) can be interpreted as the difference between high-IP countries
and low-IP countries in the relationship between their firm value and earnings
management. This coefficient is expected to be positive to show that the effect of
earnings management is more positive for high-IP countries.

CHAPTER 5
ANALYSIS AND RESULTS
This section includes the empirical results provided based on the research
design discusses in the previous chapter. First, the descriptive statistics are reported in
order to summarize the overview of empirical data. The descriptive data for United
States and Thailand are reported. These data are later used in the firm-level analysis to
examine the impact of corporate governance (CG) on the relation between earnings
management and firm value. In United States, CG data is available in form of
continuous CG score. CG data in Thailand is available in form of categorical data,
which is called CG-star group. Thereafter, the country-level descriptive data is
reported for 31 countries, which is used in the country-level analysis. The summary of
investor protection level for each country is also reported. In the second part, the
inferential statistics are reported in order to draw the conclusion regarding to the
research hypotheses.
5.1 Descriptive Statistics
5.1.1 Firm-level Analysis for United States
The data used in this research include all firms traded on the New York Stock
Exchange (NYSE) or NASDAQ during 2002-2010. The accounting data were from
the WorldScope Database. The firms whose information as not available in
WorldScope or Asset4 were excluded from the analysis. There were 5,153 firm-year
observations included in the analysis. The descriptive data of sample firms in United
States during 2002-2010 is reported in table 5.1.

45
Table 5.1 Descriptive Statistics of Sample Firms in United States
Year Tobin Q Earnings Management
Debt Ratio
Asset Growth (%)
2002 2.0103 1.8145 0.5865 12.7783
2003 2.2452 1.2301 0.5793 15.3588
2004 2.3249 0.8201 0.5801 16.0270
2005 2.2649 0.9714 0.5730 16.9119
2006 2.1804 0.8518 0.5954 17.4062
2007 2.1372 1.3431 0.6040 20.9936
2008 1.4783 2.5777 0.6288 9.0601
2009 1.7590 1.0765 0.5887 8.6067
2010 1.9426 1.6249 0.5837 12.6520
Overall 1.9718 1.4189 0.5933 13.6944
The ratio between market value and book value of firm assets or Tobin Q was
around 2 times during the analysis period. This market value ratio was lowest in 2008
as a result of the credit crunch from the sub-prime crisis. The earnings management
measures, which are the accounting accruals scaled down by operating cash flow,
varied. It is interesting that this figure was highest during 2008, which was the period
when the U.S. economy most suffered from the crisis. Moreover, U.S. firms, in
average, use debt at around 60% of their total assets. The average annual growth rate
of their assets is 13.69%. Before 2008, the growth rates increased year-by-year and
have drop dramatically to lower than 10% during 2008-2009, which is the period of
sub-prime economics crisis in United States.
Table 5.2 summarizes the corporate governance performance of firms in
United States. Overall CG Score is a part of ASSET4’s Environmental, Social, and
Environmental (ESG) score. ASSET4’s CG overall CG score consists of Board
Structure, Compensation Policy, Board Function, Vision & Strategies, and Shareholders
Rights. Moreover, the score on Shareholders Rights is reported in a separated column.
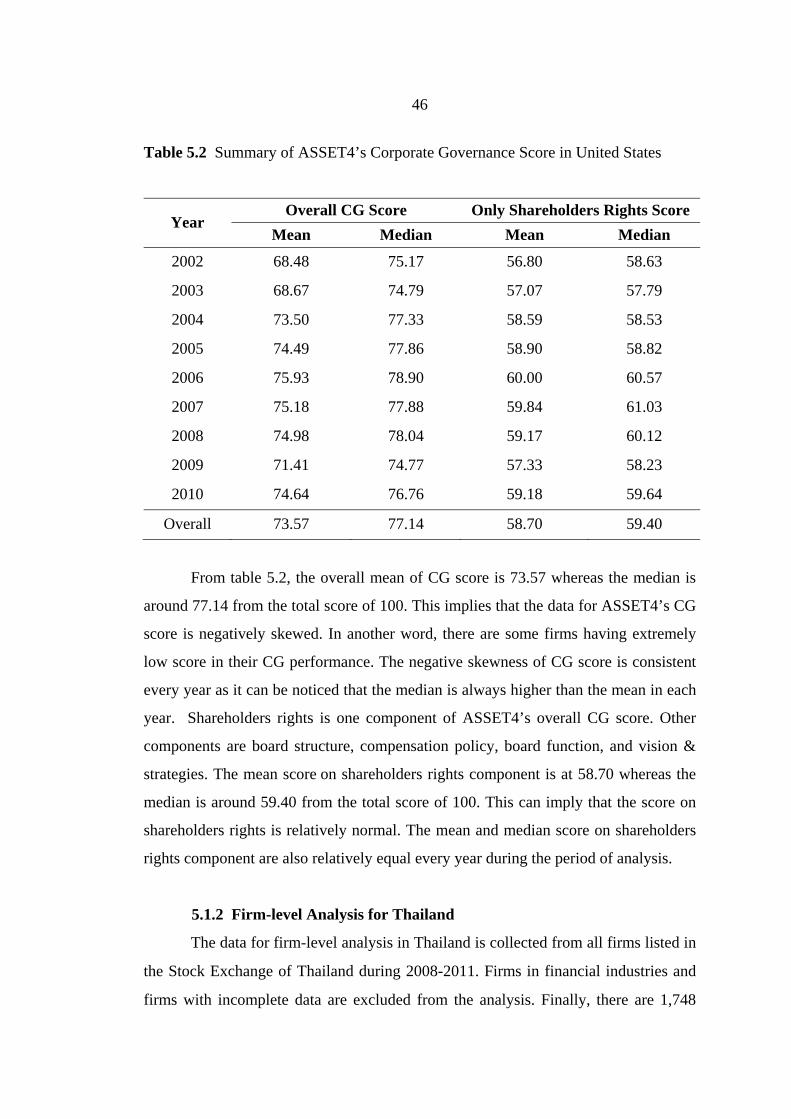
46
Table 5.2 Summary of ASSET4’s Corporate Governance Score in United States
Year Overall CG Score Only Shareholders Rights Score
Mean Median Mean Median
2002 68.48 75.17 56.80 58.63
2003 68.67 74.79 57.07 57.79
2004 73.50 77.33 58.59 58.53
2005 74.49 77.86 58.90 58.82
2006 75.93 78.90 60.00 60.57
2007 75.18 77.88 59.84 61.03
2008 74.98 78.04 59.17 60.12
2009 71.41 74.77 57.33 58.23
2010 74.64 76.76 59.18 59.64
Overall 73.57 77.14 58.70 59.40
From table 5.2, the overall mean of CG score is 73.57 whereas the median is
around 77.14 from the total score of 100. This implies that the data for ASSET4’s CG
score is negatively skewed. In another word, there are some firms having extremely
low score in their CG performance. The negative skewness of CG score is consistent
every year as it can be noticed that the median is always higher than the mean in each
year. Shareholders rights is one component of ASSET4’s overall CG score. Other
components are board structure, compensation policy, board function, and vision &
strategies. The mean score on shareholders rights component is at 58.70 whereas the
median is around 59.40 from the total score of 100. This can imply that the score on
shareholders rights is relatively normal. The mean and median score on shareholders
rights component are also relatively equal every year during the period of analysis.
5.1.2 Firm-level Analysis for Thailand
The data for firm-level analysis in Thailand is collected from all firms listed in
the Stock Exchange of Thailand during 2008-2011. Firms in financial industries and
firms with incomplete data are excluded from the analysis. Finally, there are 1,748
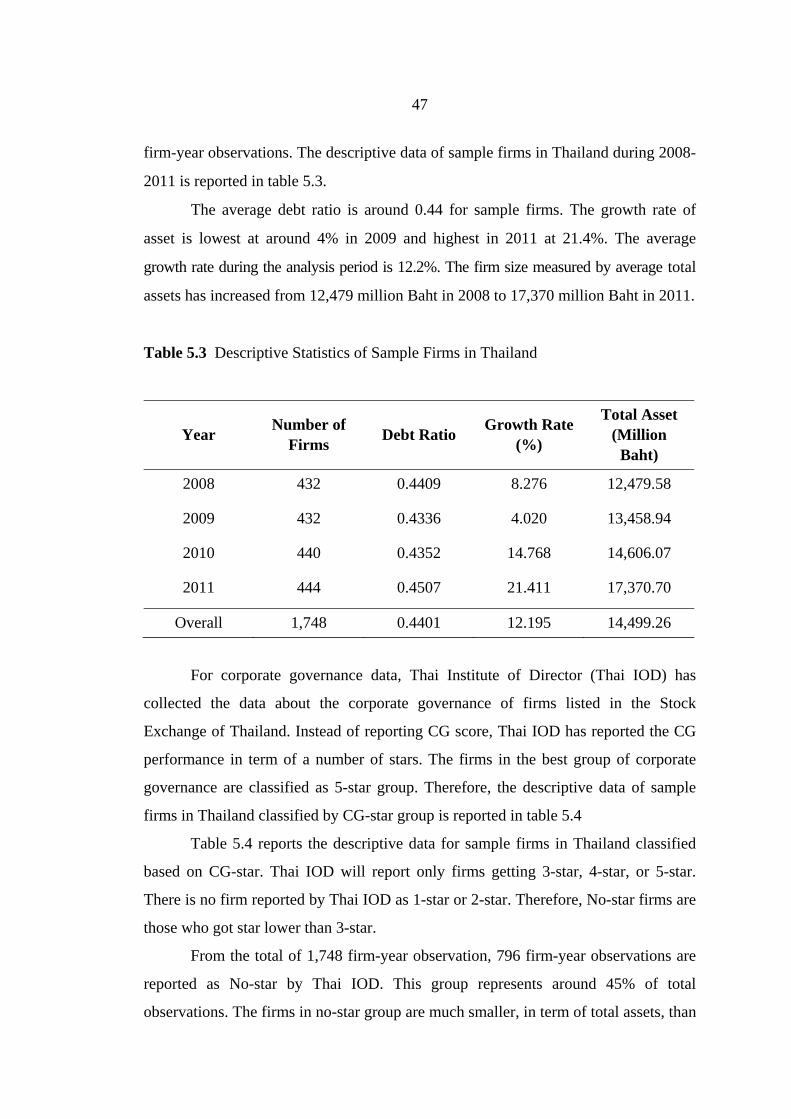
47
firm-year observations. The descriptive data of sample firms in Thailand during 2008-
2011 is reported in table 5.3.
The average debt ratio is around 0.44 for sample firms. The growth rate of
asset is lowest at around 4% in 2009 and highest in 2011 at 21.4%. The average
growth rate during the analysis period is 12.2%. The firm size measured by average total
assets has increased from 12,479 million Baht in 2008 to 17,370 million Baht in 2011.
Table 5.3 Descriptive Statistics of Sample Firms in Thailand
Year Number of
Firms Debt Ratio
Growth Rate (%)
Total Asset (Million
Baht)
2008 432 0.4409 8.276 12,479.58
2009 432 0.4336 4.020 13,458.94
2010 440 0.4352 14.768 14,606.07
2011 444 0.4507 21.411 17,370.70
Overall 1,748 0.4401 12.195 14,499.26
For corporate governance data, Thai Institute of Director (Thai IOD) has
collected the data about the corporate governance of firms listed in the Stock
Exchange of Thailand. Instead of reporting CG score, Thai IOD has reported the CG
performance in term of a number of stars. The firms in the best group of corporate
governance are classified as 5-star group. Therefore, the descriptive data of sample
firms in Thailand classified by CG-star group is reported in table 5.4
Table 5.4 reports the descriptive data for sample firms in Thailand classified
based on CG-star. Thai IOD will report only firms getting 3-star, 4-star, or 5-star.
There is no firm reported by Thai IOD as 1-star or 2-star. Therefore, No-star firms are
those who got star lower than 3-star.
From the total of 1,748 firm-year observation, 796 firm-year observations are
reported as No-star by Thai IOD. This group represents around 45% of total
observations. The firms in no-star group are much smaller, in term of total assets, than
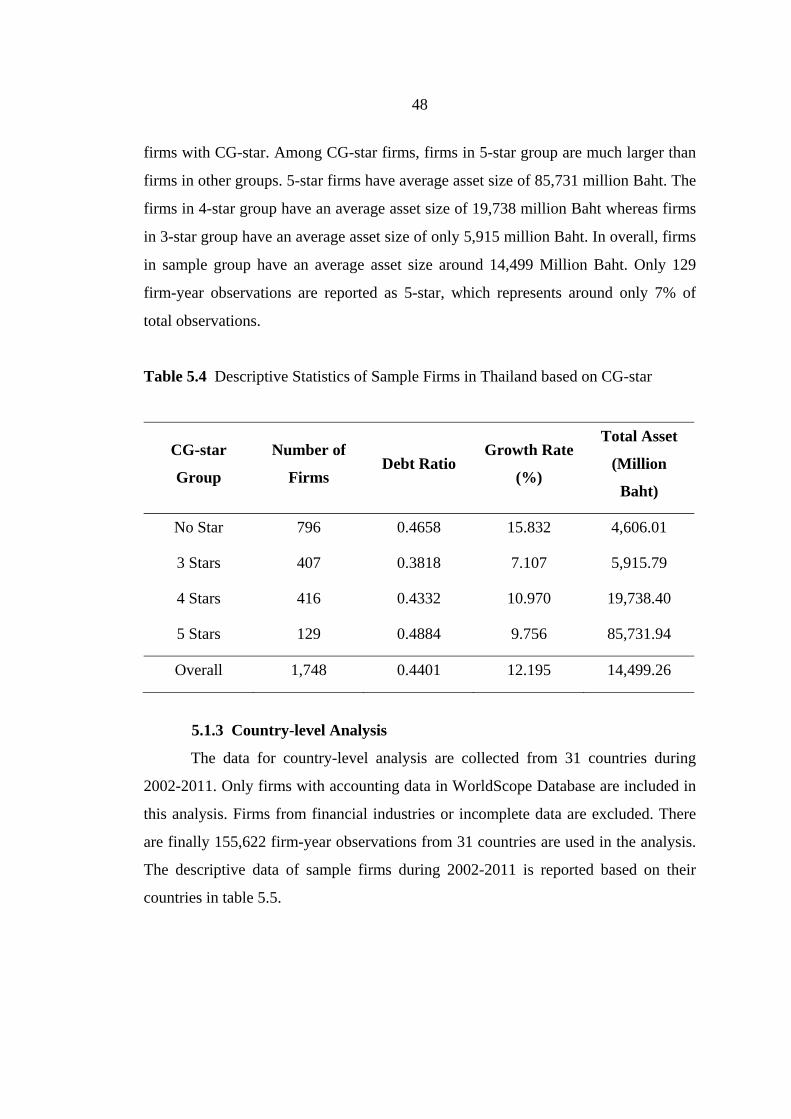
48
firms with CG-star. Among CG-star firms, firms in 5-star group are much larger than
firms in other groups. 5-star firms have average asset size of 85,731 million Baht. The
firms in 4-star group have an average asset size of 19,738 million Baht whereas firms
in 3-star group have an average asset size of only 5,915 million Baht. In overall, firms
in sample group have an average asset size around 14,499 Million Baht. Only 129
firm-year observations are reported as 5-star, which represents around only 7% of
total observations.
Table 5.4 Descriptive Statistics of Sample Firms in Thailand based on CG-star
CG-star
Group
Number of
Firms Debt Ratio
Growth Rate
(%)
Total Asset
(Million
Baht)
No Star 796 0.4658 15.832 4,606.01
3 Stars 407 0.3818 7.107 5,915.79
4 Stars 416 0.4332 10.970 19,738.40
5 Stars 129 0.4884 9.756 85,731.94
Overall 1,748 0.4401 12.195 14,499.26
5.1.3 Country-level Analysis
The data for country-level analysis are collected from 31 countries during
2002-2011. Only firms with accounting data in WorldScope Database are included in
this analysis. Firms from financial industries or incomplete data are excluded. There
are finally 155,622 firm-year observations from 31 countries are used in the analysis.
The descriptive data of sample firms during 2002-2011 is reported based on their
countries in table 5.5.

49
Table 5.5 Descriptive Statistics of Sample Firms in 31 Countries
Country No. of
Observation Debt Ratio (%) Growth (%) Tobin’s Q
Australia 6,737 38.09 5.67 1.421
Austria 490 53.89 4.38 1.184
Belgium 806 59.24 3.35 1.157
Canada 8,567 42.18 6.46 1.428
Denmark 928 51.81 3.47 1.181
Finland 1,031 54.69 2.26 1.351
France 4,892 59.09 4.38 1.209
Germany 5,546 56.32 2.64 1.203
Greece 2,036 56.63 3.03 0.959
Hong Kong 8,362 37.29 10.61 1.065
India 11,680 58.85 14.16 1.077
Indonesia 2,650 50.79 7.34 1.056
Ireland 293 56.30 3.96 1.337
Italy 1,705 63.40 2.57 1.120
Japan 29,051 51.30 0.82 0.963
Malaysia 6,726 38.47 4.14 0.900
Netherlands 844 55.56 4.03 1.323
Norway 1,203 57.19 5.33 1.220
Pakistan 1,548 62.28 10.36 1.036
Philippines 1,431 39.05 3.74 1.009
Portugal 388 70.83 2.28 1.087
Singapore 4,857 42.72 6.50 1.017
South Africa 2,052 48.60 9.98 1.263
Korea 10,694 45.28 8.85 0.929
Spain 928 60.62 4.93 1.218
Sweden 2,658 48.50 4.90 1.473
Switzerland 1,549 49.07 1.57 1.268 Taiwan 12,542 42.49 5.86 1.125
Thailand 3,578 43.34 5.31 1.050 United Kingdom 8,347 48.71 6.04 1.389
United States 11,503 56.58 5.69 1.436

50
From table 5.5, the average leverage ratio or debt ratio varies from around
40%-70% with the overall average at 51.58%. The country with lowest debt ratio is
Hong Kong with the average debt ratio of 37.29%. The country with highest debt ratio
is Portugal with the average debt ratio at 70.83%. Looking at the average growth rate,
the overall average growth rate is around 5.31% during the period of analysis. The
country with highest firm average growth rate is India whereas the country with
lowest firm average growth is Japan. Firms in Japan have the average growth rate of
only 0.82% during the period of analysis. Meanwhile, firms in India have the average
growth rate at 14.16% during the same period. The countries with high growth rate of
firms are mostly in emerging economies like Indonesia, Pakistan, South Korea, Hong
Kong, South Africa, and India. In average, firms in the above six countries have the
average annual growth rate more than 7% per year.
For Tobin’s Q ratio or the ratio between market value of firms and book value
of firms, it ranges from 0.900 to 1.473. The overall average Tobin’s Q ratio is around
1.175. The country with lowest Tobin’s Q ratio is Malaysia with the average value of
only 0.900. The country with highest Tobin’s Q ratio is Sweden with the average
value of 1.473. Furthermore, the country’s investor protection performance is reported
in table 5.6 based on La Porta et al. (1998), Leuz et al. (2003), and La porta et al.
(2006).
Table 5.6 Investor Protection Score for 31 Countries
Country Shareholders
Rights Legal
Enforcement Public
Enforcement Overall IP
Score
Australia 4.00 9.50 0.90 8.83
Austria 2.00 9.40 0.17 5.02
Belgium 0.00 9.40 0.15 3.63
Canada 5.00 9.80 0.80 9.27
Denmark 2.00 10.00 0.37 5.89
Finland 3.00 10.00 0.32 6.39
France 3.00 8.70 0.77 7.46
Germany 1.00 9.10 0.22 4.42

51
Table 5.6 (Continued)
Country Shareholders
Rights Legal
Enforcement Public
Enforcement Overall IP
Score
Greece 2.00 6.80 0.32 4.66
Hong Kong 5.00 8.90 0.87 9.19
India 5.00 5.60 0.67 7.42
Indonesia 2.00 2.90 0.62 4.36
Ireland 4.00 8.40 0.37 6.69
Italy 1.00 7.10 0.48 4.64
Japan 4.00 9.20 0.00 5.73
Malaysia 4.00 7.70 0.77 7.79
Netherlands 2.00 10.00 0.47 6.22
Norway 4.00 10.00 0.32 7.06
Pakistan 5.00 3.70 0.58 6.51
Philippines 3.00 3.50 0.83 5.94
Portugal 3.00 7.20 0.58 6.34
Singapore 4.00 8.90 0.87 8.52
South Africa 5.00 6.40 0.25 6.30
Korea 2.00 5.60 0.25 4.03
Spain 4.00 7.10 0.33 6.14
Sweden 3.00 10.00 0.50 7.00
Switzerland 2.00 10.00 0.33 5.78
Taiwan 3.00 7.40 0.52 6.19
Thailand 2.00 4.90 0.72 5.36
United Kingdom 5.00 9.20 0.68 8.68
United States 5.00 9.50 0.90 9.50
Source: La Porta et al., 1998, 2006; Leuz et al., 2003.
From table 5.6, the shareholders right score is based on anti-director rights.
The country having the legal to support the minority shareholders rights against
controlling shareholders will get one score for each provision as reported by La Porta et al.

52
(1998). The score on shareholders rights ranges from zero to five. The countries with
highest score on shareholders rights with the score of 5.00 are Canada, Hong Kong,
India, Pakistan, South Africa, United Kingdom, and United States. All of these countries
also have common law system and their legal origin is from English Law system.
For legal enforcement, the score reflects how effective the legal system can be
enforced in that country. The score ranges from zero to ten. There are six countries
getting the score of 10.00, which are Denmark, Finland, Netherlands, Norway,
Sweden, and Switzerland. Most of these countries have the civil law or code law
system with the legal origin from Scandinavian Law system. The countries with low
score in legal enforcement are countries from emerging countries like Indonesia,
Pakistan, Philippines, and Thailand. These countries have the score on legal
enforcement less than 5.00.
The public enforcement is about the power of supervisory authorities of
securities market in that country to enforce and investigate the cases. The score ranges
from zero to one. Countries with highest score of 0.90 are United States and Australia.
Hong Kong and Singapore have the second highest score of 0.87. The country with
lowest score is Japan.
The overall investor protection score is from the average of these three
investor protection components, which are shareholders rights, legal enforcement, and
public enforcement. However, the score on each component is re-scaled to the same
scale from zero to ten before the average score is computed. The countries with
highest score on overall investor protection are United States, Canada, and Hong
Kong with the overall score of 9.50, 9.27, and 9.19 respectively.
5.2 Inferential Statistics
This section reports the result of inferential statistics used in examine the
research hypotheses discussed in the previous chapter. The main technique used in
this research in the multiple linear regression analysis with interaction effect. The first
research hypothesis about corporate governance is examined based on firm-level
analysis. The data in firm-level analysis is from United States and Thailand. The
second research hypothesis about investor protection is examined based on country-
level analysis. The data in country-level analysis is from 30 countries around the
world.

53
5.2.1 Firm-level Analysis for United States
In this firm-level analysis, the first research hypothesis “The relation between
earnings management and firm value should be less negative (more positive) for the
firm with higher level of corporate governance,” is analyzed. First, the effect of
earnings management on firm value is examined. Earnings management is measured
based on accrual-based earnings management. For United States sample, it is
measured by the ratio between the absolute total accruals and operating cash flow.
The relation between firm value and earnings management is reported in table 5.7.
Table 5.7 The Effect of Earnings Management on Firm Value in United States
(No Control Variable)
Variables Coefficient t-Statistics Significance Level
Constant 1.9800 105.28 < 0.05
ATA -0.0057 -3.64 < 0.05
F-statistics 13.27
Significance Level < 0.05
Adjusted R2 0.0024
The effect of earning management and firm value is reported in table 5.7
without including any control variable. The coefficient of earnings management is
negative and significant at 5% level. This means that the effect of earnings
management on firm value, in general, is negative. This negative effect can be from
investors’ bad perception about earnings management from several cases of
accounting scandal. With this negative perception of investors about earnings
management, the effect of earnings management to firm value is generally negative in
United States.
However, in order to interpret the effect of earnings management on firm
value correctly, a set of control variables is included in the regression model. These
control variables are the debt ratio, the growth rate, and the firm size (measured by the
natural logarithm of total asset).

54
Table 5.8 The Effect of Earnings Management on Firm Value in United States
(With Control Variables)
Variables Coefficient t-Statistics Significance Level
Constant 6.7036 33.78 < 0.05
ATA -0.0040 -2.74 < 0.05
Debt Ratio -1.1306 -13.54 < 0.05
Size -0.2550 -19.49 < 0.05
Growth -0.0656 -2.05 < 0.05
F-statistics 217.43
Significance Level < 0.05
Adjusted R2 0.1439
The result reported in table 5.8 after including a set of control is similar to the
earlier result. The coefficient of earnings management is still negative and significant
at 5% level. The adjusted R-squared of the model with control variables is quite
improved from the model without control variables. The previous model without
control variables has the adjusted R-squared of 0.0024 whereas the model with
control variables has the adjusted R-squared of 0.1439. Moreover, all control
variables are also statistically significant at 5% level.
Thereafter, the effect of corporate governance is included on the relation
between firm value and earnings management. The interaction term between earnings
management and corporate governance score is computed from the multiplication of
earnings management variables and corporate governance score. This interaction term
is included in the model and the result of regression analysis with interaction term is
reported in table 5.9.

55
Table 5.9 The Effect of Corporate Governance on the Relation between Earnings
Management and Firm Value in United States
Variables Coefficient t-Statistics Significance Level
Constant 6.7079 33.15 < 0.05
ATA -0.0258 -4.62 < 0.05
Debt Ratio -1.1097 -13.29 < 0.05
Size -0.2663 -19.86 < 0.05
Growth -0.0294 -0.89 -
EM x CG 0.0312 4.05 < 0.05
CG 0.2154 2.05 < 0.05
F-statistics 178.14
Significance Level < 0.05
Adjusted R2 0.1467
The result reported in table 5.9 has included the interaction term between
earnings management and corporate governance score. All control variables, except
the growth rate, are also significant at 5% level. The coefficient of the interaction term
was positive and significant at 5% level. This supports the first research hypothesis
that the relation between earnings management and firm value is less negative for the
firm with higher level of corporate governance.
However, in general, investors may not concern about corporate governance as
continuous measurement like CG score. They may think about corporate governance
as a group such as high-CG group and low-CG group. Therefore, instead of using the
continuous CG score to create the interaction term in the regression model, each firm
will be classified into either a high-CG firm or a low-CG firm instead. In each year,
firms with a CG score above the median are classified as high-CG and those with a
CG score below the median are classified as low-CG. The effect of earnings
management on firm value is reported separately between high-CG firms group and
low-CG firms group in table 5.10.
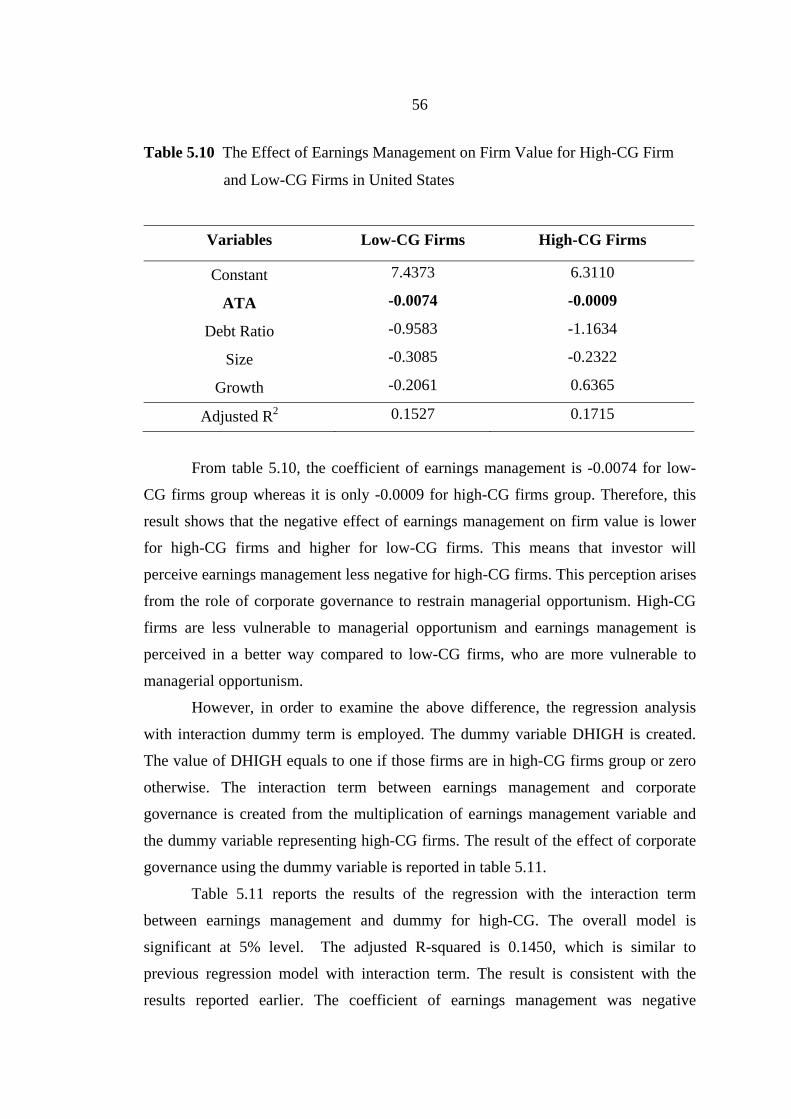
56
Table 5.10 The Effect of Earnings Management on Firm Value for High-CG Firm
and Low-CG Firms in United States
Variables Low-CG Firms High-CG Firms
Constant 7.4373 6.3110
ATA -0.0074 -0.0009
Debt Ratio -0.9583 -1.1634
Size -0.3085 -0.2322
Growth -0.2061 0.6365
Adjusted R2 0.1527 0.1715
From table 5.10, the coefficient of earnings management is -0.0074 for low-
CG firms group whereas it is only -0.0009 for high-CG firms group. Therefore, this
result shows that the negative effect of earnings management on firm value is lower
for high-CG firms and higher for low-CG firms. This means that investor will
perceive earnings management less negative for high-CG firms. This perception arises
from the role of corporate governance to restrain managerial opportunism. High-CG
firms are less vulnerable to managerial opportunism and earnings management is
perceived in a better way compared to low-CG firms, who are more vulnerable to
managerial opportunism.
However, in order to examine the above difference, the regression analysis
with interaction dummy term is employed. The dummy variable DHIGH is created.
The value of DHIGH equals to one if those firms are in high-CG firms group or zero
otherwise. The interaction term between earnings management and corporate
governance is created from the multiplication of earnings management variable and
the dummy variable representing high-CG firms. The result of the effect of corporate
governance using the dummy variable is reported in table 5.11.
Table 5.11 reports the results of the regression with the interaction term
between earnings management and dummy for high-CG. The overall model is
significant at 5% level. The adjusted R-squared is 0.1450, which is similar to
previous regression model with interaction term. The result is consistent with the
results reported earlier. The coefficient of earnings management was negative
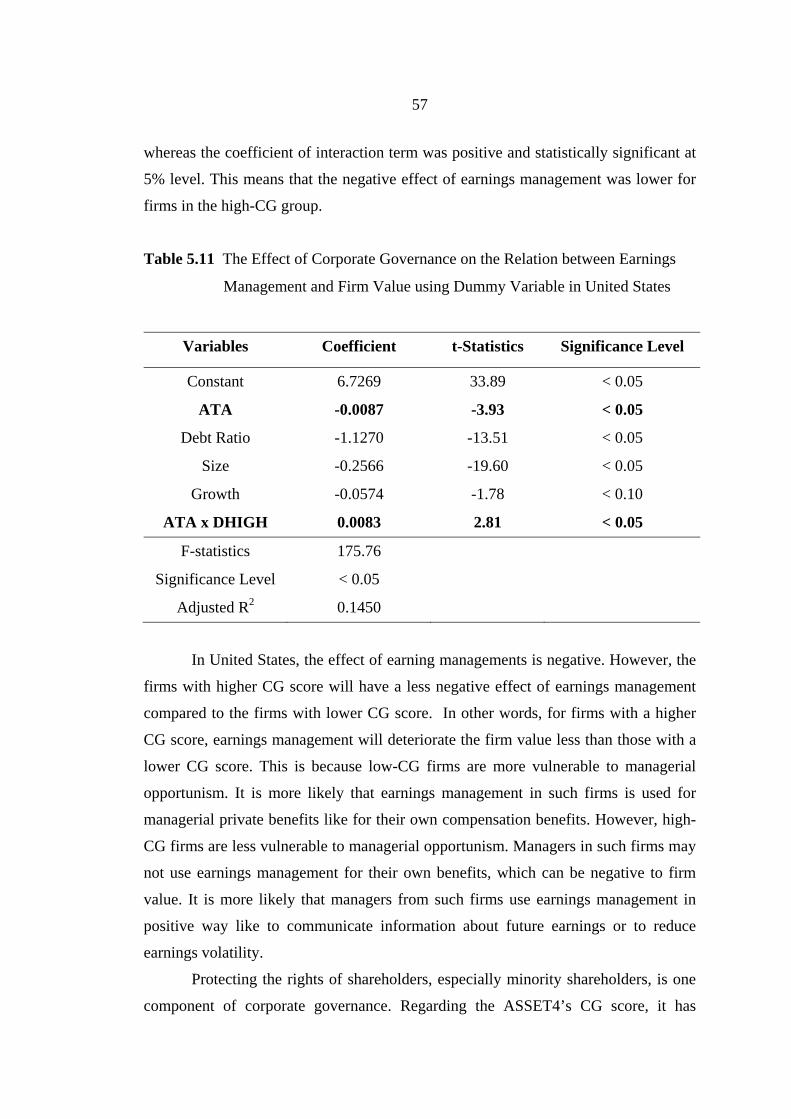
57
whereas the coefficient of interaction term was positive and statistically significant at
5% level. This means that the negative effect of earnings management was lower for
firms in the high-CG group.
Table 5.11 The Effect of Corporate Governance on the Relation between Earnings
Management and Firm Value using Dummy Variable in United States
Variables Coefficient t-Statistics Significance Level
Constant 6.7269 33.89 < 0.05
ATA -0.0087 -3.93 < 0.05
Debt Ratio -1.1270 -13.51 < 0.05
Size -0.2566 -19.60 < 0.05
Growth -0.0574 -1.78 < 0.10
ATA x DHIGH 0.0083 2.81 < 0.05
F-statistics 175.76
Significance Level < 0.05
Adjusted R2 0.1450
In United States, the effect of earning managements is negative. However, the
firms with higher CG score will have a less negative effect of earnings management
compared to the firms with lower CG score. In other words, for firms with a higher
CG score, earnings management will deteriorate the firm value less than those with a
lower CG score. This is because low-CG firms are more vulnerable to managerial
opportunism. It is more likely that earnings management in such firms is used for
managerial private benefits like for their own compensation benefits. However, high-
CG firms are less vulnerable to managerial opportunism. Managers in such firms may
not use earnings management for their own benefits, which can be negative to firm
value. It is more likely that managers from such firms use earnings management in
positive way like to communicate information about future earnings or to reduce
earnings volatility.
Protecting the rights of shareholders, especially minority shareholders, is one
component of corporate governance. Regarding the ASSET4’s CG score, it has
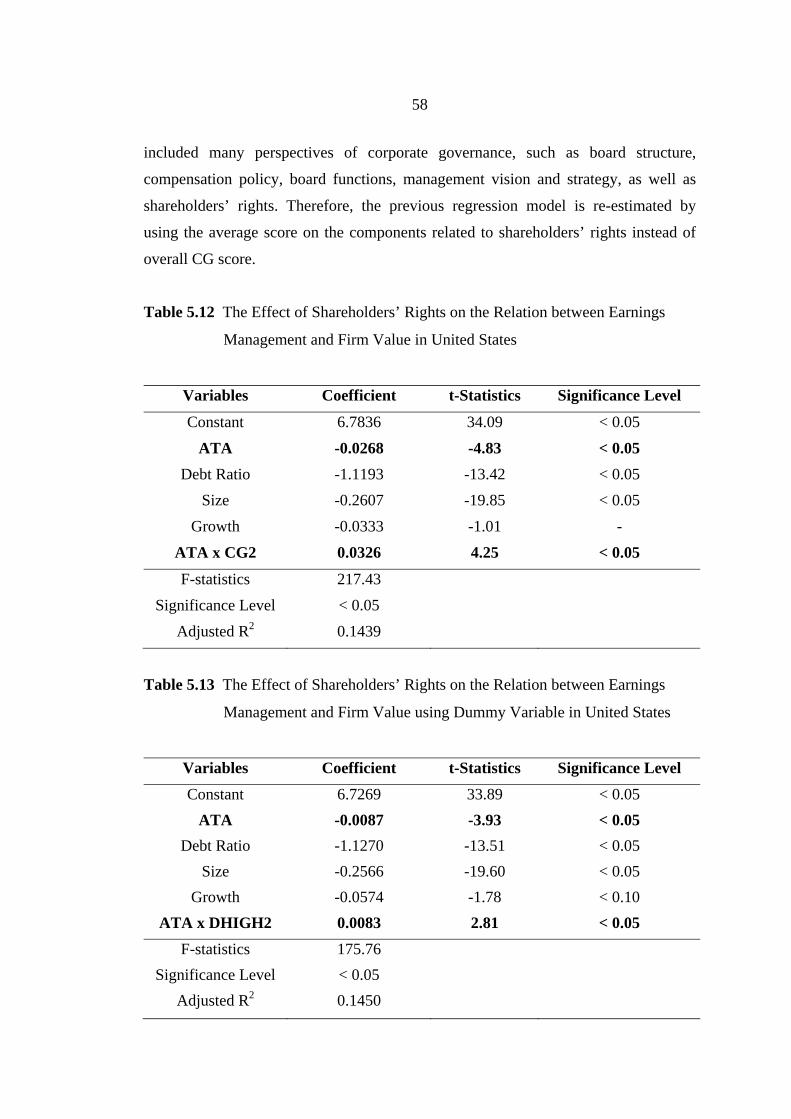
58
included many perspectives of corporate governance, such as board structure,
compensation policy, board functions, management vision and strategy, as well as
shareholders’ rights. Therefore, the previous regression model is re-estimated by
using the average score on the components related to shareholders’ rights instead of
overall CG score.
Table 5.12 The Effect of Shareholders’ Rights on the Relation between Earnings
Management and Firm Value in United States
Variables Coefficient t-Statistics Significance Level
Constant 6.7836 34.09 < 0.05
ATA -0.0268 -4.83 < 0.05
Debt Ratio -1.1193 -13.42 < 0.05
Size -0.2607 -19.85 < 0.05
Growth -0.0333 -1.01 -
ATA x CG2 0.0326 4.25 < 0.05
F-statistics 217.43
Significance Level < 0.05
Adjusted R2 0.1439
Table 5.13 The Effect of Shareholders’ Rights on the Relation between Earnings
Management and Firm Value using Dummy Variable in United States
Variables Coefficient t-Statistics Significance Level
Constant 6.7269 33.89 < 0.05
ATA -0.0087 -3.93 < 0.05
Debt Ratio -1.1270 -13.51 < 0.05
Size -0.2566 -19.60 < 0.05
Growth -0.0574 -1.78 < 0.10
ATA x DHIGH2 0.0083 2.81 < 0.05
F-statistics 175.76
Significance Level < 0.05
Adjusted R2 0.1450

59
Table 5.12 and Table 5.13 show the results of the analysis using the
shareholders rights instead of using the overall CG score reported earlier. The score
on shareholders rights was calculated by the average score on the components related
to shareholders’ rights. The results of the statistical tests using shareholders rights
instead of the overall CS score were quite similar.
The higher score in shareholder rights implies that such firms tend to protect
the rights of their shareholders. Therefore, such firms are less vulnerable to
managerial opportunism and it is less likely to use earnings management in a negative
way. In such firms, investors will perceive earnings management less negatively.
Therefore, the effect of earnings management is less negative for firms with higher
scores on shareholders rights.
One of the important problems in regression analysis is the presence of
heteroskedasticity. Heteroskedasticity can result in underestimated or overestimated
regression standard error and make the statistical test of significance become invalid.
White’s heteroskedasticity-consistent standard error or the robust standard error is
used instead of normal OLS standard error to mitigate this problem. The previous
regression model in table 5.9 is re-estimated by using the robust standard error. The
result is reported in table 5.14.
Table 5.14 The Effect of Corporate Governance on the Relation between Earnings
Management and Firm Value in United States using the Robust Standard Error
Variables Coefficient t-Statistics Significance Level
Constant 6.7836 20.98 < 0.05
ATA -0.0268 -2.85 < 0.05
Debt Ratio -1.1193 -6.79 < 0.05
Size -0.2607 -11.16 < 0.05
Growth -0.0333 -0.37 -
ATA x CG 0.0326 2.95 < 0.05
F-statistics 178.14
Significance Level < 0.05
Adjusted R2 0.1467

60
The result from table 5.14 is quite similar to the result reported earlier. When
the robust standard error is used instead of normal OLS standard error in order to
mitigate the effect from heteroskedasticity, the t-statistics for the interaction term is
slightly lower to 2.95 from 4.25 in table 5.9. However, this coefficient for interaction
term is still significantly positive at 5% level.
The data used in this analysis is collected from many firms in United States
during 2002-2010. This panel data can be affected by cross-sectional correlation
problem. The Fama-MacBeth regression technique is used to mitigate this problem.
The standard error is computed based on Fama and MacBeth (1973) to correct for the
possible cross-sectional correlation problem. The result is reported in table 5.15.
Table 5.15 The Effect of Corporate Governance on the Relation between Earnings
Management and Firm Value in United States using Fama-MacBeth
Regression
Variables Coefficient t-Statistics Significance Level
Constant 7.5001 42.24 < 0.05
ATA -0.1147 -3.25 < 0.05
Debt Ratio -1.3396 -13.44 < 0.05
Size -0.2942 -36.69 < 0.05
Growth 0.2076 4.76 < 0.05
ATA x CG 0.2133 10.79 < 0.05
The result from table 5.15 uses Fama-MacBeth regression technique instead of
normal OLS regression. The result shows that the coefficient of the interaction term is
still positive and statistically significant at 5% level. Other coefficients are also
significant at convention level. Therefore, the result is still similar to the main result
as the interaction term between earnings management and corporate governance on
firm value is significantly positive. In another word, the effect of earnings
management on firm value is more positive for firms with higher corporate
governance performance.
Another robustness check is about the time-series variation of data. Based on
the descriptive data in table 5.1, the firm value has significantly changed during 2008,

61
which is the period of sub-prime crisis in United States. This decreasing is not
surprising but it can affect to the relation between firm value and earnings
management. In order to control for this result, the set of dummy variables
representing each year are included in the main regression model. The result is
reported in table 5.16.
Table 5.16 The Effect of Corporate Governance on the Relation between Earnings
Management and Firm Value in United States using Year Dummy Variables
Variables Coefficient t-Statistics Significance Level
Constant 6.9656 35.35 < 0.05
ATA -0.0268 -4.94 < 0.05
Debt Ratio -1.0237 -12.56 < 0.05
Size -0.2802 -21.73 < 0.05
Growth -0.0681 -2.12 < 0.05
ATA x CG 0.0338 4.53 < 0.05
F-statistics 93.75
Significance Level < 0.05
Adjusted R2 0.1897
Table 5.16 reports the result of regression analysis with year dummy variables.
After including year dummy variables to mitigate the effect of time-series variation,
the result shows that the coefficient of interaction term is still positive and significant
at 5% level.
The last robustness check is about the measurement of earnings management.
In the above result, earnings management is measured based on the ratio between total
absolute accruals and operating cash flows as used by Leuz et al. (2003). Another
popular measurement of earnings management is the absolute discretionary accruals.
The discretionary accruals can be estimated based on cross-sectional modified Jones
model. The procedure of estimating the discretionary accruals has already been
discussed in the previous chapter. The result of regression analysis reported
previously is re-estimated. The absolute discretionary accruals are use instead of the
total absolutes accruals.
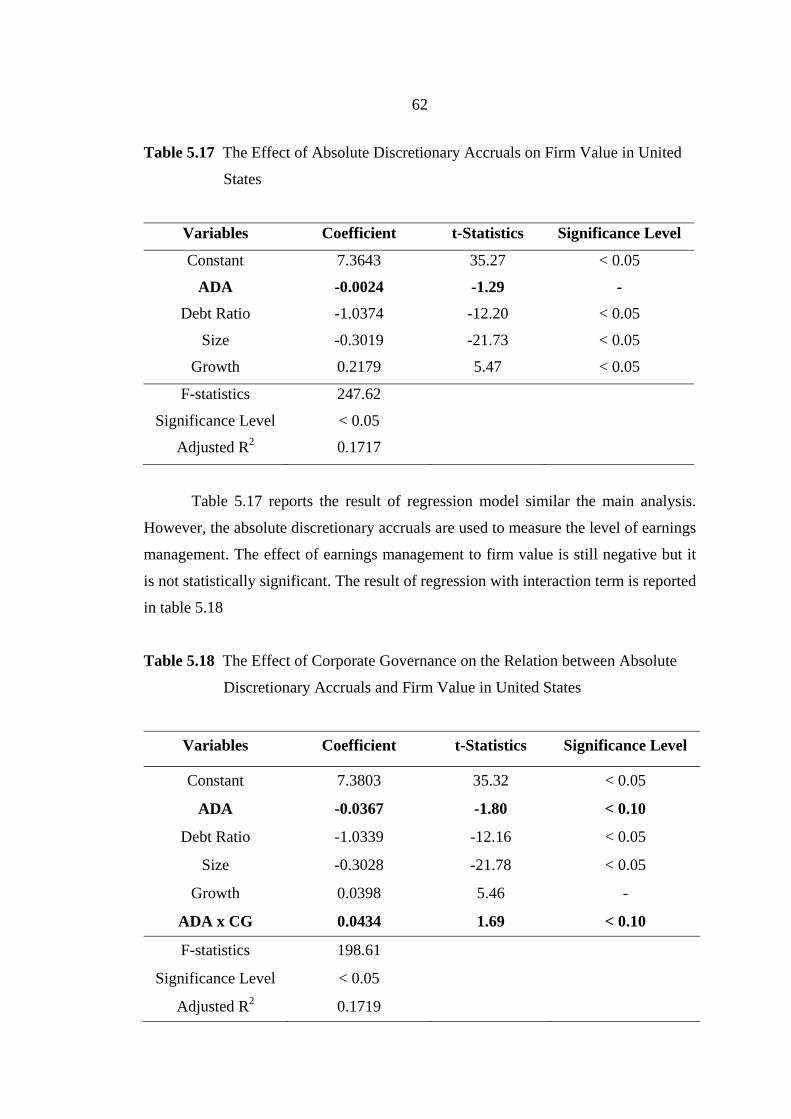
62
Table 5.17 The Effect of Absolute Discretionary Accruals on Firm Value in United
States
Variables Coefficient t-Statistics Significance Level
Constant 7.3643 35.27 < 0.05
ADA -0.0024 -1.29 -
Debt Ratio -1.0374 -12.20 < 0.05
Size -0.3019 -21.73 < 0.05
Growth 0.2179 5.47 < 0.05
F-statistics 247.62
Significance Level < 0.05
Adjusted R2 0.1717
Table 5.17 reports the result of regression model similar the main analysis.
However, the absolute discretionary accruals are used to measure the level of earnings
management. The effect of earnings management to firm value is still negative but it
is not statistically significant. The result of regression with interaction term is reported
in table 5.18
Table 5.18 The Effect of Corporate Governance on the Relation between Absolute
Discretionary Accruals and Firm Value in United States
Variables Coefficient t-Statistics Significance Level
Constant 7.3803 35.32 < 0.05
ADA -0.0367 -1.80 < 0.10
Debt Ratio -1.0339 -12.16 < 0.05
Size -0.3028 -21.78 < 0.05
Growth 0.0398 5.46 -
ADA x CG 0.0434 1.69 < 0.10
F-statistics 198.61
Significance Level < 0.05
Adjusted R2 0.1719

63
The result reported in table 5.18 has included the interaction term between
earnings management and corporate governance score similar to the main analysis.
However, the earnings management is measured by the absolute discretionary
accruals. Compared to the results reported earlier, the significant level of interaction
term in the model using the discretionary accruals is weaker than the model using
total accruals. However, the coefficient of interaction term is positive and marginally
significant at 10% level. This result can help to confirm the positive effect of
corporate governance on the relation between earnings management and firm value.
Moreover, the result of regression analysis that is reported in table 5.11 is also re-
estimated using the discretionary accruals instead of total accruals. The result of this
re-estimation is reported in table 5.19
Table 5.19 The Effect of Corporate Governance on the Relation between Absolute
Discretionary Accruals and Firm Value using Dummy Variable in United
States
Variables Coefficient t-Statistics Significance Level
Constant 7.3771 35.33 < 0.05
ADA -0.0106 -2.55 < 0.05
Debt Ratio -1.0333 12.15 < 0.05
Size -0.3026 -21.78 < 0.05
Growth 0.2176 5.46 < 0.10
ADA x DHIGH 0.0102 2.21 < 0.05
F-statistics 199.47
Significance Level < 0.05
Adjusted R2 0.1725
The interaction term in table 5.18 is from the multiplication of the dummy
variable representing high-CG firms and earnings management measured by the
absolute discretionary accruals instead of absolute total accruals. The coefficient of
earnings management is negative whereas the coefficient of this interaction term is

64
positive. Both of them are statistically significant at 5% level. This result can help to
confirm the difference in the relation between earnings management and firm value
between high-CG firms and low-CG firms. The effect of earnings management to
firm value is more positive for high-CG firms compared to low-CG firms.
From all results reported earlier, it is clearly seen that corporate governance
has an important impact to the relation between earnings management and firm value.
Based on the empirical data from United States, the effect of earnings management on
firm value is generally negative. However, this negative relation is affected by the
corporate governance. The relation between earnings management and firm value is
less negative for firms with higher corporate governance score. If all firms are broadly
classified into high-CG firms and low-CG firms, the result is also similar. Low-CG
firms or poorer-governance firms have faced the negative effect of earnings
management and firm value. High-CG firms or better-governance firms also face the
same negative effect of earnings management but this negative effect is significantly
lower for high-CG firms.
These results provide the support to the first research hypothesis as the relation
between earnings management and firm value is less negative for the firm with higher
level of corporate governance. This evidence also supports the role of corporate
governance to restrain managerial opportunism that leads to negative earnings
management. The next section will provide the empirical result in another emerging
market, which is Thailand. The corporate governance in Thailand is interesting
because CG data in Thailand is provided in term of categorical data instead of
continuous CG scores like in United States.
5.2.2 Firm-level Analysis for Thailand
This section will provide the empirical evidence on the firm-level analysis to
examine the first research hypothesis “The relation between earnings management
and firm value should be less negative (more positive) for the firm with higher level
of corporate governance.” However, in stead of the evidence from well-developed
market like United States, the further evidence on emerging market like Thailand is
examined. The effect on corporate governance in Thailand is interesting because the
corporate governance in Thailand is not available in continuous score like United
States but in form of categorical data.

65
Thai Institute of Director (Thai IOD) provides the information about corporate
governance of listed firms. This corporate governance performance is reported for
each firm in term of CG-star. Firms in top category are given Five CG-stars. Then,
other firms are given Four CG-stars and Three CG-stars according to their corporate
governance practice respectively. However, no firm is reported to be in Two CG-
stars or One CG-star. Those firms are reported as “Not Available” instead.
First the effect of CG performance on the level of earnings management is
determined. Earnings Management is based on the absolute discretionary accruals.
The level of earnings management for each CG-star group is reported in table 5.20
Table 5.20 The Level of Earnings Management on Each CG-star Group in Thailand
CG-Star Mean Standard Deviation
F-Statistics Significance Level
No Star 0.0902 0.1408
4.82 < 0.05 Three Stars 0.0889 0.2856
Four Stars 0.0657 0.0820
Five Stars 0.0476 0.0619
From table 5.20, the mean level of earnings management varies for each CG-
star group. The earnings management is highest for firms with no CG-star and it is
lowest for firms with five CG-star. The F-test is based on one-way ANOVA in order
to examine the different in mean level among different CG-star groups. The test
shows that there is different in mean level of earnings management for each CG-star
group at 5% significant level. Therefore, it can be concluded that firms in different
CG-star group have different level of earnings managements. Higher CG-star firms
tend to have lower level of earnings management.
In order to test the first research hypothesis, the effect of earnings management
of firm value can be examined separately based on their CG-star group. First, the
effect of earnings management on firm value is examined. Earnings management is
measured based on accrual-based earnings management. The absolute discretionary
accruals are estimated based on cross sectional modified Jones model. The relation
between firm value and earnings management is reported in table 5.21.
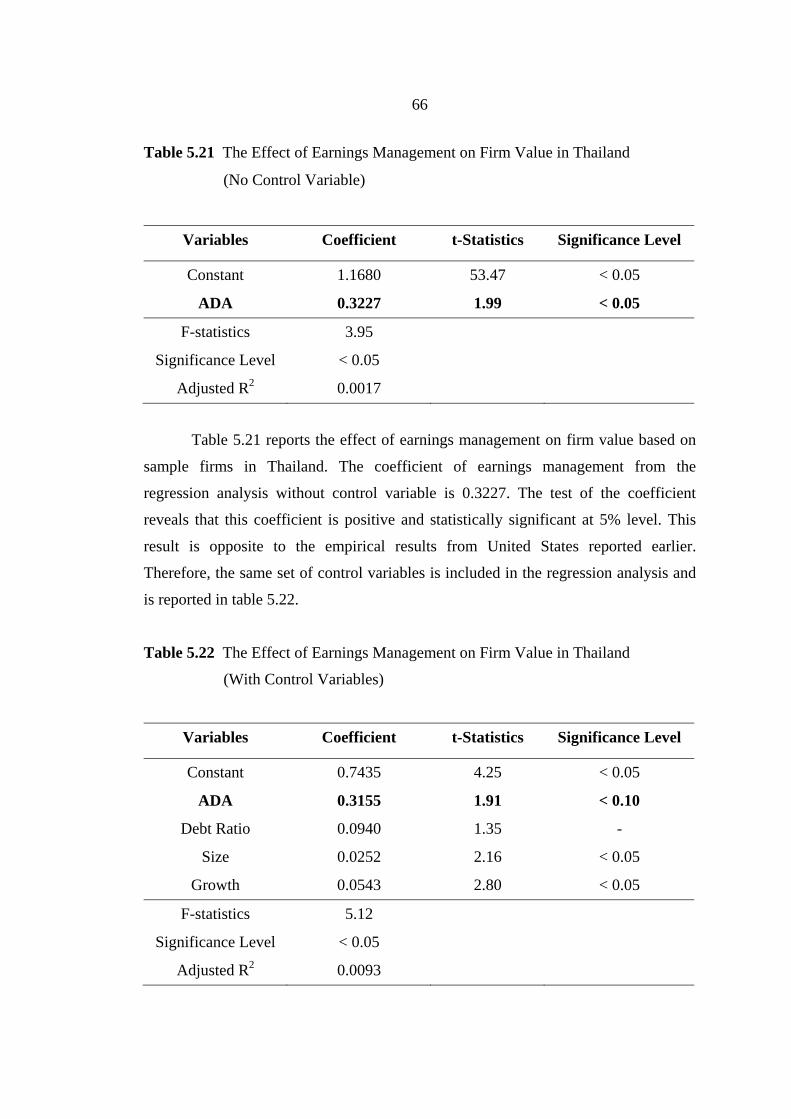
66
Table 5.21 The Effect of Earnings Management on Firm Value in Thailand
(No Control Variable)
Variables Coefficient t-Statistics Significance Level
Constant 1.1680 53.47 < 0.05
ADA 0.3227 1.99 < 0.05
F-statistics 3.95
Significance Level < 0.05
Adjusted R2 0.0017
Table 5.21 reports the effect of earnings management on firm value based on
sample firms in Thailand. The coefficient of earnings management from the
regression analysis without control variable is 0.3227. The test of the coefficient
reveals that this coefficient is positive and statistically significant at 5% level. This
result is opposite to the empirical results from United States reported earlier.
Therefore, the same set of control variables is included in the regression analysis and
is reported in table 5.22.
Table 5.22 The Effect of Earnings Management on Firm Value in Thailand
(With Control Variables)
Variables Coefficient t-Statistics Significance Level
Constant 0.7435 4.25 < 0.05
ADA 0.3155 1.91 < 0.10
Debt Ratio 0.0940 1.35 -
Size 0.0252 2.16 < 0.05
Growth 0.0543 2.80 < 0.05
F-statistics 5.12
Significance Level < 0.05
Adjusted R2 0.0093

67
Although the effect of leverage, size, and growth is controlled in the multiple
regressions, the effect of earnings management on firm value in Thailand is still
positive and significant at 10% level. Although the result is not similar to the previous
result from United States, it is not surprising because some previous studies also
report the positive effect of earnings management (Jiraporn Pornsit, Miller, Yoon and
Kim, 2008). The possible explanations of positive effect of earnings management in
Thailand is there is no obvious case of accounting scandals in Thailand, which is
different from United States.
Moreover, the difference in the effect of earnings management between
Thailand and United States can partially support the model discussed in Chapter 3.
Due to there can be both positive and negative earnings management, the effect of
earnings management on firm value can be positive (if the positive earnings
management dominates the negative earnings management) or negative (if the
negative earnings management dominates the positive earnings management).
Now let examine the impact of corporate governance on the effect of earnings
management on firm value. The corporate governance measurement in Thailand is
based on the CG-star reported by Thai IOD. Each listed firm is classified as 3-Star, 4-
Star, 5-Star, or no-Star. The regression analysis to examine the effect of earnings
management on firm value is conducted separately between firms with CG-star and
firms without CG-star and the result is reported in table 5.23.
Table 5.23 The Effect of Earnings Management on Firm Value for Firms with and
without CG-Star in Thailand
Variables No CG-Star CG-Star
Constant 1.944 0.0410
ADA 0.0770 0.8465
Debt Ratio 0.2133 -0.1959
Size -0.0631 0.0772
Growth 0.0554 0.1193
Adjusted R2 0.0260 0.0251

68
The result reported in table 5.23 shows the difference in the effect of earnings
management on firm value. The coefficient of earnings management for firm with
CG-star (including 3-Star, 4-Star, and 5-Star) is 0.8465 whereas the coefficient of
earnings management for firms without CG-star (possible to be 2-Star and 1-Star
firms) is much lower at 0.0770. This result can partially support the role of corporate
governance on the effect of earnings management. The effect of earnings management
on firm value is higher (more positive) for firms with better corporate governance
performance than firms with poorer corporate governance performance.
However, in order to examine whether this difference in the effect of earnings
management is statistically significant, the regression analysis with dummy
interaction term is used. The dummy variable for CG-star is created whereas this
dummy variable equals to one for firms with CG-star (3-Star, 4-Star, or 5-Star) or
zero otherwise. The interaction term is the multiplication between CG-star dummy
variable and earnings management measurement. This interaction term is added in the
regression model reported in table 5.22. Therefore, the coefficient of earning
management represents the effect of earnings management on firm value for firms
without CG-star whereas the coefficient of interaction term represents the incremental
or marginal effect of earnings management on firm value of firms with CG-star
compared to firms without CG-star.
Table 5.24 The Effect of Corporate Governance on the Relation between Earnings
Management and Firm Value using CG-Star Dummy Variable in Thailand
Variables Coefficient t-Statistics Significance Level
Constant 0.8180 4.58 < 0.05
ADA 0.1315 0.70 -
Debt Ratio 0.1029 1.48 -
Size 0.0196 1.63 -
Growth 0.0568 2.92 < 0.05
ADA x D345 0.5855 2.05 < 0.05
F-statistics 4.95
Significance Level < 0.05
Adjusted R2 0.0112

69
Table 5.24 reports the result of regression analysis with interaction term
between CG-star dummy variable and earnings management. The coefficient of
earnings management (EM) represents the effect of earnings management on firm
value for firms without CG-star. The result is as expected. Although the effect of
earnings management is still positive, it is not statistically significant at any
convention level. Compared to the result of regression analysis in table 5.22 that the
effect of earnings management is significantly positive, this implies that the
significantly positive effect of earnings management is from only firms with CG-star.
The coefficient of interaction term represents the difference in the effect of
earnings management between firms with CG-star and firms without CG-star. This
coefficient is positive and statistically significant at 5% level. This means the effect of
earnings management is significantly higher (or more positive) for firms with CG-star
compared to firms without CG-star.
Instead of combining the group of firms with CG-star, three dummy variables
are created for each CG-star group. The dummy variable representing i-Star (Di) is
equal to one if firms are given i CG-stars or zero otherwise. Three interaction terms
are created as the multiplication between the dummy variable for each CG-star and
earnings managements. The result of regression analysis with three interaction terms
is reported in table 5.25.
Table 5.25 The Effect of Corporate Governance on the Relation between Earnings
Management and Firm Value using Each CG-Star Dummy Variable in
Thailand
Variables Coefficient t-Statistics Significance Level Constant 0.9636 5.33 < 0.05
ADA 0.1491 0.80 - Debt Ratio 0.0949 1.37 -
Size 0.0091 0.75 - Growth 0.0563 2.91 < 0.05
ADA x D3 -0.1950 -0.58 - ADA x D4 1.6123 3.79 < 0.05 ADA x D5 2.5782 3.24 < 0.05 F-statistics 6.48
Significance Level < 0.05 Adjusted R2 0.0254

70
From table 5.25, the coefficient of interaction term for 3-Star is not
statistically significant at any convention level. However, the coefficient of interaction
term for 4-star is 1.6123, which is positive and significant at 5% level. This means
that the effect of earnings management for firms with four CG-stars is significantly
higher (more positive) than firms without CG-star. The coefficient of interaction term
for 5-star is 2.5782, which is also positive and statistically significant at 5% level.
Therefore, the effect of earnings management is more positive for firms with five CG-
stars than firms without CG-star.
The results reported earlier have revealed that the effect of earnings
management on firm value is more positive for firms with CG-star than firms without
CG-star. However, there is still no comparison of the effect of earnings management
among firms with different CG-star. In order to examine this difference, the
regression analysis to examine the effect of earnings management on firm value is
conducted separately for firms in each CG-star group. The result of three regression
models is reported in table 5.26.
Table 5.26 The Effect of Earnings Management on Firm Value for Firms in Different
CG-Star Group in Thailand
Variables Three CG-Star Four CG-Star Five CG-Star
Constant 1.3664 -0.3420 0.9126
ADA 0.6157 1.5434 1.5144
Debt Ratio -0.1338 -0.4927 0.0633
Size -0.0224 0.1130 0.0232
Growth 0.5568 -0.0377 -0.0787
Adjusted R2 0.1527 0.1527 0.1715
From table 5.26, the coefficient of earnings management on firm value for
firms with three CG-stars is 0.6157. This coefficient is lower compared to the
coefficient of earnings management for firms with CG-star (3-Star, 4-Star, or 5-Star)
reported in table 5.23 with the value of 0.8465 (that represents the average effect of
earnings management for all firms with CG-star). The coefficient of earnings
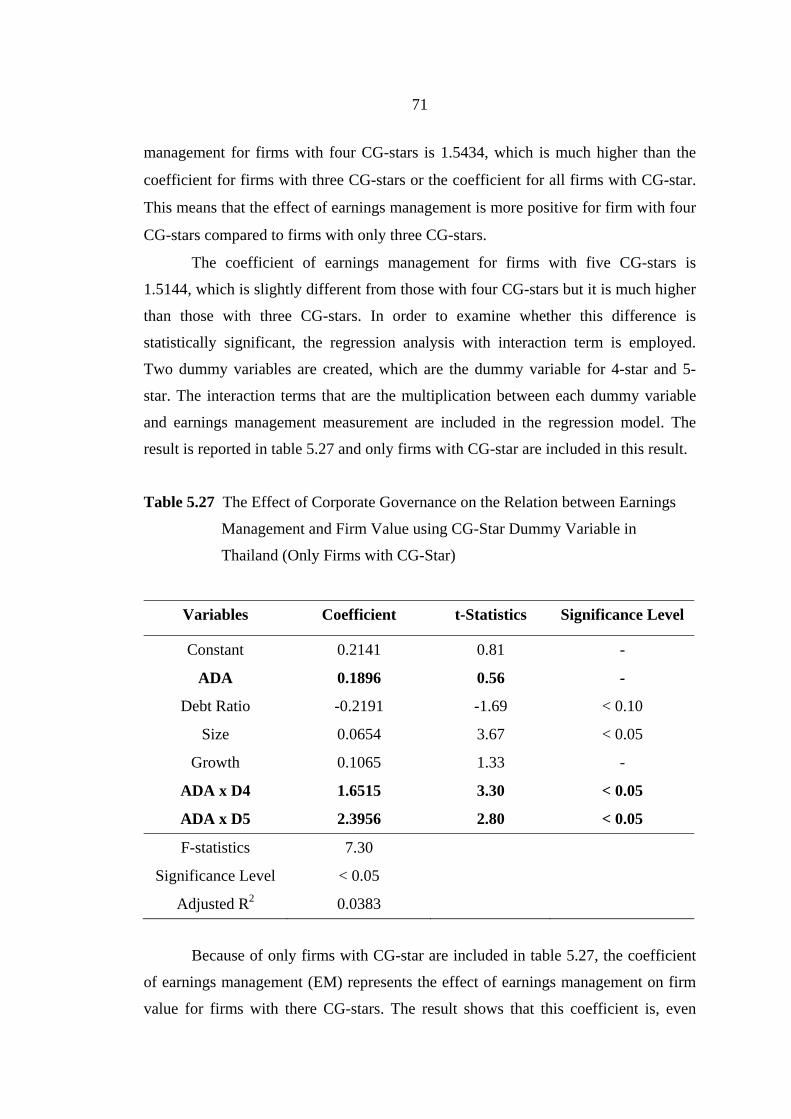
71
management for firms with four CG-stars is 1.5434, which is much higher than the
coefficient for firms with three CG-stars or the coefficient for all firms with CG-star.
This means that the effect of earnings management is more positive for firm with four
CG-stars compared to firms with only three CG-stars.
The coefficient of earnings management for firms with five CG-stars is
1.5144, which is slightly different from those with four CG-stars but it is much higher
than those with three CG-stars. In order to examine whether this difference is
statistically significant, the regression analysis with interaction term is employed.
Two dummy variables are created, which are the dummy variable for 4-star and 5-
star. The interaction terms that are the multiplication between each dummy variable
and earnings management measurement are included in the regression model. The
result is reported in table 5.27 and only firms with CG-star are included in this result.
Table 5.27 The Effect of Corporate Governance on the Relation between Earnings
Management and Firm Value using CG-Star Dummy Variable in
Thailand (Only Firms with CG-Star)
Variables Coefficient t-Statistics Significance Level
Constant 0.2141 0.81 -
ADA 0.1896 0.56 -
Debt Ratio -0.2191 -1.69 < 0.10
Size 0.0654 3.67 < 0.05
Growth 0.1065 1.33 -
ADA x D4 1.6515 3.30 < 0.05
ADA x D5 2.3956 2.80 < 0.05
F-statistics 7.30
Significance Level < 0.05
Adjusted R2 0.0383
Because of only firms with CG-star are included in table 5.27, the coefficient
of earnings management (EM) represents the effect of earnings management on firm
value for firms with there CG-stars. The result shows that this coefficient is, even

72
positive, not statistically significant at any convention level. The coefficient of
interaction term for 4-star represents the incremental or marginal effect of earnings
management for firms with four CG-stars compared to firms with three CG-stars. This
coefficient is 1.6515, which is positive and statistically significant at 5% level. The
coefficient of interaction term for 5-star is 2.3956, which is also positive and
significant at 5% level. This means the effect of earnings management is more
positive for firms with four or five CG-stars compared to firms with only three CG-
stars. This result only supports the research hypothesis about the impact of corporate
governance on the effect of earnings management.
All results reported earlier in this section can be affected by the presence of
heteroskedasticity. Heteroskedasticity is the violation of the regression assumption
about equal variance. The presence of heteroskedasticity can make the estimation of
standard error of regression incorrect and the result of hypothesis test of significance
becomes invalid. To mitigate this problem, the robust standard error is used in the
regression analysis instead of normal OLS standard error. The previous regression
result reported in table 5.24 is re-estimated using robust standard error and the new
result is reported in table 5.28
Table 5.28 The Effect of Corporate Governance on the Relation between Earnings
Management and Firm Value in Thailand using the Robust Standard Error
Variables Coefficient t-Statistics Significance Level
Constant 0.8180 4.05 < 0.05
ADA 0.1315 0.73 -
Debt Ratio 0.1029 1.40 -
Size 0.0196 1.46 -
Growth 0.0568 1.81 < 0.10
ADA x D345 0.5855 1.70 < 0.10
F-statistics 3.45
Significance Level < 0.05
Adjusted R2 0.0112

73
The result using the robust standard error reported in table 5.28 is quite similar
to the main result using normal OLS regression. The coefficient of earnings
management is still positive but not statistically significant at any convention level.
The coefficient of interaction term is positive and significant at 10% level. This means
that the effect of earnings management is more positive for firms with CG-stars than
those without CG-star.
Another robustness check for the results in this section is to mitigate the
possible effect of cross-sectional correlation problem. The Fama-MacBeth regression
technique is employed in this case. The regression model reported in table 5.23 is re-
estimated based on Fama-MacBeth regression technique and the result is reported in
table 5.29.
Table 5.29 The Effect of Corporate Governance on the Relation between Earnings
Management and Firm Value in Thailand using Fama-MacBeth
Regression
Variables Coefficient t-Statistics Significance Level
Constant 0.8593 14.09 < 0.05
ADA 0.2287 2.99 < 0.05
Debt Ratio 0.0714 1.53 -
Size 0.0175 2.96 < 0.05
Growth 0.0313 2.74 < 0.10
ADA x D345 0.5396 2.72 < 0.10
The result from table 5.29 uses Fama-MacBeth regression technique instead of
normal OLS regression. the reported result is qualitatively similar to the result
reported earlier, especially the impact of corporate governance on the relation
between earnings management and firm value. The coefficient of the interaction term
is still positive and statistically significant at 10% level. Therefore, this result does
support the impact of corporate governance to the effect of earnings management on
firm value.

74
Table 5.30 The Effect of Corporate Governance on the Relation between Earnings
Management and Firm Value in Thailand using Year Dummy Variables
Variables Coefficient t-Statistics Significance Level
Constant 0.9697 5.43 < 0.05
ADA 0.1559 0.85 -
Debt Ratio 0.1043 1.53 -
Size 0.0484 2.53 < 0.05
Growth 0.0172 1.46 -
ADA x D345 0.4697 1.68 < 0.10
F-statistics 4.95
Significance Level < 0.05
Adjusted R2 0.0112
The result from table 5.30 includes year dummy variables in order to reduce
the effect of time-series variation of the variable. The result is qualitatively similar to
the result reported earlier. Although the coefficient of the interaction term is lower
compared to the main result, it is still significant at convention level. Therefore, this
result does support the impact of corporate governance to the effect of earnings
management on firm value.
The last robustness check for this section is about the measurement of earnings
management. In this section, the earnings management is measured based on accrual-
based earnings management. The popular model to measure this accrual-based
earnings management is known as modified Jones model. The modified Jones model
use the multiple regression technique to predict the level of total accruals based on a
set of variables like change in cash revenue (change in total revenue minus change in
receivables) or property, plant, and equipments. The regression is estimated cross-
sectionally for each year based on each industry. The predicted value from this
regression model is normal accruals (non-discretionary accruals) and the residuals
from this regression model can be treated as abnormal accruals or commonly known
as discretionary accruals.
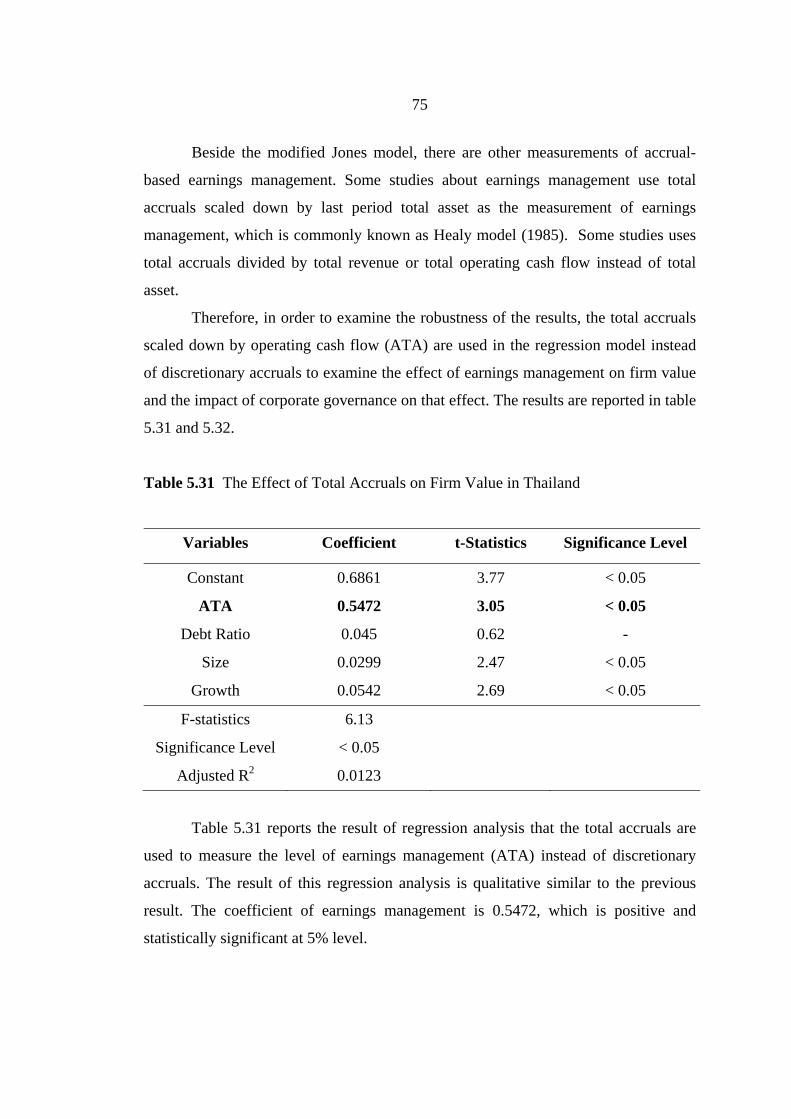
75
Beside the modified Jones model, there are other measurements of accrual-
based earnings management. Some studies about earnings management use total
accruals scaled down by last period total asset as the measurement of earnings
management, which is commonly known as Healy model (1985). Some studies uses
total accruals divided by total revenue or total operating cash flow instead of total
asset.
Therefore, in order to examine the robustness of the results, the total accruals
scaled down by operating cash flow (ATA) are used in the regression model instead
of discretionary accruals to examine the effect of earnings management on firm value
and the impact of corporate governance on that effect. The results are reported in table
5.31 and 5.32.
Table 5.31 The Effect of Total Accruals on Firm Value in Thailand
Variables Coefficient t-Statistics Significance Level
Constant 0.6861 3.77 < 0.05
ATA 0.5472 3.05 < 0.05
Debt Ratio 0.045 0.62 -
Size 0.0299 2.47 < 0.05
Growth 0.0542 2.69 < 0.05
F-statistics 6.13
Significance Level < 0.05
Adjusted R2 0.0123
Table 5.31 reports the result of regression analysis that the total accruals are
used to measure the level of earnings management (ATA) instead of discretionary
accruals. The result of this regression analysis is qualitative similar to the previous
result. The coefficient of earnings management is 0.5472, which is positive and
statistically significant at 5% level.
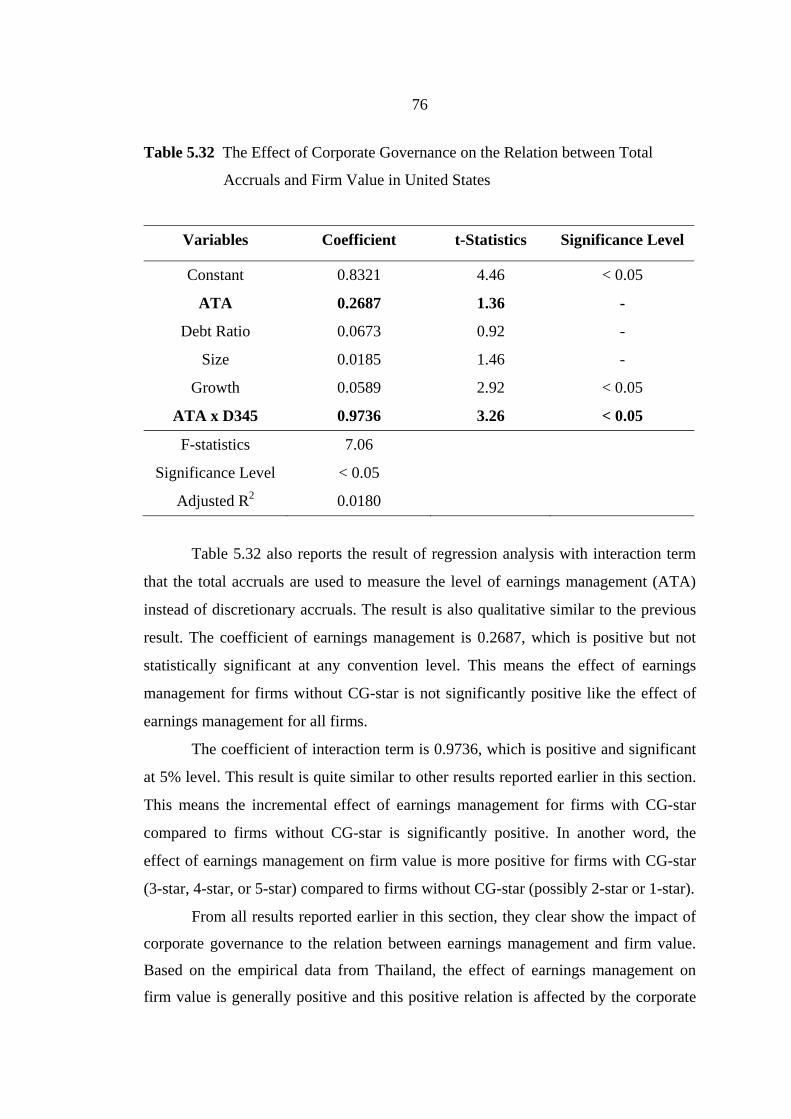
76
Table 5.32 The Effect of Corporate Governance on the Relation between Total
Accruals and Firm Value in United States
Variables Coefficient t-Statistics Significance Level
Constant 0.8321 4.46 < 0.05
ATA 0.2687 1.36 -
Debt Ratio 0.0673 0.92 -
Size 0.0185 1.46 -
Growth 0.0589 2.92 < 0.05
ATA x D345 0.9736 3.26 < 0.05
F-statistics 7.06
Significance Level < 0.05
Adjusted R2 0.0180
Table 5.32 also reports the result of regression analysis with interaction term
that the total accruals are used to measure the level of earnings management (ATA)
instead of discretionary accruals. The result is also qualitative similar to the previous
result. The coefficient of earnings management is 0.2687, which is positive but not
statistically significant at any convention level. This means the effect of earnings
management for firms without CG-star is not significantly positive like the effect of
earnings management for all firms.
The coefficient of interaction term is 0.9736, which is positive and significant
at 5% level. This result is quite similar to other results reported earlier in this section.
This means the incremental effect of earnings management for firms with CG-star
compared to firms without CG-star is significantly positive. In another word, the
effect of earnings management on firm value is more positive for firms with CG-star
(3-star, 4-star, or 5-star) compared to firms without CG-star (possibly 2-star or 1-star).
From all results reported earlier in this section, they clear show the impact of
corporate governance to the relation between earnings management and firm value.
Based on the empirical data from Thailand, the effect of earnings management on
firm value is generally positive and this positive relation is affected by the corporate

77
governance. The relation between earnings management and firm value is more
positive for firms with higher CG-star or higher corporate governance performance.
Based on CG-star in Thailand, all firms can be broadly classified into firms
with CG-star (3-star, 4-star, or 5-star) and firms without CG-star (possibly 2-star or 1-
star). Firms without CG-star can be looked as poor-governance firms and the earnings
management does not have positive effect on firm value like in general.
However, firms with CG-star can be looked as good-governance firms and the
effect of earnings management on firm value is significantly positive. Moreover, the
positive effect of earnings management is more obvious for firms with four CG-stars
or five CG-stars.
Together with the empirical results from United States, all results provide the
support to the first research hypothesis. In United States, the general relation between
earning management and firm value is negative. However, the relation between
earnings management and firm value is less negative for firms with higher corporate
governance performance. In Thailand, the general relation between earnings
management and firm value is positive. Meanwhile the relation between earnings
management and firm value is more positive for firms with higher corporate
governance performance.
All of these evidences in firm-level analysis for both United States and
Thailand can support the role of corporate governance to restrain the negative
earnings management arises from managerial opportunism. The next section will
report the results for country-level analysis using investor protection instead of firm-
level corporate governance.
5.2.3 Country-level Analysis
In last section, the empirical evidences have supported that corporate
governance can help to reduce the negative earnings management and make earnings
management becomes more positive or less negative. This result can be explained by
the role of corporate governance as the effective controlling mechanism to restrain
managerial opportunism in earnings reporting.
In this section, the previous results are extended to another level of controlling
mechanism, which is investor protection. Investor protection is about how investors
are protected based on the existence and enforcement of legal system. If managerial

78
opportunism can be effectively restrained by corporate governance at the firm level, it
should be restrained by investor protection based on the country level, too.
This section will provide the empirical evidence on the country-level analysis
to examine the second research hypothesis “The relation between earnings
management and firm value should be more positive (or less negatives) in the country
with higher level of investor protection.”
Investor protection is measured based on the country level. There are three
main measurement of investor protection, which are outside investor rights
(shareholders right), legal enforcement, and public enforcement. Outside investor
rights or shareholders rights are anti-director rights that can be used by minority
shareholders based on La Porta et al. (1998). Legal enforcement is the measurement
of how well the country law can be enforced. The measurement of legal enforcement
is based on Leuz et al. (2003) and the data is provided by La Porta et al. (1998).
Public enforcement is about the power of securities market supervisor to investigate
the abuse case, which is based on La Porta et al. (2006).
All other variables need to be based on country-level measurement similar to
the investor protection. Earnings management is measured by discretionary accruals
based on modified Jones model. The modified Jones regression models are estimated
for each year and industry. The residuals from the above regression models are
discretionary accruals. In each year, the country-level earnings management is the
average of absolute discretionary accruals for each country.
Table 5.33 The Effect of Earnings Management on Firm Value Based on
International Evidence (No Control Variable)
Variables Coefficient t-Statistics Significance Level
Constant 1.5705 50.32 < 0.05
ADA 0.3864 4.77 < 0.05
F-statistics 22.76
Significance Level < 0.05
Adjusted R2 0.0658

79
Table 5.33 reports the effect of earnings management on firm value based on
country-level analysis of 31 countries around the world. The coefficient of earnings
management is 0.3864, which is significantly positive at 5% level. This means, in
general, earnings management has the positive impact to firm value. Based on the
theoretical model discussed in Chapter 3, there can be both positive and negative
earnings management. It cannot be generally predicted for the sign of the earnings
management effect on firm value. If the positive earnings management can dominate
the negative earnings management, the effect of earnings management will be
positive. However, if the negative earnings management dominates the positive one,
the effect of earnings management turns into negative.
Therefore, the result from table 5.33 can imply that the positive earnings
management generally dominates the negative earnings management based on the
evidences from 31 countries around the world. Then, a set of country-level country
variables are included in the regression analysis and the result is reported in table 5.34.
Table 5.34 The Effect of Earnings Management on Firm Value Based on
International Evidence (With Control Variables)
Variables Coefficient t-Statistics Significance Level
Constant 0.0605 0.27 -
ADA 0.3535 4.61 < 0.05
Debt Ratio 1.0427 4.35 < 0.05
Size 0.0344 4.92 < 0.05
Growth 0.0014 0.74 -
F-statistics 18.11
Significance Level < 0.05
Adjusted R2 0.1813
After including a set of control variables, the effect of earnings management in
table 5.34 is quite similar to the previous table. The coefficient of earnings
management is slightly different from the previous model but it is still positive and

80
statistically significant at 5%. Moreover, including a set of control variables also help
to improve the adjusted r-squared from 0.0658 to 0.1813.
Then, the effect of investor protection is included in the above regression
model. The first investor protection is outside investor rights or shareholder rights
(SR). The result of regression analysis with interaction term for legal enforcement is
reported in table 5.35.
Table 5.35 The Effect of Investor Protection on the Relation between Earnings
Management and Firm Value using Shareholders Rights
Variables Coefficient t-Statistics Significance Level
Constant 0.1751 0.74 -
ADA -0.0020 -0.01 -
Debt Ratio 1.0219 4.27 < 0.05
Size 0.0304 4.16 < 0.05
Growth 0.0012 0.62 -
ADA x SR 0.1109 1.78 < 0.10
F-statistics 15.23
Significance Level < 0.05
Adjusted R2 0.1872
Table 5.35 reports the result of regression analysis with interaction term. This
interaction term is created by the multiplication between earnings management and
shareholder rights. The coefficient of interaction term is 0.1109, which is positive and
significant at 10% level. This means that the level of outside investor rights or
shareholders rights have the positive effect on the relation between earnings
management and firm value. In another word, in the country that the law can protect
shareholders right well, the effect of earnings management on firm value will be more
positive.
The next investor protection measurement is legal enforcement (LE). Legal
enforcement is the measurement of how well the country’s law is enforced, which is
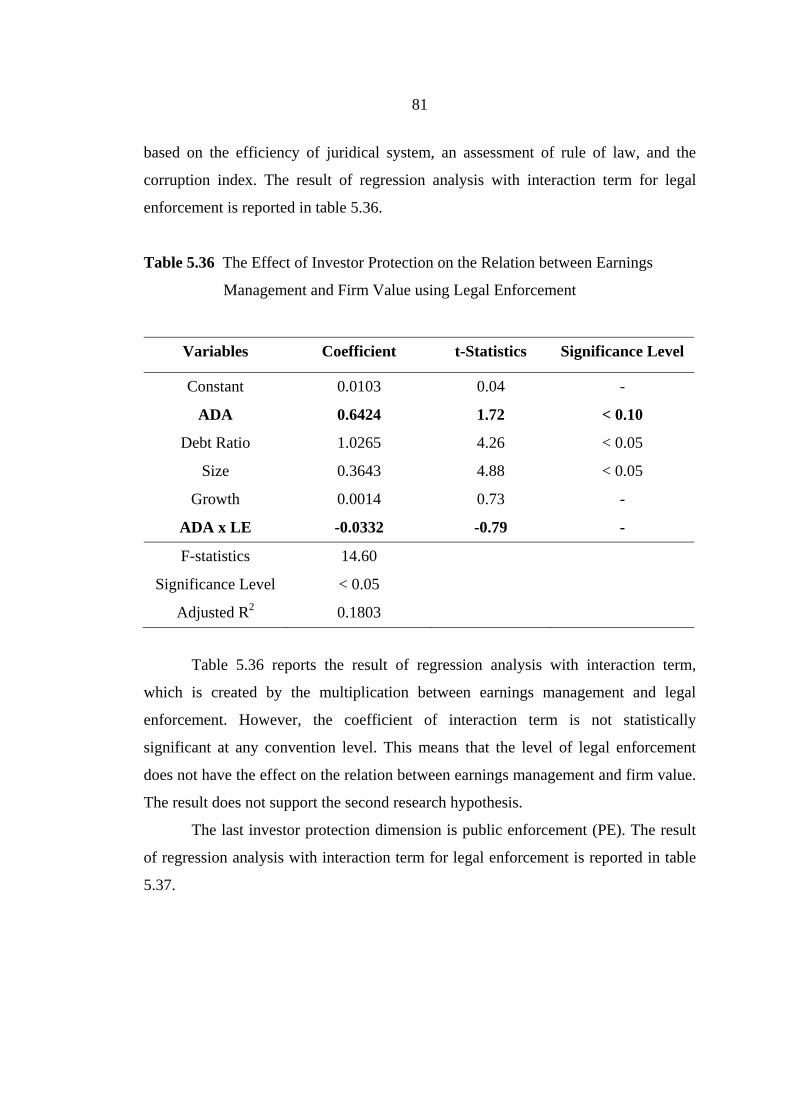
81
based on the efficiency of juridical system, an assessment of rule of law, and the
corruption index. The result of regression analysis with interaction term for legal
enforcement is reported in table 5.36.
Table 5.36 The Effect of Investor Protection on the Relation between Earnings
Management and Firm Value using Legal Enforcement
Variables Coefficient t-Statistics Significance Level
Constant 0.0103 0.04 -
ADA 0.6424 1.72 < 0.10
Debt Ratio 1.0265 4.26 < 0.05
Size 0.3643 4.88 < 0.05
Growth 0.0014 0.73 -
ADA x LE -0.0332 -0.79 -
F-statistics 14.60
Significance Level < 0.05
Adjusted R2 0.1803
Table 5.36 reports the result of regression analysis with interaction term,
which is created by the multiplication between earnings management and legal
enforcement. However, the coefficient of interaction term is not statistically
significant at any convention level. This means that the level of legal enforcement
does not have the effect on the relation between earnings management and firm value.
The result does not support the second research hypothesis.
The last investor protection dimension is public enforcement (PE). The result
of regression analysis with interaction term for legal enforcement is reported in table
5.37.

82
Table 5.37 The Effect of Investor Protection on the Relation between Earnings
Management and Firm Value using Public Enforcement
Variables Coefficient t-Statistics Significance Level
Constant 0.1165 0.74 -
ADA 0.1185 0.80 -
Debt Ratio 1.0151 4.24 < 0.05
Size 0.0328 4.69 < 0.05
Growth 0.0014 0.76 -
ADA x PE 0.3957 1.84 < 0.10
F-statistics 15.23
Significance Level < 0.05
Adjusted R2 0.1872
Table 5.37 reports the result of regression analysis with interaction term,
which is created by the multiplication between earnings management and public
enforcement measurement. The coefficient of the interaction term is positive and
significant at 10% level. This means that the level of public enforcement has the
effect on the relation between earnings management and firm value. This result can
support the second research hypothesis.
The impact of investor protection on the effect of earnings management is
varied based on the way to measure investor protection. For anti-director rights or
shareholder rights and public enforcement of securities law, the impact of investor
protection is statistically significant whereas it is not significant for legal enforcement.
The possible explanation to this result is shareholder rights and public enforcement of
securities law is more related to investors. In the country that shareholders rights are
protected well by law, the opportunistic behaviors could be discourage. The earnings
management for such countries should be from positive purpose and perceived more
positively by investors.
In addition, the public enforcement of securities law is about the power of
investigation by securities market supervisor. Therefore, the high public enforcement
level means the stronger investigation system. This could also discourage the

83
opportunistic behaviors because these activities could be more investigated and
penalized in such countries. Therefore, the earnings management is such countries are
more from positive purpose.
However, the impact of legal enforcement on the effect of earnings
management is not statistically significant. Compared to shareholders rights and
public enforcement, legal enforcement is not measured specifically to the cases about
securities market but it is for general cases. Therefore, better legal enforcement may
not mean better control of securities market system. That could be the reason why the
legal enforcement is not significant in this situation.
Therefore, in order to measure the overall effect of investor protection, the
new measurement is created. The above three dimensions of investor protection
measurement are combined into a single measurement, which is called aggregate
investor protection. Shareholder rights or outside investor rights score ranges from
zero to five. Legal enforcement score ranges from zero to ten. Public enforcement
score ranges from zero to one. In order to combine these three dimensions, the score
on each dimension is adjusted into the same scale, which is from zero to ten.
Thereafter, the mean on adjusted scores are computed and called aggregate investor
protection.
Table 5.38 The Effect of Investor Protection on the Relation between Earnings
Management and Firm Value using Aggregate Investor Protection
Variables Coefficient t-Statistics Significance Level
Constant 0.0052 0.02 -
ADA -0.2362 -0.78 -
Debt Ratio 1.0437 4.71 < 0.05
Size 0.0096 1.30 -
Growth 0.0002 0.11 -
ADA x IP 0.0734 1.76 < 0.10
IP 0.1156 5.87 < 0.05
F-statistics 19.30
Significance Level < 0.05
Adjusted R2 0.2284

84
Table 5.38 reports the result of regression analysis with interaction term,
which is created by the multiplication between earnings management and aggregate
investor protection measurement. The coefficient of earnings management becomes
insignificant at convention level whereas the coefficient of investor protection is
positive and significant at 5% level. In order to under the positive effect of investor
protection and why earnings management becomes insignificant, the coefficient of the
interaction term should be emphasized. That coefficient is positive and significant at
5% level. This means that the level of overall investor protection has the effect on the
relation between earnings management and firm value.
Then, in order to further examine the impact of investor protection on the
relation between earnings management and firm value, the regression model showing
the effect of earnings management on firm value is re-estimated based on the
aggregate investor protection level. Each country is classified into high investor
protection (High IP) or low investor protection (Low IP) based on aggregate investor
protection score of that country. The country whose aggregate investor protection is
higher than median level is classified an high-IP country whereas the country who
aggregate investor protection is lower than median level is classified as low-IP
country. The results of the regression analysis for low-IP countries and high-IP
countries are reported in table 5.39.
From table 5.39, the coefficient of earnings management is only 0.0551 for
low-IP countries whereas it is 0.4661 for high-IP countries. This result clearly shows
that the effect of earnings management on firm value is more positive for countries
have higher score on overall investor protection compared to those with lower score
on overall investor protection. In order to examine the significance of this difference,
the regression analysis with dummy interaction term is used and the result is reported
in table 5.40.
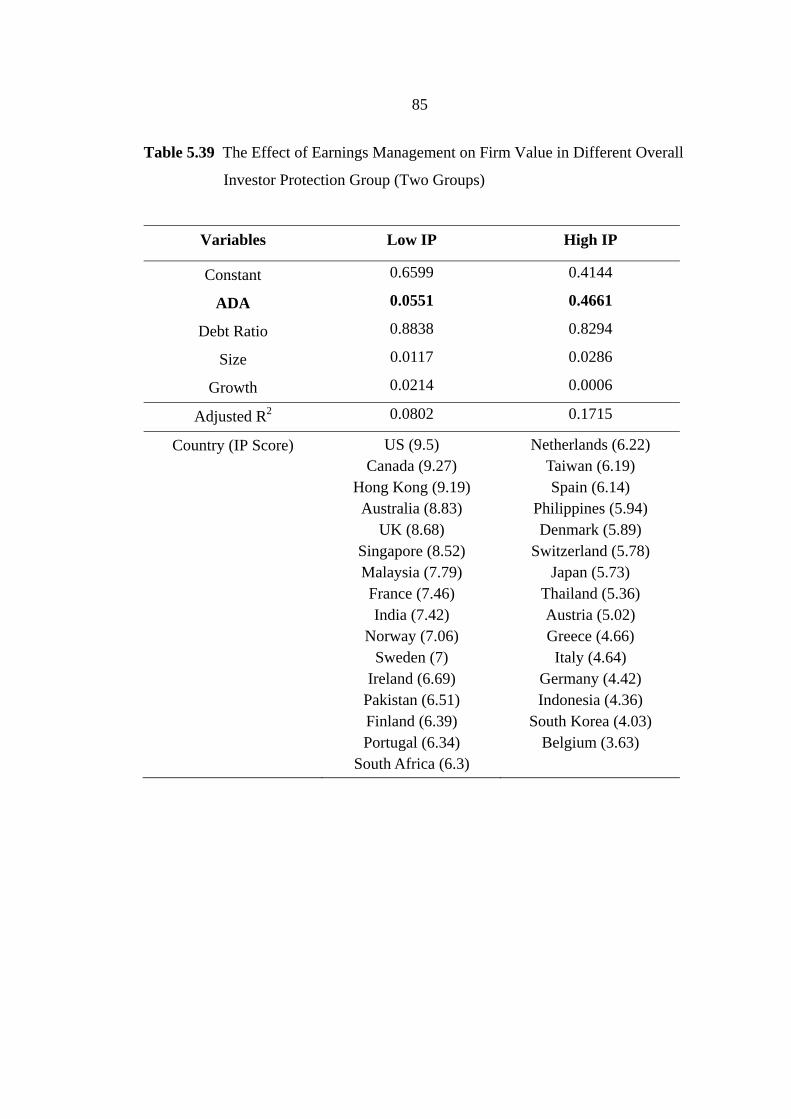
85
Table 5.39 The Effect of Earnings Management on Firm Value in Different Overall
Investor Protection Group (Two Groups)
Variables Low IP High IP
Constant 0.6599 0.4144
ADA 0.0551 0.4661
Debt Ratio 0.8838 0.8294
Size 0.0117 0.0286
Growth 0.0214 0.0006
Adjusted R2 0.0802 0.1715
Country (IP Score) US (9.5) Canada (9.27)
Hong Kong (9.19) Australia (8.83)
UK (8.68) Singapore (8.52) Malaysia (7.79) France (7.46) India (7.42)
Norway (7.06) Sweden (7)
Ireland (6.69) Pakistan (6.51) Finland (6.39) Portugal (6.34)
South Africa (6.3)
Netherlands (6.22) Taiwan (6.19) Spain (6.14)
Philippines (5.94) Denmark (5.89)
Switzerland (5.78) Japan (5.73)
Thailand (5.36) Austria (5.02) Greece (4.66) Italy (4.64)
Germany (4.42) Indonesia (4.36)
South Korea (4.03) Belgium (3.63)

86
Table 5.40 The Effect of Investor Protection on the Relation between Earnings
Management and Firm Value using Dummy Variable (Two Groups)
Variables Coefficient t-Statistics Significance Level
Constant 0.1431 0.64 -
ADA 0.0711 0.62 -
Debt Ratio 0.9762 4.12 < 0.05
Size 0.0326 4.73 < 0.05
Growth 0.0013 0.68 -
ADA x IP_HIGH 0.4630 3.29 < 0.05
F-statistics 17.12
Significance Level < 0.05
Adjusted R2 0.2069
The result in table 5.40 shows the result of regression analysis with dummy
interaction term whereas the dummy variable (IP_HIGH) equals to one if that country
has the aggregate investor protection score above the median level. The coefficient of
earnings management represents the effect of earnings management on firm value for
firms in the country with low investor protection score. The value of this coefficient is
only 0.0711, which is not statistically significant at any convention level. However,
the coefficient of interaction term is 0.4630, which is positive and significant at 5%
level. This coefficient represents the incremental or marginal effect of earnings
management for the country with high investor protection score against the country
with low investor protection score. Therefore, the result shows the effect of earnings
management is more positive for firms in the country with higher level of investor
protection.
Next, the countries are classified into three groups based on their investor
protection level. The group with highest level of investor protection is called top-IP.
The group with lowest level of investor protection is lowest-IP. The group with the
middle level of investor protection is middle-IP. The regression models to examine
the effect of earnings management on each group are reported in table 5.41.

87
Table 5.41 The Effect of Earnings Management on Firm Value in Different Overall
Investor Protection Group (Three Groups)
Variables Lowest IP Middle IP Top IP
Constant -0.4594 0.5161 0.8550
ADA 0.0151 0.3131 0.5033
Debt Ratio 1.3309 1.7509 -0.8555
Size 0.0419 0.0119 0.0425
Growth 0.0255 0.0034 -0.0009
Adjusted R2 0.2219 0.1963 0.1334
Country (IP Score) US (9.5)
Canada (9.27) Hong Kong (9.19)
Australia (8.83) UK (8.68)
Singapore (8.52) Malaysia (7.79) France (7.46) India (7.42)
Norway (7.06) Sweden (7)
Ireland (6.69)
Pakistan (6.51) Finland (6.39) Portugal (6.34)
South Africa (6.3) Netherlands (6.22)
Taiwan (6.19) Spain (6.14)
Philippines (5.94) Denmark (5.89)
Switzerland (5.78)
Japan (5.73) Thailand (5.36) Austria (5.02) Greece (4.66) Italy (4.64)
Germany (4.42) Indonesia (4.36)
South Korea (4.03) Belgium (3.63)
From table 5.41, the coefficient of earnings management for firms in the
country with lowest investor protection is only 0.0151. This means that earnings
management has a little effect in lowest-IP country. The coefficient of earnings
management for firms in the country with middle investor protection is 0.3131, which
is much higher compared to those in lowest investor protection. The coefficient of
earnings management for firms in the country with highest investor protection is
0.5033, which is highest compared to other groups. This result shows the impact of
investor protection to the relation between earnings management and firm value. The
effect of earnings management is more positive in the country with higher level of
investor protection. In order to examine the significance of this difference, the
regression analysis with dummy interaction term is used and the result is reported in
table 5.42.
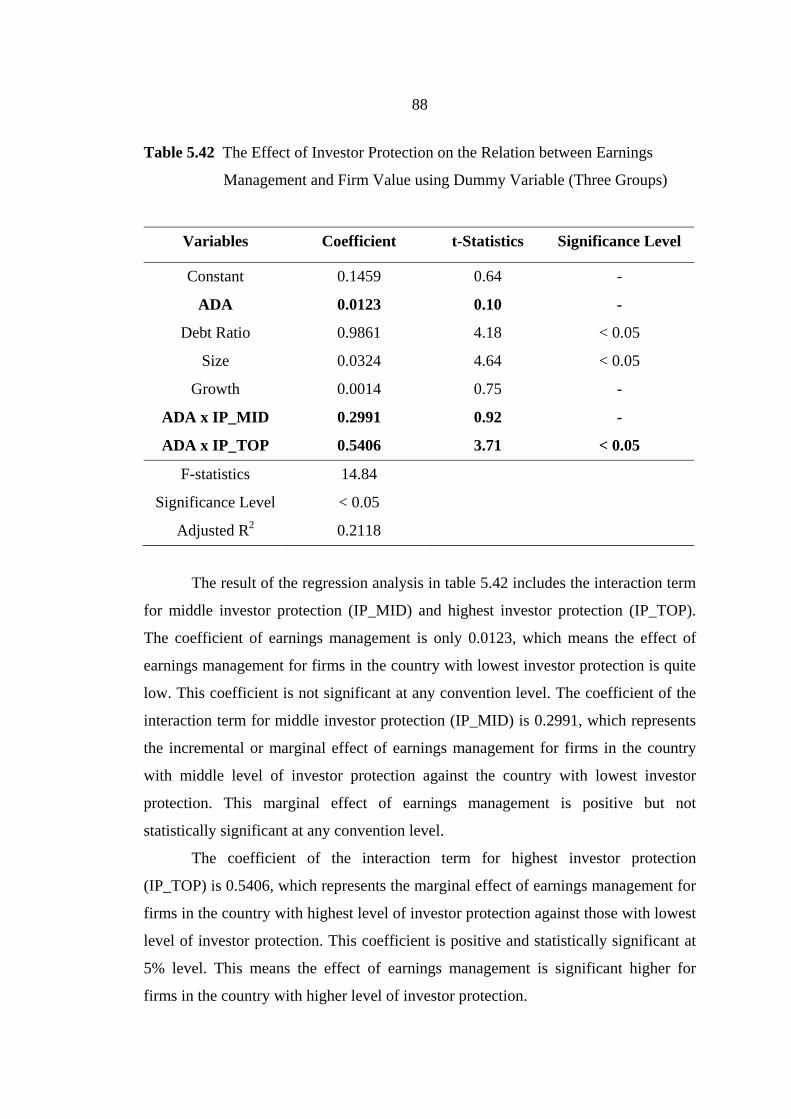
88
Table 5.42 The Effect of Investor Protection on the Relation between Earnings
Management and Firm Value using Dummy Variable (Three Groups)
Variables Coefficient t-Statistics Significance Level
Constant 0.1459 0.64 -
ADA 0.0123 0.10 -
Debt Ratio 0.9861 4.18 < 0.05
Size 0.0324 4.64 < 0.05
Growth 0.0014 0.75 -
ADA x IP_MID 0.2991 0.92 -
ADA x IP_TOP 0.5406 3.71 < 0.05
F-statistics 14.84
Significance Level < 0.05
Adjusted R2 0.2118
The result of the regression analysis in table 5.42 includes the interaction term
for middle investor protection (IP_MID) and highest investor protection (IP_TOP).
The coefficient of earnings management is only 0.0123, which means the effect of
earnings management for firms in the country with lowest investor protection is quite
low. This coefficient is not significant at any convention level. The coefficient of the
interaction term for middle investor protection (IP_MID) is 0.2991, which represents
the incremental or marginal effect of earnings management for firms in the country
with middle level of investor protection against the country with lowest investor
protection. This marginal effect of earnings management is positive but not
statistically significant at any convention level.
The coefficient of the interaction term for highest investor protection
(IP_TOP) is 0.5406, which represents the marginal effect of earnings management for
firms in the country with highest level of investor protection against those with lowest
level of investor protection. This coefficient is positive and statistically significant at
5% level. This means the effect of earnings management is significant higher for
firms in the country with higher level of investor protection.

89
Similar to the firm-level analysis, all results reported earlier in this section can
be affected by the presence of heteroskedasticity. To mitigate this problem, the robust
standard error is used in the regression analysis instead of normal OLS standard error.
The previous regression analysis is re-estimated using robust standard error and the
new result is reported in table 5.43.
Table 5.43 The Effect of Investor Protection on the Relation between Earnings
Management and Firm Value using the Robust Standard Error
Variables Coefficient t-Statistics Significance Level
Constant 0.2123 0.65 -
ADA -0.9072 -2.52 < 0.05
Debt Ratio 0.9839 2.02 < 0.05
Size 0.0302 3.57 < 0.05
Growth 0.0015 0.61 -
ADA x IP 0.1766 2.64 < 0.05
F-statistics 6.17
Significance Level < 0.05
Adjusted R2 0.1898
The result using the robust standard error reported in table 5.43 is quite similar
to the earlier result using normal OLS regression. The coefficient of interaction term
is positive and significant at 5% level. This means that the effect of earnings
management is more positive for firms in the country with higher level of investor
protection.
The regression analysis with dummy interaction term for high investor
protection (IP_HIGH) re-estimated using robust standard error and the results are
reported in table 5.44. The result using the robust standard error reported is quite
similar to the previous results using normal OLS regression. In table 5.44, the
coefficient of interaction term for high investor protection country (IP_HIGH) is
positive and significant at 5% level.

90
Table 5.44 The Effect of Investor Protection on the Relation between Earnings
Management and Firm Value using the Robust Standard Error (Two
Groups)
Variables Coefficient t-Statistics Significance Level Constant 0.1431 0.42 -
ADA 0.0710 1.56 -
Debt Ratio 0.9762 1.93 < 0.10
Size 0.0326 3.70 < 0.05
Growth 0.0013 0.52 -
ADA x IP_HIGH 0.4630 2.07 < 0.05
F-statistics 5.64 Significance Level < 0.05
Adjusted R2 0.2069
The regression analysis with two dummy interaction terms (IP_MID and
IP_TOP) is also re-estimated using robust standard error and the result is reported
table 5.45.
Table 5.45 The Effect of Investor Protection on the Relation between Earnings
Management and Firm Value using the Robust Standard Error (Three
Groups)
Variables Coefficient t-Statistics Significance Level Constant 0.1459 0.43 -
ADA 0.0123 0.24 -
Debt Ratio 0.9861 1.97 < 0.05
Size 0.0324 3.62 < 0.05
Growth 0.0014 0.59 -
ADA x IP_MID 0.2991 1.81 < 0.10
ADA x IP_TOP 0.5406 2.26 < 0.05
F-statistics 4.99 Significance Level < 0.05
Adjusted R2 0.2118
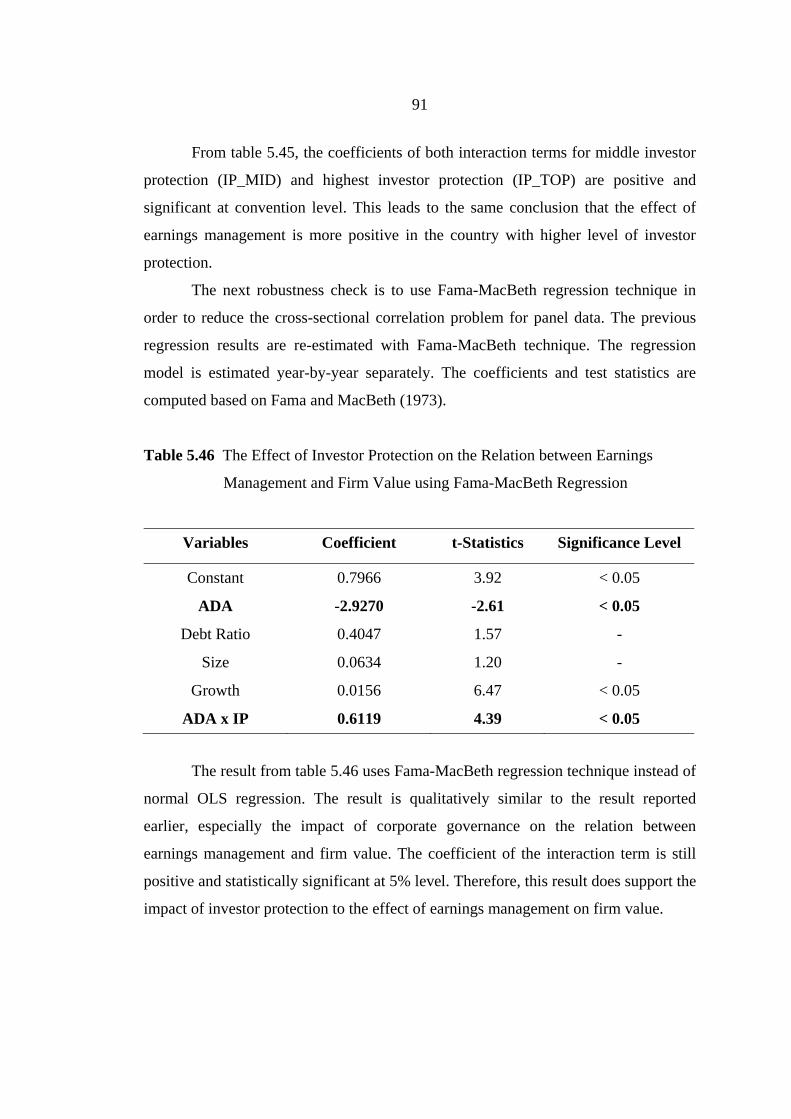
91
From table 5.45, the coefficients of both interaction terms for middle investor
protection (IP_MID) and highest investor protection (IP_TOP) are positive and
significant at convention level. This leads to the same conclusion that the effect of
earnings management is more positive in the country with higher level of investor
protection.
The next robustness check is to use Fama-MacBeth regression technique in
order to reduce the cross-sectional correlation problem for panel data. The previous
regression results are re-estimated with Fama-MacBeth technique. The regression
model is estimated year-by-year separately. The coefficients and test statistics are
computed based on Fama and MacBeth (1973).
Table 5.46 The Effect of Investor Protection on the Relation between Earnings
Management and Firm Value using Fama-MacBeth Regression
Variables Coefficient t-Statistics Significance Level
Constant 0.7966 3.92 < 0.05
ADA -2.9270 -2.61 < 0.05
Debt Ratio 0.4047 1.57 -
Size 0.0634 1.20 -
Growth 0.0156 6.47 < 0.05
ADA x IP 0.6119 4.39 < 0.05
The result from table 5.46 uses Fama-MacBeth regression technique instead of
normal OLS regression. The result is qualitatively similar to the result reported
earlier, especially the impact of corporate governance on the relation between
earnings management and firm value. The coefficient of the interaction term is still
positive and statistically significant at 5% level. Therefore, this result does support the
impact of investor protection to the effect of earnings management on firm value.

92
Table 5.47 The Effect of Investor Protection on the Relation between Earnings
Management and Firm Value using Fama-MacBeth Regression (Two
Groups)
Variables Coefficient t-Statistics Significance Level
Constant 0.7256 3.55 < 0.05
ADA 0.5890 0.92 -
Debt Ratio 0.0945 0.30 -
Size 0.0556 1.24 -
Growth 0.0233 11.09 < 0.05
ADA x IP_HIGH 1.4990 3.97 < 0.10
The result from table 5.47 uses Fama-MacBeth regression technique for the
regression model with the dummy interaction term for high investor protection. The
coefficient of the interaction term is still positive and statistically significant at 10%
level. Therefore, this result means that the effect of earnings management is more
positive for firms in the country with higher level of investor protection against the
country with lower level of investor protection.
Table 5.48 The Effect of Investor Protection on the Relation between Earnings
Management and Firm Value using Fama-MacBeth Regression (Three
Groups)
Variables Coefficient t-Statistics Significance Level
Constant 0.7956 3.95 < 0.05
ADA -0.7235 -0.85 -
Debt Ratio 0.2255 0.89 -
Size 0.0639 1.14 -
Growth 0.0197 8.74 < 0.05
ADA x IP_MID 1.8478 5.50 < 0.05
ADA x IP_TOP 2.8662 5.46 < 0.05
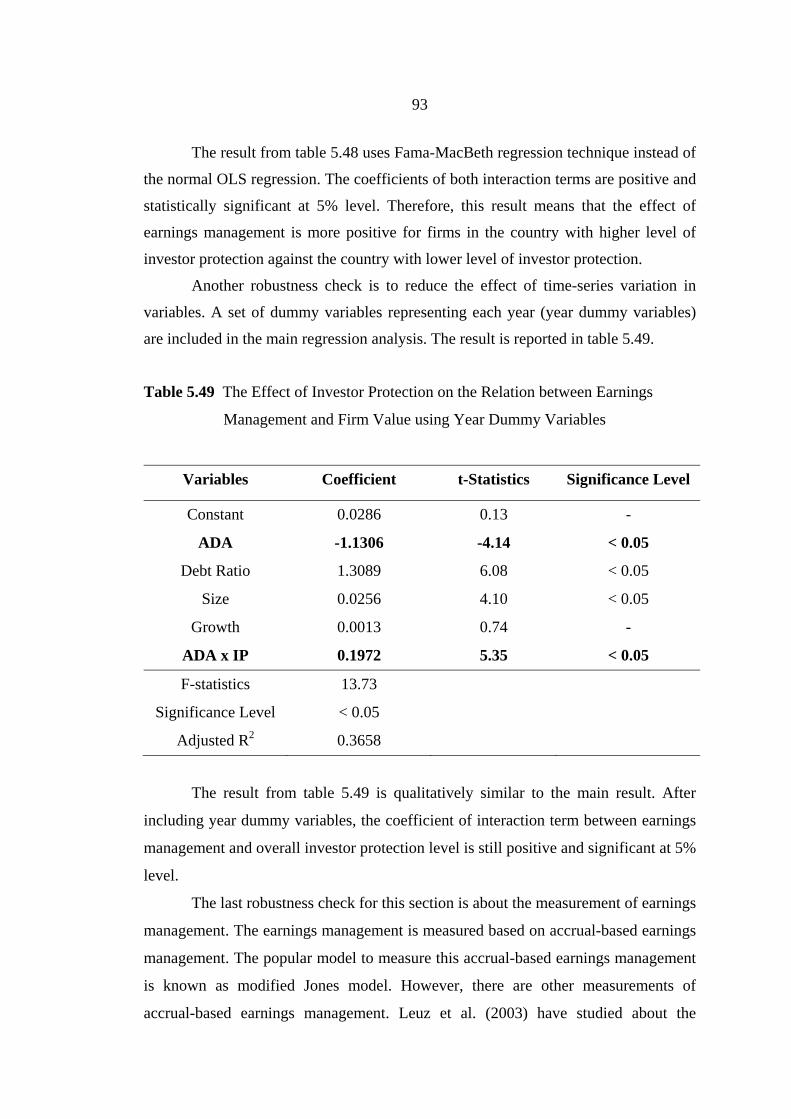
93
The result from table 5.48 uses Fama-MacBeth regression technique instead of
the normal OLS regression. The coefficients of both interaction terms are positive and
statistically significant at 5% level. Therefore, this result means that the effect of
earnings management is more positive for firms in the country with higher level of
investor protection against the country with lower level of investor protection.
Another robustness check is to reduce the effect of time-series variation in
variables. A set of dummy variables representing each year (year dummy variables)
are included in the main regression analysis. The result is reported in table 5.49.
Table 5.49 The Effect of Investor Protection on the Relation between Earnings
Management and Firm Value using Year Dummy Variables
Variables Coefficient t-Statistics Significance Level
Constant 0.0286 0.13 -
ADA -1.1306 -4.14 < 0.05
Debt Ratio 1.3089 6.08 < 0.05
Size 0.0256 4.10 < 0.05
Growth 0.0013 0.74 -
ADA x IP 0.1972 5.35 < 0.05
F-statistics 13.73
Significance Level < 0.05
Adjusted R2 0.3658
The result from table 5.49 is qualitatively similar to the main result. After
including year dummy variables, the coefficient of interaction term between earnings
management and overall investor protection level is still positive and significant at 5%
level.
The last robustness check for this section is about the measurement of earnings
management. The earnings management is measured based on accrual-based earnings
management. The popular model to measure this accrual-based earnings management
is known as modified Jones model. However, there are other measurements of
accrual-based earnings management. Leuz et al. (2003) have studied about the

94
relation between earnings management and investor protection. To measure earnings
management, they have created the new measurement named aggregate earnings
management. One of the components of that aggregate earnings management is the
measurement of account accruals, which is measured by total absolute accruals scaled
down by operating cash flows. Therefore, in order to examine the robustness of the
results, the total absolute accruals scaled down by operating cash flows are used
instead of discretionary accruals to examine the effect of earnings management on
firm value and the impact of corporate governance on that effect.
Table 5.50 The Effect of Total Accruals on Firm Value Based on International
Evidence
Variables Coefficient t-Statistics Significance Level
Constant 0.0764 0.33 -
ATA 0.0008 0.16 -
Debt Ratio 1.1256 4.54 < 0.05
Size 0.0342 4.72 < 0.05
Growth 0.0026 1.30 -
F-statistics 11.97
Significance Level < 0.05
Adjusted R2 0.1244
Table 5.50 reports the result of regression analysis that the total absolute
accruals divided by operating cash flows are used to measure the level of earnings
management (ATA) instead of the absolute discretionary accruals. The result is
slightly different from the previous result with discretionary accruals. The coefficient
of earnings management is only 0.0008, which is still positive but not statistically
significant at any convention level. The impact of investor protection to the relation
between earnings management and firm value, where earnings management is
measured by total absolute accruals scaled down by operating cash flows, is reported
in table 5.51.

95
Table 5.51 The Effect of Investor Protection on the Relation between Total Accruals
and Firm Value
Variables Coefficient t-Statistics Significance Level
Constant 0.1098 0.49 -
ATA 0.0009 0.19 -
Debt Ratio 1.0061 4.24 < 0.05
Size 0.0330 4.79 < 0.05
Growth 0.0013 0.67 -
ATA x IP 0.0577 5.63 < 0.05
F-statistics 16.88
Significance Level < 0.05
Adjusted R2 0.2044
Table 5.51 reports the result of regression analysis with interaction term that
the absolute total accruals are used to measure the level of earnings management
(ATA) instead of the absolute discretionary accruals. The result is also qualitative
similar to the previous result. The coefficient of the interaction term is positive and
significant at 5% level. This means the effect of earnings management is more
positive for firms in the country with relatively higher level of investor protection.
Another possible way to examine the impact of investor protection on the
relation between earnings management and firm value is to use a firm-level analysis.
The results reported earlier in this section are based on country-level analysis.
However, in order to make the results more robust and comparable to firm-level
analysis in previous sections, the firm-level analysis is used by combining all firms
from 31 countries. The same multiple regression analysis technique similar to the
main analysis in this section is used. Moreover, the regression model is controlled by
the possible time-series variation and country variation by adding the year dummy
variables and country dummy variables. The result of regression analysis is reported
in table

96
Table 5.52 The Effect of Investor Protection on the Relation between Earnings
Management and Firm Value (Firm-level)
Variables Coefficient t-Statistics Significance Level
Constant -1.7806 -2.71 < 0.05
ADA -0.4629 -8.50 < 0.05
Debt Ratio 2.9745 534.89 < 0.05
Size -0.1949 -36.95 < 0.05
Growth -0.0001 -0.37 -
ADA x IP 0.0649 9.72 < 0.05
IP 0.4831 6.57 < 0.05
F-statistics 6673.37
Significance Level < 0.05
Adjusted R2 0.6410
From table 5.52, the result from firm-level analysis is qualitatively similar to
country-level analysis reported in table 5.38 but the adjusted R-squared from this
firm-level analysis is 0.6410, which is much higher than the adjusted R-squared from
the country-level analysis. The coefficient of earnings management is negative and
statistically significant. This means the effect of earnings management is generally
negative at the firm level. This negative effect can be from the negative perception by
investors about earnings management form the many account scandal cases during the
past decade. The coefficient of investor protection is also positive and significant.
This means investor protection has the positive effect to the firm value. This positive
effect of investor protection can be from its role in restraining the managerial
opportunism and reducing the negative earnings management. In order to confirm
this role, we need to take a look on the interaction effect between these two variables.
The coefficient of interaction term is also significantly positive. This result confirms
the positive impact of investor protection on the relation between earnings
management and firm value.
In general, the effect of earnings management is negative at a firm-level.
However, after the impact of investor protection is introduced, the effect of investor

97
protection is positive and the interaction effect between earnings management and
investor protection is also positive. This means that investor protection can reduce the
negative effect of earnings management. The possible explanation is investor
protection can restrain managerial opportunism and negative earnings management.
Therefore, the effect of earnings management for the firms in the country with higher
level of investor protection is more positive or less negative compared to the firms in
the country with lower level of investor protection.
Table 5.53 The Effect of Investor Protection on the Relation between Earnings
Management and Firm Value with the Interaction Effect of Country
Dummy Variables (Firm-level)
Variables Coefficient t-Statistics Significance Level
Constant -1.5613 -2.30 < 0.05
ADA 0.6568 0.21 -
Debt Ratio 2.9319 494.22 < 0.05
Size -0.1947 -36.79 < 0.05
Growth -0.0001 -0.36 -
ADA x IP -0.0805 -0.23 -
IP 0.4596 6.04 < 0.05
F-statistics 4055.49
Significance Level < 0.05
Adjusted R2 0.6429
Table 5.53 reports the result of firm-level analysis but the interaction between
earnings management, investor protection, and country dummy variables are included
(ADA x IP x DCountry). After including the interaction effect with country dummy
variables, the coefficient of interaction term between earnings management and firm
value is slightly negative but not significant at convention level. Moreover, the
coefficient of earnings management is slightly positive but not significant. This means
the impact of investor protection on the relation between earnings management and
firm value is neutralized after including the country-specific effect. However, the
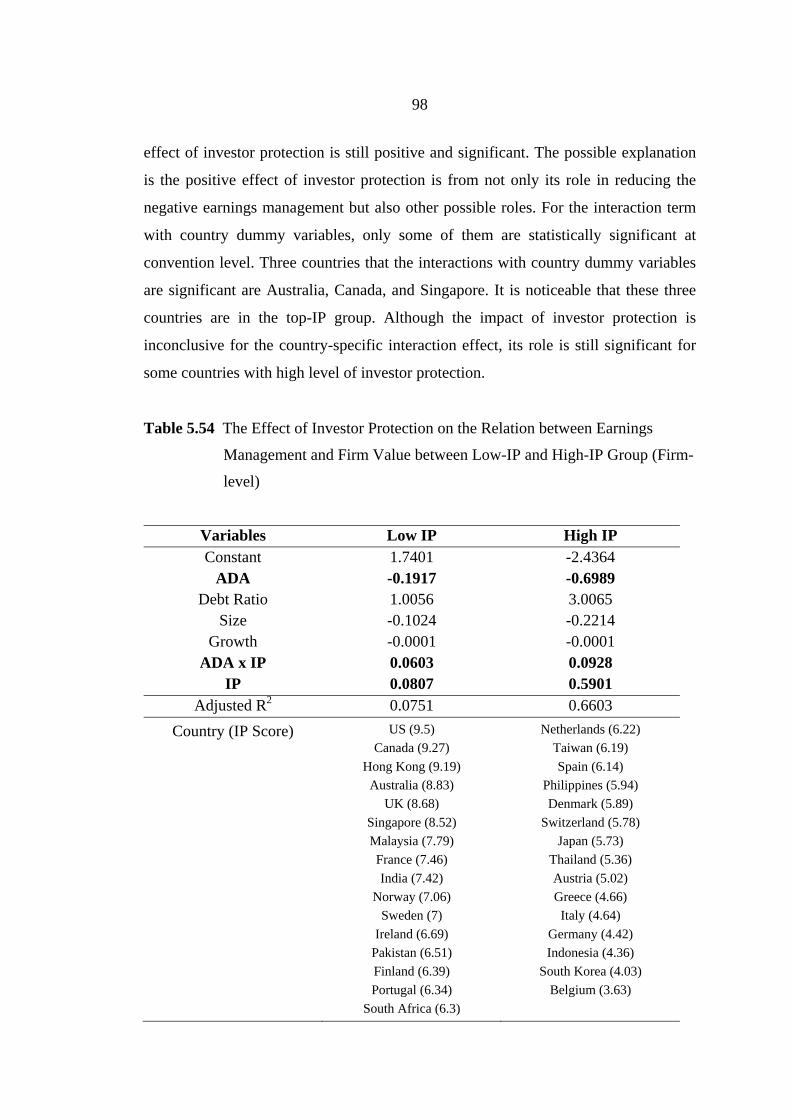
98
effect of investor protection is still positive and significant. The possible explanation
is the positive effect of investor protection is from not only its role in reducing the
negative earnings management but also other possible roles. For the interaction term
with country dummy variables, only some of them are statistically significant at
convention level. Three countries that the interactions with country dummy variables
are significant are Australia, Canada, and Singapore. It is noticeable that these three
countries are in the top-IP group. Although the impact of investor protection is
inconclusive for the country-specific interaction effect, its role is still significant for
some countries with high level of investor protection.
Table 5.54 The Effect of Investor Protection on the Relation between Earnings
Management and Firm Value between Low-IP and High-IP Group (Firm-
level)
Variables Low IP High IP Constant 1.7401 -2.4364
ADA -0.1917 -0.6989 Debt Ratio 1.0056 3.0065
Size -0.1024 -0.2214 Growth -0.0001 -0.0001
ADA x IP 0.0603 0.0928 IP 0.0807 0.5901
Adjusted R2 0.0751 0.6603
Country (IP Score) US (9.5)
Canada (9.27)
Hong Kong (9.19)
Australia (8.83)
UK (8.68)
Singapore (8.52)
Malaysia (7.79)
France (7.46)
India (7.42)
Norway (7.06)
Sweden (7)
Ireland (6.69)
Pakistan (6.51)
Finland (6.39)
Portugal (6.34)
South Africa (6.3)
Netherlands (6.22)
Taiwan (6.19)
Spain (6.14)
Philippines (5.94)
Denmark (5.89)
Switzerland (5.78)
Japan (5.73)
Thailand (5.36)
Austria (5.02)
Greece (4.66)
Italy (4.64)
Germany (4.42)
Indonesia (4.36)
South Korea (4.03)
Belgium (3.63)

99
Table 5.54 reports the firm-level regression analysis for two different groups,
high investor protection (High-IP) and low investor protection (Low-IP). The results
from both groups are qualitatively similar to the main result in table 5.52. However,
the impact size of investor protection to the relation between earnings management
and firm value is greater for high-IP group than low-IP group. The coefficient of
interaction term for low-IP group is only 0.0603 whereas it is 0.0928 for high-IP
group. Both coefficients are statistically significant at convention level. Moreover, the
adjusted R-squared for the regression analysis estimated for low-IP group is only
0.0751, which is much lower than the adjusted R-squared for high-IP group that is
0.6603. This result implies that the impact of investor protection reported earlier in
this section is more pronounced in the countries in high investor protection group. It
also supports the role of investor protection to increase the positive effect or reduce
the negative effect of earnings management.
Furthermore, the multiple regression analysis showing the effect of earnings
management on firm value is estimated based on each country separately. Only some
countries in high investor protection group and low investor protection group are
reported in order to show the difference in the effect of earnings management in those
two groups.
Table 5.55 The Effect of Earnings Management on Firm Value for Some Countries
with High Level of Investor Protection
Variables Canada Singapore Norway Portugal
Constant 5.0965 -2.3319 5.7068 0.9199
ADA 0.2550 0.8861 0.3424 0.2020
Debt Ratio 4.0336 3.0615 0.7945 -0.1254
Size -0.4798 0.1181 -0.3363 0.0149
Growth -0.0001 -0.0022 -0.0121 -0.1034
Shareholders Rights 5 4 4 3
Legal Enforcement 9.8 8.9 10 10
Public Enforcement 0.8 0.87 0.32 0.58
Overall IP Score 9.27 8.52 7.06 6.34
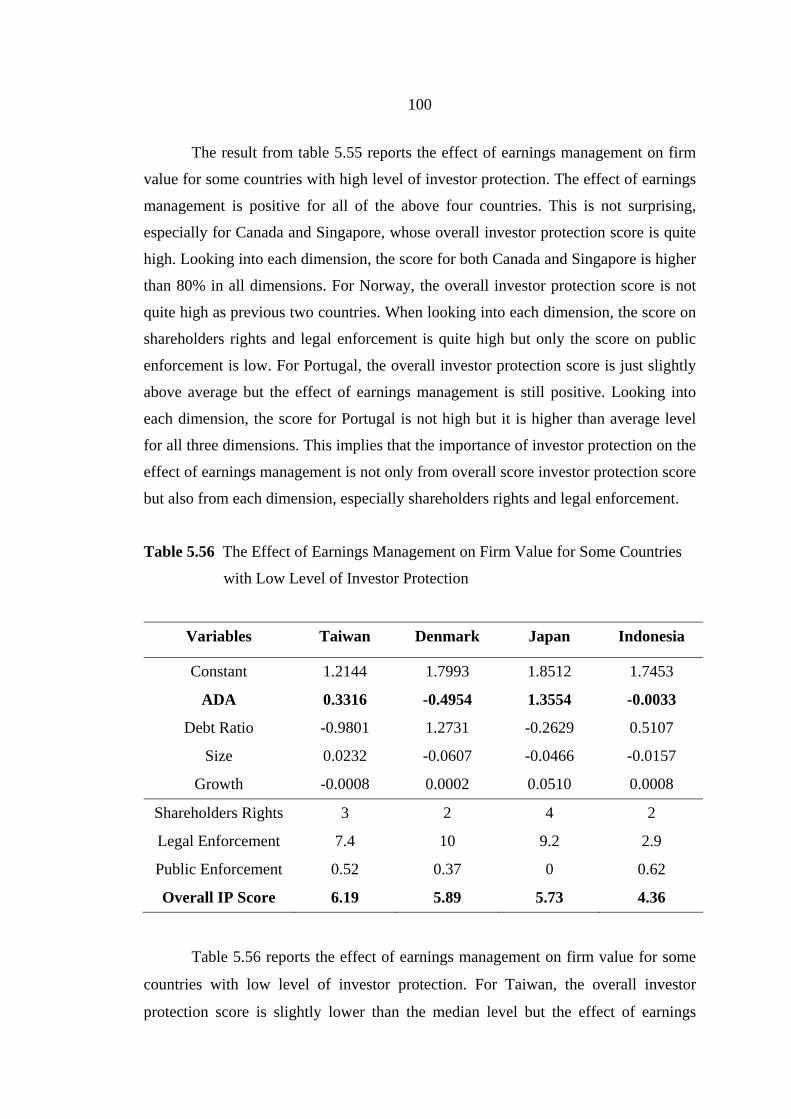
100
The result from table 5.55 reports the effect of earnings management on firm
value for some countries with high level of investor protection. The effect of earnings
management is positive for all of the above four countries. This is not surprising,
especially for Canada and Singapore, whose overall investor protection score is quite
high. Looking into each dimension, the score for both Canada and Singapore is higher
than 80% in all dimensions. For Norway, the overall investor protection score is not
quite high as previous two countries. When looking into each dimension, the score on
shareholders rights and legal enforcement is quite high but only the score on public
enforcement is low. For Portugal, the overall investor protection score is just slightly
above average but the effect of earnings management is still positive. Looking into
each dimension, the score for Portugal is not high but it is higher than average level
for all three dimensions. This implies that the importance of investor protection on the
effect of earnings management is not only from overall score investor protection score
but also from each dimension, especially shareholders rights and legal enforcement.
Table 5.56 The Effect of Earnings Management on Firm Value for Some Countries
with Low Level of Investor Protection
Variables Taiwan Denmark Japan Indonesia
Constant 1.2144 1.7993 1.8512 1.7453
ADA 0.3316 -0.4954 1.3554 -0.0033
Debt Ratio -0.9801 1.2731 -0.2629 0.5107
Size 0.0232 -0.0607 -0.0466 -0.0157
Growth -0.0008 0.0002 0.0510 0.0008
Shareholders Rights 3 2 4 2
Legal Enforcement 7.4 10 9.2 2.9
Public Enforcement 0.52 0.37 0 0.62
Overall IP Score 6.19 5.89 5.73 4.36
Table 5.56 reports the effect of earnings management on firm value for some
countries with low level of investor protection. For Taiwan, the overall investor
protection score is slightly lower than the median level but the effect of earnings

101
management is positive. Looking into each dimension, the score for Taiwan is not
high but it is higher than average level in all three dimensions, which is similar to the
score of Portugal mentioned previously. As mentioned before, the importance of
investor protection on the effect of earnings management is not only from overall
investor protection score but also from the score on each dimension. Compared to
Denmark, the effect of earnings management is negative, though the overall investor
protection is just slightly lower than Taiwan. Looking into each dimension of investor
protection for Denmark, the score on two dimensions, which are shareholders rights
and public enforcement, is lower than average level. Only the score on legal
enforcement is high. This could be a possible explanation for the negative effect of
earnings management in Denmark. For Japan, the overall investor protection score is
lower than Denmark but the effect of earnings management is positive. When looking
into each dimension, the score of two dimensions for Japan is quite high (more than
80% of the full score) but only one dimension is quite low. This means even though
the overall investor protection for Japan is low, Japan can perform well for two
dimensions, which are shareholders rights and legal enforcement. This high score on
two dimensions could be an explanation for the positive effect of earnings
management. The last country in the example is Indonesia. The overall investor
protection score for Indonesia is low. Looking into each dimension, only the score of
public enforcement is slightly higher than average whereas the score on other two
dimensions is lower than average. This makes the effect of earnings management is
negative in Indonesia.
The above examples for the effect of earnings management for each country
can help to understand the importance of investor protection. It is not only overall
investor protection but also the score on each dimension that are important to the
effect of earnings management.
From all results reported earlier in this section, the international evidence
based on empirical data from 31 countries has supported the role of investor
protection to the effect of earnings management. The effect of earnings management
on firm value is generally positive and this positive relation is affected by the level of
investor protection. The relation between earnings management and firm value is
more positive for firms in the country with higher level of investor protection.

102
If all countries are broadly classified into two groups, which are high-IP and
low-IP, the result is also similar. The effect of earnings management is significantly
positive for firms in the country with high level of investor protection but it is not
significantly positive for firms in the country with low level of investor protection.
Even though, all countries are classified into three groups based on their investor
protection level, the results are quite similar.
These results provide the support to the second research hypothesis as the
relation between earnings management and firm value is more positive for the firms
in the country with higher level of investor protection. This evidence also supports the
role of investor protection to restrain managerial opportunism and help to reduce
negative earnings management. Therefore, in the country with better investor
protection, the earnings management will have more positive effect to the firm value.

CHAPTER 6
CONCLUSION AND RECOMMENDATION
This study aims to examine the impact of corporate governance and investor
protection regarding the relation between earnings management and firm value. This
is because earnings management can be both positive and negative. Therefore, the
effect of earnings management on firm value is unpredictable because it depends on
which type of earnings management dominates the other. Negative earnings
management, as stated, stems from managerial opportunism-managers can use
earnings management for their own private benefit. Meanwhile, positive earnings
management stems from the use of earnings management in a beneficial way, such as
communicating certain information to investors.
6.1 Conclusion
The theoretical framework of this study shows that if there is an effective
mechanism for controlling managerial opportunism, the negative earnings
management should be eliminated. In that case, the effect of earnings management on
firm value should be more positive or less negative. Therefore, two research
hypotheses are established in order to examine the theoretical model. The first
hypothesis is “The relation between earnings management and firm value should be
more positive (or less negative) for the firm with a higher level of corporate
governance.” The second research hypothesis is “The relation between earnings
management and firm value should be more positive (less negative) in a country with
a higher level of investor protection.”
In order to examine the first research hypothesis, firm-level analysis is
employed. This is because the level of corporate governance can be measured based
on firm level. The empirical data on firm level were collected from two countries: the
United States and Thailand. In both countries, the results clearly show the important
104
impact of corporate governance on the relation between earnings management and
firm value.
In the United States, corporate governance performance is based on the
Environmental, Social, and Governance (ESG) score provide by ASSET4, an affiliate
of Thomson Reuters. The corporate governance score in ASSET4 includes Board
Structure, Compensation Policy, Board Function, Vision & Strategies, and
Shareholders Rights. There are 5,153 firm-year observations included in the analysis.
The effect of earnings management on firm value is examined using the
multiple linear regression technique. Firm value is represented by Tobin’s Q ratio.
Earnings management is measured based on discretionary accruals and total accruals.
A set of control variables includes firm leverage, firm growth rate, and firm size. The
results show that the effect of earnings management on firm value is generally
negative. However, this negative relation is affected by corporate governance. The
relation between earnings management and firm value is less negative for firms with a
higher corporate governance score. If all firms are broadly classified into high-CG
firms and low-CG firms, the result is also similar. Low-CG firms or poorer-
governance firms have faced the negative effect of earnings management and firm
value. High-CG firms or better-governance firms also face the same negative effect of
earnings management but this negative effect is significantly lower for high-CG firms.
In Thailand, the corporate governance data for Thailand were provided by the
Thai Institute of Directors (Thai IOD). However, instead of reporting the CG score,
the Thai IOD reports on CG performance in terms of number of stars. The firms are
classified into 5-star, 4-star, or 3-star group based on their corporate governance
performance. The same multiple regression model is employed to examine the effect
of earnings management on firm value.
The effect of earnings management on firm value is generally positive in
Thailand. This result is different from the effect of earnings management in the
United States, which is generally negative. However, the difference in the effect of
earnings management between Thailand and United States can partially support the
theoretical model because there can be both positive and negative earnings
management. The effect of earnings management on firm value can be generally
positive if the positive earnings management dominates the negative earnings
management. If the negative earnings management dominates the positive earnings

105
management, the effect of earnings management on firm value will be generally
negative.
The evidence from Thailand also shows the impact of corporate governance
on the relation between earnings management and firm value, which is more positive
for firms with a higher CG-star rating or higher corporate governance performance.
Based on the CG-star rating in Thailand, all firms can be broadly classified into firms
with CG-star (3-star, 4-star, or 5-star) and firms without CG-star (possibly 2-star or 1-
star).
Firms without a CG-star can be looked at as poor-governance firms and the
earnings management does not have a positive effect on firm value, as in general.
Meanwhile, firms with a CG-star can be looked at as good-governance firms and the
effect of earnings management on firm value is significantly positive. Moreover, the
positive effect of earnings management is more obvious for firms with four or five
CG-stars.
Together with the empirical results from the United States, all results provide
support for the first research hypothesis. In the United States, the general relation
between earnings management and firm value is negative. However, the relation
between earnings management and firm value is less negative for firms with higher
corporate governance performance. In Thailand, the general relation between earnings
management and firm value is positive. Meanwhile, the relation between earnings
management and firm value is more positive for firms with higher corporate
governance performance. All of this evidence from the firm-level analysis for both the
United States and Thailand support the role of corporate governance in restraining the
negative earnings management arising from managerial opportunism.
The second research hypothesis concerns the role of investor protection.
Investor protection performance is measured based on the country’s laws. Therefore,
country-level analysis was used in order to examine the second research hypothesis.
Investor protection measurement was based on three dimensions: outside investor
rights or shareholders rights, legal enforcement, and public enforcement.
In order to examine the effect of earnings management on firm value, the same
multiple regression model was used. However, the country-level measurement was
used instead of firm-level measurement. Country-level measurement is the average of
the firm-level measurement for that country in each year.

106
The country-level analysis based on the empirical data from 31 countries
supported the role of investor protection in terms of the effect of earnings
management. The effect of earnings management on firm value is generally positive
and this positive relation is affected by the level of investor protection. The relation
between earnings management and firm value is more positive for firms in a country
with a higher level of investor protection.
The result from international firm-level analysis based on 31 countries is
similar to the country-level analysis. It supports the role of investor protection that can
reduce the negative effect of earnings management. The effect of earnings
management for the firms in the country with higher level of investor protection is
more positive or less negative compared to the firms in the country with lower level
of investor protection. Moreover, the impact of investor protection on the effect of
earnings management is more pronounced in the countries in high investor protection
group. It also supports the role of investor protection to reduce the negative effect of
earnings management.
These results provide support for the second research hypothesis, as the
relation between earnings management and firm value is more positive for the firms
in a country with a higher level of investor protection compared to those in a country
with lower level of investor protection. This evidence also supports the role of
investor protection in restraining managerial opportunism and helping to reduce
negative earnings management. Therefore, in a country with better investor
protection, earnings management will have a more positive effect on firm value.
The results in this study provide evidence to support the role of corporate
governance and investor protection in reducing negative earnings management rather
than positive earnings management. In the firm-level analysis, the evidence shows
that the effect of earnings management on firm value is more positive or less negative
for firms with better corporate governance against firms with poorer corporate
governance. In the country-level analysis, the evidence shows that the effect of
earnings management on firm value is more positive for firms in a country with better
investor protection against those in a country with lower investor protection.

107
6.2 Implication and Recommendation
Earnings Management or managerial discretions to manage reported earnings
is generally perceived in a negative way. This is because earnings management is
usually linked with managerial opportunism. Managers are perceived to use this for
their own private benefits like their compensation plans. Many accounting scandals
around the world make this issue more interesting for investors. However, some
researches have proposed that earnings management can be positive if managers use it
in a beneficial way. Managers can use earnings management as a way to communicate
or convey certain information not available in reported earnings. Another way to use
earnings management positively is to smooth the reported earnings to reduce their
volatility. Therefore, earnings management can be beneficial or harmful for the firm’s
value based on how managers employ it.
From the firm level analysis for Thailand and United States, the results have
revealed the different effect of earnings management on firm value. Earnings
management has the negative effect on firm value in United States whereas it has the
positive effect in Thailand. One possible explanation is there are many outstanding
accounting frauds revealed in United States during the past decade. Moreover,
investors in United States are more sophisticated and are more aware of earnings
management. Therefore, in general, firms in United States are perceived more
negatively in their earnings management is pronounced. However, Thailand is an
emerging market. There is no outstanding accounting frauds, especially about
earnings management, have been revealed in Thailand. Therefore, earnings
management is not perceived negatively in Thailand.
However, it is no matter how earnings management is perceived positively or
negatively, corporate governance provides an important role that helps to improve the
effect of earning management in both situations. In Thailand, the effect of earnings
management for firms with better corporate governance is more positive than firms
with poorer corporate governance. Meanwhile, in United States, the effect of earnings
management for better governance firms is less negative than poorer governance
firms. This evidence clearly shows an importance of corporate governance to improve
the positive effect of earnings management.

108
Country-level investor protection also provides an important role as firm-level
corporate governance. Based on international evidence, earnings management is
perceived differently among various countries. The effects of earnings management
are positive for some countries and negative for some countries. However, it is no
matter how earnings management is perceived, investor protection can help to
improve healthy earnings management and strengthen the effect of positive earnings
management.
The accounting professions have discussed and improved accounting
standards to provide more meaningful accounting figures and to reduce managerial
discretion in the report of earnings. The evidence from this study shows that
managerial discretion, such as earnings management, is not actually unfavorable.
Some earnings management is perceived positively and results in a positive effect
regarding firm value. In the firms with good governance or firms in a country with
good investor protection, shareholders rights should be well-protected and they will
be less vulnerable to opportunistic earnings management. In this case, earnings
management can be used in a favorable way, for example, to reduce earnings
volatility or to convey information about future earnings by managers. Therefore,
encouraging good corporate governance or improving the country’s level of investor
protection is as important as improving accounting rules and standards in order to
restrain the negative earnings management.
Each firm can improve its corporate governance by adjusting its practices and
provisions to protect the rights of minority shareholders, as well as improving their
board effectiveness, for example, by having more independent directors with a
financial background (including financial accounting) or meeting more frequently.
For policy makers at the country level, they can improve the country’s investor
protection level. Investor protection is this research is based on aggregate investor
protection combining shareholders rights, legal enforcement, and public enforcement.
Moreover, the evidence for each country shows that the importance of investor
protection on the effect of earnings management is not only from overall investor
protection score but also from the score on each dimension. The score on legal
enforcement can be improved by increasing the efficiency of juridical system or
decreasing the corruption level in the country. The score on public enforcement can
109
be improved by increasing the power of stock market supervisor to investigate and
punish the financial or accounting abused cases.
Shareholders rights are one of important factors in both firm level and country
level. The shareholders rights protection is a component in both corporate governance
and investor protection. For corporate governance, each firm can promote
shareholders rights by improving the transparency in their decision and information
disclosure. Shareholders should have the rights to be informed with a fair knowledge
about the firm’s status. Any activities having the impact to shareholders rights should
be disclosed transparently. Moreover, shareholders should have the rights to be heard.
They should be able to participate in shareholders meeting freely. Any mechanism
that can create the obstacle for this participation should be eliminated.
If firms have better corporate governance and the investor protection by law
and enforcement is good, earnings management will not be a problem because it is
less likely to be used for private managerial benefits.
6.3 Future Researches
In order to extend the empirical evidence on this topic, other measurements of
earnings management can be used to see whether the results are similar to this study.
There are other types of accrual-based earnings management, such as performance-
matching discretionary accruals or discretionary accruals with reversal. Moreover, if
earnings management stems from managerial opportunism, managers will use not
only accruals but also other manipulations of firm operating activities, which is
known as real earnings management. The examples of these real earnings
management are, for example, to manipulate discretionary expenses such as research
and development or advertising expenses, to manipulate the timing of asset
disposition, or to overproduce and sell.
Another possible extension of this research is to find a way to create a
distinction between good and bad earnings management. Bad earnings management
comes from managerial opportunism and should be negative for the firm’s value.
Good earnings management is expected to use other beneficial methods and should be
positive for firm value. It can be started from examining the different types of

110
earnings management, e.g. income smoothing, income-increasing accruals, income-
decreasing accruals, loss avoidance, manipulating of discretionary expenses such as
R&D expenses, timing the period to sell assets, and oversell or overproduction, in
order to see whether they are positive or negative in relation to the firm’s value.

BIBLIOGRAPHY
Abdul Rahman, R. and Ali, F. 2006. Board, Audit Committee, Culture and Earnings
Management: Malaysian Evidence. Managerial Auditing Journal.
21 (7): 783-804.
Abed, S.; Al-Attar, A. and Suwaidan, M. 2012. Corporate Governance and Earnings
Management: Jordanian Evidence. International Business Research.
5 (1): 216-225.
Ahmed, K.; Hossain, M. and Adams, M. 2006. The Effects of Board Composition
and Board Size on the Informativeness of Annual Accounting Earnings.
Corporate Governance: An International Review. 14 (5): 418-431.
Baber, W.; Farefield, P. and Haggard, J. 1991. The Effect Of Concern About
Reported Income on Discretionary Spending Decisions: The Case of
Research and Development. Accounting Review. 66 (4): 818-829.
Baker, T.; Collins, D. and Reitenga, A. 2003. Stock Option Compensation and
Earnings Management Incentives. Journal of Accounting, Auditing and
Finance. 18 (4): 557-592 .
Bartov, E.; Gul, F. and Tsui, J. 2001. Discretionary-Accruals Models and Audit
Qualifications. Journal of Accounting And Economics. 30 (3): 421-452.
Beasley, M. 1996. An Empirical Analysis of the Relation Between the Board of
Director Composition and Financial Statement Fraud. Accounting
Review. 71 (4): 443-465.
Bergstresser, D. and Philippon, T. 2006. CEO Incentives and Earnings Management.
Journal of Financial Economics. 80 (3): 511-529.
Bradley, M.; Jarrell, G. and Kim, E. H. 1984. On the Existence of an Optimal
Capital Structure: Theory and Evidence. The Journal of Finance.
39 (3): 857-878.
Bris, A. and Carbolis, C. 2008. The Value of Investor Protection: Firm Evidence From
Cross-Border Mergers. Review of Financial Studies. 21 (2): 605-648.

112
Burstahler, D. and Dichev, I. 1997. Earnings Management to Avoid Earnings
Decreases and Losses. Journal of Accounting and Economics.
24 (1): 99-126.
Bushee, B. 1998. The Influence of Institutional Investors on Myopic R&D
Investment Behavior. Accounting Review. 73 (3): 305-333.
Cheng, Q. and Warfield, T. 2005. Equity Incentives and Earnings Management.
Accounting Review. 80 (2): 441-476.
Cheng, S. and Shiu, C. 2007. Investor Protection and Capital Structure: International
Evidence. Journal of Multinational Financial Management. 17 (1): 30-44.
Cohen, D. and Zarowin, P. 2010. Accrual-based and Real Earnings Management
Activities Around Seasoned Equity Offerings. Journal of Accounting
and Economics. 50 (1): 2-19.
Cornett, M.; McNutt, J. and Tehranian, H. 2009. Corporate Governance and
Earnings Management at Large U.S. Bank Holding Companies. Journal
of Corporate Finance. 15 (4): 412-430.
DeAngelo, L. 1986. Accounting Numbers As Market Valuation Substitutes: A Study of
Management Buyouts of Public Stockholders. Accounting Review.
61 (3): 400-420.
Dechow, P. and Dichev, I. 2002. The Quality of Accruals and Earnings: the Role of
Accrual Estimation Errors. Accounting Review. 77 (Supplement): 35-59.
Dechow, P.; Hutton, A.; Kim, J. H. and Sloan, R. 2012. Detecting Earnings
Management: a New Approach. Journal of Accounting Research.
50 (2): 275-334.
Dechow, P.; Kothari, S. and Watts, R. 1998. The Relation Between Earnings and
Cash Flows. Journal of Accounting and Economics. 25 (2): 133-168.
Dechow, P.; Sloan, R. and Sweeney, A. 1995. Detecting Earnings Management.
Accounting Review. 70 (2): 193-225.
DeFond, M. and Jiambalvo, J. 1994. Debt Covenant Violation and Manipulation of
Accruals. Journal of Accounting and Economics. 17 (1-2): 145-176.
DeFond, M.; Hung, M. and Trezevant, R. 2007. Investor Protection and the
Information Content of Annual Earnings Announcements: International
Evidence. Journal of Accounting and Economics. 43 (1): 37-67.
113
Dutta, S. and Gigler, F. 2002. The Effect of Earnings Forecasts on Earnings
Management. Journal of Accounting Research. 40 (2): 631-656.
Eccles, R.; Ioannou, I. and Serafeim, G. 2011. The Impact of Corporate
Sustainability on Organizational Processes and Performance.
Retrieved August 23, 2012 from http://ssrn.com/abstract=1964011.
Fama, E. and Jensen, M. 1983. The Separation of Ownership and Control. Journal
of Law and Economics. 26 (2): 301-325.
Fama, E. and MacBeth, J. 1973. Risk, Return, and Equilibrium: Empirical Tests.
Journal of Political Economy. 81 (3): 607-636.
Francis, J. and Wang, D. 2008. The Joint Effect of Investor Protection and Big 4
Audits on Earnings Quality Around the World. Contemporary
Accounting Research. 25 (1): 157-191.
Gomper, P.; Ishii, J. and Metrick, A. 2003. Corporate Governance and Equity Prices.
Quarterly Journal of Economics. 118 (1): 107-156.
Gordon, M. 1959. Dividends, Earnings and Stock Prices. Review of Economics
and Statistics. 41 (2): 99-105.
Hazarika, S.; Karpoff, J. and Nahata, R. 2012. Internal Corporate Governance, CEO
Turnover, and Earnings Management. Journal of Financial Economics.
104 (1): 44-69.
Healy, P. 1985. The Effect of Bonus Schemes on Accounting Decisions. Journal of
Accounting And Economics. 7 (1-3): 85-107.
Healy, P. and Palepu, K. 1995. The Challenges of Investor Communication: the Case of
CUC International, Inc. Journal of Financial Economics. 38 (2): 111-140.
Healy, P. and Wahlen, J. 1999. A Review of the Earnings Management Literature
and Its Implications for Standard Setting. Accounting Horizons.
13 (4): 365-383.
Hirschey, M. and Spencer, R. 1992. Size Effects in the Market Valuation of
Fundamental Factors. Financial Analysts Journal. 48 (2): 91-95.
Ioannou, I. and Serafeim, G. 2010. The Impact of Corporate Social Responsibility on
Investment Recommendations. Retrieved April 14, 2012 from
http://web.ebscohost.com/ehost/pdfviewer/pdfviewer?vid=3&sid=b499d16
7-4a92-4905-951a-6eef13629dfc%40sessionmgr114&hid=120

114
Jensen, M. and Meckling, W. 1976. Theory of the Firm: Managerial Behavior,
Agency Costs and Ownership Structure. Journal of Financial
Economics. 3 (4): 305-360.
Jiraporn, Pornsit.; Miller, G.; Yoon, S. and Kim, Y. 2008. Is Earnings Management
Opportunistic or Beneficial? an Agency Perspective. International
Review of Financial Analysis. 17, 3 (June): 622-634.
Johnson, S.; Boone, P.; Breach, A. and Friedman E. 2000. Corporate Governance in
the Asian Financial Crisis. Journal of Financial Economics. 58 (1-2): 141-186.
Jones, J. 1991. Earnings Management During Import Relief Investigations. Journal
of Accounting Research. 29 (2): 193-228.
Klapper, L. and Love, I. 2004. Corporate Governance, Investor Protection, and
Performance in Emerging Markets. Journal of Corporate Finance.
10 (5): 703-728.
Kolb, R. 2006. The Ethics of Executive Compensation. Malden: MA.: Blackwell.
Kothari, S.; Leone, A. and Wasley, C. 2005. Performance Matched Discretionary
Accrual Measures. Journal of Accounting and Economics. 39 (1): 163-197.
Kuang, Y. 2008. Performance-vested Stock Options and Earnings Management.
Journal of Business Finance and Accounting. 35 (9-10): 1049-1078.
La Porta, R.; Lopez-de-Silanes, F. and Shleifer, A. 2006. What Works in Securities
Laws? The Journal of Finance. 61 (1): 1-32.
La Porta, R.; Lopez-de-Silanes, F.; Shleifer, A. and Vishny, R. 1998. Law and
Finance. Journal of Political Economy. 106, 6 (December): 1113-1155.
La Porta, R.; Lopez-de-Silanes, F.; Shleifer, A. and Vishny, R. 2000. Investor
Protection and Corporate Governance. Journal of Financial Economics.
58 (1-2): 3-27.
Leuz, C.; Nanda, D. and Wysocki, P. 2003. Earnings Management and Investor
Protection: an International Comparison. Journal of Financial
Economics. 69 (3): 505-527.
Magrath, L. and Weld, L. 2002. Abusive Earnings Management and Early Warning
Signs. The CPA Journal. 72 (8): 50-53.
McNichols, M. 2000. Research Design Issues in Earnings Management Studies.
Journal of Accounting and Public Policy. 19 (4-5): 313-345.

115
Mohamad, M.; Abdul Rashid, H. and Shawtari, F. 2012. Corporate Governance and
Earnings Management in Malaysian Government Linked Companies: the
Impact Of GLCs’ Transformation Policy. Asian Review of Accounting.
20 (3): 241-258.
Ning, Y. 2006. A Different Perspective of Earnings Management. Canadian Social
Science. 2 (2): 11-17.
Park, Y. and Shin, H. 2004. Board Composition and Earnings Management in
Canada. Journal Of Corporate Finance. 10 (3): 431-457.
Peasnell, K.; Pope, P. and Young, S. 2005. Do Outside Directors Limit Earnings
Management? Corporate Finance Review. 10 (5): 5-10.
Ross, S. 1977. The Determination of Financial Structure: the Incentive-Signalling
Approach. Bell Journal of Economics. 8 (1): 23-40.
Rossi, S. and Volpin, P. 2004. Cross-Country Determinants of Mergers and
Acquisitions. Journal of Financial Economics. 74 (2): 277-304.
Shen, C. and Chih, H. 2005. Investor Protection, Prospect Theory, and Earnings
Management: an International Comparison of the Banking Industry.
Journal Of Banking And Finance. 29 (10): 2675-2697.
Shen, C. and Chih, H. 2007. Earnings Management and Corporate Governance in
Asia's Emerging Markets. Corporate Governance: An International
Review. 15 (5): 999-1021.
Sugata Roychowdhury. 2006. Earnings Management Through Real Activities
Manipulation. Journal of Accounting and Economics. 42 (3): 335-370.
Wang J.; Sheu, H. and Chung, H. 2011. Corporate Governance Reform and Earnings
Management. Investment Management and Financial Innovations.
8 (4): 109-118.
Watts, R. and Zimmerman, J. 1986. Positive Accounting Theory. Englewood
Cliffs: Prentice-Hall.
Watts, R. and Zimmerman, J. 1990. Positive Accounting Theory: a Ten Year
Perspective. Accounting Review. 65 (1): 131-156.
William, J. 1938. The Theory of Investment Value. Cambridge: Harvard
University Press.

116
Xie, B.; Davidson, W. and DaDalt, P. 2003. Earnings Management and Corporate
Governance: the Role of the Board and the Audit Committee. Journal of
Corporate Finance. 9 (3): 295-316.
Yermack, D. 1996. Higher Market Valuation of Companies with a Small Board of
Directors. Journal of Financial Economics. 40 (2): 185-211.

BIOGRAPHY
NAME Nopphon Tangjitprom
ACADEMIC BACKGROUND Bachelor of Business Administration (BBA),
Finance and Banking Major,
Assumption University, Thailand.
Master of Science in Information Technology,
King Mongkut’s University of Technology
Thonburi, Thailand.
PRESENT POSITION Lecturer, Finance and Banking Department,
Martin De Tour School of Management and
Economics, Assumption University
EXPERIENCES Business Analyst,
National Science and Technology
Development Agency.
Business Analyst,
Product and Distribution Department,
Bangkok Bank.