Earnings Conference Call 4th Quarter 2016 - Exelon...9 Q4 2016 Earnings Release Slides ($0.19) $1.27...
78
Earnings Conference Call 4 th Quarter 2016 February 8, 2017
Transcript of Earnings Conference Call 4th Quarter 2016 - Exelon...9 Q4 2016 Earnings Release Slides ($0.19) $1.27...

Earnings Conference Call4th Quarter 2016
February 8, 2017

2 Q4 2016 Earnings Release Slides
Cautionary Statements Regarding Forward-Looking InformationThis presentation contains certain forward-looking statements within the meaning of the Private SecuritiesLitigation Reform Act of 1995, that are subject to risks and uncertainties. The factors that could cause actualresults to differ materially from the forward-looking statements made by Exelon Corporation, Exelon GenerationCompany, LLC, Commonwealth Edison Company, PECO Energy Company, Baltimore Gas and Electric Company,Pepco Holdings LLC (PHI), Potomac Electric Power Company, Delmarva Power & Light Company, and Atlantic CityElectric Company (Registrants) include those factors discussed herein, as well as the items discussed in (1)Exelon’s 2015 Annual Report on Form 10-K in (a) ITEM 1A. Risk Factors, (b) ITEM 7. Management’s Discussionand Analysis of Financial Condition and Results of Operations and (c) ITEM 8. Financial Statements andSupplementary Data: Note 23; (2) PHI’s 2015 Annual Report on Form 10-K in (a) ITEM 1A. Risk Factors, (b) ITEM7. Management’s Discussion and Analysis of Financial Condition and Results of Operations and (c) ITEM 8.Financial Statements and Supplementary Data: Note 16; (3) Exelon’s Third Quarter 2016 Quarterly Report onForm 10-Q in (a) Part II, Other Information, ITEM 1A. Risk Factors; (b) Part 1, Financial Information, ITEM 2.Management’s Discussion and Analysis of Financial Condition and Results of Operations and (c) Part I, FinancialInformation, ITEM 1. Financial Statements: Note 18; and (4) other factors discussed in filings with the SEC by theRegistrants. Readers are cautioned not to place undue reliance on these forward-looking statements, whichapply only as of the date of this presentation. None of the Registrants undertakes any obligation to publiclyrelease any revision to its forward-looking statements to reflect events or circumstances after the date of thispresentation.

3 Q4 2016 Earnings Release Slides
Non-GAAP Financial MeasuresExelon reports its financial results in accordance with accounting principles generally accepted in the UnitedStates (GAAP). Exelon supplements the reporting of financial information determined in accordance with GAAPwith certain non-GAAP financial measures, including adjusted (non-GAAP) operating earnings, adjusted (non-GAAP) operating and maintenance expense, total gross margin, and adjusted cash flow from operations (non-GAAP) or free cash flow. Adjusted (non-GAAP) operating earnings exclude certain costs, expenses, gains andlosses and other specified items, including mark-to-market adjustments from economic hedging activities,unrealized gains and losses from nuclear decommissioning trust fund investments, merger and integrationcosts, certain costs incurred associated with the PHI acquisition, merger commitments related to the settlementof the PHI acquisition, the impairment of certain long-lived assets, plant retirements and divestitures, costsrelated to the cost management program, the non-controlling interest in CENG, and other items as set forth inthe reconciliation in the Appendix. Adjusted (non-GAAP) operating and maintenance expense excludes regulatoryoperating and maintenance costs for the utility businesses and direct cost of sales for certain Constellationbusinesses, decommissioning costs that do not affect profit and loss, the impact from operating andmaintenance expense related to variable interest entities at Generation, and other items as set forth in thereconciliation in the Appendix. Total gross margin (non-GAAP) is defined as operating revenues less purchasedpower and fuel expense, excluding revenue related to decommissioning, gross receipts tax, Exelon NuclearPartners, the operating services agreement with Fort Calhoun, variable interest entities and net of direct cost ofsales for certain Constellation businesses. Adjusted cash flow from operations (non-GAAP) or free cash flowprimarily includes net cash flows from operating activities and net cash flows from investing activities excludingcapital expenditures, net merger and acquisitions, and equity investments. Due to the forward-looking nature ofany forecasted non-GAAP measures, information to reconcile the forecast adjusted (non-GAAP) measures to themost directly comparable GAAP measure is not currently available, as management is unable to project all ofthese items for future periods.

4 Q4 2016 Earnings Release Slides
Non-GAAP Financial Measures ContinuedThis information is intended to enhance an investor’s overall understanding of period over period financialresults and provide an indication of Exelon’s baseline operating performance by excluding items that areconsidered by management to be not directly related to the ongoing operations of the business. In addition, thisinformation is among the primary indicators management uses as a basis for evaluating performance, allocatingresources, setting incentive compensation targets and planning and forecasting of future periods.These non-GAAP financial measures are not a presentation defined under GAAP and may not be comparable toother companies’ presentation. Exelon has provided these non-GAAP financial measure as supplementalinformation and in addition to the financial measures that are calculated and presented in accordance withGAAP. These non-GAAP measures should not be deemed more useful than, a substitute for, or an alternative tothe most comparable GAAP measures provided in the materials presented. Reconciliations of these non-GAAPmeasures to the most comparable GAAP measures are provided in the footnotes, appendices and attachmentsto this presentation.

5 Q4 2016 Earnings Release Slides
2016 Milestone Accomplishments
Financial
•Delivered FY 2016GAAP earnings of$1.22 and adjustedoperating earnings of$2.68 per share,within our guidancerange(1)
•Implemented 2.5%annual dividendgrowth strategythrough 2018
•Named as the onlyUtility on the Fortune100 list
•Exelon’s diversesupplier spendreached $1.9B in2016, up 202%since 2011
Growth
•Completed theacquisition of PHI,adding $8.3B of ratebase
•Invested $5.2B ofcapital to improvereliability at ourregulated Utilitiesexcluding the merger
•Completedacquisition of ConEdSolutions
•Pending acquisitionof the FitzPatricknuclear powerstation
Regulatory & Policy
•IL and NY ZECPrograms willpreserve five nuclearplants at risk ofclosure
•IL Legislationprovides ComEd afair return on energyefficiencyinvestments thatbenefit ourcustomers and alsoextends EIMAformula rate to 2022
•Completeddistribution ratecases providing$317M in revenueincreases withanother $80M forFERC transmission
Employees &Community
•Commitment to ourworkforce throughbest in industryparental leaveprogram and firstutility to sign theEqual Pay pledge
•Exelon employeesdonated 171,341hours to volunteerinitiatives and Exelondonated $46M to ourlocal communities
(1) Refer to the Earnings Release Attachments for additional details and to the Appendix for a reconciliation of adjusted (non-GAAP) operating EPS to GAAP EPS

6 Q4 2016 Earnings Release Slides
Best in Class Utility OperationsComments
• Operationally, the utilities ended the year withstrong results across key metrics.
• BGE, ComEd, and PECO achieved 1st
decile performance in CustomerSatisfaction Index (CSI) that was the bestever performance for each utility
• PECO achieved 1st decile performance inOSHA Recordable Rate
• ComEd and PECO achieved 1st decileperformance for outage frequency.ComEd’s results were best on record andbest in class.
• PHI outage frequency performance wasbest ever on record
Operations Metric2016
BGE PECO ComEd PHI
ElectricOperations
OSHA RecordableRate
2.5 Beta SAIFI(Outage Frequency)
2.5 Beta CAIDI(Outage Duration)
CustomerOperations
CustomerSatisfaction N/A
Service Level % ofCalls Answered in<30 sec
Abandon Rate
GasOperations
Percent of CallsResponded to in <1Hour
No GasOperations
Q1 Q2Q3 Q4
Exelon Utilities has identified and transferred best practices ateach of its utilities to improve operating performance in areassuch as:• System Performance• Emergency Preparedness• Corrective and Preventive Maintenance• Customer Care
Exelon Utilities Operational Metrics

7 Q4 2016 Earnings Release Slides
Best in Class at ExGen and Constellation
77% retail powercustomer
renewal rate
28% power newcustomer win
rate
91% natural gascustomer
retention rate
25 monthaverage powercontract term
Averagecustomer
duration of morethan 5 years
Stable RetailMargins
Exelon Generation Operational Metrics
• Continued best in class performance acrossour Nuclear fleet:
o Capacity Factor of 94.6% is the highestever for Exelon
o Most power ever generated at 153MMWh(1)
o All-time shortest refueling outageduration average of 22 days
• Strong performance across our Fossil andRenewable fleet:
o Renewables energy capture: 95.6%o Power dispatch match: 97.2%
Constellation Metrics
Closed on ConEdison Solutions transaction, adding more than 560,000 customers(1) Reflects generation output at ownership

8 Q4 2016 Earnings Release Slides
(1) Refer to the Earnings Release Attachments for additional details and to the Appendix for a reconciliation of adjusted (non-GAAP) operating EPS to GAAP EPS(2) Amounts may not add due to rounding
Strong 2016 Financial Results
FY AdjustedOperatingEarnings
$2.68
($0.19)
$1.27
$0.57
$0.48
$0.25
$0.31
FY GAAPEarnings
$1.22
($0.43)
$0.54
$0.41
$0.47
($0.07)
$0.31
2016 EPS Results(1,2)
• Adjusted (non-GAAP) operating earnings fullyear drivers versus guidance:
UtilitiesWeatherLower O&M
Exelon GenerationLower cost to serveNuclear Generation Output
Q4 AdjustedOperatingEarnings
$0.44
($0.08)
$0.18
$0.09
$0.10
$0.05
$0.11
Q4 GAAPEarnings
$0.22
($0.06)($0.04)
$0.09
$0.10
$0.03
$0.11
ExGenHoldCoComEd
PECOPHIBGE

9 Q4 2016 Earnings Release Slides
($0.19)
$1.27
$0.57
$0.48
$0.25
$0.31
PECO
HoldCo
ExGen
ComEd
PHI
BGE
HoldCo
ExGen
ComEd
PECO
PHI
BGE
2017 Guidance
$2.50 - $2.80(2)
~($0.20)
$1.05 - $1.15
$0.60 - $0.70
$0.40 - $0.50
$0.30 - $0.40
$0.25 - $0.35
2016 Actual
$2.68(1)
2017 Adjusted Operating Earnings Guidance
(1) 2016 results based on 2016 average outstanding shares of 927M. Refer to Earnings Release Attachments for additional details and to the Appendix for a reconciliation of adjusted (non-GAAP) operating EPS to GAAP EPS.
(2) 2017 earnings guidance based on expected average outstanding shares of 949M. Earnings guidance for OpCos may not add up to consolidated EPS guidance. Refer to the Appendix for areconciliation of adjusted (non-GAAP) operating EPS guidance to GAAP EPS.
Expect Q1 2017 Adjusted Operating Earnings of $0.55 - $0.65 per share
Key Year-Over-Year Drivers
• BGE: Higher D&A, partially offsetby normalization of one timeitems and distribution revenue
• PHI: Full year of earnings andhigher distribution andtransmission revenue
• PECO: Higher O&M for stormsand higher D&A for CapEx
• ComEd: Increased capitalinvestments to improve reliabilityin distribution and transmissionand higher U.S. Treasury yields
• ExGen: Lower realized energyprices, partially offset by NY andIL ZEC revenues

10 Q4 2016 Earnings Release Slides
Our Capital Plan Drives Stable Earnings GrowthCapital Expenditures ($M)
Over $20B of capital is being invested at utilities from 2017-2020 to improve reliability
2,200 2,0251,675 1,775
925 950975 875
775 800775 750
1,375 1,4001,350 1,425
2019E
4,775
2018E
5,175
2020E
4,825
2017E
5,275
Note: CapEx numbers are rounded to nearest $25M and numbers may not add due to rounding(1) Rate base reflects year-end estimates
Rate Base ($B)(1)
11.9 13.2 14.0 14.8 15.5
5.35.7 6.1 6.5 6.9
6.26.6
7.07.4
7.88.38.9
9.49.9
10.5
+6.5%
2020E
40.8
2019E
38.6
2018E
36.6
2017E
34.4
2016E
31.7
PHI ComEdPECO BGE
11 Q4 2016 Earnings Release Slides
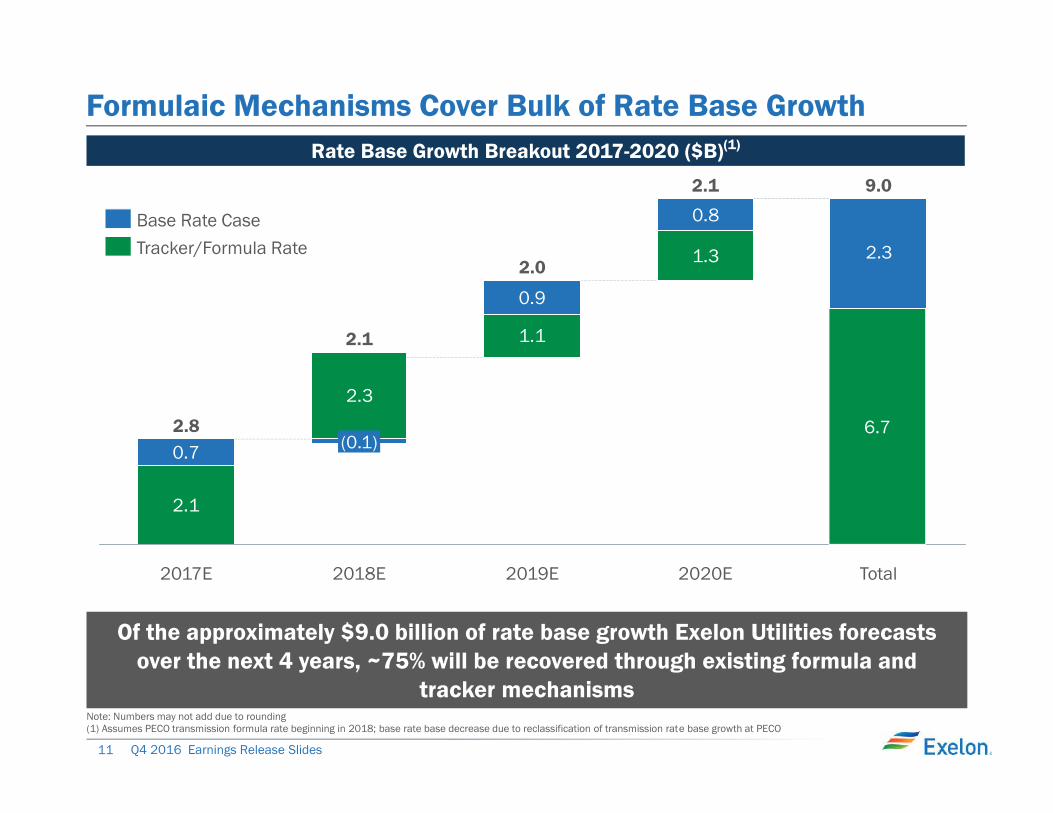
Formulaic Mechanisms Cover Bulk of Rate Base Growth
2.1
1.1
1.3
9.0
0.7
2.3
0.9
0.8
Total
9.0
2020E
2.1
2019E
2.0
2018E
2.1
(0.1)
2017E
2.8
Of the approximately $9.0 billion of rate base growth Exelon Utilities forecastsover the next 4 years, ~75% will be recovered through existing formula and
tracker mechanisms
Rate Base Growth Breakout 2017-2020 ($B)(1)
6.7
2.3Tracker/Formula RateBase Rate Case
Note: Numbers may not add due to rounding(1) Assumes PECO transmission formula rate beginning in 2018; base rate base decrease due to reclassification of transmission rate base growth at PECO

12 Q4 2016 Earnings Release Slides
Weighted Average Allowed vs Earned ROE ComparisonTwelve Month Trailing Earned ROEs(1,2)
(1) Operating ROE is calculated using operating net income divided by simple average equity for the period 12/31/15 – 12/31/16. The operating net income is reflective of all lines ofbusiness (Electric Distribution, Gas Distribution, Transmission).
(2) For a reconciliation of operating ROE, which is a non-GAAP measure derived from adjusted operating earnings, please refer to slide 78 in the Appendix
7.5%
6.3%5.6%
9.5%
10.5%9.7%10.0%10.0%
Consolidated EULegacy EUPepcoDelmarvaACE
Allowed ROE Earned ROE

13 Q4 2016 Earnings Release Slides
Exelon Utilities Distribution Rate Case Summary
ACE Electric Final Order
Pepco MD Final OrderRequested Revenue Requirement Increase(1) $52.5M
Requested ROE 9.55%
Requested Common Equity Ratio 49.55%
Order Received 11/15/16
Delmarva DE Electric FilingRequested Revenue Requirement Increase(1) $60.2M
Requested ROE 10.60%
Requested Common Equity Ratio 49.44%
Order Expected Q3 2017
Delmarva DE Gas FilingRequested Revenue Requirement Increase(1) $21.5M
Requested ROE 10.60%
Requested Common Equity Ratio 49.44%
Order Expected Q3 2017
Delmarva MD FilingRequested Revenue Requirement Increase(1) $57M
Requested ROE 10.60%
Requested Common Equity Ratio 49.10%
Order Expected 2/17/17
Pepco DC FilingRequested Revenue Requirement Increase(1) $76.8M
Requested ROE 10.60%
Requested Common Equity Ratio 49.14%
Order Expected 7/25/17
ComEd Final OrderRequested Revenue Requirement Increase(2) $127M
Authorized ROE 8.64%
Common Equity Ratio 46%
Order Received 12/6/16(1) Revenue requirement includes changes in depreciation and amortization expense where applicable, which have
no impact on pre-tax earnings(2) Amounts represents the Illinois Commerce Commission’s approved revenue requirement amount in the December
6th Final Order. The ICC also ordered rehearing on one narrow topic that ComEd expects to result in a furtherreduction to the revenue requirement of $17.5M.
(3) On July 29, 2016, BGE received a PSC order on rehearing, which is reflected in the revenue requirement increase(4) ComEd Authorized ROE is tied to the 30 year Treasury yield plus 580bps
Authorized Revenue Requirement Increase(1) $45M
Authorized ROE 9.75%
Common Equity Ratio 49.48%
Commission Approved Settlement 8/24/16
Cumulative Final OrdersAuthorized Revenue Requirement Increase(1) $317M
BGE Final OrderAuthorized Revenue Requirement Increase(1,3) $92M
Authorized ROE 9.75% (9.65% Gas)
Common Equity Ratio 51.90%
Order Received(3) 6/3/16

14 Q4 2016 Earnings Release Slides
Exelon Utilities EPS Growth of 6-8% to 2020
$0.00
$1.70
$1.90
$1.60
$1.50
$1.80
$1.40
$2.00
$2.10
$1.80
2017E
$1.90
$1.70
2019E
$2.05
2020E2018E
$1.60
$1.50
Utili
ty A
djus
ted
Oper
atin
g Ea
rnin
gs
Rate base growth combined with PHI ROE improvement drives EPS growth
$1.40
$1.75
Exelon Utilities Operating Earnings 2017-2020
Note: Reflects GAAP operating earnings except for 2017. 2017 GAAP EPS range would be $1.35 to $1.65. 2017 adjusted (non-GAAP) operating earnings include adjustments to exclude $0.05for merger commitments and integration costs. Includes after-tax interest expense held at Corporate for debt associated with existing utility investment.

15 Q4 2016 Earnings Release Slides
Exelon Generation: Gross Margin Update
1) Gross margin categories rounded to nearest $50M2) Total Gross Margin (Non-GAAP) is defined as operating revenues less purchased power and
fuel expense, excluding revenue related to decommissioning, gross receipts tax, ExelonNuclear Partners, operating services agreement with Fort Calhoun and variable interestentities. Total Gross Margin is also net of direct cost of sales for certain Constellation andPower businesses. See Slide 50 for a Non-GAAP to GAAP reconciliation of Total GrossMargin.
3) Excludes EDF’s equity ownership share of the CENG Joint Venture
4) Mark-to-Market of Hedges assumes mid-point of hedge percentages5) Based on December 31, 2016 market conditions6) Reflects Oyster Creek retirement in December 20197) Variance to September 30, 2016 are on a pro-forma basis. See slide 44 for a full pro-forma
of the September 30, 2016 gross margin in new format.
• Gross Margin disclosure now includes impacts of NY and IL ZECs, pending FitzPatrickacquisition, and reversal of the IL plant closures
• Behind ratable hedging position reflects the fundamental upside we see in power prices• Generation ~6-9% open in 2017
Recent Developments
Gross Margin Category ($M)(1) 2017 2018 2019 2017 2018 2019
Open Gross Margin(3)
(including South, West, Canada hedged gross margin)$4,100 $4,200 $4,050 $300 $550 $450
Capacity and ZEC Revenues(3) $1,850 $2,250 $2,050 $400 $550 $600
Mark-to-Market of Hedges(3,4) $1,200 $450 $350 - $(50) $50
Power New Business / To Go $550 $900 $950 $(50) - -
Non-Power Margins Executed $200 $100 $50 $50 - -
Non-Power New Business / To Go $250 $400 $450 $(50) - -
Total Gross Margin(2,5,6) $8,150 $8,300 $7,900 $650 $1,050 $1,100
December 31, 2016 Change from Sep 30, 2016(7)

16 Q4 2016 Earnings Release Slides
Adjusted O&M ($M)(1,2,3)
4,525 4,200 4,150 4,150
325525 575 625
-0.5%
2020E
4,775
2019E
4,725
2018E
4,725
2017E
4,850
Negative O&M CAGR reflects benefits of cost optimization program(1) All amounts rounded to the nearest $25M(2) O&M and Capital Expenditures reflect reversal of Quad Cities and Clinton retirement decisions and includes FitzPatrick(3) Refer to slide 77 in the Appendix for a reconciliation of adjusted {non-GAAP) O&M to GAAP O&M(4) Capital spend represents cash CapEx with CENG at 100% and excludes merger commitments; incremental CapEx (Base and Fuel) impact from nuclear reversals and adding FitzPatrick for
2017, 2018, 2019, and 2020 at Q4 is $250M, $300M, $225M, and $275M, respectively
Driving Cost and Capital Out of the Generation Business
1,050 1,000 925 875
950 900 925 850
850
175125
2019E
1,975125
2018E
2,075
2017E
2,850
2020E
1,850
Capital Expenditures ($M)(1,4)
BaseNuclear FuelCommitted GrowthReversals + FitzPatrick All Other O&M

17 Q4 2016 Earnings Release Slides
ExGen’s Strong Free Cash Flow Supports Utility Growth and Debt Reduction2017-2020 Exelon Generation Free Cash Flow(1) and Uses of Cash ($B)
(1) Free Cash Flow is a non-GAAP Measure. See slide 77 for a reconciliation of free cash flow to the most comparable GAAP measures.(2) Cumulative Free Cash Flow is a midpoint of a range based on December 31, 2016 market prices. Sources include change in margin, tax parent benefit, equity investments, and acquisitions
and divestitures.
Redeploying Exelon Generation’s free cash flow to maximize shareholder value
($2.3 - $2.7)
($2.8 - $3.2)
(~$1.3)
Committed ExGen Growth CapEx ExGen/HoldCo Debt Reduction
~$6.8
Cumulative ExGenFCF 2017-2020(2)
Utility Investment

18 Q4 2016 Earnings Release Slides
Maintaining Investment Grade Credit Ratings isa Top Financial Priority
Current Ratings (2)(3) ExCorp ExGen ComEd PECO BGE ACE DPL Pepco
Moody’s Baa2 Baa2 A2 Aa3 A3 A3 A2 A2
S&P BBB- BBB A- A- A- A A A
Fitch BBB BBB A A A- A- A A-
(1) Due to ring-fencing, S&P deconsolidates BGE from Exelon and analyzes solely as an equity investment. FFO/Debt is a non-GAAP measure. Please refer to slide 73 in the appendix for a reconciliation of FFO/Debt to the mostcomparable GAAP measure.
(2) Current senior unsecured ratings as of December 31, 2016 for Exelon, Exelon Generation and BGE and senior secured ratings for ComEd, PECO, ACE, DPL, and Pepco(3) Moody’s has ComEd on “Positive” outlook. All other ratings have “Stable” outlook.(4) Exelon Corp downgrade threshold (red dotted line) is based on the S&P Exelon Corp Summary Report; represents minimum level to maintain current Issuer Credit Rating of BBB at Exelon Corp(5) Reflects net book debt (YE debt less cash on hand) / adjusted operating EBITDA. EBITDA, a non-GAAP measure, is defined as earnings before interest, taxes, depreciation and amortization. Includes nuclear fuel amortization expense.
Please refer to slide 74 in the appendix for a reconciliation of Debt/EBITDA to the most comparable GAAP measure.
ExGen Debt/EBITDA Ratio(5)Exelon S&P FFO/Debt %(1)(4)
Credit Ratings by Operating Company
0%
5%
10%
15%
20%
25%18%-20%
2017 Target
21%
0.0
1.0
2.0
3.0
4.0
2.7x
3.3x
2017 Target
3.0x
Excluding Non-RecourseBookS&P Threshold

19 Q4 2016 Earnings Release Slides
The Exelon Value Proposition Regulated Utility Growth with utility EPS rising 6-8% annually from 2017-
2020 and rate base growth of 6.5%, representing an expanding majority of earnings
ExGen’s strong free cash generation will support utility growth while alsoreducing debt by ~$3B over the next 4 years
Optimizing ExGen value by:• Seeking fair compensation for the zero-carbon attributes of our fleet;• Closing uneconomic plants;• Monetizing assets; and,• Maximizing the value of the fleet through our generation to load matching strategy
Strong balance sheet is a priority with all businesses comfortably meetinginvestment grade credit metrics through the 2020 planning horizon
Capital allocation priorities targeting:
• Organic utility growth;• Return of capital to shareholders with 2.5% annual dividend growth through 2018(1),• Debt reduction; and,• Modest contracted generation investments
(1) Quarterly dividends are subject to declaration by the board of directors

20 Q4 2016 Earnings Release Slides
Additional Disclosures

21 Q4 2016 Earnings Release Slides
Key Provisions of the Future Energy Jobs Bill• Zero Emission Standard: Requires the Illinois Power Agency to procure contracts with zero emission
facilities for zero emission credits (ZECs) equal to 16% of the actual electricity delivered in 2014. Cost of theprogram is capped at 1.65% of rates (about $235 million per year) for 10-year program duration andpayments may be reduced by up to 10% if certain customer cost caps are exceeded.– ZEC payment calculation (subject to the caps):
• Energy Efficiency: ComEd will increase spending to ~$400M at the peak of the program. This spendingwill be treated as traditional asset investment and ComEd will be able to earn a return on it.
• Formula Rate: Extends the ComEd Distribution formula rate until 2022• Decoupling: Revenue is decoupled from energy usage by eliminating the +/- 50 basis point collar in the
formula rate• Renewable Portfolio Standard: RPS is restructured to generate more renewable development,
particularly, the law allows ComEd to propose developing a low-income community solar project and alsowill fund and place in rate base a solar rebate program for commercial and community solar developers
• Overall Cost Caps: Creates separate cost caps for residential, C&I, and large C&I customers that limitpotential increases due to investment as a result of the legislation. Sets forth processes and remedies ifprojected or actual costs exceed the limitations specified in the legislation for the relevant customer class.
Social Cost ofCarbon
($16.50/MWh)(1)
Amount thatmarket price
index exceedsthe baselinemarket price
index of$31.40/MWh
ZEC Payment
(1) Social cost of carbon remains flat for first six years and then escalates at $1/MWH per year thereafter

22 Q4 2016 Earnings Release Slides
Exelon Utilities EPS Growth of 6-8% from 2017-2020
$2.10
$2.00
$1.90
$1.80
$1.70
$1.50
$1.40
$0.00
$1.10
$0.10
$1.30
$1.20
$1.60
2020E2016A
$1.70
2017E
$1.80
$1.41
2018E
$1.90
2019E
$2.05
$1.60
$1.50
Utility growth rate is still at 6-8% despite higher earnings in 2017
$1.40
Note: Analyst day reflects GAAP operating earnings. Q4 Earnings reflects GAAP operating earnings except for 2016A and 2017. For 2016A please refer to the Appendix for a reconciliation ofadjusted (non-GAAP) operating EPS to GAAP EPS. 2017 GAAP EPS range would be $1.35 to $1.65. 2017 adjusted (non-GAAP) operating earnings include adjustments to exclude $0.05 for mergercommitments and integration costs. Includes after-tax interest expense held at Corporate for debt costs associated with utility investment.
$1.75
Analyst Day
$1.10
$0.10
$0.00
$2.00
$1.90
$2.10
$1.70
$1.80
$1.40
$1.60
$1.50
$1.30
$1.20
2017E
$1.65
2016E
$1.45
$2.00
2020E2019E
$1.90
2018E
$1.80
$1.60
$1.50
$1.35
$1.70
Q4 Earnings
$1.15

23 Q4 2016 Earnings Release Slides
Utility Capex and Rate Base vs. Previous DisclosureAnalyst Day Rate Base CapEx ($M)
Over $20B of capital is being invested in utilities from 2017-2020 and rate base is growing at 6.5% from2016-2020
3,625 3,550 3,125 3,225
1,200 1,1001,000 825
550525525500
5,175
2017E
5,325
2020E
4,600
2019E
4,650
2018E
Electric Distribution
Electric Transmission
Gas Delivery
Note: Numbers rounded to nearest $25M and may not add due to rounding. Rate base reflects year-end estimates.
3,575 3,550 3,275 3,275
1,175 1,025925 975
525 600575 575
2020E
4,825
2019E
4,775
2018E
5,175
2017E
5,275
Q4 2016 CapEx ($M)
Analyst Day Rate Base ($B) Q4 2016 Rate Base ($B)
12.2 13.0 13.6 14.0 14.7
5.2 5.8 6.2 6.5 6.96.3 6.9 7.3 7.7 8.18.4
9.1 9.5 10.0 10.9
38.2
+6.1%
2020E2018E 2019E
40.636.7
2017E
34.7
2016E
32.0
11.9 13.2 14.0 14.8 15.5
5.3 5.7 6.1 6.5 6.96.2 6.6 7.0 7.4 7.88.38.9 9.4 9.9 10.531.7
+6.5%
2020E
40.8
2019E
38.6
2018E
36.6
2017E
34.4
2016E
ComEd
PECO
BGE
PHI

24 Q4 2016 Earnings Release Slides
Note: Numbers rounded to nearest $25M and may not add due to rounding(1) Other includes long-term regulatory assets, which earn a return consistent with rate base, including Energy Efficiency and the Solar Rebate Program(2) Rate base reflects year-end estimates
ComEd Capital Expenditure and Rate Base ForecastQ4 2016 Capital Expenditures ($M)
1,800 1,6501,375 1,475
400375
300 300
2020E
1,775
2019E
1,675
2018E
2,025
2017E
2,200
~$7.7B of Capital being invested from 2017-2020
8.7 9.5 10.1 10.5 11.0
3.93.63.2
+6.8%
2020E
15.50.7
2019E
14.8
3.80.5
2018E
14.00.3
2017E
13.2
3.50.1
2016E
11.9
Q4 2016 Rate Base ($B)(2)
Analyst Day Capital Expenditures ($M)
Analyst Day Rate Base ($B)
1,750 1,5751,300 1,450
400
275300
325
2020E
1,725
2019E
1,600
2018E
1,900
2017E
2,150
8.9 9.5 9.9 10.3 10.8
3.3 3.5 3.7 3.8 3.9
+4.8%
2020E
14.7
2019E
14.0
2018E
13.6
2017E
13.0
2016E
12.2
Electric DistributionElectric TransmissionOther(1)

25 Q4 2016 Earnings Release Slides
Note: Numbers rounded to nearest $25M and may not add due to rounding. Rate base reflects year-end estimates.
PECO Capital Expenditure and Rate Base ForecastQ4 2016 Capital Expenditures ($M)
475 500 500 475
125 100
175 200 200 200
775
2017E 2020E
750
75
2019E
775
75
2018E
800
~$3.1B of Capital being invested from 2017-2020
4.0 4.2 4.4 4.6 4.9
1.4 1.5 1.6 1.7 1.9
1.0 1.11.1
2020E
7.8
2019E
7.4
2018E
7.0
2017E
6.6
0.9
2016E
6.2
0.9
+5.8%
Q4 2016 Rate Base ($B)
Analyst Day Capital Expenditures ($M)
Analyst Day Rate Base ($B)
500 500 475 475
757575100200175 200 200
2020E
750
2019E
750
2018E
775
2017E
775
4.0 4.4 4.7 4.9
1.4 1.5 1.7 1.8
5.1
1.12.0
2016E
6.3
2020E
7.7 8.1
2019E
1.0
2018E
7.3
1.0
2017E
6.9
1.00.9
+6.7%
Electric Transmission Electric DistributionGas Delivery

26 Q4 2016 Earnings Release Slides
Note: Numbers rounded to nearest $25M and may not add due to rounding. Rate base reflects year-end estimates.
BGE Capital Expenditure and Rate Base ForecastQ4 2016 Capital Expenditures ($M)
400 450 475 400
225 150 175150
300 350 325325
2020E
875
2019E
975
2018E
950
2017E
925
~$3.7B of Capital being invested from 2017-2020
3.1 3.2 3.4 3.6 3.7
1.3 1.5 1.6 1.8 2.0
1.21.1
+7.3%
2020E
6.9
2019E
6.5
2018E
6.1
1.1
2017E
5.7
1.1
2016E
5.3
0.8
Q4 2016 Rate Base ($B)
Analyst Day Capital Expenditures ($M)
Analyst Day Rate Base ($B)
400 500 500 400
225175 200
175
275 275 275300
2020E
875
2019E
975
2018E
950
2017E
900
3.2 3.3 3.5 3.7 3.9
1.0 1.1 1.1 1.21.4 1.5 1.6 1.7 1.8
+7.4%
2020E
6.9
2019E
6.5
2018E
6.2
2017E
5.8
0.7
5.2
2016EElectric DistributionGas Delivery Electric Transmission

27 Q4 2016 Earnings Release Slides
PHI Consolidated Capital Expenditure and Rate Base ForecastQ4 2016 Capital Expenditures ($M)
900 950 925 925
425 400
2020E
1,425
450
50
2019E
1,350
37550
2018E
1,40050
2017E
1,37550
~$5.5B of Capital being invested from 2017-2020
6.0 6.3 6.6 7.0 7.4
2.5 2.72.4
2.0
2020E
10.5+6.1%
2016E
8.30.3
9.4
2019E
0.3 0.49.9
2018E
0.4
2017E
8.9
2.30.3
Q4 2016 Rate Base ($B)
Analyst Day Capital Expenditures ($M)
Analyst Day Rate Base ($B)
975 975 875 900
475 525425 275
50
2017E
1,500
2020E
1,22550
2019E
1,35050
2018E
1,55050
6.0 6.4 6.6 7.0 7.3
2.7 3.12.32.1
8.4
+6.6%
2020E
10.90.4
2019E
10.00.4
2018E
9.5
2.60.3
2017E
9.10.3
2016E
0.3
Electric DistributionGas Delivery Electric Transmission
Note: Numbers rounded to nearest $25M and may not add due to rounding. Rate base reflects year-end estimates.

28 Q4 2016 Earnings Release Slides
Pepco Holdings Capital Expenditures
200 200 175 175
125 150150 125
2020E
300
2019E
325
2018E
350
2017E
325
175 175 175 175
175125
75 75
5050
50 50
2020E
300
2019E
300
2018E
350
2017E
400
Electric DistributionElectric TransmissionGas Delivery
525575 575 575
125
150250
125
2020E
825
2019E
725
2018E
700
2017E
650
Note: Numbers rounded to nearest $25M and may not add due to rounding

29 Q4 2016 Earnings Release SlidesNote: All numbers denote year-end rate base and may not add due to rounding. Rate base reflects year-end estimates.
Pepco Holdings Rate Base Outlook
1.2 1.3 1.4 1.4 1.5
0.7 0.7 0.8 0.91.0
+7.3%
2020E
2.5
2019E
2.3
2018E
2.1
2017E
2.0
2016E
1.9
1.4 1.5 1.5 1.6 1.7
0.7 0.7 0.8 0.8 0.80.3 0.3
0.3 0.4 0.4
2020E
2.8
2019E
2.7
2018E
2.7
2017E
2.5
2016E
2.4
+4.0%
Electric DistributionElectric TransmissionGas Delivery
3.3 3.5 3.74.0 4.3
0.70.9
0.90.8
0.9
5.2
2020E2019E
4.8
2018E
4.6
2017E
4.4
2016E
4.0
+6.7%

30 Q4 2016 Earnings Release Slides
1/17 2/17 3/17
ComEd ElectricDistribution
Formula Rate
4/17
Pepco ElectricDistributionRates - DC
DelmarvaElectric
DistributionRates - DE
DelmarvaElectric
DistributionRates - MD
Exelon Utilities Distribution Rate Case Schedule
5/17 6/17
Note: Based on current schedules of Illinois Commerce Commission, Maryland Public Service Commission, DC Public Service Commission and Delaware Public Service Commission and aresubject to change
Delmarva GasDistributionRates - DE
RebuttalTestimony
Jan 11
EvidentiaryHearingsMar 7-9
RebuttalTestimony
Due Feb 10
EvidentiaryHearingsApr 5-7
CommissionOrder
ExpectedFeb 17
RebuttalTestimony
Feb 1
EvidentiaryHearings
Mar 15-21
Final ReplyBriefs Apr
24
2017 FRUFiling
Mid-April
7/17
CommissionOrder
ExpectedJuly 25
RebuttalTestimoryMid-July

31 Q4 2016 Earnings Release Slides
Adjusted O&M – Q3 2016 ($M)(1,2) Adjusted O&M - Q4 2016 ($M)(2)
4,1754,1754,2504,575-3.0%
2020E2019E2018E2017E
Capital and O&M now reflect reversal of IL plant closures and addition of FitzPatrick(1) O&M and capital reflect the retirement of Clinton and Quad Cities and does not include cost of FitzPatrick acquisition(2) Refer to slide 77 in the appendix for a reconciliation of adjusted {non-GAAP) O&M to GAAP O&M(3) Capital spend represents cash CapEx with CENG at 100% and excludes merger commitments(4) Incremental CapEx impact of nuclear reversals and adding FitzPatrick for 2017, 2018, 2019, and 2020 at Q4 is $250M, $300M, $225M, and $275M, respectively
ExGen O&M and Capex vs. Previous Disclosure
900 875 800 775
875 825 800 700
825
2020E
1,575100
2019E
1,700100
2018E
1,800100
2017E
2,600
BaseNuclear FuelCommitted Growth
1,050 1,000 925 875
950 900 925 850
850
2020E
1,850125
2019E
1,975125
2018E
2,075175
2017E
2,850Capex - Analyst Day ($M)(1,3) Capex - Q4 2016 ($M)(3,4)
4,525 4,200 4,150 4,150
2020E
-0.5%
4,775625
2019E
4,725575
2018E
4,725525
2017E
4,850325
Adjusted Operating O&MReversals + FitzPatrick

32 Q4 2016 Earnings Release Slides
2016-2020 Exelon Generation Free Cash Flow and Uses of CashAnalyst Day(1) ($B)
($2.7 - $3.2)
ExGen/HoldCoDebt Reduction
($2.7 - $3.2)
Utility InvestmentCommittedExGen Growth
CapEx
(~$2.3)
CumulativeExGen FCF
2016-2020(2)
~$8.2
Redeploying Exelon Generation’s free cash flow to maximize shareholder value
Q4 2016(1) ($B)
ExGen/HoldCoDebt Reduction
($2.9 - $3.4)
Utility Investment
($3.0 - $3.5)
CommittedExGen Growth
CapEx
(~$2.3)
CumulativeExGen FCF
2016-2020(3)
~$8.7
(1) Free Cash Flow is a non-GAAP Measure. See slide 77 for a reconciliation of free cash flow to the most comparable GAAP measures.(2) Cumulative Free Cash Flow is a midpoint of a range based on June 30, 2016 market prices. It includes sources including change in margin, tax parent benefit, equity investments, and
acquisitions and divestitures.(3) Cumulative Free Cash Flow is a midpoint of a range based on December 31, 2016 market prices. It includes sources including change in margin, tax parent benefit, equity investments, and
acquisitions and divestitures.

33 Q4 2016 Earnings Release Slides
Theoretical Dividend Affordability from Utility less HoldCo(1,2)
Utility less HoldCo payout ratio falling consistently even as dividend grows(1) Chart is illustrative and shows theoretical payout ratio if utilities supported 100% of the external dividend and interest expense at HoldCo. Currently, the utilities have a payout ratio of 70% which
covers the majority of the external dividend and interest expense at HoldCo with ExGen covering the remainder.(2) Board of directors has approved a policy of 2.5% per year dividend increase through 2018. For illustrative purposes only, the chart assumes the dividend continues to increase 2.5% per year
2019 and 2020; this does not signal a change in Board policy at this time. Quarterly dividends are subject to declaration by the board of directors.
75%
79%81%
84%
60%
65%
70%
75%
80%
85%
90%
95%
2020201920182017
Midpoint of Payout Ratio RangeUtility Earnings Payout Ratio (less HoldCo)

34 Q4 2016 Earnings Release Slides
Adjusted O&M Forecast• 2017 forecast of $8.5B(1)
• Expect CAGR of ~0.5% for 2016-2020
(1) All amounts rounded to the nearest $25M(2) Refer to the Appendix for a reconciliation of adjusted (non-GAAP) O&M to GAAP O&M. The Utilities adjusted O&M excludes regulatory O&M costs that are P&L neutral. ExGen adjusted O&M
excludes direct cost of sales for certain Constellation businesses, P&L neutral decommissioning costs and the impact from O&M related to variable interest entities.(3) PHI Adjusted Operating O&M represents full year of spend
$4,850
$1,275
$775
$975
$725
$4,575
$1,300
$725
$975
$725
HoldCoHoldCo2016 Actual
$8,200
-$100 -$125
ExGen
PECO
PHI(2)
ExGen
PECO
ComEd
BGEBGE
ComEd
PHI
2017 Guidance
$8,475
Key Year-over-Year Drivers(2)
• Nuclear Reversals + FitzPatrick: $225• Nuclear Outages: $75M• PECO & BGE Storm Costs: $25M• Utility Bad Debt Costs: $25M• AMI Write-offs: ($75M)• EIMA Program Ramp-Down: ($25M)

35 Q4 2016 Earnings Release Slides
2017 Projected Sources and Uses of Cash
Consistent and reliable free cash flows Enable growth & value creationSupported by a strong balance sheet
Strong balance sheet enables flexibility toraise and deploy capital for growth
ExGen plans to issue $0.8B of long-termdebt to fund dividend to parent to supportLKE
Operational excellence and financialdiscipline drives free cash flow reliability
Generating $4.7B of free cash flow,including $1.6B at ExGen and $3.2B at theUtilities
Creating value for customers,communities and shareholders
Investing $6.1B, with $5.3B at the Utilitiesand $0.9B at ExGen
($ in millions) (1) BGE ComEd PECO PHITotal
UtilitiesExGen Corp(9) Exelon
2017ECash
Balance
Beginning Cash Balance(2) 1,025
Adjusted Cash Flow from Operations(3,4) 725 600 725 1,125 3,150 3,625 50 6,825
Base CapEx and Nuclear Fuel(5) 0 0 0 0 0 (2,050) (50) (2,125)Free Cash Flow 725 600 725 1,125 3,150 1,550 0 4,725
Debt Issuances 0 1,050 325 200 1,575 750 1,150 3,475Debt Retirements 0 (425) 0 (150) (550) (700) (1,700) (2,950)Project Financing n/a n/a n/a n/a n/a 275 n/a 275Equity Issuance/Share Buyback 0 0 0 0 0 0 1,150 1,150Contribution from Parent 150 700 0 775 1,625 0 (1,625) 0Other Financing(6) 225 650 150 (450) 575 150 525 1,250
Financing 400 1,975 475 375 3,225 475 (500) 3,175Total Free Cash Flow and Financing 1,125 2,575 1,200 1,500 6,400 2,025 (525) 7,900
Utility Investment (925) (2,200) (775) (1,375) (5,250) 0 0 (5,250)ExGen Growth(5,7) 0 0 0 0 0 (850) 0 (850)Acquisitions and Divestitures 0 0 0 0 0 50 0 50Equity Investments 0 0 0 0 0 (50) 0 (50)
Dividend(8) 0 0 0 0 0 0 (1,225) (1,225)Other CapEx and Dividend (925) (2,200) (775) (1,375) (5,250) (875) (1,225) (7,350)Total Cash Flow 200 400 425 125 1,150 1,150 (1,750) 550Ending Cash Balance(2) 1,575
(1) All amounts rounded to the nearest $25M.Figures may not add due to rounding.
(2) Gross of posted counterparty collateral(3) Excludes counterparty collateral activity(4) Adjusted Cash Flow from Operations (non-
GAAP) primarily includes net cash flows fromoperating activities and net cash flows frominvesting activities excluding capitalexpenditures, net M&A, and equityinvestments. Please refer to slide 76 forreconciliations to GAAP cash flow measures.
(5) Figures reflect cash CapEx and CENG fleet at100%
(6) Other Financing includes expected changesin short-term debt, money pool borrowings,tax sharing from the parent, debt issuecosts, CENG borrowing from Sumitomo, taxequity cash flows, capital leases, and CENGtax distributions to EDF
(7) ExGen Growth CapEx includes Phoenix, WestMedway, AGE, Nuclear relicensing, NuclearUprates, and Retail Solar
(8) Dividends are subject to declaration by theBoard of Directors.
(9) Includes cash flow activity from HoldingCompany, eliminations, and other corporateentities

36 Q4 2016 Earnings Release Slides
Exelon Debt Maturity Profile
Note: ExCorp debt includes $1,150M mandatory convertible units remarketing in 2017; ExGen debt includes legacy CEG debt; excludes securitized debt and non-recourse debt
As of 12/31/16
($M)
Exelon’s weighted average LTD maturity is approximately 13 years
500
1,189
910 800 833
500
850 763
295 175
1,430
675 700 600
1,200
650
1,225
700
700
623
2,262
523
900
350
788
300
807
750
750
185312
465
1,594
258
833
741
900
1,700
20322030 2031
78
20292027
10 16
2028
53
2034 2035 2036 2037 20392038 2040202320212019 20222020 202520182017 2024
81
2026 2033 2041 2042 2043 2044 2045 2046
EXC RegulatedExCorp ExGen PHI Holdco

37 Q4 2016 Earnings Release Slides
• Discount rates changes of +/- 50 bps result in -/+ $65M - $85M change in pension and OPEB combined2015 expense (EPS impact of ~$0.05)
Pension and OPEB Contributions and Expense
2016(1) 2017
(in $M) Pre-Tax Expense(2) Contributions Pre-Tax Expense(2) Contributions
Qualified Pension(3,4,5) $410 $310 $435 $310
Non-QualifiedPension 20 35 20 25
OPEB(4,5) 5 50 (5) 45
Total $435 $395 $450 $380
(1) PHI expense is included for the post-merger period (March 24 - December 31, 2016)(2) Pension and OPEB expenses assume a 30% and 27% capitalization rate for 2016 and 2017, respectively(3) The Balanced Funding Strategy for the Qualified Plans provides pension funding of the greater of $250M or minimum required contributions plus amounts required to avoid benefit
restrictions and at-risk status for the legacy Exelon plans. PHI qualified plan contributions are $60M.(4) Expected return on assets for pension is 7.00% and for OPEB is 6.70%(5) Pension and OPEB discount rates are 4.29% for legacy Exelon plans and ~4% for PHI for 2016. Discount rates are 4.04% and ~4.11% for Exelon and PHI, respectively, for 2017.

38 Q4 2016 Earnings Release Slides
Pension and OPEB – Funded Status and Performance
• Based on estimates from Goldman Sachs, the aggregate funded status for pension plans in S&P 500 companiesis 82% at the end of 2016
• Exelon is funded status for funding purposes (PPA) is significantly higher than PBO/GAAP funded status, whichresults in no required material pension contributions over the LRP period
(1.2)
(0.5)
(0.6)(4.3)
(3.4)
December31, 2016FundedStatus
AssetInvestment
Returns7.3%
1.1
Contribution
0.3
PHI UnfundedPension at
merger close
DiscountRate
4.05%from
4.29%
Interest,Service &
Other Costs
December31, 2015FundedStatus
81% Funded
80% Funded
(4.5)
2.6
(1.9)
Assets DeficitLiabilities
Pension 2016 Funded Status (PBO) Comparison ($B) OPEB Funded StatusDecember 31, 2016 ($B)
58% Funded

39 Q4 2016 Earnings Release Slides
EPS Sensitivities
(1) Based on December 31, 2016 market conditions and hedged position. Gas price sensitivities are based on an assumed gas-power relationship derived from an internal model that isupdated periodically. Power price sensitivities are derived by adjusting the power price assumption while keeping all other price inputs constant. Due to correlation of the variousassumptions, the EPS impact calculated by aggregating individual sensitivities may not be equal to the EPS impact calculated when correlations between the various assumptions are alsoconsidered.
(2) Represents adjusted (non-GAAP) operating earnings. Refer to slide 72 for a list of adjustments from GAAP EPS to adjusted (non-GAAP) operating earnings.
2017 2018 2019
Henry Hub Natural Gas+$1/MMBtu $0.02 $0.16 $0.22-$1/MMBtu $0.02 ($0.14) ($0.20)
NiHub ATC Energy Price+$5/MWh $0.03 $0.16 $0.23-$5/MWh ($0.03) ($0.16) ($0.23)
PJM-W ATC Energy Price+$5/MWh $0.00 $0.05 $0.12-$5/MWh $0.00 ($0.06) ($0.12)
30 Year Treasury Rate+50 basis points $0.02 $0.02 $0.03-50 basis points ($0.02) ($0.02) ($0.03)
Share Count (millions) 949 968 972
Effective Tax Rate ~34% ~34% ~33%
Com
EdEP
SIm
pact
ExG
en E
PS Im
pact
(1,2
)

40 Q4 2016 Earnings Release Slides
Historical Nuclear Capital Investment
625 625 650 575 575 600 550675 650 625 600
250 325 250
175175
150
175100
25
-0.5%
2020E
600
2019E
625
2018E
67525
2017E
775
7525
2016A
650
7525
2015A
925
2014A
850
2013A
800
25
25
2012A
975
25
50
2011A
1,00050
2010A
900
Significant historical investments have mitigatedasset management issues and prepared sites forlicense extensions already received, reducingfuture capital needs. In addition, internal costinitiatives have found more cost efficientsolutions to large CapEx spend, such as leveringreverse engineering replacements rather thanlarge system wide modifications, resulting inbaseline CAGR of -0.5%, even with net addition of3 sites.
(1) Reflects accrual capital expenditures with CENG at 50% ownership. Assumes Oyster Creek retirement by end of 2019. All numbers rounded to $25M. (2) Baseline includes ownership share ofSalem all years. CENG is included at ownership share starting in 2014 (full year) (3) FitzPatrick included starting in 2017 (9 months only) (4) Growth represents capital that increases thecapacity of the units (e.g., turbine upgrades, power uprates), and capital that extends the license of a site (e.g., License Renewals) (5) Includes CENG beginning in April 2014, excludes Salem andFort Calhoun (6) 2016 industry average excluding Exelon was not available at time of publication
Nuclear Baseline (excluding Fuel) (2,3,5)
Fukushima
Growth(4)
Cancelled GrowthNuclear Baseline CAGR
94.6%93.7%94.3%94.1%92.7%93.3%93.9%
90.0%89.2%89.3%
84.6%
85.3%87.6%
2015 2016(6)2014201320122010 2011
Industry Average Exelon
Nuclear Non-Fuel Capital Expenditures(1) ($M)
Nuclear Capacity Factor(5)

41 Q4 2016 Earnings Release Slides
Exelon Generation Disclosures
December 31, 2016

42 Q4 2016 Earnings Release Slides
Portfolio Management Strategy
Protect Balance Sheet Ensure Earnings Stability Create Value
Strategic Policy Alignment
•Aligns hedging program withfinancial policies and financialoutlook•Establish minimum hedge targets
to meet financial objectives of thecompany (dividend, credit rating)
•Hedge enough commodity risk tomeet future cash requirementsunder a stress scenario
Three-Year Ratable Hedging
•Ensure stability in near-term cashflows and earnings•Disciplined approach to hedging•Tenor aligns with customer
preferences and market liquidity•Multiple channels to market that
allow us to maximize margins•Large open position in outer years
to benefit from price upside
Bull / Bear Program
•Ability to exercise fundamentalmarket views to create value withinthe ratable framework•Modified timing of hedges versus
purely ratable•Cross-commodity hedging (heat
rate positions, options, etc.)•Delivery locations, regional and
zonal spread relationships
Exercising Market Views
% H
edge
d
Purely ratable
Actual hedge %
Market views on timing, productallocation and regional spreads
reflected in actual hedge %
High End of Profit
Low End of Profit
% Hedged
Open Generationwith LT Contracts
Portfolio Management &Optimization
Portfolio Management Over TimeAlign Hedging & Financials
Establishing Minimum Hedge Targets
Credit RatingCredit Rating
Capital &Operating
Expenditure
Capital &Operating
ExpenditureDividendDividend
CapitalStructureCapital
Structure

43 Q4 2016 Earnings Release Slides
Components of Gross Margin Categories
Open GrossMargin
•Generation GrossMargin at currentmarket prices,including ancillaryrevenues, nuclearfuel amortizationand fossils fuelsexpense
•Power PurchaseAgreement (PPA)Costs andRevenues
•Provided at aconsolidated levelfor all regions(includes hedgedgross margin forSouth, West andCanada(1))
Capacity and ZECRevenues
•Expected capacityrevenues forgeneration ofelectricity
•Expectedrevenues fromZero EmissionsCredits (ZEC)
MtM ofHedges(2)
•Mark-to-Market(MtM) of power,capacity andancillary hedges,including crosscommodity, retailand wholesaleload transactions
•Provided directlyat a consolidatedlevel for five majorregions. Providedindirectly for eachof the five majorregions viaEffective RealizedEnergy Price(EREP), referenceprice, hedge %,expectedgeneration
“Power” NewBusiness
•Retail, Wholesaleplanned electricsales
•PortfolioManagement newbusiness
•Mid marketingnew business
“Non Power”Executed
•Retail, Wholesaleexecuted gas sales
•EnergyEfficiency(4)
•BGE Home(4)
•Distributed Solar
“Non Power”New Business
•Retail, Wholesaleplanned gas sales
•EnergyEfficiency(4)
•BGE Home(4)
•Distributed Solar•PortfolioManagement /origination fuelsnew business
•Proprietarytrading(3)
Margins move from new business toMtM of hedges over the course of the
year as sales are executed(5)
Margins move from “Non power newbusiness” to “Non power executed” over
the course of the year
Gross margin linked to power production and sales Gross margin fromother business activities
(1) Hedged gross margins for South, West & Canada region will be included with Open Gross Margin; no expected generation, hedge %, EREP or reference prices provided for this region(2) MtM of hedges provided directly for the five larger regions; MtM of hedges is not provided directly at the regional level but can be easily estimated using EREP, reference price and hedged MWh(3) Proprietary trading gross margins will generally remain within “Non Power” New Business category and only move to “Non Power” Executed category upon management discretion(4) Gross margin for these businesses are net of direct “cost of sales”(5) Margins for South, West & Canada regions and optimization of fuel and PPA activities captured in Open Gross Margin

44 Q4 2016 Earnings Release Slides
ExGen Disclosures
1) Gross margin categories rounded to nearest $50M2) Total Gross Margin (Non-GAAP) is defined as operating revenues less purchased power and
fuel expense, excluding revenue related to decommissioning, gross receipts tax, ExelonNuclear Partners, operating services agreement with Fort Calhoun and variable interestentities. Total Gross Margin is also net of direct cost of sales for certain Constellation andPower businesses. See Slide 50 for a Non-GAAP to GAAP reconciliation of Total GrossMargin.
3) Excludes EDF’s equity ownership share of the CENG Joint Venture
4) Mark-to-Market of Hedges assumes mid-point of hedge percentages5) Based on December 31, 2016 market conditions6) Reflects Oyster Creek retirement in December 2019
Gross Margin Category ($M) (1) 2017 2018 2019 2017 2018 2019
Open Gross Margin(3)
(including South, West, Canada hedged gross margin)$4,100 $4,200 $4,050 $3,800 $3,650 $3,600 $300 $550 $450
Capacity and ZEC Revenues(3) $1,850 $2,250 $2,050 $1,450 $1,700 $1,450 $400 $550 $600
Mark-to-Market of Hedges(3,4) $1,200 $450 $350 $1,200 $500 $300 - $(50) $50
Power New Business / To Go $550 $900 $950 $600 $900 $950 $(50) - -
Non-Power Margins Executed $200 $100 $50 $150 $100 $50 $50 - -
Non-Power New Business / To Go $250 $400 $450 $300 $400 $450 $(50) - -
Total Gross Margin(2,5,6) $8,150 $8,300 $7,900 $7,500 $7,250 $6,800 $650 $1,050 $1,100
Reference Prices(5) 2017 2018 2019
Henry Hub Natural Gas ($/MMbtu) $3.63 $3.14 $2.87Midwest: NiHub ATC prices ($/MWh) $28.95 $27.76 $26.76Mid-Atlantic: PJM-W ATC prices ($/MWh) $33.26 $32.02 $30.32ERCOT-N ATC Spark Spread ($/MWh)HSC Gas, 7.2HR, $2.50 VOM
$2.51 $2.48 $2.73
New York: NY Zone A ($/MWh) $30.93 $30.63 $30.37New England: Mass Hub ATC Spark Spread($/MWh)ALQN Gas, 7.5HR, $0.50 VOM
$5.68 $5.93 $5.03
Change from Sep 30,2016
September 30, 2016December 31, 2016

45 Q4 2016 Earnings Release Slides
ExGen Disclosures
1) Gross margin categories rounded to nearest $50M2) Total Gross Margin (Non-GAAP) is defined as operating revenues less purchased power and
fuel expense, excluding revenue related to decommissioning, gross receipts tax, ExelonNuclear Partners, operating services agreement with Fort Calhoun and variable interestentities. Total Gross Margin is also net of direct cost of sales for certain Constellation andPower businesses. See Slide 50 for a Non-GAAP to GAAP reconciliation of Total GrossMargin.
3) Excludes EDF’s equity ownership share of the CENG Joint Venture
4) Mark-to-Market of Hedges assumes mid-point of hedge percentages5) Based on December 31, 2016 market conditions6) Reflects Oyster Creek retirement in December 2019
Gross Margin Category ($M) (1) 2017 2018 2019 2017 2018 2019
Open Gross Margin(3)
(including South, West, Canada hedged gross margin)$5,250 $5,350 $5,050 $3,800 $3,650 $3,600
Capacity and ZEC Revenues(3) $0 $0 $0 $1,450 $1,700 $1,450
Mark-to-Market of Hedges(3,4) $1,200 $500 $300 $1,200 $500 $300
Power New Business / To Go $600 $900 $950 $600 $900 $950
Non-Power Margins Executed $150 $100 $50 $150 $100 $50
Non-Power New Business / To Go $300 $400 $450 $300 $400 $450
Total Gross Margin(2,5,6) $7,500 $7,250 $6,800 $7,500 $7,250 $6,800
New FormatSeptember 30, 2016
Previous FormatSeptember 30, 2016

46 Q4 2016 Earnings Release Slides
ExGen Disclosures
(1) Expected generation is the volume of energy that best represents our commodity position in energy markets from owned or contracted for capacity based upon a simulated dispatch model that makes assumptionsregarding future market conditions, which are calibrated to market quotes for power, fuel, load following products, and options. Expected generation assumes 15 refueling outages in 2017, 15 in 2018, and 12 in 2019at Exelon-operated nuclear plants and Salem. Expected generation assumes capacity factors of 93.4%, 93.3% and 94.5% in 2017, 2018, and 2019, respectively at Exelon-operated nuclear plants, at ownership. Theseestimates of expected generation in 2018 and 2019 do not represent guidance or a forecast of future results as Exelon has not completed its planning or optimization processes for those years.
(2) Excludes EDF’s equity ownership share of CENG Joint Venture(3) Percent of expected generation hedged is the amount of equivalent sales divided by expected generation. Includes all hedging products, such as wholesale and retail sales of power, options and swaps.(4) Effective realized energy price is representative of an all-in hedged price, on a per MWh basis, at which expected generation has been hedged. It is developed by considering the energy revenues and costs associated
with our hedges and by considering the fossil fuel that has been purchased to lock in margin. It excludes uranium costs, RPM capacity and ZEC revenues, but includes the mark-to-market value of capacity contracted atprices other than RPM clearing prices including our load obligations. It can be compared with the reference prices used to calculate open gross margin in order to determine the mark-to-market value of ExelonGeneration's energy hedges.
(5) Spark spreads shown for ERCOT and New England(6) Reflects Oyster Creek retirement in December 2019
Generation and Hedges 2017 2018 2019
Exp. Gen (GWh)(1) 204,800 208,300 211,700Midwest 95,400 95,900 96,900
Mid-Atlantic(2,6) 60,200 60,300 60,000ERCOT 23,000 28,100 29,100
New York(2) 14,500 15,400 16,600New England 11,700 8,600 9,100
% of Expected Generation Hedged(3) 91%-94% 56%-59% 28%-31%Midwest 88%-91% 47%-50% 21%-24%
Mid-Atlantic(2,6) 98%-101% 67%-70% 37%-40%ERCOT 85%-88% 60%-63% 32%-35%
New York(2) 92%-95% 51%-54% 34%-37%New England 97%-100% 66%-69% 33%-36%
Effective Realized Energy Price ($/MWh)(4)
Midwest $32.00 $30.00 $29.50
Mid-Atlantic(2,6) $43.50 $38.50 $40.00
ERCOT(5) $6.50 $4.50 $3.50
New York(2) $42.00 $35.00 $31.50
New England(5) $15.00 $6.50 $6.50

47 Q4 2016 Earnings Release Slides
ExGen Hedged Gross Margin Sensitivities
(1) Based on December 31, 2016 market conditions and hedged position; gas price sensitivities are based on an assumed gas-power relationship derived from an internal model that isupdated periodically; power price sensitivities are derived by adjusting the power price assumption while keeping all other prices inputs constant; due to correlation of the variousassumptions, the hedged gross margin impact calculated by aggregating individual sensitivities may not be equal to the hedged gross margin impact calculated when correlations betweenthe various assumptions are also considered; sensitivities based on commodity exposure which includes open generation and all committed transactions; excludes EDF’s equity share ofCENG Joint Venture. Total Gross Margin (Non-GAAP) is defined as operating revenues less purchased power and fuel expense, excluding revenue related to decommissioning, grossreceipts tax, Exelon Nuclear Partners, operating services agreement with Fort Calhoun and variable interest entities. Total Gross Margin is also net of direct cost of sales for certainConstellation and Power businesses. Refer to slide 50 for a reconciliation of Total Gross Margin to the most comparable GAAP measure.
Gross Margin Sensitivities (with Existing Hedges)(1) 2017 2018 2019
Henry Hub Natural Gas ($/Mmbtu)
+ $1/Mmbtu $35 $250 $345- $1/Mmbtu $25 $(225) $(310)
NiHub ATC Energy Price
+ $5/MWh $45 $250 $360- $5/MWh $(45) $(245) $(360)
PJM-W ATC Energy Price
+ $5/MWh $5 $85 $195- $5/MWh $5 $(90) $(185)
NYPP Zone A ATC Energy Price
+ $5/MWh $5 $40 $50- $5/MWh $(10) $(35) $(50)
Nuclear Capacity Factor
+/- 1% +/- $40 +/- $40 +/- $35

48 Q4 2016 Earnings Release Slides
ExGen Hedged Gross Margin Upside/Risk
6,000
6,500
7,000
7,500
8,000
8,500
9,000
9,500
10,000
2017 2018 2019
Appr
oxim
ate
Gro
ss M
argi
n ($
mill
ion)
(1,2
,3,4
)
$8,500
$7,850
$9,250
$7,500
(1) Represents an approximate range of expected gross margin, taking into account hedges in place, between the 5th and 95th percent confidence levels assuming all unhedged supply is soldinto the spot market; approximate gross margin ranges are based upon an internal simulation model and are subject to change based upon market inputs, future transactions and potentialmodeling changes; these ranges of approximate gross margin in 2018 and 2019 do not represent earnings guidance or a forecast of future results as Exelon has not completed its planningor optimization processes for those years; the price distributions that generate this range are calibrated to market quotes for power, fuel, load following products, and options as ofDecember 31, 2016.
(2) Gross Margin Upside/Risk based on commodity exposure which includes open generation and all committed transactions(3) Gross Margin (Non-GAAP) is defined as operating revenues less purchased power and fuel expense, excluding revenue related to decommissioning, gross receipts tax, Exelon Nuclear
Partners, operating services agreement with Fort Calhoun and variable interest entities. Total Gross Margin is also net of direct cost of sales for certain Constellation and Power businesses.Excludes EDF’s equity ownership share of the CENG Joint Venture. Refer to slide 50 for a reconciliation of Total Gross Margin to the most comparable GAAP measure.
(4) Reflects Oyster Creek retirement in December 2019
$6,700
$9,500

49 Q4 2016 Earnings Release Slides
Row Item Midwest Mid-Atlantic ERCOT New York New EnglandSouth, West &
Canada
(A) Start with fleet-wide open gross margin
(B) Capacity and ZEC
(C) Expected Generation (TWh) 95.9 60.3 28.1 15.4 8.6
(D) Hedge % (assuming mid-point of range) 48.5% 68.5% 61.5% 52.5% 67.5%
(E=C*D) Hedged Volume (TWh) 46.5 41.3 17.3 8.1 5.8
(F) Effective Realized Energy Price ($/MWh) $30.00 $38.50 $4.50 $35.00 $6.50
(G) Reference Price ($/MWh) $27.76 $32.02 $2.48 $30.63 $5.93
(H=F-G) Difference ($/MWh) $2.24 $6.48 $2.02 $4.37 $0.57
(I=E*H) Mark-to-market value of hedges ($ million)(1) $105 $270 $35 $35 $5
(J=A+B+I) Hedged Gross Margin ($ million)
(K) Power New Business / To Go ($ million)
(L) Non-Power Margins Executed ($ million)
(M) Non-Power New Business / To Go ($ million)(N=J+K+L+M) Total Gross Margin(2)
$100
$400
$8,300 million
$4.2 billion
$6,900
$900
$2.25 billion
Illustrative Example of Modeling Exelon Generation2018 Gross Margin
(1) Mark-to-market rounded to the nearest $5 million(2) Total Gross Margin (Non-GAAP) is defined as operating revenues less purchased power and fuel expense, excluding revenue related to decommissioning, gross receipts tax, Exelon Nuclear
Partners operating services agreement with Fort Calhoun and variable interest entities. Total Gross Margin is also net of direct cost of sales for certain Constellation and Power businesses.Refer to slide 50 for a reconciliation of Total Gross Margin to the most comparable GAAP measure.

50 Q4 2016 Earnings Release Slides
Additional ExGen Modeling DataTotal Gross Margin Reconciliation (in $M)(1) 2017 2018 2019
Revenue Net of Purchased Power and Fuel Expense(2,3) $8,850 $8,975 $8,575
Non-cash amortization of intangible assets, net, related tocommodity contracts recorded at fair value at merger date $50 - -
Other Revenues(4) $(350) $(275) $(275)
Direct cost of sales incurred to generate revenues for certainConstellation and Power businesses(5) $(400) $(400) $(400)
Total Gross Margin (Non-GAAP) $8,150 $8,300 $7,900
(1) All amounts rounded to the nearest $25M(2) Revenue net of purchased power and fuel expense (RNF), a non-GAAP measure, is calculated as the GAAP measure of operating revenue less the GAAP measure of purchased power and fuel
expense. ExGen does not forecast the GAAP components of RNF separately, as to do so would be unduly burdensome. RNF also includes the RNF of our proportionate ownership share of CENG.(3) Excludes the Mark-to-Market impact of economic hedging activities due to the volatility and unpredictability of the future changes to power prices(4) Other revenues reflects revenues from operating services agreement with Fort Calhoun, variable interest entities, funds collected through revenues for decommissioning the former PECO nuclear
plants through regulated rates and gross receipts tax revenues(5) Reflects the cost of sales of certain Constellation businesses of Generation(6) ExGen amounts for O&M, TOTI, Depreciation & Amortization; excludes EDF’s equity ownership share of the CENG Joint Venture(7) ExGen adjusted O&M excludes direct cost of sales for certain Constellation business, P&L neutral decommissioning costs and the impact from O&M related to variable interest entities. Refer to slide
75 for a reconciliation of adjusted (non-GAAP) O&M to GAAP O&M.(8) TOTI excludes gross receipts tax of $100M(9) Interest expense includes impact of reduced capitalized interest due to Texas CCGT plants going into service in May and June of 2017. Capitalized interest will be an additional ~$25M lower in
2018 as well due to this.
Key ExGen Modeling Inputs (in $M)(1,6) 2017
Other Revenues (excluding Gross Receipts Tax)(4) $200
Adjusted O&M(7) $(4,850)
Taxes Other Than Income (TOTI)(8) $(375)
Depreciation & Amortization $(1,150)
Interest Expense(9) $(425)
Effective Tax Rate 32.0%

51 Q4 2016 Earnings Release Slides
2016A Earnings Waterfalls

52 Q4 2016 Earnings Release Slides
FY Adjusted Operating Earnings Waterfall (1,2)
$0.08
$0.05
$0.25
$2.68
$2.49
2016Corp
($0.06)
PHIBGE
$0.00
PECOComEdExGen
($0.13)
2015
($0.08) D&A($0.05) Share differential($0.04) Taxes, primarily DPAD & ILApportionment($0.02) Nuclear decommissioningtrust fund gains($0.01) Other$0.05 Nuclear outages$0.02 Pension & Fringe Benefits
$0.06 Distribution &Transmission Investment$0.03 Weather($0.01) ROE (US Treasuries)
$0.08 Increased rates($0.01) O&M(Vegetation/Other)($0.01) Weather($0.01) D&A
$0.05 Increased Distributionand Transmission rates($0.04) Rate casedisallowances($0.01) Storms
(1) Refer to the Earnings Release Attachments for additional details and to the Appendix for a reconciliation of adjusted (non-GAAP) operating EPS to GAAP EPS(2) Amounts may not add due to rounding

53 Q4 2016 Earnings Release Slides
Q4 Adjusted Operating Earnings Waterfall (1,2)
$0.03
$0.05
$0.02$0.38
$0.44
Q4 2016Corp
($0.04)
PHIBGEPECO
$0.01
ComEd
$0.00
ExGenQ4 2015
$0.05 Nuclear outages (inc. Salem)($0.01) Lower Realized Energy Pricing($0.01) D&A($0.01) Nuclear decommissioning trustfund gains
$0.02 Weather$0.01 Increase Rates($0.01) Bad debtexpense($0.01) Other
$0.02 Baltimore City Conduit feesettlement$0.01 Increased Distribution rates
(1) Refer to the Earnings Release Attachments for additional details and to the Appendix for a reconciliation of adjusted (non-GAAP) operating EPS to GAAP EPS(2) Amounts may not add due to rounding

54 Q4 2016 Earnings Release Slides
2017E Earnings Waterfalls

55 Q4 2016 Earnings Release Slides
$0.14$0.57
$0.60 - $0.70$0.01
($0.08)$0.01
2016(1) 2017(4,5)InterestDepreciation &Amortization
O&M(3)RNF(2)
ComEd Adjusted Operating EPS Bridge 2016 to 2017
Note: Drivers add up to mid-point of 2017 adjusted operating EPS range(1) Refer to the Earnings Release Attachments for additional details and to the Appendix for a reconciliation of adjusted (non-GAAP) operating EPS to GAAP EPS(2) Revenue net fuel (RNF) is defined as operating revenues less purchased power and fuel expense(3) O&M excludes regulatory items that are P&L neutral(4) Shares Outstanding (diluted) are 927M in 2016 and 949M in 2017. Refer to slide 72 for a reconciliation of adjusted (non-GAAP) operating EPS guidance to GAAP EPS(5) Guidance assumes an effective tax rate for 2017 of 39.9%.
$0.08 Distribution$0.03 Transmission$0.04 Energy Efficiency$0.02 ROE (US Treasury yields)($0.01) Weather/Load
($0.05) Depreciation &Amortization($0.03) Energy EfficiencyAmortization

56 Q4 2016 Earnings Release Slides
$0.48$0.00
2016(1) RNF(2) 2017(4,5)
$0.40 - $0.50
Depreciation &Amortization
($0.01)($0.02)
O&M(3)
PECO Adjusted Operating EPS Bridge 2016 to 2017
Note: Drivers add up to mid-point of 2017 adjusted operating EPS range(1) Refer to the Earnings Release Attachments for additional details and to the Appendix for a reconciliation of adjusted (non-GAAP) operating EPS to GAAP EPS(2) Revenue net fuel (RNF) is defined as operating revenues less purchased power and fuel expense(3) O&M excludes regulatory items that are P&L neutral(4) Shares Outstanding (diluted) are 927M in 2016 and 949M in 2017. Refer to slide 72 for a reconciliation of adjusted (non-GAAP) operating EPS guidance to GAAP EPS(5) Guidance assumes an effective tax rate for 2017 of 21.8%
($0.01) Inflation($0.01) Storm

57 Q4 2016 Earnings Release Slides
$0.04$0.31 ($0.05)
Other 2017(4,5)O&M(3)
$0.00
RNF(2)2016(1)
$0.25 - $0.35
BGE Adjusted Operating EPS Bridge 2016 to 2017
Note: Drivers add up to mid-point of 2017 adjusted operating EPS range(1) Refer to the Earnings Release Attachments for additional details and to the Appendix for a reconciliation of adjusted (non-GAAP) operating EPS to GAAP EPS(2) Revenue net fuel (RNF) is defined as operating revenues less purchased power and fuel expense(3) O&M excludes regulatory items that are P&L neutral(4) Shares Outstanding (diluted) are 927M in 2016 and 949M in 2017. Refer to slide 72 for a reconciliation of adjusted (non-GAAP) operating EPS guidance to GAAP EPS(5) Guidance assumes an effective tax rate for 2017 of 39.5%
$0.03 Pricing/Mix$0.01 Transmission
$0.04 Rate Case disallowances($0.01) Storm Costs($0.01) Bad Debt($0.01) Baltimore City Conduit Fee($0.01) Other
($0.03) D&A($0.01) TOTI($0.01) Other

58 Q4 2016 Earnings Release Slides
$0.06
$0.11
$0.25
2017(5,6)Other
($0.05)
O&M(4)
($0.01)
RNF(3)Stub PeriodEarnings(2)
2016(1)
$0.30 - $0.40
PHI Adjusted Operating EPS Bridge 2016 to 2017
($0.02) D&A($0.03) Other$0.08 Distribution
$0.03 Transmission
Note: Drivers add up to mid-point of 2017 adjusted operating EPS range(1) Refer to the Earnings Release Attachments for additional details and to the Appendix for a reconciliation of adjusted (non-GAAP) operating EPS to GAAP EPS(2) Stub period earnings reflect earnings prior to merger close date of March 23, 2016(3) Revenue net fuel (RNF) is defined as operating revenues less purchased power and fuel expense(4) O&M excludes regulatory items that are P&L neutral(5) Shares Outstanding (diluted) are 927M in 2016 and 949M in 2017. Refer to slide 72 for a reconciliation of adjusted (non-GAAP) operating EPS guidance to GAAP EPS.(6) Guidance assumes an effective tax rate for 2017 of 35.6%
59 Q4 2016 Earnings Release Slides
$0.16$1.27
2017(5,6)Other
($0.09)
Depreciation &Amortization(4)
($0.07)
O&M(3)
($0.17)
Gross Margin(2)2016(1)
$1.05 - $1.15
ExGen Adjusted Operating EPS Bridge 2016 to 2017
Note: Drivers add up to mid-point of 2017 adjusted operating EPS range.(1) Refer to the Earnings Release Attachments for additional details and to the Appendix for a reconciliation of adjusted (non-GAAP) operating EPS to GAAP EPS(2) Gross Margin (Non-GAAP) is defined as operating revenues less purchased power and fuel expense, excluding revenue related to decommissioning, gross receipts tax, Exelon Nuclear Partners, operating services
agreement with Fort Calhoun and variable interest entities. Total Gross Margin is also net of direct cost of sales for certain Constellation and Power businesses. See Slide 50 for a Non-GAAP to GAAP reconciliation ofTotal Gross Margin.
(3) O&M excludes items that are P&L neutral (including decommissioning costs and variable interest entities) and direct cost of sales for certain Constellation businesses(4) Depreciation & Amortization excludes cost of sales for certain Constellation businesses, which are included in gross margin(5) Shares Outstanding (diluted) are 927M in 2016 and 949M in 2017. Refer to slide 72 for a reconciliation of adjusted (non-GAAP) operating EPS guidance to GAAP EPS.(6) Guidance assumes an effective tax rate for 2017 of 32%
$0.32 NY + IL Legislation, includingFitzPatrick$0.16 Capacity + New Builds($0.29) Unfavorable Market Conditions($0.03) Other
($0.02) FitzPatrick + Clinton + QuadCities($0.03) Power Growth Projects($0.02) Other
($0.13) FitzPatrick + Clinton + QuadCities($0.07) Outages$0.03 Other
($0.05) Interest($0.03) Share Dilution($0.01) Other

60 Q4 2016 Earnings Release Slides
Exelon Utilities Rate Case FilingSummaries

61 Q4 2016 Earnings Release Slides
ComEd April 2016 Distribution Formula Rate
Docket # 16-0259
Filing Year 2015 Calendar Year Actual Costs and 2016 Projected Net Plant Additions are used to set the rates for calendar year2017. Rates currently in effect (docket 15-0287) for calendar year 2016 were based on 2014 actual costs and 2015projected net plant additions.
Reconciliation Year Reconciles Revenue Requirement reflected in rates during 2015 to 2015 Actual Costs Incurred. Revenue requirementfor 2015 is based on docket 14-0312 (2013 actual costs and 2014 projected net plant additions) approved in December2014.
Common Equity Ratio ~46% for both the filing and reconciliation year
ROE 8.64% for the filing year (2015 30-yr Treasury Yield of 2.84% + 580 basis point risk premium) and 8.59% for thereconciliation year (2015 30-yr Treasury Yield of 2.79% + 580 basis point risk premium – 5 basis points performancemetrics penalty). For 2016 and 2017, the actual allowed ROE reflected in net income will ultimately be based on theaverage of the 30-year Treasury Yield during the respective years plus 580 basis point spread, absent any metric penalties
Requested Rate ofReturn
~7% for both the filing and reconciliation years
Rate Base(1) $8,831 million– Filing year (represents projected year-end rate base using 2015 actual plus 2016 projected capitaladditions). 2016 and 2017 earnings will reflect 2016 and 2017 year-end rate base respectively.$7,782 million - Reconciliation year (represents year-end rate base for 2015)
Revenue RequirementIncrease(1)
$127M increase ($7M decrease due to the 2015 reconciliation and collar adjustment offset by a $134M increase relatedto the filing year). The 2015 reconciliation impact on net income was recorded in 2015 as a regulatory asset.
Timeline • 04/13/16 Filing Date• 240 Day Proceeding
The 2016 distribution formula rate filing established the net revenue requirement used to set the rates that took effect in January 2017 after theIllinois Commerce Commission's (ICC’s) review. There are two components to the annual distribution formula rate filing:• Filing Year: Based on 2015 costs and 2016 projected plant additions.• Annual Reconciliation: For 2015, this amount reconciles the revenue requirement reflected in rates in effect during 2015 to the actual costs for
that year. The annual reconciliation impacts cash flow in 2017 but the earnings impact has been recorded in 2015 as a regulatory asset.
Given the retroactive ratemaking provision in the Energy Infrastructure Modernization Act (EIMA) legislation, ComEd net income during theyear will be based on actual costs with a regulatory asset/liability recorded to reflect any under/over recovery reflected in rates. Revenue
Requirement in rate filings impacts cash flow.(1) Amounts represent the approved amounts within the Illinois Commerce Commission’s final order, received on December 6, 2016. The ICC ordered rehearing on one narrow topic that
ComEd expects to result in a further $17.5M reduction to the revenue requirement.

62 Q4 2016 Earnings Release Slides
Pepco MD Electric Distribution Rate Case – Final OrderDocket # 9418
Test Year 2015 Calendar Year
Test Period 12 months actual
Authorized Common Equity Ratio 49.55%
Authorized Rate of Return ROE: 9.55%; ROR: 7.49%
Authorized Rate Base Rate Base: $1.64B
Authorized Revenue Requirement Increase Revenue Increase: $52.5M
Revenue increase includes approximately $32.1M of new depreciation andamortization expense.
Residential Total Bill % Increase 4.76%
Notes • Order received on November 15• Advanced Metering (AMI) system deemed cost-beneficial and recovery to
begin• Post-test period AMI costs deferred to new regulatory asset• Legacy meter recovery approved over 10 years with no return• Post-test period reliability capital placed in service through March 2016
approved with some disallowance• Extension of the Grid Resiliency Program in 2017-2018 was not approved

63 Q4 2016 Earnings Release Slides
DPL DE (Electric) Distribution Rate CaseDocket # 16-0649
Test Year 2015 Calendar Year
Test Period 12 months actual
Requested Common Equity Ratio 49.44%
Requested Rate of Return ROE: 10.60%; ROR: 7.19%
Proposed Rate Base (Adjusted) $839M
Requested Revenue Requirement Increase(Updated on January 11, 2017)
$60.2M(1)(2)
Residential Total Bill % Increase 7.25%
Notes • 5/17/16 DPL DE filed application with the DPSC seeking increase in electricdistribution base rates
Intervenor Positions:• Staff $9.5M revenue increase based on 9.20% ROE• Division of the Public Advocate (DPA) $12.9M revenue increase based on
9.00% ROEProcedural Schedule:• Evidentiary Hearings: 3/7/17 – 3/9/17• Commission Order Expected: Q3 2017
(1) As permitted by Delaware law, Delmarva Power implemented interim rate increases of $2.5 million on July 16, 2016, and implementedan incremental $29.6M on December 17, 2016, subject to refund
(2) Revenue requirement includes changes in depreciation and amortization expense, which have no impact on pre-tax earnings

64 Q4 2016 Earnings Release Slides
DPL DE (Gas) Distribution Rate CaseDocket # 16-0650
Test Year 2015 Calendar Year
Test Period 12 months actual
Requested Common Equity Ratio 49.44%
Requested Rate of Return ROE: 10.60%; ROR: 7.19%
Proposed Rate Base (Adjusted) $362M
Requested Revenue Requirement Increase $21.5M(1)(2)
Residential Total Bill % Increase 10.40%
Notes • 5/17/16 DPL DE filed application with the DPSC seeking increase in gasdistribution base rates
Intervenor Positions:• Staff revenue decrease of $3.1M based on 9.20% ROE• Division of the Public Advocate (DPA) revenue decrease of $2.1M based on
9.00% ROEProcedural Schedule:• Evidentiary Hearings: 4/5/17 – 4/7/17• Commission Order Expected: Q3 2017
(1) As permitted by Delaware law, Delmarva Power implemented interim rate increases of $2.5 million on July 16, 2016, and implementedan incremental $10.4M on December 17, 2016, subject to refund
(2) Revenue requirement includes changes in depreciation and amortization expense, which have no impact on pre-tax earnings

65 Q4 2016 Earnings Release Slides
Pepco DC Distribution Rate CaseFormal Case No. 1139
Test Year April 1, 2015 – March 31, 2016
Test Period 12 months actual
Requested Common Equity Ratio 49.14%
Requested Rate of Return ROE: 10.60%; ROR: 8.00%
Proposed Rate Base (Adjusted) $1.7B
Requested Revenue Requirement Increase(Updated on February 1, 2017)
$76.8M(1)
Residential Total Bill % Increase 4.62%(2)
Notes • 6/30/16 Pepco DC filed application with the DCPSC seeking increase in electric distributionbase rates
Intervenor Positions:• Office of the People’s Council (OPC) revenue increase of $20.1M based on 8.60% ROE• Apartment and Office Building Association (AOBA) revenue increase of $62.2M based on
9.25% ROE• Healthcare Council of the National Capital Area (HCNCA) revenue increase of $16.8M based
on 8.75% ROE• District of Columbia Water and Sewer Authority (DC Water) revenue increase of $52.7M based
on 9.10% ROEProcedural Schedule:• Evidentiary Hearings: 3/15/17 – 3/21/17• Final Briefs: 4/24/17• Commission Order Expected: 7/25/17
(1) Revenue requirement includes changes in amortization expense, which has no impact on pre-tax earnings(2) As proposed by the Company, the full allocation of the CBRC to Residential and MMA customers, along with the proposal for a $1M Incremental Offset for residential
customers, will ensure that residential customers do not receive an increase on the distribution portion of their bill until approximately January 2019 (February 2019 forMMA customers). Upon expiration of the CBRC and Incremental Offset proposed by the Company, this rate increase would translate to a 4.62% total bill increase for aresidential customer.

66 Q4 2016 Earnings Release Slides
DPL MD Distribution Rate CaseCase No. 9424 Company’s Filed Position Chief Public Utility Law Judge (CPULJ)
Test Year April 1, 2015 – March 31, 2016
Test Period 12 months actual
Requested Common Equity Ratio 49.1% 49.1%
Requested Rate of Return ROE: 10.60%; ROR: 7.24% ROE: 9.48%; ROR: 6.69%
Proposed Rate Base (Adjusted) $727M $706M
Requested Revenue RequirementIncrease(Updated on October 18, 2016)
$57M $34.1M
Residential Total Bill % Increase 14.5% 6.53%
Notes • 7/20/16 DPL MD filed application with theMDPSC seeking increase in electric distributionbase rates
Intervenor Positions:• Staff revenue increase of $37.4M based on
9.48% ROE• Office of the People’s Council (OPC) revenue
increase of $22.9M based on 8.60% ROE• Intervenors: Staff, OPC, Maryland Energy Group
and Hanover FoodsProcedural Schedule:• CPULJ Proposed Order Received: 1/4/17• Commission Order Expected: 2/17/17
• 1/4/17 the CPULJ issued a proposed order• Advanced Metering (“AMI”) system deemed
cost-beneficial, and recovery to begin• Legacy meter recovery approved over 10 years,
with no return• Post-test period reliability capital placed in
service through September 2016 approved• Extension of the Grid Resiliency Program in
2017-2018 was not approved• The Company filed an appeal on January 18

67 Q4 2016 Earnings Release Slides
Appendix
Reconciliation of Non-GAAPMeasures

68 Q4 2016 Earnings Release Slides
4Q QTD GAAP EPS Reconciliation
NOTE: All amounts shown are per Exelon share and represent contributions to Exelon's EPS. Amounts may not add due to rounding.
Three Months Ended December 31, 2015 ExGen ComEd PECO BGE PHI Other Exelon
2015 GAAP Earnings (Loss) Per Share $0.17 $0.09 $0.09 $0.08 $0.00 $(0.09) $0.33
Unrealized gains related to NDT fund investments (0.05) - - - - - (0.05)
Merger and integration costs - - - - - 0.01 0.01
Amortization of commodity contract intangibles 0.01 - - - - - 0.01
Long-Lived asset impairments 0.01 - - - - - 0.01
Reassessment of state deferred income taxes 0.01 - - - - 0.03 0.05
Reduction in state income tax reserve (0.01) - - - - - (0.01)
PHI merger related redeemable debt exchange - - - - - 0.01 0.01
CENG non-controlling interest 0.02 - - - - - 0.02
2015 Adjusted (non-GAAP) Operating Earnings (Loss) PerShare $0.15 $0.09 $0.09 $0.08 $0.00 $(0.04) $0.38

69 Q4 2016 Earnings Release Slides
4Q QTD GAAP EPS Reconciliation (continued)Three Months Ended December 31, 2016 ExGen ComEd PECO BGE PHI Other Exelon
2016 GAAP (Loss) Earnings Per Share $(0.04) $0.09 $0.10 $0.11 $0.03 $(0.06) $0.22
Mark-to-Market impact of economic hedging activities (0.05) - - - - - (0.05)
Unrealized losses related to NDT fund investments 0.01 - - - - - 0.01
Amortization of commodity contract intangibles 0.03 - - - - - 0.03
Merger and integration costs 0.02 - - - - - 0.02
Reassessment of state deferred income taxes 0.02 - - - - - 0.01
Asset retirement obligation (0.08) - - - - - (0.08)
Merger commitments 0.04 - - - 0.01 (0.01) 0.04
Plant retirements and divestitures 0.10 - - - - - 0.10
Cost management program 0.01 - - - - - 0.01
Curtailment of Generation growth and development activities 0.06 - - - - - 0.06
CENG non-controlling interest 0.07 - - - - - 0.07
2016 Adjusted (non-GAAP) Operating Earnings (Loss) PerShare $0.18 $0.09 $0.10 $0.11 $0.05 $(0.08) $0.44
NOTE: All amounts shown are per Exelon share and represent contributions to Exelon's EPS. Amounts may not add due to rounding.

70 Q4 2016 Earnings Release Slides
4Q YTD GAAP EPS Reconciliation
NOTE: All amounts shown are per Exelon share and represent contributions to Exelon's EPS. Amounts may not add due to rounding.
Twelve Months Ended December 31, 2015 ExGen ComEd PECO BGE PHI Other Exelon
2015 GAAP Earnings (Loss) Per Share $1.54 $0.48 $0.42 $0.31 $0.00 $(0.20) $2.54
Mark-to-Market impact of economic hedging activities (0.18) - - - - - (0.18)
Unrealized losses related to NDT fund investments 0.13 - - - - - 0.13
Merger and integration costs 0.02 0.01 - - - 0.03 0.07
Mark-to-market impact of PHI merger related interest rateswap - - - - - 0.02 0.02
Long-lived asset impairments 0.01 - - - - 0.02 0.02
Asset retirement obligation (0.01) - - - - - (0.01)
Tax settlements (0.06) - - - - - (0.06)
Midwest generation bankruptcy recoveries (0.01) - - - - - (0.01)
PHI merger related redeemable debt exchange - - - - - 0.01 0.01
Reassessment of state deferred income taxes 0.01 - - - - 0.03 0.05
Reduction in state income tax reserve (0.01) - - - - - (0.01)
CENG non-controlling interest (0.04) - - - - - (0.04)
2015 Adjusted (non-GAAP) Operating Earnings (Loss) PerShare $1.40 $0.48 $0.43 $0.31 $0.00 $(0.13) $2.49

71 Q4 2016 Earnings Release Slides
4Q YTD GAAP EPS Reconciliation (continued)Twelve Months Ended December 31, 2016 ExGen ComEd PECO BGE PHI Other Exelon
2016 GAAP Earnings (Loss) Per Share $0.54 $0.41 $0.47 $0.31 ($0.07) ($0.44) $1.22
Mark-to-Market impact of economic hedging activities 0.03 - - - - - 0.03
Unrealized gains related to NDT fund investments (0.13) - - - - - (0.13)
Amortization of commodity contract intangibles 0.04 - - - - - 0.04
Merger and integration costs 0.04 - - - 0.05 0.04 0.12
Long-lived asset impairments 0.11 - - - - - 0.11
Asset retirement obligation (0.08) - - - - - (0.08)
Reassessment of state deferred income taxes 0.02 - - - - (0.01) 0.01
Merger commitments 0.05 - - - 0.27 0.16 0.47
Plant retirements and divestitures 0.47 - - - - - 0.47
Cost management program 0.03 - - - - - 0.04
Like-kind exchange tax position - 0.16 - - - 0.05 0.21
Curtailment of Generation growth and development activities 0.06 - - - - - 0.06
CENG non-controlling interest 0.11 - - - - - 0.11
2016 Adjusted (non-GAAP) Operating Earnings (Loss) PerShare $1.27 $0.57 $0.48 $0.31 $0.25 ($0.20) $2.68
NOTE: All amounts shown are per Exelon share and represent contributions to Exelon's EPS. Amounts may not add due to rounding.

72 Q4 2016 Earnings Release Slides
GAAP to Operating Adjustments
• Exelon’s 2017 adjusted (non-GAAP) operating earnings excludes the earnings effects of the following:− Mark-to-Market adjustments from economic hedging activities− Unrealized gains and losses from NDT fund investments to the extent not offset by contractual
accounting as described in the notes to the consolidated financial statements− Non-cash amortization of intangible assets, net, related to commodity contracts recorded at fair value at
the date of acquisition of Integrys in 2014 and ConEdison Solutions in 2016− Certain costs incurred associated with the PHI acquisition and pending FitzPatrick acquisition− Costs incurred related to a cost management program− Generation’s non-controlling interest related to CENG exclusion items− Other unusual items

73 Q4 2016 Earnings Release Slides
(1) All amounts rounded to the nearest $25M(2) Calculated using S&P Methodology. Due to ring-fencing, S&P deconsolidates BGE from Exelon and analyzes solely as an equity investment.(3) Reflects impact of operating adjustments on GAAP EBITDA. Refer to slide 72 for a list of operating adjustments to GAAP.(4) Includes other adjustments as prescribed by S&P(5) Reflects present value of net capacity purchases(6) Reflects present value of minimum future operating lease payments(7) Reflects after-tax unfunded pension/OPEB(8) Includes non-recourse project debt and mandatory convertible equity units(9) Applies 75% of excess cash against balance of LTD
YE 2017 Exelon FFO Calculation ($M)(1)
GAAP Operating Income $4,400
Depreciation & Amortization $2,875
EBITDA $7,275
+/- Non-operating activities and nonrecurring items(3) $375
- Interest Expense ($1,425)
+ Current Income Tax (Expense)/Benefit ($125)
+ Nuclear Fuel Amortization $1,050
+/- Other S&P FFO Adjustments(4) $425
= FFO (a) $7,575
YE 2017 Exelon Adjusted Debt Calculation ($M)(1)
Long-Term Debt (including current maturities) $32,700
Short-Term Debt $1,875
+ PPA Imputed Debt(5) $350
+ Operating Lease Imputed Debt(6) $850
+ Pension/OPEB Imputed Debt(7) $3,450
- Off-Credit Treatment of Debt(8) ($2,225)
- Surplus Cash Adjustment(9) ($550)
+/- Other S&P FFO Adjustments(4) $300
= Adjusted Debt (b) $36,750
YE 2017 Exelon FFO/Debt(2)
FFO (a)= 21%
Adjusted Debt (b)
GAAP to Non-GAAP Reconciliations

74 Q4 2016 Earnings Release Slides
YE 2017 ExGen Net Debt Calculation ($M)(1)
Long-Term Debt (including current maturities) $9,525
Short-Term Debt $825
- Surplus Cash Adjustment ($375)
= Net Debt (a) $9,975
YE 2017 Book Debt / EBITDA
Net Debt (a)= 3.3x
Operating EBITDA (b)
(1) All amounts rounded to the nearest $25M(2) Reflects impact operating adjustments on GAAP EBITDA. Refer to slide 72 for a list of operating adjustments to GAAP.
YE 2017 ExGen Operating EBITDA Calculation($M)(1)
GAAP Operating Income $1,225
Depreciation & Amortization $1,200
EBITDA $2,425
+/- Non-operating activities and nonrecurring items(2) $600
= Operating EBITDA (b) $3,025
GAAP to Non-GAAP ReconciliationsYE 2017 ExGen Net Debt Calculation ($M)(1)
Long-Term Debt (including current maturities) $9,525
Short-Term Debt $825
- Surplus Cash Adjustment ($375)
- Nonrecourse Debt ($2,550)
= Net Debt (a) $7,425
YE 2017 Recourse Debt / EBITDA
Net Debt (a)= 2.7x
Operating EBITDA (b)
YE 2017 ExGen Operating EBITDA Calculation($M)(1)
GAAP Operating Income $1,225
Depreciation & Amortization $1,200
EBITDA $2,425
+/- Non-operating activities and nonrecurring items(2) $600
- EBITDA from projects financed by nonrecourse debt ($250)
= Operating EBITDA (b) $2,775

75 Q4 2016 Earnings Release Slides
2016 Adjusted O&M Reconciliation ($M)(1) ExGen ComEd PECO BGE PHI(4) Other ExelonGAAP O&M $5,650 $1,525 $800 $725 $1,525 $100 $10,325
Regulatory O&M(2) - (225) (75) - (100) - (400)
Long-lived asset impairment costs (175) - - - - - (175)
Merger commitments and costs to achieve - - - - (475) (200) (675)
Direct cost of sales incurred to generate revenues forcertain Constellation and Power businesses(3) (475) - - - - - (475)
O&M for managed plants that are partially owned (400) - - - - - (400)
Other (25) - - - 25 - -
Adjusted O&M (Non-GAAP) $4,575 $1,300 $725 $725 $975 $(100) $8,200
(1) All amounts rounded to the nearest $25M(2) Reflects earnings neutral O&M(3) Reflects the direct cost of sales of certain Constellation and Power businesses of Generation, which are included in Total Gross Margin(4) All amounts represent full year of spend at PHI
GAAP to Non-GAAP Reconciliations
2017 Adjusted O&M Reconciliation ($M)(1) ExGen ComEd PECO BGE PHI Other ExelonGAAP O&M $5,775 $1,300 $850 $750 $1,100 ($125) $9,650
Regulatory O&M(2) - (25) (75) ($25) (100) - (225)
Decommissioning(2) 25 - - - - - 25
Long-lived asset impairment costs - - - - - - -
Direct cost of sales incurred to generate revenues forcertain Constellation and Power businesses(3) (400) - - - - - (400)
O&M for managed plants that are partially owned (425) - - - - - (425)
Other (125) - - - (25) - (150)
Adjusted O&M (Non-GAAP) $4,850 $1,275 $775 $725 $975 $(125) $8,475

76 Q4 2016 Earnings Release Slides
GAAP to Non-GAAP Reconciliations2017 Adjusted Cash from Ops Calculation ($M)(1) ComEd PECO BGE PHI ExGen Other ExelonNet cash flows provided by operating activities (GAAP) $950 $725 $700 $1,125 $3,475 ($300) $6,650
Other cash from investing activities - - $25 - ($275) - ($250)
Intercompany receivable adjustment ($350) - - - - $350 -
Counterparty collateral activity - - - - $425 - $425
Adjusted Cash Flow from Operations $600 $725 $725 $1,125 $3,625 $50 $6,825
2017 Cash From Financing Calculation ($M)(1) ComEd PECO BGE PHI ExGen Other ExelonNet cash flow provided by financing activities (GAAP) $1,200 $175 $200 $125 ($200) $425 $1,950
Dividends paid on common stock $425 $300 $200 $250 $650 ($575) $1,225
Intercompany receivable adjustment $350 - - - - ($350) -
Financing Cash Flow $1,975 $475 $400 $375 $475 ($500) $3,175
Exelon Total Cash Flow Reconciliation(1) 2017GAAP Beginning Cash Balance $650
Adjustment for Cash Collateral Posted $375
Adjusted Beginning Cash Balance(3) $1,025
Net Change in Cash (GAAP)(2) $550
Adjusted Ending Cash Balance(3) $1,575
Adjustment for Cash Collateral Posted ($800)
GAAP Ending Cash Balance $775
(1) All amounts rounded to the nearest $25M. Items may not sum due to rounding.(2) Represents the GAAP measure of net change in cash, which is the sum of cash flow from operations, cash from investing activities, and cash from financing activities. Figures reflect
cash capital expenditures and CENG fleet at 100%.(3) Adjusted Beginning and Ending cash balances reflect GAAP Beginning and End Cash Balances excluding counterparty collateral activity
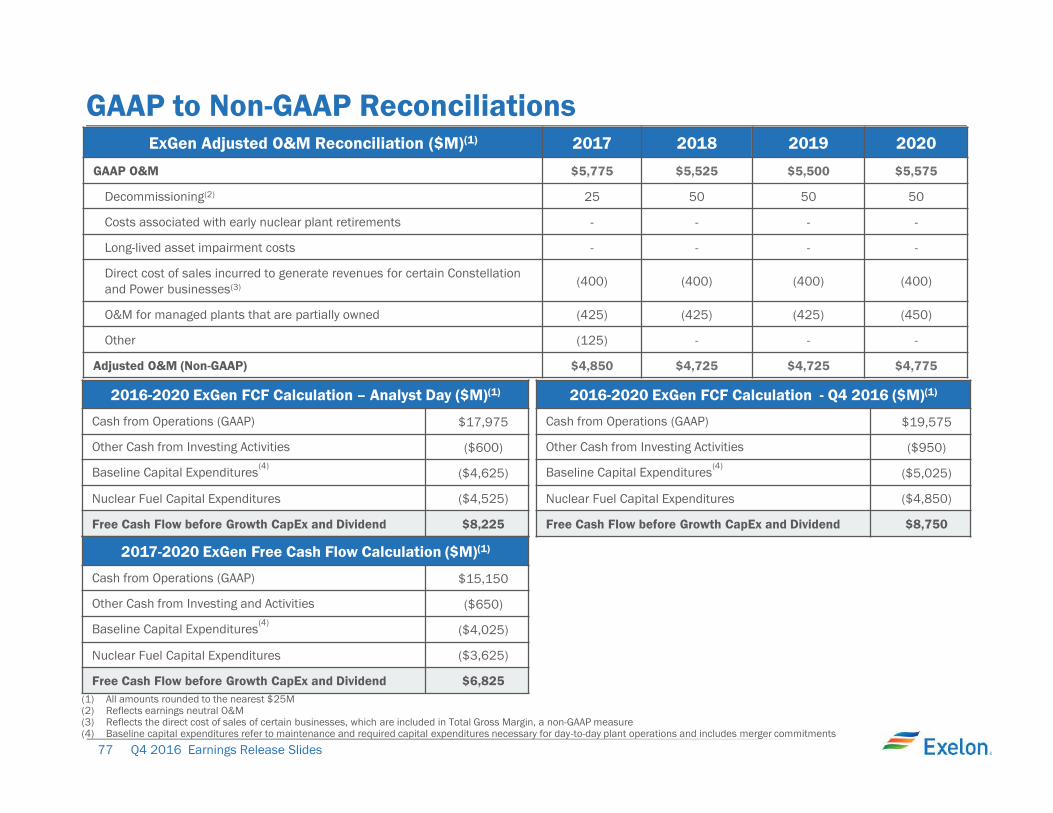
77 Q4 2016 Earnings Release Slides
GAAP to Non-GAAP ReconciliationsExGen Adjusted O&M Reconciliation ($M)(1) 2017 2018 2019 2020
GAAP O&M $5,775 $5,525 $5,500 $5,575
Decommissioning(2) 25 50 50 50
Costs associated with early nuclear plant retirements - - - -
Long-lived asset impairment costs - - - -
Direct cost of sales incurred to generate revenues for certain Constellationand Power businesses(3) (400) (400) (400) (400)
O&M for managed plants that are partially owned (425) (425) (425) (450)
Other (125) - - -
Adjusted O&M (Non-GAAP) $4,850 $4,725 $4,725 $4,775
(1) All amounts rounded to the nearest $25M(2) Reflects earnings neutral O&M(3) Reflects the direct cost of sales of certain businesses, which are included in Total Gross Margin, a non-GAAP measure(4) Baseline capital expenditures refer to maintenance and required capital expenditures necessary for day-to-day plant operations and includes merger commitments
2016-2020 ExGen FCF Calculation – Analyst Day ($M)(1)
Cash from Operations (GAAP) $17,975
Other Cash from Investing Activities ($600)
Baseline Capital Expenditures(4)($4,625)
Nuclear Fuel Capital Expenditures ($4,525)
Free Cash Flow before Growth CapEx and Dividend $8,225
2016-2020 ExGen FCF Calculation - Q4 2016 ($M)(1)
Cash from Operations (GAAP) $19,575
Other Cash from Investing Activities ($950)
Baseline Capital Expenditures(4)($5,025)
Nuclear Fuel Capital Expenditures ($4,850)
Free Cash Flow before Growth CapEx and Dividend $8,750
2017-2020 ExGen Free Cash Flow Calculation ($M)(1)
Cash from Operations (GAAP) $15,150
Other Cash from Investing and Activities ($650)
Baseline Capital Expenditures(4)($4,025)
Nuclear Fuel Capital Expenditures ($3,625)
Free Cash Flow before Growth CapEx and Dividend $6,825

78 Q4 2016 Earnings Release Slides
GAAP to Non-GAAP Reconciliations
(1) ACE, Delmarva, and Pepco represents full year of earnings
Operating ROE Reconciliation(1) ACE Delmarva Pepco LegacyEXC
ConsolidatedEU
Net Income (GAAP)(1)($42) ($9) $42 $1,102 $1,103
Operating exclusions $99 $89 $127 $146 $461
Adjusted Operating Earnings(1)$57 $80 $170 $1,258 $1,564
Average Equity $1,017 $1,282 $2,270 $11,951 $16,523
Operating ROE (Adjusted Operating Earnings/Average Equity) 5.6% 6.3% 7.5% 10.5% 9.5%