Earnings Conference Call 2nd Quarter 2013 - Exelon · This presentation contains certain...
37
Earnings Conference Call 4 th Quarter 2014 February 13 th , 2015
Transcript of Earnings Conference Call 2nd Quarter 2013 - Exelon · This presentation contains certain...

Earnings Conference Call 4th Quarter 2014 February 13th, 2015
1 2014 4Q Earnings Release Slides
Cautionary Statements Regarding Forward-Looking Information This presentation contains certain forward-looking statements within the meaning of the Private Securities Litigation Reform Act of 1995, that are subject to risks and uncertainties. The factors that could cause actual results to differ materially from the forward-looking statements made by Exelon Corporation, Commonwealth Edison Company, PECO Energy Company, Baltimore Gas and Electric Company and Exelon Generation Company, LLC (Registrants) include those factors discussed herein, as well as the items discussed in (1) Exelon’s 2014 Annual Report on Form 10-K (to be filed on February 13, 2015) in (a) ITEM 1A. Risk Factors, (b) ITEM 7. Management’s Discussion and Analysis of Financial Condition and Results of Operations and (c) ITEM 8. Financial Statements and Supplementary Data: Note 22 and (2) other factors discussed in filings with the SEC by the Registrants. Readers are cautioned not to place undue reliance on these forward-looking statements, which apply only as of the date of this presentation. None of the Registrants undertakes any obligation to publicly release any revision to its forward-looking statements to reflect events or circumstances after the date of this presentation.

2 2014 4Q Earnings Release Slides
• Utilities • $3.1 billion invested in technology
and infrastructure • PHI Acquisition
• ExGen • Integrys and ProLiance Acquisitions • Texas CCGTs, Bloom & NetPower
partnership • Added 215 MW of clean generation
• Utilities
• Top decile for safety; top quartile for outage frequency
• ExGen • Nuclear capacity factor over 94%(2) • Power dispatch match nearly 97%
and renewables energy capture of 95%
• ComEd and BGE rate cases: • 3rd consecutive rate case in which
ComEd achieved ≥ 95% of its ask • 1st rate case settlement for BGE
since 1999 • ExGen
• HR 1146 • Capacity Performance Product • EPA’s Clean Power Plan (111(d))
• 2014 adjusted operating results of $2.39/share(1)
• Total shareholder return of 41% • Successful ~$3B billion forward equity
and mandatory convertible offering • $75M in total savings from
consolidation of CENG plants(3) • $675M ExGen Texas Power Financing
2014 In Review
(1) Represents adjusted (non-GAAP) operating EPS. Refer to the Earnings Release Attachments for additional details and to the Appendix for a reconciliation of adjusted (non-GAAP) operating EPS to GAAP EPS.
(2) Exelon operated plants at ownership
(3) Total CapEx and O&M savings from consolidation. Includes EDF’s equity ownership share of the CENG Joint Venture
Operational Excellence
Financial Discipline
Regulatory Advocacy
Growth Investments
• Delivered solid 2014 results at the mid-point of our guidance range

3 2014 4Q Earnings Release Slides
HoldCo
ExGen
ComEd
PECO
BGE
HoldCo
ExGen
ComEd
PECO
BGE
2015 Guidance
$2.25 - $2.55(2)
$1.15 - $1.35
$0.45 - $0.55
$0.35 - $0.45
$0.20 - $0.30
2014 Actual
$2.39(1)
$1.34
$0.47
$0.41
$0.23
2015 Adjusted Operating Earnings Guidance
(1) 2014 results based on 2014 average outstanding shares of 864M. Refer to Earnings Release Attachments for additional details and to the Appendix for a reconciliation of adjusted (non-GAAP) operating EPS to GAAP EPS.
(2) 2015 earnings guidance based on expected average outstanding shares of ~866M. Earnings guidance for OpCos may not add up to consolidated EPS guidance. Refer to the Appendix for a reconciliation of adjusted (non-GAAP) operating EPS guidance to GAAP EPS.
Key Year-Over-Year Drivers
• Total impact of asset divestitures: $(0.12)
• Additional planned nuclear outage $(0.02)
• ExGen Pension/OPEB: $(0.02)
• ComEd: increased capital investments in distribution and transmission partially offset by lower US Treasury Yields: $0.03
• Capacity Prices: $0.07
• Full year elimination of DOE fee: $0.04
Expect Q1 2015 Adjusted Operating Earnings of $0.60 - $0.70 per share

4 2014 4Q Earnings Release Slides
Adjusted O&M Forecast(2) • 2015 forecast of $7.225B(1)
• Expect CAGR of ~0.2 % for 2015-2017
2015E
$7,225(1)
$4,525
$1,250
$750
$775
2014 Actuals
$6,950(1)
$4,350
$1,200
$750
$725
(in $M)
ExGen
ComEd ComEd
PECO PECO
BGE
Corp
(1) Refer to the Appendix for a reconciliation of adjusted (non-GAAP) O&M to GAAP O&M. Further, the Utilities adjusted O&M excludes regulatory O&M costs that are P&L neutral. ExGen adjusted O&M excludes direct cost of sales for certain Constellation businesses, P&L neutral decommissioning costs and the impact from O&M related to variable interest entities.
(2) All amounts rounded to the nearest $25M. (3) Prior to consolidation on April 1, 2014, CENG was under the equity method of accounting. CENG 0&M prior to consolidation is not included.
ExGen(3)
BGE
Key Year-over-Year Drivers(2)
• Growth including Integrys & full year of CENG: $250M
• Inflation: $125M • Plant Divestitures: $(100M) • Pension/OPEB: $50M • PECO Storm Costs: $(50M) • BGE & ComEd Storm Costs: $25M
Corp -75 -75

5 2014 4Q Earnings Release Slides
Hedging Activity and Market Fundamentals Heat Rates have expanded throughout 2014 % of Expected Generation Hedged (1) Total Portfolio
(1) Mid-point of disclosed hedge % ranges was used
Impacts of our view on our hedging activity
• Over the last several quarters, power prices have increased and heat rates have expanded
• We have adjusted our strategy by reducing our long heat rate position and increasing our fixed-price length where we see remaining upside
• During 4Q, we lowered our cross-commodity hedges monetizing our long heat rate view as heat rates
expanded but continued to stay behind ratable by carrying a long fixed-price position
1Q13 2Q13 3Q13 4Q13 1Q14 2Q14 3Q14 4Q14 1Q14 2Q14 3Q14 4Q14

6 2014 4Q Earnings Release Slides
Exelon Generation: Gross Margin Update December 31, 2014 Change from Sept 30, 2014
Gross Margin Category ($M) (1) 2015 2016 2017 2015 2016 2017
Open Gross Margin(3)
(including South, West, Canada hedged gross margin)
$5,700 $5,850 $6,100 $(1,050) $(650) $(550)
Mark-to-Market of Hedges(3,4) $1,050 $550 $350 $1,050 $400 $200
Power New Business / To Go $350 $550 $800 $(50) - $50
Non-Power Margins Executed $200 $100 $50 $100 $50 -
Non-Power New Business / To Go $250 $350 $400 $(50) - $50
Total Gross Margin(2) $7,550 $7,400 $7,700 - $(200) $(250)
1) Gross margin categories rounded to nearest $50M. 2) Total Gross Margin (Non-GAAP) is defined as operating revenues less purchased power and
fuel expense, excluding revenue related to decommissioning, gross receipts tax, Exelon Nuclear Partners, operating services agreement with Fort Calhoun and variable interest entities. Total Gross Margin is also net of direct cost of sales for certain Constellation businesses. See Slide 36 for a Non-GAAP to GAAP reconciliation of Total Gross Margin.
3) Excludes EDF’s equity ownership share of the CENG Joint Venture 4) Mark to Market of Hedges assumes mid-point of hedge percentages. Note: Inclusive of all asset divestitures as of December 31, 2014 and Quail Run, as well as the Integrys acquisition.
• Load serving business had strong 2014 and is off to a good start in 2015 • Cleared 195MW of new peaking generation in ISO-NE Forward Capacity Auction 9. Expected
to be online in mid-2018 • Natural gas and power prices declined during the fourth quarter • Aggressively hedged our PJM East and New England Portfolios in early Q4 when prices were
higher
Recent Developments
7 2014 4Q Earnings Release Slides
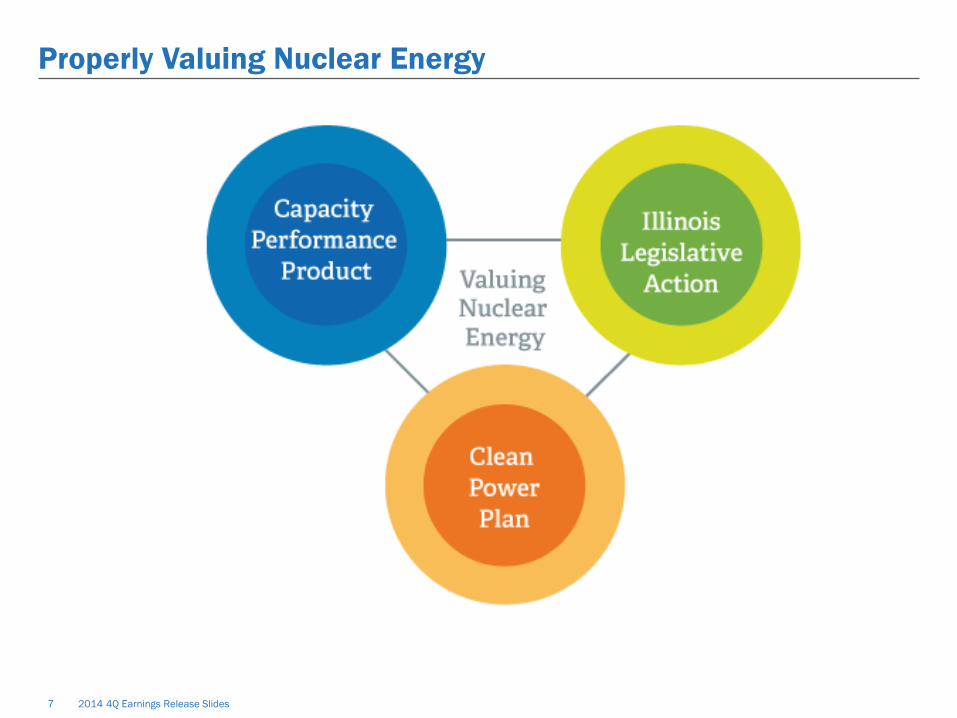
Properly Valuing Nuclear Energy

8 2014 4Q Earnings Release Slides
Exelon Generation Disclosures
December 31, 2014
9 2014 4Q Earnings Release Slides
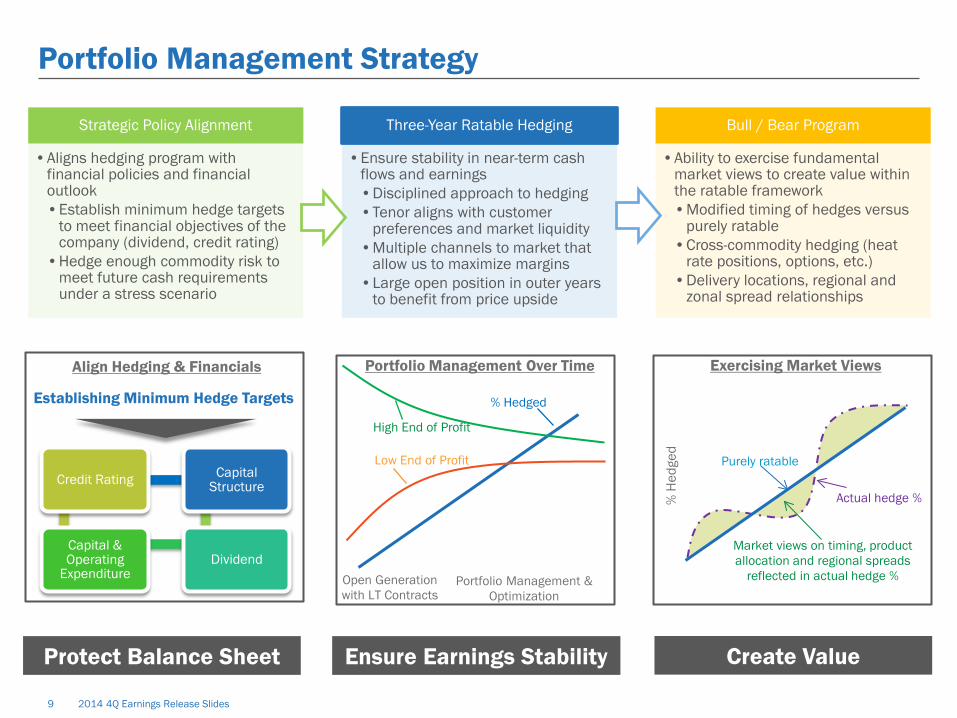
Portfolio Management Strategy
Protect Balance Sheet Ensure Earnings Stability Create Value
Strategic Policy Alignment
•Aligns hedging program with financial policies and financial outlook •Establish minimum hedge targets
to meet financial objectives of the company (dividend, credit rating)
•Hedge enough commodity risk to meet future cash requirements under a stress scenario
Three-Year Ratable Hedging
•Ensure stability in near-term cash flows and earnings •Disciplined approach to hedging •Tenor aligns with customer
preferences and market liquidity •Multiple channels to market that
allow us to maximize margins •Large open position in outer years
to benefit from price upside
Bull / Bear Program
•Ability to exercise fundamental market views to create value within the ratable framework •Modified timing of hedges versus
purely ratable •Cross-commodity hedging (heat
rate positions, options, etc.) •Delivery locations, regional and
zonal spread relationships
Exercising Market Views
% H
edge
d
Purely ratable
Actual hedge %
Market views on timing, product allocation and regional spreads
reflected in actual hedge %
High End of Profit
Low End of Profit
% Hedged
Open Generation with LT Contracts
Portfolio Management & Optimization
Portfolio Management Over Time Align Hedging & Financials
Establishing Minimum Hedge Targets
Credit Rating
Capital & Operating
Expenditure Dividend
Capital Structure
10 2014 4Q Earnings Release Slides
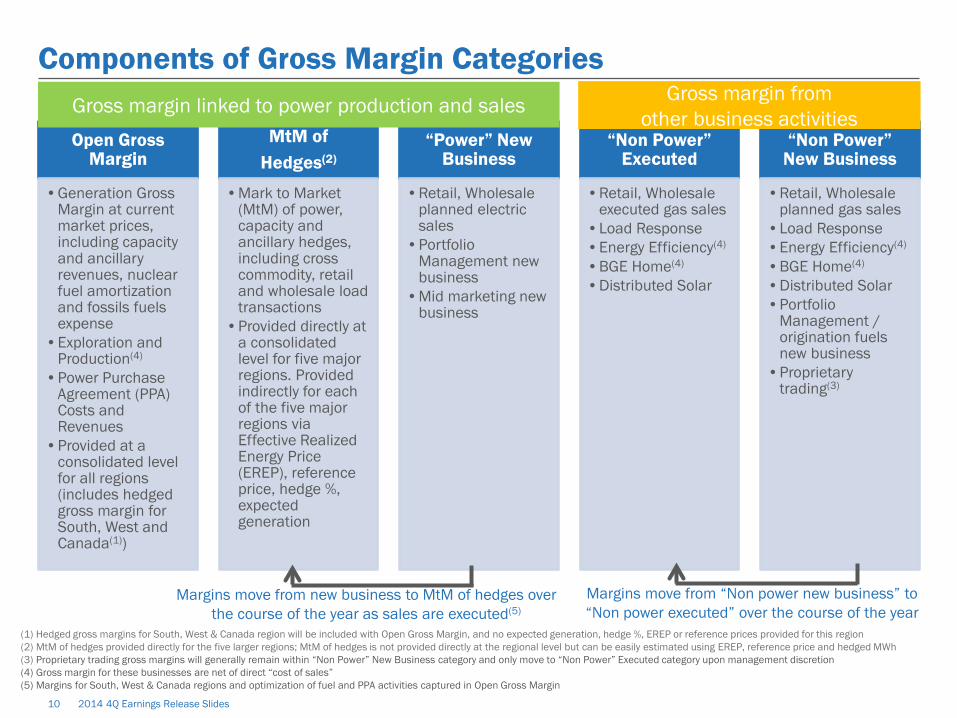
Components of Gross Margin Categories
Open Gross Margin
•Generation Gross Margin at current market prices, including capacity and ancillary revenues, nuclear fuel amortization and fossils fuels expense
•Exploration and Production(4)
•Power Purchase Agreement (PPA) Costs and Revenues
•Provided at a consolidated level for all regions (includes hedged gross margin for South, West and Canada(1))
MtM of Hedges(2)
•Mark to Market (MtM) of power, capacity and ancillary hedges, including cross commodity, retail and wholesale load transactions
•Provided directly at a consolidated level for five major regions. Provided indirectly for each of the five major regions via Effective Realized Energy Price (EREP), reference price, hedge %, expected generation
“Power” New Business
•Retail, Wholesale planned electric sales
•Portfolio Management new business
•Mid marketing new business
“Non Power” Executed
•Retail, Wholesale executed gas sales
•Load Response •Energy Efficiency(4) •BGE Home(4) •Distributed Solar
“Non Power” New Business
•Retail, Wholesale planned gas sales
•Load Response •Energy Efficiency(4) •BGE Home(4) •Distributed Solar •Portfolio
Management / origination fuels new business
•Proprietary trading(3)
Margins move from new business to MtM of hedges over the course of the year as sales are executed(5)
Margins move from “Non power new business” to “Non power executed” over the course of the year
Gross margin linked to power production and sales Gross margin from other business activities
(1) Hedged gross margins for South, West & Canada region will be included with Open Gross Margin, and no expected generation, hedge %, EREP or reference prices provided for this region (2) MtM of hedges provided directly for the five larger regions; MtM of hedges is not provided directly at the regional level but can be easily estimated using EREP, reference price and hedged MWh (3) Proprietary trading gross margins will generally remain within “Non Power” New Business category and only move to “Non Power” Executed category upon management discretion (4) Gross margin for these businesses are net of direct “cost of sales” (5) Margins for South, West & Canada regions and optimization of fuel and PPA activities captured in Open Gross Margin
11 2014 4Q Earnings Release Slides
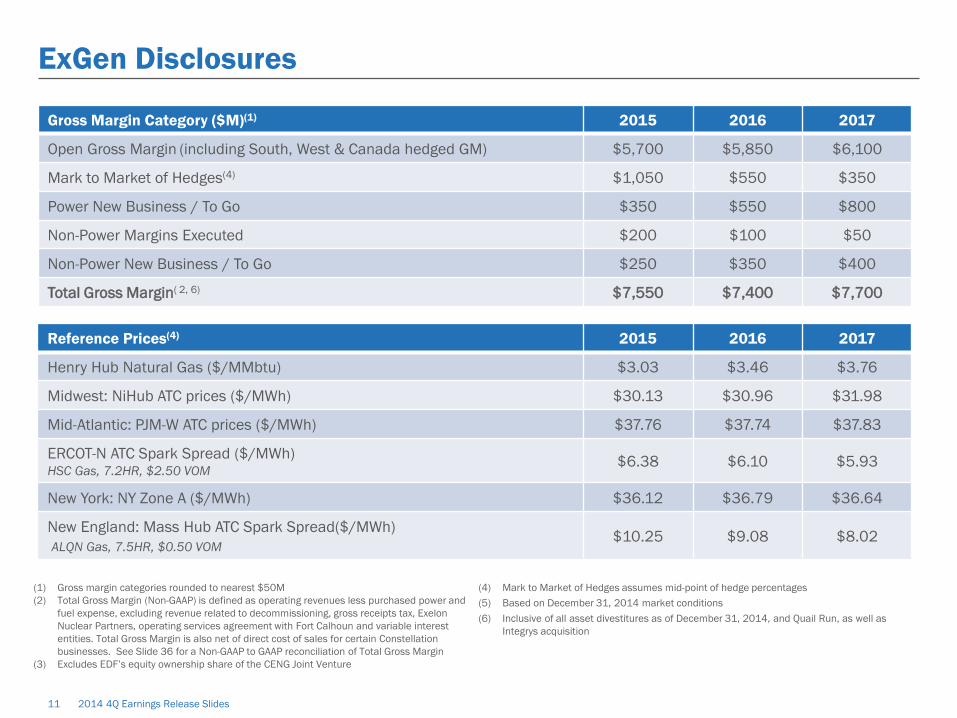
ExGen Disclosures
Gross Margin Category ($M)(1) 2015 2016 2017
Open Gross Margin (including South, West & Canada hedged GM) $5,700 $5,850 $6,100
Mark to Market of Hedges(4) $1,050 $550 $350
Power New Business / To Go $350 $550 $800
Non-Power Margins Executed $200 $100 $50
Non-Power New Business / To Go $250 $350 $400
Total Gross Margin( 2, 6) $7,550 $7,400 $7,700
Reference Prices(4) 2015 2016 2017
Henry Hub Natural Gas ($/MMbtu) $3.03 $3.46 $3.76
Midwest: NiHub ATC prices ($/MWh) $30.13 $30.96 $31.98
Mid-Atlantic: PJM-W ATC prices ($/MWh) $37.76 $37.74 $37.83
ERCOT-N ATC Spark Spread ($/MWh) HSC Gas, 7.2HR, $2.50 VOM
$6.38 $6.10 $5.93
New York: NY Zone A ($/MWh) $36.12 $36.79 $36.64
New England: Mass Hub ATC Spark Spread($/MWh) ALQN Gas, 7.5HR, $0.50 VOM
$10.25 $9.08 $8.02
(1) Gross margin categories rounded to nearest $50M (2) Total Gross Margin (Non-GAAP) is defined as operating revenues less purchased power and
fuel expense, excluding revenue related to decommissioning, gross receipts tax, Exelon Nuclear Partners, operating services agreement with Fort Calhoun and variable interest entities. Total Gross Margin is also net of direct cost of sales for certain Constellation businesses. See Slide 36 for a Non-GAAP to GAAP reconciliation of Total Gross Margin
(3) Excludes EDF’s equity ownership share of the CENG Joint Venture
(4) Mark to Market of Hedges assumes mid-point of hedge percentages (5) Based on December 31, 2014 market conditions (6) Inclusive of all asset divestitures as of December 31, 2014, and Quail Run, as well as
Integrys acquisition

12 2014 4Q Earnings Release Slides
ExGen Disclosures Generation and Hedges 2015 2016 2017
Exp. Gen (GWh) (1) 191,200 192,400 196,800 Midwest 97,100 97,400 95,900 Mid-Atlantic (2) 62,400 62,900 60,700 ERCOT 16,800 17,300 25,700 New York (2) 9,300 9,300 9,300 New England 5,600 5,500 5,200
% of Expected Generation Hedged (3) 93%-96% 61%-64% 31%-34% Midwest 88%-91% 55%-58% 23%-26% Mid-Atlantic (2) 99%-102% 67%-70% 36%-39% ERCOT 94%-97% 77%-80% 48%-51% New York (2) 84%-87% 60%-63% 38%-41% New England 118%-121% 68%-71% 32%-35%
Effective Realized Energy Price ($/MWh) (4)
Midwest $34.00 $34.50 $36.00 Mid-Atlantic (2) $45.00 $45.00 $47.00 ERCOT(5) $10.50 $7.50 $7.00 New York (2) $47.50 $43.50 $40.00 New England (5) $21.00 $14.50 $9.00
(1) Expected generation is the volume of energy that best represents our commodity position in energy markets from owned or contracted for capacity based upon a simulated dispatch model that makes assumptions regarding future market conditions, which are calibrated to market quotes for power, fuel, load following products, and options. Expected generation assumes 14 refueling outages in 2015, 12 in 2016, and 15 in 2017 at Exelon-operated nuclear plants, and Salem. Expected generation assumes capacity factors of 93.5%, 94.1% and 93.4% in 2015 , 2016 and 2017 respectively at Exelon-operated nuclear plants, at ownership. These estimates of expected generation in 2015, 2016 and 2017 do not represent guidance or a forecast of future results as Exelon has not completed its planning or optimization processes for those years. (2) Excludes EDF’s equity ownership share of CENG Joint Venture. (3) Percent of expected generation hedged is the amount of equivalent sales divided by expected generation. Includes all hedging products, such as wholesale and retail sales of power, options and swaps. (4) Effective realized energy price is representative of an all-in hedged price, on a per MWh basis, at which expected generation has been hedged. It is developed by considering the energy revenues and costs associated with our hedges and by considering the fossil fuel that has been purchased to lock in margin. It excludes uranium costs and RPM capacity revenue, but includes the mark-to-market value of capacity contracted at prices other than RPM clearing prices including our load obligations. It can be compared with the reference prices used to calculate open gross margin in order to determine the mark-to-market value of Exelon Generation's energy hedges. (5) Spark spreads shown for ERCOT and New England. (6) Inclusive of all asset divestitures as of December 31,2014 and Quail Run, as well as Integrys acquisition

13 2014 4Q Earnings Release Slides
ExGen Hedged Gross Margin Sensitivities Gross Margin Sensitivities (With Existing Hedges)(1) 2015 2016 2017
Henry Hub Natural Gas ($/Mmbtu)
+ $1/Mmbtu $25 $340 $730
- $1/Mmbtu $35 $(310) $(710)
NiHub ATC Energy Price
+ $5/MWh $35 $215 $370
- $5/MWh $(30) $(215) $(365)
PJM-W ATC Energy Price
+ $5/MWh $(5) $105 $205
- $5/MWh $10 $(100) $(205)
NYPP Zone A ATC Energy Price
+ $5/MWh $ - $10 $25
- $5/MWh $(5) $(15) $(30)
Nuclear Capacity Factor
+/- 1% +/- $40 +/- $45 +/- $45
(1) Based on December 31, 2014 market conditions and hedged position; Gas price sensitivities are based on an assumed gas-power relationship derived from an internal model that is updated periodically; Power prices sensitivities are derived by adjusting the power price assumption while keeping all other prices inputs constant; Due to correlation of the various assumptions, the hedged gross margin impact calculated by aggregating individual sensitivities may not be equal to the hedged gross margin impact calculated when correlations between the various assumptions are also considered; Sensitivities based on commodity exposure which includes open generation and all committed transactions; Excludes EDF’s equity share of CENG Joint Venture; Inclusive of all asset divestitures as of December 31, 2014, and Quail Run, as well as Integrys acquisition
14 2014 4Q Earnings Release Slides
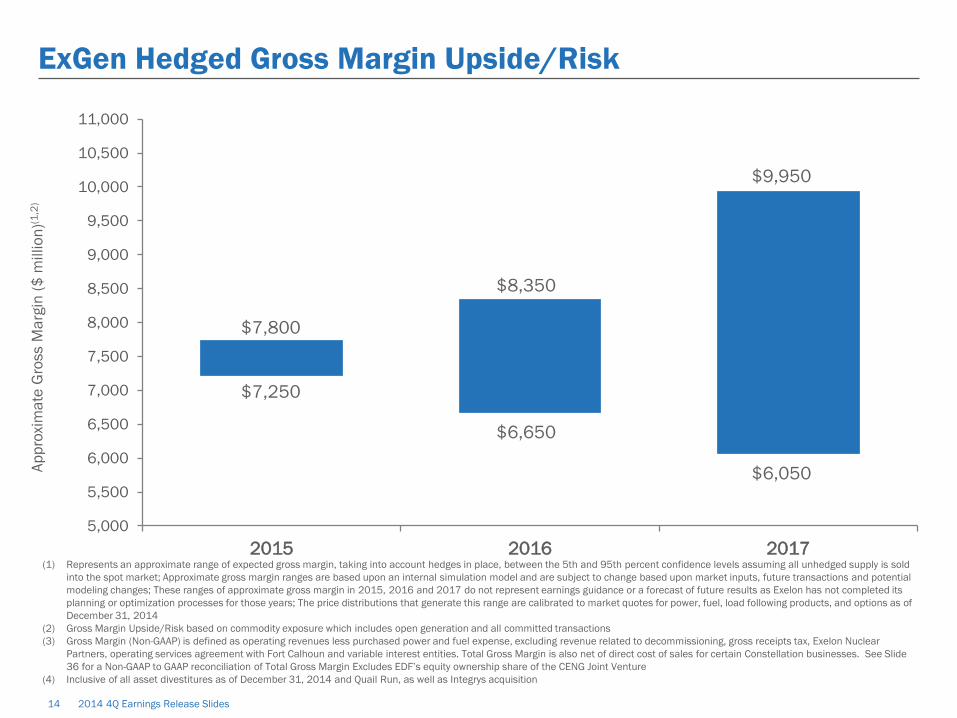
ExGen Hedged Gross Margin Upside/Risk
5,000
5,500
6,000
6,500
7,000
7,500
8,000
8,500
9,000
9,500
10,000
10,500
11,000
2015 2016 2017
$9,950
$6,050 Appr
oxim
ate
Gro
ss M
argi
n ($
mill
ion)
(1,2
)
$7,800
$7,250
$8,350
$6,650
(1) Represents an approximate range of expected gross margin, taking into account hedges in place, between the 5th and 95th percent confidence levels assuming all unhedged supply is sold into the spot market; Approximate gross margin ranges are based upon an internal simulation model and are subject to change based upon market inputs, future transactions and potential modeling changes; These ranges of approximate gross margin in 2015, 2016 and 2017 do not represent earnings guidance or a forecast of future results as Exelon has not completed its planning or optimization processes for those years; The price distributions that generate this range are calibrated to market quotes for power, fuel, load following products, and options as of December 31, 2014
(2) Gross Margin Upside/Risk based on commodity exposure which includes open generation and all committed transactions (3) Gross Margin (Non-GAAP) is defined as operating revenues less purchased power and fuel expense, excluding revenue related to decommissioning, gross receipts tax, Exelon Nuclear
Partners, operating services agreement with Fort Calhoun and variable interest entities. Total Gross Margin is also net of direct cost of sales for certain Constellation businesses. See Slide 36 for a Non-GAAP to GAAP reconciliation of Total Gross Margin Excludes EDF’s equity ownership share of the CENG Joint Venture
(4) Inclusive of all asset divestitures as of December 31, 2014 and Quail Run, as well as Integrys acquisition
15 2014 4Q Earnings Release Slides
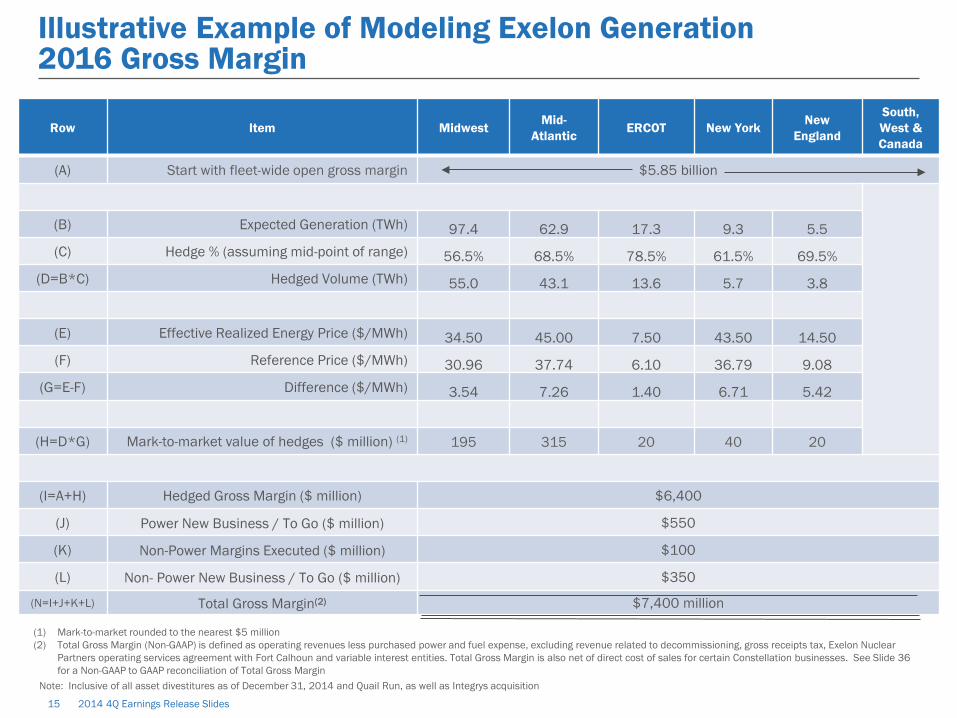
Illustrative Example of Modeling Exelon Generation 2016 Gross Margin
Row Item Midwest Mid-Atlantic ERCOT New York New
England
South, West & Canada
(A) Start with fleet-wide open gross margin $5.85 billion
(B) Expected Generation (TWh) 97.4 62.9 17.3 9.3 5.5 (C) Hedge % (assuming mid-point of range) 56.5% 68.5% 78.5% 61.5% 69.5%
(D=B*C) Hedged Volume (TWh) 55.0 43.1 13.6 5.7 3.8
(E) Effective Realized Energy Price ($/MWh) 34.50 45.00 7.50 43.50 14.50 (F) Reference Price ($/MWh) 30.96 37.74 6.10 36.79 9.08
(G=E-F) Difference ($/MWh) 3.54 7.26 1.40 6.71 5.42
(H=D*G) Mark-to-market value of hedges ($ million) (1) 195 315 20 40 20
(I=A+H) Hedged Gross Margin ($ million) $6,400
(J) Power New Business / To Go ($ million) $550
(K) Non-Power Margins Executed ($ million) $100
(L) Non- Power New Business / To Go ($ million) $350
(N=I+J+K+L) Total Gross Margin(2) $7,400 million
(1) Mark-to-market rounded to the nearest $5 million (2) Total Gross Margin (Non-GAAP) is defined as operating revenues less purchased power and fuel expense, excluding revenue related to decommissioning, gross receipts tax, Exelon Nuclear
Partners operating services agreement with Fort Calhoun and variable interest entities. Total Gross Margin is also net of direct cost of sales for certain Constellation businesses. See Slide 36 for a Non-GAAP to GAAP reconciliation of Total Gross Margin
Note: Inclusive of all asset divestitures as of December 31, 2014 and Quail Run, as well as Integrys acquisition
16 2014 4Q Earnings Release Slides
Additional Disclosures
17 2014 4Q Earnings Release Slides
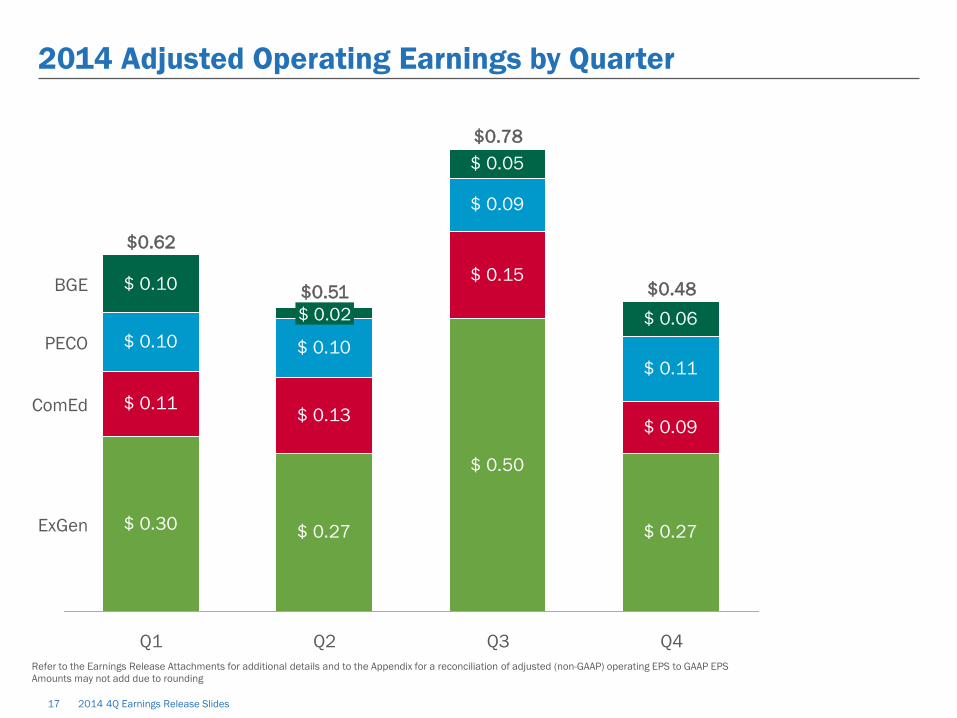
2014 Adjusted Operating Earnings by Quarter
Refer to the Earnings Release Attachments for additional details and to the Appendix for a reconciliation of adjusted (non-GAAP) operating EPS to GAAP EPS Amounts may not add due to rounding
$ 0.30 $ 0.27 $ 0.27
$ 0.15
$ 0.50
$ 0.13$ 0.11$ 0.09
$ 0.10$ 0.10$ 0.11
$ 0.09
$ 0.06
$ 0.05
$ 0.10
ExGen
BGE
ComEd
PECO
Q4
$0.48
Q3
$0.78
Q2
$0.51 $ 0.02
Q1
$0.62
18 2014 4Q Earnings Release Slides
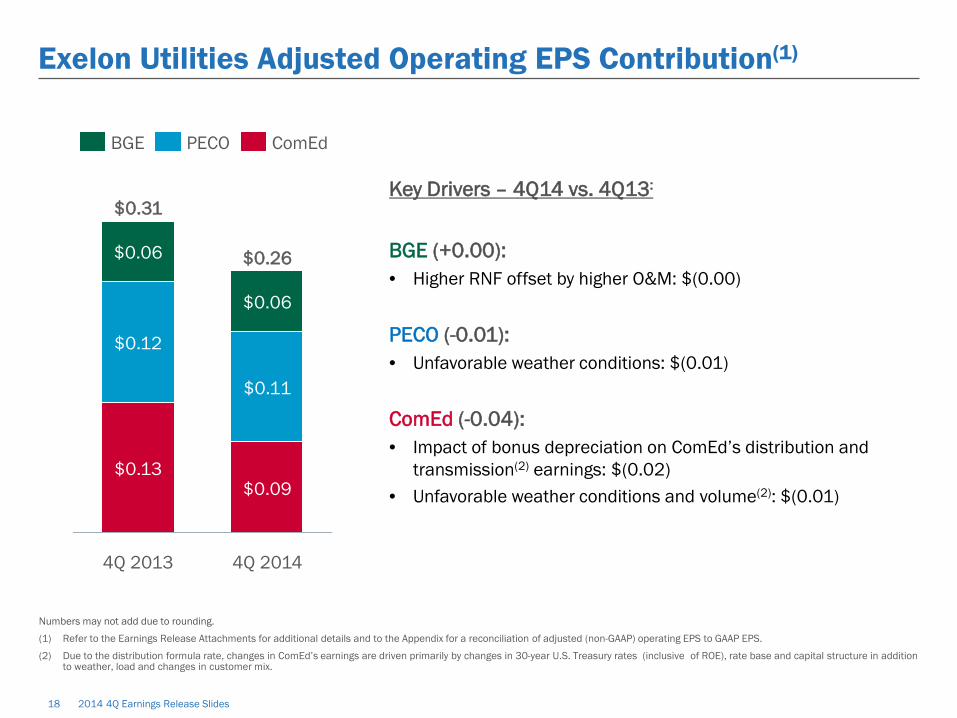
Exelon Utilities Adjusted Operating EPS Contribution(1)
Key Drivers – 4Q14 vs. 4Q13: BGE (+0.00): • Higher RNF offset by higher O&M: $(0.00)
PECO (-0.01): • Unfavorable weather conditions: $(0.01)
ComEd (-0.04): • Impact of bonus depreciation on ComEd’s distribution and
transmission(2) earnings: $(0.02) • Unfavorable weather conditions and volume(2): $(0.01)
$0.13
4Q 2014
$0.26
$0.06
$0.11
$0.09
4Q 2013
$0.31
$0.06
$0.12
ComEd PECO BGE
Numbers may not add due to rounding.
(1) Refer to the Earnings Release Attachments for additional details and to the Appendix for a reconciliation of adjusted (non-GAAP) operating EPS to GAAP EPS.
(2) Due to the distribution formula rate, changes in ComEd’s earnings are driven primarily by changes in 30-year U.S. Treasury rates (inclusive of ROE), rate base and capital structure in addition to weather, load and changes in customer mix.

19 2014 4Q Earnings Release Slides
$0.14
$0.47$0.45 - $0.55
Other
($0.02)
Depreciation & Amortization
($0.02)
O&M(3)
($0.06)
RNF(2) 2014(1)
($0.01)
2015(4)(5)
ComEd Adjusted Operating EPS Bridge 2014 to 2015
Note: Drivers add up to mid-point of 2015 adjusted operating EPS range (1) Refer to the Earnings Release Attachments for additional details and to the Appendix for a reconciliation of adjusted (non-GAAP) operating EPS to GAAP EPS. (2) Revenue net fuel (RNF) is defined as operating revenues less purchased power and fuel expense. (3) O&M excludes regulatory items that are P&L neutral. (4) Shares Outstanding (diluted) are 866M in 2015 and 864M in 2014. Refer to slide 33 for a reconciliation of adjusted (non-GAAP) operating EPS guidance to GAAP EPS. (5) Guidance assumes an effective tax rate for 2015 of 39.5%.
Interest
$0.11 Distribution$0.02 Transmission$0.01 Weather/Volumes
($0.01) Storm($0.02) Inflation($0.01) Pension/OPEB($0.01) Other

20 2014 4Q Earnings Release Slides
$0.41
RNF(2)
($0.00)
2015(4)(5)
$0.35 - $0.45
Tax
($0.02)
Interest
($0.00)
Depreciation & Amortization
(0.00)
O&M(3)
$0.01
PECO Adjusted Operating EPS Bridge 2014 to 2015
Note: Drivers add up to mid-point of 2015 adjusted operating EPS range. (1) Refer to the Earnings Release Attachments for additional details and to the Appendix for a reconciliation of adjusted (non-GAAP) operating EPS to GAAP EPS. (2) Revenue net fuel (RNF) is defined as operating revenues less purchased power and fuel expense. (3) O&M excludes regulatory items that are P&L neutral. (4) Shares Outstanding (diluted) are 864M in 2014 and 866M in 2015. Refer to slide 33 for a reconciliation of adjusted (non-GAAP) operating EPS guidance to GAAP EPS. (5) Guidance assumes an effective tax rate for 2015 of 28.5%.
2014(1)
($0.02) Storm Tax Repairs Benefit
$0.03 Storm ($0.01) Inflation ($0.01) Operational/IT Increases
21 2014 4Q Earnings Release Slides
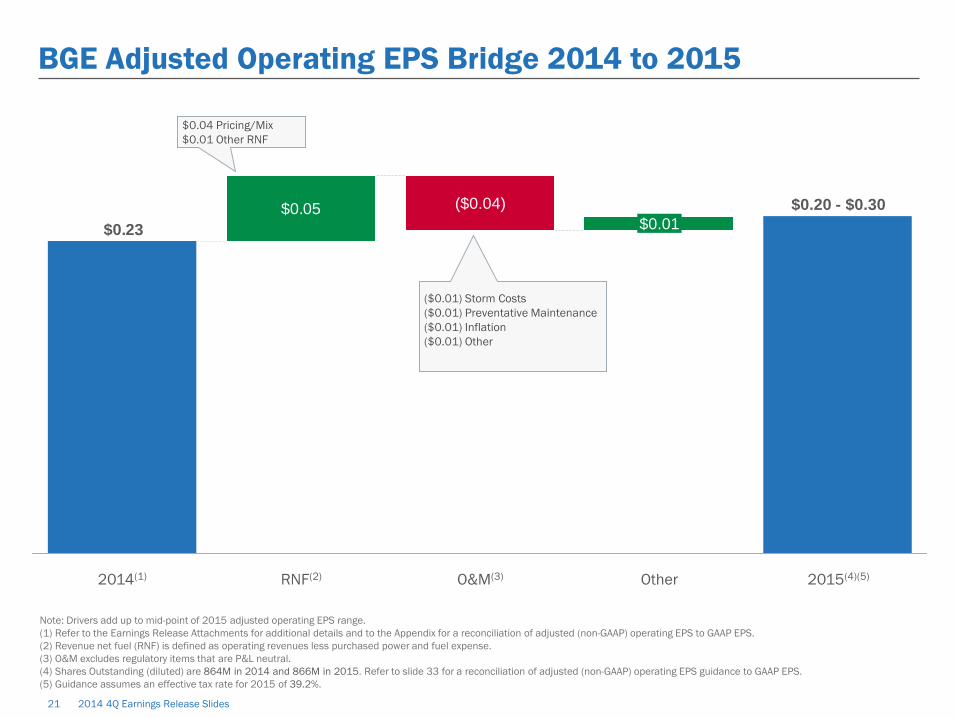
$0.05$0.23
Other O&M(3)
($0.04)
RNF(2) 2014(1)
$0.20 - $0.30 $0.01
2015(4)(5)
BGE Adjusted Operating EPS Bridge 2014 to 2015
($0.01) Storm Costs ($0.01) Preventative Maintenance ($0.01) Inflation ($0.01) Other
$0.04 Pricing/Mix $0.01 Other RNF
Note: Drivers add up to mid-point of 2015 adjusted operating EPS range. (1) Refer to the Earnings Release Attachments for additional details and to the Appendix for a reconciliation of adjusted (non-GAAP) operating EPS to GAAP EPS. (2) Revenue net fuel (RNF) is defined as operating revenues less purchased power and fuel expense. (3) O&M excludes regulatory items that are P&L neutral. (4) Shares Outstanding (diluted) are 864M in 2014 and 866M in 2015. Refer to slide 33 for a reconciliation of adjusted (non-GAAP) operating EPS guidance to GAAP EPS. (5) Guidance assumes an effective tax rate for 2015 of 39.2%.
22 2014 4Q Earnings Release Slides
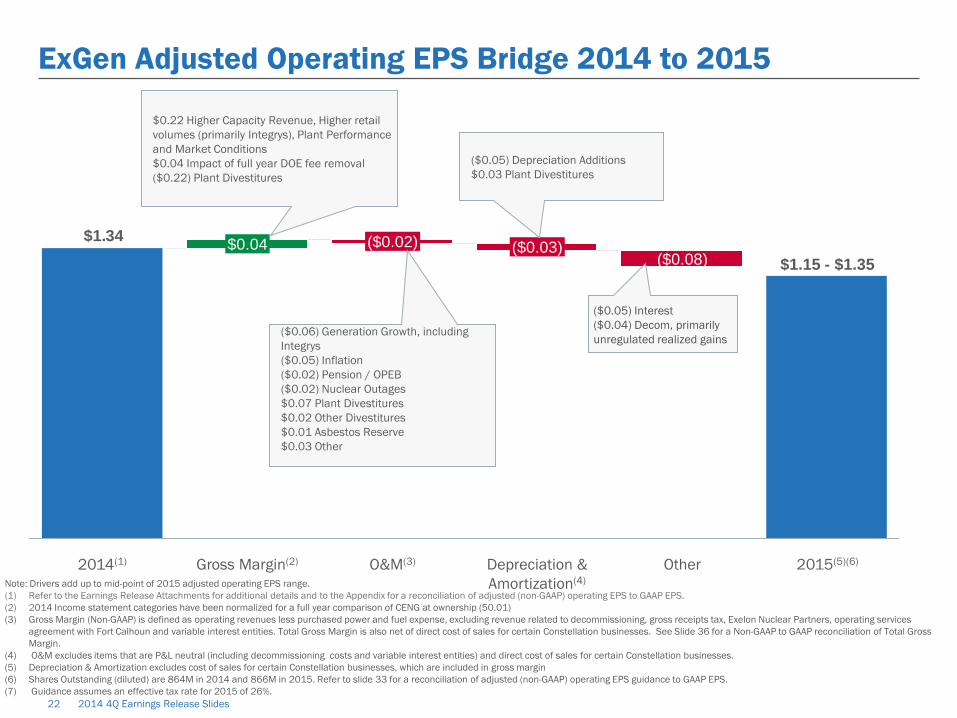
$1.34($0.08)
Other
$1.15 - $1.35
2015(5)(6) Depreciation & Amortization(4)
($0.03)
O&M(3)
($0.02)
Gross Margin(2)
$0.04
2014(1)
ExGen Adjusted Operating EPS Bridge 2014 to 2015
Note: Drivers add up to mid-point of 2015 adjusted operating EPS range. (1) Refer to the Earnings Release Attachments for additional details and to the Appendix for a reconciliation of adjusted (non-GAAP) operating EPS to GAAP EPS. (2) 2014 Income statement categories have been normalized for a full year comparison of CENG at ownership (50.01) (3) Gross Margin (Non-GAAP) is defined as operating revenues less purchased power and fuel expense, excluding revenue related to decommissioning, gross receipts tax, Exelon Nuclear Partners, operating services
agreement with Fort Calhoun and variable interest entities. Total Gross Margin is also net of direct cost of sales for certain Constellation businesses. See Slide 36 for a Non-GAAP to GAAP reconciliation of Total Gross Margin.
(4) O&M excludes items that are P&L neutral (including decommissioning costs and variable interest entities) and direct cost of sales for certain Constellation businesses. (5) Depreciation & Amortization excludes cost of sales for certain Constellation businesses, which are included in gross margin (6) Shares Outstanding (diluted) are 864M in 2014 and 866M in 2015. Refer to slide 33 for a reconciliation of adjusted (non-GAAP) operating EPS guidance to GAAP EPS. (7) Guidance assumes an effective tax rate for 2015 of 26%.
$0.22 Higher Capacity Revenue, Higher retail volumes (primarily Integrys), Plant Performance and Market Conditions $0.04 Impact of full year DOE fee removal ($0.22) Plant Divestitures
($0.05) Depreciation Additions $0.03 Plant Divestitures
($0.06) Generation Growth, including Integrys ($0.05) Inflation ($0.02) Pension / OPEB ($0.02) Nuclear Outages $0.07 Plant Divestitures $0.02 Other Divestitures $0.01 Asbestos Reserve $0.03 Other
($0.05) Interest ($0.04) Decom, primarily unregulated realized gains
23 2014 4Q Earnings Release Slides
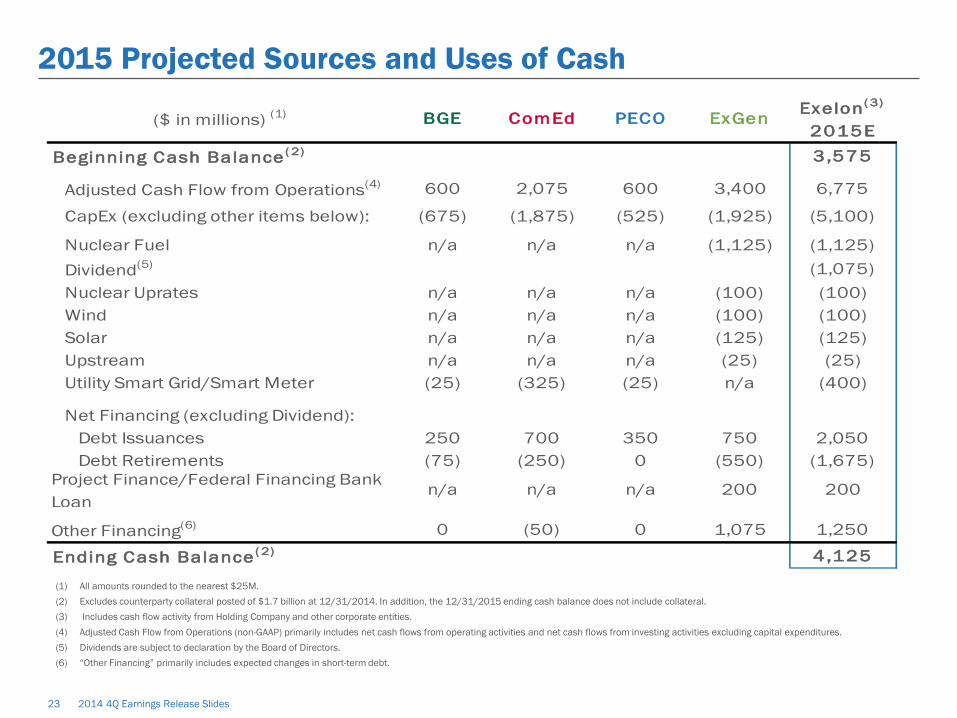
2015 Projected Sources and Uses of Cash
(1) All amounts rounded to the nearest $25M. (2) Excludes counterparty collateral posted of $1.7 billion at 12/31/2014. In addition, the 12/31/2015 ending cash balance does not include collateral. (3) Includes cash flow activity from Holding Company and other corporate entities. (4) Adjusted Cash Flow from Operations (non-GAAP) primarily includes net cash flows from operating activities and net cash flows from investing activities excluding capital expenditures. (5) Dividends are subject to declaration by the Board of Directors. (6) “Other Financing” primarily includes expected changes in short-term debt.
($ in millions) (1) BGE ComEd PECO ExGen Exelon( 3)
2015E
Beginning Cash Balance( 2) 3 ,575
Adjusted Cash Flow from Operations(4) 600 2,075 600 3,400 6,775
CapEx (excluding other items below): (675) (1,875) (525) (1,925) (5,100)
Nuclear Fuel n/a n/a n/a (1,125) (1,125)Dividend(5) (1,075)Nuclear Uprates n/a n/a n/a (100) (100)Wind n/a n/a n/a (100) (100)Solar n/a n/a n/a (125) (125)Upstream n/a n/a n/a (25) (25)Utility Smart Grid/Smart Meter (25) (325) (25) n/a (400)
Net Financing (excluding Dividend):Debt Issuances 250 700 350 750 2,050 Debt Retirements (75) (250) 0 (550) (1,675)
Project Finance/Federal Financing Bank Loan
n/a n/a n/a 200 200
Other Financing(6) 0 (50) 0 1,075 1,250
Ending Cash Balance( 2) 4 ,125
24 2014 4Q Earnings Release Slides
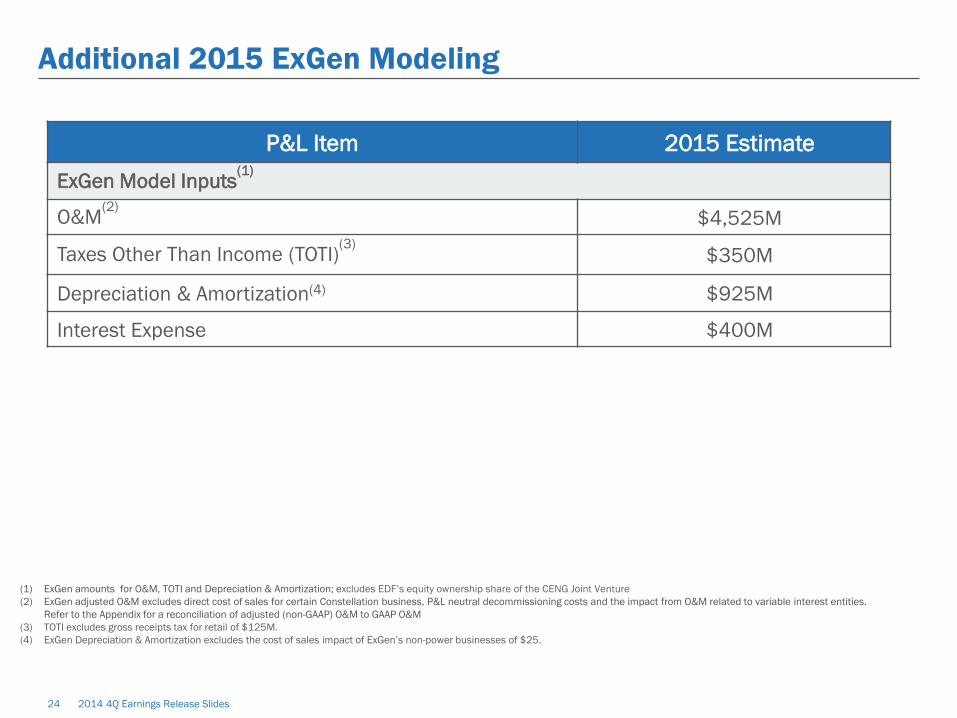
Additional 2015 ExGen Modeling
P&L Item 2015 Estimate
ExGen Model Inputs(1)
O&M(2) $4,525M
Taxes Other Than Income (TOTI)(3) $350M
Depreciation & Amortization(4) $925M
Interest Expense $400M
(1) ExGen amounts for O&M, TOTI and Depreciation & Amortization; excludes EDF’s equity ownership share of the CENG Joint Venture (2) ExGen adjusted O&M excludes direct cost of sales for certain Constellation business, P&L neutral decommissioning costs and the impact from O&M related to variable interest entities.
Refer to the Appendix for a reconciliation of adjusted (non-GAAP) O&M to GAAP O&M (3) TOTI excludes gross receipts tax for retail of $125M. (4) ExGen Depreciation & Amortization excludes the cost of sales impact of ExGen’s non-power businesses of $25.

25 2014 4Q Earnings Release Slides
2015 Regulatory and Legislative Timelines
Settlement Filed in New Jersey (Jan
14)
Maryland Hearings (Jan 26
– Feb 6)
New Jersey Approval (Feb 11)
DC Hearings (March 30- April 8)
Maryland Deadline (April 8)
Expected Transaction Close
(Q2/Q3)
Illinois Legislative
Session Begins (Jan
14)
Cert Petition Filed in EPSA v.
FERC (Order 745 – Demand Response) (Jan
15)
Supreme Court decision
on cert in EPSA v. FERC
(Demand Response)
(March-April)
Supreme Court hearing on Michigan v.
EPA (MATS) (March-April)
FERC Ruling on PJM
Capacity Performance
Proposal (April)
MATS Rule in Effect (April)
PJM BRA Auction (May
11)
PJM BRA Auction
Results (May 22)
Illinois Legislative
Session Adjourns (May
31)
Supreme Court Decision
in Michigan vs. EPA (June)
Final Clean Power Rule
(111d) Issued (Mid-Summer)
Illinois Legislative
Veto Session (Nov)
ExGen
Exelon Utilities
PHI Acquisition
ComEd Formula Rate Filing (April)
BGE Electric and Gas Rate Case Filing (TBD) MD PSC Ruling Expected 7 Months
after Filing
PECO Electric Rate Case Filing (TBD) PaPUC Ruling
Expected within 9 Months of Filing
ICC Rules on ComEd Formula Rate Filing (Dec)
26 2014 4Q Earnings Release Slides
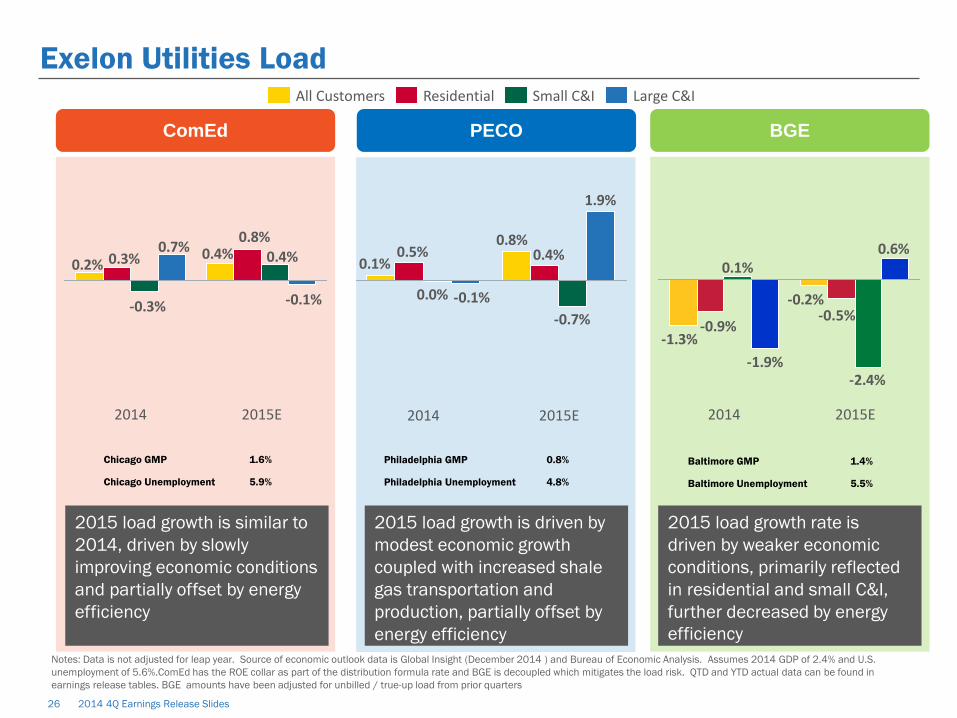
BGE
2015 load growth rate is driven by weaker economic conditions, primarily reflected in residential and small C&I, further decreased by energy efficiency
Exelon Utilities Load
0.4%0.2%
0.8%0.3% 0.4%
-0.3% -0.1%
0.7%
2015E 2014
Large C&I Small C&I Residential All Customers
ComEd
2015 load growth is similar to 2014, driven by slowly improving economic conditions and partially offset by energy efficiency
0.8%0.1% 0.4%0.5%
-0.7%0.0%
1.9%
-0.1%
2015E 2014
PECO
2015 load growth is driven by modest economic growth coupled with increased shale gas transportation and production, partially offset by energy efficiency
-1.3%
-0.2%
-0.9%
-2.4%
0.1%0.6%
-1.9%
-0.5%
2014 2015E
Chicago GMP 1.6%
Chicago Unemployment 5.9%
Philadelphia GMP 0.8%
Philadelphia Unemployment 4.8%
Baltimore GMP 1.4%
Baltimore Unemployment 5.5%
Notes: Data is not adjusted for leap year. Source of economic outlook data is Global Insight (December 2014 ) and Bureau of Economic Analysis. Assumes 2014 GDP of 2.4% and U.S. unemployment of 5.6%.ComEd has the ROE collar as part of the distribution formula rate and BGE is decoupled which mitigates the load risk. QTD and YTD actual data can be found in earnings release tables. BGE amounts have been adjusted for unbilled / true-up load from prior quarters
27 2014 4Q Earnings Release Slides
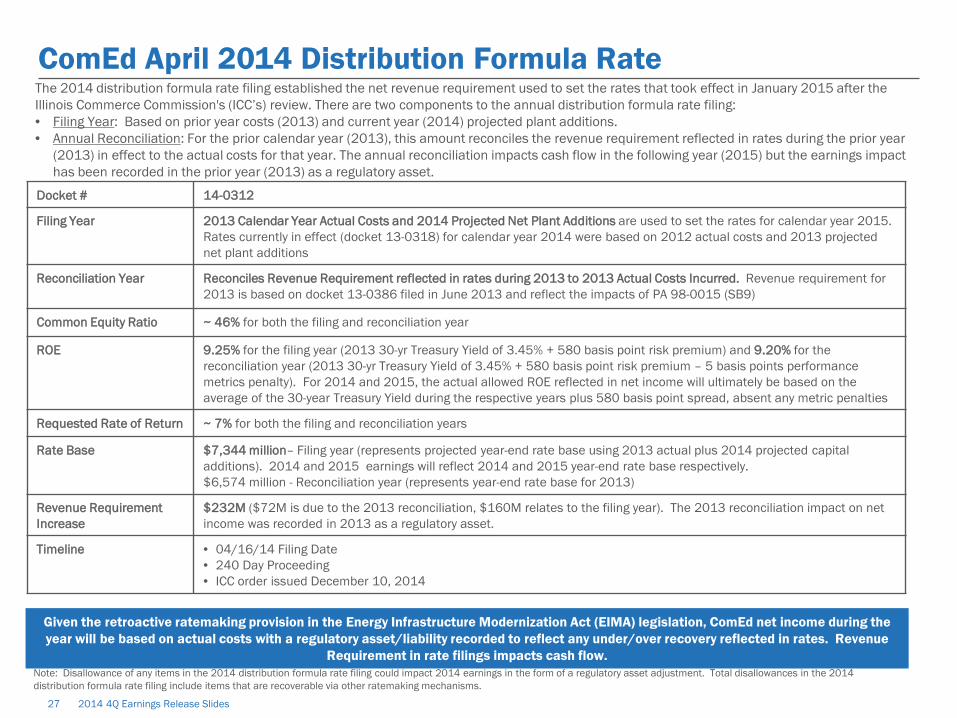
ComEd April 2014 Distribution Formula Rate
Docket # 14-0312
Filing Year 2013 Calendar Year Actual Costs and 2014 Projected Net Plant Additions are used to set the rates for calendar year 2015. Rates currently in effect (docket 13-0318) for calendar year 2014 were based on 2012 actual costs and 2013 projected net plant additions
Reconciliation Year Reconciles Revenue Requirement reflected in rates during 2013 to 2013 Actual Costs Incurred. Revenue requirement for 2013 is based on docket 13-0386 filed in June 2013 and reflect the impacts of PA 98-0015 (SB9)
Common Equity Ratio ~ 46% for both the filing and reconciliation year
ROE 9.25% for the filing year (2013 30-yr Treasury Yield of 3.45% + 580 basis point risk premium) and 9.20% for the reconciliation year (2013 30-yr Treasury Yield of 3.45% + 580 basis point risk premium – 5 basis points performance metrics penalty). For 2014 and 2015, the actual allowed ROE reflected in net income will ultimately be based on the average of the 30-year Treasury Yield during the respective years plus 580 basis point spread, absent any metric penalties
Requested Rate of Return ~ 7% for both the filing and reconciliation years
Rate Base $7,344 million– Filing year (represents projected year-end rate base using 2013 actual plus 2014 projected capital additions). 2014 and 2015 earnings will reflect 2014 and 2015 year-end rate base respectively. $6,574 million - Reconciliation year (represents year-end rate base for 2013)
Revenue Requirement Increase
$232M ($72M is due to the 2013 reconciliation, $160M relates to the filing year). The 2013 reconciliation impact on net income was recorded in 2013 as a regulatory asset.
Timeline • 04/16/14 Filing Date • 240 Day Proceeding • ICC order issued December 10, 2014
Note: Disallowance of any items in the 2014 distribution formula rate filing could impact 2014 earnings in the form of a regulatory asset adjustment. Total disallowances in the 2014 distribution formula rate filing include items that are recoverable via other ratemaking mechanisms.
The 2014 distribution formula rate filing established the net revenue requirement used to set the rates that took effect in January 2015 after the Illinois Commerce Commission's (ICC’s) review. There are two components to the annual distribution formula rate filing: • Filing Year: Based on prior year costs (2013) and current year (2014) projected plant additions. • Annual Reconciliation: For the prior calendar year (2013), this amount reconciles the revenue requirement reflected in rates during the prior year
(2013) in effect to the actual costs for that year. The annual reconciliation impacts cash flow in the following year (2015) but the earnings impact has been recorded in the prior year (2013) as a regulatory asset.
Given the retroactive ratemaking provision in the Energy Infrastructure Modernization Act (EIMA) legislation, ComEd net income during the year will be based on actual costs with a regulatory asset/liability recorded to reflect any under/over recovery reflected in rates. Revenue
Requirement in rate filings impacts cash flow.
28 2014 4Q Earnings Release Slides
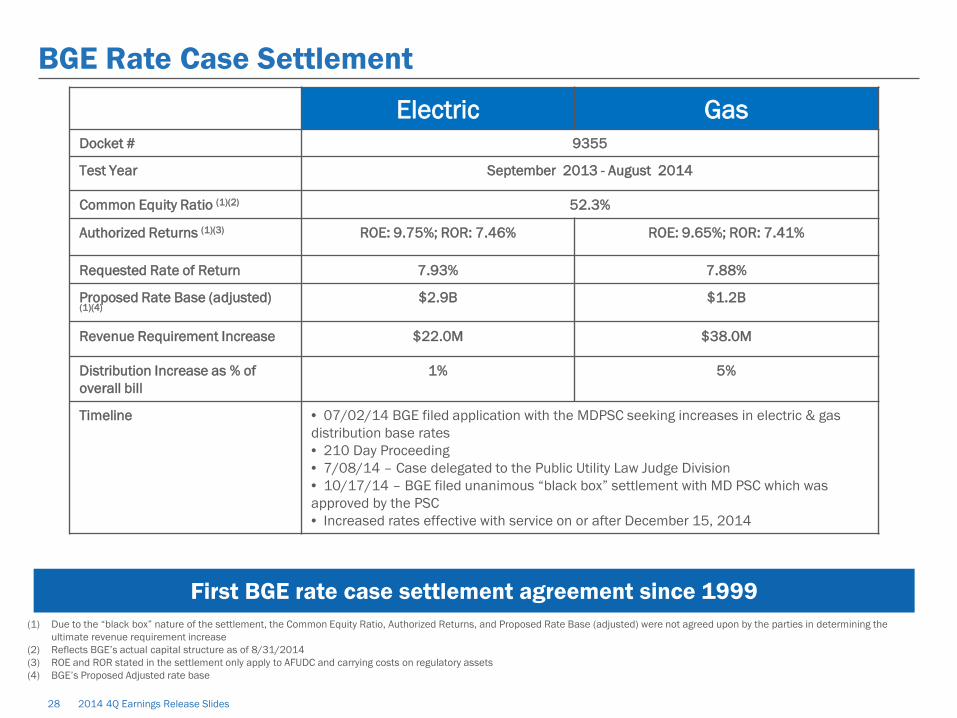
BGE Rate Case Settlement Electric Gas
Docket # 9355
Test Year September 2013 - August 2014
Common Equity Ratio (1)(2) 52.3%
Authorized Returns (1)(3) ROE: 9.75%; ROR: 7.46% ROE: 9.65%; ROR: 7.41%
Requested Rate of Return 7.93% 7.88%
Proposed Rate Base (adjusted) (1)(4)
$2.9B $1.2B
Revenue Requirement Increase $22.0M $38.0M
Distribution Increase as % of overall bill
1% 5%
Timeline • 07/02/14 BGE filed application with the MDPSC seeking increases in electric & gas distribution base rates • 210 Day Proceeding • 7/08/14 – Case delegated to the Public Utility Law Judge Division • 10/17/14 – BGE filed unanimous “black box” settlement with MD PSC which was approved by the PSC • Increased rates effective with service on or after December 15, 2014
(1) Due to the “black box” nature of the settlement, the Common Equity Ratio, Authorized Returns, and Proposed Rate Base (adjusted) were not agreed upon by the parties in determining the ultimate revenue requirement increase
(2) Reflects BGE’s actual capital structure as of 8/31/2014 (3) ROE and ROR stated in the settlement only apply to AFUDC and carrying costs on regulatory assets (4) BGE’s Proposed Adjusted rate base
First BGE rate case settlement agreement since 1999

29 2014 4Q Earnings Release Slides
Appendix
Reconciliation of Non-GAAP Measures

30 2014 4Q Earnings Release Slides
4Q GAAP EPS Reconciliation
Three Months Ended December 31, 2014 ExGen ComEd PECO BGE Other Exelon
2014 Adjusted (non-GAAP) Operating Earnings (Loss) Per Share $0.27 $0.09 $0.11 $0.06 $(0.04) $0.48
Mark-to-market impact of economic hedging activities (0.08) - - - - (0.08)
Unrealized losses related to NDT fund investments 0.03 - - - - 0.03
Merger and integration costs (0.01) - - - (0.08) (0.09)
Reassessment of State Deferred Income Taxes 0.04 - - - (0.01) 0.03
Amortization of commodity contract intangibles (0.03) - - - - (0.03)
Plant retirements and divestitures 0.06 - - - - 0.06
Long-Lived asset impairment (0.39) - - - - (0.39)
Bargain-Purchase Gain 0.03 - - - - 0.03
Tax settlements 0.01 - - - - 0.01
Non-Controlling Interest (0.03) - - - - (0.03)
4Q 2014 GAAP Earnings (Loss) Per Share ($0.11) $0.09 $0.11 $0.06 $(0.13) $0.02 NOTE: All amounts shown are per Exelon share and represent contributions to Exelon's EPS. Amounts may not add due to rounding.
Three Months Ended December 31, 2013 ExGen ComEd PECO BGE Other Exelon
2013 Adjusted (non-GAAP) Operating Earnings (Loss) Per Share $0.21 $0.13 $0.12 $0.06 $(0.02) $0.50
Mark-to-market impact of economic hedging activities 0.16 - - - - 0.16
Unrealized gains related to nuclear decommissioning trust funds 0.05 - - - - 0.05
Constellation merger and integration costs (0.02) - - - - (0.02)
Reassessment of State Deferred Income Taxes 0.02 - - - (0.02) -
Amortization of commodity contract intangibles (0.09) - - - - (0.09)
Midwest Generation Bankruptcy Charges (0.02) - - - - (0.02)
4Q 2013 GAAP Earnings (Loss) Per Share $0.31 $0.13 $0.12 $0.06 $(0.04) $0.58
31 2014 4Q Earnings Release Slides
4Q YTD GAAP EPS Reconciliation
NOTE: All amounts shown are per Exelon share and represent contributions to Exelon's EPS. Amounts may not add due to rounding.
Year Ended December 31, 2013 ExGen ComEd PECO BGE Other Exelon
2013 Adjusted (non-GAAP) Operating Earnings (Loss) Per Share $1.40 $0.49 $0.45 $0.23 $(0.07) $2.50
Mark-to-market impact of economic hedging activities 0.35 - - - (0.00) 0.35
Unrealized gains related to nuclear decommissioning trust funds 0.09 - - - - 0.09
Asset Retirement Obligation (0.01) - - - - (0.01)
Plant retirements and divestiture 0.02 - - - - 0.02
Long-Lived asset impairment (0.12) - - - (0.02) (0.14)
Merger and integration costs (0.08) - - - - (0.08)
Amortization of commodity contract intangibles (0.41) - - - - (0.41)
Remeasurement of like kind exchange tax position - (0.20) - - (0.11) (0.31)
Amortization of the fair value of certain debt 0.01 - - - - 0.01
Reassessment of State Deferred Income Taxes 0.01 - - - (0.01) -
Midwest Generation Bankruptcy Charges 0.02 - - - - 0.02
4Q 2013 GAAP Earnings (Loss) Per Share $1.24 $0.29 $0.45 $0.23 $(0.21) $2.00

32 2014 4Q Earnings Release Slides
4Q YTD GAAP EPS Reconciliation - continued
Year Ended December 31, 2014 ExGen ComEd PECO BGE Other Exelon
2014 Adjusted (non-GAAP) Operating Earnings (Loss) Per Share $1.34 $0.47 $0.41 $0.23 $(0.06) $2.39
Mark-to-market impact of economic hedging activities (0.42) - - - - (0.42)
Unrealized gains related to NDT fund investments 0.10 - - - - 0.10
Asset Retirement Obligation 0.02 - - - - 0.02
Plant retirements and divestitures 0.28 - - - - 0.28
Long-Lived asset impairment (0.49) - - - (0.02) (0.50)
Gain on CENG Integration 0.18 - - - - 0.18
Merger and integration costs (0.10) - - - (0.11) (0.21)
Amortization of commodity contract intangibles (0.07) - - - - (0.07)
Tax settlements 0.12 - - - - 0.12
Reassessment of State Deferred Income Taxes 0.04 - - - (0.01) 0.03
Bargain-Purchase Gain 0.03 - - - - 0.03
Non-Controlling Interest (0.07) - - - - (0.07)
4Q 2014 GAAP Earnings Per Share $0.97 $0.47 $0.41 $0.23 ($0.20) $1.88
NOTE: All amounts shown are per Exelon share and represent contributions to Exelon's EPS. Amounts may not add due to rounding.
33 2014 4Q Earnings Release Slides
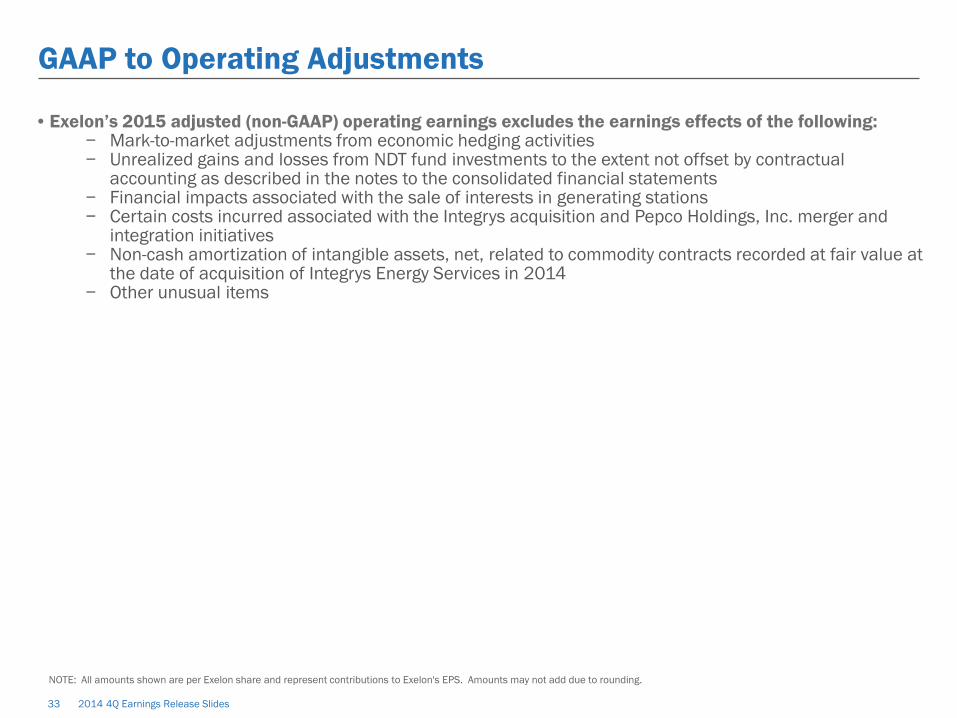
GAAP to Operating Adjustments
NOTE: All amounts shown are per Exelon share and represent contributions to Exelon's EPS. Amounts may not add due to rounding.
• Exelon’s 2015 adjusted (non-GAAP) operating earnings excludes the earnings effects of the following: − Mark-to-market adjustments from economic hedging activities − Unrealized gains and losses from NDT fund investments to the extent not offset by contractual
accounting as described in the notes to the consolidated financial statements − Financial impacts associated with the sale of interests in generating stations − Certain costs incurred associated with the Integrys acquisition and Pepco Holdings, Inc. merger and
integration initiatives − Non-cash amortization of intangible assets, net, related to commodity contracts recorded at fair value at
the date of acquisition of Integrys Energy Services in 2014 − Other unusual items

34 2014 4Q Earnings Release Slides
Adjusted O&M Reconciliations to GAAP 2014 Adjusted O&M Reconciliation (in $M)(3) ExGen ComEd PECO BGE Other Exelon GAAP O&M $5,575 $1,450 $875 $700 $(25) $8,575
PHI Merger and Acquisition Costs - - - - (25) (25)
Regulatory O&M(1) - (250) (100) - - (350)
Upstream and Power Impairments (525) - - - (25) (525)
Constellation Merger Commitments (50) - - - - (50)
Direct cost of sales incurred to generate revenues for certain Constellation businesses(2) (325) - - - - (325)
O&M for managed plants that are partially owned (300) - - - - (300)
Other (25) - - - - (25)
Adjusted O&M (Non-GAAP, as shown on slide 4) $4,350 $1,200 $750 $700 $(75) $6,950
(1) Reflects P&L neutral O&M. (2) Reflects the direct cost of sales of certain Constellation businesses of Generation, which are included in Total Gross Margin. (3) All amounts rounded to the nearest $25M.

35 2014 4Q Earnings Release Slides
Adjusted O&M Reconciliations to GAAP
2015 Adjusted O&M Reconciliation (in $M)(3) ExGen ComEd PECO BGE Other Exelon GAAP O&M $5,225 $1,550 $850 $775 $(75) $8,350
PHI Acquisition Costs (25) - - - - (25)
Regulatory O&M(1) - $(300) (100) - - (425)
Decommissioning 25 - - - - 25
Direct cost of sales incurred to generate revenues for certain Constellation businesses(2) (300) - - - - (300)
O&M for managed plants that are partially owned (400) - - - - (400)
Adjusted O&M (Non-GAAP, as shown on slide 4) $4,525 $1,250 $750 $775 $(75) $7,225
(1) Reflects P&L neutral O&M. (2) Reflects the direct cost of sales of certain Constellation businesses of Generation, which are included in Total Gross Margin. (3) All amounts rounded to the nearest $25M.

36 2014 4Q Earnings Release Slides
ExGen Total Gross Margin Reconciliation to GAAP Total Gross Margin Reconciliation (in $M)(4) 2015 2016 2017
Revenue Net of Purchased Power and Fuel Expense(1)(5) $8,100 $8,000 $8,400
Other Revenues(2) $(250) $(250) $(250)
Direct cost of sales incurred to generate revenues for certain Constellation businesses(3) $(300) $(350) $(450)
Total Gross Margin (Non-GAAP, as shown on slide 6) $7,550 $7,400 $7,700
(1) Revenue net of purchased power and fuel expense (RNF), a non-GAAP measure, is calculated as the GAAP measure of operating revenue less the GAAP measure of purchased power and fuel expense . ExGen does not forecast the GAAP components of RNF separately. RNF also includes the RNF of our proportionate ownership share of CENG.
(2) Reflects revenues from operating services agreement with Fort Calhoun, variable interest entities, funds collected through revenues for decommissioning the former PECO nuclear plants through regulated rates and gross receipts tax revenues.
(3) Reflects the cost of sales and depreciation expense of certain Constellation businesses of Generation. (4) All amounts rounded to the nearest $50M. (5) Excludes the impact of the operating exclusion for mark-to-market due to the volatility and unpredictability of the future changes to power prices.