EARN AT COMIC CONS? - The News Blog of Comics …€¦ · hint: all the bills in the background are...
24
HINT: ALL THE BILLS IN THE BACKGROUND ARE ONES. HOW MUCH DID INDIE EXHIBITORS EARN AT COMIC CONS? CONVENTION EXHIBITOR MEGA SURVEY 2014 RESULTS
Transcript of EARN AT COMIC CONS? - The News Blog of Comics …€¦ · hint: all the bills in the background are...

HINT: ALL THE BILLS IN THE BACKGROUND ARE ONES.
HOW MUCH DID
INDIE EXHIBITORS EARN AT
COMIC CONS?
CONVENTION EXHIBITOR MEGA SURVEY 2014 RESULTS

INRODUCTION$In 2013, we asked 46 of our fellow artists, small press publishers, cartoonists, and makers to anonymously answer questions about the pop culture conventions and indie comics shows (aka CAFs) they attended. We asked for their opinions of the shows and their gross sales (sales before expenses). The results were often surprising with many twists and turns. But also: graphs!
In 2014, we had 107 participants! We don’t need a graph to tell us that is over twice the exhibitors over 2013. (Wait... or is it? Damn it, maybe we do need that graph.) Thank you to all the participants and to Heidi MacDonald at The Beat for making our dream of crunching numbers for several weeks a reality. If only our statistics teachers could see us now. Think of the extra credit!
Our goal with this survey is two-fold:
• To give exhibitors a sense of how they are selling in relation to their peers. • To give exhibitors a sense of which shows are the best and which ones are “the rest,” so they can make better decisions (and more $$$).
We asked exhibitors about 32 shows total. However, many of them to did not yield enough data to “break them out” into their own sections. If you don’t see your local show here, the only way to fix that is to fill out the 2015 survey!
We hope you’ll find this year’s data illuminating. So, onward heroes! Your statistical destiny awaits...

0
500
1000
1500
2000
0
1000
2000
3000
4000
5000
OVERALL SALES IN 2014
PER SHOW AVERAGE
$1000
COMIC CONS:$1450
VS.INDIE CONS:
$615
$1100$800 $970
$4500
AVG. SALES BY EXHIBITOR TYPE
Artists Cartoonists Publishers Makers &Designers
$800$950
$1690
$800
AVG. SALES BY EXPERIENCE
0-2 Yrs. 3-5 Yrs. 6-9 Yrs. 10+ Yrs.
AVG. SALES BY PLACEMENT
$845
$900
ArtistAlley
Small Press
ExhibitorBooth
AVG. SALES BY SPACE
$540
$625
$1280
1/2 Indie Table
1 Indie Table
1 Con Booth2 Con
Booths
0 500 1000 1500 2000 2500
$2255
0 500 1000 1500 2000 2500 3000 3500 4000
$3800
Note: We used median averages for the survey, because the top sales numbers were often so high above the majority of sales responses that a mean average would be oddly skewed, giving a false representation of the “typical” convention selling experience.

0
300
600
900
1200
1500
0
300
600
900
1200
1500
OVERALL SALES IN 2014
HIGH SCORE$
San Diego Comic-Con: $90,000San Diego Comic-Con: $25,500
Phoenix Comicon: $17,300San Diego Comic-Con: $15,125
Denver Comic Con: $14,300
Facebo
ok
CHANGES TO 2015 SCHEDULE
2014 OVERALL SALES VS. 2013
AVG. SALES BY GENREHumor: $1200Fan Art: $1150Horror: $1000
Superhero: $900Action / Adventure: $850
Kids: $755Fantasy: $685
Alternative: $625Autobio: $580
$1410
AVG. SALES BY BOOTH CHANGES
Added Space
FLAT26%
DOWN23%
UP51%
New Signs
New Staff
Altered Prices
New Product
No Change
$1160
$700
$1235
$975$1035
AVG. SALES BY MARKETING
$1000$900
$800$900
$1420
Tum
blr
PR
to W
ebsites
PR
to O
ther N
ews So
urces
“More Shows”30.3%
“Fewer Shows”22.5%
“Same Shows” 12.4%
“Dumping some to add others”
18%
“Not Sure”15.7%
“I’m staying
home for good!”
1.1%

0
$1,000
$2,000
$3,000
$4,000
$5,000
$6,000
$7,000
$8,000
90th75th50th25th10th
0
$5,000
$10,000
$15,000
$20,000
99th90th75th50th25th10th
FIND YOUR PERCENTILE
SHOW TYPE PERCENTILE
$300$100
AVERAGESALES
PER SHOW
$200 $420 $1000$2205
$5000
$17300
$650$220
$1450
$3010
$7000
$1500$4060
$600
INDIE CON COMIC-CON
0
$1,000
$2,000
$3,000
$4,000
$5,000
$6,000
90th50th10th
EXPERIENCE PERCENTILE
EXPERIENCE PERCENTILE II
$200$160
$1900$800
$5675
$2985
0-2 Years
3-5 Years
0
$2,000
$4,000
$6,000
$8,000
$10,000
$12,000
90th50th10th
10+ Years
6-9 Years
$650$150
$1600$800
$12000
$4250

OUR TAKEON THE WHOLE: It looks as though 2014 was a down year.Compared to the 2013 data, the per show average is down (2013: $1000), the average for a comic con was down (2013: $1940), and there were fewer “Up” sales reported overall (2013: 57.5%). Possible factors include: attendees spending less, a weak economy, most convention halls expanding, which tends to decrease every exhibitor’s overall take; and less quantifiable, a sense of convention fatigue. Most likely, this downward trend could be partially due to an increase of data in 2014 providing a clearer picture of the scene.
WHOA: There were some shockers for us. Makers and designers (crafters, branded producers, jewelry makers) averaged almost 4x as much per show as publishers, artists and cartoonists. Perhaps they charge more for goods on average? Or is this a sign of attendee tastes? Another surprise was the dip between average sales for exhibitors with 6-9 years experience and 10+ experience. Is there an average “peak” for an exhibitor’s sales? Whatever the reason for that one, it’s an eye opener.
TIPS, BUT ALSO TRICKS: According to the data, jumping from Artist Alley / Small Press to an Exhibitor Booth could 2x your sales. Likewise, going from one booth to two could 3x your sales. However, going from one to two tables at a CAF doesn’t do much for sales on average. Also, consider marketing your show appearances to news sources outside of social media – exhibitors who did tended to average higher sales.
FINAL WORD: $1000 per show? Uh, is it too late to get an MBA?

0 300 600 900 1200 1500
EMERALD CITY COMICON 2014
RANGE OF SALES(Not Including $0 Total)
Highest: $11,000Lowest: $230
REPORT CARDOrganization: 4.2
Attendee Interest in Buying: 3.7Overall Rating: 3.7
SURVEY SAYS: Most had high praise for the show’s staff and volunteers. “ECCC is well managed, the organizers are great and it’s a very well run convention.” However, there is a feeling that “they are catering to the big publishers and pushing the little guys to the back.” Exhibitors observe these back areas are poorly trafficked, perhaps because “most people think there is only one place for artist alley and therefore don’t think to look for more.”
OUR TAKE: The show’s average sales are down from last year (2013: $1700) and there were more reported flat sales overall (2013: 10% “Flat,” 70% “Up”). If the show’s superstar organizers find a way to encourage visitors to explore more of the hall, we suspect the average numbers will benefit.
TIPS: If you’re exhibiting in the back areas, be sure to bring a machete and a sherpa – your table is past many layers of thick vegetation.
Based on the responses of23 exhibitors:
SALES AVERAGE:$1500
Artist Alley: $295Exhibitor Booth: $695-$850
$815
SALES BY EXPERIENCE & PLACEMENT
First Year
$1500
$1500
$1125
OVERALL SALES
Return Exhibitor
Artist Alley
Exhibitor Booth
FLAT41.2%
UP35.3%
DOWN23.5%

05 0 100 150 200 250 300 350
MOCCA FEST 2014
RANGE OF SALES(Not Including $0 Total)
Highest: $1,500Lowest: $75
REPORT CARDOrganization: 4.1
Attendee Interest in Buying: 3.6Overall Rating: 3.8
SURVEY SAYS: The consensus is that the Society of Illustrators organized the show well, with “very attentive volunteers in the aisles,” who “promptly handled any concerns or questions voiced,” and “the crowd is really fun.” However, everyone agrees “tables are WAY too expensive” and some folks “didn’t even break even on the table.”
OUR TAKE: Based on average sales and table cost numbers, it seems many exhibitors aren’t profiting from this show. If you’re tabling solely to network and share your comics, we’re guessing you won’t be disappointed. Otherwise...
TIPS: It’ll be $40,000 for a half table next year, but the cost includes a snazzy tote bag.
Based on the responses of12 exhibitors:
SALES AVERAGE:$320
Half Table: $210-$290Full Table: $330-$460
SALES BY SPACE
HalfTable $310
$320
OVERALL SALES
FLAT37.5% UP
50%
DOWN12.5%
FullTable

WONDERCON ANAHEIM 2014
RANGE OF SALES(Not Including $0 Total)
Highest: $7,800Lowest: $35
REPORT CARDOrganization: 4.4
Attendee Interest in Buying: 3.5Overall Rating: 3.7
SURVEY SAYS: Folks described demand as “softer” this year for a variety of reasons: “the attendees were largely dismissive,” “they had apparently added more exhibitors to the floor that year, which further sliced up the pie” and for small press, “poor placement” compared to previous years. Still, there were some sales success stories and people praising WCA staff for being “super responsive and great to work with.”
OUR TAKE: The overall average was down from last year (2013: $1680), and there were more “Flat” sales (2013: 75% “Up,” 0% “Flat”). However, it looks like booth exhibitors fared better than last year (2013: $3040). Hopefully, they won’t keep expanding and messing with the floor.
TIPS: “Exhibitors, please get back to your booths and stop posing for pictures in the Mario Kart. Come on. We mean it!”
Based on the responses of15 exhibitors:
SALES AVERAGE:$1360
Artist Alley: $210 Small Press: $300
Exhibitor Table: $500-$700Exhibitor Booth: $900-$2900
SALES BY SPACE
Artist Alley
$435
$4500
OVERALL SALES
FLAT36.4%
UP36.4%
DOWN27.4%
Exhibit. Booth
0 1000 2000 3000 4000 5000
Small Press
$1100

TORONTO COMIC ARTS FESTIVAL 2014
RANGE OF SALES(Not Including $0 Total)
Highest: $1,800Lowest: $50
REPORT CARDOrganization: 4.1
Attendee Interest in Buying: 4.5Overall Rating: 4.7
SURVEY SAYS: The few who left comments on this show didn’t sell well, but noted that “the social experience was invaluable.” NOTE: Because TCAF tends to change out the exhibitor line up every year, there were not enough respondents who also exhibited in 2013 to compare year-to-year overall sales.
OUR TAKE: TCAF got the highest overall rating, and the highest buyer interest rating. For a CAF, the show delivers a solid show average relative to table costs. Rather than expanding the floor, they’re adding more programming and events. If you can get in, we recommend this one.
TIPS: Avoid inspection at the Canadian border by rafting your books across one of several finger lakes.
Based on the responses of10 exhibitors:
SALES AVERAGE:$1075
Half Table: $175 Full Table: $350

PHOENIX COMICON 2014RANGE OF SALES
(Not Including $0 Total)Highest: $17,300
Lowest: $50
REPORT CARDOrganization: 4.5
Attendee Interest in Buying: 3.7Overall Rating: 4.1
SURVEY SAYS: Overall glowing marks from exhibitors, despite sales being down. “The crowds are a fair mix of autograph seekers and true blue fans,” and the show is “well organized” with a “good fan-base” who showed “genuine enthusiasm.” However, folks pointed out their lower sales, one attributing it to “reoriented Artists’ Alley tables” and floor expansion.
OUR TAKE: Indeed, average sales were off from last year (2013: $2000) and overall reported sales were surprisingly “Down” (2013: 87.5% “Up,” 12.5% “Down”). Even if they are down from last year, the show is still a winner overall with high marks and high average profits. *Recommendation Stamp*
TIPS: Looking for free parking? Conveniently located just a few blocks from the convention center are many sketchy streets to choose from.
Based on the responses of15 exhibitors:
SALES AVERAGE:$1780
Artist Alley: $229Exhibitor Booth: $599
OVERALL SALESFLAT7.7%
UP53.8%
DOWN38.5%

DENVER COMIC CON 2014RANGE OF SALES
(Not Including $0 Total)Highest: $14,300
Lowest: $880
REPORT CARDOrganization: 3.2
Attendee Interest in Buying: 3.6Overall Rating: 3.4
SURVEY SAYS: Exhibitors mostly praised the fans, saying they’re “great” and “VERY interested in buying art and supporting local talent.” However, they also cited the show’s organizational shift as having “a devastating impact on the exhibitor floor experience.” The hall was “madness” with “way too much stuff happening on the floor,” including a marching band. (?!)
OUR TAKE: Intriguingly, the show’s ratings are way down from last year (2013: 4.4), but average sales are way up from last year (2013: $2100). Yet, most people reported “Flat” sales compared to last year. It’s a mix of good signs and red flags. We’ll need more exhibitors to share their sales for DCC in 2015 to get a better picture.
TIPS: WHAT?! SORRY, WE CAN’T GIVE YOU A TIP OVER THIS F%#&ING MARCHING BAND!
Based on the responses of8 exhibitors:
SALES AVERAGE:$3220
Artist Alley: $225Exhibitor Booth: $700-$850
OVERALL SALES
UP33.3%FLAT
50%
DOWN16.7%

0 500 1000 1500 2000 2500 3000 3500 4000
SAN DIEGO COMIC -CON 2014
RANGE OF SALES(Not Including $0 Total)
Highest: $90,000Lowest: $520
REPORT CARDOrganization: 4.3
Attendee Interest in Buying: 3.3Overall Rating: 4.1
SURVEY SAYS: “It is really difficult to compete with some of the larger media presence at San Diego,” or to put it bluntly, “you can’t beat any of the big brands.” Also, attendee interest in freebies “bordered on the pathological,” and the show is “expensive as heck.” However, while some claimed they do “much better in a zine fest/small press setting,” many described sales as “excellent” this year.
OUR TAKE: Average sales are up from last (2013: $2800) and scores remain high (2013: Overall – 4.2), though perceived attendee interest took a dive (2013: 3.8). There is definitely money to be made: a high score of $90,000 suggests the ceiling is very high. Bring your sales A-game and try not to let the looming shadow of multinational corporations harsh your vibe.
TIPS: It’s still illegal to strangle someone for asking which of your books are free.
Based on the responses of18 exhibitors:
SALES AVERAGE:$3290
Artist Alley: FREESmall Press: $500
Exhibitor Table: $900-$1000Exhibitor Booth: $2100-$5500
SALES BY EXPERIENCE
$2000
$4000
OVERALL SALES
Return Exhibitor
FLAT7.7%
UP69.2%
DOWN23.1%
FirstYear

SALT LAKE COMIC CON 2014
RANGE OF SALES(Not Including $0 Total)
Highest: $7,160Lowest: $600
REPORT CARDOrganization: 2.4
Attendee Interest in Buying: 2Overall Rating: 2.2
SURVEY SAYS: Yikes. One exhibitor said it was “a pleasure to interact with the attendees.” That was the only compliment. Here’s what others said: “The entire vibe of this show is as a money-making vehicle for the organizers and nothing else.” “It was basically a comic-con themed county fair.” “The layout of the hall was terrible.” “Placement of exhibitors appeared to be random.” “Folks were there to spend money on photos and signatures, not art. Calling it a ‘comic-con’ is a misnomer.” You get the idea.
OUR TAKE: This show had the lowest overall ratings, but above average sales. Though the booth cost is a bit high considering the average. Local exhibitors with low overhead could likely slog through the show with a marginal profit, but given the negative comments, it’s probably not worth a trip.
TIPS: One of the biggest attractions on the floor was local TV comedy show Studio C. If you specialize in Studio C fan art, you will make a killing.
Based on the responses of8 exhibitors:
SALES AVERAGE:$1570
Artist Alley: $200Small Press: $450
Exhibitor Booth: $900
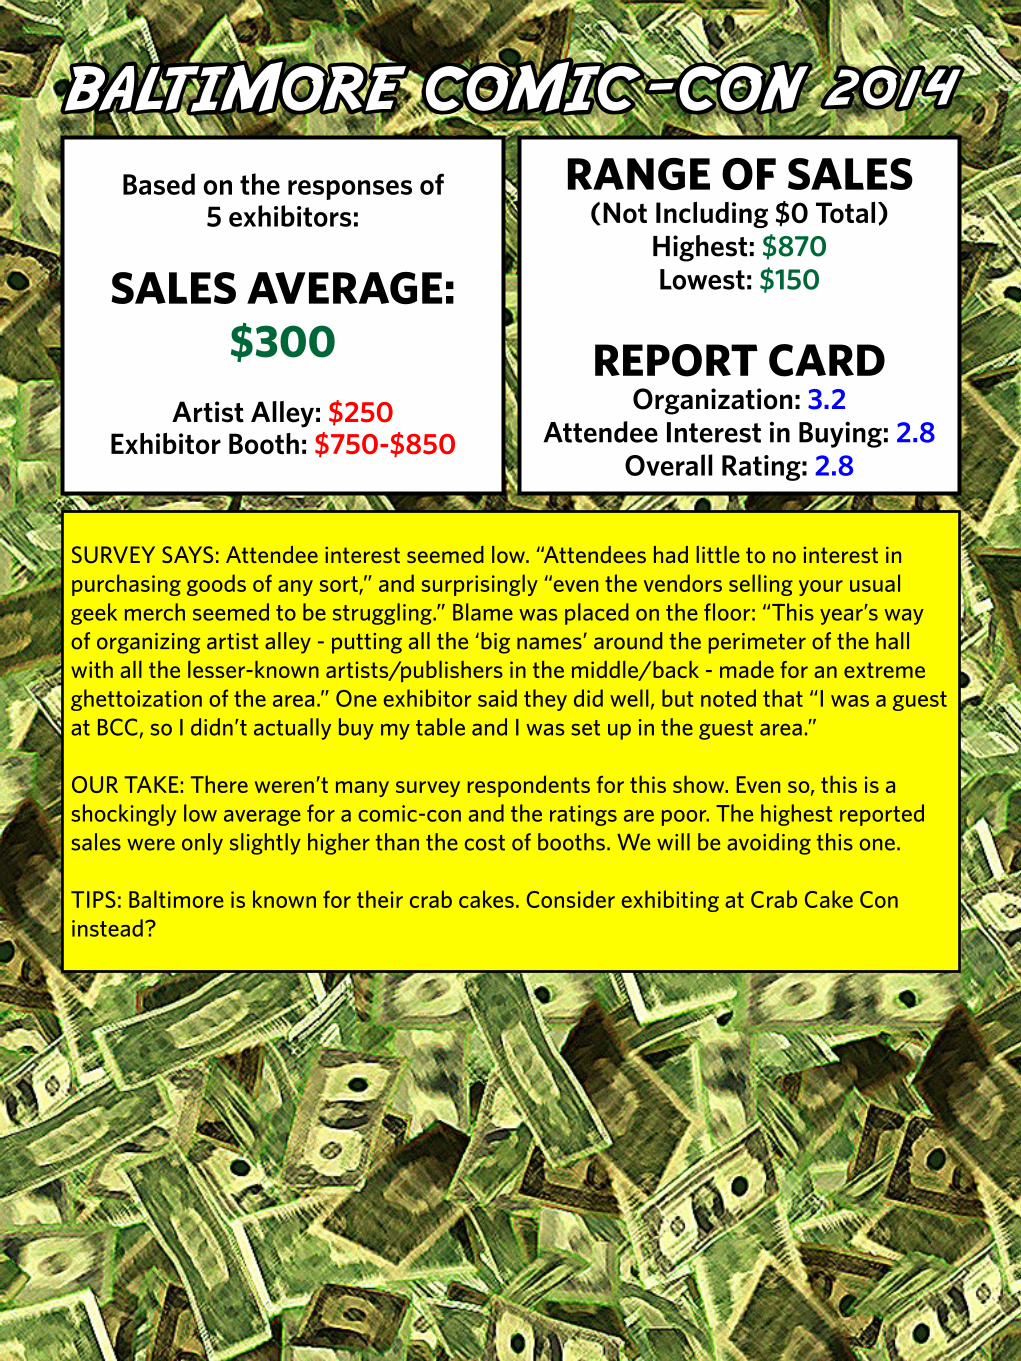
BALTIMORE COMIC -CON 2014
RANGE OF SALES(Not Including $0 Total)
Highest: $870Lowest: $150
REPORT CARDOrganization: 3.2
Attendee Interest in Buying: 2.8Overall Rating: 2.8
SURVEY SAYS: Attendee interest seemed low. “Attendees had little to no interest in purchasing goods of any sort,” and surprisingly “even the vendors selling your usual geek merch seemed to be struggling.” Blame was placed on the floor: “This year’s way of organizing artist alley - putting all the ‘big names’ around the perimeter of the hall with all the lesser-known artists/publishers in the middle/back - made for an extreme ghettoization of the area.” One exhibitor said they did well, but noted that “I was a guest at BCC, so I didn’t actually buy my table and I was set up in the guest area.”
OUR TAKE: There weren’t many survey respondents for this show. Even so, this is a shockingly low average for a comic-con and the ratings are poor. The highest reported sales were only slightly higher than the cost of booths. We will be avoiding this one.
TIPS: Baltimore is known for their crab cakes. Consider exhibiting at Crab Cake Con instead?
Based on the responses of5 exhibitors:
SALES AVERAGE:$300
Artist Alley: $250Exhibitor Booth: $750-$850

0 100 200 300 400 500 600 700 800
SMALL PRESS EXPO 2014
RANGE OF SALES(Not Including $0 Total)
Highest: $4,060Lowest: $80
REPORT CARDOrganization: 4.2
Attendee Interest in Buying: 4.4Overall Rating: 4.6
SURVEY SAYS: A lot of love for SPX. Several cited it as their “favorite convention,” one exhibitor adding, “everybody is friendly and interested in talking about, making, and buying comics.” Complaints included table rates being “a little expensive” and “the application process was tough to understand this year.” Only one exhibitor talked about their sales, saying “I cleaned up at SPX: sold out of my new book in the first few hours.”
OUR TAKE: The show’s ratings have increased over last year (2013: Overall – 4), even if average sales have not (2013: $300). On average, it looks like sales improve proportionately with a full table. (Apparenly not the case at MoCCA.) From these numbers, it seems like a small minority significantly profit here, but a majority have a good time.
TIPS: Find a bank that will convert good vibes into US dollars. ;-D
Based on the responses of17 exhibitors:
SALES AVERAGE:$300
Half Table: $150 Full Table: $300
SALES BY SPACE
Half Table
$780
OVERALL SALES
FLAT23.1%
UP69.2%DOWN
27.4%
FullTable
$300

ROSE CITY COMIC CON 2014
RANGE OF SALES(Not Including $0 Total)
Highest: $2,600Lowest: $150
REPORT CARDOrganization: 4.3
Attendee Interest in Buying: 3.1Overall Rating: 3.8
SURVEY SAYS: Exhibitors called Rose City a “cute show” with a “friendly staff.” Attendees were “positive and energetic,” but they weren’t “flush with disposable income” and “still don’t really know how to buy art from artists.” They weren’t a “huge buying crowd.”
OUR TAKE: These numbers don’t look encouraging for growing profits, and not just the average show vs. booth costs. On average, return exhibitors didn’t make much more than first year exhibitors, and 80% of those return exhibitors’ sales were either down or flat. The show’s solid organizers will hopefully encourage their attendees to buy more.
TIPS: Sales leave a bad taste in your mouth? Good thing you’re in Portland, land of tater tots and elaborate donuts.
Based on the responses of15 exhibitors:
SALES AVERAGE:$650
Artist Alley: $225 Exhibitor Booth: $495-$595
SALES BY EXPERIENCE
First Year
$650
OVERALL SALES
FLAT40%
UP20%
Return Exhibitor
$635
0 100 200 300 400 500 600 700 800
DOWN40%

LONG BEACH COMIC CON 2014
RANGE OF SALES(Not Including $0 Total)
Highest: $5,000Lowest: $200
REPORT CARDOrganization: 3.6
Attendee Interest in Buying: 3.3Overall Rating: 3.1
SURVEY SAYS: Some described the crowd as “really pleasant,” and that “Saturday was great [for sales],” whereas others described it as “a bust.” One said, “Ended up leaving on Sunday afternoon due to no traffic.” Another said, “it’s always a pleasure to both attend and table at LBCC,” whereas another noted that “load in is terrible for artists alley. They give a two hour window and if you can’t make it that’s that.” The last comment was simply: “It’s OK.”
OUR TAKE: It’s a lower than average show for both sales and ratings. Some like exhibiting at the show, others do not. On average, it’s probably better to stay in Artist Alley for this one.
TIPS: It’s hard for exhibitors to compete with the dollar book store across the street. You can get the “It’s Pat” book and a Math Blaster CD-ROM together for just $2!
Based on the responses of7 exhibitors:
SALES AVERAGE:$690
Artist Alley: $150-$250Exhibitor Booth: $1000-$4400
OVERALL SALES
UP60%
DOWN40%
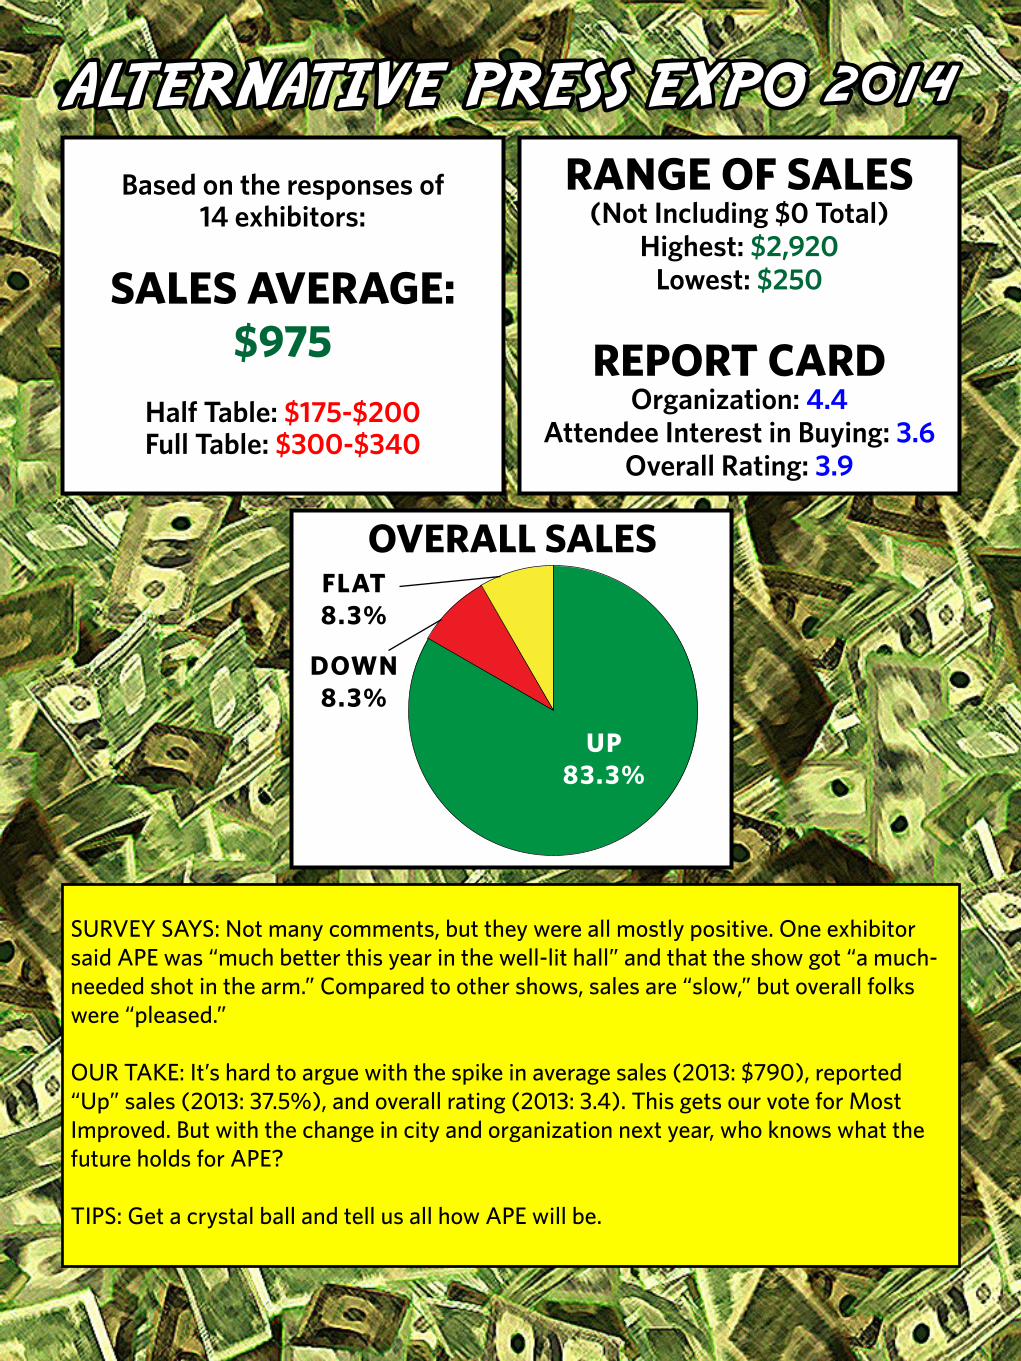
ALTERNATIVE PRESS EXPO 2014
RANGE OF SALES(Not Including $0 Total)
Highest: $2,920Lowest: $250
REPORT CARDOrganization: 4.4
Attendee Interest in Buying: 3.6Overall Rating: 3.9
SURVEY SAYS: Not many comments, but they were all mostly positive. One exhibitor said APE was “much better this year in the well-lit hall” and that the show got “a much-needed shot in the arm.” Compared to other shows, sales are “slow,” but overall folks were “pleased.”
OUR TAKE: It’s hard to argue with the spike in average sales (2013: $790), reported “Up” sales (2013: 37.5%), and overall rating (2013: 3.4). This gets our vote for Most Improved. But with the change in city and organization next year, who knows what the future holds for APE?
TIPS: Get a crystal ball and tell us all how APE will be.
Based on the responses of14 exhibitors:
SALES AVERAGE:$975
Half Table: $175-$200Full Table: $300-$340
OVERALL SALES
UP83.3%
FLAT8.3%
DOWN8.3%

NEW YORK COMIC CON 2014
RANGE OF SALES(Not Including $0 Total)
Highest: $3,200Lowest: $200
REPORT CARDOrganization: 4.1
Attendee Interest in Buying: 3.6Overall Rating: 3.7
SURVEY SAYS: Not many comments, but they were mostly negative regarding attendee interest. “The big problem is no one there seemed to care much about comics,” and that “there’s a big drop off in casual purchases.” However, there apparently were “many destination sales.”
OUR TAKE: There was a small increase in average sales from last year (2014: $2000) and a small increase in ratings across the board. The most encouraging sign is 80% reporting “Up” sales. Very high table costs vs. average sales makes this show a gamble in our humble opinion. NYCC has surpassed SDCC in attendance, but even accounting for the fewer responses, the highest sales for NYCC are much lower than SDCC, suggesting that NYCC may not have as strong a buying community among its attendees compared to SDCC.
TIPS: If you feel like you’re getting pushed around by the crowds, just shout, “Ayy, I’m exhibitin’ over here!”
Based on the responses of8 exhibitors:
SALES AVERAGE:$2100
Artist Alley: $550-$650Small Press: $975
Exhibitor Booth: $2300+
OVERALL SALES
UP80%
FLAT20%

GEEKGIRLCON 2014RANGE OF SALES
(Not Including $0 Total)Highest: $2,900
Lowest: $350
REPORT CARDOrganization: 3.4
Attendee Interest in Buying: 4.4Overall Rating: 4.4
SURVEY SAYS: “I love this con” was a common sentiment among exhibitors. “This one feels 100% like a safe and fun space all the time,” and the overall “vibe is wonderful.” Some grumbled about Artist Alley not being on the same floor as the Exhibitor Hall, which was “not an ideal experience,” and that “vendor organization felt a little off (as compared to other years),” but most enjoyed the show.
OUR TAKE: This was one of the highest rated shows, which is great, but sales are lower than average, which is not so great. However, the booth prices are quite reasonable, so locals with low overhead could make a nice profit here and likely enjoy themselves.
TIPS: Don’t be fooled by the insidious FakeGeekGirlCon, which pretends to like Batman in order to trick men for all kinds of unsubstantiated benefits!
Based on the responses of7 exhibitors:
SALES AVERAGE:$830
Artist Alley: $75Exhibitor Table: $200Exhibitor Booth: $325
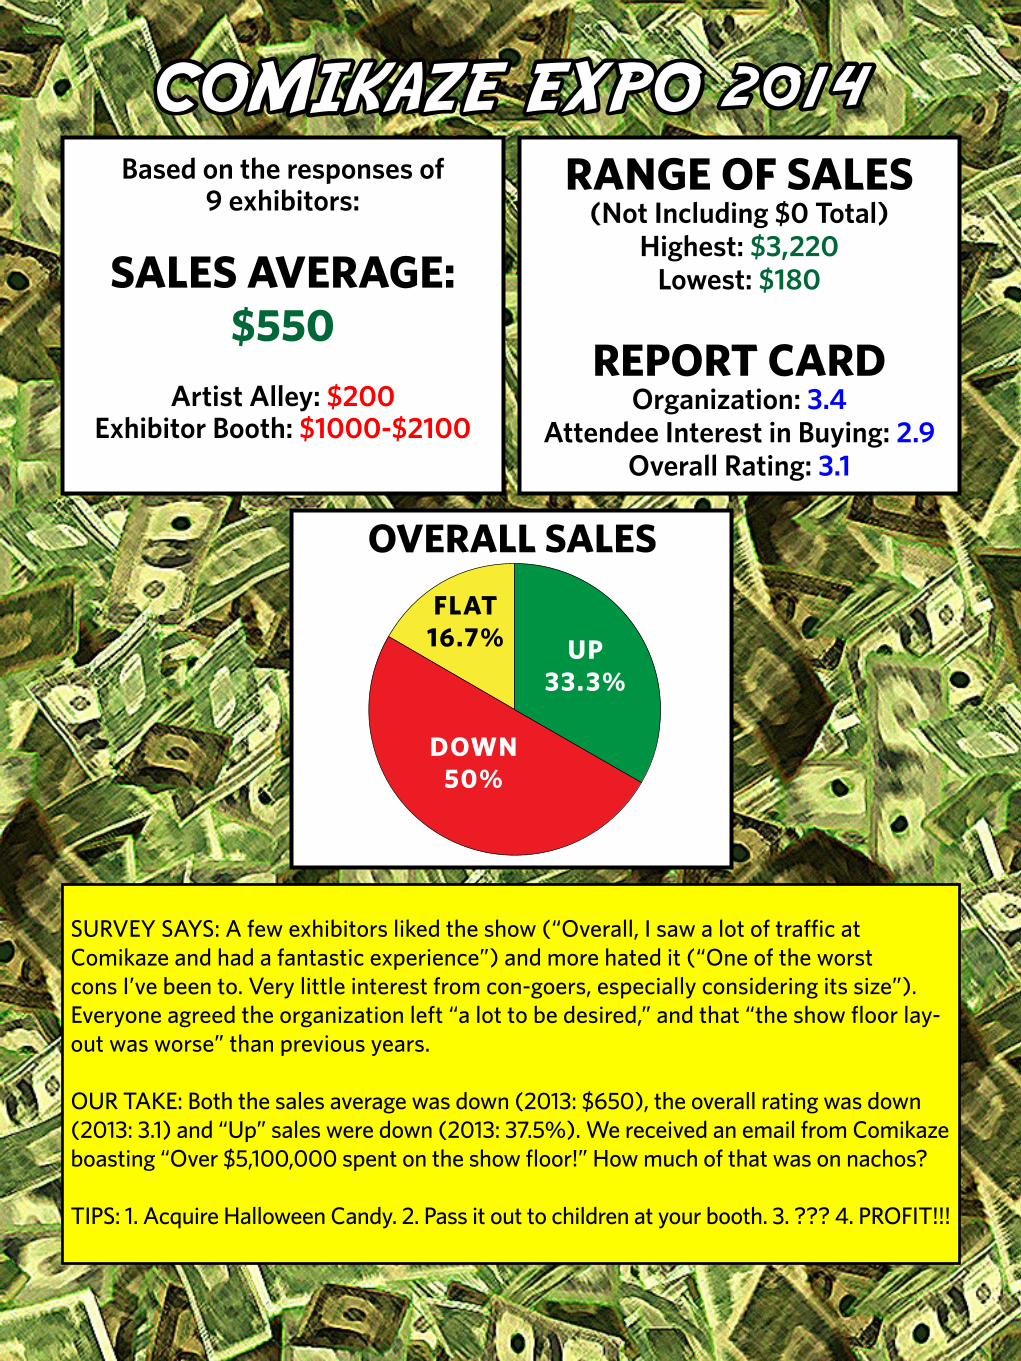
COMIKAZE EXPO 2014RANGE OF SALES
(Not Including $0 Total)Highest: $3,220
Lowest: $180
REPORT CARDOrganization: 3.4
Attendee Interest in Buying: 2.9Overall Rating: 3.1
SURVEY SAYS: A few exhibitors liked the show (“Overall, I saw a lot of traffic at Comikaze and had a fantastic experience”) and more hated it (“One of the worst cons I’ve been to. Very little interest from con-goers, especially considering its size”). Everyone agreed the organization left “a lot to be desired,” and that “the show floor lay-out was worse” than previous years.
OUR TAKE: Both the sales average was down (2013: $650), the overall rating was down (2013: 3.1) and “Up” sales were down (2013: 37.5%). We received an email from Comikaze boasting “Over $5,100,000 spent on the show floor!” How much of that was on nachos?
TIPS: 1. Acquire Halloween Candy. 2. Pass it out to children at your booth. 3. ??? 4. PROFIT!!!
Based on the responses of9 exhibitors:
SALES AVERAGE:$550
Artist Alley: $200Exhibitor Booth: $1000-$2100
OVERALL SALES
UP33.3%
DOWN50%
FLAT16.7%

2014 CONVENTION RANKS
BY AVERAGE SALES
1. San Diego Comic-Con $32902. Denver Comic Con $32203. New York Comic Con $21004. Phoenix Comicon $17805. Salt Lake Comic Con $15706. Emerald City Comicon $15007. WonderCon Anaheim $13608. TCAF $10759. APE $97510. GeekGirlCon $83011. Long Beach Comic Con $69012. Rose City Comic Con $65013. Comikaze Expo $55014. MoCCA Fest $32015. SPX $30016. Baltimore Comic-Con $300
THE SUPER RANKINGA Ranking That Takes Into Account Both Average Profits and Ratings
(% Profit Based on Avg. Sales Minus Table Costs) x (Avg. Rating)
1. TCAF 9. Rose City Comic Con2. Phoenix Comicon 10. Salt Lake Comic Con3. GeekGirlCon 11. New York Comic Con4. APE 12. SPX5. Denver Comic Con 13. MoCCA Fest6. Emerald City Comicon 14. Long Beach Comic Con7. San Diego Comic-Con 15. Comikaze Expo8. WonderCon Anaheim 16. Baltimore Comic-Con
BY AVERAGE RATING
1. TCAF 4.432. SPX 4.403. Phoenix Comicon 4.104. GeekGirlCon 4.075. APE 3.976. San Diego Comic-Con 3.907. WonderCon Anaheim 3.878. Emerald City Comicon 3.879. MoCCA Fest 3.8310. New York Comic Con 3.8011. Rose City Comic Con 3.7312. Denver Comic Con 3.4013. Long Beach Comic Con 3.3314. Comikaze Expo 3.1315. Baltimore Comic-Con 2.9316. Salt Lake Comic Con 2.20

VISIT OUR WEBSITES:
devastatorpress.com
comicsbeat.com