Early Alert of Academi cally At-Risk Students: An Open ...
42
(2014). Early Alert of Academically At‐Risk Students: An Open Source Analytics Initiative. Journal of Learning Analytics, 1(1), 6–47. ISSN 1929‐7750 (online). The Journal of Learning Analytics works under a Creative Commons License, Attribution ‐ NonCommercial‐NoDerivs 3.0 Unported (CC BY‐NC‐ND 3.0) 6 Early Alert of Academically At-Risk Students: An Open Source Analytics Initiative Sandeep M. Jayaprakash, Erik W. Moody, Eitel J.M. Lauría, James R. Regan, and Joshua D. Baron Marist College, USA [email protected] ABSTRACT: The Open Academic Analytics Initiative (OAAI) is a collaborative, multi‐year grant program aimed at researching issues related to the scaling up of learning analytics technologies and solutions across all of higher education. The paper describes the goals and objectives of the OAAI, depicts the process and challenges of collecting, organizing and mining student data to predict academic risk, and report results on the predictive performance of those models, their portability across pilot programs at partner institutions, and the results of interventions on at‐risk students. KEYWORDS: Learning analytics, open source, data mining, learning management systems, portability, retention, course completion 1 INTRODUCTION Higher education, particularly in the United States, is facing major strategic challenges regarding course and degree completion rates as well as overall college retention. Across all types of four‐year institutions, of those students starting bachelor degree programs in 2001, only 36% completed them within four years (U.S. Dept. of Education, 2009). As a result, the United States now ranks 12 th in the world in the percentage of 25‐ to 34‐year‐olds with an associate’s degree or higher (College Board Advocacy & Policy Center, 2010). Although not a panacea solution, the emergence of “big data” and analytics technologies within higher education has begun to provide new tools for addressing this developing national challenge (Long & Siemens, 2011). At the forefront of these big data and analytics solutions is learning analytics, which has recently emerged in the education domain in the aftermath of the successful application of data mining techniques in business organizations. The goal of learning analytics 1 is to uncover hidden patterns in 1 A distinction should be made between the terms academic analytics and learning analytics. There is more on this topic in Section 2. The name given to this research initiative when it was launched two years ago (Open Academic Analytics Initiative) is tied to an early definition of the term academic analytics. As the use of analytics in education is relatively new, there has been a natural evolution in the terminology used to describe it. The authors posit that the current definition of learning analytics better describes the kind of work carried out by this initiative. The main goal of this project is to improve the chances of student success in a specific course, which is also a central concern of learning analytics. We believe that this
Transcript of Early Alert of Academi cally At-Risk Students: An Open ...
(2014). Early Alert of Academically At‐Risk Students: An Open Source Analytics Initiative. Journal of Learning Analytics, 1(1), 6–47.
ISSN 1929‐7750 (online). The Journal of Learning Analytics works under a Creative Commons License, Attribution ‐ NonCommercial‐NoDerivs 3.0 Unported (CC BY‐NC‐ND 3.0) 6
Early Alert of Academically At-Risk Students: An Open Source Analytics Initiative
Sandeep M. Jayaprakash, Erik W. Moody, Eitel J.M.
Lauría, James R. Regan, and Joshua D. Baron
Marist College, USA
ABSTRACT: The Open Academic Analytics Initiative (OAAI) is a collaborative, multi‐year grant
program aimed at researching issues related to the scaling up of learning analytics technologies
and solutions across all of higher education. The paper describes the goals and objectives of the
OAAI, depicts the process and challenges of collecting, organizing and mining student data to
predict academic risk, and report results on the predictive performance of those models, their
portability across pilot programs at partner institutions, and the results of interventions on at‐risk
students.
KEYWORDS: Learning analytics, open source, data mining, learning management systems,
portability, retention, course completion
1 INTRODUCTION
Higher education, particularly in the United States, is facing major strategic challenges regarding course
and degree completion rates as well as overall college retention. Across all types of four‐year
institutions, of those students starting bachelor degree programs in 2001, only 36% completed them
within four years (U.S. Dept. of Education, 2009). As a result, the United States now ranks 12th in the
world in the percentage of 25‐ to 34‐year‐olds with an associate’s degree or higher (College Board
Advocacy & Policy Center, 2010). Although not a panacea solution, the emergence of “big data” and
analytics technologies within higher education has begun to provide new tools for addressing this
developing national challenge (Long & Siemens, 2011).
At the forefront of these big data and analytics solutions is learning analytics, which has recently
emerged in the education domain in the aftermath of the successful application of data mining
techniques in business organizations. The goal of learning analytics1 is to uncover hidden patterns in
1 A distinction should be made between the terms academic analytics and learning analytics. There is more on this topic in Section 2. The name given to this research initiative when it was launched two years ago (Open Academic Analytics Initiative) is tied to an early definition of the term academic analytics. As the use of analytics in education is relatively new, there has been a natural evolution in the terminology used to describe it. The authors posit that the current definition of learning analytics better describes the kind of work carried out by this initiative. The main goal of this project is to improve the chances of student success in a specific course, which is also a central concern of learning analytics. We believe that this

(2014). Early Alert of Academically At‐Risk Students: An Open Source Analytics Initiative. Journal of Learning Analytics, 1(1), 6–47.
ISSN 1929‐7750 (online). The Journal of Learning Analytics works under a Creative Commons License, Attribution ‐ NonCommercial‐NoDerivs 3.0 Unported (CC BY‐NC‐ND 3.0) 7
educational data and use those patterns to attain a better understanding of the educational process,
assess student learning, and make predictions on performance. The widespread deployment of learning
management system platforms that log student interactions with educational software has made large
data sets available, which enrich traditional student academic records and demographic data, facilitating
new research in this domain.
The Open Academic Analytics Initiative (OAAI), supported by a grant from EDUCAUSE’s Next Generation
Learning Challenges program, which was funded in part by the Bill and Melinda Gates Foundation, has
aimed to advance the field of Learning Analytics by exploring issues related to scaling this technology
across all of higher education. In particular, the project has worked to address three core research
questions:
1. What are the potential challenges, solutions, and benefits associated with developing a completely
open‐source early alert solution for higher education?
2. To what degree can predictive models be imported from the academic context (e.g., a four‐year
private liberal arts college) in which they were developed to new and potentially very different
academic contexts (e.g., two‐year community colleges)?
3. What intervention strategies are most effective in helping academically at‐risk students succeed?
To examine these questions, the OAAI has been engaged in the development of a prototype open‐
source academic early alert system that feeds from the Sakai CLE (Collaboration and Learning
Environment),2 and includes open predictive models based on the Pentaho Business Analytics suite,3 and
intervention strategies that leverage Open Educational Resources (OER). In addition, the OAAI has
conducted research on the portability of predictive models between institutions as well as the
effectiveness of engaging students in online academic support communities as means to improve
academic success. This paper will focus primarily on our research into predictive analysis, portability of
the models across institutions and intervention effectiveness, but details associated with the technical
aspects of OAAI’s open learning analytics ecosystem are available on the Sakai Project Wiki.4
To investigate the scaling issues related to portability and intervention effectiveness, the OAAI began by
creating a framework for the development of predictive models based on student data from Marist
College, a mid‐size comprehensive liberal arts institution located in New York State. These predictive
models were created using student demographic data (e.g., gender, age), aptitude data (e.g.,
standardized high school test cores), and learning management system data (e.g., site visits, assignment
submissions, partial contributions to the final course grade collected in the gradebook tool). This follows
project is only indirectly related to institutional goals such as college retention and cost savings, which are among the objects of study of academic analytics, in the current definition of this term.
2 http://www.sakaiproject.org 3 http://www.pentaho.com 4 https://confluence.sakaiproject.org/x/8aWCB

(2014). Early Alert of Academically At‐Risk Students: An Open Source Analytics Initiative. Journal of Learning Analytics, 1(1), 6–47.
ISSN 1929‐7750 (online). The Journal of Learning Analytics works under a Creative Commons License, Attribution ‐ NonCommercial‐NoDerivs 3.0 Unported (CC BY‐NC‐ND 3.0) 8
the same initial approach that Campbell (2007) did at Purdue in his dissertation work, in which he
developed models to detect students at risk of underperforming in a course. Comparing Marist’s data to
Purdue’s has provided insights into the degree to which the predictive models can be imported from
one type of institution to another.
The predictive models trained and tested with Marist College data were subsequently deployed at four
partner institutions (two community colleges5 and two HBCUs6), to further research issues of portability
and intervention effectiveness. With the conclusion of the project, these predictive models have been
released7 under an open‐source license in the standards‐based Predictive Model Markup Language
(PMML) as a means to facilitate use of and further enhancement of the models by others.
Predictive models do not influence course completion and retention rates without being combined with
effective intervention strategies aimed at helping at‐risk students succeed. To address this, the OAAI
developed a concept called an Online Academic Support Environment (OASE) that leverages Sakai
Project Sites to provide students with an online support community and resources aimed at aiding
academic success. Resources include OER (open educational resources) content for remediation and
study skill development, facilitation by a professional academic support specialist, and a student mentor
who acts as a peer coach.
In the next section, the paper reviews related research showing how others have applied data mining
techniques to assess student performance. Next, the paper describes the predictive modelling
framework developed by the OAAI, and the results of model development and testing on Marist College
data. Then the paper describes the deployment of an experimental academic early alert system, testing
data from partner institutions, and the deployment and effectiveness of different intervention strategies
at the aforementioned pilots. Finally, the paper provides a summary and conclusions, which include
future research opportunities.
2 RELATED WORK In the last decade, the discipline of analytics has permeated most layers of society and organizations.
Defined succinctly as the discovery and communication of meaningful patterns of data, analytics has
provided a data‐driven approach to the way in which individuals and organizations conduct business and
make decisions. Education, and in particular higher education, has not remained impervious to the lure
of analytics. Many colleges and universities around the world have started to apply analytics to gain new
insights on a variety of business and educational issues. The spectrum of possibilities is ample:
enhancing decision making in the admissions process, increasing financial and operational efficiency,
5 Community colleges in the USA are two‐year public institutions providing higher education and lower‐level tertiary education. 6 Historical Black Colleges and Universities (HBCUs) are institutions of higher education in the USA established before 1964 with the intention of serving the black community.
7 https://confluence.sakaiproject.org/pages/viewpage.action?pageId=75671025

(2014). Early Alert of Academically At‐Risk Students: An Open Source Analytics Initiative. Journal of Learning Analytics, 1(1), 6–47.
ISSN 1929‐7750 (online). The Journal of Learning Analytics works under a Creative Commons License, Attribution ‐ NonCommercial‐NoDerivs 3.0 Unported (CC BY‐NC‐ND 3.0) 9
improving fundraising programs, helping educators achieve a better understanding of their students
learning process and abilities, and enhancing student performance across courses and disciplines.
As in the case of any new discipline, the use of analytics in education has adopted a variety of terms to
describe aspects of research and practice. The extant literature on the use of analytics in education
includes references to academic analytics, learning analytics, predictive analytics, social learning
analytics, and educational data mining, to mention some of the most prominent terms used by
researchers and practitioners. Two distinct research communities, Educational Data Mining and Learning
Analytics and Knowledge, have developed because of the increasing interest in the application of
analytics in education, and the booming amount of available data and software platforms and tools.
Siemens and Baker (2012) chronicle the evolution of these research communities, their similarities and
differences, and call for more collaboration and integration, given the overlaps in research interests,
methodological approaches, and technologies between both communities.
The title given to the research initiative described in this paper (Open Academic Analytics Initiative)
when it was proposed in early 2011 is a good example of the way in which the terms adopted to
describe concepts and processes tied to analytics in education have evolved over time. If this project
were to be launched today, it would almost certainly be called Open Learning Analytics Initiative. The
distinction is subtle but substantive. In its inception, academic analytics was an overarching term,
focusing both on institutional issues (e.g., enrollment management) and instructional issues. Over time,
academic analytics has shifted its focus: most authors place its emphasis at an institutional level.
Learning analytics has spun off as a more specific term, focused on instructional issues. A recent
EDUCAUSE research report (van Barneveld, Arnold, & Campbell, 2012) tackles the issue of variability in
terminology, providing a definition of learning analytics as “the use of analytic techniques to help target
instructional, curricular, and support resources to support the achievement of specific learning goals” (p.
8), and uses the Course Signals project developed at Purdue (Arnold, 2010) as a typical example of a
learning analytics project. We believe that this definition of learning analytics, which also reflects its
commonly accepted use in the USA, encompasses the work of the OAAI, which focuses on early
detection of at‐risk students and subsequent intervention. In that spirit, the following paragraphs in
section 2.1 provide a condensed review of the literature in learning analytics, in particular the work
related to the use of data mining to predict academic performance. Section 2.2 follows with a short
literature review on intervention theory.
2.1 Early Alert and Prediction of Academic Performance
Initial attempts to use machine learning and data mining techniques to predict academic performance
and act upon it can probably be traced back to the early 2000s. Ma, Liu, Wong, Yu, and Lee (2000) used
a scoring function based on association rules to identify potential weak students, and subsequently
select the courses that each weak student is recommended to take. Chen, Liu, Ou, and Liu (2000)
applied decision trees on web log data to profile student groups that exhibit similar behaviour to a

(2014). Early Alert of Academically At‐Risk Students: An Open Source Analytics Initiative. Journal of Learning Analytics, 1(1), 6–47.
ISSN 1929‐7750 (online). The Journal of Learning Analytics works under a Creative Commons License, Attribution ‐ NonCommercial‐NoDerivs 3.0 Unported (CC BY‐NC‐ND 3.0) 10
particular pedagogical strategy. A conceptual paper by Zaïane and Luo (2001) pointed to the enabling
capabilities of these techniques on data generated by web‐based course management platforms to help
understand learners’ behaviour through usage pattern recognition, supporting educators to evaluate
the learning process better. Yu, Own, and Lin (2001) applied fuzzy association rules to capture
relationships between web usage patterns of a learner, including the time spent online, amount of read
and posted material, etc. Minaei‐Bidgoli and Punch (2003) classified students using features extracted
from logged data in a web‐based system in order to predict their final grades. They combined multiple
classifiers and weighted feature vectors using a genetic algorithm to optimize the prediction accuracy of
the classifier. Laurie and Timothy (2005) used data mining as a strategy for assessing discussion forums
in online courses, with the objective of enhancing the instructor’s ability to evaluate the progress of a
threaded discussion. Morris, Wu, and Finnegan (2005) used discriminant analysis on high school data
(GPA and standardized test scores) to predict the successful completion of online courses. Romero,
Ventura, & Garcia (2008) published a case study tutorial with the Moodle8 learning management system
to exemplify the application of data mining in learning management systems. The tutorial described how
different data mining techniques and packages could be used in order to improve the course and the
students’ learning. Bravo, Sosnovsky, and Ortigosa (2009) profiled low performance in e‐learning
systems using a decision trees classifier trained with log data consisting of records of student actions
within the system. The 2010 edition of the KDD Cup9 challenged competitors to predict student
performance on mathematical problems from logs of student interaction with Intelligent Tutoring
Systems, another piece of evidence pointing at the growing interest in learning analytics as a rich
applied research field.
There have been a number of academic initiatives at various colleges and universities preceding our
work that sought to detect students in academic difficulty by using analytics. Campbell, deBlois, &
Oblinger (2007) report on an experiment at the University of Alabama (UA) in 2002, where graduate
students in a data‐mining course who were given access to anonymized data of enrolled freshmen from
1999, 2000, and 2001 were able to develop predictive models of at‐risk students using a variety of data
mining techniques, including logistic regression, decision trees, and neural networks. The input data
used to train the models included demographic and aptitude data (e.g., standardized high school scores
and grades along with cumulative GPA in the freshman year). These models allowed the UA to identify
150–200 freshmen each year who were not likely to return for their sophomore year. In 2004, Northern
Arizona University (NAU) launched an initiative that used multiple data sources to identify at‐risk first‐
year students and to assess which proactive interventions have the best influence on their academic
success and retention. The model measured utilization of services and resources (e.g., academic services
recreational resources, social resources such as student organization membership, academic referrals,
and advising sessions), levels of risk (e.g., standardized high school test scores, high school GPA), and
8 http://www.moodle.org 9 KDD Cup 2010. See http://www.sigkdd.org/kddcup
(2014). Early Alert of Academically At‐Risk Students: An Open Source Analytics Initiative. Journal of Learning Analytics, 1(1), 6–47.
ISSN 1929‐7750 (online). The Journal of Learning Analytics works under a Creative Commons License, Attribution ‐ NonCommercial‐NoDerivs 3.0 Unported (CC BY‐NC‐ND 3.0) 11
outcomes (measured by first‐year student GPAs and enrollment retention status). The initiative has
evolved into an early alert system called GPS.10
In his doctoral dissertation at Purdue University, Campbell (2007) used factor analysis and logistic
regression on a set of student features derived from data extracted from Blackboard,11 which included
learning management system usage and student demographics. This research gave way to the
development of Course Signals (Arnold, 2010) a prominent early intervention system originally
developed at Purdue and currently owned and marketed by Ellucian.12 Course Signals builds models
from student data that predict which students may be struggling academically and subsequently
provides proactive intervention. Reports on pilots between fall 2007 and fall 2009 showed significant
improvement on course completion, and mastery of content learning outcomes, making Course Signals
one of the most successful proofs of concept of the use of data mining and statistical techniques to
develop early alert systems.
Barber and Sharkey (2012) report on the creation of a predictive model for the University of Phoenix to
identify academically at‐risk students. The model combines data from the learning management system,
financial aid system, and student system to calculate a likelihood of any given student failing the current
course. Other learning analytics projects include University of Maryland–Baltimore County’s “Check My
Activities” project (Fritz, 2011) and Grand Rapids Community College’s Project ASTRO,13 which
altogether are indicative of the growing interest in the application of these technologies.
Nevertheless, the number of initiatives that have been able to transition from concept to
implementation is still scarce, and the project described in this paper is one of the few to attain this
status. In addition, only a small number of implementations have scaled up to more than a few
institutions with most being implemented at just one (the one where it was developed).
This explains in part the amount of attention and recognition that the Open Academic Analytics Initiative
(OAAI) has received, including two prestigious international awards.14 As of its ending date of January
2013, the OAAI has successfully achieved all of its major project outcomes, including a) the development
and deployment of an open‐source academic early alert prototype system; b) the release of predictive
models under an open‐license; c) study of portability of predictive models from one academic context to
another; d) research on the impact of different intervention strategies on student performance.
10 Grade Performance Status, http://www4.nau.edu/ua/GPS/Faculty 11 http://www.blackboard.com 12 http://www.ellucian.com/signals 13 http://projects.oscelot.org/gf/project/astro 14 In March 2013, the OAAI was recognized by Computerworld as a 2013 Honors Laureate and Finalist in the Emerging Technology category, and in June 2013 by Campus Technology Magazine as one of only nine recipients for the Campus Technology Innovator Award (over 230 applied).

(2014). Early Alert of Academically At‐Risk Students: An Open Source Analytics Initiative. Journal of Learning Analytics, 1(1), 6–47.
ISSN 1929‐7750 (online). The Journal of Learning Analytics works under a Creative Commons License, Attribution ‐ NonCommercial‐NoDerivs 3.0 Unported (CC BY‐NC‐ND 3.0) 12
2.2 Intervention Theory Our approach has been to build upon the success of the Course Signals system developed at Purdue
University. We have used predictive analytical techniques to identify students at risk of course failure
and subsequently researched the effectiveness of two different interventions designed to improve
student outcomes. Course Signals addresses an issue that many instructors are aware of, but one that
has largely gone unaddressed in the literature. Often students do not understand how well they are
performing in a class until it is too late for those performing poorly to change their trajectory (Pistilli &
Arnold, 2010). Our design was in no small part influenced by the EDUCAUSE/Gates Foundation grant
that funded this project. The grant stipulated that effective techniques to improve student retention be
investigated and demonstrated in socio‐economically disadvantaged populations. We relied on
Campbell’s work at Purdue with Course Signals, which heavily referenced Tinto’s and Astin’s work,
suggesting that positive interactions, good grades, and increased faculty–student interaction (email
warnings) are among the most effective means of achieving better retention rates.
The work done at Purdue has shown that the use of relatively simple notification interventions can have
a significant effect on student behaviour. In one course with 220 students, 55% of those who were
initially identified as being at high risk for not completing the course moved into the moderate risk
category because of receiving an intervention. More impressively, almost 25% moved from high risk to
no or low risk, and of those who began at the “moderate risk” level, almost 70% rose to the no/low risk
category. This seems to indicate that simply making students aware that they are at risk of not
completing a course motivates them to seek help and change their academic behaviour. Interestingly,
once the interventions stopped, they found that the students who had received the “notification
interventions” continued to seek help and at a frequency of “30% more often than students in the
control group” (Arnold, 2010).
As the field is so new, there is very little data available on the measure of retention defined as
continued enrollment or graduation at a given institution. More recent data collected from the
Signals program indicates that over three years, students who have taken between one and five Signals
courses have significantly higher retention rates than students in a non‐Signals control group.
Furthermore, it was found that students who had chosen to participate in the Signals program had lower
standardized testing scores at entrance than control subjects (Arnold & Pistilli, 2012). These findings
represent the best data available on the longitudinal impact of an early alert intervention targeted
toward at‐risk students.
In a recent publication, Tinto discusses the importance of interventions that reach into the classroom.
Campus‐wide efforts to increase student engagement, such as clubs, social events, job fairs, etc., are
more likely to reach traditional on‐campus students than non‐residential students. Often interventions
must be employed through a course in order to reach minority populations (Tinto, 2012). The most
effective attempts to affect retention positively occur through interactions with faculty (Tinto, 1982;
(2014). Early Alert of Academically At‐Risk Students: An Open Source Analytics Initiative. Journal of Learning Analytics, 1(1), 6–47.
ISSN 1929‐7750 (online). The Journal of Learning Analytics works under a Creative Commons License, Attribution ‐ NonCommercial‐NoDerivs 3.0 Unported (CC BY‐NC‐ND 3.0) 13
Tinto, 1987). This point is supported by the Seven Principles of Good Practices, a series of approaches
designed to improve student outcomes. All seven of the principles in one way or another will have a
positive impact on student engagement (Chickering & Ehrmann, 1996). Principle one, encouraging
contact between students and faculty, is perhaps the principle most directly achieved through the
interventions deployed in this study. Our intervention achieves this through use of emails sent by the
instructor to the student. These emails could be customized to address specific issues with which the
student was struggling.
Tinto points out that early efforts to improve retention rates focused on selection and admission efforts:
“Stop talking to faculty about student retention and focus instead on the ways their actions can enhance
students’ education” (Tinto, 2007, p. 9). Tinto correctly suggests that many institutions chose to address
the issue of retention via the admission process. This approach ignores the fact that many students
enrolled in higher education institutions are unprepared for the challenges that face them. Additionally
some institutions specifically serve populations that are underprepared for the challenges of higher
education. We must instead focus on what we can do within our institutions to improve retention rates
of our admitted students. Tinto suggests that effective intervention will be specific to the setting in
which it is attempted. Differences in the institution size, focus, and target population require unique
approaches. Often institutions already have support services tailored to their student population needs.
Many institutions offer student services, such as access to a writing centre, proofreading services, or
math tutoring sessions. Unfortunately, these services often go underused by students who could benefit
from them the most (Tinto, 2012). Effective interventions will connect existing services to students who
may not even know they need these services. With this in mind, we encouraged students to take
advantage of the resources offered at their institution and designed specifically for that institution’s
student body. The OASE intervention was developed to address this issue specifically by connecting the
numerous services currently available at higher education institutions and the students who can most
benefit from these services.
Campbell also references Astin’s theory of student involvement, which suggests that most activities
requiring a student to interact with his or her instructor improve student retention and academic
performance (Astin, 1993; Astin, 1999). The receipt of an email from an instructor indicating that a
student’s performance is problematic creates a situation in which the student is more likely to address
the issue directly with the instructor. These interactions develop the student’s academic engagement,
potentially resulting in better retention rates. Singell and Waddell (2010) provide a nice review of Tinto
and Astin’s theories regarding the complex issue of student retention.
The OAAI has adhered to the notification system concept used at Purdue by leveraging Sakai Project
Sites to create an Online Academic Support Environment that provides a unique opportunity to engage
students identified as “needing help” in an online community designed to help them succeed
academically (more on this in section 4) . There is significant evidence from the past 20 years of research
that high levels of student engagement or involvement with their institution is empirically linked to
(2014). Early Alert of Academically At‐Risk Students: An Open Source Analytics Initiative. Journal of Learning Analytics, 1(1), 6–47.
ISSN 1929‐7750 (online). The Journal of Learning Analytics works under a Creative Commons License, Attribution ‐ NonCommercial‐NoDerivs 3.0 Unported (CC BY‐NC‐ND 3.0) 14
higher rates of student retention (Cuseo, n.d.). Although the correlation between support groups and
academic success has not been as widely researched, recent studies have also shown compelling
evidence that students who participate in support groups had significantly higher first‐ and second‐
semester and cumulative GPAs than their peers who did not participate. In addition, students who
participated in such groups were much more likely to persist into their sophomore year (79% vs. 39%)
(Folger, Carter, & Chase, 2004).
There has been relatively little attention directed at the importance of timing in determining the
effectiveness of any intervention. The logic is simple, the sooner an intervention can be deployed, the
more time a student has to address the problem. A series of studies using absenteeism as an indicator of
performance in the classroom have consistently pointed to the importance of providing feedback to the
student early in the semester (Bevitt, Baldwin, & Calvert, 2010). Absenteeism is a reliable and easily
collected indicator of performance, providing an opportunity for intervention as early as two weeks into
the semester (Smith & Beggs, 2003; Colby, 2004). Two separate studies have confirmed, the earlier the
intervention, the better the opportunity for the student to change his or her grade in a positive direction
(Colby, 2004; Newman‐Ford, Fitzgibbon, Lloyd & Thomas, 2008).
3 PREDICTIVE MODELLING FOR ACADEMIC RISK DETECTION The predictive analysis goal of the OAAI was to detect, relatively early in the semester, those
undergraduate students who were in academic difficulty in the course by using student data. This task
was re‐expressed as a binary classification process with the purpose of discriminating between students
a) in good standing or b) academically at‐risk.15 Classification is a supervised learning task, where a set of
input data samples, each of them labelled with a target class value, is used to train the classification
model.
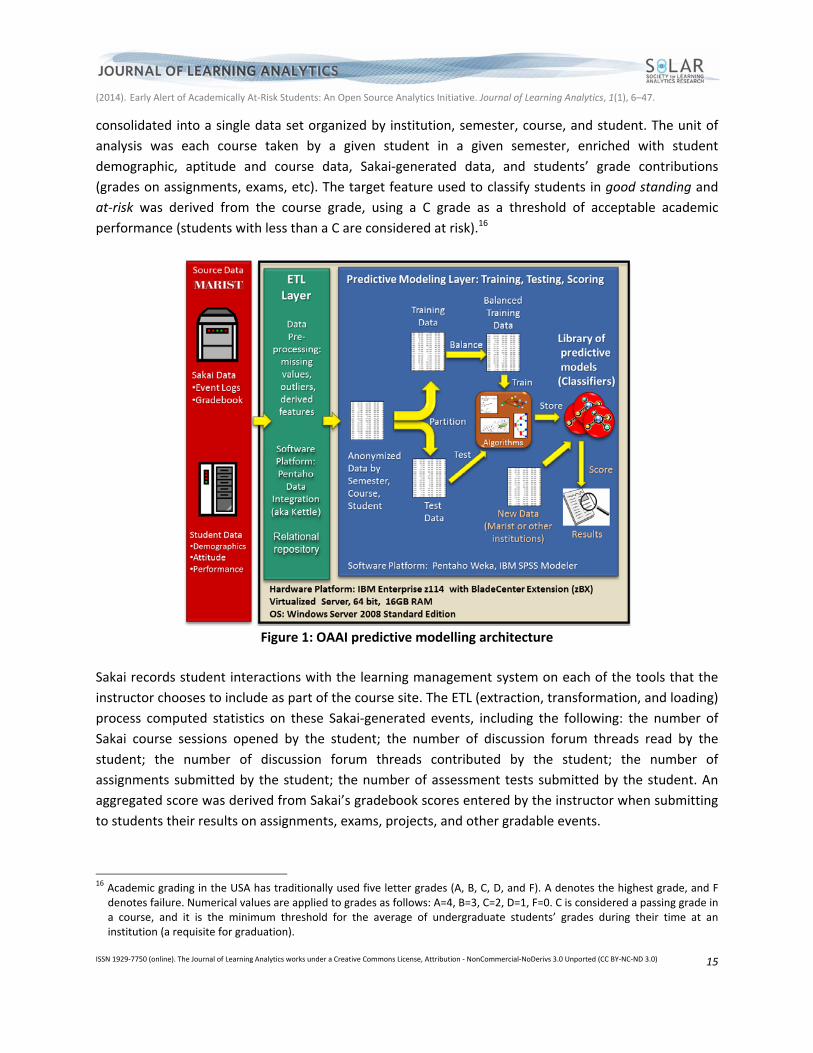
Figure 1 depicts the OAAI architecture. Four sources of data were considered: a) student demographic
and aptitude data; b) course grades and course related data; c) Sakai‐generated data on student
interaction with the learning management system; d) partial contributions to the student’s final grade
collected by Sakai’s gradebook tool (i.e., student grades on specific grading events, such as assignments
and exams). The OAAI used Pentaho Business Intelligence, an open source analytics suite with data
mining and data integration capabilities. Predictive models were developed using both Weka (Pentaho’s
data mining module) and IBM’s SPSS Modeler, to preserve compatibility between data mining tools.
Pentaho’s data integration tool automated the sourcing of input data feeding the predictive modelling
stage.
During the extraction process, data was anonymized to remove identifying student information. Data
was subsequently rescaled, transformed, processed to handle missing values and outliers, and finally
15 “At‐risk” in this paper means academically at‐risk.
(2014). Early Alert of Academically At‐Risk Students: An Open Source Analytics Initiative. Journal of Learning Analytics, 1(1), 6–47.
ISSN 1929‐7750 (online). The Journal of Learning Analytics works under a Creative Commons License, Attribution ‐ NonCommercial‐NoDerivs 3.0 Unported (CC BY‐NC‐ND 3.0) 15
consolidated into a single data set organized by institution, semester, course, and student. The unit of
analysis was each course taken by a given student in a given semester, enriched with student
demographic, aptitude and course data, Sakai‐generated data, and students’ grade contributions
(grades on assignments, exams, etc). The target feature used to classify students in good standing and
at‐risk was derived from the course grade, using a C grade as a threshold of acceptable academic
performance (students with less than a C are considered at risk).16
Figure 1: OAAI predictive modelling architecture
Sakai records student interactions with the learning management system on each of the tools that the
instructor chooses to include as part of the course site. The ETL (extraction, transformation, and loading)
process computed statistics on these Sakai‐generated events, including the following: the number of
Sakai course sessions opened by the student; the number of discussion forum threads read by the
student; the number of discussion forum threads contributed by the student; the number of
assignments submitted by the student; the number of assessment tests submitted by the student. An
aggregated score was derived from Sakai’s gradebook scores entered by the instructor when submitting
to students their results on assignments, exams, projects, and other gradable events.
16 Academic grading in the USA has traditionally used five letter grades (A, B, C, D, and F). A denotes the highest grade, and F denotes failure. Numerical values are applied to grades as follows: A=4, B=3, C=2, D=1, F=0. C is considered a passing grade in a course, and it is the minimum threshold for the average of undergraduate students’ grades during their time at an institution (a requisite for graduation).

(2014). Early Alert of Academically At‐Risk Students: An Open Source Analytics Initiative. Journal of Learning Analytics, 1(1), 6–47.
ISSN 1929‐7750 (online). The Journal of Learning Analytics works under a Creative Commons License, Attribution ‐ NonCommercial‐NoDerivs 3.0 Unported (CC BY‐NC‐ND 3.0) 16
Table 1: Input Data Set Used to Train and Test Predictive Models
Following standard supervised learning practice, the consolidated data set (see Table 1) was
partitioned into training and test data subsets: a) two semesters of undergraduate data (fall 2010
and spring 2011, 9,938 samples) for the training data set; and b) one semester of undergraduate
data (fall 2011, 5,212 samples) for the test data set. All records in both the training data set and the
test data set were labelled with the target class value (ACADEMIC_RISK = at‐risk, good standing). The
label is used by the classification algorithm to supervise the learning of the model at training time. At
test time, the label is used to compute the predictive performance of the classifier. Validated
predictive models were stored for future scoring of incoming student data.
3.1 Machine Learning Algorithms for Predictive Modelling Several machine‐learning algorithms were considered to train predictive models. After evaluating a
number of them, we settled for four well‐known classifiers for comparison purposes: logistic regression,
support vector machines using sequential minimal optimization (SVM/SMO), J48 decision trees, and
(2014). Early Alert of Academically At‐Risk Students: An Open Source Analytics Initiative. Journal of Learning Analytics, 1(1), 6–47.
ISSN 1929‐7750 (online). The Journal of Learning Analytics works under a Creative Commons License, Attribution ‐ NonCommercial‐NoDerivs 3.0 Unported (CC BY‐NC‐ND 3.0) 17
Naïve Bayes, all of them robust classification methods that can handle categorical and continuous
predictors. Weka provides implementations of all of them.17
Logistic regression is probably the most popular parametric method used in situations when the target
variable is categorical (i.e., classification). Logistic regression models are generalized linear models that
predict the outcome of a categorical dependent variable based on one or more predictor variables. In its
simplest form, it can solve binary classification problems; in its multinomial form, it can be used to solve
multivalued (2+ classes) classification problems. As the goal in this project was to detect at‐risk students,
we focused on binary logistic regression. The term logistic regression is usually applied in the literature
(and in this article hereafter) to refer to those cases where the dependent variable is binary. Logistic
regression models the probability of occurrence of a certain value of the target (class) variable as a
logistic (or logit) function of the linear combination of the set of continuous or discrete predictor
variables. In this sense, logistic regression is often referred to as a discriminative classifier because the
probability of the class given the data can be viewed as directly discriminating the value of the class for
any given configuration of predictor values.
Logistic regression makes no assumption about the distribution of the predictors, but the user must
decide on the inclusion of predictors in the model, as well as any interaction and regularization terms. As
in the case of linear regression, multicollinearity can have a negative effect on the parameter estimates,
inflating their variance, and therefore affecting the model fit. For further information regarding logistic
regression, see for example Neter, Kutner, Nachtsheim, and Wasserman (1996) and Larose (2006).
J48 is Weka’s open source implementation of Quinlan’s C4.5 decision tree, a non‐parametric algorithm
that learns rules from data. A decision tree is a graphical representation of rules inferred from input (i.e.,
training) data that constitute the basis for prediction. The set of rules learnt by the algorithm describe a
class to which an object or event belongs (two class values in the case of this project: at‐risk and good
standing). Decision tree models use a recursive procedure to partition the training data progressively
into groups according to a partition rule that maximizes the homogeneity of the dependent variable in
each of the obtained groups. At each step of the procedure, the partition rule selects a predictor
variable, to split the data file into the groups, stopping when pre‐specified conditions are satisfied. The
outcome of the learning process is a set of rules (or its associated tree‐like representation) that
describes the predictor features and their value ranges that specify a given class value. This makes
decision trees highly expressive: good at both predicting and describing the nature of the prediction
(i.e., the prediction is not the result of a black box). Quinlan’s C4.5 algorithm uses an information
theoretical metric (entropy reduction, also known as information gain) to determine the split criterion.
For a detailed description of C4.5, see Quinlan (1993).
Support vector machines (or SVMs) are a state of the art family of supervised learning models proposed
17 http://wiki.pentaho.com/display/datamining/classifiers

(2014). Early Alert of Academically At‐Risk Students: An Open Source Analytics Initiative. Journal of Learning Analytics, 1(1), 6–47.
ISSN 1929‐7750 (online). The Journal of Learning Analytics works under a Creative Commons License, Attribution ‐ NonCommercial‐NoDerivs 3.0 Unported (CC BY‐NC‐ND 3.0) 18
by Vladimir Vapnik (1995) that have become increasingly popular for classification, regression, and
novelty detection tasks. SVMs are particularly well suited to analyze data with a large number of
predictor attributes, and have therefore had considerable impact in text categorization and
bioinformatics. The basic SVM is a discriminative, maximum‐margin model based on the idea of
classifying data into two categories by finding an optimal decision boundary (an N‐dimensional
hyperplane) that is as far away from the data in each of the classes as possible. The vectors near the
hyperplane are the support vectors. Therefore, the basic SVM is a non‐probabilistic, binary linear
classifier. To deal with non‐linear boundaries, an SVM maps data into a dimensional feature space
where the data points can be categorized or predicted accurately, even if there is no easy way to
separate the points in the original dimensional space. This involves using a kernel function to map the
data from the original space into the new feature space. An SVM, like its close cousin the multilayer
perceptron neural network model, does not provide output in the form of a function of its predictors.
Thus, like neural networks, they are less expressive than other machine learning algorithms (more of a
black box approach to prediction). For a detailed tutorial on SVMs, we recommend Burges (1998).
In this study, we used Platt’s (1999) sequential minimal optimization (SMO) algorithm, which tackles the
maximum‐margin hyperplane optimization by decomposing the problem into 2‐dimensional sub‐
problems that may be solved analytically, eliminating the need for a numerical optimization algorithm.
In addition, in order to obtain posterior probability estimates for the classes, we set the parameter in
Weka’s implementation of (SVM/SMO) that fits logistic regression models to the outputs of the support
vector machine.
Naïve Bayes classifiers (Friedman, Geiger, & Goldszmidt, 1997) are simplified Bayesian networks,
graphical models based on the notion of conditional independence that encode the joint probability
distribution of a set of variables in a compact manner using a directed graph to describe the probabilistic
dependencies among variables. A Naïve Bayes classifier assumes that all predictor variables are
conditionally independent given the class variable. This very strong independence assumption simplifies
the computation of the likelihood of the data, reducing it to a product of the likelihood of each attribute
given the class, and therefore significantly decreasing the amount of training data required to estimate
the model parameters. The classifier learns the estimates of the class priors and the likelihood of the
data (conditional probability of the data given the class). New examples can be assigned to the class
value that yields the highest posterior probability, which is proportional to (likelihood prior). This type of classifier is described as generative since the posterior probability distribution of the data given the
class can be viewed as a random generator of data samples for a given class value. When the predictor
attributes are discrete, or Gaussian with variance independent of the class, Naïve Bayes learners can be
viewed as linear classifiers; that is, every such Naïve Bayes corresponds to a hyperplane decision
boundary in predictor attribute space (Mitchell, 2005). Despite the oversimplified assumptions that give
its name to the algorithm, Naïve Bayes classifiers exhibit excellent performance in many complex real‐
world situations. For further reading on the performance of Naïve Bayes, including a theoretical
explanation on the optimality of the algorithm, see Rish (2001) and Zhang (2004).

(2014). Early Alert of Academically At‐Risk Students: An Open Source Analytics Initiative. Journal of Learning Analytics, 1(1), 6–47.
ISSN 1929‐7750 (online). The Journal of Learning Analytics works under a Creative Commons License, Attribution ‐ NonCommercial‐NoDerivs 3.0 Unported (CC BY‐NC‐ND 3.0) 19
3.2 Input Data Considerations and Data Quality Challenges Data mining algorithms are affected by the quality and characteristics of the input data. Generally, a
predictive model is usually as good as its training data. Although a careful choice of data mining
algorithms can sometimes mitigate the poor quality of the data to be mined (Fisher, Lauría, Chengalur‐
Smith, & Wang, 2006), in general, no matter how robust the data mining algorithm is, it will fail to
produce accurate models if faced with low‐quality training data (Freitas, 2002). Therefore, for any data
mining effort to be successful, it should be preceded by a data quality enhancement activity (Lauría &
Tayi, 2003). The data collected at Marist College for training and testing purposes, particularly the log
data from Sakai, was reviewed by staff at the IT Department prior to being submitted for data
integration (ETL) and analysis, to verify its integrity and to ensure that technical problems did not result
in erroneous data being collected. Marist College data presented a number of issues that had to be
addressed before it could be effectively used in the predictive modelling stage.
Missing data: In the initial consideration of the input data set, missing data was present in a number of
attributes (see Table 1 to check the percentage of missing values per attribute in the training data set).
This was especially significant in those attributes related to Sakai usage (see the paragraph on variability
in Sakai tools usage below). Corrective action: We used a cut‐off of 20% missing data to discard those
attributes in the input data set with a percentage of missing values above this threshold. For the rest of
the attributes containing missing data, no pre‐processing of missing data was made at ETL time as
Weka’s implementation of the machine learning algorithms used in this study provides built‐in
mechanisms to deal with missing data: a) Logistic regression and SVM/SMO use a filter (named
ReplaceMissingValues in Weka’s library) that is “trained” on the training data (i.e., it records the means
on numeric attributes and modes on categorical attributes computed on the training data). These values
are used to replace missing values in test instances; b) J48 (which inherits its missing data mechanism
from C4.5) splits training instances with missing values into pieces. A piece going down a branch receives
a weight proportional to the popularity of the branch, with weights adding up to 1. J48 uses a similar
mechanism at prediction time for handling missing values as it does at training time. If the decision tree
splits on an attribute that has a missing value in a given test instance, then predictions (probability
distributions) from all sub‐trees rooted at that point are combined with weights proportional to the
number of training instances that supported each sub‐tree; c) Naïve Bayes in turn ignores missing values
altogether (i.e., it does not update statistics for an attribute when its value is missing in a training
instance; at testing time, an attribute is omitted from the Bayes formula if its value is missing in the test
instance). Some special considerations were made on those attributes related to Sakai usage (see
paragraph below).
Variability in Sakai tools usage: Not all instructors use the same set of Sakai tools (e.g., traditional, on‐
the‐ground courses do not usually include discussion forums). This produces null values in those records
corresponding to courses where Sakai tools were not used and therefore data was never meant to be
generated. Corrective action: We used the same guidelines that Campbell (2007) used in his research:

(2014). Early Alert of Academically At‐Risk Students: An Open Source Analytics Initiative. Journal of Learning Analytics, 1(1), 6–47.
ISSN 1929‐7750 (online). The Journal of Learning Analytics works under a Creative Commons License, Attribution ‐ NonCommercial‐NoDerivs 3.0 Unported (CC BY‐NC‐ND 3.0) 20
for a Sakai course tool to be counted, at least 50% of the students in the course should use the tool at
least once. The missing data rule explained in the paragraph above discarded those attributes with 20%
or more of missing values. A quick inspection of Table 1 shows that the attributes discarded are those
corresponding to Sakai tools not typically used in undergraduate courses (discussion forums and
submissions of assignments and exams are common in online courses, which represents a small
percentage of the undergraduate course offering at Marist College). This is a design consideration:
eliminating attributes from the analysis with a high percentage of missing values, or imputing missing
data (using Weka’s built‐in mechanism to impute data on those algorithms that require complete data).
The decision made was to use a low cut‐off of missing data, and with this eliminate a number of
attributes, particularly those corresponding to Sakai tool usage. We do acknowledge that this introduces
a bias in the analysis, as we indirectly impose a selection of predictor attributes in the input data. We
consider though that the alternative of imputing attributes with high percentages of missing data would
introduce even more bias and, furthermore, would be conceptually incorrect: it is not the same to
impute missing data omitted at random due to issues in the data collection (e.g., SAT_MATH,
SAT_VERBAL) than to impute large amounts of missing data on attributes where it was never meant to
be generated (R_FORUM_POST, R_ASN_SUB).18
Variability in assessment and student activity: Workload varies across courses and instructors (e.g., an
instructor may be more demanding, or post materials more frequently, depending on the characteristics
of the course, or its weekly schedule). This may have a confounding impact on the ability of the
predictive models to capture behavioural patterns of similar students across different courses. These
patterns may inaccurately portray differences in behaviour among students of similar characteristics in
different courses that should otherwise reflect similar behaviour (e.g., a frequency of access to content
material by a student in a course where the instructor posts course materials once every two weeks may
be seen as an indication of less than satisfactory effort when compared to a course where the instructor
posts materials twice a week). Corrective action: Frequencies of Sakai‐generated events are replaced by
ratios and proportions, normalizing those frequencies by dividing them by the average course
frequency. For example the CONTENT_READ variable, measuring the number of times a section in the
Lessons tool is accessed by a student becomes R_CONTENT_READ, measuring the number of times a
section in the Lessons tool is accessed by a student divided by the average number of times a section in
the Lessons tool is accessed by a student in that course.
Unbalanced classes: The proportion of academically at‐risk students may vary across institutions. At
Marist College, for example, the average percentage of students with poor grades is quite low (around
7% of the consolidated data set that lists courses taken by students exhibit grades below C). This poses
an additional challenge as it yields input data that is unbalanced at the class value (good standing, at‐
risk). In situations where the distribution of classes is highly unbalanced, the number of samples of the
18 Other research projects and initiatives had struggled with the same issues regarding course management tool usage and missing data. We had several fruitful discussions in this regard with John Campbell (Purdue) and Steve Lonn (U. Michigan). We gratefully acknowledge their input.
(2014). Early Alert of Academically At‐Risk Students: An Open Source Analytics Initiative. Journal of Learning Analytics, 1(1), 6–47.
ISSN 1929‐7750 (online). The Journal of Learning Analytics works under a Creative Commons License, Attribution ‐ NonCommercial‐NoDerivs 3.0 Unported (CC BY‐NC‐ND 3.0) 21
class of interest (at‐risk students in this case) may be too small to provide useful information about what
distinguishes students in good standing (the dominant class value). Corrective action: A stratified
sampling approach was applied on the training data set to balance the proportion of classes and,
therefore, improve the performance of the predictive model at detecting at‐risk cases. This is
accomplished either by oversampling the at‐risk cases in the training data set, or sub‐sampling the good‐
standing cases. Weka includes a re‐sampling function that combines these two approaches by both
oversampling the minority class and sub‐sampling the dominant class. The overall sampling size can be
controlled by setting a function parameter. The test data set is not oversampled; it keeps the original
distribution of class values, as it represents the class distribution with which the trained classifier will be
confronted when making predictions on new data.
During the data integration (ETL) process, extraneous data records (e.g., records without a
corresponding final grade) were removed from the input data. Once the input data was integrated,
including transformation of variables representing frequencies into ratios, the continuous attributes in
both training and test data sets were analyzed to check for outliers (an outlier was defined as an
observation distant 3+ standard deviations from the mean). Records containing outliers were
eliminated. We did not consider this a relevant issue that could bias the analysis given the rather large
size of the training and test data, and the fact that the number of records with outliers represented less
than 2% of the data in both the training and test data sets.
3.3 Predictive Performance Assessment
Trained models in a binary classification setting are typically evaluated on test data using measures of
predictive performance derived from the confusion matrix that yields counts of true positives (TP), true
negatives (TN), false positives (FP) and false negatives (FN). If the input data has an unbalanced
distribution of class values, using predictive accuracy or error rate to measure predictive performance
may be misleading, as those metrics are driven by the dominant class value (good students, in the case
of Marist College). We therefore report predictive accuracy, but we focus on other metrics, namely
recall, false positive (FP) rate, and precision, as reported by Weka, to measure the predictive
performance of the classifiers. Recall (TP/(TP+FN)) measures the ability of the classifier to detect the
class of interest (at‐risk); FP rate (1‐TN/(TN+FP)) measures the number of false alarms raised by the
classifier; precision (TP/(TP+FP)) measures the fraction of instances predicted as positives that are
actually positives.19 A perfect classifier would be described as one having 100% recall (i.e., predicting all
at‐risk students as being at‐risk) and 0% FP rate (predicting no good standing students as being at‐risk).
However, there is usually a trade‐off between performance metrics, as there is a lower bound on the
19 Sensitivity and specificity are alternative terms typically used in clinical trials but also used in other fields, including data mining to refer to recall and (1‐FP Rate). Recall and FP Rate are more commonly used in the fields of pattern recognition, machine learning, and information retrieval. Sensitivity is also called true positive rate, whereas (1‐FP Rate) is sometimes called true negative rate. As Weka reports recall an FP rate rather than sensitivity and specificity, we decided to stick to its terminology.

(2014). Early Alert of Academically At‐Risk Students: An Open Source Analytics Initiative. Journal of Learning Analytics, 1(1), 6–47.
ISSN 1929‐7750 (online). The Journal of Learning Analytics works under a Creative Commons License, Attribution ‐ NonCommercial‐NoDerivs 3.0 Unported (CC BY‐NC‐ND 3.0) 22
error rate that can be achieved by any classifier acting on a given attribute space (Duda, Hart, & Stork,
2001).
A receiver operating characteristics (ROC) graph is an appealing technique for comparing classifiers
based on their predictive performance, that visually depict the trade‐off between recall (detection of the
class of interest) and false alarm rates of classifiers. ROC graphs are 2‐D graphs in which recall (TP rate)
is plotted on the Y‐axis and FP rate is plotted on the X‐axis. A point in ROC space is better than another if
it is above and to the left (TP rate is higher, FP rate is lower, or both) of the first (Fawcett, 2006). ROC
graphs are also helpful to compare a learnt classifier’s performance with a random guessing strategy,
which acts as a baseline. The diagonal line (Y = X) in a ROC graph represents the strategy of randomly
guessing the class of interest, where the points along the diagonal are given by the frequency with which
the random‐guessing classifier guesses the class of interest. Evidently, any classifier that holds some
value should yield a point in ROC space located above the diagonal representing random guessing.
3.4 Experimental Setup on Marist Data and Analysis of Results Data from fall 2010, spring 2011, and fall 2011 was collected at Marist College and cleaned, recoded,
and aggregated into data sets corresponding to courses taken by a student in a given semester using the
record format described in section 3 and Table 1. Fall 2010 and spring 2011 data were used for training
the classifiers (9,938 training samples); fall 2011 was reserved for testing purposes (5,212 samples).
Experiments were conducted to test the predictive performance of the classifiers following these
guidelines:
a) Four baseline predictive models were trained using four classification algorithms (Logistic
Regression, J48, SVM/SMO, Naïve Bayes) and the full non‐balanced training data (no re‐sampling
applied on the training data, 9,938 training samples) for comparison purposes. Each model was
subsequently tested using the test subset and predictive performance measures were computed.
b) Multiple balanced training data sets of varying size were created by varying the overall sampling size
(25%, 50%, 75%, and 100% of the training data re‐sampled). Five different training data sets were
created for each balanced training size by varying the sampling seed, a total of 5 x 4 = 20 balanced
training data sets. Models were trained with each of the 20 training data sets and 4 algorithms, for a
total of 4 x 5 x 4 = 80 models. Each model was subsequently tested using the test subset and
predictive performance measures were computed.
Models were grouped according to sampling size of the training data, and classification algorithm. On all
five models corresponding to the same sampling size (25%, 50%, 75%, and 100% of the training data re‐
sampled), the predictive performance measures were summarized, computing a mean value, and a
standard error. Table 2 and Figures 2 and 3 report the outcomes of this evaluation.20 Clearly, balancing
20 Preliminary results of a less extensive and systematic experiment using fall 2010 data were reported in Lauría et al., 2012.

(2014). Early Alert of Academically At‐Risk Students: An Open Source Analytics Initiative. Journal of Learning Analytics, 1(1), 6–47.
ISSN 1929‐7750 (online). The Journal of Learning Analytics works under a Creative Commons License, Attribution ‐ NonCommercial‐NoDerivs 3.0 Unported (CC BY‐NC‐ND 3.0) 23
the training data has a positive effect on the ability of the classifiers to detect at‐risk students, as
measured by the Recall metric. Logistic regression, SVM/SMO and Naïve Bayes outperform J48 in terms
of Recall; the three algorithms exhibit a very stable behaviour when varying the overall sampling size. To
try to explain this behaviour we should refer to the bias–variance trade‐off in supervised learning.21
Logistic regression, support vector machines (linear ones at least) and Naïve Bayes are all high bias/low
variance learners. Their representational power is fairly low (all being linear models) and this tends to
make them very stable, which in turn leads to low variance. Decision trees, on the other hand, are low
bias (are more expressive, have a stronger representational ability) but high variance learners.22 This
means that small changes in the training data set can lead to radically different trees being produced.
Table 2: Predictive Performance on Marist Data
21 The learning error can be decomposed into bias and variance components. Generally, there is a trade‐off between the bias and variance of a supervised learning algorithm (Geman, Bienenstock, & Doursat, 1992). The inductive bias of a learning algorithm is the set of assumptions that the learner uses to predict outputs given inputs that it has not encountered (Mitchell, 1980). A linear boundary (e.g., a straight line in 2‐D attribute space) has high bias (the linear assumption is rather inflexible), but a fluctuation in the training data set has a small impact on its predictive power, which means that is has low variance. Instead, a learning algorithm with low bias must be “flexible” so that it can fit the training data well (e.g., a curve that passes though all data points in a 2‐D attribute space), but in doing so, it learns the irregularities of the training data as well, which reduces its ability to make predictions on new data (i.e., generalize). This means that a learning algorithm with low bias will typically have high variance: it is affected by fluctuations in the training data set.
22 For a detailed account of the effect of class imbalance on C4.5 classifiers, see Drummond and Holte (2003).

(2014). Early Alert of Academically At‐Risk Students: An Open Source Analytics Initiative. Journal of Learning Analytics, 1(1), 6–47.
ISSN 1929‐7750 (online). The Journal of Learning Analytics works under a Creative Commons License, Attribution ‐ NonCommercial‐NoDerivs 3.0 Unported (CC BY‐NC‐ND 3.0) 24
Although we balanced the classes through re‐sampling at roughly 50%, keeping the class distribution
approximately equal in all the re‐sampled training data sets (25%, 50%, 75%, 100%), the fact that the
total number of instances changes (actually increases as we increase the percentage of re‐sampled data)
leads to different trees being produced. Bigger trees are learnt on the larger training sets created
through re‐sampling. Note that the varying re‐sampling percentage not only increases the size of the
training data set, it also changes the characteristics of the training data set by duplicating samples of the
minority class through oversampling, and eliminating samples of the majority class though sub‐sampling.
These trees are increasingly more expressive but have decreasing predictive power as they lose their
ability to generalize on new instances.
Figure 2: Predictive performance on Marist data
The different behaviour of the classifiers is reflected in Figure 2: for all three linear models (logistic
regression, SVM/SMO, and Naïve Bayes), all metrics are fairly flat, as data set size increases. J48 exhibits
a linear increase in accuracy and decrease in recall (which is tied to the decrease in FP rate and increase
in precision).
Weka’s handling of missing values may also be a source of variability in the behaviour of the classifier.
Weka’s re‐sampling function oversamples the minority class (at‐risk) and subsamples the dominant
class. This change in the distribution of records belonging to each class also has an effect on the
distribution of null values in the training data, which are then treated differently by the four learners

(2014). Early Alert of Academically At‐Risk Students: An Open Source Analytics Initiative. Journal of Learning Analytics, 1(1), 6–47.
ISSN 1929‐7750 (online). The Journal of Learning Analytics works under a Creative Commons License, Attribution ‐ NonCommercial‐NoDerivs 3.0 Unported (CC BY‐NC‐ND 3.0) 25
under consideration, as was described in section 3.2. This does not necessarily explain the direction of
change (it would require a detailed analysis of the new proportions of missing data after each re‐
sampled training data set is produced), but it may point to some difference in behaviour among
classifiers. In any case, the amount of missing data in the original (unbalanced) training data set is not
very significant, as shown in Table 1. This leads us to believe that although Weka’s handling of missing
values may play a role, it is the inherent nature of the learners regarding the bias–variance trade‐off that
drives the behaviour of the classifiers when trained with different sized training data sets.23
Figure 3: ROC graphs
The ROC graphs in Figure 3 show that the classifiers (in particular logistic regression, SVM/SMO and
Naïve Bayes), when trained with balanced (re‐sampled) data, exhibit more than acceptable
performance, with value pairs (Recall, FP rate) located on the far northwest side of ROC space. Recall
values in all three classifiers is high (more than 80%) while maintaining rather low FP values (less than
17%). These FP rates are relatively high when compared to the classifiers trained with unbalanced data
(which exhibit single digit FP rates), which shows that balancing the training data through re‐sampling
improves detection of at‐risk students but at the same time increases the number of false alarms. This
issue requires further consideration as it has an impact on the number of students in good academic
standing that are signalled by the system as being at‐risk. Although this is not a matter of immediate
23 This analysis came out of a discussion on this subject with Mark Hall, Weka’s architect and one of its original core developers. The authors are grateful to Mark for his insightful comments and suggestions.

(2014). Early Alert of Academically At‐Risk Students: An Open Source Analytics Initiative. Journal of Learning Analytics, 1(1), 6–47.
ISSN 1929‐7750 (online). The Journal of Learning Analytics works under a Creative Commons License, Attribution ‐ NonCommercial‐NoDerivs 3.0 Unported (CC BY‐NC‐ND 3.0) 26
concern given that alerts are not automatically submitted to the students (they are submitted to the
instructor instead), this does leave substantial room for improvement in terms of model development.
The standard error in all four classifiers is small, which also means that the classifiers are not affected by
random variations of the sampling seed. Overall, logistic regression seems to outperform the other
classifiers, with a better combination of high Recall (above 84%), lower percentage of false alarms (FP
Rate below 13%), and higher precision in predicting at‐risk students (Precision close to 33%). SVM/SMO
comes close, with similar performance metric values (Recall 84%, FP Rate 15%, Precision 29%).
To perform an assessment of the relevance of the predictors we picked one of the training data sets re‐
sampled at 50% and analyzed the learnt logistic regression model (we picked an arbitrary data set as we
had checked before that the predictive performance of logistic regression is practically the same for all
re‐sampled data sets). We used SPSS Modeler to report the model outcomes as it provides a more
detailed analysis along with a nice predictor importance chart.24 According to this chart (see Figure 4),
the score computed out of partial contributions to the final grade (RMN_SCORE_PARTIAL) appears to be
the most relevant predictor, followed by cumulative GPA (CUM_GPA) and academic standing. The other
predictors included in the chart are second tier. They include number of Sakai sessions logged in the
semester (R_SESSIONS), online status (ONLINE_FLAG), full‐time status (RC_FTPT), and student’s class
(RC_CLASS). The use of the RMN_SCORE_PARTIAL metric as a predictor seems promising if contributions
to the final grade (such as assignments or tests) are available at prediction time.
Figure 4: Predictor importance chart for logistic regression model
24 The predictor importance chart in SPSS Modeler depicts the relative importance of each predictor in estimating the model. Since the values are relative, the sum of the values for all predictors on the display is 1.0. Predictor importance does not relate to model accuracy, it just relates to the importance of each predictor in making a prediction.

(2014). Early Alert of Academically At‐Risk Students: An Open Source Analytics Initiative. Journal of Learning Analytics, 1(1), 6–47.
ISSN 1929‐7750 (online). The Journal of Learning Analytics works under a Creative Commons License, Attribution ‐ NonCommercial‐NoDerivs 3.0 Unported (CC BY‐NC‐ND 3.0) 27
Table 3 displays the outcome of the logistic regression model. Almost all regression coefficients are
statistically significant (freshman and junior class indicators are the exception). As was expected, an
increase of the partial grades score (RMN_SCORE_PARTIAL), cumulative GPA, and number of Sakai
sessions (R_SESSIONS) decreased the expected probability of being at‐risk relative to being in good
standing, controlling for the other inputs. Regular students, compared to online students, have a large
reduction (.319) in the expected ratio of the probability of being at‐risk relative to being in good
standing. Part‐time students are expected to have a much higher (by a factor of 2.443) proportion of
being at‐risk relative to being in good standing than full time students. Sophomore students have a
greater expected probability of being at‐risk (1.34) relative to good standing. Finally, students in
probation and regular students are much more likely to be at‐risk (by a factor of 25.5 and 8.4
respectively) than honours students, controlling for the other predictors.
Table 3: Logistic Regression Model for At‐Risk Students
Variable Metric Slope
(b)
Wald df p Odds Ratio
Exp(b)
Regular student (ONLINE_FLAG =0) ‐1.143 24.80 1 <.001 .319
Part‐time student (RC_FTPT=0) .893 12.31 1 <.001 2.443
Cumulative GPA (CUM_GPA) ‐2.354 297.68 1 <.001 .095
Partial grades score (RMN_SCORE_PARTIAL) ‐.077 434.34 <.001 .926
Number of Sakai Sessions (R_SESSIONS) ‐.146 5.06 1 .024 .864
Freshman (RC_CLASS=1) ‐.134 .936 1 .333 .875
Sophomore (RC_CLASS=2) .292 5.37 1 .020 1.340
Junior (RC_CLASS=3) .023 .031 1 .861 1.023
Probation (ACADEMIC_STANDING=0) 3.243 54.84 1 <.001 25.598
Regular standing (ACADEMIC_STANDING=1) 2.132 28.49 1 <.001 8.428
Intercept 11.879 267.43 1 <.001
Senior (RC_CLASS=4) and Honour/Dean’s list (ACADEMIC_STANDING=2) are reference categories
Chi‐Square = 3859.12 df=10 p <0.001
4 CONDUCTING PILOTS OF THE ACADEMIC ALERT SYSTEM AT PARTNER INSTITUTIONS One of the factors associated with the scaling of learning analytics that the OAAI has researched is the
portability of predictive models: how models developed for one academic context (e.g., a large research
university), can be effectively deployed in another (e.g., community college). During the summer of 2011
we ran correlations on Marist data between students’ grades and the same set of predictors used by
Campbell (2007) in his original dissertation research, which included student demographic (e.g., age),
aptitude (e.g., SAT scores), and learning management system usage (e.g., number of sessions initiated
by the student). Although Marist College and Purdue University differ in a number of ways (e.g.,
different institutional type, size, and instructional approaches), and use different learning management
(2014). Early Alert of Academically At‐Risk Students: An Open Source Analytics Initiative. Journal of Learning Analytics, 1(1), 6–47.
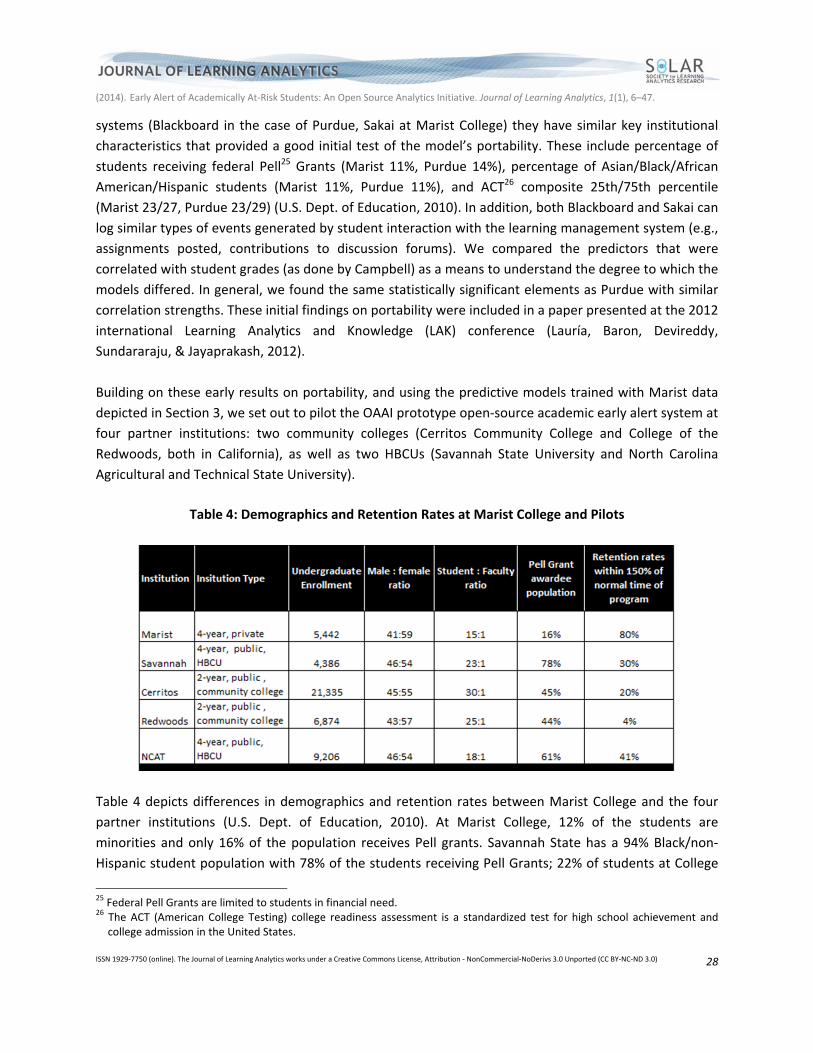
ISSN 1929‐7750 (online). The Journal of Learning Analytics works under a Creative Commons License, Attribution ‐ NonCommercial‐NoDerivs 3.0 Unported (CC BY‐NC‐ND 3.0) 28
systems (Blackboard in the case of Purdue, Sakai at Marist College) they have similar key institutional
characteristics that provided a good initial test of the model’s portability. These include percentage of
students receiving federal Pell25 Grants (Marist 11%, Purdue 14%), percentage of Asian/Black/African
American/Hispanic students (Marist 11%, Purdue 11%), and ACT26 composite 25th/75th percentile
(Marist 23/27, Purdue 23/29) (U.S. Dept. of Education, 2010). In addition, both Blackboard and Sakai can
log similar types of events generated by student interaction with the learning management system (e.g.,
assignments posted, contributions to discussion forums). We compared the predictors that were
correlated with student grades (as done by Campbell) as a means to understand the degree to which the
models differed. In general, we found the same statistically significant elements as Purdue with similar
correlation strengths. These initial findings on portability were included in a paper presented at the 2012
international Learning Analytics and Knowledge (LAK) conference (Lauría, Baron, Devireddy,
Sundararaju, & Jayaprakash, 2012).
Building on these early results on portability, and using the predictive models trained with Marist data
depicted in Section 3, we set out to pilot the OAAI prototype open‐source academic early alert system at
four partner institutions: two community colleges (Cerritos Community College and College of the
Redwoods, both in California), as well as two HBCUs (Savannah State University and North Carolina
Agricultural and Technical State University).
Table 4: Demographics and Retention Rates at Marist College and Pilots
Table 4 depicts differences in demographics and retention rates between Marist College and the four
partner institutions (U.S. Dept. of Education, 2010). At Marist College, 12% of the students are
minorities and only 16% of the population receives Pell grants. Savannah State has a 94% Black/non‐
Hispanic student population with 78% of the students receiving Pell Grants; 22% of students at College
25 Federal Pell Grants are limited to students in financial need. 26 The ACT (American College Testing) college readiness assessment is a standardized test for high school achievement and college admission in the United States.

(2014). Early Alert of Academically At‐Risk Students: An Open Source Analytics Initiative. Journal of Learning Analytics, 1(1), 6–47.
ISSN 1929‐7750 (online). The Journal of Learning Analytics works under a Creative Commons License, Attribution ‐ NonCommercial‐NoDerivs 3.0 Unported (CC BY‐NC‐ND 3.0) 29
of the Redwoods are minorities and 44% receive Pell Grants; Cerritos College’s student body is 41%
Hispanic and 45% of the students receive Pell Grants; and North Carolina AT&T has an 89% Black/non‐
Hispanic student population and 61% of the students are awarded Pell grants. In addition, the retention
rates at these institutions are considerably lower when compared to Marist College.
The purpose of the pilots was twofold: a) research the portability of predictive models developed at
Marist (see section 3) as means to understand how their accuracy changes as they are deployed in
different academic contexts (four‐year vs. two‐year institutions) and how to deal with such changes; b)
explore the impact that different “intervention” strategies, such as participating in an Online Academic
Support Environment (OASE), have on course completion and content mastery (i.e., final course grades)
outcomes.
4.1 Description of the Academic Alert System The pilots were conducted in spring 2012 and fall 2012. Three times during each of those semesters (at
approximately four week intervals, 25%, 50% and 75% of the semester completed) anonymized data
was collected from a pre‐established set of courses at each of the partner institutions (note: NCAT did
not participate in the spring 2012 pilot). Most courses were in the 15‐18 week range while a few were
shorter and in the 9‐week range. We chose mostly freshman/first year introductory courses (often
referred to as “gateway courses” as students who do not succeed in these tend not to continue in the
course subject matter). The courses were face to face and spanned a wide range of subjects, including
math, sciences, business, and art. Class sizes ranged from 20 to 60 students.
A logistic regression model trained with fall 2010/spring 2011 Marist College data was applied on the
pilot data to identify students who were potentially at risk of not completing their course. Once the
prediction process was completed an Academic Alert Report (AAR) corresponding to the collected data
(25%, 50% and 75%) was produced for each partner institution, listing the students in the pilot data who
had been identified as at‐risk. The generated AARs were placed in a secure location (a Sakai Project Site).
Instructors accessed their corresponding AARs from the specified site, and recovered the identity of
each course/ student record using an encrypted Student Identification Key. Figure 5 depicts the
workflow for generation and distribution of AARs.
Students identified as at‐risk, were subjected to two different intervention strategies: “Awareness
Messaging” and participating in an “Online Academic Support Environment (OASE).” To explore the
impact of these different intervention strategies, different sections of the same course were designated
as either control group (received no intervention) or treatment groups receiving either “Awareness
Messaging” intervention or OASE intervention. In most cases, we had the same instructor teaching three
sections of the same course and used one section as the control and the other two for the two
treatment groups. Although not perfect, this approach helped to control for variations in teaching style.

(2014). Early Alert of Academically At‐Risk Students: An Open Source Analytics Initiative. Journal of Learning Analytics, 1(1), 6–47.
ISSN 1929‐7750 (online). The Journal of Learning Analytics works under a Creative Commons License, Attribution ‐ NonCommercial‐NoDerivs 3.0 Unported (CC BY‐NC‐ND 3.0) 30
Awareness Messaging Intervention: Students identified in an AAR who were assigned to classes in
the “Awareness Intervention” group received a message indicating that they were at risk of not
completing the course successfully along with guidance on what they might do to improve their
chances of success.
AAR Project Site
Faculty Folder
Dropbox Tool
Academic Alert Report (AAR)
Student Identification
Key (SIK)
Gradebook Data Extract
Pentaho[data processing,
scoring and reporting]
Academic Alert Report
(AAR)
Specific Sakai Course Site
Identified Student
Online Academic Support Environment
(OASE)
AAR transferred from Marist into a Project Site for faculty at each institutions Sakai system
Open Academic Analytic Initiative Workflow for Academic Alert
Reports (AAR) and deployment of intervention strategies
Awareness Messaging Intervention
Student Aptitude and Demographic Data Extract (SIS)
Sakai Event
Log Data Extract
A sub‐folder for each course/section used to organize the
AAR and course SIK
Faculty notified when new AA is posted and access their
Dropbox to review AAR
Messages Tool
Faculty message “identified’
students through the class Course Site
The Sakai Dropbox tool
is used to provide each faculty with a private folder
Figure 5: Workflow for AAR generation and distribution
Online Academic Support Environment Intervention: Students identified in an AAR who were
assigned to classes in the “Online Academic Support Environment Intervention” group received a
very similar message to the other intervention group except that instead of specific
recommendations, the students were encouraged to join the institutions Online Academic Support
Environment, a Sakai‐based online support site in which they are given access to Open Educational
Resources (OER) instructional materials (e.g., Khan Academy videos, Flat World Knowledge
textbooks, etc.). In addition to these materials, they are provided with a range of mentoring from
peers and professional support staff.
In both types of interventions, the text of the messages is standardized across instructors and the text
becomes increasingly serious in tone as students receive their second and third message.

(2014). Early Alert of Academically At‐Risk Students: An Open Source Analytics Initiative. Journal of Learning Analytics, 1(1), 6–47.
ISSN 1929‐7750 (online). The Journal of Learning Analytics works under a Creative Commons License, Attribution ‐ NonCommercial‐NoDerivs 3.0 Unported (CC BY‐NC‐ND 3.0) 31
Ease of Use: We recognize that any effective intervention cannot be overly burdensome on an
instructor. The willingness of an instructor to commit to the use of the intervention system is critical to
the success of the intervention. Given the demands currently put upon adjunct instructors and full‐time
faculty it is critical that any effective intervention is efficient. If the intervention requires too much
additional effort on behalf of the instructor, many will simply choose not to use the system. At three
different intervals during the semester (25%, 50%, and 75% of the semester completed) students
identified with low, medium, and high levels of probability of being at‐risk were sent to the instructor,
who ultimately determined to whom to forward an email message. This provided the instructor with an
opportunity to consider special circumstances such as illness or the fact that they may have already
spoken to the student. Ultimately, the instructor has the best opportunity to judge who could benefit
from an early intervention. It is also especially critical in the developmental stages to provide instructors
with an opportunity to preview and customize27 any alerts sent to their students. The system is a tool
that the instructor can use to help better stay in touch with their student’s progress, and it offers an
opportunity to interact with the student, improving academic engagement. These are both critical to
establishing higher levels of student engagement and ultimately increasing student retention.
Early Alerts: The opportunity to provide early feedback to the student about their progress in the course
gives the student a greater opportunity to change what may be ineffective strategies. In many
universities and colleges, students do not receive a high level of feedback until midterm grades are
returned. Unfortunately, in many courses, by the time the student has received their midterm grades, it
is too late to improve their grade significantly, often resulting in a poor grade or even course failure. The
use of numerous metrics employed by the predictive model allows for feedback to students much
earlier in the semester. The importance of early feedback has not been well addressed in the literature
perhaps because techniques to do so have been limited. Now with the advent of powerful learning
analytics techniques and the use of automated alert systems, instructors have the opportunity to
provide feedback to their students with enough time for the students to change their behaviour.
4.2 The Interventions Design Framework The Awareness Intervention was modelled on the service provided in the Purdue Signals program. The
work done at Purdue has shown that this use of relatively simple notification interventions can have a
significant effect on student behaviour. The OAAI has added to the notification system concept, or what
we refer to as awareness intervention, by leveraging Sakai Project Sites to create an “Online Academic
Support Environment” (OASE) to provide a unique opportunity to engage students identified as at‐risk
and needing help in an online community designed to help them succeed academically.
27 The first part of each message was standardized; the end of the message was then something the instructor could customize.

(2014). Early Alert of Academically At‐Risk Students: An Open Source Analytics Initiative. Journal of Learning Analytics, 1(1), 6–47.
ISSN 1929‐7750 (online). The Journal of Learning Analytics works under a Creative Commons License, Attribution ‐ NonCommercial‐NoDerivs 3.0 Unported (CC BY‐NC‐ND 3.0) 32
The past two decades of research into the design of effective online courses has resulted in compelling
evidence that the type and frequency of interactions between the learner and instructor, the learner
and content and the learner and his or her peers correlates closely with overall course satisfaction,
engagement and obtainment of learning objectives (Cuseo, n.d.). The OASE Design Framework is
organized around this simple but powerful concept of learner interactions with the goal of creating a
compelling online environment in which learners will feel part of an academic support community.
These types of interactions allowed the students to develop strategies that have the potential of
carrying over from course to course. They were able to access a variety of materials pertaining to study
skills, time management, stress reduction tips, etc. They were also able to access general subject‐specific
materials to help with a variety of classes, i.e., algebra, statistics, writing, researching. These materials
allowed students to get answers to general questions that can provide support for most course work.
A team consisting of an instructional designer, student support staff, and academic advising experts at
Marist College designed a general framework for the Online Academic Support Environment (OASE),
based on research and best practices on creating online support communities. Team members then
worked with partner institutions to apply this framework locally to create a customized OASE site that
leveraged local support resources and met the needs of their particular student population and
academic context. Some of the core design elements for the OASE are to:
Promote Awareness of Academic Support Services ‐ The site was facilitated by an institutional
representative, possibly an academic advisor or support staff, who answered questions and helped
direct students to campus‐based or online resources provided by the institution (e.g., tutoring
services, writing labs etc.). In addition to making students aware of these resources, such
interactions helped students feel engaged with their institution.
Promote Peer‐to‐Peer Engagement ‐ The site was co‐facilitated by advanced students who acted as
peer mentors and provided a more experienced student perspective on issues of campus and
academic life. For example, they managed an online “Student Lounge” discussion forum in which
students would engage in discussions that were most relevant to them (e.g., how to deal with test
anxiety). In other cases, student‐developed videos on academic success issues (e.g., Cerritos
College’s iFALCON program2), were made available.
Provide Access to Self‐Assessment Tools ‐ Students were given access to a range of self‐assessment
tools, such as the Learning and Study Strategies Inventory (LASSI), to help them become more aware
of their strengths and weaknesses as a learner as well as their preferred learning style.
Recommendations to either seek out in‐person assistance or review educational materials were
provided based on the results of these assessments.
Provide Access to Educational Scaffolding Content ‐ Students were provided with a range of open
content as a means to improve study skills, refresh content knowledge, or engage in skill
remediation. For example, students were given access to Flat World Knowledge’s textbook, available
for free online under a Creative Commons license, titled College Success3 to better understand how

(2014). Early Alert of Academically At‐Risk Students: An Open Source Analytics Initiative. Journal of Learning Analytics, 1(1), 6–47.
ISSN 1929‐7750 (online). The Journal of Learning Analytics works under a Creative Commons License, Attribution ‐ NonCommercial‐NoDerivs 3.0 Unported (CC BY‐NC‐ND 3.0) 33
to take notes or improve their time management skills. In other cases, students were directed to
open‐source tutoring software available through the Carnegie Mellon Open Learning Initiative for
remediation purposes. The OAAI also collaborated with other Open Educational Resources and
related Next Generation Learning Challenge‐funded projects to work to incorporate their content
into the OASE.
These interactions were focused on two primary supports: a) assisting learners in finding resources (e.g.,
remedial content, tutors, academic advising services, etc.) and b) facilitating online discussions on timely
topics related to student academic success. It should be noted that the goal of these online discussions
will not generally be to answer specific content‐related questions but rather to direct students to where
they can obtain such support.
Once at‐risk students had been identified, this information was used to alert them that they were at risk
of failing the course. At each university, a Site Coordinator from the participating institution played a
critical role as liaison between investigators, university administration, regulators, and instructors.
Instructors were provided with an orientation about the study purpose, their role in the study, and how
to use the alert system. All study details were disclosed with respect to privacy, data storage, the
volunteer nature of the study, and consent for instructors and students. A total of 3,176 students were
assigned to one of three groups (control Awareness & OASE). Each course was assigned to one of the
three groups. To the extent possible, instructors were assigned to sections representing each of the
three groups. At three different points during the semester (25%, 50% and 75% of the semester
completed), Academic Alerts were automatically sent to the instructors. After reviewing the AAR list,
instructors sent the email messages to the students they felt were struggling in their course.
Students in the Awareness group were sent emails with messages like the following:
Based on your performance on recent graded assignments and exams, as well as other
factors that tend to predict academic success, I am becoming worried about your ability to
complete this class successfully.
I am reaching out to offer some assistance and to encourage you to consider taking steps to
improve your performance. Doing so early in the semester will increase the likelihood of you
successfully completing the class and avoid negatively impacting your academic standing.
Additionally, Instructors were encouraged to recommend the following:
Ask the student to visit you during office hours.
Set up an appointment with a tutor, academic support person, or consider participating in a study
group.
Access web‐based resources such as online tutoring tools.
Take practice exams, complete additional exercises and homework questions.

(2014). Early Alert of Academically At‐Risk Students: An Open Source Analytics Initiative. Journal of Learning Analytics, 1(1), 6–47.
ISSN 1929‐7750 (online). The Journal of Learning Analytics works under a Creative Commons License, Attribution ‐ NonCommercial‐NoDerivs 3.0 Unported (CC BY‐NC‐ND 3.0) 34
Students in the OASE group received the same messages plus access to the resources described in the
OASE Design Framework, such as academic support services like The Kahn Academy, Flat World
Knowledge textbooks, as well as access to mentoring from peers and professional support staff. At the
end of the semester, we collected data on a number of measures, including course grade, content
mastery, and course withdrawal.
4.3 Analysis of Predictions on Pilot Data Table 5 reports the predictive performance of the logistic regression model (the model of choice for the
AARs) at each partner institution in spring 2012 and fall 2012. This evaluation included assessing the
model’s performance at three points during the semester (25%, 50%, and 75% of the semester
completed), which corresponds to when Academic Alert Reports were provided to instructors, to
evaluate how the model’s performance improved as more LMS event and gradebook data became
available. It is important to highlight that the model was deployed for prediction at institutions
representing vastly different educational contexts as compared to Marist, both in terms of
demographics and retention rates (please refer to Table 4 for details).
Looking at the predictive performance of the model in each of the AARs, using Recall as an indicator
(percentage of at‐risk students that were identified), it is clear that the results are considerably higher
than random chance. In three out of four partner institutions (Savannah, Cerritos, Redwoods) the
average Recall across all AARs was approximately 74.5%, with highs of 84.5% (Redwoods, AAR2) and
lows of 61% (Cerritos, AAR1). If we restrict the analysis to the AARs generated in fall 2012, the results
are even better: an average of 75.5%. When comparing these values to the predictive performance of
the model tested with Marist data (Table 2), we find only a 10% difference on the average. Given that
we expected a much larger difference between how the model performed when tested with Marist data
and when deployed at community colleges and HBCUs, this was a surprising and encouraging finding. It
should be noted, however, that NCAT Recall values are way below the aforementioned scores (an
average of 52%), a fact that deserves further consideration.
These findings seem to indicate that predictive models developed based on data from one institution
may be scalable to other institutions, even those that are different regarding institutional type, student
population, and instructional practices. We believe this very interesting finding may be the result of the
specific elements of the models that have shown to be the most powerful predictors. The attributes that
are most predictive of student outcomes are cumulative GPA and the aggregated score
(RMN_SCORE_PARTIAL) summarizing partial contributions to the final grade, as reported by the LMS
gradebook. Given that these two attributes are such fundamental aspects of academic success, it is not
surprising that the predictive model has fared so well across these different institutions. If this
explanation is correct, it does point to the importance of instructors using the gradebook within their
LMS if they wish to take advantage of learning analytics. Although grades and cumulative GPA are well
documented predictors in the extant literature (see Dziuban and Moskal (2011) for a recent reference),

(2014). Early Alert of Academically At‐Risk Students: An Open Source Analytics Initiative. Journal of Learning Analytics, 1(1), 6–47.
ISSN 1929‐7750 (online). The Journal of Learning Analytics works under a Creative Commons License, Attribution ‐ NonCommercial‐NoDerivs 3.0 Unported (CC BY‐NC‐ND 3.0) 35
and were also identified by Purdue’s Signals project (Arnold, 2010), there is no documented precedent
of the use of partial contributions to the student’s final grade extracted from the LMS gradebook tool to
determine academic risk in the early stages of the semester. Our research further corroborates earlier
studies with respect to the relevance of good grades as predictors of future academic performance but,
more importantly, it points to the use of this data‐driven approach to allow the instructor to make
predictions of student performance much earlier in the semester (2–3 weeks into the course), compared
to what the instructor might be able to do through visual inspection (typically after the midterm). It also
indicates that models may not import well into institutions where partial contributions to the final grade
and/or cumulative GPA are not available (e.g., non‐credit training programs).
Table 5: Predictive Performance on spring 2012 and fall 2012 Pilot Data
A number of issues require further study. We found variability in predictive performance across
institutions and in pilot runs in different semesters (spring 2012 vs. fall 2012). Fall 2012 outcomes at
NCAT were rather poor, with Recall values in the 45–56% range. In addition, we noticed that the average
false positive rate at partner institutions (percentage of false alarms) was larger than the average value
obtained when testing the model with Marist College data (an average of 26%, with highs of 43% for the

(2014). Early Alert of Academically At‐Risk Students: An Open Source Analytics Initiative. Journal of Learning Analytics, 1(1), 6–47.
ISSN 1929‐7750 (online). The Journal of Learning Analytics works under a Creative Commons License, Attribution ‐ NonCommercial‐NoDerivs 3.0 Unported (CC BY‐NC‐ND 3.0) 36
pilots versus roughly 13% for Marist College). A possible explanation can be found by considering the
difference in retention rates between institutions: the model trained with Marist College data was fine‐
tuned to detect at‐risk students (only 7% of the student population at Marist College). It could be
inferred that such model, applied on a student population where the proportion of at‐risk students is
much higher would raise a higher rate of false alarms. Thus, although our findings are encouraging
regarding portability, important questions remain regarding scaling up models across academic settings
that are more diverse. Portability values were higher than expected, but when data is available, it is
reasonable to assume that models with better predictive power can be learnt using training data from
the same institution.
4.4 Analysis of Intervention 4.4.1 Impact on At‐Risk Students Academic Success
The study described above was conducted over two semesters in the spring and fall of 2012.28 The
assessment conducted in the spring included three institutions: Cerritos Community College, College of
the Redwoods, and Savannah State University. The study conducted in the fall included the previously
mentioned institutions as well as North Carolina Agricultural and Technical State University. The two
treatment groups (“awareness messaging” and OASE) were comprised of students who had received at
least one intervention based on any of the three Academic Alert Reports provided during the course of
the semester. To identify control subjects, which by definition did not receive interventions, we selected
those students who had been identified as having an average “risk level” of three or higher across all
three Academic Alert Reports. Students were categorized into academic risk categories based on the
predictive model’s ability to generate failure probability scores (likelihood of not completing the course
successfully) as a part of prediction output. These probability values were classified into four ranges: 1)
no risk: probability range of 0%–50%; 2) low risk: probability range of 50%–75%; 3) medium risk:
probability range of 75%–90%; and 4) high risk: probability of 90% and above.
In the spring of 2012, 1,739 students were enrolled in the OAAI study. Four‐hundred and fifty‐one of
these students were identified as being at‐risk. Participating students were then divided into one of
three groups (Awareness: n = 193, M = 77.47, SEM = 0.97; OASE: n = 179, M = 77.5, SEM = 1.05; control
group: n = 79, M = 75.17, SEM = 1.32). A one‐way ANOVA was conducted revealing a significant
difference between groups (F (2,448), 8.484, p = .000*, see Figure 6). Post‐hoc analysis showed no
differences between the two treatment groups; however, there were statistically significant differences
between control and Awareness (p = .000*) and control and the OASE group (p = .000*).
A similar one‐way ANOVA was conducted collapsing across 696 students identified as at‐risk in the
spring and fall semesters. Students were assigned to one of the three experimental groups (Awareness:
n = 277, M = 70.81, SEM = 0.77; OASE: n = 254, M = 71.14, SEM = 0.83; control group: n = 165, M =
28 Preliminary findings using spring 2012 data were reported in Lauría, Moody, Jayaprakash, Jonnalagadda, and Baron (2013).

(2014). Early Alert of Academically At‐Risk Students: An Open Source Analytics Initiative. Journal of Learning Analytics, 1(1), 6–47.
ISSN 1929‐7750 (online). The Journal of Learning Analytics works under a Creative Commons License, Attribution ‐ NonCommercial‐NoDerivs 3.0 Unported (CC BY‐NC‐ND 3.0) 37
66.33, SEM = 0.96). Again, a significant difference was found (F (2,693) = 8.025, p = .000*, see Figure 7).
Post‐hoc analysis once again showed no differences between the two treatment groups, but confirmed
a statistically significant difference between control and Awareness (p = .002*) and control and the
OASE group (p = .002*). In a course with a final grade range of 75, students in the two treatment groups
have shown a 6% improvement over non‐intervention controls.
Figure 6: Impact on general student academic
success, spring 2012 data
(error bars represent SEM)
Figure 7: Impact on general student academic
success, spring and fall 2012 data collapsed
(error bars represent SEM)
4.4.2 Impact on the Academic Success of At‐Risk Students Receiving Pell Grants
The Pell Grant is awarded to students who can demonstrate an “exceptional” financial need. Pell Grant
status is considered a reliable predictor of a student’s socio‐economic status. There is considerable
evidence showing that students with lower socio‐economic status have lower GPAs and graduation rates
(Stinebrickner & Stinebrickner, 2003; Griffith, 2008; Day, Dworsky, Fogarity, & Damashek, 2011). In an
effort to isolate at‐risk students identified as having a lower socio‐economic status, we further refined
the groups from the previous ANOVA analysis to include only students awarded Pell Grants.
In the spring of 2012, 326 students were identified as being “at‐risk” and had also been awarded a Pell
grant. These students were then divided into one of three groups (Awareness: n = 138, M = 71.52, SEM =
1.14; OASE: n = 132, M = 71.74, SEM = 1.22; control group: n = 57, M = 63.77, SEM = 1.35). A one‐way
ANOVA was conducted revealing a significant difference between groups (F (2,324), 8.35, p = .000*, see
Figure 8). Post‐hoc analysis showed no differences between the two treatment groups; however, there
were statistically significant differences between control and Awareness (p = .001*) and control and the
OASE group (p = .000*).
A similar one‐way ANOVA was conducted collapsing across 499 students identified as at‐risk and
receiving Pell grants in the spring and fall semesters. These students were assigned to one of three
groups (Awareness: n = 200, M = 70.10, SEM = 0.92; OASE: n = 187, M = 70.08, SEM = 0.98; control
50
60
70
80
90
100
Awareness OASE Control
Final Grade (%)
Mean Final Grade for "at Risk" Students (Spring 2012)
50
60
70
80
90
100
Awareness OASE ControlFinal Grade (%)
Mean Final Grade for "at Risk" Students (Collapsed)
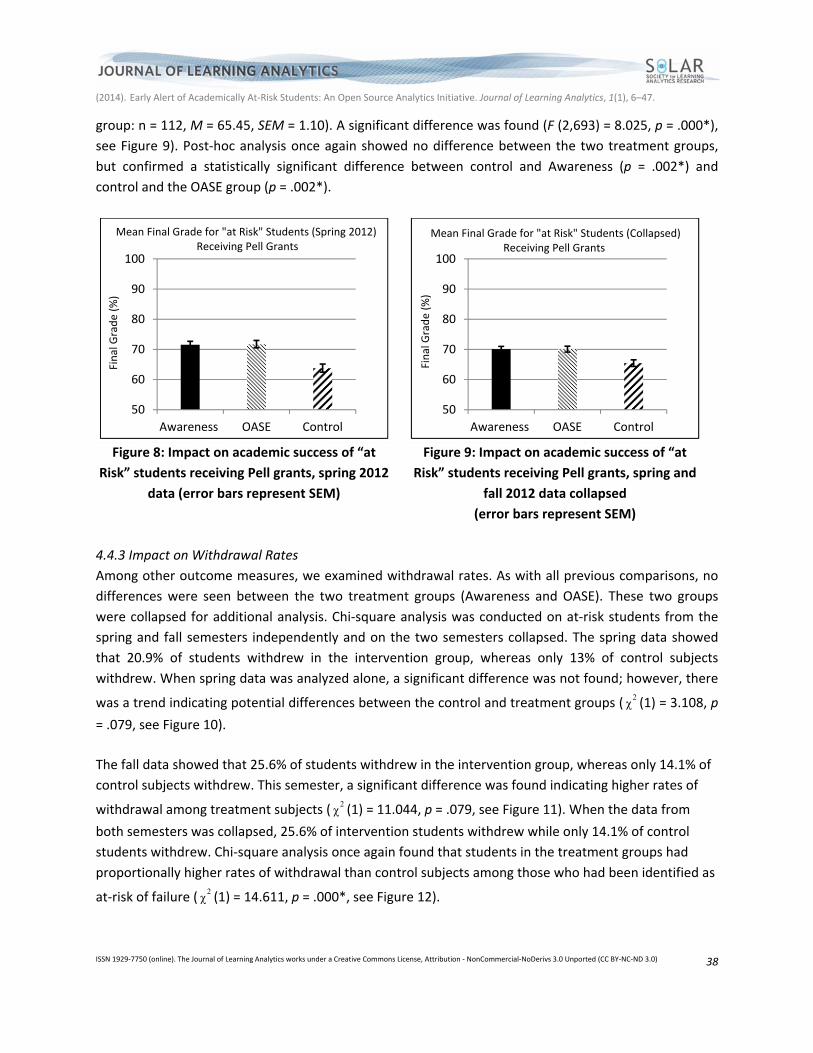
(2014). Early Alert of Academically At‐Risk Students: An Open Source Analytics Initiative. Journal of Learning Analytics, 1(1), 6–47.
ISSN 1929‐7750 (online). The Journal of Learning Analytics works under a Creative Commons License, Attribution ‐ NonCommercial‐NoDerivs 3.0 Unported (CC BY‐NC‐ND 3.0) 38
group: n = 112, M = 65.45, SEM = 1.10). A significant difference was found (F (2,693) = 8.025, p = .000*),
see Figure 9). Post‐hoc analysis once again showed no difference between the two treatment groups,
but confirmed a statistically significant difference between control and Awareness (p = .002*) and
control and the OASE group (p = .002*).
Figure 8: Impact on academic success of “at
Risk” students receiving Pell grants, spring 2012
data (error bars represent SEM)
Figure 9: Impact on academic success of “at
Risk” students receiving Pell grants, spring and
fall 2012 data collapsed
(error bars represent SEM)
4.4.3 Impact on Withdrawal Rates
Among other outcome measures, we examined withdrawal rates. As with all previous comparisons, no
differences were seen between the two treatment groups (Awareness and OASE). These two groups
were collapsed for additional analysis. Chi‐square analysis was conducted on at‐risk students from the
spring and fall semesters independently and on the two semesters collapsed. The spring data showed
that 20.9% of students withdrew in the intervention group, whereas only 13% of control subjects
withdrew. When spring data was analyzed alone, a significant difference was not found; however, there
was a trend indicating potential differences between the control and treatment groups (2χ (1) = 3.108, p
= .079, see Figure 10).
The fall data showed that 25.6% of students withdrew in the intervention group, whereas only 14.1% of
control subjects withdrew. This semester, a significant difference was found indicating higher rates of
withdrawal among treatment subjects (2χ (1) = 11.044, p = .079, see Figure 11). When the data from
both semesters was collapsed, 25.6% of intervention students withdrew while only 14.1% of control
students withdrew. Chi‐square analysis once again found that students in the treatment groups had
proportionally higher rates of withdrawal than control subjects among those who had been identified as
at‐risk of failure (2χ (1) = 14.611, p = .000*, see Figure 12).
50
60
70
80
90
100
Awareness OASE Control
Final Grade (%)
Mean Final Grade for "at Risk" Students (Spring 2012) Receiving Pell Grants
50
60
70
80
90
100
Awareness OASE ControlFinal Grade (%)
Mean Final Grade for "at Risk" Students (Collapsed)Receiving Pell Grants

(2014). Early Alert of Academically At‐Risk Students: An Open Source Analytics Initiative. Journal of Learning Analytics, 1(1), 6–47.
ISSN 1929‐7750 (online). The Journal of Learning Analytics works under a Creative Commons License, Attribution ‐ NonCommercial‐NoDerivs 3.0 Unported (CC BY‐NC‐ND 3.0) 39
Figure 10. Impact on withdrawal rates in
at‐risk students, spring 2012 data
Figure 11. Impact on withdrawal rates in
at‐risk students, fall 2012 data
Early research on the Purdue Signals project found an increase in withdrawals early in the course, which
stabilized, and was not found to be significant (Arnold, 2010). More recent research on Signals has found
that withdrawal rates increased in sections of Agronomy and Psychology but decreased in sections of
Statistics (Pistilli, Arnold, & Bethune, 2012). The difference in withdrawal rates might be explained by
some students who have chosen to withdraw soon in the course, rather than attempting to complete
and failing. The mixed results suggested we may see a change in withdrawal rates but the direction was
unclear. The data collected in the spring indicated that withdrawal rates were higher in the treatment
groups, but not significantly. Fall data, however, indicated that withdrawal rates in the treatment groups
were significantly higher. The data collected in both semesters were higher in the treatment groups;
however, these results were inconsistent, as seen in the Purdue research (Arnold, 2010; Pistilli, et al.,
2012).
Figure 12. Impact on withdrawal rates for at‐risk students,
spring and fall 2012 data collapsed
0
100
200
300
400
Yes No Yes No
Withdrawal Rates for "at Risk" Students (Spring 2012)
Control Intervention
Freq
uen
cy
0
100
200
300
400
Yes No Yes No
Withdrawal Rates for "at Risk" Students (Fall 2012)
Control Intervention
Freq
uen
cy
0
100
200
300
400
Yes No Yes No
Withdrawal Rates for "at Risk" Students (Collapsed)
Control Intervention
Freq
uen
cy
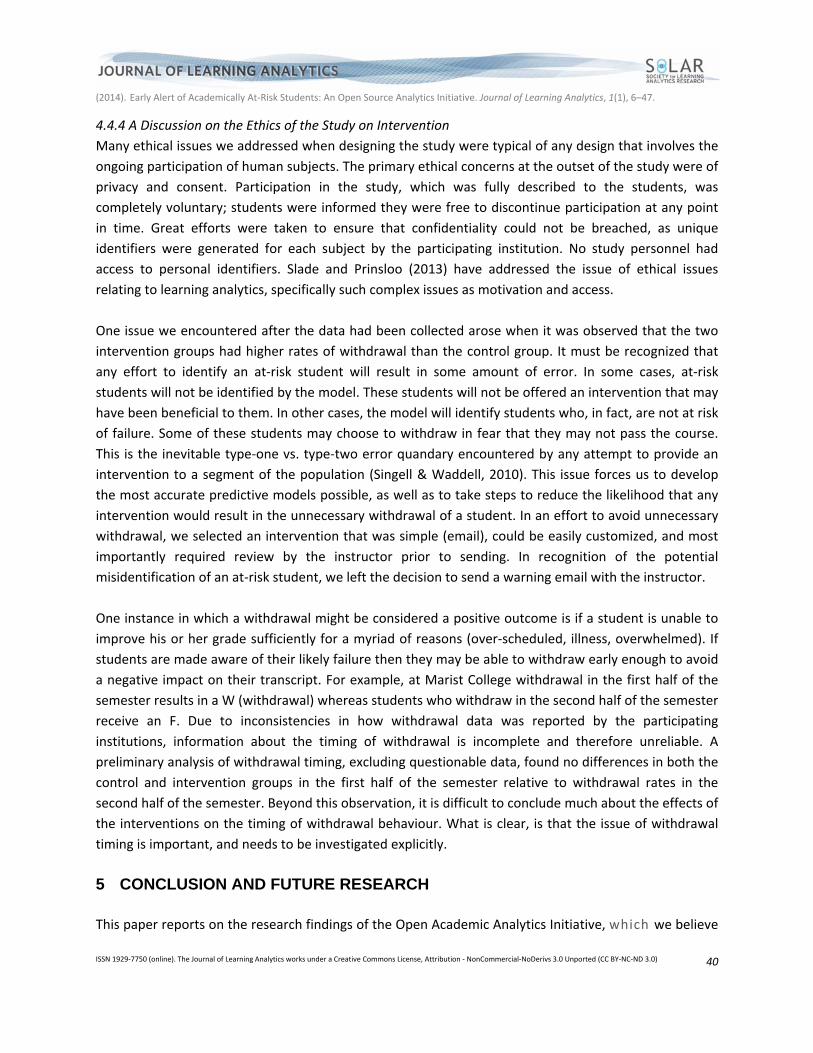
(2014). Early Alert of Academically At‐Risk Students: An Open Source Analytics Initiative. Journal of Learning Analytics, 1(1), 6–47.
ISSN 1929‐7750 (online). The Journal of Learning Analytics works under a Creative Commons License, Attribution ‐ NonCommercial‐NoDerivs 3.0 Unported (CC BY‐NC‐ND 3.0) 40
4.4.4 A Discussion on the Ethics of the Study on Intervention
Many ethical issues we addressed when designing the study were typical of any design that involves the
ongoing participation of human subjects. The primary ethical concerns at the outset of the study were of
privacy and consent. Participation in the study, which was fully described to the students, was
completely voluntary; students were informed they were free to discontinue participation at any point
in time. Great efforts were taken to ensure that confidentiality could not be breached, as unique
identifiers were generated for each subject by the participating institution. No study personnel had
access to personal identifiers. Slade and Prinsloo (2013) have addressed the issue of ethical issues
relating to learning analytics, specifically such complex issues as motivation and access.
One issue we encountered after the data had been collected arose when it was observed that the two
intervention groups had higher rates of withdrawal than the control group. It must be recognized that
any effort to identify an at‐risk student will result in some amount of error. In some cases, at‐risk
students will not be identified by the model. These students will not be offered an intervention that may
have been beneficial to them. In other cases, the model will identify students who, in fact, are not at risk
of failure. Some of these students may choose to withdraw in fear that they may not pass the course.
This is the inevitable type‐one vs. type‐two error quandary encountered by any attempt to provide an
intervention to a segment of the population (Singell & Waddell, 2010). This issue forces us to develop
the most accurate predictive models possible, as well as to take steps to reduce the likelihood that any
intervention would result in the unnecessary withdrawal of a student. In an effort to avoid unnecessary
withdrawal, we selected an intervention that was simple (email), could be easily customized, and most
importantly required review by the instructor prior to sending. In recognition of the potential
misidentification of an at‐risk student, we left the decision to send a warning email with the instructor.
One instance in which a withdrawal might be considered a positive outcome is if a student is unable to
improve his or her grade sufficiently for a myriad of reasons (over‐scheduled, illness, overwhelmed). If
students are made aware of their likely failure then they may be able to withdraw early enough to avoid
a negative impact on their transcript. For example, at Marist College withdrawal in the first half of the
semester results in a W (withdrawal) whereas students who withdraw in the second half of the semester
receive an F. Due to inconsistencies in how withdrawal data was reported by the participating
institutions, information about the timing of withdrawal is incomplete and therefore unreliable. A
preliminary analysis of withdrawal timing, excluding questionable data, found no differences in both the
control and intervention groups in the first half of the semester relative to withdrawal rates in the
second half of the semester. Beyond this observation, it is difficult to conclude much about the effects of
the interventions on the timing of withdrawal behaviour. What is clear, is that the issue of withdrawal
timing is important, and needs to be investigated explicitly.
5 CONCLUSION AND FUTURE RESEARCH This paper reports on the research findings of the Open Academic Analytics Initiative, which we believe

(2014). Early Alert of Academically At‐Risk Students: An Open Source Analytics Initiative. Journal of Learning Analytics, 1(1), 6–47.
ISSN 1929‐7750 (online). The Journal of Learning Analytics works under a Creative Commons License, Attribution ‐ NonCommercial‐NoDerivs 3.0 Unported (CC BY‐NC‐ND 3.0) 41
contributes to our collective understanding of the issues related to scaling of learning analytics across all
of higher education. Specifically, our research shows:
a) The feasibility of implementing an open‐source early‐alert prototype for higher education, and
provides a detailed account of the challenges and design criteria used in implementing such a
system.
b) The strength of scores derived from partial contributions to the student’s final grade as predictors of
academic performance.
c) How these predictive models can help the instructor detect students at academic risk earlier in the
semester.
d) Initial evidence that predictive models can be imported from the academic context in which they
were developed to different academic contexts while retaining most of their predictive power.
e) That there may be benefits associated with customizing imported predictive models using local
institutional data as a means to enhance their predictive power further.
f) That relatively simple intervention strategies designed to alert students early in a course that they
may be at risk academically can positively impact student learning outcomes such as overall course
grades.
g) That there are no apparent gains between providing students with an online academic support
environment and simply making students aware of their potential academic risk.
h) That interventions can have unintended consequences, such as triggering students to withdraw
from courses, often early in the semester, as means to avoid academic and financial penalties.
Predictive models were trained and tested using Marist College data; those models were then applied
on pilot runs using data from several partner institutions. The research tested the portability of those
models, and the success of intervention strategies in improving at‐risk student outcomes. The results are
promising, as they seem to point to a higher portability of learning analytics models than initially
anticipated. These results had a subsequent positive impact on the effectiveness of interventions on
students at academic risk. We hope that these results will encourage researchers from other institutions
to develop similar strategies of early detection of and intervention in academic risk.
Based on our work to date, our research team has begun to discuss and identify areas of research that
we believe will be important to the field of learning analytics as it begins to be deployed more widely.
These research questions, outlined below, could form the basis for a national research agenda in this
new and emerging field.
What is the importance of an early alert and how does learning analytics facilitate early alerts?
The importance of timeliness has been identified as critical to the success of any intervention intended
to change the trajectory of an at‐risk student (Kim, Newton, Downey, & Benton, 2010). If a student
becomes aware of their risk of failure after too many grades have been recorded, the likelihood that any
change in effort will lead to a grade change decreases. Many students only start to consider that they

(2014). Early Alert of Academically At‐Risk Students: An Open Source Analytics Initiative. Journal of Learning Analytics, 1(1), 6–47.
ISSN 1929‐7750 (online). The Journal of Learning Analytics works under a Creative Commons License, Attribution ‐ NonCommercial‐NoDerivs 3.0 Unported (CC BY‐NC‐ND 3.0) 42
might be in trouble after a poor mid‐term grade, and for many this is simply too late for a measurable
recovery. Learning analytics can provide an alert within the first five weeks of a course, giving both the
instructor and student time to address the issue before too many grades have been recorded.
Does learning analytics allow us to identify students who might not complete a course that the typical
instructor would miss?
Learning analytics solutions are often seen as ways to improve student success in large lecture‐style
courses (100+ students) in which it can be very difficult for an instructor to identify, early on in the
course, which students may not succeed. As learning analytics is deployed at institutions with smaller
class sizes, as was the case with many of the OAAI course pilots, it will be important to understand the
“value added” of learning analytics over what an instructor is capable of doing on his or her own.
Although many of the instructors in our pilots noted that they found the identification of at‐risk students
very helpful, it remains unclear if they would have identified the same students that our model
identified had they attempted to do so on their own. Thus, we believe it will be important to conduct
further studies in which instructor predictions are compared to model predictions.
What are the characteristics of students who seem to have “immunity” to the treatment (those who
received interventions but never improved) versus those who were effectively treated after just one
intervention?
From our initial research, we have found that students seem to fall into one of two broad categories:
those who improve after receiving just one “treatment” or intervention and those who do not improve
regardless of the number of “treatments” received. Very few students who did not improve after the
first intervention went on to improve after the second or third. Our theory is that some students
respond very well to the “treatment” and thus improve after just one intervention while other seem
“immune” to the “treatment” and do not improve regardless of how many treatments they receive.
Understanding why this is the case and what characteristics are associated with these two categories of
students would help us to understand better how to deploy interventions most effectively.
How portable are predictive models designed for one type of course delivery (e.g., face‐to‐face) when
they are deployed in another delivery format (e.g., fully online)?
We are particularly interested in exploring the issue of portability regarding face‐to‐face and fully online
programs given how much more LMS usage takes place in the later mode of instruction. It may be that
models developed based on face‐to‐face courses do not import well to fully online courses or at least
that such models could be significantly improved if they were customized for fully online courses.
ACKNOWLEDGEMENTS
This research is supported by EDUCAUSE’s Next Generation Learning Challenges, funded through the Bill
& Melinda Gates Foundation and The William and Flora Hewlett Foundation. It is also partially
supported by funding from the National Science Foundation, award numbers 1125520 and 0963365. The

(2014). Early Alert of Academically At‐Risk Students: An Open Source Analytics Initiative. Journal of Learning Analytics, 1(1), 6–47.
ISSN 1929‐7750 (online). The Journal of Learning Analytics works under a Creative Commons License, Attribution ‐ NonCommercial‐NoDerivs 3.0 Unported (CC BY‐NC‐ND 3.0) 43
authors would like to thank Nicole Maziarz for proofreading the document.
REFERENCES Arnold, K. (2010). Signals: Applying academic analytics. EDUCAUSE Review,
http://www.educause.edu/ero/article/signals‐applying‐academic‐analytics
Arnold, K.E., & Pistilli, M.D. (2012). Course Signals at Purdue: Using learning analytics to increase student
success. Proceedings of the 2nd International Conference on Learning Analytics and Knowledge
(LAK’12), Vancouver, Canada, 29 April–2 May. New York, NY: Association of Computer
Machinery, 267–270. doi:10.1145/2330601.2330666
Astin, A.W. (1993). What matters in college? Four critical years revisited. San Francisco: Jossey‐Bass.
Astin, A.W. (1999). Student involvement: A developmental theory for higher education. Journal of
College Student Development, 40(5), 418–429.
Barber, R., & Sharkey, M. (2012). Course correction: Using analytics to predict course success.
Proceedings of the 2nd International Conference on Learning Analytics and Knowledge (LAK’12),
Vancouver, Canada, 29 April–2 May, New York, NY: Association of Computer Machinery, 259–
262. doi:10.1145/2330601.2330664
Bevitt, D., Baldwin, C., & Calvert, J. (2010). Intervening early: Attendance and performance monitoring
as a trigger for first year support in the biosciences. Bioscience Education E‐journal, 15,
doi:http://journals.heacademy.ac.uk/doi/abs/10.11120/beej.2012.20000053
Bravo, J., Sosnovsky, S., & Ortigosa, A. (2009). Detecting symptoms of low performance using prediction
rules. Proceedings of the 2nd Educational Data Mining Conference (EDM’09), Universidad de
Cordoba, Cordoba, Spain, 1–3 July, 31‐40.
Burges, C.J.C. (1998). A tutorial on support vector machines for pattern recognition: Data mining and
knowledge discovery 2, 121–167. http://research.microsoft.com/en‐
us/um/people/cburges/papers/svmtutorial.pdf
Campbell, J.P. (2007). Utilizing student data within the course management system to determine
undergraduate student academic success: An exploratory study. (Doctoral dissertation, Purdue
University). (UMI No. 3287222).
Campbell, J., deBlois, P., & Oblinger, D. (2007). Academic analytics: A new tool for a new era. EDUCAUSE
Review (July/August), 41–57. http://net.educause.edu/ir/library/pdf/erm0742.pdf
Chen, G., Liu, C., Ou, K., & Liu, B. (2000). Discovering decision knowledge from web log portfolio for
managing classroom processes by applying decision tree and data cube technology. Journal of
Educational Computing Research, 23(3), 305–332. doi:10.2190/5JNM‐B6HP‐YC58‐PM5Y
Chickering, A.W., & Ehrmann, S.C. (1996). Implementing the seven principles: Technology as lever.
American Association for Higher Education and Accreditation Bulletin, 49, 3–6.
Colby, J. (2004). Attendance and attainment. Fifth Annual Conference of the Information and Computer
Sciences: Learning and Teaching Support Network (ICS‐LTSN), 31 August–2 September,
University of Ulster. doi:www.ics.heacademy.ac.uk/italics/Vol4‐2/ITALIX.pdf
College Board Advocacy & Policy Center (2010). The college completion agenda 2010 progress report,

(2014). Early Alert of Academically At‐Risk Students: An Open Source Analytics Initiative. Journal of Learning Analytics, 1(1), 6–47.
ISSN 1929‐7750 (online). The Journal of Learning Analytics works under a Creative Commons License, Attribution ‐ NonCommercial‐NoDerivs 3.0 Unported (CC BY‐NC‐ND 3.0) 44
Executive summary. Retrieved February 17, 2011 from
http://completionagenda.collegeboard.org/sites/default/files/reports_pdf/progress_executive_
summary.pdf
Cuseo, J. (n.d.) Academic advisement and student retention: Empirical connections & systemic
interventions (Marymount College). Retrieved February 13, 2011 from
https://apps.uwc.edu/administration/academicaffairs/esfy/CuseoCollection/Academic%20Advis
ement%20and%20Student%20Retention.doc
Day, A., Dworsky, A., Fogarity, K., & Damashek, A. (2011). An examination of post‐secondary retention
and graduation among foster care youth enrolled in a four‐year university. Children and Youth
Services Review, 33(11), 2335–2341.
http://EconPapers.repec.org/RePEc:eee:cysrev:v:33:y:2011:i:11:p:2335‐2341ral
Drummond, C., & Holte, R. (2003). “C4.5, class imbalance and cost sensitivity: Why under‐sampling beats
over‐sampling,” Proceedings of Workshop on Learning Imbalanced Datasets II, ICML,
Washington DC, 21 August, 1–8.
Duda, R.O., Hart, P.E., Stork, D.G. (2001). Pattern classification, 2nd ed. New York, NY: John Wiley &
Sons.
Dziuban, C., & Moskal, P. (2011). “A course is a course is a course: Factor invariance in student
evaluation of online, blended and face‐to‐face learning environments.” The Internet and Higher
Education, doi:10.1016/j.iheduc.2011.05.003
Fawcett, T. (2006). “An introduction to ROC analysis,” Pattern Recognition Letters, 27, 861–874.
Fisher, C., Lauría, E., Chengalur‐Smith, S., & Wang, R. (2006). Introduction to information quality.
Bloomington, IN: AuthorHouse.
Folger, W., Carter, J.A., & Chase, P.B. (2004). “Supporting first generation college freshmen with small
group intervention.” College Student Journal, 38(3), 472–476.
Freitas, A.A. (2002). Data mining and knowledge discovery with evolutionary algorithms. New York, NY:
Springer.
Friedman, N., Geiger, D., & Goldszmidt, M. (1997). Bayesian network classifiers. Machine Learning, 29,
131–163.
Fritz, J. (2011). Classroom walls that talk: Using online course activity data of successful students to raise
self‐awareness of underperforming peers. Internet and Higher Education, 14(2), 89–97.
Geman, E., Bienenstock, E., & Doursat, R. (1992). Neural networks and the bias/variance dilemma.
Neural Computation, 4, 1–58.
http://stuff.mit.edu/afs/athena.mit.edu/course/6/6.435/OldFiles/www/Geman92.pdf
Griffith, A.L. (2008). Determination of grades, persistence and major choice for low‐income and minority
students. Working Paper #110. Cornell Higher Education Research Institute.
http://www.ilr.cornell.edu/cheri/workingPapers/2008.html
Kim, E., Newton, F.B., Downey, R.G., & Benton, S.L. (2010). Personal factors impacting college student
success: Constructing College Learning Effectiveness Inventory (CLEI). College Student Journal,
44(1), 112–125. http://www.sunyrockland.edu/Members/xshi/assigned‐reading‐materials‐
1/files/personal‐factors‐impacting‐college‐student‐success.pdfEducationAL

(2014). Early Alert of Academically At‐Risk Students: An Open Source Analytics Initiative. Journal of Learning Analytics, 1(1), 6–47.
ISSN 1929‐7750 (online). The Journal of Learning Analytics works under a Creative Commons License, Attribution ‐ NonCommercial‐NoDerivs 3.0 Unported (CC BY‐NC‐ND 3.0) 45
Larose, D.T. (2006). Data mining methods and models. Hoboken, NJ: Wiley. doi:10.1002/0471756482
Lauría, E., Baron, J., Devireddy, M., Sundararaju V., & Jayaprakash, S. (2012). Mining academic data to
improve college retention: An open source perspective. Proceedings of the 2nd International
Conference on Learning Analytics and Knowledge (LAK’12), Vancouver, Canada, 29 April–2 May.
New York, NY: Association of Computer Machinery, 139–142. doi:10.1145/2330601.2330637
Lauría, E., Moody, E., Jayaprakash, S., Jonnalagadda, N., & Baron, J. (2013). Open Academic Analytics
Initiative: Initial research findings. Proceedings of the 3rd International Conference on Learning
Analytics and Knowledge (LAK’13), Leuven, Belgium, 8–12 April. New York, NY: Association of
Computer Machinery, 150–154. doi:10.1145/2460296.2460325
Lauría, E., Tayi, G.K. (2003). A comparative study of data mining algorithms for network intrusion
detection in the presence of poor quality data. Proceedings of the 8th International Conference
on Information Quality, Cambridge, Massachusetts, USA, 7–9 November, 190–201.
Laurie, P.D., & Timothy, E. (2005). Using data mining as a strategy for assessing asynchronous discussion
forums. Computers & Education, 45(1), 141–160.
Long, P., & Siemens, G. (2011). Penetrating the fog: Analytics in learning and education. EDUCAUSE
Review, 46(5). http://www.educause.edu/ero/article/penetrating‐fog‐analytics‐learning‐and‐
education
Ma, Y., Liu, B., Wong, C., Yu, P., & Lee, S. (2000). Targeting the right students using data mining.
Proceedings of the 6th International Conference on Knowledge Discovery and Data Mining (KDD
2000), Boston, Massachusetts, USA, 20–23 August, 457–464.
ftp://ftp.cse.buffalo.edu/users/azhang/disc/disc01/cd1/out/papers/kdd/p457‐ma.pdf
Minaei‐Bidgoli, B., & Punch, W. (2003). Using genetic algorithms for data mining optimization in an
educational web‐based system. Proceedings of Genetic and Evolutionary Computational
Conference, Chicago, Illinois, USA, 12–16 July, 2252–2263.
Mitchell, T.M. (1980). The need for biases in learning generalizations. (Report CBM‐TR 5‐110). New
Brunswick, NJ: Rutgers University Department of Computer Science.
Mitchell, T. (2005). Generative and discriminative classifiers: Naïve Bayes and logistic regression..
http://www.cs.cmu.edu/~tom/mlbook/NBayesLogReg.pdf
Morris, L.V., Wu, S., & Finnegan, C. (2005). Predicting retention in online general education courses. The
American Journal of Distance Education, 19(1), 23–36. doi:10.1016/j.iheduc.2005.06.009
Neter, J., Kutner, M., Nachtsheim, C., & Wasserman, W. (1996). Applied linear regression models, 3rd ed.
Chicago, IL: Irwin.
Newman‐Ford, L.E., Fitzgibbon, K., Lloyd, S., & Thomas, S.L. (2008). A large‐scale investigation into the
relationship between attendance and attainment: A study using an innovative, electronic
attendance monitoring system. Studies in Higher Education, 33(6), 699–717.
Pistilli, M.D., & Arnold, K.E. (2010). Purdue Signals: Mining real‐time academic data to enhance student
success. About Campus, 15, 22–24. doi:10.1002/abc.20025
Pistilli, M.D., Arnold, K.E., & Bethune, M. (2012). Signals: Using academic analytics to promote student
success. EDUCAUSE Review, July/Aug 2012, online.
Platt, J.C. (1999). Using analytic QP and sparseness to speed training of support vector machines. In M.S.

(2014). Early Alert of Academically At‐Risk Students: An Open Source Analytics Initiative. Journal of Learning Analytics, 1(1), 6–47.
ISSN 1929‐7750 (online). The Journal of Learning Analytics works under a Creative Commons License, Attribution ‐ NonCommercial‐NoDerivs 3.0 Unported (CC BY‐NC‐ND 3.0) 46
Kearns, S.A. Solla, D.A. Cohn (eds.), Advances in neural information processing systems, vol. 11.
Cambridge, MA: MIT Press.
Quinlan, J.R. (1993). C4.5: Programs for machine learning. San Mateo, CA: Kaufman.
Rish, I. (2001). An empirical study of the Naïve Bayes classifier. Proceedings of Workshop on Empirical
Methods in Artificial Intelligence, Seattle, Washington, USA, 4–10 August, 41–46.
Romero, C., Ventura, S., & Garcia, E. (2008). Data mining in course management systems: Moodle case
study and tutorial. Computers & Education, 51(1), 368–384.
Siemens, G., & Baker, S.J. (2012). Learning analytics and educational data mining: Towards
communication and collaboration. Proceedings of the 2nd International Conference on Learning
Analytics and Knowledge (LAK’12), Vancouver, Canada, 29 April–2 May. New York, NY:
Association of Computer Machinery, 252–254. doi:10.1145/2330601.2330661
Singell, D.L., & Waddell, G.R. (2010). Modeling retention at a large public university: Can at‐risk students
be identified early enough to treat? Research in Higher Education, 51(6), 546–572.
Slade, S., & Prinsloo, P. (2013). Learning analytics: Ethical issues and dilemmas. American Behavioral
Scientist, 57(10), 1509–1528.
Smith, E.M., & Beggs, B.J. (2003). A new paradigm for maximizing student retention in higher education.
IEE Engineering Education Conference, Southampton, UK, 6–7 January.
doi:www.ulster.ac.uk/star/resources/paradigm.pdf
Stinebrickner, R., & Stinebrickner, T.R. (2003). Understanding educational outcomes of students from
low‐income families: Evidence from a liberal arts college with a full tuition subsidy program. The
Journal of Human Resources, 38(3), 591–617. doi:10.3368/jhr.XXXVIII.3.591
Tinto, V. (1982). Limits of theory and practice in student attrition. The Journal of Higher Education, 53(6),
687–700.
Tinto, V. (1987). Leaving college: Rethinking the causes and cures of student attrition. Chicago:
University of Chicago Press.
Tinto, V. (2007). Research and practice of student retention: What next? Journal of College Student
Retention, 8(1), 1–19.
Tinto, V. (2012). Enhancing student success: Taking the classroom success seriously. The International
Journal of the First Year in Higher Education, 3(1), 1–8.
U.S. Department of Education, National Center for Educational Statistics, Postsecondary Education Data
System. (2009). Graduation rates of first time postsecondary students...1996 through 2004.
Retrieved February 15, 2011 from
http://nces.ed.gov/programs/digest/d09/tables/dt09_331.asp
U.S. Department of Education, National Center for Education, Integrated Postsecondary Education Data
System. (2010). Retrieved February 15, 2011 from http://nces.ed.gov/collegenavigator/
van Barneveld, A., Arnold, K.E., & Campbell, J.P. (2012). Analytics in higher education: Establishing a
common language. EDUCAUSE Learning Initiative.
http://educause.edu/ir/library/pdf/ELI3026.pdf
Vapnik, V. (1995). The nature of statistical learning theory. New York, NY: Springer‐Verlag.
Yu, P., Own, C., & Lin, L. (2001). On learning behavior analysis of web based interactive environment.

(2014). Early Alert of Academically At‐Risk Students: An Open Source Analytics Initiative. Journal of Learning Analytics, 1(1), 6–47.
ISSN 1929‐7750 (online). The Journal of Learning Analytics works under a Creative Commons License, Attribution ‐ NonCommercial‐NoDerivs 3.0 Unported (CC BY‐NC‐ND 3.0) 47
Proceedings of ICCEE, Oslo/Bergen, Norway.
Zaïane, O., & Luo, J. (2001). Web usage mining for a better web‐based learning environment.
Proceedings of Conference on Advanced Technology for Education Banff, Alberta, Canada, 60–
64.
Zhang, H. (2004). The optimality of Naïve Bayes. Proceedings of the Seventeenth International Florida Artificial Intelligence Research Society Conference (FLAIRS), 562–567. http://www.aaai.org/Library/FLAIRS/2004/flairs04‐097.php