EAI Endorsed Transactions - SUTD-MIT International … experiment is conducted at an office testbed...
9
European Alliance 09 2015 -01 2016 | Volume 3 | Issue 6 | e3 EAI Endorsed Transactions Design of Cloud-Connected IoT System for Smart Buildings on Energy Management (Invited paper) Wayes Tushar 1 , Chau Yuen 1,∗ , Kai Li 1 , Kristin L. Wood 1 , Zhang Wei 2 , and Liu Xiang 2 1 Singapore University of Technology and Design (SUTD), Singapore. 2 Peking University, Haidian, China. Abstract Building energy management (BEM) system can provide cost-effective energy management solutions for smart buildings. However, the success of BEM is contingent on identifying large energy consuming devices, monitoring energy usage, optimal scheduling of flexible appliances, and distinguishing and controlling energy wastage. To this end, this paper discusses the design of Internet of Things (IoT) for a flexible BEM with the backend analytic that performs analysis on energy usage pattern and the wastage. We present the experimental results of real-time monitoring of consumers’ energy usage in a commercial space to identify the electricity wastage. The experiment is conducted at an office testbed using a comprehensive wireless sensor network. Extensive analysis is done to identify the energy wastage pattern of users for reducing the electricity cost. It is demonstrated that it is possible to reduce significant energy wastage when an office building is equipped with the proposed IoT system. Received on 22 October 2015; accepted on 22 October 2015; published on 01 January 2016 Keywords: IoT, smart building, energy wastage, air condition. Copyright © 2016 C. Yuen et al., licensed to EAI. This is an open access article distributed under the terms of the Creative Commons Attribution license (http://creativecommons.org/licenses/by/3.0/), which permits unlimited use, distribution and reproduction in any medium so long as the original work is properly cited. doi: 10.4108/eai.1-1-2016.150813 1. Introduction One of the most widely studied methods to reduce electricity cost is the use of demand response management scheme [1], in which consumers can shift their electricity consumption from a high price period to a low price period, e.g., response to the dynamic pricing signals sent from the grid (see the related references in [2]). Such shifting in electricity demand helps utility in reducing the peak demand and hence can greatly alleviate the energy generating cost. However, shifting in electricity demand causes inconvenience to the end users, and it is not suitable for commercial buildings as the number of flexible load in such buildings are limited. Besides, the end consumers, other than the building manager, are not responsible for the payment of the utility bill of the building, which makes the consumers not very prudent in efficiently managing their electricity usage. Further, the peak demand period of commercial buildings coincides with the peak demand period of the grid. Therefore, if the consumers, i.e., building occupants 1 , are uninterested in saving energy, it may give rise to significant energy wastage in commercial spaces [3], which subsequently increase the cost of electricity. Given this reality, building energy management (BEM) system has been received considerable attention recently as a potential solution to prevent such expensive electricity usage. In particular, it is important to have low cost BEM solutions that can immediately detect the energy wastage from an office building and be flexible enough to install into retrofit buildings. In this regard, a number of recent studies investigate the issue of cost- effective energy management in office spaces. For instance, a simulation based study of an office building is conducted in [4] to investigate the uncertainties in energy consumption due to actual weather condition and the building’s operational practices. To manage the energy for electrical, heating, and cooling energy zones of a building, a semi-centralized decision making process using multi-agent systems is proposed in [5] for joint heat and power optimization with a view to improve energy efficiency and reduce energy cost. In [6], the authors present a multi-agent comfort and energy system by designing a meeting schedular with ∗ Corresponding author. Email: [email protected]. 1 Please note that we have used consumer and occupant interchange- ably to refer to the electricity consumers in commercial buildings throughout the manuscript. multi-objective Markov Decision Process. The designed energy system is further implemented in a testbed with inputs from a real-world building including actual EAI for Innovation EAI Endorsed Transactions on Industrial Networks 1 and Intelligent Systems on Industrial Networks And Intelligent Systems Research Article
Transcript of EAI Endorsed Transactions - SUTD-MIT International … experiment is conducted at an office testbed...
European Alliance
09 2015 -01 2016 | Volume 3 | Issue 6 | e3
EAI Endorsed Transactions
Design of Cloud-Connected IoT System for Smart
Buildings on Energy Management (Invited paper)
Wayes Tushar1, Chau Yuen1,∗, Kai Li1, Kristin L. Wood1, Zhang Wei2, and Liu Xiang2
1Singapore University of Technology and Design (SUTD), Singapore. 2Peking University, Haidian, China.
Abstract
Building energy management (BEM) system can provide cost-effective energy management solutions for
smart buildings. However, the success of BEM is contingent on identifying large energy consuming devices,
monitoring energy usage, optimal scheduling of flexible appliances, and distinguishing and controlling energy
wastage. To this end, this paper discusses the design of Internet of Things (IoT) for a flexible BEM with the
backend analytic that performs analysis on energy usage pattern and the wastage. We present the experimental
results of real-time monitoring of consumers’ energy usage in a commercial space to identify the electricity
wastage. The experiment is conducted at an office testbed using a comprehensive wireless sensor network.
Extensive analysis is done to identify the energy wastage pattern of users for reducing the electricity cost. It is
demonstrated that it is possible to reduce significant energy wastage when an office building is equipped with
the proposed IoT system.
Received on 22 October 2015; accepted on 22 October 2015; published on 01 January 2016
Keywords: IoT, smart building, energy wastage, air condition.
Copyright © 2016 C. Yuen et al., licensed to EAI. This is an open access article distributed under the terms of the Creative Commons
Attribution license (http://creativecommons.org/licenses/by/3.0/), which permits unlimited use, distribution and reproduction in any
medium so long as the original work is properly cited.
doi: 10.4108/eai.1-1-2016.150813
1. Introduction
One of the most widely studied methods to reduce
electricity cost is the use of demand response
management scheme [1], in which consumers can shift
their electricity consumption from a high price period
to a low price period, e.g., response to the dynamic
pricing signals sent from the grid (see the related
references in [2]). Such shifting in electricity demand
helps utility in reducing the peak demand and hence
can greatly alleviate the energy generating cost.
However, shifting in electricity demand causes
inconvenience to the end users, and it is not suitable for
commercial buildings as the number of flexible load in
such buildings are limited. Besides, the end consumers,
other than the building manager, are not responsible for
the payment of the utility bill of the building, which
makes the consumers not very prudent in efficiently
managing their electricity usage. Further, the peak
demand period of commercial buildings coincides with
the peak demand period of the grid. Therefore, if the consumers, i.e., building occupants1, are uninterested
in saving energy, it may give rise to significant energy
wastage in commercial spaces [3], which subsequently
increase the cost of electricity. Given this reality,
building energy management (BEM) system has been
received considerable attention recently as a potential
solution to prevent such expensive electricity usage.
In particular, it is important to have low cost
BEM solutions that can immediately detect the energy
wastage from an office building and be flexible enough
to install into retrofit buildings. In this regard, a
number of recent studies investigate the issue of cost-
effective energy management in office spaces. For
instance, a simulation based study of an office building
is conducted in [4] to investigate the uncertainties in
energy consumption due to actual weather condition
and the building’s operational practices. To manage
the energy for electrical, heating, and cooling energy
zones of a building, a semi-centralized decision making
process using multi-agent systems is proposed in [5]
for joint heat and power optimization with a view to
improve energy efficiency and reduce energy cost.
In [6], the authors present a multi-agent comfort and
energy system by designing a meeting schedular with ∗Corresponding author. Email: [email protected] note that we have used consumer and occupant interchange-
ably to refer to the electricity consumers in commercial buildings throughout the manuscript.
multi-objective Markov Decision Process. The designed
energy system is further implemented in a testbed
with inputs from a real-world building including actual
EAI for Innovation
EAI Endorsed Transactions on Industrial Networks 1 and Intelligent Systems
on Industrial Networks And Intelligent Systems Research Article

European Alliance
09 2015 -01 2016 | Volume 3 | Issue 6 | e3
Chau et al.
thermal zones, temperatures, occupant preferences,
and occupant schedules. User comfort is considered in
[7], which demonstrates an intermediary communica-
tion platform to facilitate the communication between
humans and buildings toward adaptive end user com-
fort management and to compensate for high rate of
discomfort in office buildings. An optimal operating
strategy of building energy system with storage is pro-
posed in [8], which is shown to be effective for reducing
energy cost of the building. It is shown that the type and
capacity of storage devices have consequential effect on
the cost.
Inefficient use of consumer electronics such as
various lights and thermal control of office buildings
also cause significant waste of electricity. To address
this issue, an intelligent LED lighting system is
presented in [9], which uses multiple sensors and
wireless communication technology to control LED
light according to user’s state and the surrounding
environment. Similar energy control for lighting system
is also studied in [10]. For thermal control in office
buildings, a model-based key performance indicator
is proposed in [11] that can be applied to both at
room and central office level. The objective of the
scheme is to monitor and suggest useful counteractions
to be undertaken whenever inefficient management
of cooling systems is detected. Finally, an integrated
classification method to determine office buildings’
energy and thermal comfort class is developed in
[12] applying different clustering techniques. The
classification results are used for a parametric study of
common buildings’ characteristics in each rating class,
in order to provide a tool for adopting improvement
recommendations for buildings’ energy efficiency.
As from above discussion, most existing BEM studies
deal with the problems of energy efficiency and cost
reduction in office buildings from theoretical perspec-
tives. However, for a better understanding of energy
consumption/wastage pattern in such environments
and implementations, it is required to install a large
number of sensors that can provide real-time monitor-
ing and control facility. To this end, a system based on
IoT is a natural solution for old existing buildings.
In this paper, we demonstrate a number of experi-
ments and related analysis conducted in a smart office
environment within a testbed located at the Singa-
pore University of Technology and Design (SUTD). We
give a detailed discussion on the setup of the sensor
and wireless communications network at the SUTD
office testbed and explain the related technologies used
for the experiments. In the experiments, the energy
usage pattern of lights and air conditions (ACs) and
room occupancy are continuously monitored through
the deployed sensor network. The main objective is to
identify the total number of hours of energy wastage
by the room occupants and thus determine the total
energy wastage from the identified hours. It is shown that a significant portion of electricity is wasted by
the office members due to their negligence to switch-
off the lights and ACs when the respective rooms are
empty. The cost of the wasted energy from the office
building is determined, and thus the consequence of
the energy wastage on the electricity bill is established.
We further explain how the experimental results of the
proposed work can be utilized to implement effective
energy wastage control schemes.
The rest of the paper is organized as follows.
The system architecture is demonstrated in Section 2
followed by related energy analysis in Section 3. Finally,
some concluding remarks are drawn in Section 4.
2. System Architecture
In this section, we describe the overall system
architecture that is considered for the proposed study.
2.1. Desired Properties
The desired properties of the proposed architecture are
considered in terms of the system’s scalability, quality
of service (QoS), security, dynamic and interoperability.
Scalability. The system needs to be scalable. In
particular, it should have the capability for easy
installation of new nodes and efficient network
management with newly added nodes without any
degradation in the system performance. This would
leverage the extension of the network beyond a specific
geographic area and number of smart devices, and
further avoid the constraint on the number of smart
devices that can be installed within a system for desired
outcomes.
QoS. The IoT, which is the backbone of the proposed
system, is inherently a complex and shared system con-
sisting of a plethora of applications, networked com-
ponents, and resources. Many devices are constrained
in terms of computation, communication, and energy,
in addition the constraints are also dynamic and het-
erogeneous. Coupled with the critical nature of many
IoT applications, this motivates the need to provide
QoS across multiple dimensions. The first dimension
is the nature of the stakeholders. These include the
application, resource providers, and the network that
connects them. The second is the nature of competing
applications in the IoT, since multiple applications must
coexist. Finally, the nature of the constraints must be
considered, e.g., network characteristics like latency for
control messages and bandwidth, device properties like
battery power and memory, environment attributes like
location and temperature, or application requirements
like priorities, precision and responsiveness.
EAI for Innovation
EAI Endorsed Transactions on Industrial Networks 2 and Intelligent Systems
European Alliance
09 2015 -01 2016 | Volume 3 | Issue 6 | e3
Design of Cloud-Connected IoT System for Smart Buildings on Energy Management (Invited paper)
Security. Security attacks on IoT system can be
significantly catastrophic as it takes the control of
large critical infrastructure systems and even of small
scale systems like household appliances. As a result
of these security attacks, consumers might receive
wrong pricing information on their energy usage
or a malicious controller, other than the authorised
grid, may take the control over their scheduled
loads. Therefore, strong security measures need to be
taken against such as playback attack, for example,
for ensuring data confidentiality, data integrity, and
user/device authenticity.
Dynamic. The IoT network needs to have the capability
to dynamically adopt to the change of environment. For
instance, it should have the ability to self organize with
the change of sensor network set up and self-healing
capability in case of of an disruption in the network.
Further, the network needs to be flexible enough to be
connected with other existing or new network with a
view to work in a larger scope.
Interoperability. Interoperability is a vital concept of
IoT, which connects the devices in a network through
a common software or platform in order to let
them work together. Since smart grid is composed of
large number of smart nodes such as homes, where
each home has a number of intelligent devices, that
can operate, communicate and interact autonomously,
users may want to purchase an off-the-shelf devices,
e.g., a sensor like camera or an actuator like light
controller, and integrate them to the system. Therefore,
interoperability of IoT is critical in making these smart
devices work together.
2.2. Network Architecture
We surveyed and discussed some typical network
architectures of IoT network for smart building
management.
Cloud-based vs non cloud-based architecture. Generally,
the cloud-based IoT architecture consists of users,
which seek services from the system, distributed
sensor nodes, and a number of intra-connected servers
as a cloud platform. Specifically, a physical sensor
is virtualized as a virtual sensor on the cloud
computing. The nodes upload data to the servers
with no concerns about the locations of the servers
or their detailed specifications. Therefore, the cloud-
based architecture supports the IoT services that can
satisfy the requirement of scalability. Data collected
from the sensors is transmitted to a data processing
unit in the cloud [13]. The unit creates a storage
format that is used to process the data and then
send the data to database. Moreover, the authorized
user is able to access or control the sensor via the
user interface on web browser. In [14], an uID-CoAP
architecture based on cloud computing is proposed
to combine constrained application protocol (CoAP)
with the ubiquitous ID (uID) architecture. The uID-
CoAP keeps the knowledge and data required for
practical complex IoT services. In addition, a software
framework for embedded system is developed to
enable IoT service to support application-layer API.
Furthermore, the cloud-based IoT is developed for
intelligent home automation system [15]. Systems with
cloud computing capabilities analyze the assimilated
data to recognize the activities of inhabitants or events.
These can automate the domestic utilizations effectively
and also can support the inhabitant by reducing the
costs and improving the standard of living.
Single hop vs multi-hop IoT network. In single hop IoT
architecture, sensor nodes are directly connected to
a data sink/gateway that assembles the data. The
data transmission delay can be minimised and large
data volume applications such as multimedia sensor
network can be supported [16]. However, the network
size and coverage of single hop IoT network are limited
by the 1-hop range of the sink, which does not support
large-scale IoT networks.
Therefore, multi-hop IoT architecture is developed to
cover urban scenarios. In [17], a multi-hop IoT network
is proposed to integrate MANET and WSNs, which
enables cross-network impromptu communications to
boost urban data collection in smart city. It is shown
that multi-hop IoT architecture improves ubiquitous
and collaborative urban sensing by enabling a fine-
grained adaptive control for more scalable management
of urban environments. Data routing attracts lots of
research attentions in multi-hop IoT network. A secure
routing protocol is proposed to enable the IoT devices
to authenticate before forming a new network or
joining an existing network [18]. The proposed routing
protocol embeds the multi-layer parameters into the
routing algorithm, thus combining the authentication
and routing processes without incurring significant
overheads. A scalable smart city testbed is developed
for large-scale IoT experimentation [19]. Specifically,
all the nodes deployed are part of the same physical
network as long as it is possible to find a set of IEEE
802.15.4 links connecting, on a multi-hop manner, any
pair of the deployed nodes.
IP-based vs non-IP based network protocol. The two-way
communications between the sensors and the server
are motivated by the type of network architecture.
In particular, we use IP-based and non-IP based
communication protocols in the system. In an IP-
based communication protocol, as shown in Fig. 1,
to communicate with the server the sensors install in
each room first communicates with a respective Wi-
Fi access point. Then, the information is passed from
the Wi-Fi access point to the server through Wi-Fi. For
EAI for Innovation
EAI Endorsed Transactions on Industrial Networks 3 and Intelligent Systems

Chau et al.
Figure 1. Single-hop IP based wireless sensor network based on Wi-Fi.
nodes send their respective signals through ZigBee
to a router from where the signals are retransmitted
towards a gateway. The ZigBee Alliance has developed
a specification for a reliable, cost-effective, low-power,
low-data-rate wireless networking protocol, which is
built on the top of the IEEE 802.15.4 standard [21].
ZigBee uses multi-hop support for communication, and
hence if one router is down, the node can reconnect to
another router. Thus additional coverage can be added
easily through ZigBee. However, the transmission
of control message could be more difficult in such
failure. The ZigBee standard defines the network layer
specifications for star, tree, and peer-to-peer network
topologies, and also provides frameworks for the
application programming in the application layer. In
ZigBee, the network layer is in charge of organizing
and providing routing over a multi-hop network (built
on the top of the IEEE 802.15.4 functionalities). On
the contrary, the purpose of the application layer is
to provide a framework for distributed application
development and communication. To transfer the data
using ZigBee, we use a XBee Pro-S2B module, which
has a RF data rate of 250, 000 bits per seconds
(bps) [22]. Now, the gateway, upon receiving the
signals from all the routers transmit them over internet
towards the cloud server. Similarly, for server to sensor
communication, the control signal first sent from the
cloud to the gateway, and then the gateway sends the
control signal towards the intended controller node.
2.3. Sensing and Control
Multi Purpose Node (MPN) Sensors:
Figure 2. Multi-hop star topology Non-IP based wireless sensor network based
on ZigBee.
S1
Xbee chip
S3, S4
A3 S5
S1. Motion S2 S2. Noise
S3. Temperature S4. Humidity S5. Lux
A1 Actuators: A1. IR Blaster
A2 A2. LED Lighting control A3. LED indicator
communication from server to the sensors, the control
signal from the server is first transmitted towards
the Wi-Fi access point, which is further send to the
respective controller via Wi-Fi [20]. However, if we
want to extend the coverage using WiFi, installation
of additional access point may not be easy. Further as
the number of devices increases in the network the
MAC protocol may not be in favour. Nonetheless, there
is a new standard 802.11AH to support machine-type
devices.
For non-IP based communication protocol, we show
the network architecture in Fig. 2, where sensor
Figure 3. Demonstration of the MPN used in each office room for sensing and controlling purposes.
The sensing of different environmental parameters
are accomplished by installing a multi-purpose node
(MPN) in each of the room that we wish to sense the
wastage of energy and control. An MPN, as shown
in Fig. 3, is a combination of a number of sensors
and actuators. On the one hand, an MPN is equipped
with sensors like motion detector, noise detector, a
temperature and humidity sensor, and a lux sensor.
All the environmental data collected by the sensors are
stored and analysed in the cloud server.
4
Sensors (MPN)
Wi-Fi access point
Wi-Fi
Cloud server
Sensor (MPN)
ZigBee
ZigBee Gateway
ZigBee Router
Cloud server
Internet
and Intelligent Systems 09 2015 -01 2016 | Volume 3 | Issue 6 | e3
EAI Endorsed Transactions on Industrial Networks European Alliance
EAI for Innovation

Table 1. Technical Specification of the XBee Pro S2B Unit
Design of Cloud-Connected IoT System for Smart Buildings on Energy Management (Invited paper)
o from a range of [2, 3], the room is also assumed to
be occupied. For other readings from the sensors, the
server considers the room is empty. That is,
Room = fill if, motion= 1 or noise ≈ σ
empty otherwise . (1)
On the other hand, a set of actuators consisting of a
IR bluster, a LED lighting control and a LED indicator
are also installed inside the MPN. The control signals
are instructed from the cloud server to the actuators
of the MPN, if requires, in order to control energy
consumption of some of the office equipments, e.g., the
3.2. Light Analysis
To analyze the status of lights in a room, i.e., whether
the lights are switched on or off, we measure the light
intensity of a room through a lux sensor installed within
the MPN. Particularly, if the measurement from lux
sensor is less than 500, the lights are assumed to be off. Otherwise, the lights are assumed to be switched on. In
summary,
Status of lights = on if lux ≥ 500
AC of an office room may switched off if there is no one
inside the room for a particular period of time. off
otherwise
. (2)
2.4. SUTD Office Testbed
In the SUTD office testbed, each selected faculty
office room is equipped with an MPN. The MPN is
configured in a cloud-connected multihop non-IP based
architecture as shown in Fig. 3. All the environmental
data collected by the sensors are stored and analysed
in the cloud server. The control signals, however,
are instructed from the cloud server to the actuators
of the MPN, if requires, in order to control energy
consumption of some of the office equipments, e.g., the
AC of an office room may switched off if there is no one
inside the room for a particular period of time.
3. Energy Analysis
In this section, we show the energy analysis of the
experiments that are conducted at the faculty offices.
We present the results of eight selected rooms from
the testbed, where each room has an MPN. The lux,
temperature, humidity, motion, and noise sensors of
the MPN are used to measure the light intensity,
room temperature, humidity level, room occupancy,
and operating condition of the ACs of the office rooms.
The measurement is conducted periodically for every
five minutes for a duration of two months. To this end,
what follows are the analysis that we conducted for
different aspects of the office rooms.
3.1. Occupancy Analysis
To conduct the occupancy analysis of the office rooms,
we mainly focus on the values obtained from two types
of sensor. In particular, an office room is considered to
It is important to note that the placement of sensors in the room affects the lux reading and may cause
some error on the detection of the status of lights.
For example, if the sensor is placed close to the
window, some outdoor light sources such as natural
light, corridor light, etc, can be captured, which causes
a high lux value.
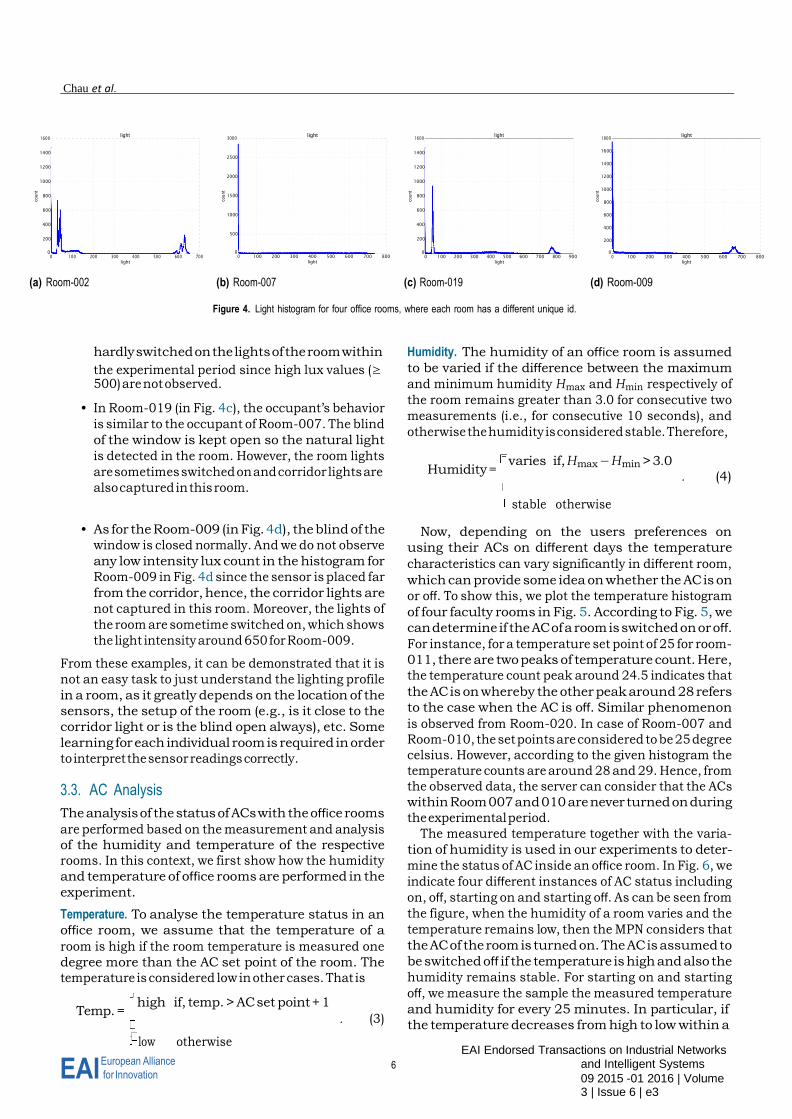
Fig. 4 indicates whether or not the lights in a room
are switched on and also if there are other sources of light in the room. We demonstrate four histograms in Fig. 4, where we show how the cloud server can identify whether the lights of a particular office room
are switched on or switched off. In particular, the
histograms give us the count of the lux intensity inside four office rooms for the considered duration
of time. For instance, consider Room-0022 in Fig. 4a,
where the lights are switched on for multiple time
instants as well as the room gets some lights from
the corridor even when the room lights are switched
off. This can be interpreted according to the observed
phenomenon from Fig. 4a where the cloud server
receives a measurement of a lux intensity of 600 due
to the lights within the room. Furthermore, due to the
lights from the corridor, the histogram shows spikes at
around the intensity of 40 for a large number of time.
In a similar fashion, we can analyse the light usage
behavior of other rooms as follows:
• In Room-007 (in Fig. 4b), the blind of windows is
always open and hence natural light is captured in
the room, which is demonstrated by the presence
of lux from 200 to 600. The corridor light whose
lux value is generally lower than 100 is not
captured. Additionally, the occupant of the room
be occupied if the reading from the motion sensor is 1.
In addition, if the noise sensor measures a noise reading 2Each room is assigned a different number for identification.
Specifications Xbee Pro S2B
Indoor/Urban range Up to 300 ft, up to 200 ft for international variant
Outdoor line-of-sight Up to 2 miles, up to 5000 ft for international variant
Transmit power 63 mW (+18 dBm), 10 mW (+10 dBm) for international variant
Receiver sensitivity -102 dBm
RF data rate 250,000 bps
Number of channels 15 direct sequence channels
Supported network & topologies
Point-to-point, point-to-multipoint, peer-to-peer and mesh
and Intelligent Systems
09 2015 -01 2016 | Volume 3 | Issue 6 | e3
EAI Endorsed Transactions on Industrial Networks
5 European Alliance
EAI for Innovation
Chau et al.
1600 light
3000 light
1600 light
1800 light
1400
1200
1000
800
600
400
200
0
0 100 200 300 400 500 600 700
light
2500
2000
1500
1000
500
0
0 100 200 300 400 500 600 700 800
light
1400
1200
1000
800
600
400
200
0
0 100 200 300 400 500 600 700 800 900
light
1600
1400
1200
1000
800
600
400
200
0
0 100 200 300 400 500 600 700 800
light
(a) Room-002 (b) Room-007 (c) Room-019 (d) Room-009
Figure 4. Light histogram for four office rooms, where each room has a different unique id.
hardly switched on the lights of the room within
the experimental period since high lux values (≥ 500) are not observed.
• In Room-019 (in Fig. 4c), the occupant’s behavior
is similar to the occupant of Room-007. The blind
of the window is kept open so the natural light
is detected in the room. However, the room lights
are sometimes switched on and corridor lights are
Humidity. The humidity of an office room is assumed
to be varied if the difference between the maximum
and minimum humidity Hmax and Hmin respectively of
the room remains greater than 3.0 for consecutive two
measurements (i.e., for consecutive 10 seconds), and
otherwise the humidity is considered stable. Therefore,
Humidity = varies if, Hmax − Hmin > 3.0
also captured in this room.
stable otherwise
. (4)
• As for the Room-009 (in Fig. 4d), the blind of the
window is closed normally. And we do not observe
any low intensity lux count in the histogram for
Room-009 in Fig. 4d since the sensor is placed far
from the corridor, hence, the corridor lights are
not captured in this room. Moreover, the lights of
the room are sometime switched on, which shows
the light intensity around 650 for Room-009.
From these examples, it can be demonstrated that it is
not an easy task to just understand the lighting profile
in a room, as it greatly depends on the location of the
sensors, the setup of the room (e.g., is it close to the
corridor light or is the blind open always), etc. Some
learning for each individual room is required in order
to interpret the sensor readings correctly.
3.3. AC Analysis
The analysis of the status of ACs with the office rooms
are performed based on the measurement and analysis
of the humidity and temperature of the respective
rooms. In this context, we first show how the humidity
and temperature of office rooms are performed in the
experiment.
Temperature. To analyse the temperature status in an
office room, we assume that the temperature of a
room is high if the room temperature is measured one
degree more than the AC set point of the room. The
temperature is considered low in other cases. That is
Temp. = high if, temp. > AC set point + 1
Now, depending on the users preferences on
using their ACs on different days the temperature
characteristics can vary significantly in different room,
which can provide some idea on whether the AC is on
or off. To show this, we plot the temperature histogram
of four faculty rooms in Fig. 5. According to Fig. 5, we
can determine if the AC of a room is switched on or off. For instance, for a temperature set point of 25 for room-
011, there are two peaks of temperature count. Here,
the temperature count peak around 24.5 indicates that
the AC is on whereby the other peak around 28 refers
to the case when the AC is off. Similar phenomenon
is observed from Room-020. In case of Room-007 and
Room-010, the set points are considered to be 25 degree
celsius. However, according to the given histogram the
temperature counts are around 28 and 29. Hence, from
the observed data, the server can consider that the ACs
within Room 007 and 010 are never turned on during
the experimental period.
The measured temperature together with the varia-
tion of humidity is used in our experiments to deter-
mine the status of AC inside an office room. In Fig. 6, we
indicate four different instances of AC status including
on, off, starting on and starting off. As can be seen from
the figure, when the humidity of a room varies and the
temperature remains low, then the MPN considers that
the AC of the room is turned on. The AC is assumed to
be switched off if the temperature is high and also the
humidity remains stable. For starting on and starting
off, we measure the sample the measured temperature
and humidity for every 25 minutes. In particular, if
low otherwise
. (3) the temperature decreases from high to low within a
co
unt
co
unt
co
unt
co
unt
and Intelligent Systems
09 2015 -01 2016 | Volume 3 | Issue 6 | e3
EAI Endorsed Transactions on Industrial Networks
6 European Alliance
EAI for Innovation

European Alliance
09 2015 -01 2016 | Volume 3 | Issue 6 | e3
Table 2. Description of the status of AC in a office room based on temperature
and humidity measurement. rooms. The wastage is due to the lights and ACs, which remain switched on when the rooms are empty.
Design of Cloud-Connected IoT System for Smart Buildings on Energy Management (Invited paper)
140 temperature
90 temperature
100 temperature
140 temperature
120
100
80
60
40
20
0
24 25 26 27 28 29 30 31 32
temperature
80
70
60
50
40
30
20
10
0
23 24 25 26 27 28 29 30 31
temperature
80
60
40
20
0
22 23 24 25 26 27 28 29
temperature
120
100
80
60
40
20
0
20 22 24 26 28 30 32
temperature
(a) Room-007 (b) Room-010 (c) Room-011 (d) Room-020
Figure 5. Temperature histogram for four office rooms where each room has a different unique id.
Table 3. Demonstration of the total duration of energy wastage in the office
Humidity Temperature Status of AC
Varied Low On
Stable High Off
Varied High
Starting on, if temperature decreases within a duration ≤ 25 minutes
Off, otherwise
Stable Low
Starting off, if temperature increases within a duration ≤ 25 minutes
On, otherwise
duration of 25 minutes with varying humidity, the con-
dition refers to starting on. However, if the temperature
does not decrease within the specified duration (while
humidity is varying) then the AC is considered to be
off. Similarly, if the humidity is stable, then increase of
temperature from low to high within 25 minutes indi-
cates starting off state, which is otherwise considered as
on. The decision making process of the AC status based
on the measured temperature and humidity is briefly
shown in Table 2.
Based on Fig. 4 and 5, the analysis is performed
offline with the site information (e.g., sensor location
and aircon set point) through site visit and user
survey. As a future research direction, an online
learning algorithm is needed to estimate the light and
temperature readings, and hence to provide a real-time
data collection and analysis.
3.4. Wastage of energy
Wastage in terms of time. After successfully measure the
status of lights and AC in office rooms, the measured
data is analyzed according to (1), (2), (3), (4) and Table 2
to determine the energy wastage in the office building.
In particular, based on the measured data, we study
the total number of hours when the office rooms are
empty but the lights or ACs or both remain switched
remained switched on even when the rooms are empty.
For instance, consider No. room-1. In a measurement
duration of 1296 hours, i.e., 54 days, the energy wastage
for lights and ACs are 322 and 272 hours respectively.
Since, lights and ACs consume a significant portion
of electricity [10, 12], the study in Table 3 clearly
emphasizes the volume of energy wastage that may
occur in a commercial office space if the employees do
not switch off their room appliances while leaving the
office.
Wastage in terms of energy and money. Now to quantify
the amount of energy wastage within office room, we
map the total duration of wastage from Table 3 into the
total energy wastage and the total cost for this wastage
energy during these periods of time. We consider that
each office room is equipped with a 40 W fluorescent
light and an AC with system 3/4 (2260 W). Now,
for the considered system and duration of wastage
demonstrated in Table 3, the total energy wastage for
both per day and the considered experimental duration
are calculated by using HOME ELECTRICITY AUDIT
form3 provided by SP Service, Singapore. The same
on. The key findings of the study are presented in
Table 3. As can be seen from this table, a significant
number of times the appliances in office rooms are
3The form is available online for public use in https://services.
spservices.sg/elect_audit_frameset.asp.
EAI for Innovation
EAI Endorsed Transactions on Industrial Networks 7 and Intelligent Systems
co
unt
co
unt
co
unt
co
unt
Room Number
Dura,on of data collec,on
AC set point (oCelsius)
Room empty,
lights on (Hours)
Room empty, AC
on (Hours)
Room empty (Days)
002 54 days 24 322 272 53
007 54 days 25 104 7 50
009 54 days 25 149 96 48
011 54 days 24 133 138 46
014 54 days 24 202 2 50
017 54 days 24 150 26 43
019 54 days 25 129 216 49
020 54 days 25 88 66 49

European Alliance
09 2015 -01 2016 | Volume 3 | Issue 6 | e3
Chau et al.
Figure 6. Measurement of humidity and temperature from an office room at SUTD office testbed.
Table 4. Demonstration of total wastage in terms of energy and money (in Singapore dollar (SGD)) from the SUTD office testbed.
Room
Number
Total
number of
day
Energy wastage from
lights (kWh)
Energy wastage from
AC (kWh)
Cost of energy
wastage from lights
(SGD)
Cost of energy
wastage from lights
(SGD)
Total
wastage
(SGD)
Average
wastage
per day
Total
wastage in
the
considered
time
Average
wastage
per day
Total
wastage in
the
considered
time
Average
wastage
per day
Total
wastage in
the
considered
time
Average
wastage
per day
Total
wastage in
the
considered
time
002 54 0.2384 12.87 11.39 615.08 0.055 3.006 2.65 143.24 146.25
007 54 0.0772 4.16 0.27 14.64 0.018 0.972 0.063 3.402 4.374
009 54 0.11 5.94 4.02 217.23 0.025 1.386 0.937 50.60 51.984
011 54 0.0984 5.32 5.78 312.42 0.023 1.242 1.34 72.75 73.998
014 54 0.1496 8.07 0.02 1.22 0.035 1.89 0.005 0.288 2.178
017 54 0.1112 6.00 1.08 58.57 0.026 1.404 0.252 13.644 15.048
019 54 0.0956 5.16 9.04 488.16 0.022 1.206 2.105 113.68 114.894
020 54 0.0648 3.49 2.75 148.88 0.015 0.81 0.642 34.668 35.478
Total cost of energy wastage from the SUTD office testbed in the considered time 444.204
form is also used to calculate the cost of total wasted
energy and the results are shown in Table 4.
As can be seen from Table 4, significant amount of
energy and cost savings are possible if the proposed
monitoring scheme is adopted in office environments to
control the AC and lights when the occupants are not
in their respected rooms. For example, over a 54 days duration, 627.95 kWh of energy worth of 146.25 dollar
can be saved from only room-002 if room’s AC and
lights are switched off when the room is empty. If we
consider the total cost of energy from the eight rooms,
the energy and related cost savings from the wastage is significantly high. As can be seen from Table 4, the
experimental result from the eight rooms demonstrated
a savings of total 1856.2 kWh of energy that leads to a
total savings of 444.204 dollar over a 54 days duration.
Imagine an office building with 90 rooms, the saving
could be easily 4500 dollar over two-month period.
4. Conclusion
There are several plans to explore the work in some
other direction. One potential plan is to include the
real-time analysis of data after learning from the users’
behavior of energy usage. We are also interested to
use the result, after learning, to do real-time energy
management incorporating user comfort such as pre-
cooling of aircons of office rooms through movement
prediction. Moreover, an application on the user’s
mobile phone will be implemented to track and predict
the movement, and trigger the pre-cooling of aircon
before the the user arrives the office.
Acknowledgement. This work is supported by the Singapore
University of Technology and Design (SUTD) through the
Energy Innovation Research Program (EIRP) Singapore
NRF2012EWT-EIRP002-045.
References
[1] Palensky, P. and Dietrich, D. (2011) Demand side
management: Demand response, intelligent energy
European Alliance for Innovation
EAI Endorsed Transactions on Industrial Networks 8 and Intelligent Systems EAI
European Alliance
09 2015 -01 2016 | Volume 3 | Issue 6 | e3
Design of Cloud-Connected IoT System for Smart Buildings on Energy Management (Invited paper)
systems, and smart loads. IEEE Trans. Ind. Inform. 7(3):
381–388.
[2] Fang, X., Misra, S., Xue, G. and Yang, D. (2012) Smart
grid - The new and improved power grid: A survey. IEEE Commun. Surveys Tuts. 14(4): 944–980.
[3] Stauffer, N.W. (2013), Reducing energy
wastage in commercial buildings. URL
http://newsoffice.mit.edu/2013/
reducing-wasted-energy-in-commercial-buildings.
Published in MIT News on Feb. 5.
[4] Wang, L., Mathew, P. and Pang, X. (2012) Uncertainties
in energy consumption introduced by building opera-
tions and weather for a medium-size office building.
Elsevier Energy and Building 53: 152–158.
[5] Zhao, P., Suryanarayanan, S. and Simões, M.G.
(2013) An energy management system for building
structures using a multi-agent decision-making control
methodology. IEEE Trans. Ind. Appl. 49(1): 322–330.
[6] Klein, L., young Kwak, J., Kavulya, G., Jazizadeh,
F., Becerik-Gerber, B., Varakantham, P. and Tambe,
M. (2012) Coordinating occupant behavior for building
energy and comfort management using multi-agent
systems. Elsevier Automation in Construction 22: 525–
536.
[7] Jazizadeh, F. and Becerik-Gerber, B. (2012) Toward adaptive comfort management in office buildings using
participatory sensing for end user driven control. In
Proc. 4th ACM Workshop on Embedded Sensing Systems forEnergy-Efficiency in Buildings (Toronto, Canada): 1–8.
[8] Xu, Z., Guan, X., Jia, Q.S., Wu, J., Wang, D. and Chen, S.
(2012) Performance analysis and comparison on energy
storage devices for smart building energy management.
IEEE Trans. Smart Grid 3(4): 2136–2147.
[9] Byun, J., Hong, I., Lee, B. and Park, S. (2013)
Intelligent household led lighting system considering
energy efficiency and user satisfaction. IEEE Trans. Consum. Electron. 59(1): 70–76.
[10] Parise, G., Martirano, L., and Ponio, S.D. (2013) Energy
performance of interior lighting systems. IEEE Trans. Ind. Appl. 49(6): 2793–2801.
[11] Sorrentino, M., Rizzo, G., Trifiró, A. and Bedogni, F.
(2014) A model-based key performance index for energy
assessment and monitoring of telecommunication cool-
ing systems. IEEE Trans. Sustain. Energy 5(4): 1126–1136.
[12] Nikolaou, T.G., Kolokotsa, D.S., Stavrakakis, G.S. and
Skias, I.D. (2012) On the application of clustering
techniques for office buildings’ energy and thermal
comfort classification. IEEE Trans. Smart Grid 3(4): 2196–
2210.
[13] Ahmed, K. and Gregory, M. (2011) Integrating wireless
sensor networks with cloud computing. In International Conference on Mobile Ad-hoc and Sensor Networks (MSN) (IEEE): 364–366.
[14] Yashiro, T., Kobayashi, S., Koshizuka, N. and Sakamura,
K. (2013) An internet of things (iot) architecture
for embedded appliances. In Humanitarian Technology Conference (R10-HTC), 2013 IEEE Region 10 (IEEE): 314–
319.
[15] Kelly, S.D.T., Suryadevara, N.K. and Mukhopadhyay,
S.C. (2013) Towards the implementation of iot for
environmental condition monitoring in homes. Sensors
Journal, IEEE 13(10): 3846–3853. [16] Redondi, A., Buranapanichkit, D., Cesana, M.,
Tagliasacchi, M. and Andreopoulos, Y. (2014)
Energy consumption of visual sensor networks: Impact
of spatio-temporal coverage based on single-hop
topologies. In EWSN: 150–165.
[17] Bellavista, P., Cardone, G., Corradi, A. and Foschini,
L. (2013) Convergence of MANET and WSN in IoT urban
scenarios. IEEE Sensors Journal 13(10): 3558–3567.
[18] Chze, P.L.R. and Leong, K.S. (2014) A secure multi-hop
routing for IoT communication. In IEEE World Forum on Internet of Things (WF-IoT) (IEEE): 428–432.
[19] Sanchez, L., Muñoz, L., Galache, J.A., Sotres, P.,
Santana, J.R., Gutierrez, V., Ramdhany, R. et al. (2014)
Smartsantander: IoT experimentation over a smart city
testbed. Computer Networks 61: 217–238.
[20] Camps-Mur, D., Garcia-Saavedra, A. and Serrano,
P. (2013) Device-to-device communications with Wi-
Fi direct: Overview and experimentation. IEEE Wireless Commun. 20(3): 96–104.
[21] Sallabi, F.M., Gaouda, A.M., El-Hag, A.H. and Salama,
M.M.A. (2014) Evaluation of zigbee wireless sensor
networks under high power disturbances. IEEE Trans. Power Del. 29(1): 13–20.
[22] Digi International Inc. (2012), Xbee/xbee-pro
zb rf modules. URL http://www.adafruit.com/
datasheets/XBee%20ZB%20User%20Manual.pdf.
Published online in March 2012.
European Alliance for Innovation
EAI Endorsed Transactions on Industrial Networks and Intelligent Systems
9 09 2015 -01 2016 | Volume EAI