EaglE ScoutS · EaglE ScoutS Merit Beyond the Badge Photos and merit badge images courtesy of the...
77
EAGLE SCOUTS MERIT BEYOND THE BADGE By Sung Joon Jang, Byron R. Johnson, and Young-II Kim Baylor University
Transcript of EaglE ScoutS · EaglE ScoutS Merit Beyond the Badge Photos and merit badge images courtesy of the...

EaglE ScoutSM e r i t B e y o n d t h e B a d g e
BySung Joon Jang, Byron R. Johnson, and Young-II Kim
Baylor university

EaglE ScoutSM e r i t B e y o n d t h e B a d g e
Photos and merit badge images courtesy of the Boy Scouts of America.

table of contents
Background ....................................................................................................... 1
About Eagle Scouts .......................................................................................... 2
Study Questions and Methodology Overview ................................................ 2
Findings ............................................................................................................. 4 Health and Recreation ............................................................................... 4 Connection ................................................................................................. 9 Service and Leadership ........................................................................... 13 Environmental Stewardship .................................................................... 17 Goal Orientation ....................................................................................... 19 Planning and Preparedness .................................................................... 22 Character.................................................................................................. 24
Summary ......................................................................................................... 28
Tables .............................................................................................................. 29 Table 1: Descriptive Statistics ................................................................. 29 Table 2: Main Findings ............................................................................. 30
Appendix A ...................................................................................................... 33 Study Design ............................................................................................ 33 The Sample .............................................................................................. 33 The Survey Items ..................................................................................... 34 Data Analysis and Reporting .................................................................. 34
Appendix B: Regression Tables (Eagle Scout vs. Non-Scout) ..................... 35
Appendix C: Regression Tables (Eagle Scout vs. Scout) ............................. 47
Appendix D: Survey ........................................................................................ 59
Acknowledgements ........................................................................................ 71
About the Authors ........................................................................................... 71
Endnotes ......................................................................................................... 72

1
BackgroundA majority of Americans believe instilling values in
young people is important for a healthy society; however,
this goal is not easily achieved. There are many reasons
that building character and instilling values in youth is
an objective that is often difficult to realize. Families
have traditionally been the main providers of character
training for their children. However, today families are
under enormous pressure for time and resources due
to changing family structures and economic pressures.
Children are also exposed to many more messages that
may not align with the values their family is teaching.
Because of this, many parents find they need additional
support to reinforce positive character development.
Achieving this objective also requires an enormous
local and national commitment to provide the structure
and support necessary to put in place programs and
resources that teach and reinforce the values that will
help prepare youth to make ethical decisions and to
achieve their full potential as individuals. The founders
of Scouting recognized the need to provide training so
youth could live and act according to values that would
help them succeed and serve society as a whole. And, it
is for this reason the Boy Scouts of America (BSA) was
founded in 1910 and chartered by Congress in 1916. For
more than 100 years the BSA has sought to encourage
and instill the values necessary to help young people
make and continue making ethical and moral choices
over the entire course of their life.
Beginning in the early 1990s, practitioners
and policy makers, as well as scholars of various
disciplines, contributed to the emergence of a new
approach to youth research and practice, which has
been referred to as positive youth development.1 The
approach emerged out of frustration over a problem-
focused view on youth development. The underlying
assumption of the problem-focused view was that youth
were vulnerable and represent potential problems that
need to be managed.2 On the other hand, the positive
youth development perspective suggested that the
approach focusing on risk reduction was incomplete and
inadequate. Instead, the positive youth development
perspective views young people as resources to be
developed, focusing on their potentials for successful
and healthy development.
Positive youth development is based on the
premise that when adults support and enable youth to
control and motivate themselves, youth are most likely
to harness and internalize their potential for prosocial
behavior.3 Indeed, there is research confirming that,
under the right conditions, youth become self-motivated
by confronting challenging tasks. For example, initiative
or the ability to be motivated from within has been found
to be a core quality of positive youth development.4
Similarly, researchers have found participation in
organized youth activities to be associated with prosocial
experiences related to initiative, identity exploration and
reflection, emotional learning, developing teamwork
skills, and forming ties with community members.5
The programs of the BSA are designed to incorporate
activities and learning experiences that strengthen young
people’s attitudes and actions toward God, family, country,
and community. Ultimately, the aim of BSA programs has
been and continues to remain the same—to have a positive
and robust influence on the character, citizenship, and
physical fitness of youth who participate.
The objective of Scouting, therefore, is to promote
positive youth development that has a lasting impact
on youth into young adulthood and throughout their
life. This lasting influence—enhancing youth’s values,
ethics, decision making, relationships, and personal

2
The Eagle Scout Award, the highest award in
Boy Scouting, has been awarded to young men for 100
years. Since 1912, around 4 percent of men who were
Boy Scouts have earned the award. More than 2 million
young men have earned the rank of Eagle Scout since it
was first awarded.
Over the years, requirements for the Eagle Scout
Award have changed to meet the needs of the era;
however, certain elements of the program have remained
true from the original Eagle Scout requirements. A
boy must demonstrate citizenship and caring for his
community and others, leadership qualities, and outdoor
skills that show his self-sufficiency and ability to overcome
obstacles. Today, a boy must earn 21 merit badges, 12
of which are required: First Aid, Camping, Citizenship
in the Community, Citizenship in the Nation, Citizenship
in the World, Personal Management, Personal Fitness,
Swimming or Hiking or Cycling, Communications,
Family Life, Emergency Preparedness or Lifesaving, and
Environmental Science.
Beyond the merit badges, a candidate must
also plan and carry out a service project to benefit the
community. In addition, he must have held a troop
leadership position during his Scouting tenure. Finally,
the Eagle Scout candidate undergoes a rigorous
board of review in which his district, council, and troop
leaders evaluate his “attitude and practice of the ideals
of Scouting.” Achieving the rank of Eagle Scout must
happen before a boy’s 18th birthday.
about Eagle Scouts
Study Questions and Methodology overview
development—is thought to be even more significant
for those youth attaining the rank of Eagle Scout.
This additional benefit, of course, is due to the added
dedication and commitment required to reach this
important designation. Consequently, the BSA has
always maintained that achieving Scouting’s ultimate
rank would result in additional benefits for Eagle Scouts
when compared to Scouts that do not achieve this
rank, as well as youth who have never participated in
Scouting. Moreover, there is a belief that becoming an
Eagle Scout has positive and lasting influences that can
be confirmed or documented.
Previous studies have shown that participation
in Scouting produces better citizens.6 And, there is no
shortage of examples or anecdotal accounts that would
affirm these findings. Surprisingly, however, there is
very little scientific evidence to confirm the prosocial
benefits associated with Scouting or earning the rank of
Eagle Scout. Thus, the central question of this study is
to determine if participation in Scouting and ultimately
becoming an Eagle Scout is associated with prosocial
behavior and positive youth development that carries
over into young adulthood and beyond.

3
Do youth participating in Scouting receive
character-building advantages over youth that have not
participated in Scouting? More specifically, do Eagle
Scouts, because of the additional commitment and
effort required to reach this rank, experience additional
positive attributes that provide advantage and benefits
to them over non-Scouts as well as other Scouts who
never attain the rank of Eagle?
To obtain the answers to these research questions,
a major research grant from the John Templeton
Foundation was awarded to Baylor University’s Program
on Prosocial Behavior. Through this funding, a survey
was conducted by the Gallup Organization from October
12, 2010 to November 20, 2010 (see Table 1 and
Appendix A for demographic profiles of the sample and
a more detailed description of the study design and
methodology). The following provides a brief description
of the survey methodology.
•Galluprecruitedpotentialrespondentsthrough
nationwide random-digit dialing sampling and a
multi-call design.
•Atotalof81,409potentialrespondentswere
contacted by the Gallup Organization.
•Amongthosewhoagreedtobere-contacted,
2,512 were randomly selected and completed
the telephone survey.
•Thisstudyisbasedondatacollectedfrom
the random sample of 2,512 adult males and
has a margin of error of plus or minus four
percentage points.
•Amongthe2,512,134wereidentifiedasEagle
Scouts, 853 were identified as Scouts, and 1,502
were identified as non-Scouts. Twenty-three
could not be identified as one of these three
survey respondents.
•Thesurveyincludedsubjectsgroupedwithin
three main topics:
— Well-being (e.g., with survey questions
dedicated to recreational activities, emotional
well-being, relational well-being, and physical
well-being)
— Civic engagement (e.g., with survey items
focusing on membership in formal and
informal groups, community donations,
community volunteering, community
problem-solving, environmental stewardship,
political participation, and civic leadership)
— Character development (e.g., survey
statements asking about commitment
to learning, goal orientation, planning/
preparedness, self-efficacy, activities with
neighbors, accountability, moral attitudes,
openness to diversity, civic attitudes,
and spirituality)
A complete copy of the actual survey is included
at the end of this report in Appendix D.
Analyses were conducted to see whether three
groups of survey respondents—Eagle Scouts, Scouts
who did not earn the Eagle Scout Award (henceforth,
Scout), and non-Scouts—differed in their survey
responses. (See Appendix A for a full description of
the statistical analysis used.) This report includes only
the findings of Eagle Scouts compared to other Scouts
and non-Scouts.

4
There are a number of statistically significant
differences between Eagle Scouts and other Scouts as
well as non-Scouts in key areas. These areas have been
summarized into seven thematic categories: Health
and Recreation, Connection, Service and Leadership,
Environmental Stewardship, Goal Orientation, Planning
and Preparedness, and Character. (Key study findings
are summarized in Table 2.)
Findings
Eagle Scouts exhibit an increased tendency to participate in a variety of health and recreational activities.
Eagle Scouts are more likely to exercise every day for 30 minutes (see Figure 1). Eagle Scouts are approximately
58 percent more likely than other Scouts to exercise every day for 30 minutes, but are not significantly different from
non-Scouts.
Figure 1. Exercised every day for 30 or more minutes
*The asterisk indicates a statistically significant difference.
100%40% 80%20% 60%0%
Eagle vs. Scout Eagle vs. Non-Scout
58%*
18%
Health and Recreation
5
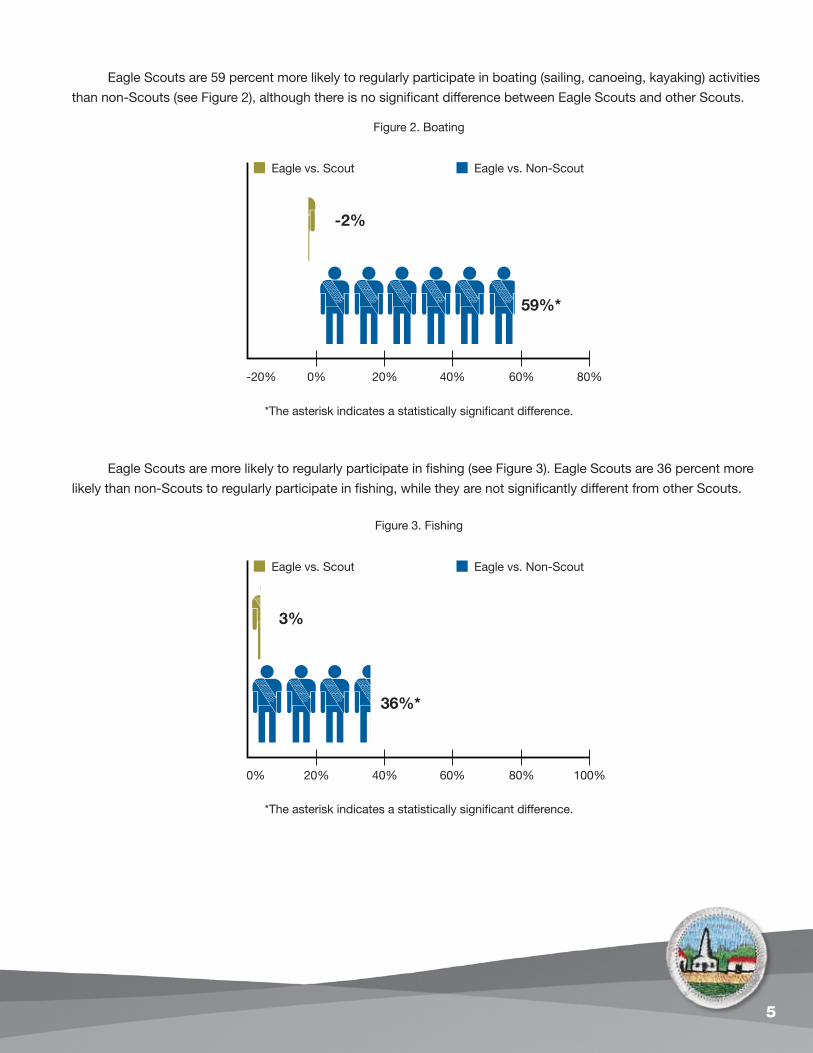
Eagle Scouts are 59 percent more likely to regularly participate in boating (sailing, canoeing, kayaking) activities
than non-Scouts (see Figure 2), although there is no significant difference between Eagle Scouts and other Scouts.
Figure 2. Boating
*The asterisk indicates a statistically significant difference.
80%20% 60%0% 40%-20%
Eagle vs. Scout Eagle vs. Non-Scout
-2%
59%*
Eagle Scouts are more likely to regularly participate in fishing (see Figure 3). Eagle Scouts are 36 percent more
likely than non-Scouts to regularly participate in fishing, while they are not significantly different from other Scouts.
Figure 3. Fishing
*The asterisk indicates a statistically significant difference.
100%40% 80%20% 60%0%
Eagle vs. Scout Eagle vs. Non-Scout
3%
36%*

6
Eagle Scouts are significantly more likely to go camping (see Figure 4). Eagle Scouts are approximately
40 percent more likely than other Scouts to participate in camping. Eagle Scouts are 95 percent more likely than
non-Scouts to report camping.
Figure 4. Camping
*The asterisk indicates a statistically significant difference.
100%40% 80%20% 60%0%
Eagle vs. Scout Eagle vs. Non-Scout
40%*
95%*
Eagle Scouts are more likely to indicate they are satisfied with the amount of leisure and free time they have (see
Figure 5). Eagle Scouts are 51 percent more likely than Scouts to be satisfied with the amount of leisure and free time
they have, while there is no statistically significant difference between Eagle Scouts and non-Scouts.
100%
Figure 5. Satisfied with the amount of leisure and free time
*The asterisk indicates a statistically significant difference.
40% 80%20% 60%0%
Eagle vs. Scout Eagle vs. Non-Scout
51%*
34%

7
Eagle Scouts are more likely to attend plays, concerts, or live theater (see Figure 6). Eagle Scouts are 72 percent
more likely than non-Scouts to attend plays, concerts, or live theater but are not significantly different from other Scouts.
Figure 6. Attending plays, concerts, or live theater
*The asterisk indicates a statistically significant difference.
100%40% 80%20% 60%0%
Eagle vs. Scout Eagle vs. Non-Scout
24%
72%*
Eagle Scouts are more likely to regularly play a musical instrument (see Figure 7). Eagle Scouts are 38 percent more
likely than non-Scouts to play a musical instrument. However, Eagle Scouts and other Scouts are not significantly different.
Figure 7. Playing a musical instrument
*The asterisk indicates a statistically significant difference.
100%40% 80%20% 60%0%
Eagle vs. Scout Eagle vs. Non-Scout
6%
38%*

8
Eagle Scouts are more likely to read books (see Figure 8). Eagle Scouts are 39 percent more likely than non-Scouts
to read books, but are not significantly different from other Scouts.
Figure 8. Reading books
*The asterisk indicates a statistically significant difference.
100%40% 80%20% 60%0%
Eagle vs. Scout Eagle vs. Non-Scout
22%
39%*
Eagle Scouts are more likely to visit a local, state, or national park (see Figure 9). Eagle Scouts are 42 percent more
likely than non-Scouts to visit a local, state, or national park, while they are not significantly different from other Scouts.
Figure 9. Visiting a local, state, or national park
*The asterisk indicates a statistically significant difference.
100%40% 80%20% 60%0%
Eagle vs. Scout Eagle vs. Non-Scout
29%
42%*

9
Eagle Scouts are less likely to report drinking alcohol in the last seven days (see Figure 10). Eagle Scouts are 25
percent less likely than other Scouts to drink alcohol in the last seven days, although they are not significantly different
from non-Scouts.
Figure 10. Drank alcohol in the last seven days
*The asterisk indicates a statistically significant difference.
60%0% 40%-20% 20%-40%
Eagle vs. Scout Eagle vs. Non-Scout
-25%*
-13%
connectionEagle Scouts show a greater connectedness to siblings, neighbors, religious community, friends,
co-workers, formal and informal groups, and a spiritual presence in nature.
Eagle Scouts are significantly more likely to report being very close with siblings (see Figure 11). Eagle Scouts
are 38 percent more likely than non-Scouts to report being very close with their siblings. Eagle Scouts and other
Scouts are not significantly different in their relationships with siblings.
Figure 11. Very close with siblings
*The asterisk indicates a statistically significant difference.
100%40% 80%20% 60%0%
Eagle vs. Scout Eagle vs. Non-Scout
30%
38%*

10
Eagle Scouts are more likely to indicate they are extremely close with neighbors (see Figure 12). Eagle Scouts are
97 percent more likely than Scouts to report being extremely close with neighbors. Eagle Scouts are not significantly
different from non-Scouts.
Figure 12. Extremely close with neighbors
*The asterisk indicates a statistically significant difference.
100%40% 80%20% 60%0%
Eagle vs. Scout Eagle vs. Non-Scout
97%*
39%
Eagle Scouts are more likely to report being extremely close with their religious community (see Figure 13).
Eagle Scouts are 66 percent more likely than Scouts to report being extremely close with their religious community.
Eagle Scouts and non-Scouts are not significantly different.
Figure 13. Extremely close with religious community
*The asterisk indicates a statistically significant difference.
100%40% 80%20% 60%0%
Eagle vs. Scout Eagle vs. Non-Scout
66%*
39%
11
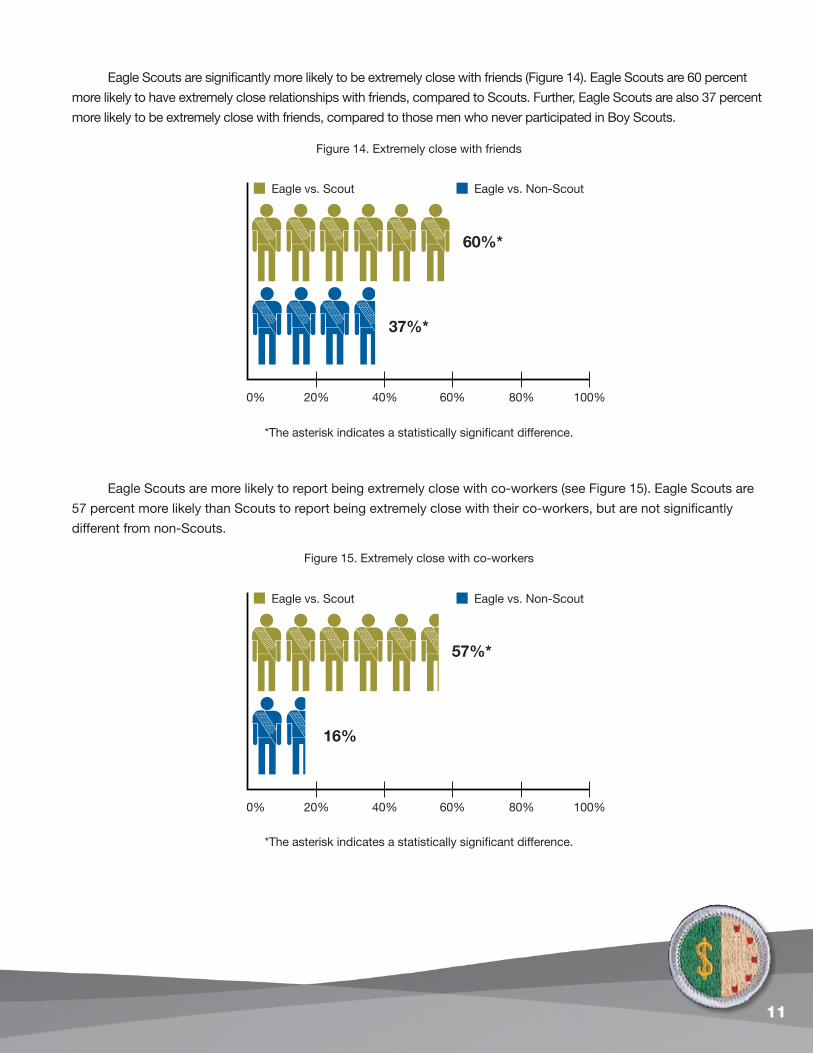
Eagle Scouts are significantly more likely to be extremely close with friends (Figure 14). Eagle Scouts are 60 percent
more likely to have extremely close relationships with friends, compared to Scouts. Further, Eagle Scouts are also 37 percent
more likely to be extremely close with friends, compared to those men who never participated in Boy Scouts.
Figure 14. Extremely close with friends
*The asterisk indicates a statistically significant difference.
100%40% 80%20% 60%0%
Eagle vs. Scout Eagle vs. Non-Scout
60%*
37%*
Eagle Scouts are more likely to report being extremely close with co-workers (see Figure 15). Eagle Scouts are
57 percent more likely than Scouts to report being extremely close with their co-workers, but are not significantly
different from non-Scouts.
Figure 15. Extremely close with co-workers
*The asterisk indicates a statistically significant difference.
100%40% 80%20% 60%0%
Eagle vs. Scout Eagle vs. Non-Scout
57%*
16%
12
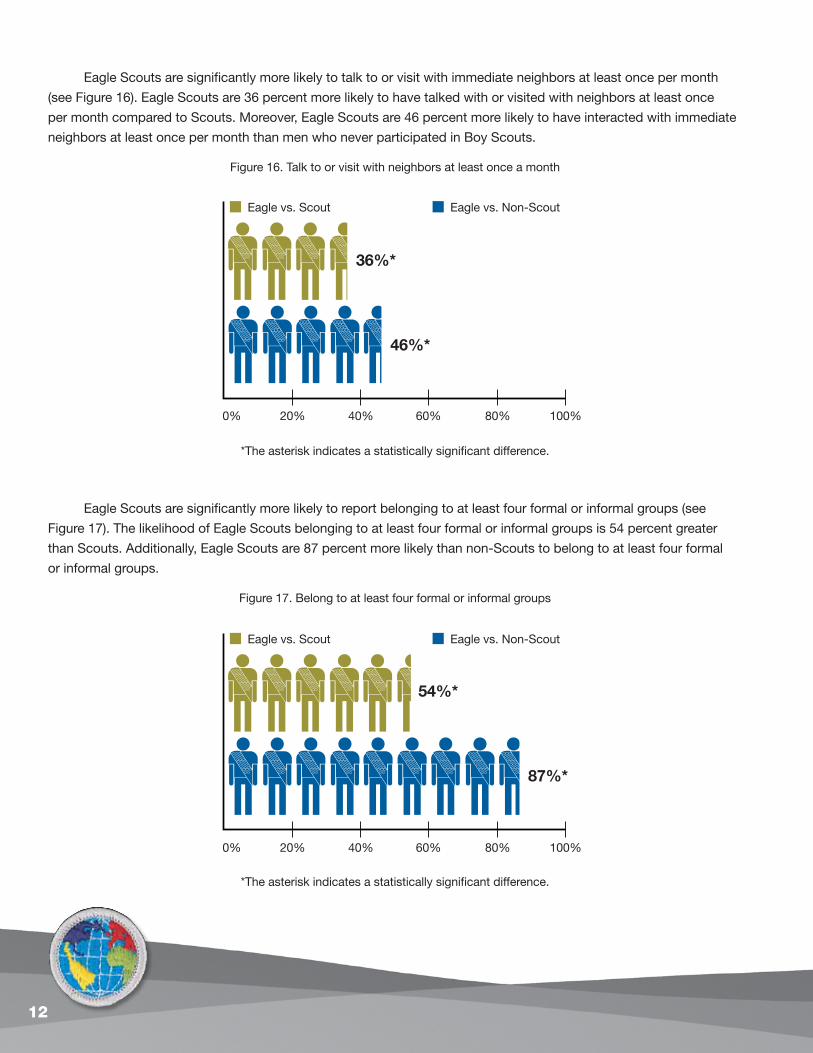
Eagle Scouts are significantly more likely to talk to or visit with immediate neighbors at least once per month
(see Figure 16). Eagle Scouts are 36 percent more likely to have talked with or visited with neighbors at least once
per month compared to Scouts. Moreover, Eagle Scouts are 46 percent more likely to have interacted with immediate
neighbors at least once per month than men who never participated in Boy Scouts.
Figure 16. Talk to or visit with neighbors at least once a month
*The asterisk indicates a statistically significant difference.
100%40% 80%20% 60%0%
Eagle vs. Scout Eagle vs. Non-Scout
36%*
46%*
Eagle Scouts are significantly more likely to report belonging to at least four formal or informal groups (see
Figure 17). The likelihood of Eagle Scouts belonging to at least four formal or informal groups is 54 percent greater
than Scouts. Additionally, Eagle Scouts are 87 percent more likely than non-Scouts to belong to at least four formal
or informal groups.
Figure 17. Belong to at least four formal or informal groups
*The asterisk indicates a statistically significant difference.
100%40% 80%20% 60%0%
Eagle vs. Scout Eagle vs. Non-Scout
54%*
87%*

13
Eagle Scouts are significantly more likely to report they agree they find a spiritual presence in nature (see Figure
18). Specifically, Eagle Scouts are roughly 44 percent more likely than Scouts to agree they find a spiritual presence in
nature. Also, Eagle Scouts are 50 percent more likely than non-Scouts to agree they find a spiritual presence in nature.
Figure 18. Agree that I find a spiritual presence in nature
*The asterisk indicates a statistically significant difference.
100%40% 80%20% 60%0%
Eagle vs. Scout Eagle vs. Non-Scout
44%*
50%*
Service and leadershipDuty to God, service to others, service to the community, and leadership are traits that are especially
strong in Eagle Scouts.
Eagle Scouts are more likely to have donated money to a religious institution in their community within the last
month (see Figure 19). Eagle Scouts are 53 percent more likely than non-Scouts to have donated money to a religious
institution in their community within the last month, but are not significantly different from other Scouts in donating
money to a religious institution.
Figure 19. Donated money to a religious institution
*The asterisk indicates a statistically significant difference.
100%40% 80%20% 60%0%
Eagle vs. Scout Eagle vs. Non-Scout
24%
53%*
14
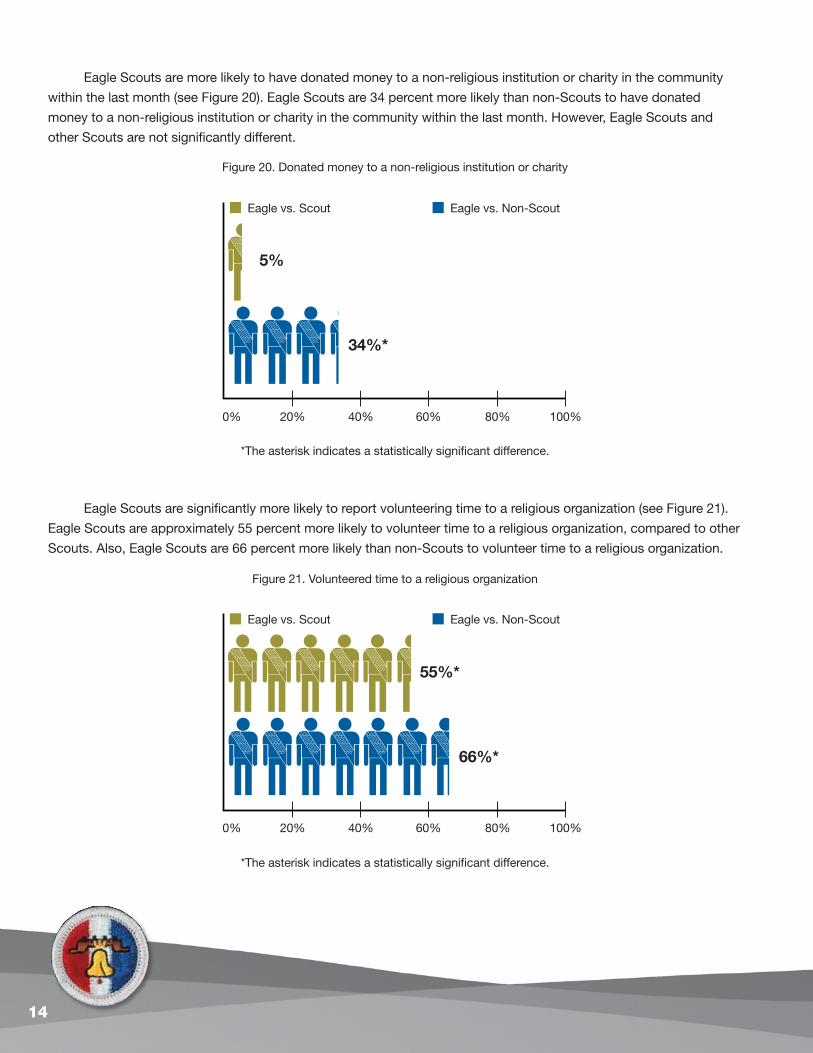
Eagle Scouts are more likely to have donated money to a non-religious institution or charity in the community
within the last month (see Figure 20). Eagle Scouts are 34 percent more likely than non-Scouts to have donated
money to a non-religious institution or charity in the community within the last month. However, Eagle Scouts and
other Scouts are not significantly different.
Figure 20. Donated money to a non-religious institution or charity
*The asterisk indicates a statistically significant difference.
100%40% 80%20% 60%0%
Eagle vs. Scout Eagle vs. Non-Scout
5%
34%*
Eagle Scouts are significantly more likely to report volunteering time to a religious organization (see Figure 21).
Eagle Scouts are approximately 55 percent more likely to volunteer time to a religious organization, compared to other
Scouts. Also, Eagle Scouts are 66 percent more likely than non-Scouts to volunteer time to a religious organization.
100%
Figure 21. Volunteered time to a religious organization
*The asterisk indicates a statistically significant difference.
40% 80%20% 60%0%
Eagle vs. Scout Eagle vs. Non-Scout
55%*
66%*

15
Eagle Scouts are significantly more likely to report volunteering time to a non-religious organization (see Figure 22).
Eagle Scouts are 58 percent more likely than other Scouts to volunteer their time to a non-religious organization. In addition,
Eagle Scouts are 62 percent more likely than non-Scouts to volunteer time to a non-religious organization.
Figure 22. Volunteered time to a non-religious organization
*The asterisk indicates a statistically significant difference.
100%40% 80%20% 60%0%
Eagle vs. Scout Eagle vs. Non-Scout
58%*
62%*
Eagle Scouts are significantly more likely to report they have worked with others in the neighborhood to address
a problem or improve something (see Figure 23). Compared to Scouts, Eagle Scouts are 68 percent more likely to
work with their neighbors to address a problem or improve something. Also, Eagle Scouts are 56 percent more likely
than non-Scouts to work with others in their neighborhood to address a problem or improve something.
Figure 23. Worked to solve community problem
*The asterisk indicates a statistically significant difference.
100%40% 80%20% 60%0%
Eagle vs. Scout Eagle vs. Non-Scout
68%*
56%*

16
Eagle Scouts are more likely to have voted in the last presidential election (see Figure 24). Eagle Scouts are 73 percent
more likely than non-Scouts to have voted in the last presidential election, while they are not different from other Scouts.
Figure 24. Voted in presidential election
*The asterisk indicates a statistically significant difference.
100%40% 80%20% 60%0%
Eagle vs. Scout Eagle vs. Non-Scout
15%
73%*
Eagle Scouts are significantly more likely to report having held leadership positions at their workplace (see
Figure 25). Eagle Scouts are roughly 39 percent more likely than other Scouts and approximately 55 percent more
likely than non-Scouts to have held a leadership position at their workplace.
Figure 25. Held leadership positions at workplace
*The asterisk indicates a statistically significant difference.
100%40% 80%20% 60%0%
Eagle vs. Scout Eagle vs. Non-Scout
39%*
55%*

17
Eagle Scouts are significantly more likely to hold leadership positions in their local community (see Figure 26).
Specifically, compared to Scouts, Eagle Scouts are about 53 percent more likely to have held leadership positions
in the local community. Moreover, Eagle Scouts are around 76 percent more likely than non-Scouts to have held
leadership positions in the local community.
Figure 26. Held leadership positions in local community
*The asterisk indicates a statistically significant difference.
100%40% 80%20% 60%0%
Eagle vs. Scout Eagle vs. Non-Scout
53%*
76%*
Environmental StewardshipEagle Scouts are more likely to engage in behaviors that are designed to enhance and protect the environment.
Eagle Scouts are significantly more likely to be active in a group that works to protect the environment (see
Figure 27). Eagle Scouts are 89 percent more likely than other Scouts and 92 percent more likely than non-Scouts to
be active in a group that works to protect the environment.
Figure 27. Active in a group that works to protect the environment
*The asterisk indicates a statistically significant difference.
100%40% 80%20% 60%0%
Eagle vs. Scout Eagle vs. Non-Scout
89%*
92%*

18
Eagle Scouts are significantly more likely to report they avoid using certain products that harm the environment
(see Figure 28). Compared to Scouts, Eagle Scouts are 38 percent more likely to indicate they avoid using products
that harm the environment. Further, Eagle Scouts are 31 percent more likely than men who have never been Scouts to
say they avoid using products that harm the environment.
Figure 28. Avoided products that harm the environment
*The asterisk indicates a statistically significant difference.
100%40% 80%20% 60%0%
Eagle vs. Scout Eagle vs. Non-Scout
38%*
31%*
Eagle Scouts are more likely to report they tried to use less water in their household (see Figure 29). Eagle Scouts
are 71 percent more likely than Scouts to report trying to use less water in their household, while they are not significantly
different from non-Scouts.
Figure 29. Tried to use less water in your household
*The asterisk indicates a statistically significant difference.
100%40% 80%20% 60%0%
Eagle vs. Scout Eagle vs. Non-Scout
71%*
33%

19
goal orientationEagle Scouts are more likely to be committed to learning, and to set and achieve personal, professional,
spiritual, and financial goals.
Eagle Scouts are significantly more likely to report it is extremely important to learn something new every day
(see Figure 30). Eagle Scouts are 42 percent more likely than other Scouts to feel it is extremely important to learn
something every day. Further, Eagle Scouts are 40 percent more likely to believe it is extremely important to learn
something every day, compared to those men who never participated in Boy Scouts.
Figure 30. Extremely important to learn something new every day
*The asterisk indicates a statistically significant difference.
100%40% 80%20% 60%0%
Eagle vs. Scout Eagle vs. Non-Scout
42%*
40%*
Eagle Scouts are significantly more likely to report they had taken a course or class in the past year (see Figure 31).
Eagle Scouts are 30 percent more likely than Scouts to report taking a course or class in the past year. Eagle Scouts are
80 percent more likely than non-Scouts to report taking a course or class in the past year.
Figure 31. I have taken a course or class in the past year
*The asterisk indicates a statistically significant difference.
100%40% 80%20% 60%0%
Eagle vs. Scout Eagle vs. Non-Scout
30%*
80%*

20
Eagle Scouts are significantly more likely to report a personal goal was achieved in the last year (see Figure 32).
Eagle Scouts are 39 percent more likely than Scouts to report achieving a personal goal in the last year. Eagle Scouts
are also 64 percent more likely than non-Scouts to report they achieved a personal goal in the last year.
Figure 32. Personal goal was achieved in the last year
*The asterisk indicates a statistically significant difference.
100%40% 80%20% 60%0%
Eagle vs. Scout Eagle vs. Non-Scout
39%*
64%*
Eagle Scouts are more likely to report a professional goal was achieved in the last year (see Figure 33). Eagle
Scouts are roughly 29 percent more likely than non-Scouts to report they achieved a professional goal in the last year.
However, Eagle Scouts and other Scouts are not significantly different in terms of achieving a professional goal.
Figure 33. Professional goal was achieved in the last year
*The asterisk indicates a statistically significant difference.
100%40% 80%20% 60%0%
Eagle vs. Scout Eagle vs. Non-Scout
29%
29%*
21
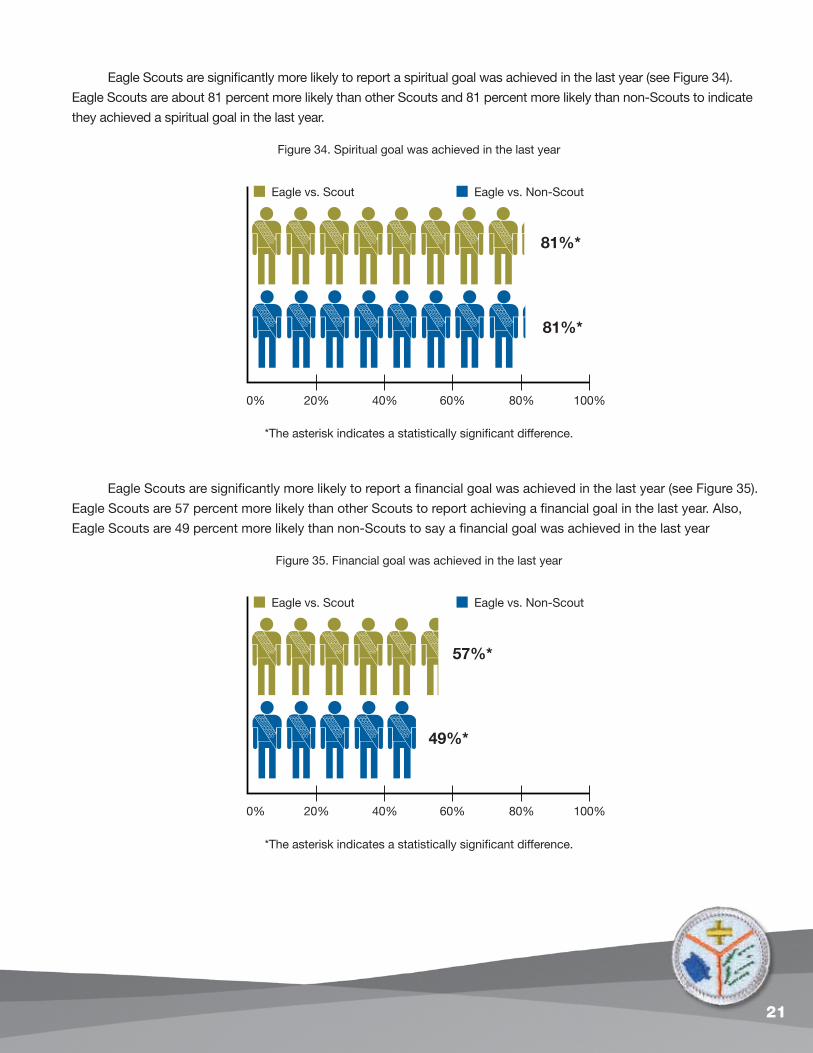
Eagle Scouts are significantly more likely to report a spiritual goal was achieved in the last year (see Figure 34).
Eagle Scouts are about 81 percent more likely than other Scouts and 81 percent more likely than non-Scouts to indicate
they achieved a spiritual goal in the last year.
Figure 34. Spiritual goal was achieved in the last year
*The asterisk indicates a statistically significant difference.
100%40% 80%20% 60%0%
Eagle vs. Scout Eagle vs. Non-Scout
81%*
81%*
Eagle Scouts are significantly more likely to report a financial goal was achieved in the last year (see Figure 35).
Eagle Scouts are 57 percent more likely than other Scouts to report achieving a financial goal in the last year. Also,
Eagle Scouts are 49 percent more likely than non-Scouts to say a financial goal was achieved in the last year
Figure 35. Financial goal was achieved in the last year
*The asterisk indicates a statistically significant difference.
100%40% 80%20% 60%0%
Eagle vs. Scout Eagle vs. Non-Scout
57%*
49%*

22
Planning and PreparednessEagle Scouts show higher levels of planning and preparedness than do Scouts who never attained the
rank of Eagle Scout and men who were never Scouts.
Eagle Scouts are significantly more likely to report a disaster supply kit is kept in their home (see Figure 36).
Eagle Scouts are 94 percent more likely than other Scouts to have a disaster supply kit in their home. Also, Eagle
Scouts are 124 percent more likely than non-Scouts to have a disaster supply kit kept in the home.
Figure 36. A disaster supply kit is kept in home
*The asterisk indicates a statistically significant difference.
140%80% 120%60% 100%0%
Eagle vs. Scout Eagle vs. Non-Scout
94%*
124%*
Eagle Scouts are significantly more likely to report a kit with emergency supplies is kept in their car (see Figure
37). Eagle Scouts are 43 percent more likely than other Scouts to report a kit with emergency supplies is kept in their
car. Moreover, Eagle Scouts are 81 percent more likely than non-Scouts to report a kit with emergency supplies is
kept in their car.
Figure 37. A kit with emergency supplies is kept in the car
*The asterisk indicates a statistically significant difference.
100%40% 80%20% 60%0%
Eagle vs. Scout Eagle vs. Non-Scout
43%*
81%*

23
Eagle Scouts are significantly more likely to report having a specific meeting place for family to reunite for an
emergency (see Figure 38). Eagle Scouts are 94 percent more likely than other Scouts and 100 percent more likely
than non-Scouts to have a specific meeting place for family to reunite in an emergency.
Figure 38. Having a specific meeting place for emergency
*The asterisk indicates a statistically significant difference.
100%40% 80%20% 60%0%
Eagle vs. Scout Eagle vs. Non-Scout
94%*
100%*
Eagle Scouts are significantly more likely to report having CPR certification (see Figure 39). Eagle Scouts are
50 percent more likely than other Scouts to have CPR certification. Also, Eagle Scouts are 90 percent more likely
than non-Scouts to have CPR certification.
Figure 39. CPR certification
*The asterisk indicates a statistically significant difference.
100%40% 80%20% 60%0%
Eagle vs. Scout Eagle vs. Non-Scout
50%*
90%*

24
characterEagle Scouts are more likely than other Scouts and men who were never Scouts to indicate they have
built character traits related to work ethics, morality, tolerance, and respect for diversity.
Eagle Scouts are significantly more likely to report agreeing they always try to exceed people’s expectation (see
Figure 40). Eagle Scouts are 54 percent more likely than other Scouts to agree they always try to exceed expectations.
Additionally, Eagle Scouts are 52 percent more likely than non-Scouts to agree they always try to exceed.
Figure 40. Agree that I always try to exceed people’s expectations
*The asterisk indicates a statistically significant difference.
100%40% 80%20% 60%0%
Eagle vs. Scout Eagle vs. Non-Scout
54%*
52%*
Eagle Scouts are more likely to agree they always do what is right (see Figure 41). Eagle Scouts are
approximately 47 percent more likely than non-Scouts to agree they always do what is right, whereas Eagle and other
Scouts are not significantly different.
Figure 41. Agree that I always do what is right
*The asterisk indicates a statistically significant difference.
100%40% 80%20% 60%0%
Eagle vs. Scout Eagle vs. Non-Scout
26%
47%*

25
Eagle Scouts are more likely to report they agree they work hard to get ahead (see Figure 42). Eagle Scouts
are 88 percent more likely than other Scouts to agree they work hard to get ahead, although they are not significantly
different from non-Scouts.
Figure 42. Agree that I work hard to get ahead
*The asterisk indicates a statistically significant difference.
100%40% 80%20% 60%0%
Eagle vs. Scout Eagle vs. Non-Scout
88%*
40%
Eagle Scouts are significantly more likely to agree they always treat people of other religions with respect (see
Figure 43). Eagle Scouts are 109 percent more likely than other Scouts to agree they always treat people of other
religions with respect. Moreover, Eagle Scouts are 45 percent more likely than non-Scouts to agree they always treat
people of other religions with respect.
Figure 43. I always treat people of other religions with respect
*The asterisk indicates a statistically significant difference.
120%60% 100%40% 80%0%
Eagle vs. Scout Eagle vs. Non-Scout
109%*
45%*

26
Eagle Scouts are more likely to strongly agree that most religions make a positive contribution to society (see
Figure 44). Eagle Scouts are 29 percent more likely than non-Scouts to strongly agree that most religions make a
positive contribution to society, but are not significantly different from other Scouts.
Figure 44. Most religions make a positive contribution to society
*The asterisk indicates a statistically significant difference.
100%40% 80%20% 60%0%
Eagle vs. Scout Eagle vs. Non-Scout
22%
29%*
Eagle Scouts are significantly more likely to state respecting religious leaders outside of their religion is
somewhat important (see Figure 45). Eagle Scouts are 133 percent more likely than other Scouts and 109 percent
more likely than non-Scouts to say respecting religious leaders outside of your religion is at least somewhat important.
Figure 45. To respect religious leaders outside of your religion is somewhat important
*The asterisk indicates a statistically significant difference.
140%80% 120%60% 100%0%
Eagle vs. Scout Eagle vs. Non-Scout
133%*
109%*

27
Eagle Scouts are more likely to say it is important to show respect to the American flag (see Figure 46). Eagle
Scouts are 89 percent more likely than other Scouts to say it is important to show respect to the American flag.
However, Eagle Scouts and non-Scouts are not significantly different in their attitudes toward the American flag.
Figure 46. It is important to show respect to the American flag
*The asterisk indicates a statistically significant difference.
100%40% 80%20% 60%0%
Eagle vs. Scout Eagle vs. Non-Scout
89%*
39%

28
For more than 100 years the Boy Scouts of
America has sought to encourage and instill the values
necessary to help young people make and continue
making ethical and moral choices over the entire course
of their life. The objective of Scouting, therefore, is to
promote the positive and prosocial development of
youth that carries over into adulthood and influences
all of society. This lasting influence—enhancing youth’s
values, ethics, decision making, relationships, and
personal development—is even more significant for
youth who attain the rank of Eagle Scout. The Boy
Scouts of America has always maintained that achieving
Scouting’s highest rank would result in additional
benefits for Eagle Scouts when compared to Scouts that
do not achieve this rank, as well as to youth who have
never participated in Scouting. In order to assess the
influence, if any, of participation in Boy Scouts on men in
later life, adult men representative of the U.S. population
were surveyed, with the key difference being that some
had participated in Scouting and some had not.
Analysis of the nationally representative survey
reveals significant differences between Eagle Scouts
and other Scouts as well as non-Scouts. Eagle Scouts
consistently indicate their experience in Scouting
contributed to positive and prosocial development as
measured by responses to a wide range of issues and
subjects, including the following:
•EagleScoutsexhibitanincreasedtendency
to participate in a variety of health and
recreational activities.
•EagleScoutsshowagreaterconnectednessto
siblings, neighbors, religious community, friends,
co-workers, formal and informal groups, and a
spiritual presence in nature.
•DutytoGod,servicetoothers,servicetothe
community, and leadership are traits that are
especially strong in Eagle Scouts.
•EagleScoutsaremorelikelytoengagein
behaviors that are designed to enhance and
protect the environment.
•EagleScoutsaremorelikelytobecommitted
to setting and achieving personal, professional,
spiritual, and financial goals.
•EagleScoutsshowhigherlevelsofplanning
and preparedness than do other Scouts and
non-Scouts.
•EagleScoutsaremorelikelythanotherScouts
and non-Scouts to indicate they have built
character traits related to work ethics, morality,
tolerance, and respect for diversity.
In sum, when compared to Scouts and non-
Scouts, Eagle Scouts exhibit significantly higher levels
of health and recreation, connection, service and
leadership, environmental stewardship, goal orientation,
planning and preparedness, and character.
Summary

29
Table 1
Table 1. Descriptive Statistics for Demographic Variables
Obsevations Mean S.D. Min Max
Age 2,503 47.439 17.091 18 94
White 2,477 0.739 0.439 0 1
Black 2,477 0.091 0.287 0 1
Hispanic 2,477 0.109 0.312 0 1
Other 2,477 0.061 0.239 0 1
Education 2,504 3.388 1.629 1 6
Income 2,345 5.047 2.378 1 8
Unemployment 2,512 0.066 0.249 0 1
Married 2,512 0.592 0.492 0 1
East 2,512 0.215 0.411 0 1
Midwest 2,512 0.226 0.418 0 1
West 2,512 0.243 0.429 0 1
South 2,512 0.316 0.465 0 1
Religiosity 2,487 2.261 1.718 0 5
tables

30
Table 2Table 2. Main Findings: Odds Ratios and Percentage Changes From the Logistic Regression of Key Items on Scouting Status Variables
Item DescriptionEagle vs. Non-Scout Eagle vs. Scout
OR % N Pseudo R2 OR % N Pseudo R2
Health & Recreation
Exercised everyday for 30 or more minutesa 1.183 18.3 1,360 0.06 1.579* 57.9 1,334 0.03
Boatingb 1.585** 58.5 1,362 0.02 0.978 -2.2 1,334 0.01
Fishingb 1.360* 36.0 1,363 0.05 1.029 2.9 1,336 0.02
Camping 1.946*** 94.6 1,363 0.06 1.404* 40.4 1,336 0.08
Satisfied with the amount of leisure and free timea 1.344 34.4 1,363 0.04 1.512* 51.2 1,333 0.05
Attending plays, concerts, or live theaterb 1.718*** 71.8 1,363 0.06 1.236 23.6 1,334 0.05
Playing a musical instrumentb 1.376+ 37.6 1,362 0.05 1.056 5.6 1,336 0.02
Reading booksb 1.385+ 38.5 1,362 0.08 1.215 21.5 1,336 0.04
Visiting a local, state, or national parkb 1.415* 41.5 1,363 0.03 1.292 29.2 1,336 0.04
Drank alcohol in the last seven daysa 0.868 -13.2 1,359 0.08 0.750+ -25.0 1,334 0.05
Connection
Very close with siblingsb 1.380+ 38.0 1,233 0.02 1.302 30.2 1,215 0.02
Extremely close with neighborsa 1.386 38.6 1,345 0.09 1.966** 96.6 1,319 0.09
Extremely close with religious communitya 1.390 39.0 1,134 0.20 1.662* 66.2 1,124 0.28
Extremely close with friends 1.371* 37.1 1,351 0.04 1.595** 59.5 1,329 0.03
Extremely close with co-workersa 1.163 16.3 1,027 0.06 1.566* 56.6 1,007 0.04
Talk to or visit with immediate neighbors at least once a month
1.462* 46.2 1,363 0.03 1.360+ 36.0 1,334 0.08
Belong to at least 4 formal or informal groups
1.871* 87.1 1,355 0.06 1.544+ 54.4 1,332 0.07
Agree that I find a spiritual presence in nature
1.501* 50.1 1,359 0.07 1.439* 43.9 1,331 0.05

31
Table 2. Main Findings: Odds Ratios and Percentage Changes From the Logistic Regression of Key Items on Scouting Status Variables (Continued)
Item DescriptionEagle vs. Non-Scout Eagle vs. Scout
OR % N Pseudo R2 OR % N Pseudo R2
Service & Leadership
Donated money to a religious institutionb 1.531* 53.1 1,363 0.39 1.244 24.4 1,335 0.32
Donated money to a non-religious institution or charityb 1.337+ 33.7 1,361 0.11 1.052 5.2 1,335 0.09
Volunteered time to a religious organization
1.657* 65.7 1,363 0.32 1.548* 54.8 1,336 0.30
Volunteered time to a non-religious organization
1.622** 62.2 1,361 0.05 1.581** 58.1 1,336 0.06
Worked to solve community problem 1.560** 56.0 1,363 0.03 1.675*** 67.5 1,334 0.04
Voted in presidential electionb 1.728* 72.8 1,359 0.23 1.147 14.7 1,333 0.16
Held leadership positions at workplace
1.549* 54.9 1,361 0.12 1.389+ 38.9 1,334 0.10
Held leadership positions in local community
1.759*** 75.9 1,363 0.06 1.529** 52.9 1,334 0.07
Environmental Stewardship
Been active in a group that works to protect the environment
1.916*** 91.6 1,362 0.03 1.894*** 89.4 1,334 0.04
Avoided using certain products that harm the environment
1.313+ 31.3 1,359 0.04 1.382* 38.2 1,333 0.03
Tried to use less water in your householda 1.328 32.8 1,361 0.04 1.705** 70.5 1,334 0.02
Goal Orientation
It is extremely important to learn something new every day
1.398* 39.8 1,362 0.03 1.416* 41.6 1,336 0.02
I have taken a course or class in the past year
1.800*** 80.0 1,361 0.18 1.301+ 30.1 1,335 0.13
Personal goal was achieved in the last year
1.638** 63.8 1,352 0.05 1.391* 39.1 1,319 0.06
Professional goal was achieved in the last yearb 1.289+ 28.9 1,347 0.10 1.285 28.5 1,319 0.12
Spiritual goal was achieved in the last year
1.811*** 81.1 1,359 0.16 1.809*** 80.9 1,324 0.16
Financial goal was achieved in the last year
1.491** 49.1 1,357 0.03 1.568** 56.8 1,328 0.03
Table 2

32
Table 2. Main Findings: Odds Ratios and Percentage Changes From the Logistic Regression of Key Items on Scouting Status Variables (Continued)
Item DescriptionEagle vs. Non-Scout Eagle vs. Scout
OR % N Pseudo R2 OR % N Pseudo R2
Planning & Preparedness
A disaster supply kit is kept in home
2.237*** 123.7 1,360 0.05 1.935*** 93.5 1,334 0.04
A kit with emergency supplies is kept in car
1.813*** 81.3 1,360 0.03 1.428* 42.8 1,335 0.03
Having a specific meeting place for family to reunite for emergency
1.997*** 99.7 1,359 0.03 1.937*** 93.7 1,324 0.03
CPR certification 1.897*** 89.7 1,357 0.04 1.496** 49.6 1,333 0.03
Character
Agree that I always try to exceed people’s expectations of me
1.516* 51.6 1,362 0.04 1.542* 54.2 1,333 0.05
Agree that I always do what is rightb 1.469* 46.9 1,361 0.04 1.261 26.1 1,335 0.03
Agree that I work hard to get aheada 1.402 40.2 1,352 0.08 1.882* 88.2 1,326 0.05
Strongly agree that I always treat people of other religion with respect
1.453* 45.3 1,362 0.03 2.088*** 108.8 1,333 0.04
Strongly agree that most religions make a positive contribution to societyb
1.290+ 29.0 1,358 0.05 1.220 22.0 1,334 0.05
To respect religious leaders outside of your religion is somewhat important
2.090* 109.0 1,350 0.04 2.327* 132.7 1,328 0.12
It is important to show respect to the American flaga 1.389 38.9 1,362 0.11 1.891* 89.1 1,334 0.11
Note: OR = Odds Ratio; % = Percentage Change in Odds Ratio.Analyses are weighted to adjust for sampling design. Analyses include demographic controls such as age, race, education, income, employment, marital status, region, and religiosity. aStatistically significant for Eagle vs. Scout, but not Eagle vs. Non-Scout. bStatistically significant for Eagle vs. Non-Scout, but not Eagle vs. Scout.† p < .10, * p < .05, ** p < .01, *** p < .001 (two-tailed tests).
Table 2

33
Study DesignIn order to test a series of hypotheses or
assumptions about the prosocial effects of participating
in the BSA, a national survey was conducted in
partnership with the Gallup Organization. The first step
in this process was to identify a representative sample of
Boy Scouts from the adult male population in the United
States. To identify Boy Scouts, two screening questions
were added to the Gallup Daily tracking poll which
conducts telephone interviews with 1,000 American
adults each day, 350 days per year. This nightly poll
uses dual-frame random-digit-dialing sampling (which
includes cellular as well as landline telephone sampling
to reach those in cellphone-only households) and a
multi-call design (up to three callbacks). Once contact
was made, an adult member of the household who
most recently had a birthday was interviewed regarding
various political, economic, and well-being topics. If
necessary, Spanish-language interviews are conducted.
The data are weighted daily by the number of adults in
the household, number of phone lines in the household,
and the respondent’s reliance on cellphones to adjust
for any disproportion in selection probabilities, and
then weighted to compensate for nonrandom non-
response, using targets from the U.S. Census Bureau
for age, gender, education, race, and region. The
resulting sample represents an estimated 95 percent
of all U.S. households.
The screening questions were run from April 20
to October 4, 2010, and generated a random sample of
81,409 male adults (aged 18 or older) living in the U.S.
The first screening question simply asked whether a
respondent had ever been a member of the Boy Scouts
of America, and if the response was yes, the second
screening question asked if the respondent achieved the
rank of Eagle Scout. Results from the screening items
were used to identify a large pool of individuals willing to
be re-contacted with our target survey.
the SampleThe present dataset represents the largest ever
conducted from a nationally representative sample
of American adult males who participated in the Boy
Scouts and those who were never a Scout. Respondents
were randomly chosen from those who agreed to be
re-contacted during the screening period. Specifically,
this research is based on data collected from a random
sample of 2,512 adult males interviewed over the phone,
between October 12 and November 20, 2010. The total
sample consists of 134 Eagle Scouts (5.3%), 853 non-
Eagle Scouts (33.9%), and 1,502 non-Scout respondents
(59.8%)7 plus 23 missing cases (1%).8
Two “dummy” variables, Eagle and non-Eagle
Scouts, indicate whether a respondent not only
participated in Boy Scouting but also achieved the
highest rank before age 18.9 A respondent’s age at the
time of survey was calculated by using his birthday
and survey date, whereas three race/ethnicity dummy
variables (black/African American, Hispanic, and other)
compare the effect of being a racial/ethnic minority on
the outcome measures with that of being white. Three
measures of social class were employed: education
(1 = Less than high school graduate, 2 = High school
graduate, . . ., 5 = College graduate, 6 = Postgraduate
work/degree); annual household income in 2009,
before taxes (1 = Under $15,000, 2 = $15,000 to less
than $25,000, . . ., 7 = $75,000 to less than $100,000,
8 = $100,000 or over); and employment status (1 =
unemployed, 0 = employed, a student, retired, and
other). Dummy variables of marital status and region
appendix a

34
measure whether the respondent was married or
not (i.e., single/never married, separated, divorced,
widowed, or living with unmarried partner) and where
they lived (East, Midwest, South, and West) at the time
of the survey. Finally, a control for frequency of religious
service attendance was designed (5 = more than once
a week, 4 = once a week, 3 = once a month, 2 = major
religious holidays, 1 = other, 0 = atheist/agnostic/non-
religious), given that many Scout troops are sponsored
by religious organizations. Controlling for these factors
gives a clearer indicator of whether participation in
Scouting has an independent effect on developmental
outcomes in adulthood.
As Table 1 shows, respondents were, on average,
47 years old (47.439); and 73.9 percent white, 9.1
percent black/African American, 10.9 percent Hispanic,
and 6.1 percent other race. Their average education
(3.388) was between some college (= 3) and trade/
technical/vocational training (= 4), whereas average
income (5.047) fell between $45,000 and $55,000. Less
than 7 percent (6.6%) of respondents were unemployed,
and almost 60 percent (59.2%) were married. Also, 21.5
percent of respondents lived in the East, 22.6 percent in
the Midwest, 24.3 percent in the West, and 31.6 percent
in the South. The table also shows that average religious
service attendance (2.26) fell between “Major religious
holidays” and “Once a month.”
the Survey ItemsThe survey was designed to cover a number
of areas that, broadly defined, would elicit responses
related to character, values, ethics, morality, citizenship,
responsibility, healthy living, and prosocial behavior. In
essence, the survey attempted to tap the virtues, habits,
and attitudes the Boy Scouts of America seeks to instill
in the youth who participate in Scouting.
The survey included many categories and subjects
that were grouped within three main topics: Well-Being
(e.g., with survey questions dedicated to recreational
activities, emotional well-being, relational well-being,
and physical well-being), Civic Engagement (e.g., with
survey items focusing on membership in formal and
informal groups, community donations, community
volunteering, community problem-solving, environmental
stewardship, political participation, and civic leadership),
and Character Development (e.g., survey statements
asking about commitment to learning, goal orientation,
planning/preparedness, self-efficacy, activities with
neighbors, accountability, moral attitudes, openness to
diversity, civic attitudes, and spirituality). A complete
copy of the actual survey is included at the end of this
report in Appendix D.
Data analysis and ReportingA series of logistic regression analyses was
conducted to see whether the three groups of
survey respondents—Eagle Scout, non-Eagle Scout
(henceforth, Scout), and non-Scout—differ in their
responses to the items listed above. If a survey item has
more than two response options, the responses were
first dichotomized since logistic regression applies to a
variable that has only two response options (e.g., yes vs.
no); and then analyzed for all possible dichotomization.10
Next, controls for demographic variables mentioned
above were applied in order to determine whether
participation in Scouting has an independent effect
on the variables of interest. The regression analyses
yielded many important findings, even after controlling
for demographic variables. However, for the purpose
of this particular publication, those findings specifically
targeting Eagle Scouts were highlighted.11 For ease in
statistical interpretation of the data, odds ratios and
percentage changes are reported in order to distinguish
between Eagle Scouts, Scouts, and non-Scouts (see
Appendix B and C).
35
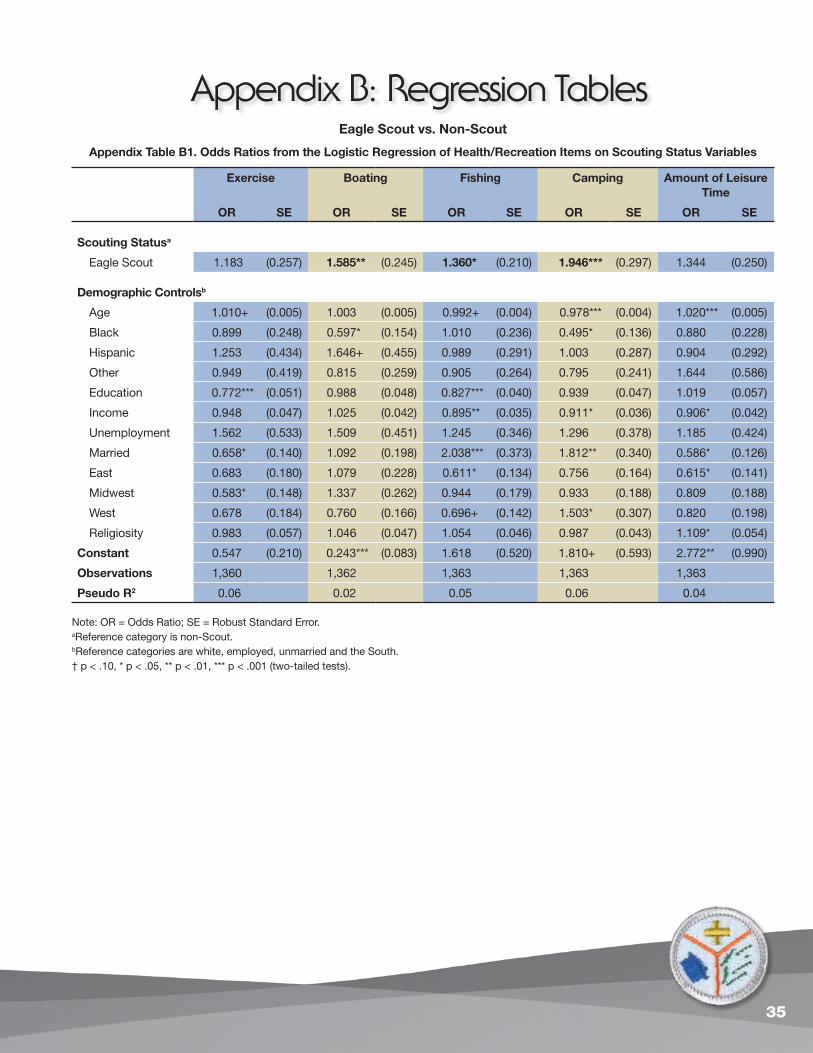
appendix B: Regression tablesEagle Scout vs. Non-Scout
Appendix Table B1. Odds Ratios from the Logistic Regression of Health/Recreation Items on Scouting Status Variables
Exercise Boating Fishing Camping Amount of Leisure Time
OR SE OR SE OR SE OR SE OR SE
Scouting Statusa
Eagle Scout 1.183 (0.257) 1.585** (0.245) 1.360* (0.210) 1.946*** (0.297) 1.344 (0.250)
Demographic Controlsb
Age 1.010+ (0.005) 1.003 (0.005) 0.992+ (0.004) 0.978*** (0.004) 1.020*** (0.005)
Black 0.899 (0.248) 0.597* (0.154) 1.010 (0.236) 0.495* (0.136) 0.880 (0.228)
Hispanic 1.253 (0.434) 1.646+ (0.455) 0.989 (0.291) 1.003 (0.287) 0.904 (0.292)
Other 0.949 (0.419) 0.815 (0.259) 0.905 (0.264) 0.795 (0.241) 1.644 (0.586)
Education 0.772*** (0.051) 0.988 (0.048) 0.827*** (0.040) 0.939 (0.047) 1.019 (0.057)
Income 0.948 (0.047) 1.025 (0.042) 0.895** (0.035) 0.911* (0.036) 0.906* (0.042)
Unemployment 1.562 (0.533) 1.509 (0.451) 1.245 (0.346) 1.296 (0.378) 1.185 (0.424)
Married 0.658* (0.140) 1.092 (0.198) 2.038*** (0.373) 1.812** (0.340) 0.586* (0.126)
East 0.683 (0.180) 1.079 (0.228) 0.611* (0.134) 0.756 (0.164) 0.615* (0.141)
Midwest 0.583* (0.148) 1.337 (0.262) 0.944 (0.179) 0.933 (0.188) 0.809 (0.188)
West 0.678 (0.184) 0.760 (0.166) 0.696+ (0.142) 1.503* (0.307) 0.820 (0.198)
Religiosity 0.983 (0.057) 1.046 (0.047) 1.054 (0.046) 0.987 (0.043) 1.109* (0.054)
Constant 0.547 (0.210) 0.243*** (0.083) 1.618 (0.520) 1.810+ (0.593) 2.772** (0.990)
Observations 1,360 1,362 1,363 1,363 1,363
Pseudo R2 0.06 0.02 0.05 0.06 0.04
Note: OR = Odds Ratio; SE = Robust Standard Error.aReference category is non-Scout.bReference categories are white, employed, unmarried and the South.† p < .10, * p < .05, ** p < .01, *** p < .001 (two-tailed tests).

36
Appendix Table B1. Odds Ratios from the Logistic Regression of Health/Recreation Items on Scouting Status Variables (cont.)
Attending Concerts
Playing a Musical Instrument
Reading Books Visiting a Park Drink
OR SE OR SE OR SE OR SE OR SE
Scouting Statusa
Eagle Scout 1.718*** (0.259) 1.376+ (0.258) 1.385+ (0.272) 1.415* (0.217) 0.868 (0.136)
Demographic Controlsb
Age 0.990* (0.004) 0.985** (0.005) 1.000 (0.005) 0.993 (0.004) 0.990* (0.004)
Black 1.667* (0.379) 0.921 (0.264) 1.467 (0.393) 1.193 (0.258) 1.146 (0.272)
Hispanic 1.793* (0.496) 1.234 (0.401) 3.013** (1.136) 0.957 (0.258) 0.884 (0.230)
Other 0.734 (0.236) 1.625 (0.552) 1.439 (0.559) 1.036 (0.306) 0.699 (0.217)
Education 1.256*** (0.059) 1.221*** (0.072) 1.491*** (0.080) 1.165*** (0.052) 1.304*** (0.059)
Income 1.059 (0.041) 0.915+ (0.045) 0.990 (0.038) 0.965 (0.035) 1.114** (0.040)
Unemployment 1.076 (0.320) 0.951 (0.333) 0.723 (0.213) 0.899 (0.249) 0.797 (0.254)
Married 0.611** (0.104) 0.538** (0.107) 0.967 (0.185) 1.650** (0.274) 0.906 (0.147)
East 1.303 (0.268) 1.143 (0.291) 1.249 (0.282) 0.871 (0.167) 1.329 (0.264)
Midwest 1.503* (0.287) 1.073 (0.264) 1.406 (0.308) 0.901 (0.166) 1.299 (0.249)
West 1.552* (0.323) 1.060 (0.257) 1.183 (0.264) 1.206 (0.241) 1.335 (0.254)
Religiosity 1.037 (0.045) 1.051 (0.056) 1.079 (0.052) 0.992 (0.042) 0.817*** (0.033)
Constant 0.214*** (0.069) 0.331** (0.125) 0.586 (0.194) 1.002 (0.300) 0.416** (0.130)
Observations 1,363 1,362 1,362 1,363 1,359
Pseudo R2 0.06 0.05 0.08 0.03 0.08
Note: OR = Odds Ratio; SE = Robust Standard Error.aReference category is non-Scout.bReference categories are white, employed, unmarried and the South.† p < .10, * p < .05, ** p < .01, *** p < .001 (two-tailed tests).

37
Appendix Table B2. Odds Ratios from the Logistic Regression of Connection Items on Scouting Status Variables
Very Close with Siblings
Extremely Close with Neighbors
Extremely Close with Religious
Community
Extremely Close with Friends
OR SE OR SE OR SE OR SE
Scouting Statusa
Eagle Scout 1.380+ (0.228) 1.386 (0.330) 1.390 (0.280) 1.371* (0.203)
Demographic Controlsb
Age 0.999 (0.005) 1.028*** (0.006) 1.018*** (0.005) 1.001 (0.004)
Black 1.197 (0.282) 1.190 (0.359) 1.189 (0.313) 1.068 (0.230)
Hispanic 1.220 (0.371) 0.551 (0.265) 0.726 (0.277) 0.754 (0.206)
Other 1.522 (0.512) 1.817 (0.861) 0.272* (0.165) 0.989 (0.292)
Education 0.974 (0.049) 0.834** (0.059) 0.882+ (0.057) 0.954 (0.042)
Income 0.970 (0.037) 0.860** (0.050) 0.825*** (0.044) 0.904** (0.031)
Unemployment 0.944 (0.307) 0.645 (0.308) 0.699 (0.282) 1.031 (0.284)
Married 0.921 (0.160) 1.052 (0.258) 1.303 (0.331) 0.672* (0.111)
East 1.111 (0.243) 0.717 (0.198) 0.603* (0.155) 0.835 (0.164)
Midwest 0.919 (0.184) 0.661 (0.198) 0.573* (0.146) 0.882 (0.163)
West 0.746 (0.157) 0.630 (0.187) 0.696 (0.195) 0.817 (0.160)
Religiosity 1.175*** (0.054) 1.044 (0.060) 1.951*** (0.167) 1.202*** (0.050)
Constant 1.904* (0.612) 0.118*** (0.056) 0.078*** (0.038) 1.071 (0.318)
Observations 1,233 1,345 1,134 1,351
Pseudo R2 0.02 0.09 0.20 0.04
Note: OR = Odds Ratio; SE = Robust Standard Error. aReference category is non-Scout.bReference categories are white, employed, unmarried and the South.† p < .10, * p < .05, ** p < .01, *** p < .001 (two-tailed tests).

38
Appendix Table B2. Odds Ratios from the Logistic Regression of Connection Items on Scouting Status Variables (cont.)
Extremely Close with Coworkers
Talk to Neighbors Once a Month
Belong to at Least 4 Groups
Spiritual Presence in Nature
OR SE OR SE OR SE OR SE
Scouting Statusa
Eagle Scout 1.163 (0.249) 1.462* (0.253) 1.871* (0.471) 1.501* (0.245)
Demographic Controlsb
Age 1.023*** (0.006) 1.016*** (0.005) 0.996 (0.008) 1.027*** (0.005)
Black 1.411 (0.395) 1.175 (0.297) 1.400 (0.456) 1.512+ (0.372)
Hispanic 0.589 (0.227) 0.946 (0.273) 0.482 (0.295) 1.062 (0.311)
Other 0.991 (0.420) 1.503 (0.497) 0.303+ (0.186) 1.163 (0.354)
Education 0.849** (0.054) 0.897* (0.046) 1.219* (0.116) 1.050 (0.051)
Income 0.944 (0.045) 0.982 (0.040) 1.089 (0.088) 0.947 (0.034)
Unemployment 0.556 (0.260) 0.898 (0.275) 0.484 (0.321) 1.113 (0.341)
Married 0.815 (0.193) 1.335 (0.246) 0.688 (0.200) 1.098 (0.192)
East 0.922 (0.242) 0.982 (0.217) 0.802 (0.273) 0.994 (0.210)
Midwest 0.865 (0.213) 1.128 (0.244) 1.272 (0.391) 0.850 (0.169)
West 0.924 (0.239) 0.858 (0.183) 1.159 (0.391) 0.867 (0.179)
Religiosity 1.192** (0.070) 1.071 (0.053) 1.219** (0.091) 1.219*** (0.056)
Constant 0.190*** (0.077) 1.561 (0.530) 0.020*** (0.012) 0.380** (0.121)
Observations 1,027 1,363 1,355 1,359
Pseudo R2 0.06 0.03 0.06 0.07
Note: OR = Odds Ratio; SE = Robust Standard Error. aReference category is non-Scout.bReference categories are white, employed, unmarried and the South.† p < .10, * p < .05, ** p < .01, *** p < .001 (two-tailed tests).

39
Appendix Table B3. Odds Ratios from the Logistic Regression of Service/Leadership Items on Scouting Status Variables
Religious Donation
Secular Donation Religious Volunteering
Secular Volunteering
OR SE OR SE OR SE OR SE
Scouting Statusa
Eagle Scout 1.531* (0.332) 1.337+ (0.214) 1.657* (0.329) 1.622** (0.245)
Demographic Controlsb
Age 1.035*** (0.006) 1.018*** (0.004) 1.007 (0.005) 0.993 (0.004)
Black 1.061 (0.315) 1.205 (0.275) 1.492 (0.412) 0.955 (0.208)
Hispanic 1.423 (0.537) 1.431 (0.416) 0.701 (0.249) 0.738 (0.203)
Other 1.011 (0.362) 2.294* (0.889) 0.811 (0.323) 1.445 (0.422)
Education 1.117* (0.061) 1.180*** (0.056) 1.087 (0.066) 1.191*** (0.054)
Income 1.040 (0.050) 1.153*** (0.043) 0.980 (0.046) 1.028 (0.037)
Unemployment 0.702 (0.251) 0.434** (0.132) 0.454* (0.180) 0.571+ (0.166)
Married 1.568* (0.342) 1.490* (0.258) 1.137 (0.245) 1.303 (0.216)
East 1.028 (0.244) 1.247 (0.253) 0.515** (0.123) 0.994 (0.190)
Midwest 0.929 (0.219) 1.498* (0.296) 0.656+ (0.151) 1.016 (0.186)
West 0.932 (0.250) 1.257 (0.263) 0.632+ (0.158) 1.117 (0.220)
Religiosity 2.685*** (0.172) 0.992 (0.043) 2.518*** (0.189) 1.140** (0.047)
Constant 0.007*** (0.004) 0.112*** (0.037) 0.028*** (0.012) 0.262*** (0.082)
Observations 1,363 1,361 1,363 1,361
Pseudo R2 0.39 0.11 0.32 0.05
Note: OR = Odds Ratio; SE = Robust Standard Error.aReference category is non-Scout.bReference categories are white, employed, unmarried and the South.† p < .10, * p < .05, ** p < .01, *** p < .001 (two-tailed tests).

40
Appendix Table B3. Odds Ratios from the Logistic Regression of Service/Leadership Items on Scouting Status Variables (cont.)
Community Problem-Solving
Voting for Presidential
Election
Leadership at Workplace
Leadership in Community
OR SE OR SE OR SE OR SE
Scouting Statusa
Eagle Scout 1.560** (0.233) 1.728* (0.458) 1.549* (0.301) 1.759*** (0.285)
Demographic Controlsb
Age 1.008+ (0.004) 1.043*** (0.006) 1.014** (0.005) 1.013** (0.005)
Black 1.609* (0.347) 1.954+ (0.708) 0.986 (0.231) 0.987 (0.220)
Hispanic 0.677 (0.186) 1.059 (0.416) 0.637 (0.177) 0.852 (0.261)
Other 1.422 (0.413) 0.530 (0.215) 0.638 (0.222) 0.795 (0.279)
Education 1.042 (0.046) 1.598*** (0.116) 1.205*** (0.065) 1.134* (0.055)
Income 0.980 (0.035) 1.224*** (0.059) 1.136** (0.044) 0.969 (0.037)
Unemployment 0.544* (0.154) 0.901 (0.282) 0.505* (0.144) 0.651 (0.211)
Married 1.192 (0.192) 1.334 (0.303) 1.816*** (0.324) 1.709** (0.291)
East 1.023 (0.195) 1.122 (0.324) 0.563** (0.122) 1.244 (0.255)
Midwest 0.982 (0.179) 1.031 (0.271) 0.733 (0.155) 1.167 (0.228)
West 1.230 (0.235) 0.868 (0.241) 0.760 (0.171) 0.995 (0.213)
Religiosity 1.110** (0.045) 1.086 (0.064) 0.993 (0.045) 1.158*** (0.051)
Constant 0.457** (0.138) 0.042*** (0.019) 0.361** (0.121) 0.076*** (0.029)
Observations 1,363 1,359 1,361 1,363
Pseudo R2 0.03 0.23 0.12 0.06
Note: OR = Odds Ratio; SE = Robust Standard Error. aReference category is non-Scout.bReference categories are white, employed, unmarried and the South.† p < .10, * p < .05, ** p < .01, *** p < .001 (two-tailed tests).

41
Appendix Table B4. Odds Ratios from the Logistic Regression of Environmental Stewardship Items on Scouting Status Variables
Environmental Group
Avoid Products that Harm
Environment
Try to Use Less Water
OR SE OR SE OR SE
Scouting Statusa
Eagle Scout 1.916*** (0.311) 1.313+ (0.215) 1.328 (0.231)
Demographic Controlsb
Age 1.001 (0.005) 1.013** (0.004) 1.007 (0.005)
Black 1.749* (0.424) 1.033 (0.229) 1.575+ (0.434)
Hispanic 0.912 (0.314) 0.766 (0.209) 1.494 (0.501)
Other 1.404 (0.434) 1.805+ (0.599) 1.452 (0.464)
Education 1.062 (0.057) 1.219*** (0.057) 1.079 (0.054)
Income 1.075+ (0.045) 1.026 (0.038) 0.901** (0.036)
Unemployment 0.470 (0.219) 0.741 (0.196) 1.205 (0.390)
Married 0.810 (0.139) 0.965 (0.166) 1.219 (0.222)
East 0.935 (0.209) 0.914 (0.184) 0.983 (0.217)
Midwest 0.835 (0.177) 0.768 (0.146) 0.598* (0.120)
West 1.018 (0.231) 1.011 (0.205) 1.611* (0.388)
Religiosity 1.018 (0.050) 0.975 (0.042) 0.964 (0.047)
Constant 0.148*** (0.056) 0.484* (0.150) 2.647** (0.911)
Observations 1,362 1,359 1,361
Pseudo R2 0.03 0.04 0.04
Note: OR = Odds Ratio; SE = Robust Standard Error. aReference category is non-Scout.bReference categories are white, employed, unmarried and the South.† p < .10, * p < .05, ** p < .01, *** p < .001 (two-tailed tests).

42
Appendix Table B5. Odds Ratios from the Logistic Regression of Goal Orientation Items on Scouting Status Variables
Commitment to Learning
Have Taken a Course
Personal Goal
OR SE OR SE OR SE
Scouting Statusa
Eagle Scout 1.398* (0.198) 1.800*** (0.298) 1.638** (0.256)
Demographic Controlsb
Age 1.012** (0.004) 0.947*** (0.005) 0.984*** (0.004)
Black 1.983** (0.436) 1.058 (0.263) 1.250 (0.272)
Hispanic 1.449 (0.393) 1.753* (0.464) 0.888 (0.236)
Other 1.353 (0.369) 0.860 (0.274) 0.974 (0.294)
Education 0.978 (0.043) 1.397*** (0.070) 1.183*** (0.054)
Income 0.924* (0.033) 1.039 (0.038) 1.005 (0.037)
Unemployment 1.065 (0.299) 0.539+ (0.180) 0.677 (0.189)
Married 0.952 (0.154) 1.154 (0.204) 0.818 (0.136)
East 0.997 (0.190) 1.046 (0.220) 1.281 (0.249)
Midwest 0.993 (0.182) 0.852 (0.167) 1.052 (0.200)
West 1.120 (0.215) 1.210 (0.252) 1.169 (0.230)
Religiosity 0.983 (0.040) 1.167*** (0.053) 1.222*** (0.051)
Constant 0.955 (0.283) 1.309 (0.392) 0.947 (0.283)
Observations 1,362 1,361 1,352
Pseudo R2 0.03 0.18 0.05
Note: OR = Odds Ratio; SE = Robust Standard Error. aReference category is non-Scout.bReference categories are white, employed, unmarried and the South.† p < .10, * p < .05, ** p < .01, *** p < .001 (two-tailed tests).

43
Appendix Table B5. Odds Ratios from the Logistic Regression of Goal Orientation Items on Scouting Status Variables (cont.)
Professional Goal Spiritual Goal Financial Goal
OR SE OR SE OR SE
Scouting Statusa
Eagle Scout 1.289+ (0.195) 1.811*** (0.300) 1.491** (0.219)
Demographic Controlsb
Age 0.968*** (0.004) 1.007 (0.005) 1.000 (0.004)
Black 1.263 (0.288) 1.292 (0.304) 1.809** (0.383)
Hispanic 0.832 (0.244) 1.062 (0.365) 0.865 (0.241)
Other 1.086 (0.319) 0.932 (0.351) 1.296 (0.361)
Education 1.131** (0.053) 0.944 (0.051) 1.014 (0.046)
Income 1.156*** (0.043) 0.927+ (0.041) 1.087* (0.040)
Unemployment 0.358** (0.128) 0.705 (0.236) 0.563+ (0.187)
Married 1.038 (0.187) 0.950 (0.177) 0.942 (0.156)
East 0.848 (0.169) 0.918 (0.222) 1.324 (0.253)
Midwest 1.065 (0.197) 0.837 (0.171) 0.992 (0.184)
West 0.953 (0.199) 1.103 (0.255) 1.483* (0.294)
Religiosity 1.125** (0.051) 1.782*** (0.096) 1.093* (0.046)
Constant 0.712 (0.217) 0.132*** (0.048) 0.261*** (0.082)
Observations 1,347 1,359 1,357
Pseudo R2 0.10 0.16 0.03
Note: OR = Odds Ratio; SE = Robust Standard Error. aReference category is non-Scout.bReference categories are white, employed, unmarried and the South.† p < .10, * p < .05, ** p < .01, *** p < .001 (two-tailed tests).
44
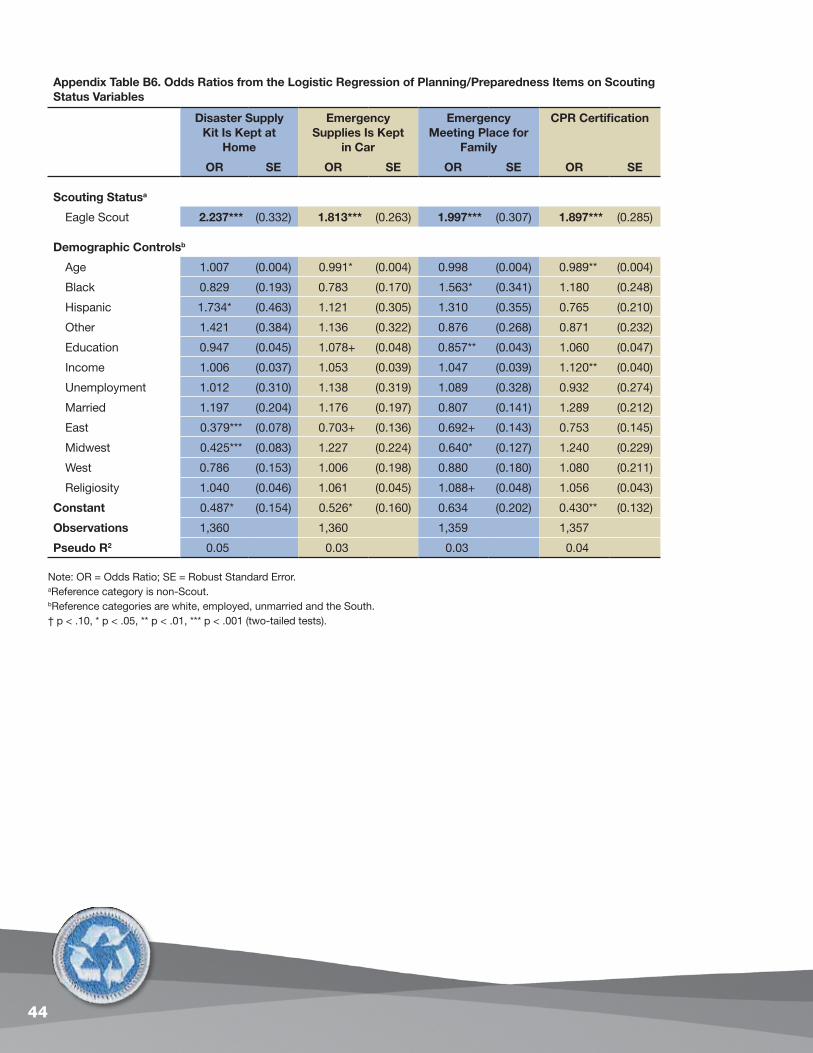
Appendix Table B6. Odds Ratios from the Logistic Regression of Planning/Preparedness Items on Scouting Status Variables
Disaster Supply Kit Is Kept at
Home
Emergency Supplies Is Kept
in Car
Emergency Meeting Place for
Family
CPR Certification
OR SE OR SE OR SE OR SE
Scouting Statusa
Eagle Scout 2.237*** (0.332) 1.813*** (0.263) 1.997*** (0.307) 1.897*** (0.285)
Demographic Controlsb
Age 1.007 (0.004) 0.991* (0.004) 0.998 (0.004) 0.989** (0.004)
Black 0.829 (0.193) 0.783 (0.170) 1.563* (0.341) 1.180 (0.248)
Hispanic 1.734* (0.463) 1.121 (0.305) 1.310 (0.355) 0.765 (0.210)
Other 1.421 (0.384) 1.136 (0.322) 0.876 (0.268) 0.871 (0.232)
Education 0.947 (0.045) 1.078+ (0.048) 0.857** (0.043) 1.060 (0.047)
Income 1.006 (0.037) 1.053 (0.039) 1.047 (0.039) 1.120** (0.040)
Unemployment 1.012 (0.310) 1.138 (0.319) 1.089 (0.328) 0.932 (0.274)
Married 1.197 (0.204) 1.176 (0.197) 0.807 (0.141) 1.289 (0.212)
East 0.379*** (0.078) 0.703+ (0.136) 0.692+ (0.143) 0.753 (0.145)
Midwest 0.425*** (0.083) 1.227 (0.224) 0.640* (0.127) 1.240 (0.229)
West 0.786 (0.153) 1.006 (0.198) 0.880 (0.180) 1.080 (0.211)
Religiosity 1.040 (0.046) 1.061 (0.045) 1.088+ (0.048) 1.056 (0.043)
Constant 0.487* (0.154) 0.526* (0.160) 0.634 (0.202) 0.430** (0.132)
Observations 1,360 1,360 1,359 1,357
Pseudo R2 0.05 0.03 0.03 0.04
Note: OR = Odds Ratio; SE = Robust Standard Error. aReference category is non-Scout.bReference categories are white, employed, unmarried and the South.† p < .10, * p < .05, ** p < .01, *** p < .001 (two-tailed tests).

45
Appendix Table B7. Odds Ratios from the Logistic Regression of Character Items on Scouting Status Variables
Exceed People's Expectations
I Always Do What Is Right
Work Hard to Get Ahead
Respect People of Other Religion
OR SE OR SE OR SE OR SE
Scouting Statusa
Eagle Scout 1.516* (0.284) 1.469* (0.279) 1.402 (0.362) 1.453* (0.255)
Demographic Controlsb
Age 0.980*** (0.005) 1.007 (0.005) 0.990 (0.007) 1.015** (0.005)
Black 0.838 (0.204) 0.787 (0.184) 1.282 (0.431) 1.340 (0.348)
Hispanic 0.516* (0.145) 1.019 (0.303) 1.542 (0.807) 1.509 (0.468)
Other 0.927 (0.298) 1.720 (0.701) 1.385 (0.665) 1.476 (0.509)
Education 0.951 (0.050) 1.112* (0.058) 0.800** (0.056) 0.938 (0.051)
Income 1.116** (0.046) 1.041 (0.043) 1.187** (0.072) 0.990 (0.041)
Unemployment 0.853 (0.261) 1.071 (0.335) 0.568 (0.221) 1.393 (0.507)
Married 1.329 (0.243) 1.589* (0.308) 1.993** (0.469) 0.778 (0.149)
East 1.174 (0.273) 0.861 (0.194) 1.557 (0.527) 1.393 (0.310)
Midwest 1.024 (0.222) 1.023 (0.225) 1.935* (0.604) 1.224 (0.260)
West 0.897 (0.200) 0.809 (0.181) 1.278 (0.353) 0.803 (0.167)
Religiosity 1.025 (0.050) 1.108* (0.054) 1.169* (0.086) 1.111* (0.051)
Constant 5.237*** (1.837) 0.844 (0.298) 5.083** (2.528) 1.542 (0.514)
Observations 1,362 1,361 1,352 1,362
Pseudo R2 0.04 0.04 0.08 0.03
Note: OR = Odds Ratio; SE = Robust Standard Error. aReference category is non-Scout.bReference categories are white, employed, unmarried and the South.† p < .10, * p < .05, ** p < .01, *** p < .001 (two-tailed tests).

46
Appendix Table B7. Odds Ratios from the Logistic Regression of Character Items on Scouting Status Variables (cont.)
Most Religion Positive
Contribution
Respect Leaders of Other Faith
Show Respect to American Flag
OR SE OR SE OR SE
Scouting Statusa
Eagle Scout 1.290+ (0.199) 2.090* (0.730) 1.389 (0.361)
Demographic Controlsb
Age 1.016*** (0.004) 1.005 (0.010) 1.021* (0.009)
Black 1.485+ (0.323) 1.255 (0.701) 0.586 (0.203)
Hispanic 1.138 (0.325) 0.999 (0.538) 1.419 (0.735)
Other 1.043 (0.315) 1.723 (1.219) 1.410 (0.731)
Education 1.009 (0.048) 1.004 (0.111) 0.679*** (0.056)
Income 0.927* (0.035) 0.921 (0.064) 1.099+ (0.061)
Unemployment 0.960 (0.272) 0.627 (0.341) 0.725 (0.297)
Married 0.993 (0.168) 0.905 (0.359) 1.204 (0.329)
East 0.898 (0.181) 0.985 (0.422) 0.703 (0.261)
Midwest 0.921 (0.173) 0.824 (0.340) 0.558+ (0.189)
West 0.821 (0.167) 0.733 (0.303) 0.532* (0.162)
Religiosity 1.238*** (0.053) 1.351** (0.153) 1.371*** (0.113)
Constant 0.245*** (0.077) 15.375*** (9.799) 8.007*** (4.585)
Observations 1,358 1,350 1,362
Pseudo R2 0.05 0.04 0.11
Note: OR = Odds Ratio; SE = Robust Standard Error. aReference category is non-Scout.bReference categories are white, employed, unmarried and the South.† p < .10, * p < .05, ** p < .01, *** p < .001 (two-tailed tests).

47
appendix c: Regression tablesEagle Scout vs. Scout
Appendix Table C1. Odds Ratios from the Logistic Regression of Health/Recreation Items on Scouting Status Variables
Exercise Boating Fishing Camping Amount of Leisure Time
OR SE OR SE OR SE OR SE OR SE
Scouting Statusa
Eagle Scout 1.579* (0.345) 0.978 (0.146) 1.029 (0.154) 1.404* (0.220) 1.512* (0.286)
Demographic Controlsb
Age 1.014* (0.006) 1.001 (0.004) 0.997 (0.004) 0.967*** (0.004) 1.031*** (0.005)
Black 0.695 (0.223) 0.745 (0.144) 1.043 (0.199) 0.334*** (0.084) 0.752 (0.170)
Hispanic 1.214 (0.510) 0.889 (0.240) 0.953 (0.254) 1.044 (0.276) 0.455** (0.124)
Other 1.286 (0.582) 0.856 (0.262) 1.165 (0.342) 0.571+ (0.177) 0.641 (0.224)
Education 0.951 (0.073) 0.985 (0.046) 0.855*** (0.040) 0.927 (0.046) 0.964 (0.051)
Income 0.966 (0.056) 1.086* (0.039) 1.033 (0.037) 1.070+ (0.039) 1.014 (0.043)
Unemployment 1.079 (0.520) 1.312 (0.399) 1.377 (0.414) 1.112 (0.324) 1.847 (0.810)
Married 0.553* (0.130) 0.813 (0.132) 1.087 (0.181) 1.082 (0.181) 0.734 (0.150)
East 1.302 (0.389) 0.789 (0.156) 0.589** (0.121) 0.983 (0.206) 0.805 (0.174)
Midwest 1.836* (0.481) 0.956 (0.177) 1.032 (0.191) 1.100 (0.219) 0.983 (0.217)
West 1.112 (0.309) 0.935 (0.167) 1.012 (0.183) 1.881*** (0.340) 1.136 (0.241)
Religiosity 1.009 (0.065) 1.068 (0.044) 1.094* (0.045) 1.115* (0.047) 1.054 (0.053)
Constant 0.100*** (0.047) 0.390** (0.119) 0.846 (0.248) 1.790+ (0.552) 0.936 (0.327)
Observations 1,334 1,334 1,336 1,336 1,333
Pseudo R2 0.03 0.01 0.02 0.08 0.05
Note: OR = Odds Ratio; SE = Robust Standard Error. aReference category is Scout.bReference categories are white, employed, unmarried and the South.† p < .10, * p < .05, ** p < .01, *** p < .001 (two-tailed tests).

48
Appendix Table C1. Odds Ratios from the Logistic Regression of Health/Recreation Items on Scouting Status Variables (cont.)
Attending Concerts
Playing a Musical Instrument
Reading Books Visiting a Park Drink
OR SE OR SE OR SE OR SE OR SE
Scouting Statusa
Eagle Scout 1.236 (0.184) 1.056 (0.190) 1.215 (0.233) 1.292 (0.202) 0.750+ (0.112)
Demographic Controlsb
Age 0.995 (0.004) 0.982*** (0.005) 1.007 (0.005) 0.992+ (0.004) 0.990* (0.004)
Black 1.575* (0.298) 1.179 (0.284) 1.014 (0.245) 0.569** (0.106) 0.835 (0.162)
Hispanic 1.244 (0.327) 1.328 (0.390) 1.050 (0.327) 1.497 (0.434) 0.778 (0.201)
Other 0.999 (0.291) 2.091* (0.687) 1.244 (0.523) 1.301 (0.399) 0.770 (0.236)
Education 1.168*** (0.054) 1.080 (0.061) 1.302*** (0.076) 1.012 (0.046) 1.090+ (0.050)
Income 1.207*** (0.043) 0.947 (0.041) 1.016 (0.044) 1.142*** (0.041) 1.190*** (0.043)
Unemployment 1.431 (0.451) 0.899 (0.312) 1.514 (0.646) 1.529 (0.457) 1.358 (0.397)
Married 0.579*** (0.093) 1.047 (0.192) 0.806 (0.164) 0.965 (0.154) 0.805 (0.128)
East 0.938 (0.179) 1.040 (0.239) 1.010 (0.246) 0.770 (0.149) 0.874 (0.167)
Midwest 0.967 (0.178) 0.820 (0.193) 0.868 (0.193) 0.827 (0.154) 0.811 (0.150)
West 1.052 (0.189) 1.072 (0.231) 1.135 (0.257) 1.171 (0.212) 0.995 (0.179)
Religiosity 1.022 (0.042) 0.977 (0.049) 1.132* (0.057) 1.131** (0.047) 0.871*** (0.036)
Constant 0.214*** (0.068) 0.549+ (0.197) 0.817 (0.284) 0.933 (0.284) 0.817 (0.244)
Observations 1,334 1,336 1,336 1,336 1,334
Pseudo R2 0.05 0.02 0.04 0.04 0.05
Note: OR = Odds Ratio; SE = Robust Standard Error. aReference category is Scout.bReference categories are white, employed, unmarried and the South.† p < .10, * p < .05, ** p < .01, *** p < .001 (two-tailed tests).

49
Appendix Table C2. Odds Ratios from the Logistic Regression of Connection Items on Scouting Status Variables
Very Close with Siblings
Extremely Close with Neighbors
Extremely Close with Religious
Community
Extremely Close with Friends
OR SE OR SE OR SE OR SE
Scouting Statusa
Eagle Scout 1.302 (0.214) 1.966** (0.483) 1.662* (0.366) 1.595** (0.233)
Demographic Controlsb
Age 1.002 (0.005) 1.028*** (0.007) 1.026*** (0.007) 1.004 (0.004)
Black 1.089 (0.230) 1.602+ (0.445) 1.464 (0.369) 0.915 (0.177)
Hispanic 1.460 (0.436) 1.187 (0.509) 1.165 (0.503) 1.009 (0.278)
Other 1.109 (0.360) 0.645 (0.435) 0.805 (0.393) 0.883 (0.262)
Education 1.030 (0.051) 0.849+ (0.072) 0.885+ (0.062) 0.914+ (0.044)
Income 1.006 (0.039) 0.865* (0.058) 0.881* (0.049) 1.028 (0.037)
Unemployment 0.767 (0.243) 0.546 (0.284) 0.170*** (0.089) 0.886 (0.280)
Married 0.628** (0.112) 0.923 (0.237) 1.137 (0.277) 0.492*** (0.079)
East 1.054 (0.226) 0.773 (0.262) 0.663 (0.180) 0.682* (0.132)
Midwest 0.771 (0.156) 0.864 (0.271) 0.370*** (0.103) 0.712+ (0.135)
West 0.906 (0.177) 0.697 (0.223) 0.998 (0.269) 0.807 (0.147)
Religiosity 1.179*** (0.054) 1.158+ (0.088) 2.590*** (0.259) 1.132** (0.048)
Constant 1.517 (0.503) 0.059*** (0.035) 0.012*** (0.007) 0.754 (0.235)
Observations 1,215 1,319 1,124 1,329
Pseudo R2 0.02 0.09 0.28 0.03
Note: OR = Odds Ratio; SE = Robust Standard Error. aReference category is Scout.bReference categories are white, employed, unmarried and the South.† p < .10, * p < .05, ** p < .01, *** p < .001 (two-tailed tests).

50
Appendix Table C2. Odds Ratios from the Logistic Regression of Connection Items on Scouting Status Variables (cont.)
Extremely Close with Coworkers
Talk to Neighbors Once a Month
Belong to at Least 4 Groups
Spiritual Presence in Nature
OR SE OR SE OR SE OR SE
Scouting Statusa
Eagle Scout 1.566* (0.334) 1.360+ (0.247) 1.544+ (0.354) 1.439* (0.229)
Demographic Controlsb
Age 1.021** (0.008) 1.020*** (0.005) 1.010 (0.007) 1.021*** (0.005)
Black 0.969 (0.276) 1.588+ (0.399) 1.223 (0.355) 1.391 (0.303)
Hispanic 1.385 (0.492) 1.709 (0.577) 2.180* (0.763) 1.054 (0.297)
Other 0.744 (0.321) 0.756 (0.257) 1.446 (0.617) 0.783 (0.260)
Education 0.821** (0.058) 0.954 (0.052) 1.175* (0.080) 0.952 (0.047)
Income 0.974 (0.051) 0.990 (0.041) 1.260*** (0.080) 0.934+ (0.034)
Unemployment 0.301* (0.180) 0.362** (0.112) 0.433 (0.328) 0.698 (0.227)
Married 0.825 (0.197) 1.971*** (0.372) 0.694 (0.155) 0.849 (0.144)
East 0.660 (0.193) 0.737 (0.165) 0.900 (0.254) 0.705+ (0.140)
Midwest 0.868 (0.226) 1.389 (0.311) 0.971 (0.288) 1.000 (0.195)
West 0.816 (0.217) 1.095 (0.241) 0.738 (0.206) 1.178 (0.227)
Religiosity 1.028 (0.061) 1.122* (0.057) 1.180* (0.078) 1.220*** (0.057)
Constant 0.235** (0.113) 0.837 (0.289) 0.007*** (0.005) 0.954 (0.310)
Observations 1,007 1,334 1,332 1,331
Pseudo R2 0.04 0.08 0.07 0.05
Note: OR = Odds Ratio; SE = Robust Standard Error. aReference category is Scout.bReference categories are white, employed, unmarried and the South.† p < .10, * p < .05, ** p < .01, *** p < .001 (two-tailed tests).

51
Appendix Table C3. Odds Ratios from the Logistic Regression of Service/Leadership Items on Scouting Status Variables
Religious Donation Secular Donation Religious Volunteering
Secular Volunteering
OR SE OR SE OR SE OR SE
Scouting Statusa
Eagle Scout 1.244 (0.245) 1.052 (0.171) 1.548* (0.303) 1.581** (0.244)
Demographic Controlsb
Age 1.025*** (0.006) 1.020*** (0.005) 1.000 (0.005) 0.999 (0.004)
Black 1.468 (0.415) 1.258 (0.271) 1.229 (0.286) 0.748 (0.146)
Hispanic 1.801+ (0.557) 2.031* (0.623) 1.343 (0.444) 0.999 (0.246)
Other 1.295 (0.504) 0.863 (0.299) 0.772 (0.312) 0.990 (0.290)
Education 0.980 (0.056) 1.147** (0.057) 1.150* (0.066) 1.258*** (0.056)
Income 1.110* (0.049) 1.229*** (0.045) 0.931 (0.042) 1.118** (0.039)
Unemployment 0.667 (0.242) 0.740 (0.216) 0.677 (0.259) 1.123 (0.350)
Married 1.300 (0.259) 1.115 (0.192) 1.570* (0.322) 0.906 (0.146)
East 0.832 (0.206) 1.216 (0.273) 0.777 (0.176) 0.901 (0.171)
Midwest 0.857 (0.194) 0.995 (0.198) 0.698 (0.154) 0.964 (0.178)
West 0.770 (0.169) 0.847 (0.165) 0.931 (0.215) 0.978 (0.174)
Religiosity 2.472*** (0.143) 1.057 (0.047) 2.465*** (0.164) 1.130** (0.046)
Constant 0.024*** (0.010) 0.136*** (0.045) 0.029*** (0.012) 0.151*** (0.047)
Observations 1,335 1,335 1,336 1,336
Pseudo R2 0.32 0.09 0.30 0.06
Note: OR = Odds Ratio; SE = Robust Standard Error. aReference category is Scout.bReference categories are white, employed, unmarried and the South.† p < .10, * p < .05, ** p < .01, *** p < .001 (two-tailed tests).

52
Appendix Table C3. Odds Ratios from the Logistic Regression of Service/Leadership Items on Scouting Status Variables (cont.)
Community Problem-Solving
Voting in Presidential
Election
Leadership at Workplace
Leadership in Community
OR SE OR SE OR SE OR SE
Scouting Statusa
Eagle Scout 1.675*** (0.249) 1.147 (0.284) 1.389+ (0.277) 1.529** (0.247)
Demographic Controlsb
Age 1.002 (0.004) 1.026*** (0.007) 1.014** (0.005) 1.017*** (0.005)
Black 1.779** (0.350) 1.488 (0.517) 1.375 (0.343) 1.181 (0.231)
Hispanic 0.914 (0.237) 1.646 (0.841) 0.782 (0.245) 0.750 (0.210)
Other 1.010 (0.294) 3.151* (1.657) 1.538 (0.515) 0.868 (0.278)
Education 1.068 (0.048) 1.346*** (0.094) 1.216*** (0.066) 1.079 (0.051)
Income 1.114** (0.039) 1.080 (0.054) 1.233*** (0.050) 1.241*** (0.050)
Unemployment 1.083 (0.334) 0.696 (0.271) 0.562+ (0.184) 0.723 (0.245)
Married 1.355+ (0.214) 2.217** (0.561) 1.150 (0.214) 0.944 (0.154)
East 0.926 (0.179) 0.929 (0.277) 0.459*** (0.103) 0.745 (0.146)
Midwest 1.054 (0.192) 0.922 (0.255) 0.938 (0.214) 0.704+ (0.138)
West 1.047 (0.187) 1.070 (0.319) 0.780 (0.166) 0.913 (0.174)
Religiosity 1.099* (0.045) 1.291*** (0.084) 1.047 (0.050) 1.121** (0.047)
Constant 0.261*** (0.080) 0.182*** (0.083) 0.262*** (0.089) 0.045*** (0.017)
Observations 1,334 1,333 1,334 1,334
Pseudo R2 0.04 0.16 0.10 0.07
Note: OR = Odds Ratio; SE = Robust Standard Error. aReference category is Scout.bReference categories are white, employed, unmarried and the South.† p < .10, * p < .05, ** p < .01, *** p < .001 (two-tailed tests).

53
Appendix Table C4. Odds Ratios from the Logistic Regression of Environmental Stewardship Items on Scouting Status Variables
Environmental Group
Avoid Products that Harm Environment
Try to Use Less Water
OR SE OR SE OR SE
Scouting Statusa
Eagle Scout 1.894*** (0.312) 1.382* (0.220) 1.705** (0.288)
Demographic Controlsb
Age 1.004 (0.004) 1.012** (0.004) 1.005 (0.005)
Black 1.077 (0.239) 1.290 (0.258) 1.508+ (0.342)
Hispanic 1.761* (0.486) 2.005* (0.632) 1.580 (0.518)
Other 1.555 (0.476) 0.823 (0.252) 1.058 (0.353)
Education 1.088 (0.057) 1.186*** (0.057) 1.101+ (0.054)
Income 1.156*** (0.048) 1.015 (0.037) 0.945 (0.036)
Unemployment 1.056 (0.393) 1.405 (0.469) 1.213 (0.411)
Married 0.965 (0.168) 0.905 (0.154) 1.154 (0.198)
East 0.830 (0.177) 1.067 (0.213) 0.927 (0.194)
Midwest 1.155 (0.241) 1.276 (0.244) 0.778 (0.154)
West 1.023 (0.202) 1.376+ (0.256) 1.330 (0.271)
Religiosity 0.958 (0.044) 0.955 (0.040) 0.962 (0.044)
Constant 0.078*** (0.027) 0.483* (0.151) 1.691 (0.551)
Observations 1,334 1,333 1,334
Pseudo R2 0.04 0.03 0.02
Note: OR = Odds Ratio; SE = Robust Standard Error. aReference category is Scout.bReference categories are white, employed, unmarried and the South.† p < .10, * p < .05, ** p < .01, *** p < .001 (two-tailed tests).

54
Appendix Table C5. Odds Ratios from the Logistic Regression of Goal Orientation Items on Scouting Status Variables
Commitment to Learning
Have Taken a Course
Personal Goal
OR SE OR SE OR SE
Scouting Statusa
Eagle Scout 1.416* (0.202) 1.301+ (0.199) 1.391* (0.226)
Demographic Controlsb
Age 0.996 (0.004) 0.959*** (0.004) 0.981*** (0.004)
Black 2.181*** (0.416) 1.334 (0.266) 1.025 (0.202)
Hispanic 1.802* (0.453) 1.505 (0.437) 1.249 (0.368)
Other 1.280 (0.377) 1.183 (0.374) 0.828 (0.248)
Education 0.986 (0.044) 1.360*** (0.066) 1.127* (0.053)
Income 0.939+ (0.032) 1.081* (0.038) 1.133*** (0.042)
Unemployment 0.932 (0.283) 0.801 (0.241) 0.352*** (0.101)
Married 0.966 (0.152) 0.839 (0.142) 0.938 (0.159)
East 0.880 (0.163) 0.885 (0.184) 0.617* (0.120)
Midwest 1.154 (0.211) 0.888 (0.167) 0.991 (0.189)
West 0.898 (0.156) 0.784 (0.146) 1.156 (0.219)
Religiosity 1.024 (0.041) 1.216*** (0.052) 1.117* (0.048)
Constant 1.679+ (0.500) 1.064 (0.320) 1.163 (0.360)
Observations 1,336 1,335 1,319
Pseudo R2 0.02 0.13 0.06
Note: OR = Odds Ratio; SE = Robust Standard Error. aReference category is Scout.bReference categories are white, employed, unmarried and the South.† p < .10, * p < .05, ** p < .01, *** p < .001 (two-tailed tests).

55
Appendix Table C5. Odds Ratios from the Logistic Regression of Goal Orientation Items on Scouting Status Variables (cont.)
Professional Goal Spiritual Goal Financial Goal
OR SE OR SE OR SE
Scouting Statusa
Eagle Scout 1.285 (0.204) 1.809*** (0.293) 1.568** (0.232)
Demographic Controlsb
Age 0.962*** (0.004) 1.013** (0.005) 0.998 (0.004)
Black 0.870 (0.174) 1.438+ (0.309) 1.155 (0.218)
Hispanic 1.565 (0.442) 1.582 (0.477) 1.270 (0.343)
Other 0.582 (0.206) 1.169 (0.381) 1.234 (0.367)
Education 1.163** (0.058) 1.073 (0.058) 1.061 (0.048)
Income 1.235*** (0.046) 0.856*** (0.036) 1.133*** (0.041)
Unemployment 0.369** (0.133) 0.626 (0.266) 0.500+ (0.178)
Married 1.140 (0.203) 1.076 (0.195) 0.797 (0.129)
East 0.928 (0.190) 0.866 (0.188) 0.807 (0.154)
Midwest 1.022 (0.208) 0.669+ (0.144) 1.117 (0.205)
West 0.971 (0.180) 0.974 (0.192) 0.854 (0.153)
Religiosity 1.056 (0.045) 1.713*** (0.085) 1.005 (0.041)
Constant 0.694 (0.216) 0.101*** (0.037) 0.334*** (0.102)
Observations 1,319 1,324 1,328
Pseudo R2 0.12 0.16 0.03
Note: OR = Odds Ratio; SE = Robust Standard Error. aReference category is Scout.bReference categories are white, employed, unmarried and the South.† p < .10, * p < .05, ** p < .01, *** p < .001 (two-tailed tests).

56
Appendix Table C6. Odds Ratios from the Logistic Regression of Planning/Preparedness Items on Scouting Status Variables
Disaster Supply Kit Is Kept
at Home
Emergency Supplies Are Kept in Car
Emergency Meeting Place
for Family
CPR Certification
OR SE OR SE OR SE OR SE
Scouting Statusa
Eagle Scout 1.935*** (0.281) 1.428* (0.208) 1.937*** (0.290) 1.496** (0.213)
Demographic Controlsb
Age 1.001 (0.004) 0.990* (0.004) 0.994 (0.004) 0.984*** (0.004)
Black 0.963 (0.188) 0.639* (0.120) 1.702** (0.323) 1.055 (0.194)
Hispanic 1.890* (0.484) 1.333 (0.336) 1.561+ (0.411) 1.140 (0.284)
Other 1.378 (0.392) 1.643+ (0.477) 1.262 (0.378) 2.496** (0.734)
Education 1.009 (0.047) 1.052 (0.047) 0.987 (0.047) 0.994 (0.045)
Income 1.006 (0.037) 1.087* (0.037) 0.998 (0.038) 1.047 (0.037)
Unemployment 0.696 (0.221) 0.989 (0.289) 1.352 (0.434) 1.135 (0.341)
Married 1.328+ (0.223) 1.009 (0.161) 1.355+ (0.232) 1.389* (0.221)
East 0.670* (0.134) 1.400+ (0.265) 0.805 (0.162) 0.893 (0.168)
Midwest 0.977 (0.189) 1.307 (0.238) 0.794 (0.160) 0.994 (0.182)
West 1.461* (0.259) 1.283 (0.226) 0.928 (0.176) 0.906 (0.158)
Religiosity 1.111* (0.047) 1.131** (0.045) 1.098* (0.048) 1.104* (0.044)
Constant 0.293*** (0.090) 0.484* (0.145) 0.369** (0.117) 1.033 (0.305)
Observations 1,334 1,335 1,324 1,333
Pseudo R2 0.04 0.03 0.03 0.03
Note: OR = Odds Ratio; SE = Robust Standard Error. aReference category is Scout.bReference categories are white, employed, unmarried and the South.† p < .10, * p < .05, ** p < .01, *** p < .001 (two-tailed tests).

57
Appendix Table C7. Odds Ratios from the Logistic Regression of Character Items on Scouting Status Variables
Exceed People's Expectations
I Always Do What Is Right
Work Hard to Get Ahead
Respect People of Other Religion
OR SE OR SE OR SE OR SE
Scouting Statusa
Eagle Scout 1.542* (0.297) 1.261 (0.238) 1.882* (0.477) 2.088*** (0.359)
Demographic Controlsb
Age 0.985** (0.005) 1.000 (0.005) 0.984* (0.006) 1.004 (0.004)
Black 0.765 (0.162) 0.623* (0.133) 1.599 (0.524) 3.795*** (0.975)
Hispanic 0.786 (0.232) 1.378 (0.442) 3.216* (1.644) 1.444 (0.407)
Other 0.659 (0.215) 1.897 (0.755) 0.514+ (0.180) 1.079 (0.355)
Education 1.087 (0.059) 1.076 (0.059) 0.893+ (0.061) 1.014 (0.049)
Income 1.083+ (0.048) 0.986 (0.043) 1.099+ (0.060) 0.915* (0.035)
Unemployment 0.468* (0.150) 0.635 (0.205) 0.826 (0.336) 1.133 (0.392)
Married 1.323 (0.254) 1.605* (0.311) 1.752* (0.413) 1.434* (0.252)
East 0.916 (0.218) 1.180 (0.276) 0.934 (0.266) 1.347 (0.282)
Midwest 0.821 (0.183) 1.328 (0.305) 1.127 (0.320) 1.024 (0.203)
West 0.572** (0.122) 0.821 (0.175) 0.658 (0.173) 1.021 (0.196)
Religiosity 1.058 (0.053) 1.061 (0.051) 1.028 (0.066) 1.068 (0.047)
Constant 3.536*** (1.351) 2.053+ (0.784) 9.774*** (4.711) 1.394 (0.448)
Observations 1,333 1,335 1,326 1,333
Pseudo R2 0.05 0.03 0.05 0.04
Note: OR = Odds Ratio; SE = Robust Standard Error. aReference category is Scout.bReference categories are white, employed, unmarried and the South.† p < .10, * p < .05, ** p < .01, *** p < .001 (two-tailed tests).

58
Appendix Table C7. Odds Ratios from the Logistic Regression of Character Items on Scouting Status Variables (cont.)
Most Religion Positive
Contribution
Respect Leaders of Other Faith
Show Respect to American Flag
OR SE OR SE OR SE
Scouting Statusa
Eagle Scout 1.220 (0.182) 2.327* (0.866) 1.891* (0.485)
Demographic Controlsb
Age 1.016*** (0.004) 0.995 (0.009) 1.029*** (0.007)
Black 1.077 (0.209) 1.524 (0.764) 1.089 (0.412)
Hispanic 1.072 (0.286) 0.990 (0.513) 0.882 (0.333)
Other 0.434* (0.150) 3.915+ (3.056) 1.165 (0.546)
Education 0.975 (0.046) 0.987 (0.110) 0.742*** (0.059)
Income 0.951 (0.034) 1.013 (0.073) 1.035 (0.054)
Unemployment 0.929 (0.296) 1.153 (0.686) 0.882 (0.382)
Married 1.342+ (0.220) 1.014 (0.312) 1.486 (0.374)
East 0.958 (0.188) 1.390 (0.639) 1.449 (0.495)
Midwest 0.836 (0.159) 1.358 (0.537) 0.910 (0.272)
West 0.975 (0.176) 1.133 (0.430) 0.676 (0.184)
Religiosity 1.270*** (0.052) 1.989*** (0.293) 1.420*** (0.112)
Constant 0.223*** (0.069) (3.841) 2.500+ (1.218)
Observations 1,334 1,328 1,334
Pseudo R2 0.05 0.12 0.11
Note: OR = Odds Ratio; SE = Robust Standard Error. aReference category is Scout.bReference categories are white, employed, unmarried and the South.† p < .10, * p < .05, ** p < .01, *** p < .001 (two-tailed tests).

59
appendix D: Survey
Gallup® is a trademark of The Gallup Organization. All other trademarks are the property of their respective owners. Copyright © 2005 The Gallup Organization, Princeton, NJ. All rights reserved. 1
1. On the whole, would you say you are satisfied or dissatisfied with the amount of leisure and free time you have? Satisfied Dissatisfied Don’t Know Refused
2. Please indicate whether or not you regularly participate in or do each of the following activities in your leisure or
free time. Yes No Don’t Refused
Know
▼ ▼ ▼ ▼ A. Attend plays, concerts, or live theater ............................................................................. B. Boating (sailing, canoeing, kayaking, etc.) ..................................................................... C. Education or taking classes ............................................................................................. D. Exercising ........................................................................................................................ E. Fishing ............................................................................................................................. F. Hunting ............................................................................................................................ G. Playing a musical instrument .......................................................................................... H. Playing video or computer games ................................................................................... I. Reading books ................................................................................................................. J. Camping .......................................................................................................................... K. Walking or hiking ........................................................................................................... L. Visiting a local, state, or national park ............................................................................ M. Bird watching .................................................................................................................. N. Snowmobiling or ATV riding .........................................................................................
3. How many formal or informal groups or clubs do you belong to, in your area, that meet at least monthly? These could
be groups such as social clubs, support groups, religious or civic groups or committees, fraternal or veteran’s organizations, or even a group of friends who meet on a routine basis for a particular purpose or activity?
4. How often do you talk to or visit with your immediate neighbors — these are the 10 or 20 households that live closest to you?
Never Once a year or less Several times a year Once a month Several times a month Several times a week About every day Don’t Know Refused
Gallup® is a trademark of The Gallup Organization. All other trademarks are the property of their respective owners. Copyright ©2011 The Gallup Organization, Princeton, NJ. All rights reserved.

60
Gallup® is a trademark of The Gallup Organization. All other trademarks are the property of their respective owners. Copyright © 2005 The Gallup Organization, Princeton, NJ. All rights reserved. 2
5. Did you experience the following feelings during A LOT OF THE DAY yesterday? Yes No Don’t Refused Know
▼ ▼ ▼ ▼ A. Enjoyment .......................................................................................................................... B. Worry ................................................................................................................................. C. Stress .................................................................................................................................. D. Depression ..........................................................................................................................
6. Please rate the closeness of your relationships with the following groups of people. Not close Extremely Don’t N/A Refused
at all close know
▼ ▼ ▼ ▼ ▼ ▼ ▼ ▼ A. With your parents B. With your siblings C. With your children D. With your neighbors E. With your religious community F. With your friends G. With your coworkers
7. Approximately how many hours did you spend socially with friends or family yesterday? This can include
telephone or e-mail.
Not Applicable Refused
8. Regardless of whether or not you think it should be legal, for each one, please tell me whether you personally believe that, in general, it is morally acceptable or morally wrong.
Morally Morally Don’t Refused Acceptable Wrong Know
▼ ▼ ▼ ▼ A. Divorce ............................................................................................................................... B. The death penalty ............................................................................................................... C. Gay or lesbian relations ...................................................................................................... D. Abortion ............................................................................................................................. E. Cheating to get ahead .........................................................................................................
9. Some people believe that there is a basic set of morals that most Americans live by,
others say that there are no basic set of morals and individuals have to decide for them what is right and wrong? Which comes closer to your point of view?
There is a basic set of morals that Americans live by There is no basic set of morals and individuals have to decide for them what is right and wrong Don’t Know Refused
Gallup® is a trademark of The Gallup Organization. All other trademarks are the property of their respective owners. Copyright ©2011 The Gallup Organization, Princeton, NJ. All rights reserved.

61
Gallup® is a trademark of The Gallup Organization. All other trademarks are the property of their respective owners. Copyright © 2005 The Gallup Organization, Princeton, NJ. All rights reserved. 3
10. Please indicate the extent to which you agree or disagree with each of the following statements about yourself. Strongly Strongly Don’t Refused
Disagree Agree Know
▼ ▼ ▼ ▼ ▼ ▼ ▼ A. I always try to exceed people’s expectations of me .......................... B. I always do what is right ................................................................... C. I fully accept the consequences of choices I make ........................... D. I work hard to get ahead ....................................................................
11. How important is it to learn something new every day? Not at all important Extremely important Don’t Know Refused
12. Have you taken a course or a class on a topic that interests you in the past year?
Yes No Don’t Know Refused
13. Have you done any of the following in your local community in the past month?
Yes No Don’t Refused Know
▼ ▼ ▼ ▼ A. Donated money to a religious institution ........................................................................... B. Donated money to a non-religious institution or charity ................................................... C. Volunteered your time to a religious organization ............................................................. D. Volunteered your time to a non-religious organization .....................................................
14. Overall, how much impact do you think people like you can have in making your community a better place to live?
No impact at all A small impact A moderate impact A big impact Don’t Know Refused
15. In the past year, have you worked with others in your neighborhood to address a problem or improve something?
Yes No Don’t Know Refused
Gallup® is a trademark of The Gallup Organization. All other trademarks are the property of their respective owners. Copyright ©2011 The Gallup Organization, Princeton, NJ. All rights reserved.

62
Gallup® is a trademark of The Gallup Organization. All other trademarks are the property of their respective owners. Copyright © 2005 The Gallup Organization, Princeton, NJ. All rights reserved. 4
16. How much do you agree or disagree with the following statements? Strongly Strongly Don’t Refused Disagree Agree Know
▼ ▼ ▼ ▼ ▼ ▼ ▼
A. I always treat people of other religious faiths with respect ............... B. Most religious faiths make a positive contribution to society ........... C. I would not object to a person of a different
religious faith moving next door ....................................................... D. In the past year, I have learned something from someone
of another religious faith ................................................................... E. I find a spiritual presence in nature ................................................... F. I regularly reflect on the meaning of life ..........................................
17. In the last year, I have made a personal goal.
Yes No Don’t Know Refused
IF YOU HAVE NOT MADE A PERSONAL GOAL IN THE LAST YEAR, PLEASE SKIP TO QUESTION 18. a. Was this personal goal achieved?
Yes No Don’t Know Refused
18. In the last year, I have made a professional goal.
Yes No Don’t Know Refused
IF YOU HAVE NOT MADE A PROFESSIONAL GOAL IN THE LAST YEAR, PLEASE SKIP TO QUESTION 19. a. Was this professional goal achieved?
Yes No Don’t Know Refused
19. In the last year, I have made a spiritual goal.
Yes No Don’t Know Refused
IF YOU HAVE NOT MADE A SPIRITUAL GOAL IN THE LAST YEAR, PLEASE SKIP TO QUESTION 20.
Gallup® is a trademark of The Gallup Organization. All other trademarks are the property of their respective owners. Copyright ©2011 The Gallup Organization, Princeton, NJ. All rights reserved.

63
Gallup® is a trademark of The Gallup Organization. All other trademarks are the property of their respective owners. Copyright © 2005 The Gallup Organization, Princeton, NJ. All rights reserved. 5
a. Was this spiritual goal achieved? Yes No Don’t Know Refused
20. In the last year, I have made a financial goal.
Yes No Don’t Know Refused
IF YOU HAVE NOT MADE A FINANCIAL GOAL IN THE LAST YEAR, PLEASE SKIP TO QUESTION 21. a. Was this financial goal achieved?
Yes No Don’t Know Refused
21. Do you use a spending plan or monthly budget to help you meet your monthly expenses?
Yes No Don’t Know Refused
IF YOU DO NOT USE A SPENDING PLAN OR MONTHLY BUDGET PLAN, SKIP TO QUESTION 23.
22. How closely do you usually keep to your budget? Very closely Somewhat closely Not closely Don’t Know Refused
23. Which of the following best describes how you pay your bills, rent, and other expenses?
I always pay on time I usually pay on time I sometimes pay on time I almost never pay on time Don’t Know Refused
Gallup® is a trademark of The Gallup Organization. All other trademarks are the property of their respective owners. Copyright ©2011 The Gallup Organization, Princeton, NJ. All rights reserved.

64
Gallup® is a trademark of The Gallup Organization. All other trademarks are the property of their respective owners. Copyright © 2005 The Gallup Organization, Princeton, NJ. All rights reserved. 6
24. Please indicate whether or not you or your household currently has any of the following to prepare for a public emergency.
Yes No Don’t Refused Know
▼ ▼ ▼ ▼ A. A Disaster Supply Kit with emergency supplies
that is kept in a designated place in your home ................................................................. B. A kit with emergency supplies that you keep in your car .................................................. C. A kit with emergency supplies that you keep where you work ......................................... D. A specific meeting place to reunite in the event
you and your family cannot return home or are evacuated ................................................ E. CPR Certification ...............................................................................................................
25. Which of these, if any, have you done in the past year?
Yes No Don’t Refused Know
▼ ▼ ▼ ▼ A. Been active in a group or organization that works to protect the environment B. Avoided using certain products that harm the environment C. Tried to use less water in your household D. Recycled paper, glass, aluminum, motor oils, or other items
26. Did you vote in the 2008 presidential election when Barack Obama and John McCain were the two main
candidates? Yes No Don’t Know Refused Not eligible to vote
27. Have you voted in a local election in the year?
Yes No Don’t Know Refused Not eligible to vote
28. Have you ever been elected to any public office?
Yes No Don’t Know Refused
29. How important are the following?
Very Not Don’t Refused Important important Know at All
▼ ▼ ▼ ▼ ▼ ▼ A. To obey laws in general ........................................................................... B. To show respect to the American flag ......................................................
Gallup® is a trademark of The Gallup Organization. All other trademarks are the property of their respective owners. Copyright ©2011 The Gallup Organization, Princeton, NJ. All rights reserved.

65
Gallup® is a trademark of The Gallup Organization. All other trademarks are the property of their respective owners. Copyright © 2005 The Gallup Organization, Princeton, NJ. All rights reserved. 7
C. To respect religious leaders outside of your religious tradition ............... D. For children to respect parents ................................................................. E. To show respect for senior citizens ..........................................................
30. Would you say your own health, in general, is…? Excellent Very good Good Fair Poor Don’t Know Refused
31. Do you have any health problems that prevent you from doing any of the things people your age normally can do?
Yes No Don’t Know Refused
32. Do you smoke?
Yes No Don’t Know Refused
33. In the last seven days, on how many days did you do the following?
A. Exercise for 30 or more minutes
Don’t Know Refused
B. Drink alcohol
Don’t Know Refused
34. What is your height in inches?
Don’t Know Refused
35. What is your weight in pounds?
Don’t Know Refused
Gallup® is a trademark of The Gallup Organization. All other trademarks are the property of their respective owners. Copyright ©2011 The Gallup Organization, Princeton, NJ. All rights reserved.

66
Gallup® is a trademark of The Gallup Organization. All other trademarks are the property of their respective owners. Copyright © 2005 The Gallup Organization, Princeton, NJ. All rights reserved. 8
36. Have you ever held leadership positions at the organization in which you are, or have been, employed? Yes No Don’t Know Refused
37. Have you held leadership positions in your local community?
Yes No Don’t Know Refused
DEMOGRAPHICS
38. What is your age?
Refused
39. What is your marital status?
Single/Never been married Married Separated Divorced Widowed Domestic partnership/Living with partner (not legally married) Don’t Know Refused
40. What is the highest level of education you have completed?
Less than high school graduate High school graduate Some college Trade/Technical/Vocational training College graduate Postgraduate work/degree Don’t Know Refused
41. Are you currently…
Self-employed A salaried employee A stay at home mom A student Unemployed Retired Other Don’t Know Refused
Gallup® is a trademark of The Gallup Organization. All other trademarks are the property of their respective owners. Copyright ©2011 The Gallup Organization, Princeton, NJ. All rights reserved.

67
Gallup® is a trademark of The Gallup Organization. All other trademarks are the property of their respective owners. Copyright © 2005 The Gallup Organization, Princeton, NJ. All rights reserved. 9
IF YOU IDENTIFIED AS SELF-EMPLOYED OR A SALARIED EMPLOYEE, CONTINUE. OTHERWISE, SKIP TO QUESTION 42.
a. Could you tell me the general category of work you do in your primary job? Professional worker: Lawyer, doctor, scientist, teacher, engineer, nurse, accountant, computer programmer, architect, investment banker, stock broker, marketing, musician, artist Manager, Executive or Official: In a business, government agency, or other organization Business Owner: Such as a store, factory, plumbing contractor, etc. (self-employed). Clerical or Office Worker: In business, government agency, or other type of organization -- such as a typist, secretary, postal clerk, telephone operator, computer operator, data entry, bank clerk, etc. Sales worker: Clerk in a store, door-to-door salesperson, sales associate, manufacturer’s representative, outside sales person Service worker: Policeman/woman, fireman, waiter or waitress, maid, nurse's aide, attendant, barber or beautician, fast-food, landscaping, janitorial, personal care worker Construction or Mining worker: Construction manager, plumber, carpenter, electrician, other construction trades, miner, or other extraction worker Manufacturing or Production worker: Operates a machine in a factory, is an assembly line worker in a factory, includes non-restaurant food preparation (baker), printer, print shop worker, garment, furniture and all other manufacturing Transportation worker: Drives a truck, taxi cab, bus or etc, works with or on aircraft (including pilots and flight attendants), trains, boats, teamster, longshoreman, delivery company worker or driver, moving company worker Installation or Repair worker: Garage mechanic, linesman, other installation, maintenance or repair worker Farming, Fishing or Forestry worker: Farmer, farm worker, aquaculture or hatchery worker, fisherman, deck hand on fishing boat, lumberjack, forest management worker Other (list) Don’t Know Refused
42. In politics, as of today, do you consider yourself a Republican, Democrat, or an Independent?
Republican Independent, lean Republican Independent Independent, lean Democrat Democrat Don’t Know Refused
Gallup® is a trademark of The Gallup Organization. All other trademarks are the property of their respective owners. Copyright ©2011 The Gallup Organization, Princeton, NJ. All rights reserved.

68
Gallup® is a trademark of The Gallup Organization. All other trademarks are the property of their respective owners. Copyright © 2005 The Gallup Organization, Princeton, NJ. All rights reserved. 10
43. What was your annual household income in 2009, before taxes? Under $15,000 $15,000 to less than $25,000 $25,000 to less than $35,000 $35,000 to less than $45,000 $45,000 to less than $55,000 $55,000 to less than $75,000 $75,000 to less than $100,000 $100,000 or over Don’t Know Refused
44. What is your religious preference?
Christianity Judaism Islam Buddhism Hinduism Native American Religion Agnostic Atheist Nonreligious/ Secular Other (list) Don’t Know Refused
IF YOUR RELIGIOUS PREFERENCE IS CHRISTIANITY, CONTINUE TO QUESTION 44a. IF YOUR RELIGIOUS PREFERENCE IS AGNOSTIC, ATHEIST, OR NONRELIGIOUS/SECULAR, SKIP TO QUESTION 46. FOR ALL OTHER RELIGIOUS PREFERENCES, SKIP TO QUESTION 45. a. To which denomination of Christianity do you belong?
Catholic Baptist Methodist/Wesleyan Lutheran Presbyterian Pentecostal/Charismatic Episcopal/Anglican Latter-Day Saints/ Mormon Churches of Christ Assemblies of God Congregational/United Church of Christ Other (list) Don’t Know Refused
Gallup® is a trademark of The Gallup Organization. All other trademarks are the property of their respective owners. Copyright ©2011 The Gallup Organization, Princeton, NJ. All rights reserved.

69
Gallup® is a trademark of The Gallup Organization. All other trademarks are the property of their respective owners. Copyright © 2005 The Gallup Organization, Princeton, NJ. All rights reserved. 11
45. Typically, how often do you attend religious services? More than once a week Once a week Once a month Major religious holidays Other Don’t Know Refused
46. Are you, yourself, of Hispanic origin or descent, such as Mexican, Puerto Rican, Cuban, or other Spanish
background? Yes No Don’t Know Refused
47. What is your race?
White African-American/Black Hispanic Asian Other Don’t Know Refused
48. Including yourself, how many adults, 18 years of age or older, live in your household?
Don’t Know Refused
49. Region:
East Midwest South West
50. How many different residential phone numbers do you have coming into your household, not including lines
dedicated to a fax machine, modem, or used strictly for business purposes? Do not include cellular phones.
Don’t Know Refused
51. Were you ever a member of the Boy Scouts of America?
Yes No Don’t Know Refused
Gallup® is a trademark of The Gallup Organization. All other trademarks are the property of their respective owners.
Copyright ©2011 The Gallup Organization, Princeton, NJ. All rights reserved.

70
Gallup® is a trademark of The Gallup Organization. All other trademarks are the property of their respective owners. Copyright © 2005 The Gallup Organization, Princeton, NJ. All rights reserved. 12
IF YES, CONTINUE TO QUESTION 52. IF NO, SURVEY IS COMPLETED.
52. During that time, did you ever achieve the Eagle Scout rank? Yes No Don’t Know Refused
53. How many years were you a member of the Boy Scouts before the age of 18?
Don’t Know Refused
54. Please rate how important being a part of the Boy Scouts was in your life.
Not very important Very important Don’t Know Refused
55. If you had a son, would you want them to be a member of the Boy Scouts?
Yes No Don’t Know Refused
This completes the survey. Please make sure you have answered all of the questions relevant to you and
then send the survey back in the envelope provided. Thank you for your participation!
Gallup® is a trademark of The Gallup Organization. All other trademarks are the property of their respective owners. Copyright ©2011 The Gallup Organization, Princeton, NJ. All rights reserved.
71
This study was funded through a generous grant
(ID No. 15465) from the John M. Templeton Foundation.
The opinions expressed in this paper are those of the
authors and do not necessarily reflect the views of the
John M. Templeton Foundation.
Please direct all correspondence to Byron R. Johnson,
Program on Prosocial Behavior, Institute for Studies
of Religion, Baylor University, One Bear Place 97236,
Waco, TX 76798; 254-710-7555 (phone), 254-710-1428
(fax); www.BaylorISR.org.
acknowledgments
about the authorsSung Joon Jang is an associate professor in the
Department of Sociology at Baylor University and a
faculty fellow in the Institute for Studies of Religion. His
publications focus on the effects of family, school, peers,
religiosity, and community on crime and delinquency,
including drug use. His latest research examines how
religiosity protects an individual from the effects of strain
and emotional distress on deviant coping behavior.
Professor Jang came to Baylor in 2007, after holding
faculty positions at Ohio State University and Louisiana
State University. Dr. Jang’s research interests include
crime and deviance, juvenile delinquency, drug use,
religiosity and spirituality, and mental health. Dr. Jang
teaches Ph.D. students courses in criminological theory
and micro-criminology.
Byron R. Johnson is Distinguished Professor of the
Social Sciences at Baylor University. He is the founding
director of the Baylor Institute for Studies of Religion
(ISR) as well as director of the Program on Prosocial
Behavior. Before joining the faculty at Baylor University,
Johnson directed research centers at Vanderbilt
University and the University of Pennsylvania. Professor
Johnson recently completed a series of studies for the
Department of Justice on the role of religion in prosocial
youth behavior and is a member of the Coordinating
Council for Juvenile Justice and Delinquency Prevention
(Presidential Appointment). He is a leading authority on
the scientific study of religion, the efficacy of faith-based
organizations, and criminal justice. His recent research
has examined the impact of faith-based programs on
recidivism reduction and prisoner reentry and this is the
subject of his most recent book—More God, Less Crime:
Why Faith Matters and How It Could Matter More (2011).
Young-Il Kim joined ISR in the fall of 2011 as a
post-doctoral fellow. He received his Ph.D. in sociology
from the University of Virginia in 2010. His areas of
research interest include religion, family, and civic
engagement. At ISR, he analyzes data from the Gallup
World Poll to determine the current state of religion in the
world as well as the way in which religion interacts with
other societal and individual characteristics.

72
Endnotes1 Damon, William. 2004. “What is Positive Youth
Development?” Annals of the American Academy of
Political and Social Science 591:13-24; Elder, Glen H.
1998. “The Life Course and Human Development.”
Pp. 939-991 in Handbook of Child Psychology:
Theoretical Models of Human Development, edited by
William Damon and Richard M. Lerner. New York: John
Wiley; Lerner, Richard M., Jason B. Almerigi, Christina
Theokas and Jacqueline V. Lerner. 2005a. “Positive Youth
Development A View of the Issues.” The Journal of Early
Adolescence 25(1):10-16; Lerner, Richard M., Jacqueline
V. Lerner, Jason B. Almerigi, Christina Theokas, Erin
Phelps, Steinunn Gestsdottir, Sophie Naudeau, Helena
Jelicic, Amy Alberts, Lang Ma, Lisa M. Smith, Deborah
L. Bobek, David Richman-Raphael, Isla Simpson, Elise
D. Christiansen and Alexander von Eye. 2005b. “Positive
Youth Development, Participation in Community Youth
Development Programs, and Community Contributions of
Fifth-grade Adolescents: Findings from the First Wave of
the 4-H Study of Positive Youth Development.” Journal of
Early Adolescence 25(1):17-71.
2 Leffert, Nancy, Peter L. Benson, Peter C.
Scales, Anu R. Sharma, Dyanne R. Drake and Dale A.
Blyth. 1998. “Developmental Assets: Measurement
and Prediction of Risk Behaviors Among Adolescents.”
Applied Developmental Science 2(4):209.
3 Damon, William. 2004. “What is Positive Youth
Development?” Annals of the American Academy of
Political and Social Science 591:13-24; Lerner, Jacqueline
V., E. Phelps, Yulika K. Forman and Edmond P. Bowers.
2009. “Positive Youth Development.” Pp. 524-558 in
Handbook of Adolescent Psychology: Individual Bases of
Adolescent Development, edited by Richard M. Lerner and
L. Steinberg. Hoboken, NJ: John Wiley & Sons.
Lerner, Richard M. 2009. “The Positive Youth
Development Perspective: Theoretical and Empirical
Bases of a Strength-based Approach to Adolescent
Development.” Pp. 149-163 in Oxford Handbook of
Positive Psychology, edited by C.R. Snyder and S.J.
Lopez. New York, NY: Oxford University Press.
4 Larson, Reed W. 2000. “Toward a Psychology
of Positive Youth Development.” American Psychologist
55 (1):170-183.
5 Hansen, David M., Reed W. Larson and Jodi B.
Dworkin. 2003. “What Adolescents Learn in Organized
Youth Activities: A Survey of Self-reported Developmental
Experiences.” Journal of Research on Adolescence
13(1):25-55; Jang, Sung Joon, Byron R. Johnson, and
Christopher Bader. 2008. “The Cumulative Advantage
of Religiosity in Preventing Drug Use,” Journal of Drug
Issues, 38 (3): 771-798; Jang, Sung Joon and Byron R.
Johnson. 2010. “Religion, Race, and Drug Use Among
American Youth,” Interdisciplinary Journal of Research on
Religion, 6: 1-25; Ulmer, Jeffrey T., Scott Desmond, Sung
Joon Jang, Byron R. Johnson. 2010. “Teenage Religiosity
and Changes in Marijuana Use During the Transition
to Adulthood,” Interdisciplinary Journal of Research
on Religion, 6: 1-19; Jang, Sung Joon and Byron R.
Johnson. 2011. “The Effects of Childhood Exposure to
Drug Users and Religion on Drug Use in Adolescence
and Young Adulthood,” Youth and Society, 43:1220-
1245; Ulmer, Jeffrey T., Scott Desmond, Sung Joon Jang,
Byron R. Johnson. 2012. “Religiosity and Dynamics of
Marijuana Use: Initiation, Persistence, and Desistence,”
(in press) Deviant Behavior.
6 The Values of Men and Boys in America, Louis
Harris and Associates (1995).

73
7 A “dummy” variable was constructed to
represent the Eagle Scout status. Since this report
focuses on Eagle Scouts, we analyzed data from two
subsets of the total sample: one includes Eagle Scouts
and non-Scouts, with the latter being a reference
category, and the other Eagle Scouts and other Scouts,
with the non-Eagle Scouts being a reference category.
So, we were able to assess whether achieving the
rank of Eagle Scout makes a difference in various life
outcomes, comparing them separately to Scouts and
non-Scouts.
8 For results based on the total sample, it can
be said with 95 percent confidence that the maximum
margin of sampling error is plus or minus 2.35
percentage points, whereas the margin of sampling error
for the Boy Scout, the Eagle Scout, and the general
adult male population sample (from which non-Scout
respondents were selected) can be said to be plus or
minus 3.41, plus or minus 5.73, and plus or minus 3.34
percentage points, respectively.
9 While our data are not longitudinal, that is,
cross-sectional (i.e., a survey taken at one time point on
a cross-section of the population), the dummy variables
are legitimately exogenous or antecedent to endogenous
or outcome variables measuring recreational lifestyles,
human and social capital, civic engagement, and
well-being at age 18 or older. Thus, the chronological
order helps us meet the necessary condition of time
sequence so we may interpret associations between
the dummy and outcome variables as potentially causal
relationships. We examined the associations, however,
adjusting for survey respondents’ key sociodemographic
characteristics, because previous studies tend to show
they are related to developmental outcomes of our
interest. Thus, failing to take those characteristics into
account would bias our findings, leading us to over- or
underestimate the influence of Boy Scout involvement
in adolescence on beliefs, attitudes, and behaviors in
adulthood.
10 For example, a survey item asking, “How
closely do you usually keep to your budget?” has three
response options: “not closely,” “somewhat closely,” and
“very closely.” So, this item was analyzed by grouping
the response options into two, “not or somewhat
closely” (= 0) vs. “very closely” (= 1) as well as “not
closely” (= 0) vs. “somewhat or very closely” (= 1).
11 Subsequent publications will focus on Scouts
as well as other key findings.

210-0452012 Printing