Eagle Bulk Q4 2012 earnings presentation
23
EAGLE BULK SHIPPING INC. 4Q 2012 Results Presentation 2 April 2013
-
Upload
tradewindsnews -
Category
Documents
-
view
94 -
download
1
Transcript of Eagle Bulk Q4 2012 earnings presentation
EAGLE BULK SHIPPING INC. 4Q 2012 Results Presentation
2 April 2013
EAGLE BULK SHIPPING INC. 2
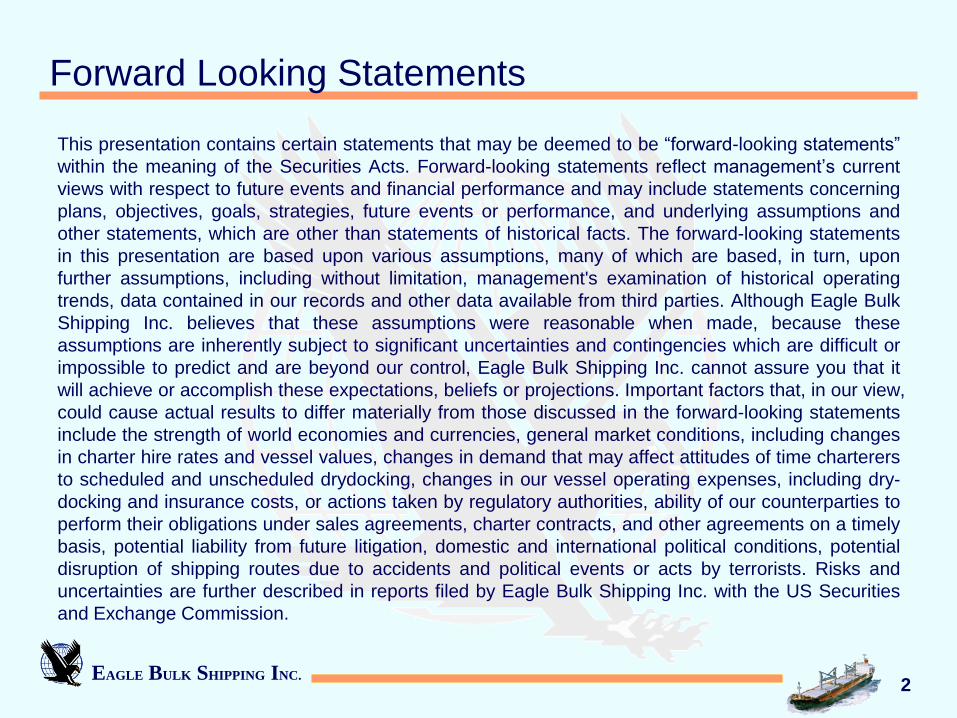
Forward Looking Statements
This presentation contains certain statements that may be deemed to be “forward-looking statements”
within the meaning of the Securities Acts. Forward-looking statements reflect management’s current
views with respect to future events and financial performance and may include statements concerning
plans, objectives, goals, strategies, future events or performance, and underlying assumptions and
other statements, which are other than statements of historical facts. The forward-looking statements
in this presentation are based upon various assumptions, many of which are based, in turn, upon
further assumptions, including without limitation, management's examination of historical operating
trends, data contained in our records and other data available from third parties. Although Eagle Bulk
Shipping Inc. believes that these assumptions were reasonable when made, because these
assumptions are inherently subject to significant uncertainties and contingencies which are difficult or
impossible to predict and are beyond our control, Eagle Bulk Shipping Inc. cannot assure you that it
will achieve or accomplish these expectations, beliefs or projections. Important factors that, in our view,
could cause actual results to differ materially from those discussed in the forward-looking statements
include the strength of world economies and currencies, general market conditions, including changes
in charter hire rates and vessel values, changes in demand that may affect attitudes of time charterers
to scheduled and unscheduled drydocking, changes in our vessel operating expenses, including dry-
docking and insurance costs, or actions taken by regulatory authorities, ability of our counterparties to
perform their obligations under sales agreements, charter contracts, and other agreements on a timely
basis, potential liability from future litigation, domestic and international political conditions, potential
disruption of shipping routes due to accidents and political events or acts by terrorists. Risks and
uncertainties are further described in reports filed by Eagle Bulk Shipping Inc. with the US Securities
and Exchange Commission.
EAGLE BULK SHIPPING INC. 3
Results and Highlights
Commercial
Industry
Financials
Q&A
Appendix
Agenda
EAGLE BULK SHIPPING INC.
Results and Highlights
EAGLE BULK SHIPPING INC.
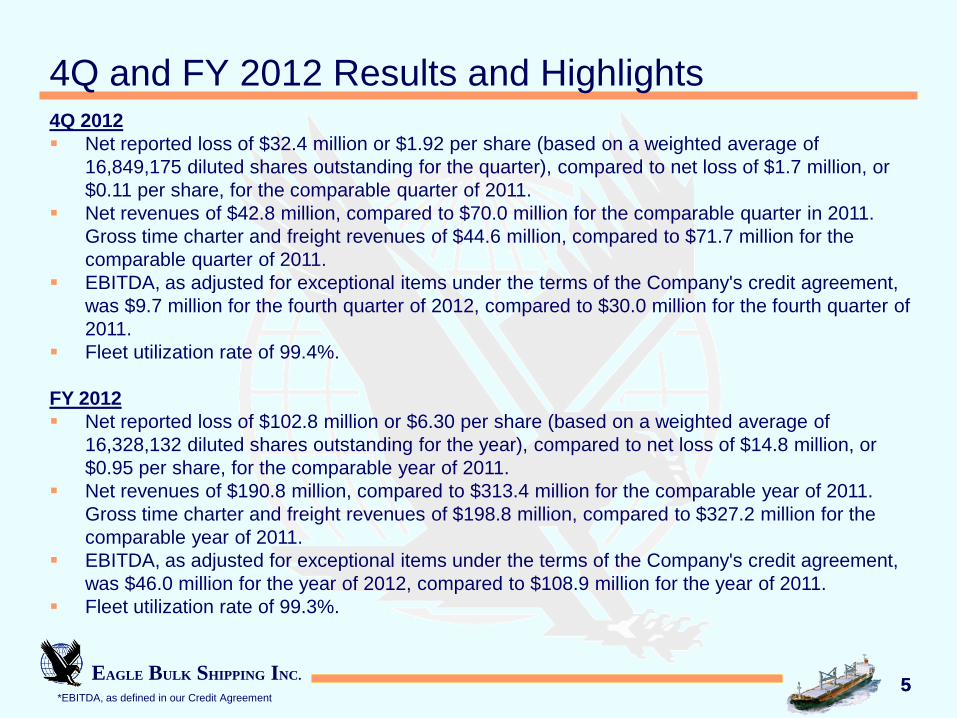
4Q and FY 2012 Results and Highlights
5 5
4Q 2012
Net reported loss of $32.4 million or $1.92 per share (based on a weighted average of
16,849,175 diluted shares outstanding for the quarter), compared to net loss of $1.7 million, or
$0.11 per share, for the comparable quarter of 2011.
Net revenues of $42.8 million, compared to $70.0 million for the comparable quarter in 2011.
Gross time charter and freight revenues of $44.6 million, compared to $71.7 million for the
comparable quarter of 2011.
EBITDA, as adjusted for exceptional items under the terms of the Company's credit agreement,
was $9.7 million for the fourth quarter of 2012, compared to $30.0 million for the fourth quarter of
2011.
Fleet utilization rate of 99.4%.
FY 2012
Net reported loss of $102.8 million or $6.30 per share (based on a weighted average of
16,328,132 diluted shares outstanding for the year), compared to net loss of $14.8 million, or
$0.95 per share, for the comparable year of 2011.
Net revenues of $190.8 million, compared to $313.4 million for the comparable year of 2011.
Gross time charter and freight revenues of $198.8 million, compared to $327.2 million for the
comparable year of 2011.
EBITDA, as adjusted for exceptional items under the terms of the Company's credit agreement,
was $46.0 million for the year of 2012, compared to $108.9 million for the year of 2011.
Fleet utilization rate of 99.3%.
*EBITDA, as defined in our Credit Agreement

EAGLE BULK SHIPPING INC. EAGLE BULK SHIPPING INC.
Commercial
EAGLE BULK SHIPPING INC. 7
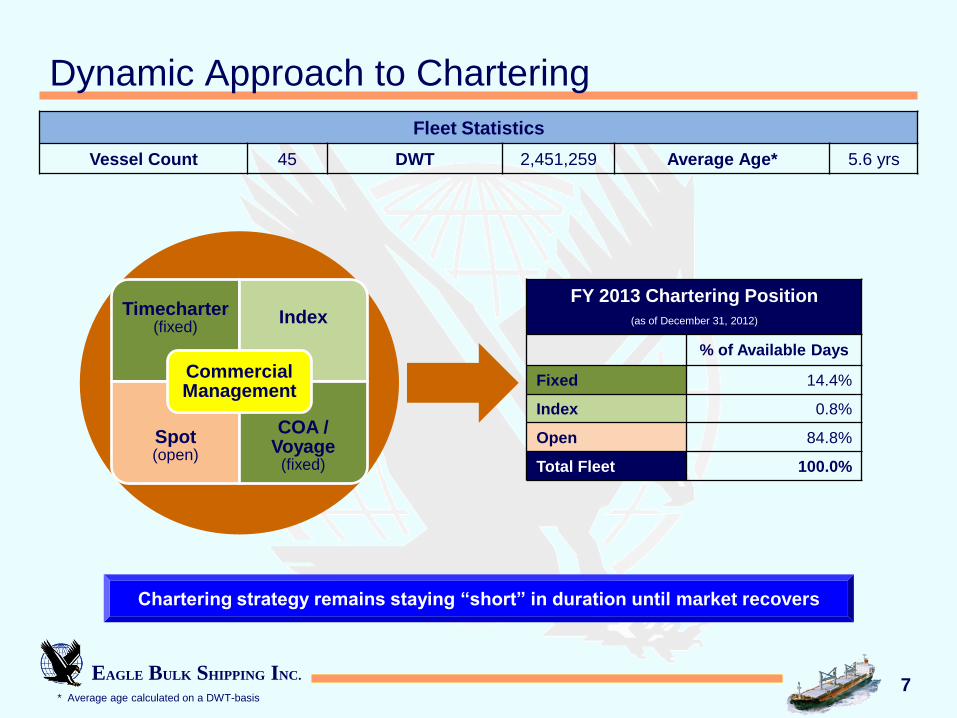
Dynamic Approach to Chartering
Chartering strategy remains staying “short” in duration until market recovers
Timecharter (fixed)
Index
Spot (open)
COA / Voyage
(fixed)
Commercial Management
Fleet Statistics
Vessel Count 45 DWT 2,451,259 Average Age* 5.6 yrs
* Average age calculated on a DWT-basis
FY 2013 Chartering Position
(as of December 31, 2012)
% of Available Days
Fixed 14.4%
Index 0.8%
Open 84.8%
Total Fleet 100.0%
EAGLE BULK SHIPPING INC. 8
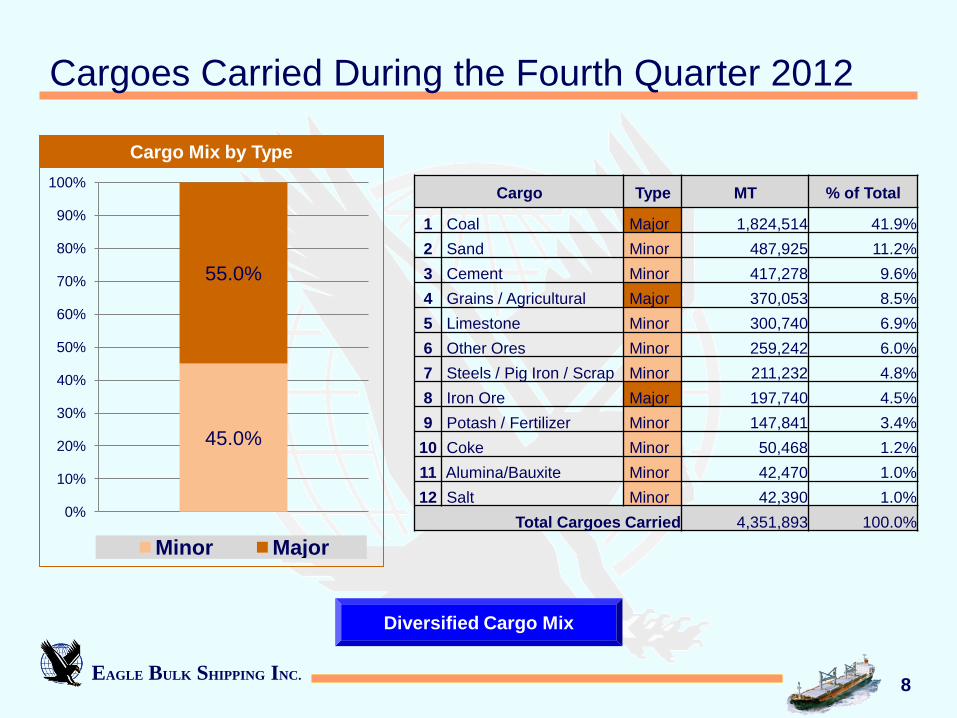
Cargoes Carried During the Fourth Quarter 2012
Diversified Cargo Mix
Cargo Type MT % of Total
1 Coal Major 1,824,514 41.9%
2 Sand Minor 487,925 11.2%
3 Cement Minor 417,278 9.6%
4 Grains / Agricultural Major 370,053 8.5%
5 Limestone Minor 300,740 6.9%
6 Other Ores Minor 259,242 6.0%
7 Steels / Pig Iron / Scrap Minor 211,232 4.8%
8 Iron Ore Major 197,740 4.5%
9 Potash / Fertilizer Minor 147,841 3.4%
10 Coke Minor 50,468 1.2%
11 Alumina/Bauxite Minor 42,470 1.0%
12 Salt Minor 42,390 1.0%
Total Cargoes Carried 4,351,893 100.0%
45.0%
55.0%
0%
10%
20%
30%
40%
50%
60%
70%
80%
90%
100%
Minor Major
Cargo Mix by Type
EAGLE BULK SHIPPING INC.
Industry
EAGLE BULK SHIPPING INC. 10
Source(s): Clarksons
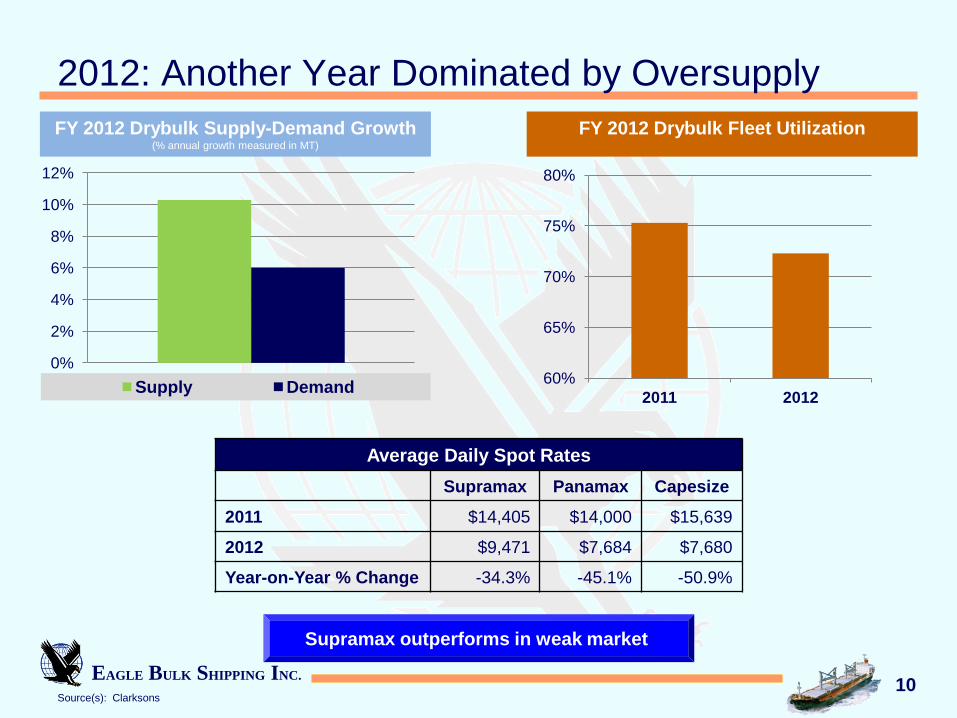
2012: Another Year Dominated by Oversupply
Supramax outperforms in weak market
FY 2012 Drybulk Supply-Demand Growth (% annual growth measured in MT)
FY 2012 Drybulk Fleet Utilization (\
Average Daily Spot Rates
Supramax Panamax Capesize
2011 $14,405 $14,000 $15,639
2012 $9,471 $7,684 $7,680
Year-on-Year % Change -34.3% -45.1% -50.9%
0%
2%
4%
6%
8%
10%
12%
Supply Demand 60%
65%
70%
75%
80%
2011 2012
EAGLE BULK SHIPPING INC.
0%
2%
4%
6%
8%
10%
12%
14%
16%
18%
0
5
10
15
20
25
30
35
40
Capesize Panamax Sub-Panamax
Vessels in million DWT as a % of Fleet (DWT)
11 Source(s): Clarksons
Scrapping at historical highs
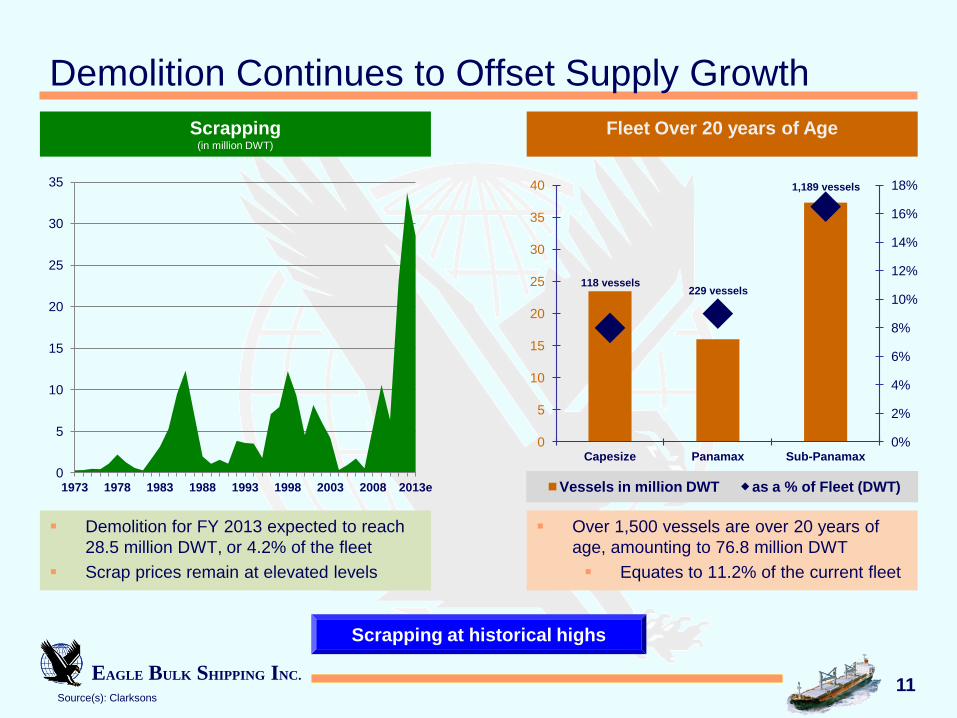
Demolition Continues to Offset Supply Growth
Scrapping
(in million DWT)
Fleet Over 20 years of Age
(
118 vessels 229 vessels
1,189 vessels
Demolition for FY 2013 expected to reach
28.5 million DWT, or 4.2% of the fleet
Scrap prices remain at elevated levels
Over 1,500 vessels are over 20 years of
age, amounting to 76.8 million DWT
Equates to 11.2% of the current fleet
0
5
10
15
20
25
30
35
1973 1978 1983 1988 1993 1998 2003 2008 2013e
EAGLE BULK SHIPPING INC.
0
2
4
6
8
10
12
14
Jan-08 Jan-09 Jan-10 Jan-11 Jan-12 Jan-13
Actual 3m Moving Average
12 Source(s): Clarksons
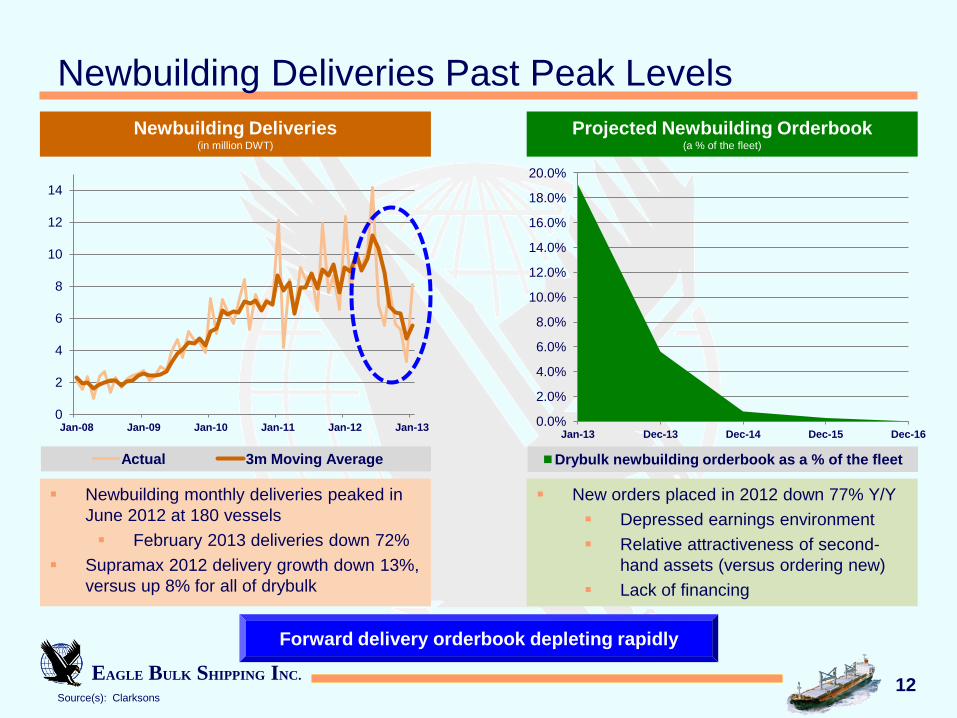
Newbuilding Deliveries Past Peak Levels
Forward delivery orderbook depleting rapidly
Projected Newbuilding Orderbook (a % of the fleet)
0.0%
2.0%
4.0%
6.0%
8.0%
10.0%
12.0%
14.0%
16.0%
18.0%
20.0%
Jan-13 Dec-13 Dec-14 Dec-15 Dec-16
Drybulk newbuilding orderbook as a % of the fleet
Newbuilding Deliveries (in million DWT)
New orders placed in 2012 down 77% Y/Y
Depressed earnings environment
Relative attractiveness of second-
hand assets (versus ordering new)
Lack of financing
Newbuilding monthly deliveries peaked in
June 2012 at 180 vessels
February 2013 deliveries down 72%
Supramax 2012 delivery growth down 13%,
versus up 8% for all of drybulk
EAGLE BULK SHIPPING INC. 13
Source(s): Clarksons, USDA
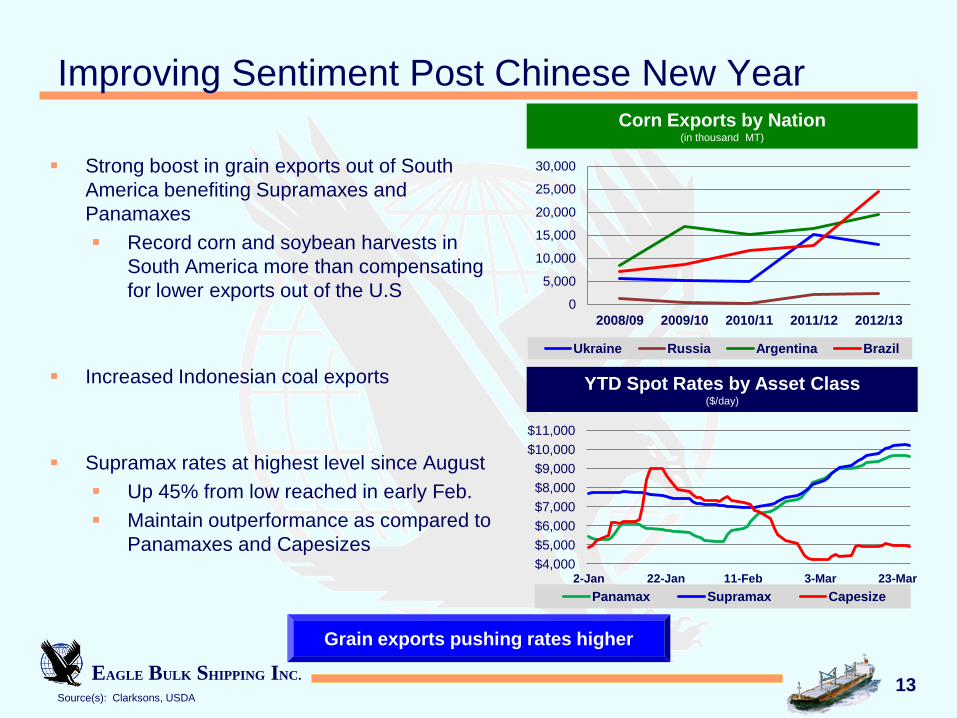
Strong boost in grain exports out of South
America benefiting Supramaxes and
Panamaxes
Record corn and soybean harvests in
South America more than compensating
for lower exports out of the U.S
Increased Indonesian coal exports
Supramax rates at highest level since August
Up 45% from low reached in early Feb.
Maintain outperformance as compared to
Panamaxes and Capesizes
Improving Sentiment Post Chinese New Year
Grain exports pushing rates higher
0
5,000
10,000
15,000
20,000
25,000
30,000
2008/09 2009/10 2010/11 2011/12 2012/13
Ukraine Russia Argentina Brazil
Corn Exports by Nation (in thousand MT)
$4,000
$5,000
$6,000
$7,000
$8,000
$9,000
$10,000
$11,000
2-Jan 22-Jan 11-Feb 3-Mar 23-Mar
Panamax Supramax Capesize
YTD Spot Rates by Asset Class ($/day)
EAGLE BULK SHIPPING INC. 14
Source(s): Clarksons, Macquarie, Peabody
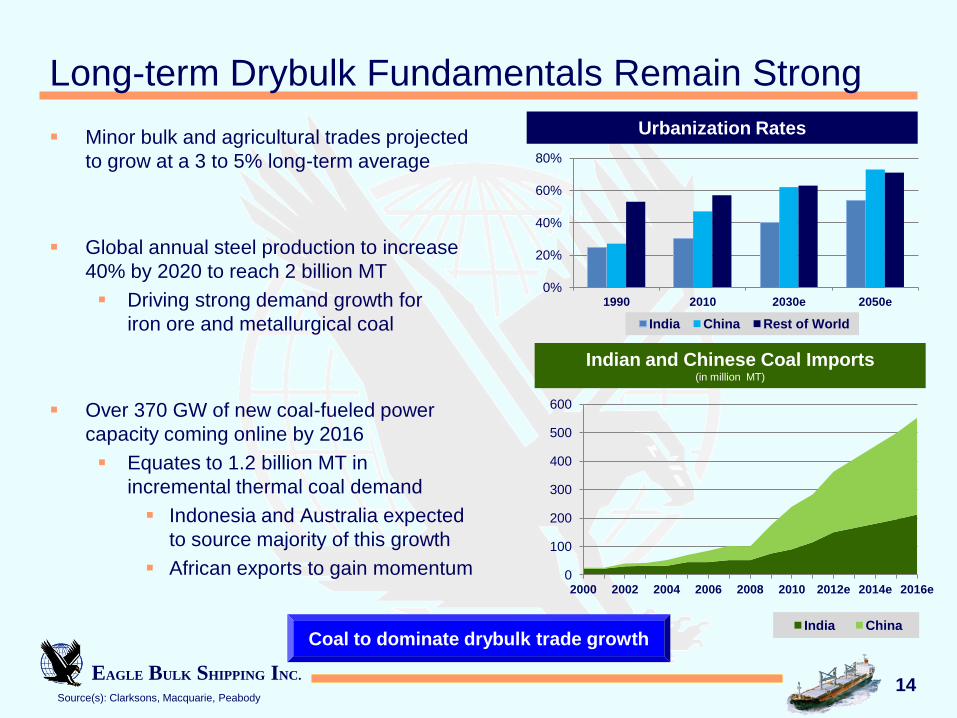
Minor bulk and agricultural trades projected
to grow at a 3 to 5% long-term average
Global annual steel production to increase
40% by 2020 to reach 2 billion MT
Driving strong demand growth for
iron ore and metallurgical coal
Over 370 GW of new coal-fueled power
capacity coming online by 2016
Equates to 1.2 billion MT in
incremental thermal coal demand
Indonesia and Australia expected
to source majority of this growth
African exports to gain momentum
Long-term Drybulk Fundamentals Remain Strong
Coal to dominate drybulk trade growth
Indian and Chinese Coal Imports (in million MT)
0
100
200
300
400
500
600
2000 2002 2004 2006 2008 2010 2012e 2014e 2016e
India China
0%
20%
40%
60%
80%
1990 2010 2030e 2050e
India China Rest of World
Urbanization Rates
EAGLE BULK SHIPPING INC.
Financials
EAGLE BULK SHIPPING INC. 16
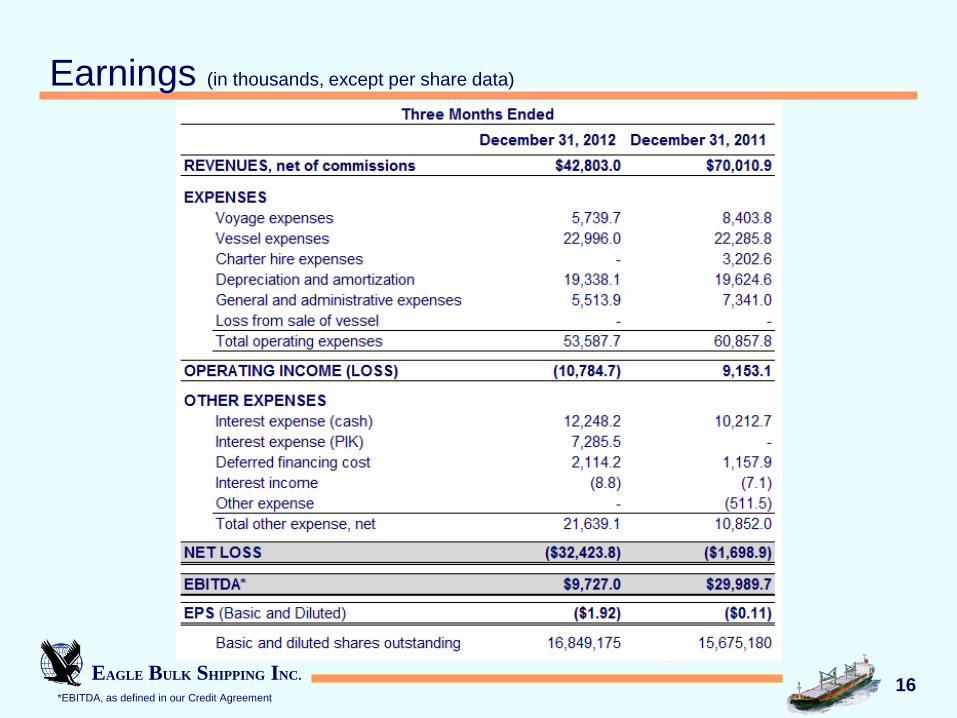
Earnings (in thousands, except per share data)
*EBITDA, as defined in our Credit Agreement
EAGLE BULK SHIPPING INC. 17
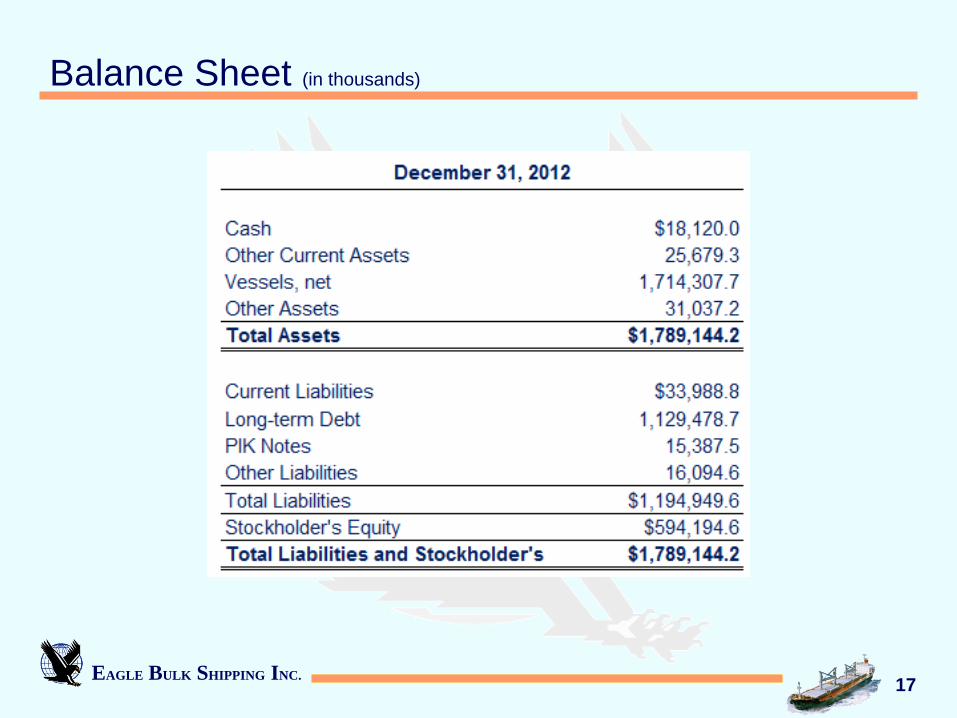
Balance Sheet (in thousands)
EAGLE BULK SHIPPING INC. 18
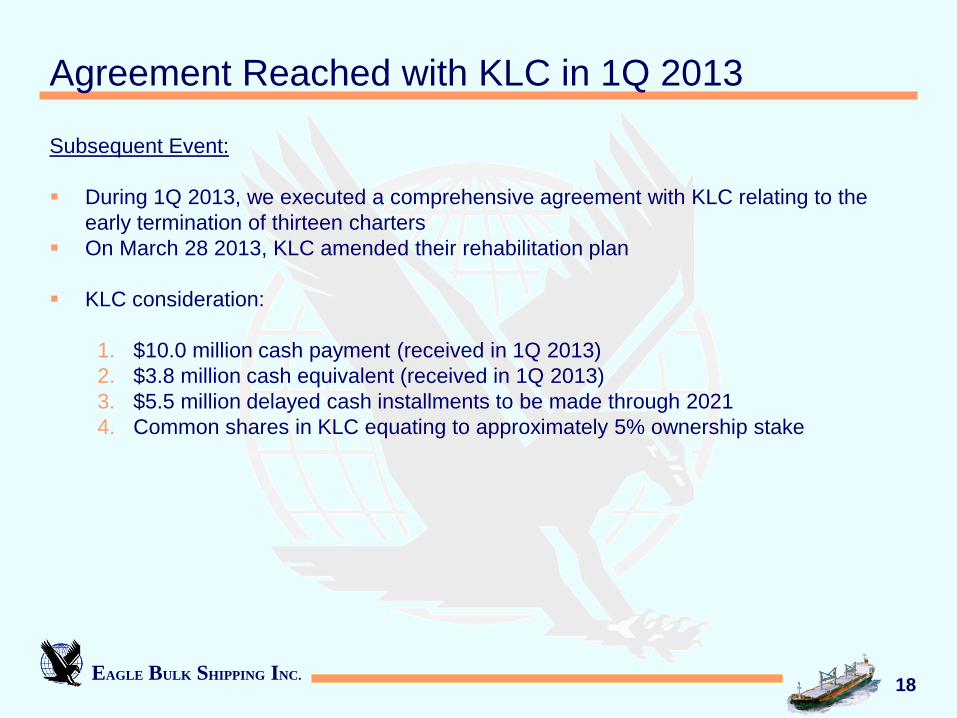
Agreement Reached with KLC in 1Q 2013
Subsequent Event:
During 1Q 2013, we executed a comprehensive agreement with KLC relating to the
early termination of thirteen charters
On March 28 2013, KLC amended their rehabilitation plan
KLC consideration:
1. $10.0 million cash payment (received in 1Q 2013)
2. $3.8 million cash equivalent (received in 1Q 2013)
3. $5.5 million delayed cash installments to be made through 2021
4. Common shares in KLC equating to approximately 5% ownership stake
EAGLE BULK SHIPPING INC.
Q&A
EAGLE BULK SHIPPING INC. EAGLE BULK SHIPPING INC.
EAGLE BULK SHIPPING INC.
Appendix
EAGLE BULK SHIPPING INC. 22
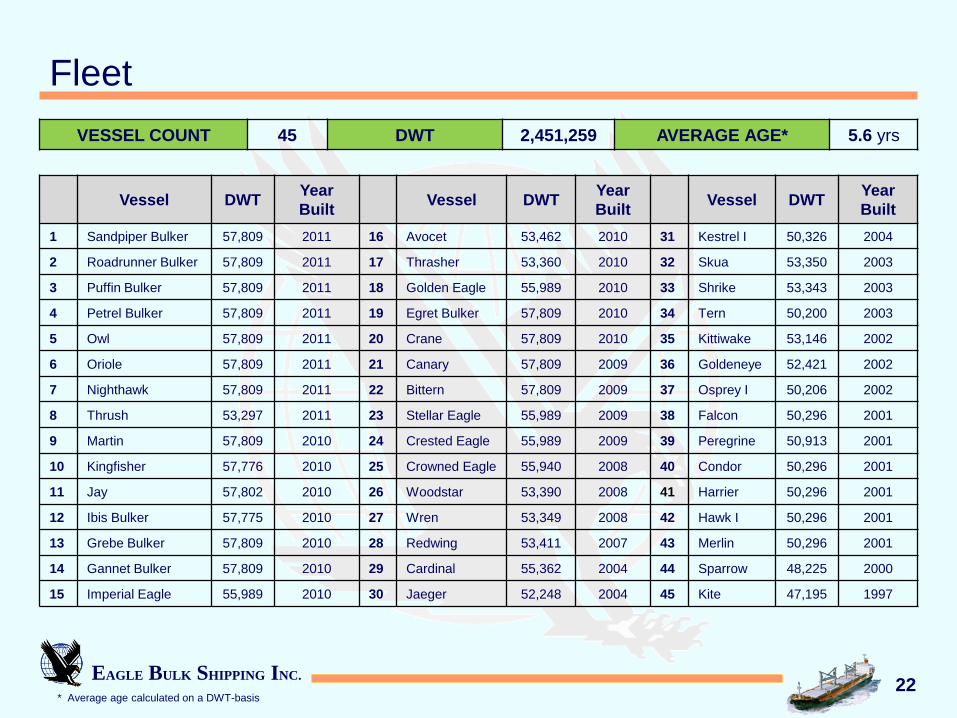
Fleet
Vessel DWT Year
Built Vessel DWT
Year
Built Vessel DWT
Year
Built
1 Sandpiper Bulker 57,809 2011 16 Avocet 53,462 2010 31 Kestrel I 50,326 2004
2 Roadrunner Bulker 57,809 2011 17 Thrasher 53,360 2010 32 Skua 53,350 2003
3 Puffin Bulker 57,809 2011 18 Golden Eagle 55,989 2010 33 Shrike 53,343 2003
4 Petrel Bulker 57,809 2011 19 Egret Bulker 57,809 2010 34 Tern 50,200 2003
5 Owl 57,809 2011 20 Crane 57,809 2010 35 Kittiwake 53,146 2002
6 Oriole 57,809 2011 21 Canary 57,809 2009 36 Goldeneye 52,421 2002
7 Nighthawk 57,809 2011 22 Bittern 57,809 2009 37 Osprey I 50,206 2002
8 Thrush 53,297 2011 23 Stellar Eagle 55,989 2009 38 Falcon 50,296 2001
9 Martin 57,809 2010 24 Crested Eagle 55,989 2009 39 Peregrine 50,913 2001
10 Kingfisher 57,776 2010 25 Crowned Eagle 55,940 2008 40 Condor 50,296 2001
11 Jay 57,802 2010 26 Woodstar 53,390 2008 41 Harrier 50,296 2001
12 Ibis Bulker 57,775 2010 27 Wren 53,349 2008 42 Hawk I 50,296 2001
13 Grebe Bulker 57,809 2010 28 Redwing 53,411 2007 43 Merlin 50,296 2001
14 Gannet Bulker 57,809 2010 29 Cardinal 55,362 2004 44 Sparrow 48,225 2000
15 Imperial Eagle 55,989 2010 30 Jaeger 52,248 2004 45 Kite 47,195 1997
* Average age calculated on a DWT-basis
VESSEL COUNT 45 DWT 2,451,259 AVERAGE AGE* 5.6 yrs
EAGLE BULK SHIPPING INC. 23
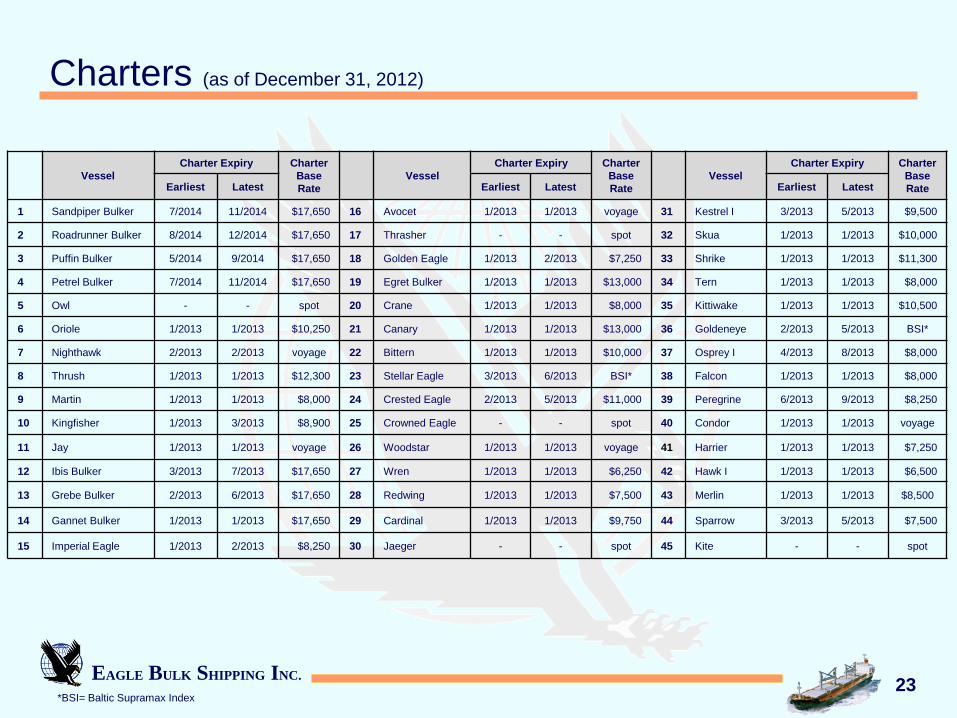
Charters (as of December 31, 2012)
Vessel
Charter Expiry Charter
Base
Rate
Vessel
Charter Expiry Charter
Base
Rate
Vessel
Charter Expiry Charter
Base
Rate Earliest Latest Earliest Latest Earliest Latest
1 Sandpiper Bulker 7/2014 11/2014 $17,650 16 Avocet 1/2013 1/2013 voyage 31 Kestrel I 3/2013 5/2013 $9,500
2 Roadrunner Bulker 8/2014 12/2014 $17,650 17 Thrasher - - spot 32 Skua 1/2013 1/2013 $10,000
3 Puffin Bulker 5/2014 9/2014 $17,650 18 Golden Eagle 1/2013 2/2013 $7,250 33 Shrike 1/2013 1/2013 $11,300
4 Petrel Bulker 7/2014 11/2014 $17,650 19 Egret Bulker 1/2013 1/2013 $13,000 34 Tern 1/2013 1/2013 $8,000
5 Owl - - spot 20 Crane 1/2013 1/2013 $8,000 35 Kittiwake 1/2013 1/2013 $10,500
6 Oriole 1/2013 1/2013 $10,250 21 Canary 1/2013 1/2013 $13,000 36 Goldeneye 2/2013 5/2013 BSI*
7 Nighthawk 2/2013 2/2013 voyage 22 Bittern 1/2013 1/2013 $10,000 37 Osprey I 4/2013 8/2013 $8,000
8 Thrush 1/2013 1/2013 $12,300 23 Stellar Eagle 3/2013 6/2013 BSI* 38 Falcon 1/2013 1/2013 $8,000
9 Martin 1/2013 1/2013 $8,000 24 Crested Eagle 2/2013 5/2013 $11,000 39 Peregrine 6/2013 9/2013 $8,250
10 Kingfisher 1/2013 3/2013 $8,900 25 Crowned Eagle - - spot 40 Condor 1/2013 1/2013 voyage
11 Jay 1/2013 1/2013 voyage 26 Woodstar 1/2013 1/2013 voyage 41 Harrier 1/2013 1/2013 $7,250
12 Ibis Bulker 3/2013 7/2013 $17,650 27 Wren 1/2013 1/2013 $6,250 42 Hawk I 1/2013 1/2013 $6,500
13 Grebe Bulker 2/2013 6/2013 $17,650 28 Redwing 1/2013 1/2013 $7,500 43 Merlin 1/2013 1/2013 $8,500
14 Gannet Bulker 1/2013 1/2013 $17,650 29 Cardinal 1/2013 1/2013 $9,750 44 Sparrow 3/2013 5/2013 $7,500
15 Imperial Eagle 1/2013 2/2013 $8,250 30 Jaeger - - spot 45 Kite - - spot
*BSI= Baltic Supramax Index