
1 EERE Communications EERE Web Coordinators Meeting 10/15/2015.
Technical Report NREL/TP-7A2-47172 December 2009
E85 Dispenser Study K. Moriarty, C. Johnson, T. Sears, and P. Bergeron
National Renewable Energy Laboratory 1617 Cole Boulevard, Golden, Colorado 80401-3393 303-275-3000 • www.nrel.gov
NREL is a national laboratory of the U.S. Department of Energy Office of Energy Efficiency and Renewable Energy Operated by the Alliance for Sustainable Energy, LLC
Contract No. DE-AC36-08-GO28308
Technical Report NREL/TP-7A2-47172 December 2009
E85 Dispenser Study K. Moriarty, C. Johnson, T. Sears, and P. Bergeron
Prepared under Task No. BB07.7525
NOTICE
This report was prepared as an account of work sponsored by an agency of the United States government. Neither the United States government nor any agency thereof, nor any of their employees, makes any warranty, express or implied, or assumes any legal liability or responsibility for the accuracy, completeness, or usefulness of any information, apparatus, product, or process disclosed, or represents that its use would not infringe privately owned rights. Reference herein to any specific commercial product, process, or service by trade name, trademark, manufacturer, or otherwise does not necessarily constitute or imply its endorsement, recommendation, or favoring by the United States government or any agency thereof. The views and opinions of authors expressed herein do not necessarily state or reflect those of the United States government or any agency thereof.
Available electronically at http://www.osti.gov/bridge
Available for a processing fee to U.S. Department of Energy and its contractors, in paper, from:
U.S. Department of Energy Office of Scientific and Technical Information P.O. Box 62 Oak Ridge, TN 37831-0062 phone: 865.576.8401 fax: 865.576.5728 email: mailto:[email protected]
Available for sale to the public, in paper, from: U.S. Department of Commerce National Technical Information Service 5285 Port Royal Road Springfield, VA 22161 phone: 800.553.6847 fax: 703.605.6900 email: [email protected] online ordering: http://www.ntis.gov/ordering.htm
Printed on paper containing at least 50% wastepaper, including 20% postconsumer waste
iii
Executive Summary This study reviews E85 dispensing infrastructure advances and issues and evaluates the geographic concentration of flexible fuel vehicles (FFVs), E85 stations, ethanol production facilities, and E85 suppliers. Costs, space, financial incentives, and barriers to adding E85 fueling equipment at existing stations are also assessed.
This study found that E85 is increasingly available in the U.S. in half of the states; however, the other half have minimal or no E85 fueling options. Despite these gains, E85 is only available at 1% of U.S. gasoline stations. Ethanol production reached 9.5 billion gallons in 2008, but less than 1% is consumed as E85. FFVs have not reached a significant concentration in any county, metropolitan area, or state.
Summary of Findings • Flexible Fuel Vehicles (FFVs)
o Approximately 7.2 million FFVs (~3% of nation’s vehicles)
o Highest concentration of FFVs for any state is 4%
o Highest concentration of FFVs for any county is 9.5%
o 98% of U.S. counties have FFV concentrations of 5% or less
• E85 Stations in the U.S. o 1,928 stations (available at just over 1% of gasoline stations)
o 70% of stations are in 10 states
o 7 states have no stations; another 14 states have fewer than 10 stations
• Ethanol Production o 9.5 billion gallons (226 million barrels) produced in 2008 (gasoline consumption
in 2008 was 132 billion gallons, or 3.14 billion barrels)
o 213 existing and under-construction plants with annual capacity of 14.2 billion gallons (338 million barrels)
o Low-level ethanol blends of 10% or less represent 99% of U.S. ethanol consumption
o Proportion of ethanol sold as E85 is unknown but is less than 1% of all ethanol consumption
• E85 Suppliers and Wholesalers o 15 ethanol production facilities blend and market E85 at the plant gate
o Retail stations within a 100-mile radius of terminals/blenders terminating on Class I railroads are assumed to have access to E85
o ProTec Fuels and Magellan are the most significant E85 suppliers
• Retail Station Costs and Space o Costs to add a new tank and E85 dispensing equipment average $59,000
o Costs to convert an existing tank and add E85 dispensing equipment average $11,000
iv
Table of Contents Background and Current State of Ethanol Supply and Markets ............................................................ 1
Federal Renewable Fuel Standard .............................................................................................1 Flexible Fuel Vehicle Market Penetration ................................................................................................. 2
Description of Data ....................................................................................................................3 Geographic Regions ...................................................................................................................4 FFV Penetration in U.S. Counties..............................................................................................4
Infrastructure Market Penetration ............................................................................................................. 5 Implementation of E85 Infrastructure ........................................................................................9
Fueling Equipment ...............................................................................................................9 Space Limitations...............................................................................................................10
Wholesale Suppliers and Producers ....................................................................................................... 11 Distribution Issues ...................................................................................................................12
Financial Incentives for E85 Infrastructure ............................................................................................ 13 Federal Government .................................................................................................................13
Alternative Fuel Infrastructure Tax Credit ........................................................................13 Grants for E85 Infrastructure .............................................................................................14
States ........................................................................................................................................14 Grant Programs ..................................................................................................................15 Tax Credits .........................................................................................................................15 Laws Protecting Station Owners ........................................................................................16 Rebates ...............................................................................................................................16 Non-Monetary Incentives ..................................................................................................16
Barriers in the Marketplace ...................................................................................................................... 16 Vehicles....................................................................................................................................16 Infrastructure ............................................................................................................................16 Supply ......................................................................................................................................17 Dispenser certification .............................................................................................................17 E85 Pricing...............................................................................................................................17 Other Barriers ...........................................................................................................................18
Conclusions ............................................................................................................................................... 18 References ................................................................................................................................................. 20
v
List of Figures Figure 1. Historical ethanol plants and production. ........................................................................ 1 Figure 2. RFS fuel type requirements by year. ............................................................................... 2 Figure 3. Historical FFV sales by manufacturer. ............................................................................ 3 Figure 4. Flex-fuel vehicle penetration by county and MSA boundaries. ...................................... 5 Figure 5. Historical E85 stations. .................................................................................................... 6 Figure 6. Map of E85 fueling stations. ........................................................................................... 6 Figure 7. Space allocation for an average convenience store in an urban area. ........................... 10 Figure 8. Regions with high probability of retailer access to ethanol. ......................................... 12 List of Tables Table 1. Historical FFV Model Availability by Manufacturer and Yeara ...................................... 3 Table 2. Historical E85 Stations and Statesa ................................................................................... 7 Table 3. Summary of E85 Stations by PADD Regiona ................................................................... 8 Table 4. Cost of Adding E85 Equipment to Existing Gasoline Stationsa ..................................... 10 Table 5. E85 Prices and Equivalents Compared with Gasolinea .................................................. 17 Table 6. Regional E85 Prices and Equivalents Compared with Gasolinea ................................... 18
1
Background and Current State of Ethanol Supply and Markets
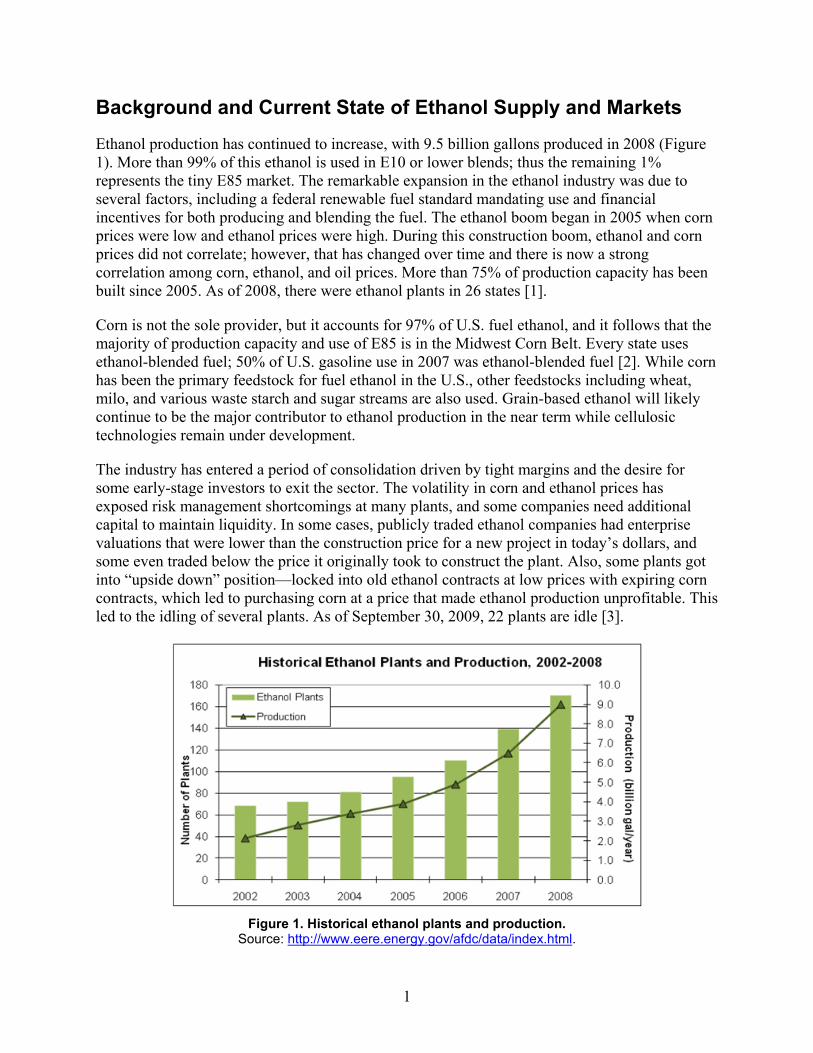
Ethanol production has continued to increase, with 9.5 billion gallons produced in 2008 (Figure 1). More than 99% of this ethanol is used in E10 or lower blends; thus the remaining 1% represents the tiny E85 market. The remarkable expansion in the ethanol industry was due to several factors, including a federal renewable fuel standard mandating use and financial incentives for both producing and blending the fuel. The ethanol boom began in 2005 when corn prices were low and ethanol prices were high. During this construction boom, ethanol and corn prices did not correlate; however, that has changed over time and there is now a strong correlation among corn, ethanol, and oil prices. More than 75% of production capacity has been built since 2005. As of 2008, there were ethanol plants in 26 states [1].
Corn is not the sole provider, but it accounts for 97% of U.S. fuel ethanol, and it follows that the majority of production capacity and use of E85 is in the Midwest Corn Belt. Every state uses ethanol-blended fuel; 50% of U.S. gasoline use in 2007 was ethanol-blended fuel [2]. While corn has been the primary feedstock for fuel ethanol in the U.S., other feedstocks including wheat, milo, and various waste starch and sugar streams are also used. Grain-based ethanol will likely continue to be the major contributor to ethanol production in the near term while cellulosic technologies remain under development.
The industry has entered a period of consolidation driven by tight margins and the desire for some early-stage investors to exit the sector. The volatility in corn and ethanol prices has exposed risk management shortcomings at many plants, and some companies need additional capital to maintain liquidity. In some cases, publicly traded ethanol companies had enterprise valuations that were lower than the construction price for a new project in today’s dollars, and some even traded below the price it originally took to construct the plant. Also, some plants got into “upside down” position—locked into old ethanol contracts at low prices with expiring corn contracts, which led to purchasing corn at a price that made ethanol production unprofitable. This led to the idling of several plants. As of September 30, 2009, 22 plants are idle [3].
Figure 1. Historical ethanol plants and production.
Source: http://www.eere.energy.gov/afdc/data/index.html.
2
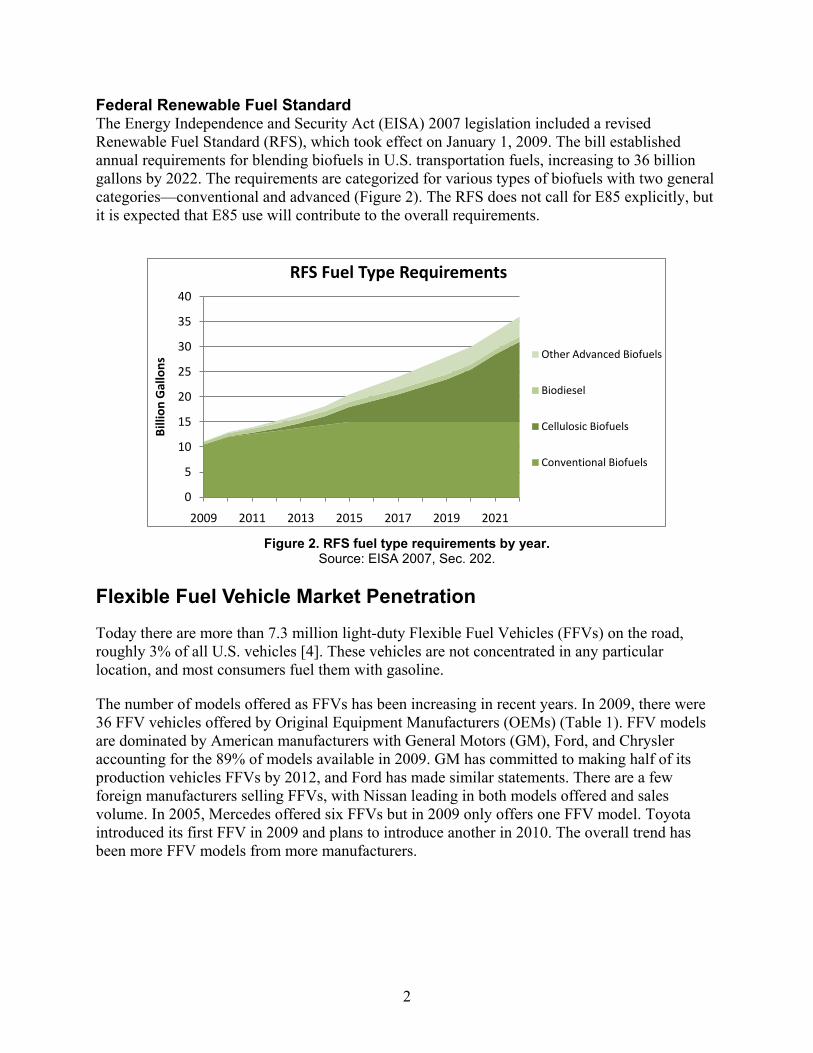
Federal Renewable Fuel Standard The Energy Independence and Security Act (EISA) 2007 legislation included a revised Renewable Fuel Standard (RFS), which took effect on January 1, 2009. The bill established annual requirements for blending biofuels in U.S. transportation fuels, increasing to 36 billion gallons by 2022. The requirements are categorized for various types of biofuels with two general categories—conventional and advanced (Figure 2). The RFS does not call for E85 explicitly, but it is expected that E85 use will contribute to the overall requirements.
Figure 2. RFS fuel type requirements by year.
Source: EISA 2007, Sec. 202. Flexible Fuel Vehicle Market Penetration
Today there are more than 7.3 million light-duty Flexible Fuel Vehicles (FFVs) on the road, roughly 3% of all U.S. vehicles [4]. These vehicles are not concentrated in any particular location, and most consumers fuel them with gasoline.
The number of models offered as FFVs has been increasing in recent years. In 2009, there were 36 FFV vehicles offered by Original Equipment Manufacturers (OEMs) (Table 1). FFV models are dominated by American manufacturers with General Motors (GM), Ford, and Chrysler accounting for the 89% of models available in 2009. GM has committed to making half of its production vehicles FFVs by 2012, and Ford has made similar statements. There are a few foreign manufacturers selling FFVs, with Nissan leading in both models offered and sales volume. In 2005, Mercedes offered six FFVs but in 2009 only offers one FFV model. Toyota introduced its first FFV in 2009 and plans to introduce another in 2010. The overall trend has been more FFV models from more manufacturers.
0
5
10
15
20
25
30
35
40
2009 2011 2013 2015 2017 2019 2021
Billi
on G
allo
ns
RFS Fuel Type Requirements
Other Advanced Biofuels
Biodiesel
Cellulosic Biofuels
Conventional Biofuels
3
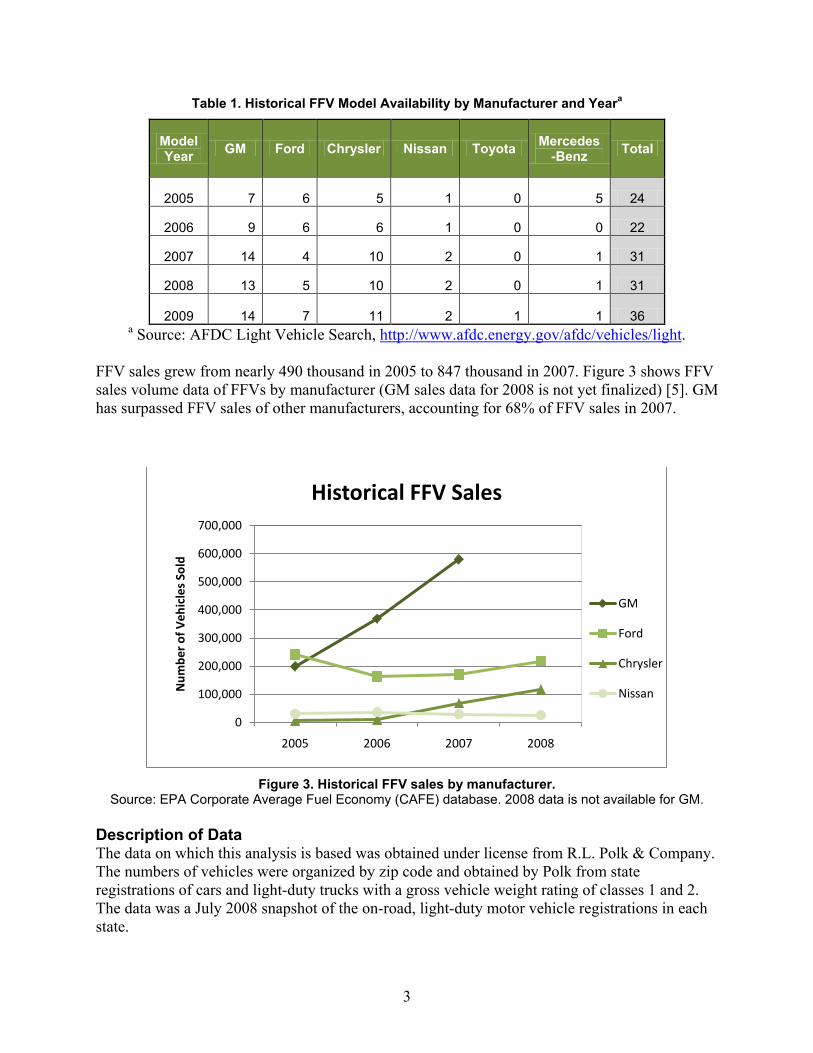
Table 1. Historical FFV Model Availability by Manufacturer and Yeara
Model Year GM Ford Chrysler Nissan Toyota Mercedes
-Benz Total
2005 7 6 5 1 0 5 24
2006 9 6 6 1 0 0 22
2007 14 4 10 2 0 1 31
2008 13 5 10 2 0 1 31
2009 14 7 11 2 1 1 36 a Source: AFDC Light Vehicle Search, http://www.afdc.energy.gov/afdc/vehicles/light.
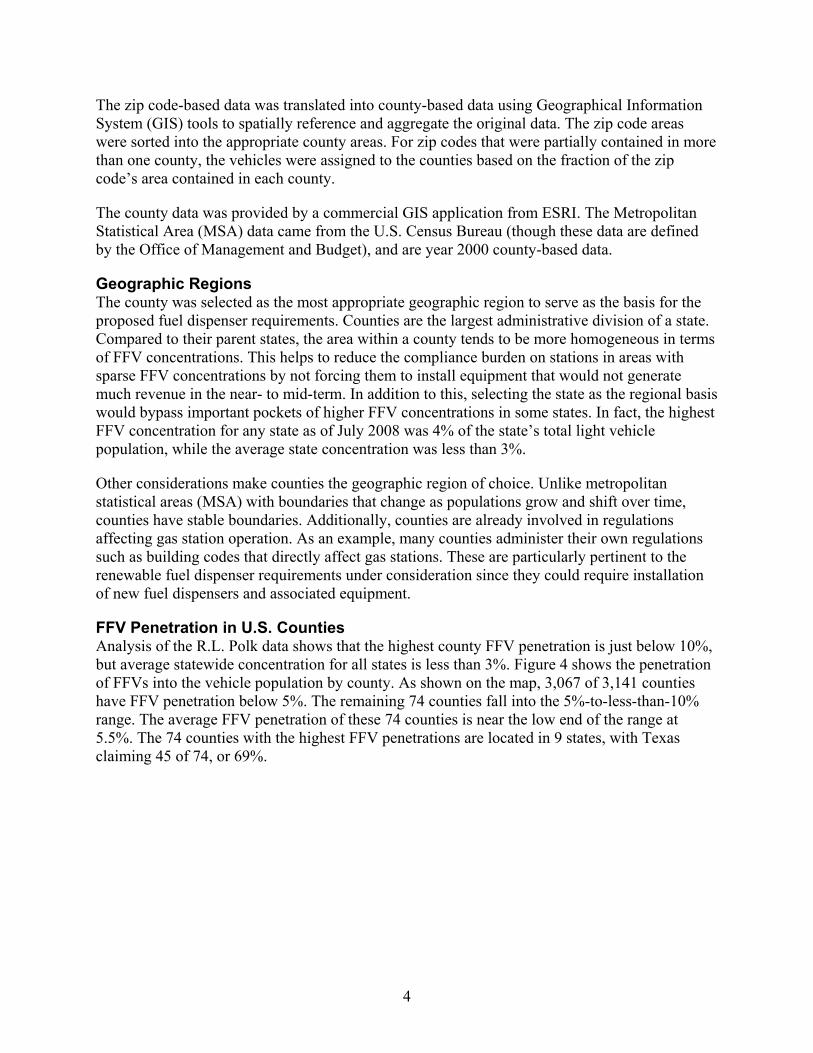
FFV sales grew from nearly 490 thousand in 2005 to 847 thousand in 2007. Figure 3 shows FFV sales volume data of FFVs by manufacturer (GM sales data for 2008 is not yet finalized) [5]. GM has surpassed FFV sales of other manufacturers, accounting for 68% of FFV sales in 2007.
Figure 3. Historical FFV sales by manufacturer.
Source: EPA Corporate Average Fuel Economy (CAFE) database. 2008 data is not available for GM. Description of Data The data on which this analysis is based was obtained under license from R.L. Polk & Company. The numbers of vehicles were organized by zip code and obtained by Polk from state registrations of cars and light-duty trucks with a gross vehicle weight rating of classes 1 and 2. The data was a July 2008 snapshot of the on-road, light-duty motor vehicle registrations in each state.
0
100,000
200,000
300,000
400,000
500,000
600,000
700,000
2005 2006 2007 2008
Num
ber o
f Veh
icle
s So
ld
Historical FFV Sales
GM
Ford
Chrysler
Nissan
4
The zip code-based data was translated into county-based data using Geographical Information System (GIS) tools to spatially reference and aggregate the original data. The zip code areas were sorted into the appropriate county areas. For zip codes that were partially contained in more than one county, the vehicles were assigned to the counties based on the fraction of the zip code’s area contained in each county.
The county data was provided by a commercial GIS application from ESRI. The Metropolitan Statistical Area (MSA) data came from the U.S. Census Bureau (though these data are defined by the Office of Management and Budget), and are year 2000 county-based data.
Geographic Regions The county was selected as the most appropriate geographic region to serve as the basis for the proposed fuel dispenser requirements. Counties are the largest administrative division of a state. Compared to their parent states, the area within a county tends to be more homogeneous in terms of FFV concentrations. This helps to reduce the compliance burden on stations in areas with sparse FFV concentrations by not forcing them to install equipment that would not generate much revenue in the near- to mid-term. In addition to this, selecting the state as the regional basis would bypass important pockets of higher FFV concentrations in some states. In fact, the highest FFV concentration for any state as of July 2008 was 4% of the state’s total light vehicle population, while the average state concentration was less than 3%.
Other considerations make counties the geographic region of choice. Unlike metropolitan statistical areas (MSA) with boundaries that change as populations grow and shift over time, counties have stable boundaries. Additionally, counties are already involved in regulations affecting gas station operation. As an example, many counties administer their own regulations such as building codes that directly affect gas stations. These are particularly pertinent to the renewable fuel dispenser requirements under consideration since they could require installation of new fuel dispensers and associated equipment.
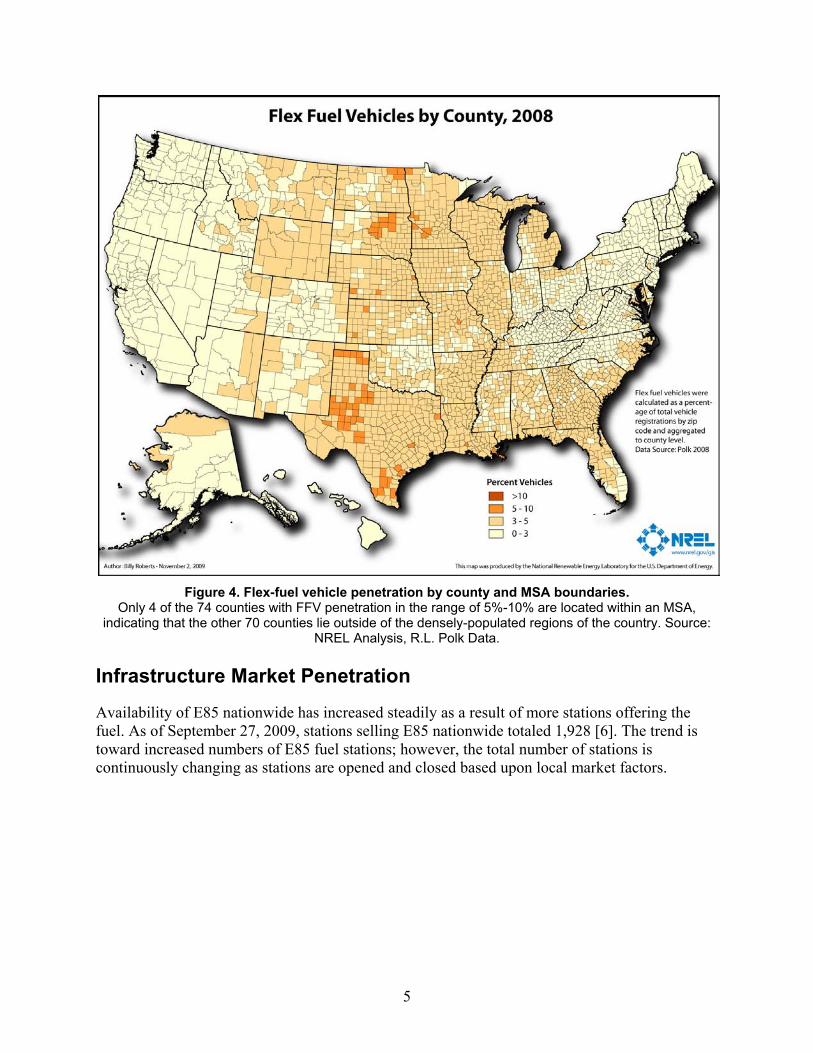
FFV Penetration in U.S. Counties Analysis of the R.L. Polk data shows that the highest county FFV penetration is just below 10%, but average statewide concentration for all states is less than 3%. Figure 4 shows the penetration of FFVs into the vehicle population by county. As shown on the map, 3,067 of 3,141 counties have FFV penetration below 5%. The remaining 74 counties fall into the 5%-to-less-than-10% range. The average FFV penetration of these 74 counties is near the low end of the range at 5.5%. The 74 counties with the highest FFV penetrations are located in 9 states, with Texas claiming 45 of 74, or 69%.
5
Figure 4. Flex-fuel vehicle penetration by county and MSA boundaries.
Only 4 of the 74 counties with FFV penetration in the range of 5%-10% are located within an MSA, indicating that the other 70 counties lie outside of the densely-populated regions of the country. Source:
NREL Analysis, R.L. Polk Data. Infrastructure Market Penetration
Availability of E85 nationwide has increased steadily as a result of more stations offering the fuel. As of September 27, 2009, stations selling E85 nationwide totaled 1,928 [6]. The trend is toward increased numbers of E85 fuel stations; however, the total number of stations is continuously changing as stations are opened and closed based upon local market factors.
6
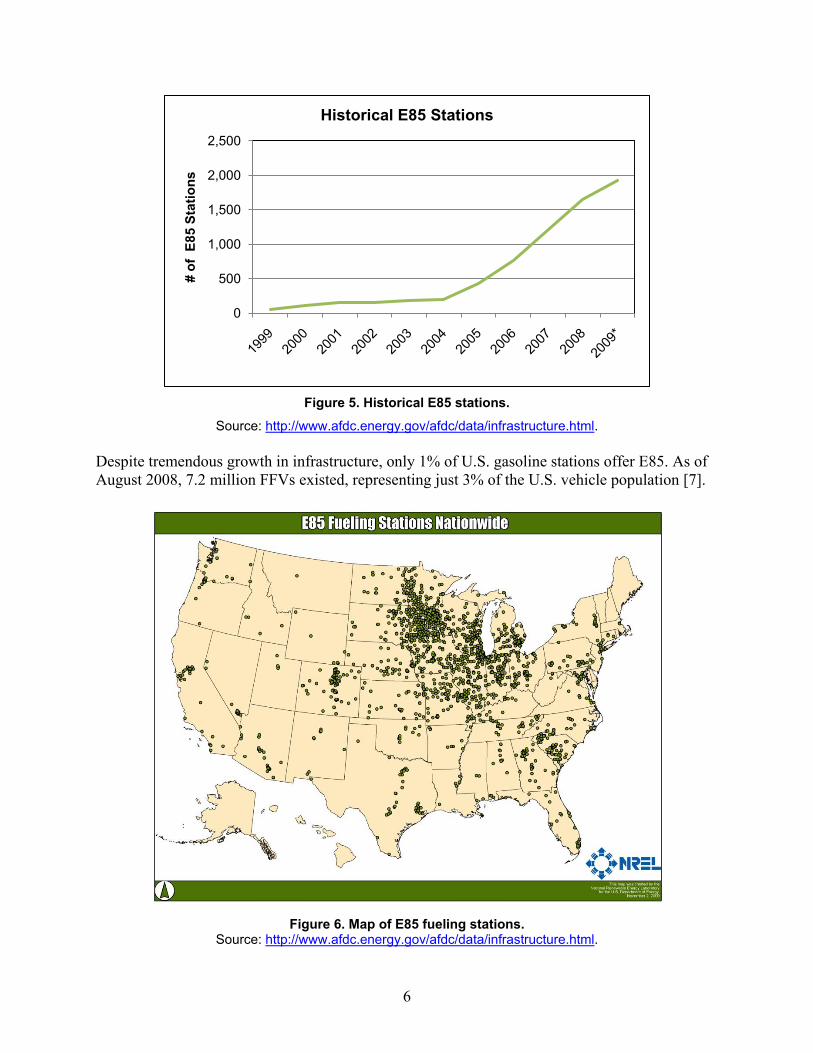
Figure 5. Historical E85 stations.
Source: http://www.afdc.energy.gov/afdc/data/infrastructure.html. Despite tremendous growth in infrastructure, only 1% of U.S. gasoline stations offer E85. As of August 2008, 7.2 million FFVs existed, representing just 3% of the U.S. vehicle population [7].
Figure 6. Map of E85 fueling stations.
Source: http://www.afdc.energy.gov/afdc/data/infrastructure.html.
0
500
1,000
1,500
2,000
2,500
# of
E85
Sta
tions
Historical E85 Stations
7
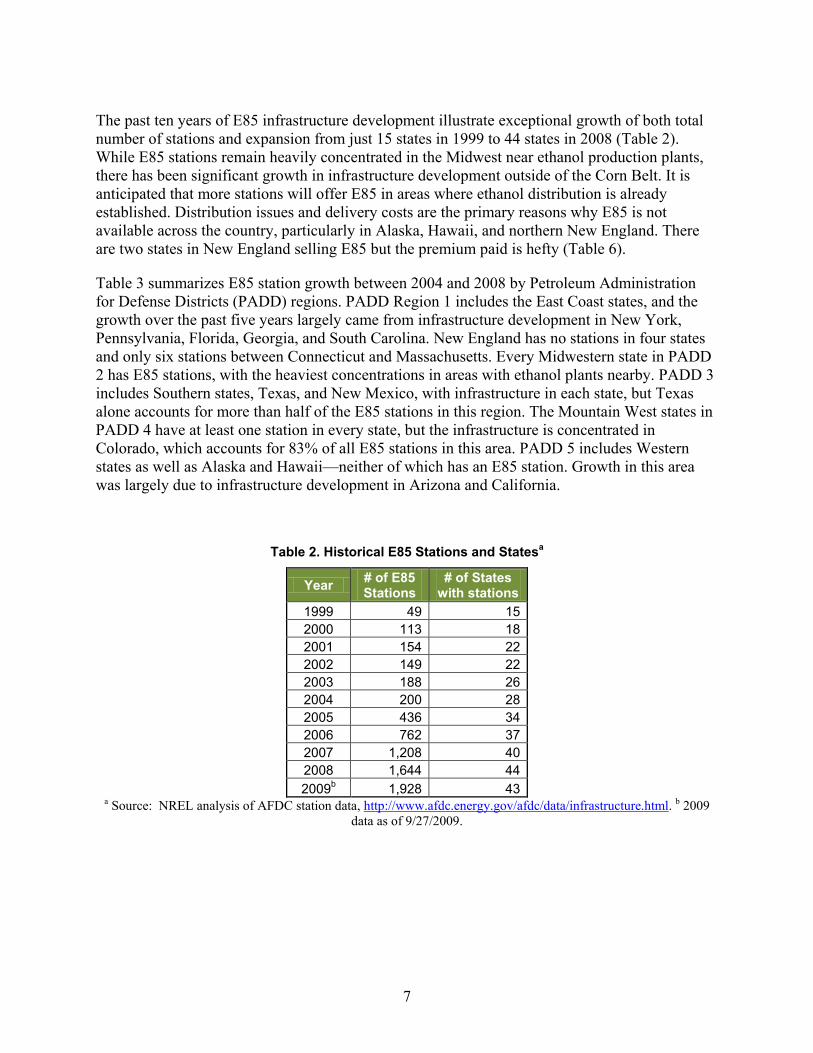
The past ten years of E85 infrastructure development illustrate exceptional growth of both total number of stations and expansion from just 15 states in 1999 to 44 states in 2008 (Table 2). While E85 stations remain heavily concentrated in the Midwest near ethanol production plants, there has been significant growth in infrastructure development outside of the Corn Belt. It is anticipated that more stations will offer E85 in areas where ethanol distribution is already established. Distribution issues and delivery costs are the primary reasons why E85 is not available across the country, particularly in Alaska, Hawaii, and northern New England. There are two states in New England selling E85 but the premium paid is hefty (Table 6).
Table 3 summarizes E85 station growth between 2004 and 2008 by Petroleum Administration for Defense Districts (PADD) regions. PADD Region 1 includes the East Coast states, and the growth over the past five years largely came from infrastructure development in New York, Pennsylvania, Florida, Georgia, and South Carolina. New England has no stations in four states and only six stations between Connecticut and Massachusetts. Every Midwestern state in PADD 2 has E85 stations, with the heaviest concentrations in areas with ethanol plants nearby. PADD 3 includes Southern states, Texas, and New Mexico, with infrastructure in each state, but Texas alone accounts for more than half of the E85 stations in this region. The Mountain West states in PADD 4 have at least one station in every state, but the infrastructure is concentrated in Colorado, which accounts for 83% of all E85 stations in this area. PADD 5 includes Western states as well as Alaska and Hawaii—neither of which has an E85 station. Growth in this area was largely due to infrastructure development in Arizona and California.
Table 2. Historical E85 Stations and Statesa
Year # of E85 Stations
# of States with stations
1999 49 15 2000 113 18 2001 154 22 2002 149 22 2003 188 26 2004 200 28 2005 436 34 2006 762 37 2007 1,208 40 2008 1,644 44 2009b 1,928 43
a Source: NREL analysis of AFDC station data, http://www.afdc.energy.gov/afdc/data/infrastructure.html. b 2009 data as of 9/27/2009.

8
Table 3. Summary of E85 Stations by PADD Regiona
E85 Station Trends 2004-2008
PADD Region 2004 2008 5 Year % change
PADD 1 CT, MN, MA, NH, RI, VT, DE, DC, MD, NJ, NY, PA, FL, GA, NC, SC, VA, WV 7 190 2714% PADD 2 IL, IN, IA, KS, KY, MI, MN, MO, NE, ND, OH, OK, SD, TN, WI 166 1,256 757% PADD 3 AL, AR, LA, MS, NM, TX 3 59 1967% PADD 4 CO, ID, MT, UT, WY 18 73 406% PADD 5 AK, AZ, CA, HI, NV, OR, WA 4 66 1650%
a Source: NREL analysis of AFDC station data, http://www.afdc.energy.gov/afdc/fuels/stations_counts.html. Per EISA, Congress may consider legislation requiring stations to supply E85 if FFV concentration exceeds 15% in a geographical region. This raises several questions in how to address and implement infrastructure needs to serve a geographic market that reaches the 15% FFV market penetration rate. What methods will be used to determine which stations are obligated to provide E85? Will it be sales volume, population areas, station location, or other metrics? Will all or some percentage of stations in an obligated geographic area be required to supply E85? Will the same methods be used to determine which stations are required to sell E85 in rural and urban areas?
According to the U.S. Geological Survey (USGS), there are 3,141 counties (inclusive of boroughs and census areas in Alaska, parishes in Louisiana, and 42 independent cities mostly in Virginia) [8]. According to NPN Petroleum and Convenience, there were 161,768 stations in 2008 [9]. Averaging these statistics results in approximately 50 stations per county, but it is unlikely that stations are dispersed uniformly. It is anticipated that stations are more concentrated in counties with higher populations. The investment for E85 infrastructure in an obligated community will be significant. A summary of average infrastructure costs is available later in this report.
While it will be some time before any counties reach 15% FFV concentration, it is interesting to look at the demographics of two counties that already have FFV concentrations above 5%. Lafayette Parish (county) in Louisiana is unique—this is the only county in the U.S. to have both a high overall number of FFVs (greater than 139 FFVs per 5 square miles: http://rpm.nrel.gov/transatlas/launch/) and a high penetration rate of FFVs as compared to all vehicles registered in Lafayette Parish (between 5% and 10%, Figure 4). The U.S. Census Bureau reports a 2008 population of 207,000 and land area of 270 square miles. A general search of Google Maps and Whitepages.com listed approximately 55 retail gas stations concentrated in two of the larger towns in the county. There are four E85 stations in Louisiana but none are located a reasonable distance from Lafayette. Another county that is among the 74 counties with the highest FFV penetration rate is Moore County, Texas (Figure 4). This is a rural county in northwest Texas with a population of 20,300 and a land area of 900 square miles. There are
9
approximately 15 gas stations, with all but two in one town. The closest E85 station is more than 50 miles away.
Implementation of E85 Infrastructure In addition to good penetration of FFVs in the area, there are two other key factors to the success of E85 infrastructure: proper refueling equipment, and an economical supply of E85.
Fueling Equipment E85 stations require at least one storage tank and one dispenser devoted to selling the fuel. Both have minimum requirements to serve E85.
• Tanks. The vast majority of underground storage tanks (UST) being used for petroleum-based fuels can also be used for E85 after proper conversion. Analysis has shown that converting a midgrade tank is the most cost effective; however, many types of tanks have been converted including premium, diesel, kerosene, and redundant regular gasoline tanks [10].
• Dispensers. Gasoline dispensers need to be converted or replaced to serve E85. The dispenser system must be approved by the local authority having jurisdiction (AHJ), typically a fire marshal. The AHJ dictates what components need to be replaced for proper conversion or whether a new dispenser is needed. The AHJs typically require UL-certified components, but the lack of listed equipment has resulted in AHJs approving E85 dispensers through other methods. However, OSHA regulations require that retailers use equipment listed by a “nationally recognized testing laboratory” (i.e., UL) and retailers are required to comply with all applicable laws and regulations to be in compliance with tank insurance policies, state fund requirements, bank loan covenants, and to be considered not-liable under negligence theory for any accidents that occur with the tank. Therefore, AHJs will likely require UL-certified dispensers once they are available.
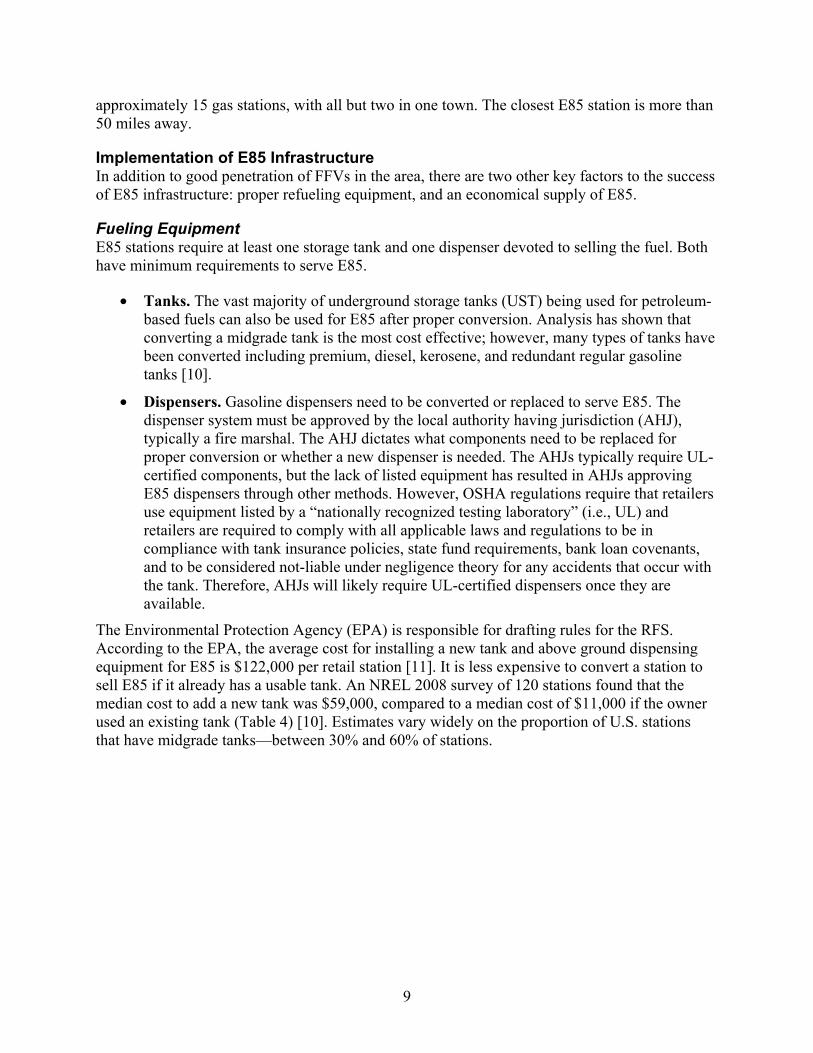
The Environmental Protection Agency (EPA) is responsible for drafting rules for the RFS. According to the EPA, the average cost for installing a new tank and above ground dispensing equipment for E85 is $122,000 per retail station [11]. It is less expensive to convert a station to sell E85 if it already has a usable tank. An NREL 2008 survey of 120 stations found that the median cost to add a new tank was $59,000, compared to a median cost of $11,000 if the owner used an existing tank (Table 4) [10]. Estimates vary widely on the proportion of U.S. stations that have midgrade tanks—between 30% and 60% of stations.
10
Table 4. Cost of Adding E85 Equipment to Existing Gasoline Stationsa
Generalized Cost Estimates for E85 Equipment at Existing Stations Scenario Cost Source Description Major Variables
Affecting Cost
New tank, new or retrofit dispenser(s)
Mean: $71,735 Median: $59,153 NREL Survey
Includes new underground storage tank (UST), pump, dispenser(s), piping, electric, excavation, and concrete work
Dispenser needs, concrete work, excavation, sell-backs, canopy, tank size, location, labor cost, regulations
$50K-$200K NACS $50K-$70K DOT, EPA, DOE >$50K NEVC <$62,407 DAI
Convert existing tank, new or retrofit dispenser(s)
Mean: $21,244 Median: $10,972 NREL Survey Tank cleaning, replace
non-compatible components in piping and dispensers
Dispenser needs, # of non-compatible components, location, labor cost, regulations
$19K to $30K DAI
$5K-$30K DOT, EPA, DOE
$2.5-25K NEVC a Source: Cost of Adding E85 Fueling Capability to Existing Gasoline Stations: NREL Survey and Literature
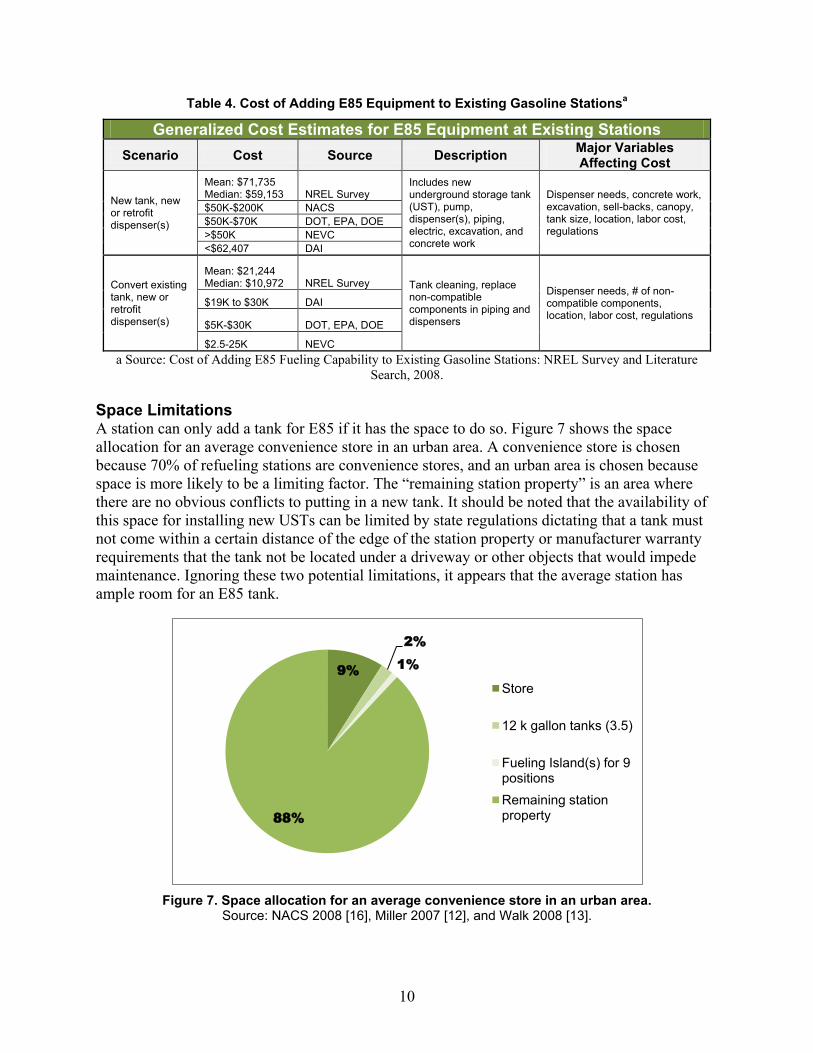
Search, 2008. Space Limitations A station can only add a tank for E85 if it has the space to do so. Figure 7 shows the space allocation for an average convenience store in an urban area. A convenience store is chosen because 70% of refueling stations are convenience stores, and an urban area is chosen because space is more likely to be a limiting factor. The “remaining station property” is an area where there are no obvious conflicts to putting in a new tank. It should be noted that the availability of this space for installing new USTs can be limited by state regulations dictating that a tank must not come within a certain distance of the edge of the station property or manufacturer warranty requirements that the tank not be located under a driveway or other objects that would impede maintenance. Ignoring these two potential limitations, it appears that the average station has ample room for an E85 tank.
Figure 7. Space allocation for an average convenience store in an urban area.
Source: NACS 2008 [16], Miller 2007 [12], and Walk 2008 [13].
9%
2%1%
88%
Store
12 k gallon tanks (3.5)
Fueling Island(s) for 9 positionsRemaining station property
11
Wholesale Suppliers and Producers
The Internal Revenue Service (IRS) maintains a list of active petroleum terminals for taxation purposes, which reflects that every state has bulk terminals and many states have multiple blenders that may be capable of supplying E85 [14]. The majority of ethanol is shipped by rail to blending terminals. Smaller amounts are shipped by truck and barge [15]. Ethanol is commonly delivered to terminals and splash-blended with gasoline to make E85. In some cases, and usually at ethanol plants directly marketing E85, the splash-blending takes place in the railcar. ProTec Fuels and Magellan Midstream Partners are the primary suppliers of E85 in the nation. ProTec markets the fuel from 27 of their terminals and Magellan from 20. There are 15 ethanol plants that blend and market E85 at their facility. The only states that appear to have multiple E85 suppliers in the same locations are Iowa and Minnesota.
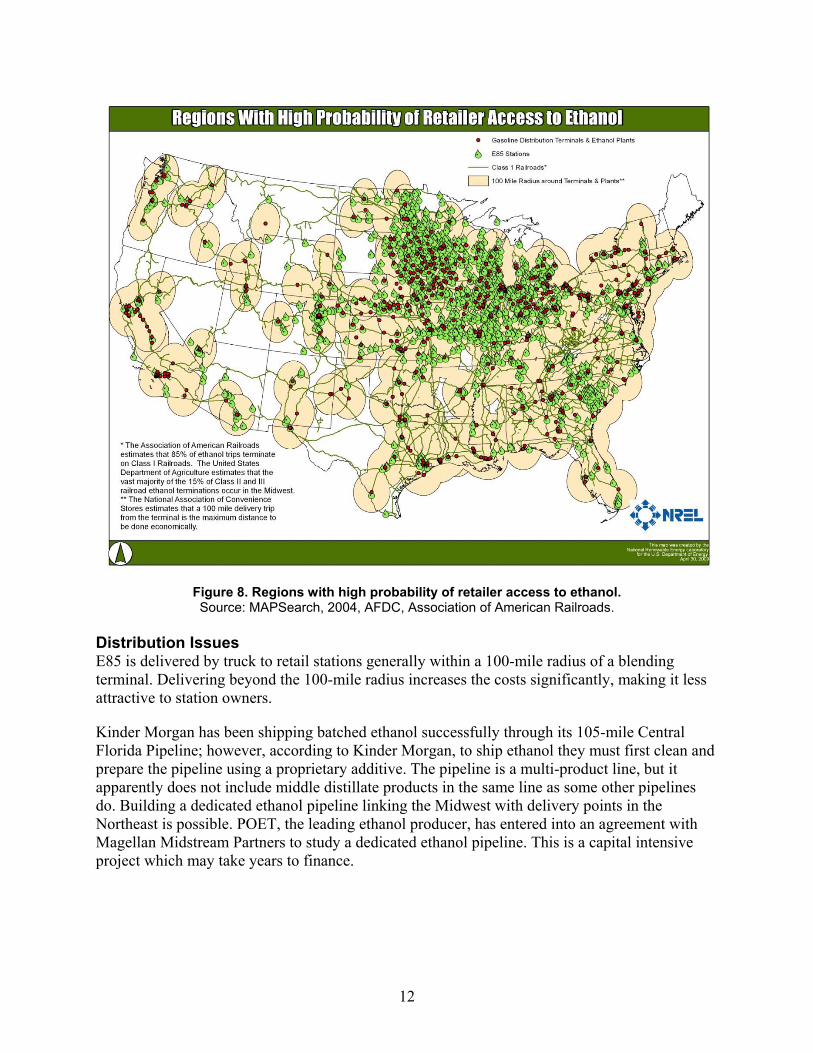
The reasoning below was used to identify areas that likely have access to E85 and areas where it is difficult or expensive to obtain. These locations are estimated in Figure 8 based on the following rationale:
• Ninety percent of ethanol is transported by train or truck [15]. The portion that is transported by truck is assumed to stay within a 100-mile radius of ethanol plants due to fuel shipping costs. Therefore, ethanol plants and their 100-mile radii were added to the map.
• E85 is difficult or expensive to obtain if delivery trucks need to travel a long distance from a distribution petroleum terminal that blends ethanol to the retail station. In general, the petroleum-retail industry considers 100 miles the upper limit for economical delivery [16]. This distance is confirmed by the map for all but 14 E85 stations (12 of which were marginal in their distance beyond 100 miles).
• More than 85% of the ethanol railroad trips from ethanol plants to terminals terminate on Class I railroads [17-18]. Therefore, only terminals with ethanol-blending capabilities on Class I railroads were included.
• The availability of E85 in the regions around these terminals and plants was determined by mapping existing E85 stations. Terminals with no E85 stations within 100 miles were removed under the assumption that they did not offer E85.
• Twelve E85 stations were located just outside the 100-mile radius of a terminal, and two stations were located far away from any mapped terminals. These two stations were contacted, and each obtains fuel from a terminal in Bozeman, Montana. This terminal was added to the map despite the fact that it is on a Class II railroad instead of Class I.
The resulting shaded areas on the map shows regions where E85 is probably available to refueling stations, and the white area shows where E85 is probably too expensive or too logistically challenging for stations to offer E85. These assumptions indicate that E85 should be available to 95% of the population.
12
Figure 8. Regions with high probability of retailer access to ethanol. Source: MAPSearch, 2004, AFDC, Association of American Railroads.
Distribution Issues E85 is delivered by truck to retail stations generally within a 100-mile radius of a blending terminal. Delivering beyond the 100-mile radius increases the costs significantly, making it less attractive to station owners.
Kinder Morgan has been shipping batched ethanol successfully through its 105-mile Central Florida Pipeline; however, according to Kinder Morgan, to ship ethanol they must first clean and prepare the pipeline using a proprietary additive. The pipeline is a multi-product line, but it apparently does not include middle distillate products in the same line as some other pipelines do. Building a dedicated ethanol pipeline linking the Midwest with delivery points in the Northeast is possible. POET, the leading ethanol producer, has entered into an agreement with Magellan Midstream Partners to study a dedicated ethanol pipeline. This is a capital intensive project which may take years to finance.
13
Financial Incentives for E85 Infrastructure
There are numerous sources of funding available to assist in the development and growth of E85 infrastructure, all varying greatly in form and function. The sources tend to fall into the categories of federal government, state government, and industry or non-profit entity-funded, each of which seek to induce investment to build and operate E85 infrastructure. The funding is typically in the form of tax incentives, grants, and technical assistance, although other financial vehicles are in place, including funding agreements, loans, rebates, and small business programs.
While it is clear that funding sources exist, identifying appropriate funding sources on a case-by-case basis is less apparent. There is no single source, or clearinghouse, of such information. The following summary provides examples of existing funding opportunities.
An exact figure of overall funding available is not possible to identify with a significant degree of accuracy because, for example, total funds issued through tax incentives are not readily calculable across diverse programs, and loan programs across states do not open and close simultaneously. Additionally, financial information is not available for numerous loan, grant, and incentive programs that have already closed. Funding opportunities that are open have provided neither the number of projects nor the size of the awards. Further, much of the funding for existing programs has not been delivered to potential recipients or applicants for funding, as due dates for applications are on a rolling basis.
Federal Government Several federal income tax incentives support ethanol fuel consumption and the development of U.S. ethanol infrastructure, although these incentives provide significantly less support than do ethanol production tax incentives and blending tax credits. While these demand-side incentives, such as tax credits for infrastructure and consumer vehicles, are small in comparison to those that encourage production, the tax provisions nonetheless have a positive impact on nurturing demand, with demonstrated success.
In terms of federal incentives, there are several clear options for those interested in subsidized E85 infrastructure.
Alternative Fuel Infrastructure Tax Credit A tax credit is available for the cost of installing alternative fueling equipment placed into service after December 31, 2005. The Energy Policy Act of 2005 (EPAct 2005, P.L. 109-58, § 1342) (26 USC 30C) created an income tax credit for up to 30 percent of the cost, up to $30,000 maximum, to establish alternative fuel infrastructure placed into service after December 31, 2005 and before January 1, 2009. Pursuant to the American Recovery and Reinvestment Act of 2009 (Pub. L. No. 111-5, §1123), for property placed in service during 2009 and 2010 the credit is worth $50,000 or 50 percent of cost (whichever is less). Fueling station owners who install qualified equipment at multiple sites are allowed to use the credit toward each location. The credit, unless extended, expires December 31, 2010 for eligible fuel types, the list of which includes E85.
14
Grants for E85 Infrastructure Historically, the U.S. Department of Energy (DOE) Clean Cities Program has been the chief federal catalyst for the deployment of E85 infrastructure. Between 1999 and 2006, Clean Cities provided $11 million in grants to 33 states to install biofuels infrastructure. Clean Cities’ criteria for awarding the grants include, for example, the ability of the grantee to (1) access and dispense a significant amount of biofuel, and (2) share at least 50 percent of the project costs, as well as the grantee’s record of past success with alternative fuel infrastructure development. The $7.2 million in 2006 grants, with private and state or local cost sharing, resulted in biofuel blending infrastructure being added in 9 states, and biofuel dispensers, primarily for E85, being installed in 210 locations in 21 states, such as California, Colorado, Georgia, and Iowa. In August 2009, DOE’s Clean Cities program announced the selection of 25 cost-share projects that will be funded with nearly $300 million from the American Recovery and Reinvestment Act. While not all of the funding is going toward E85 projects, 6 of the 25 projects explicitly involve funding for new E85 fueling infrastructure.
Although this provision has never received funding, Section 244 of The Energy Independence and Security Act of 2007 (P.L. 110-140) authorizes DOE to establish a new program for making grants and providing assistance to retail and wholesale fuel dealers for the installation, replacement, or conversion of fuel storage and dispensing equipment. In 2009, DOE posted an opportunity to apply for funding to finance biofuels fueling stations. One area of interest for this grant is for refueling infrastructure projects that include new dispensing facilities or additional equipment or upgrades and improvements to existing refueling sites for Alternative Fuel Vehicles (AFVs). This includes upgrading or modifying private fueling stations to allow public and/or shared fleet access.
States U.S. state governments collectively offer scores of financial incentives and favorable regulatory policies that promote the use of alternative fuels. These programs include industry recruitment incentives, corporate tax credits, net metering policies, grants, loan programs, rebate programs, personal tax credits, sales tax exemptions, property tax exemptions, and production incentives.
Overall, all states offer incentives that affect the deployment of E85 in some way, many simply through the promotion of E85 production and/or sales. Sixty percent of states are significantly invested in supporting E85 through grants, loans, or tax incentives for E85 infrastructure, while other states do not propose as much outward investment in E85 infrastructure itself. The variety of incentives is vast; however, the efficacy of many of the incentives may be questionable, or at least contingent on external factors. For example, Minnesota has experience with several forms of incentives that are intended to boost E85 use in the state, including producer incentives, a state mandate requiring 10% ethanol blend at all service stations, and a grant program supporting E85 pump installations. Nonetheless, the state has had some difficulty in generating staying power for the E85 pump installations, with numerous E85 outlets folding the E85 portion of their business as quickly as the state is offering support (up to $15,000 per fueling station) to other stations to begin offering E85. The difficulty appears to be related to the price of conventional gasoline fuel, which when above $4.00/gallon led to a surge in funding requests. The drop in gasoline prices in 2008-2009 is believed to be responsible for the closing of existing E85 infrastructure.
15
Grant Programs Certain states have provided significant funding through grant programs to install E85 fuel dispensers, including blender pumps, at fueling stations.
Michigan: The Michigan Energy Office through its Biofuel Infrastructure Grant Incentive Program provides E85 conversion grants for travel routes of consumer and fleet vehicles (grants up to $5,000 per facility are available in 2009). There is an additional matching grant program to assist retail stations in converting existing fuel delivery systems to provide E85 (covers up to 75% of costs up to $3,000). There are also grants available to assist in costs for new fuel delivery E85 systems at retail stations (50% up to $12,000 per facility and sales for three years or portion of grant must be repaid).
Iowa: An infrastructure program awards grants to station owners to help cover costs of installing E85 dispensers and blender pumps (70% of the installation costs up to $50,000 for a 5-year contract).
South Dakota: There is a state grant program available to station owners to assist in the purchase and installation of ethanol blender pumps with a goal of adding 100 new pumps in one year. Station owners may receive $2,500 from the South Dakota Corn Utilization Council and $2,500 from the ethanol industry to purchase the pumps.
Illinois: The Illinois Department of Commerce and Economic Opportunity administered grants from a private foundation funding the addition of 64 E85 dispensers.
Tennessee: The Tennessee Department of Transportation (TDOT), as part of the Governor’s Alternative Fuels Working Group, provides infrastructure assistance that includes $1.5 million to establish fueling sites not more than 100 miles apart along the state’s highways and major corridors.
Ohio: The State of Ohio’s Alternative Fuel Transportation Grant Program provides up to $1 million for E85 infrastructure.
New York: The state has a $10 million grant program to assist private retail stations in installing fuel pumps for ethanol.
Tax Credits Some states have implemented fueling station tax credit incentives. Examples include:
South Carolina: Beginning January 1, 2008, a tax credit of up to 25% of construction and installation costs for retail pumps dispensing E85 blends is available. The credit must be taken in three equal installments beginning with the taxable year in which the equipment is placed into service.
Ohio: A tax Credit and Infrastructure incentive at a rate of 13 cents per gallon of fuel dispensed in 2008.
Idaho: There is a 6% investment tax credit available to any Idaho retail fuel dealer or distributor investing in biofuels infrastructure for selling fuel blends with at least 10 percent ethanol. The
16
credit allowed cannot exceed 50% of the income tax liability of the taxpayer, and the biofuels must be sold over a period of five years. It expires January 1, 2012.
Michigan: There is a tax incentive in the amount of 30% of conversion cost after receiving the $5,000 grant incentive, noted above.
Laws Protecting Station Owners Some states have enacted legislation that prevents a fueling station from being treated punitively for installing E85 infrastructure. New York has a law prohibiting exclusivity contracts between fuel distributors and fuel stations—this presumably allows retailers the flexibility to offer E85. South Dakota has an E85 franchise restriction protection that gives retail station owners the ability to convert to or add E85 infrastructure.
Rebates Rebates can appear in many forms. For example, The State of Michigan offers a Biofuel Signage Rebate to cover up to 50% of costs to design, install, and pay the first year's annual fee for signage. Illinois offers rebates related to E85 use.
Non-Monetary Incentives Also noteworthy are non-monetary incentives for E85 use. Numerous states have enacted provisions that allow such items to serve as incentives for the purchase or acquisition of such vehicles, and by association the need for additional E85 infrastructure. Some of these non-monetary incentives include access to high-occupancy vehicle (HOV) lanes for E85 vehicles that do not have more than one passenger and parking privileges for such vehicles at locations that might otherwise require payment for parking.
Barriers in the Marketplace
Numerous barriers to the widespread use of E85 are several of these key challenges are summarized in this section.
Vehicles The low concentration of FFVs in the United States makes it difficult to build a demand case for E85 in any given location. Additionally, the reduced volumetric fuel economy when operating on E85 and the price of E85 (when taking energy content into account) can make the use of E85 less attractive to consumers because they may have to pay more for fuel and refuel more often.
Infrastructure Distribution issues and limited availability of E85 at terminals limits the geographic locations of E85 stations. While the map in Figure 8 shows that many areas should have access to ethanol, there may be issues with sufficient storage and handling equipment to accommodate the fuel. In addition, low E85 fuel sales volumes to date make it difficult for retailers to justify a good business case for installing more expensive E85 equipment, especially if it will take the place of a high volume gasoline or diesel sales position on the fueling island.
17
Supply The RFS sets a limit for the amount of corn-starch ethanol that can be blended into gasoline to meet the specified requirements, and current production capacity is at that limit. Therefore, future growth should come from cellulosic ethanol production, which is still in the research and demonstration phase. Terminals that offer E85 are limited, and transportation of fuel to these terminals from production facilities via rail or truck is costly and limits geographic distribution.
Dispenser certification Currently, there are no E85 dispensers available from manufacturers that have been safety certified or listed by a national safety testing organization such as Underwriters Laboratory (UL). Most installations to date have been done under a waiver or with special permission from the local fire marshal (or other authorities having jurisdiction). This complicates the process considerably and has been a barrier to widespread implementation, especially in urban and metropolitan areas that have strict construction and safety-permitting procedures. This uncertainty regarding the use of non-safety-listed equipment may also impact a retailer’s liability insurance.
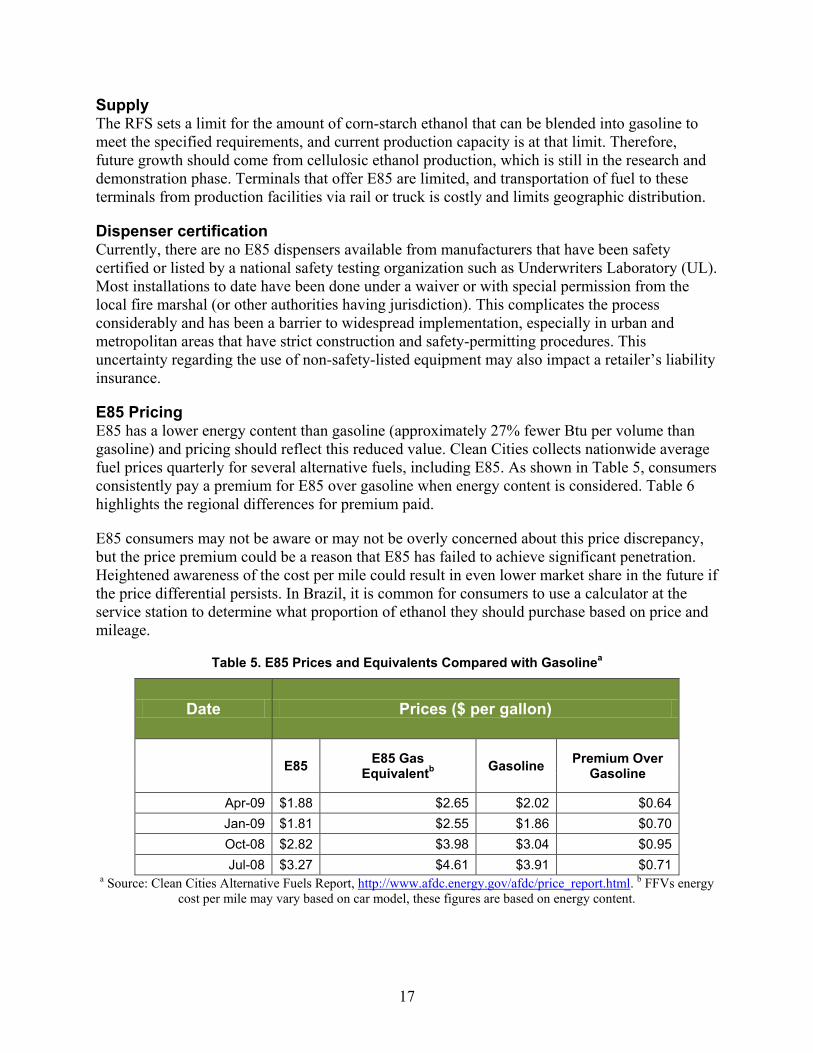
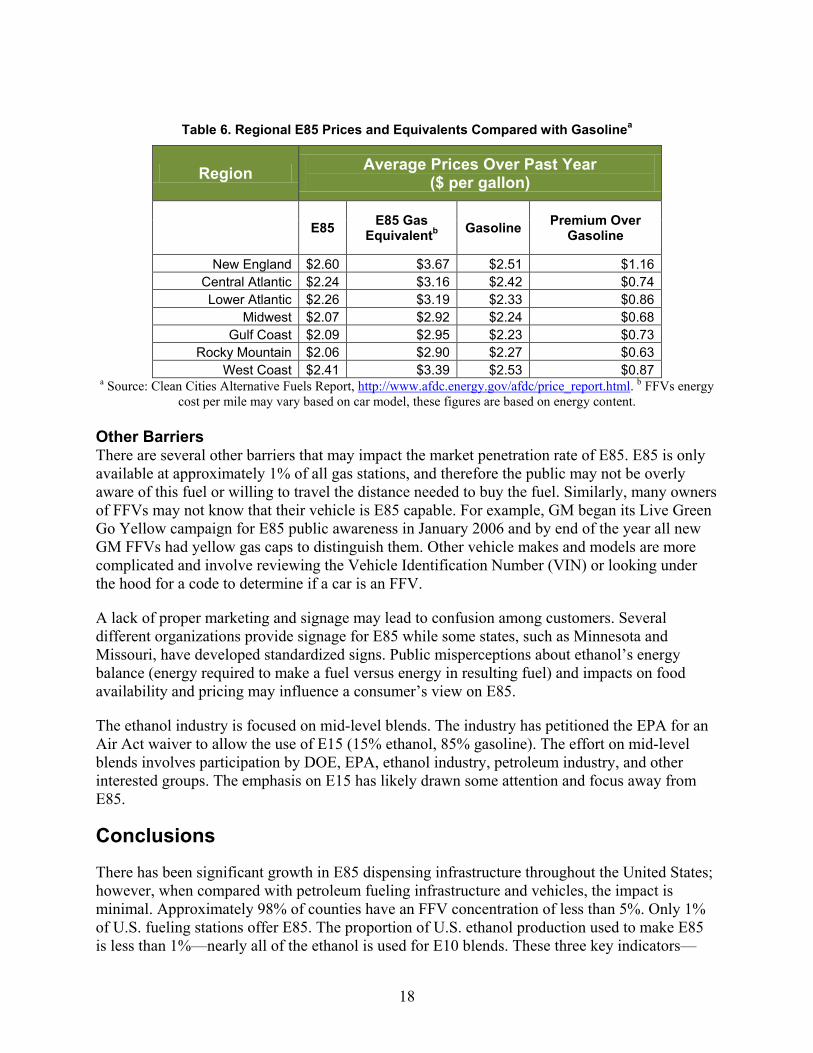
E85 Pricing E85 has a lower energy content than gasoline (approximately 27% fewer Btu per volume than gasoline) and pricing should reflect this reduced value. Clean Cities collects nationwide average fuel prices quarterly for several alternative fuels, including E85. As shown in Table 5, consumers consistently pay a premium for E85 over gasoline when energy content is considered. Table 6 highlights the regional differences for premium paid.
E85 consumers may not be aware or may not be overly concerned about this price discrepancy, but the price premium could be a reason that E85 has failed to achieve significant penetration. Heightened awareness of the cost per mile could result in even lower market share in the future if the price differential persists. In Brazil, it is common for consumers to use a calculator at the service station to determine what proportion of ethanol they should purchase based on price and mileage.
Table 5. E85 Prices and Equivalents Compared with Gasolinea
Date Prices ($ per gallon)
E85 E85 Gas
Equivalentb Gasoline Premium Over Gasoline
Apr-09 $1.88 $2.65 $2.02 $0.64 Jan-09 $1.81 $2.55 $1.86 $0.70 Oct-08 $2.82 $3.98 $3.04 $0.95 Jul-08 $3.27 $4.61 $3.91 $0.71
a Source: Clean Cities Alternative Fuels Report, http://www.afdc.energy.gov/afdc/price_report.html. b FFVs energy cost per mile may vary based on car model, these figures are based on energy content.
18
Table 6. Regional E85 Prices and Equivalents Compared with Gasolinea
Region Average Prices Over Past Year ($ per gallon)
E85 E85 Gas
Equivalentb Gasoline Premium Over Gasoline
New England $2.60 $3.67 $2.51 $1.16 Central Atlantic $2.24 $3.16 $2.42 $0.74 Lower Atlantic $2.26 $3.19 $2.33 $0.86
Midwest $2.07 $2.92 $2.24 $0.68 Gulf Coast $2.09 $2.95 $2.23 $0.73
Rocky Mountain $2.06 $2.90 $2.27 $0.63 West Coast $2.41 $3.39 $2.53 $0.87
a Source: Clean Cities Alternative Fuels Report, http://www.afdc.energy.gov/afdc/price_report.html. b FFVs energy cost per mile may vary based on car model, these figures are based on energy content.
Other Barriers There are several other barriers that may impact the market penetration rate of E85. E85 is only available at approximately 1% of all gas stations, and therefore the public may not be overly aware of this fuel or willing to travel the distance needed to buy the fuel. Similarly, many owners of FFVs may not know that their vehicle is E85 capable. For example, GM began its Live Green Go Yellow campaign for E85 public awareness in January 2006 and by end of the year all new GM FFVs had yellow gas caps to distinguish them. Other vehicle makes and models are more complicated and involve reviewing the Vehicle Identification Number (VIN) or looking under the hood for a code to determine if a car is an FFV.
A lack of proper marketing and signage may lead to confusion among customers. Several different organizations provide signage for E85 while some states, such as Minnesota and Missouri, have developed standardized signs. Public misperceptions about ethanol’s energy balance (energy required to make a fuel versus energy in resulting fuel) and impacts on food availability and pricing may influence a consumer’s view on E85.
The ethanol industry is focused on mid-level blends. The industry has petitioned the EPA for an Air Act waiver to allow the use of E15 (15% ethanol, 85% gasoline). The effort on mid-level blends involves participation by DOE, EPA, ethanol industry, petroleum industry, and other interested groups. The emphasis on E15 has likely drawn some attention and focus away from E85.
Conclusions
There has been significant growth in E85 dispensing infrastructure throughout the United States; however, when compared with petroleum fueling infrastructure and vehicles, the impact is minimal. Approximately 98% of counties have an FFV concentration of less than 5%. Only 1% of U.S. fueling stations offer E85. The proportion of U.S. ethanol production used to make E85 is less than 1%—nearly all of the ethanol is used for E10 blends. These three key indicators—
19
FFV concentration, E85 station counts, and ethanol production dedicated to E85—indicate that it will be some time before E85 is viewed as a high volume transportation fuel.
The majority of retail stations are independently owned by a single owner. These station owners may not have knowledge of grants and other incentives available for the installation of E85 infrastructure. Retail station owners are probably uncertain of the investment, especially since the average profit per station is $36,000 and costs for E85 infrastructure average $11,000 for converting a tank and $59,000 for installing a new tank and these costs could be even higher, as indicated by a recent EPA study in support of rule making for RFS [10-11]. Tax incentives are usually recouped over a few years and may not be incentive enough for a station to install E85 dispensing equipment.
20
References
1. Renewable Fuels Association. 2009 Ethanol Industry Outlook. Washington, DC: Renewable Fuels Association, February 2009; p. 2. Available at http://www.ethanolrfa.org/objects/pdf/outlook/RFA_Outlook_2009.pdf.
2. Renewable Fuels Association. 2008 Ethanol Industry Outlook. Washington, DC: Renewable Fuels Association, February 2008; p. 4. Available at http://www.ethanolrfa.org/objects/pdf/outlook/RFA_Outlook_2008.pdf.
3. “Biorefinery Locations.” Renewable Fuels Association online, http://www.ethanolrfa.org/industry/locations. Accessed September 30, 2009.
4. “Fuels.”Alternative Fuels and Advanced Vehicles Data Center online, http://www.afdc.energy.gov/afdc/data/fuels.html. Accessed September 9, 2009.
5. FFV sales volume. EPA CAFE Database 2005, 2006, 2007, 2008.
6. “Alternative Fueling Station Total Counts by State and Fuel Type.” Alternative Fuels and Advanced Vehicles Data Center online, http://www.afdc.energy.gov/afdc/fuels/stations_counts.html. Accessed September 27, 2009.
7. “Vehicles: Light-Duty E85 FFVs in Use.” Alternative Fuels and Advanced Vehicles Data Center online, http://www.afdc.energy.gov/afdc/data/vehicles.html. Updated August 22, 2008.
8. “Frequently Asked Questions.” U.S. Geological Survey (USGS) online, http://www.usgs.gov/faq/faq.asp?id=785&category_id=31. Accessed September 29, 2009.
9. NPN Petroleum & Convenience. “NPN MarketFacts 2008.” NPN Magazine online, http://www.npnweb.com/ME2/dirmod.asp?sid=A79131211D8846B1A33169AF72F78511&type=gen&mod=Core+Pages&gid=CD6098BB12AF47B7AF6FFC9DF4DAE988. Accessed September 29, 2009.
10. Johnson, C.; Melendez, M. E85 Retail Business Case: When and Why to Sell. NREL/TP-540-41590. Golden, CO: National Renewable Energy Laboratory, December 2007.
11. Environmental Protection Agency. Renewable Fuel Standard Program: Draft Regulatory Impact Analysis. EPA420-D-06-008. Washington, DC: U.S. Environmental Protection Agency, September 2006. Available at http://www.epa.gov/oms/renewablefuels/420d06008.pdf.
12. Miller, P. Personal communication. U.S. Environmental Protection Agency Office of Underground Storage Tanks, Washington, DC, 29 March 2007.
13. Walk, S. Personal communication. Protec Fuel Management, Boca Raton, FL, 9 March 2009.
14. “Active Fuel Terminals.” Internal Revenue Service (IRS) online, http://www.irs.gov/pub/irs-utl/tcn_db.pdf. Accessed July 31, 2009.
21
15. Denicoff, M.R. Ethanol Transportation Backgrounder—Expansion of U.S. Corn-based Ethanol from the Agricultural Transportation Perspective. Washington, DC: U.S. Department of Agriculture Agricultural Marketing Service, September 2007; p. 21. Available at www.ams.usda.gov/AMSv1.0/getfile?dDocName=STELPRDC5063605&acct=atpub.
16. NACS. NACS State of the Industry Annual Report Convenience & Petroleum Retailing Totals, Trends and Analysis of 2008 Industry Data. Alexandria, VA: The Association for Convenience and Petroleum Retailing, August 2009.
17. Association of American Railroads (AAR). “Railroads and Ethanol.” Association of American Railroads online, http://www.aar.org. June 2008.
18. Keen, D. Personal communication. Policy and Economics Department, Association of American Railroads, Washington, DC, 22 April 2009.
F1147-E(10/2008)
REPORT DOCUMENTATION PAGE Form Approved OMB No. 0704-0188
The public reporting burden for this collection of information is estimated to average 1 hour per response, including the time for reviewing instructions, searching existing data sources, gathering and maintaining the data needed, and completing and reviewing the collection of information. Send comments regarding this burden estimate or any other aspect of this collection of information, including suggestions for reducing the burden, to Department of Defense, Executive Services and Communications Directorate (0704-0188). Respondents should be aware that notwithstanding any other provision of law, no person shall be subject to any penalty for failing to comply with a collection of information if it does not display a currently valid OMB control number. PLEASE DO NOT RETURN YOUR FORM TO THE ABOVE ORGANIZATION. 1. REPORT DATE (DD-MM-YYYY)
December 2009 2. REPORT TYPE
Technical Report 3. DATES COVERED (From - To)
4. TITLE AND SUBTITLE
E85 Dispenser Study 5a. CONTRACT NUMBER
DE-AC36-08-GO28308
5b. GRANT NUMBER
5c. PROGRAM ELEMENT NUMBER
6. AUTHOR(S) K. Moriarty, C. Johnson, T. Sears, and P. Bergeron
5d. PROJECT NUMBER NREL/TP-7A2-47172
5e. TASK NUMBER BB07.7525
5f. WORK UNIT NUMBER
7. PERFORMING ORGANIZATION NAME(S) AND ADDRESS(ES) National Renewable Energy Laboratory 1617 Cole Blvd. Golden, CO 80401-3393
8. PERFORMING ORGANIZATION REPORT NUMBER NREL/TP-7A2-47172
9. SPONSORING/MONITORING AGENCY NAME(S) AND ADDRESS(ES)
10. SPONSOR/MONITOR'S ACRONYM(S) NREL
11. SPONSORING/MONITORING AGENCY REPORT NUMBER
12. DISTRIBUTION AVAILABILITY STATEMENT National Technical Information Service U.S. Department of Commerce 5285 Port Royal Road Springfield, VA 22161
13. SUPPLEMENTARY NOTES
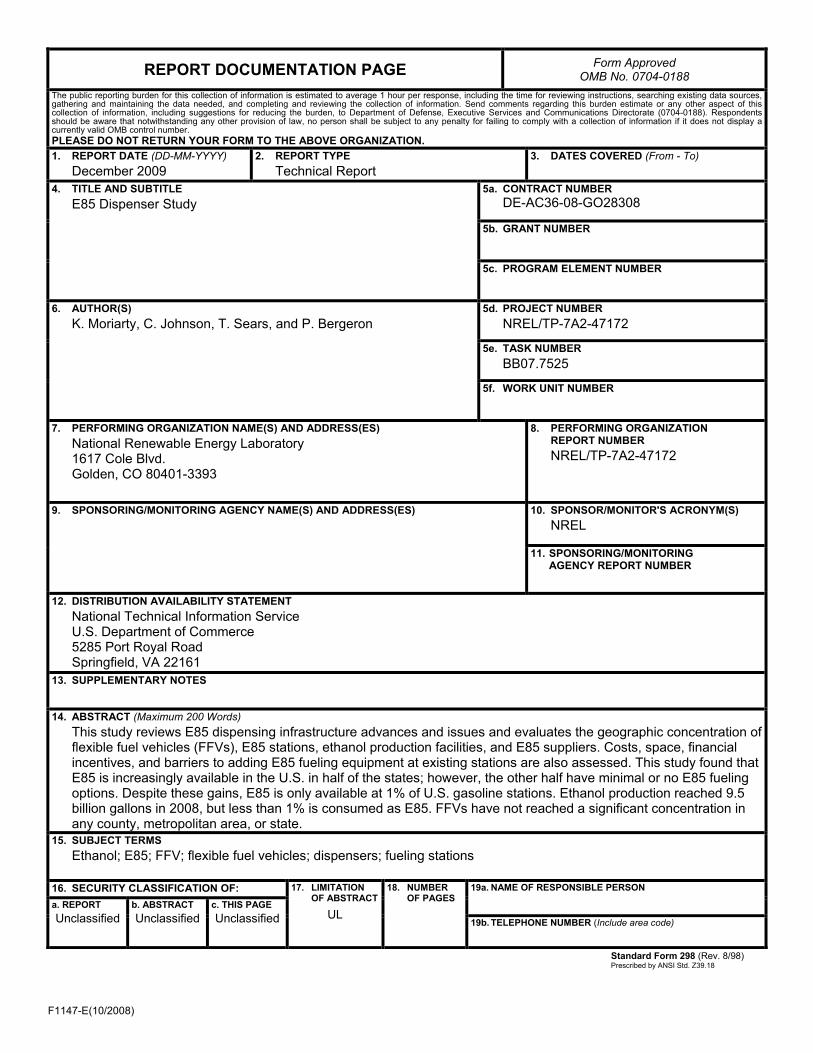
14. ABSTRACT (Maximum 200 Words) This study reviews E85 dispensing infrastructure advances and issues and evaluates the geographic concentration of flexible fuel vehicles (FFVs), E85 stations, ethanol production facilities, and E85 suppliers. Costs, space, financial incentives, and barriers to adding E85 fueling equipment at existing stations are also assessed. This study found that E85 is increasingly available in the U.S. in half of the states; however, the other half have minimal or no E85 fueling options. Despite these gains, E85 is only available at 1% of U.S. gasoline stations. Ethanol production reached 9.5 billion gallons in 2008, but less than 1% is consumed as E85. FFVs have not reached a significant concentration in any county, metropolitan area, or state.
15. SUBJECT TERMS Ethanol; E85; FFV; flexible fuel vehicles; dispensers; fueling stations
16. SECURITY CLASSIFICATION OF: 17. LIMITATION OF ABSTRACT
UL
18. NUMBER OF PAGES
19a. NAME OF RESPONSIBLE PERSON a. REPORT
Unclassified b. ABSTRACT Unclassified
c. THIS PAGE Unclassified 19b. TELEPHONE NUMBER (Include area code)
Standard Form 298 (Rev. 8/98) Prescribed by ANSI Std. Z39.18