E-waste - Toxics Link | for a toxics-free worldtoxicslink.org/docs/Chennai.pdfPAGE | 2 E-WASTE TAMIL...
65
E-waste Tamil Nadu Braces up for The Challenge A Report Study Team Mr Satish Sinha, Associate Director Toxics Link Mr G. Arun Senthil Ram Regional Coordinator, Chennai Ms Priti Mahesh Senior Programme Officer
Transcript of E-waste - Toxics Link | for a toxics-free worldtoxicslink.org/docs/Chennai.pdfPAGE | 2 E-WASTE TAMIL...

E-wasteTamil Nadu Braces up for
The Challenge
A Report
Study TeamMr Satish Sinha, Associate Director
Toxics Link
Mr G. Arun Senthil Ram Regional Coordinator, Chennai
Ms Priti MaheshSenior Programme Offi cer

PAGE | 2 E-WASTE TAMIL NADU BRACES UP FOR THE CHALLENGE
AMC Annual Maintenance ContractBFRs Brominated fl ame retardantsCAGR Compound Annual Growth RateCDMA Code Division Multiple AccessCPCB Central Pollution Control BoardCRT Cathode Ray TubeEEE Electrical and Electronic EquipmentEPR Extended Producer ResponsibilityEXIM Export and ImportGSM Global System for Mobile CommunicationsIT Information TechnologyLCD Liquid Crystal DisplayMoEF Ministry of Environment and ForestMT /yr Metric tones per yearNASSCOM National Association of Software and Services CompaniesNGOs Non Governmental OrganizationsNP NonylphenolNPE Nonylphenol EthoxylateOEMs Original Equipment ManufacturersPBDEs Polybrominated diphenyl ethersPBDDs Polybrominated dioxinsPBDFs Polybrominated FuronsPC Personal ComputerPCBs Polychlorinated biphenylsPDP Plasma Display PanelPROs Producer Responsibility OrganisationsPVC Polyvinyl chlorideT/month Tons per monthTNPCB Tamil Nadu Pollution Control BoardTPP Triphenyl phosphateWEEE Waste Electrical and Electronic Equipment
Acronyms and Abbreviations

PAGE | 3
While conducting the survey on the useful life of computers, we inter-viewed a large number of respondents who provided us valuable real time data. We sincerely thank all respondents for sharing their views and infor-mation. We would also like to thank all companies, in no particular order, Nokia, Sony, Dell, LG, Samsung, HCL and HP for the valuable informa-tion provided, which was very essential for this study.
We also wish to thank and acknowledge Ms Sivagami and her team for the excellent fi eld work for this report.
We express our sincere gratitude to Mr. Ravi Agarwal, Director, Toxics Link for providing us valuable guidance and support. We also thank all our colleagues at Toxics Link for their continuous support and timely advice.
A special acknowledgement goes to Tamil Nadu Pollution Control Board, especially Chairman Mr. Balakrishnan, IAS and Shri. R. Ramachandran, Member Secretary, for assigning this important study to Toxics Link and extending their support throughout.
Acknowledgement

PAGE | 4 E-WASTE TAMIL NADU BRACES UP FOR THE CHALLENGE
Electronic waste or e-waste is growing at a very fast pace, posing serious challenge in its safe management both nationally and globally. Unlike other kinds of waste, e-waste constitutes of disparate materials, some of them highly toxic and some very precious.
Th e Indian e-waste scenario is highly complex on account of its dispersed generation and dumping from developed countries. Th e infrastructure and techniques employed in its recycling in India are very rudimentary, giving rise to human health and environmental concerns.
It is of utmost importance therefore to understand the magnitude of the problem and the associated complexities. Sustainable solutions can evolve only with a clear understanding of these issues. State wise assessment of e-waste generation and disposal methods can be the best model for putting the issues in perspective and identifying probable solutions.
It is with this objective that an attempt has been made to understand the e-waste scenario in the state of Tamil Nadu. Th e study makes an assess-ment of e-waste generation in the state and current disposal practices of business and individual users.
Th is study, taken up on a specifi c request of Tamil Nadu Pollution Con-trol Board, can be used in assessing policy imperatives in developing a mechanism and infrastructure for facilitating safe management of e-waste in the state.
Study Objective

PAGE | 5
Executive Summary
India is one of the largest consumer markets for electronic and electrical equipments. Th is growing consumption, coupled with high obsolescence rate due to rapid technology changes, has resulted in progressively increas-ing e-waste generation. According to a study, in 2007, India generated 380,000 tonnes of e- waste from discarded computers, televisions and mobile phones. By 2012, this waste is likely to peg at 800,000 tonnes, growing 15 per cent annually. Import or illegal dumping of e-waste adds to domestic toxic waste.
Tamil Nadu has been a forerunner in IT revolution; it was one of the fi rst states in the country to have ‘IT Policy’ in the year 1997. Th e state is a popular destination for both hardware and software industry, which also means large generation of e-waste. It has an urgent need to establish an organised mechanism for collection, treatment and disposal of such waste in the region. Taking cognizance of the situation, TNPCB has identi-fi ed e-waste as a major concern, and has supported this study on e-waste quantifi cation and its environmental impacts in Tamil Nadu.
Th e purpose of this study is to analyse volume of e- waste generated in Tamil Nadu and its disposal mechanism. Th is can serve as a basis for the development of effi cient policy approach for electronic waste management in the state and in the country. Th e study is based on review of existing literature, structured and unstructured interviews and exploratory surveys. Five corporations in Tamil Nadu namely Chennai, Madurai, Coimbatore, Trichy and Salem were selected for carrying out the assessment for e-waste generation and disposal. Th e equipments covered in this assessment in-clude personal computers, mobiles phones, televisions, washing machines and refrigerators.

PAGE | 6 E-WASTE TAMIL NADU BRACES UP FOR THE CHALLENGE
Th e following were the key fi ndings:
• Tamil Nadu to generate around 22 thousand metric tones of e-waste in 2009; Personal computers’ share is around 60 per cent.
• Maximum useful life of a computer is four years; lifespan of house-hold consumer electronics ranged between eight to nine years. Mobile phones have a life span of around two years. Lifespan of diff erent equipments was assessed through user survey.
• Th ere is evidence of illegal imports of e-waste into the state, but it has been extremely diffi cult to quantify this.
• Most of e-waste is recycled in the informal sector, in by lanes of Chen-nai without any concern for human health and environment.
• Tamil Nadu has a few formal e-waste recyclers recognised by TNPCB. Most of then however are only engaged in the segregation and dis-mantling of waste, as they do not have an integrated facility for repro-cessing. Th e disaggregated recoverable components of waste are sent to specialised facilities outside the country for material recovery.
• Th e state does not have a proper system for e- waste collection, which a major challenge in its management.
• Most user companies do not have a policy on e- waste disposal.• None of the brands has invested in consumer awareness or education
or in e-waste management.• Awareness of issues in e-waste management is very low.
Th e study reveals that the current method of e- waste disposal by infor-mal sector is a matter of serious concern for environment and human health. It needs to be addressed on priority. Th e state also needs to address e-waste dumping that largely feeds the supply lines of informal sector. A policy based on the principle of producer’s responsibility, involving all stakeholders, can bring organisation in e-waste management in the state.

C H A P T E R 1
Introduction
Electronic goods have transformed the way we live and work. Burgeon-ing demand for these goods has made this industry the largest and fastest growing across continents. Globalisation that brought together competi-tive production centres and consumption markets in tandem with IT services has catalysed this growth. Th e industry has also made signifi cant investments in R&D and innovation, adding newer and improved fea-tures to their products boosting demand and consumption.
Th e change in society's consumption patterns, driven by large choices and rapid product obsolescence has created huge quantities of such end-of life or discarded products. Th is waste stream of used electronics is popu-larly known as electronic waste or e-waste. Growing at an alarming rate, e-waste is almost keeping a pace with the growth of electronics industry. It now makes up fi ve percent of all municipal solid waste worldwide, nearly

PAGE | 8 E-WASTE TAMIL NADU BRACES UP FOR THE CHALLENGE
matching the quantity of waste from plastic packaging, it is however much more hazardous and brings in a new set of challenges associated with its management.
In India, electronics industry has witnessed rapid growth since economic liberalisation. Th is trend is supported by giant strides made by Indian IT sector. Th e latter has been one of the key drivers of economic growth fuelling higher levels of consumption. New products and services brought shift in the pattern of governance. It ushered in an era of infrastructure reform and e-governance. Th is shift was marked by the application of information technology in a big way in all areas. Th ese developments have churned out a wide gamut of e-waste from households, commercial establishments, industries and public sectors. Personal computer sales in India grew from 14,05,290 in 1999-2000 to 73,44,306 in 2007-08 (see Figure 1).
Th e consumption of PC in four largest cities (Delhi, Mumbai, Kolkata and Chennai) grew by 19 percent in the last year. For laptop market the growth fi gures are even higher the sales jumped from 4, 31,834 in 2005-2006 to 18, 22,139 in 2007-2008 a growth of 114 percent.1
Th e growth in demand for telecom products has also been overwhelm-ing -India adds 2 million mobile phone users every month. With telecom penetration of around 10 percent, this growth is expected to continue at least over the next decade.2 Th e advent of LCD and plasma screens gave a shot in the arm of television market. Infl uenced by rapid technology change, availability and aff ordability of the products, the earlier Indian mindset of using EEE till it functioned changed.
2,311,617
2002-03 2003-04 2004-05 2005-06 2006-07 2007-08
3,124,4223,809,724
5,046,558
6,341,451
7,344,3067,000,000
6,000,000
5,000,000
4,000,000
3,000,000
2,000,000
1,000,000
0
Figure 1. Personal computer sales in India

PAGE | 9
Th is changed consumption pattern has been responsible for the bulk of e-waste in the country. It’s only very recent that the problems associated with such waste have began to be identifi ed; fuller knowledge of the com-plexities associated with such wastes is still not within our grasp.
Electronic waste or e-waste comprises electrical and electronic goods that have reached the end of their useful life either because of product obso-lescence, advancement in technology, change in fashion, style or status. E- waste contains toxic substances and chemicals that can have adverse eff ects on the health and environment, if not handled properly.
E-Waste Scenario
Th e issue of e-waste - its hazards and complexities - was fi rst brought into public discourse by a Toxics Link publication Scrapping the High Tech Myth in 2003. Th is initiated new research and dialogue among various stakeholders. Many studies and assessments have followed since. Accord-ing to a report published by GTZ in 2007, India generated 380,000 tonnes of e-waste from discarded computers, televisions and mobile phones in 2007. Th is is projected to grow to more than 800,000 tonnes by 2012 at a growth rate of 15 percent.3
Most of this waste is handled and managed by the informal sector in the by lanes of large cities and small towns, where it operates in clusters, spe-cialising in particular process or component. Th ese groups deal with this waste in most rudimentary fashion, recovering its constituents like metals, glass and plastics, and trade them in the scrap market. Scale of individual business is small and the processes dangerous and hazardous. Th e Indian e-waste processing has just been augmented with a very small segment of formal recyclers, who have the wherewithal for its reprocessing.
Another dimension of e-waste in India is the illegal imports of such waste from developed countries. Th is dumping of e-waste into India is con-stantly rising and fl ourishing in spite of international regulations. Th e clandestine nature of illegal imports makes it diffi cult to quantify e-waste generated through this route.
The Issue
Th e current practices in e-waste management in India have a number of drawbacks like the absence of an inventory of goods sold, unhealthy con-ditions of informal recycling, inadequate legislation, poor awareness and the industry reluctance to address the critical issues. Th e consequences
INTRODUCTION

PAGE | 10 E-WASTE TAMIL NADU BRACES UP FOR THE CHALLENGE
are that (i) toxic materials enter the waste stream, adversely aff ecting the environment and human health, and (ii) resource wastage, as dumped goods have valuable materials that can be recovered and recycled. E- waste recycling by ill-equipped informal sector creates unhealthy and hazardous conditions for the workers and pollutes the environment. As there is no organised procedure for e-waste collection in India, there is no clear data on the quantity generated and disposed of each year and the resulting extent of environmental risk.
Solid waste management, which is already a mammoth task in India, has become more complicated with the immensity of e-waste. Th e problem is not just of quantity, but also of the toxic nature of this waste. E-waste contains signifi cant quantities of hazardous elements like lead, mercury and cadmium. Improper recycling and disposal processes involve open air burning of plastic waste, exposure to toxic solders, dumping of acids in rivers or streams, and widespread general dumping.
Th e subject of e-waste recycling and disposal has captured attention at all levels of governance, and has opened a dialogue between the government organisations and the private sector manufacturers of electronic goods.

C H A P T E R 2
E-waste -Definition
E-Waste or waste electrical and electronic equipment (WEEE) - is the term used to describe old, end-of-life or discarded appliances using electricity. It comprises wastes generated from used electronic devices and household appliances, which are not fi t for their original intended use and are destined for recovery, recycling or disposal. Such waste encompasses wide range of electrical and electronic devices like computers, cell phones, televisions, digital cameras, personal stereos, large household appliances such as refrigerators, air conditioners, washing machines etc.
Th e four main categories of e-waste, according to most defi nitions, are:
• Large household appliances
• Small household appliances
• ICT and consumer electronics
• Lighting equipments

PAGE | 12 E-WASTE TAMIL NADU BRACES UP FOR THE CHALLENGE
Composition of E-waste
Composition of e-waste is very diverse. It contains more than 1000 diff er-ent substances, which fall under “hazardous” and “non-hazardous” catego-ries. Broadly, it consists of ferrous and non-ferrous metals, plastics, glass, wood & plywood, printed circuit boards, concrete and ceramics, rubber and other items. Iron and steel constitute about 50 percent of e-waste followed by plastics (21%), non-ferrous metals (13%) and other constitu-ents. Non-ferrous metals comprise metals like copper, aluminium and precious metals like silver, gold, platinum, palladium etc. Th e presence of elements like lead, mercury, arsenic, cadmium, selenium and hexavalent chromium and fl ame- retardants beyond certain threshold quantities in e- waste classifi es them as hazardous waste.
Electrical and electronic equipment contain valuable materials. Printed circuit boards contain precious metals such as gold, silver, platinum and palladium; scarce materials like indium and gallium are also used as these have specifi c application in new technologies (e.g fl at screens, photovolta-ics).
Th is apart, electrical and electronic equipment contain a variety of ma-terials that can be hazardous to human health and environment, if not disposed of in environmentally sound manner.
Table 1. Material composition of the four categories of e-wasteMaterial appliances (%)
Large householdappliances (%)
Small householdelectronics (%)
ICT and consumer Lamps (%)
Ferrous metal 43 29 36 -
Aluminium 14 9.3 5 14
Copper 12 17 4 0.22
Lead 1.6 0.57 0.29 -
Cadmium 0.0014 0.0068 0.018 -
Mercury 0.000038 0.000018 0.00007 0.02
Gold 0.00000067 0.00000061 0.00024 -
Silver 0.0000077 0.000007 0.0012 -
Palladium 0.0000003 0.00000024 0.00006 -
Indium 0 0 0.0005 0.0005
Brominated plastics 0.29 0.75 18 3.7Plastics 19 37 12 0
Lead glass 0 0 19 0
Glass 0.017 0.16 0.3 77
Other 10 6.9 5.7 5
Source: EMPA

PAGE | 13
Hazards in E-waste
E-waste contains a number of toxic substances, such as lead and cadmium in circuit boards, lead oxide and cadmium in monitor (CRTs), mercury in switches and fl at screen monitors, cadmium in computer batteries, polychlorinated biphenyls (PCBs) in older capacitors and transformers, brominated fl ame retardants on printed circuit boards, plastic casings and cables, and polyvinyl chloride (PVC) cable insulation that releases highly toxic dioxins and furans when burned to retrieve copper from the wires.
Due to the hazards involved, disposing and recycling e-waste has serious legal and environmental implications. When this waste is land fi lled or incinerated, it results in signifi cant contamination problems. From land-fi lls toxins leach into groundwater; if incinerated, emit toxic air pollutants including dioxins. Likewise, the recycling of computers has serious occu-pational and environmental implications, particularly when the recycling industry is marginally profi table at best and often cannot aff ord to take the necessary precautions to protect the environment and worker health.
Th e eff ects of some of these toxic metals are given below.
Antimony (Sb) - Antimony is a metal with a variety of industrial uses, in-cluding as a fl ame-retardant (as antimony trioxide) and as a trace compo-nent of metal solders. In some forms, antimony has chemical similarities to arsenic, including in its toxicity. Exposure to high levels at workplace, as dusts or fumes, can lead to severe skin problems and other health ef-fects. Antimony trioxide is recognised as a possible human carcinogen.
Cadmium (Cd) - Cadmium occurs in electronics both as cadmium metal, in some switches and solder joints, and as cadmium compounds in rechargeable batteries, UV stabilisers in older PVC cables and "phosphor" coatings in older cathode ray tubes. Like lead, cadmium can accumulate in the body over time, with long-term exposure causing damage to the kidneys and bone structure. Cadmium and its compounds are known human carcinogens, primarily through inhalation of contaminated fumes and dusts.
Lead (Pb) - Lead is widely used in electronic goods, as a major compo-nent of solders (as an alloy with tin) in printed circuit boards and as lead oxide in the glass of cathode ray tubes (televisions and monitors), as well as in lead-acid batteries. Lead is a signifi cant material in current CRTs, accounting for up to eight percent of the overall composition of the CRT by weight (Menad, 1999), with a 17" monitor containing as much as 1.12 kg of lead (Monchamp et. al., 2001). Th e toxic metal is used in several parts of the CRT monitor, including the funnel and neck glass, the
E-WASTE DEFINITION

PAGE | 14 E-WASTE TAMIL NADU BRACES UP FOR THE CHALLENGE
sealing frit, as solder on printed wiring boards (PWBs) within the moni-tor, and sometimes in the front panel glass of the CRT. Lead compounds have also been used as stabilisers in some PVC cables and other products. Lead is highly toxic to all life forms, including humans. It can build up in the body through repeated exposure and has adverse eff ects on the nerv-ous system. Its eff ects are more pronounced among developing foetuses and children.
Nonylphenol (NP) - Nonylphenol is a chemical most widely known as a breakdown product of nonylphenol ethoxylate (NPE) detergents, though it is reportedly also used as an antioxidant in some plastics. It is a strong endocrine disruptor, capable of causing inter sex (individuals with both male and female characteristics) changes in fi sh. Nonylphenol can also build up in the system through food chain, and may be capable of causing damage to human DNA and even sperm functions.
Brominated fl ame retardants (BFRs) - Brominated fl ame retardants are used in the plastic housings of electronic equipment and in the circuit boards to reduce fl ammability. More than 50 percent of BFR usage in the electronics industry consists of tetrabromobisphenol - a TBBPA composi-tion has 10 percent polybrominated diphenyl ethers (PBDEs) and less than one percent polybrominated biphenyls (PBB).
Polybrominated diphenyl ethers (PBDEs) are one of several classes of brominated fl ame-retardants used to prevent the spread of fi re in a wide variety of materials, including casings and components of many electronic goods. Th ese are environmentally persistent chemicals, some of which are highly bio-accumulative and capable of interfering with normal brain de-velopment in animals. Several PBDEs are suspected endocrine disruptors, demonstrating an ability to interfere with hormones involved in growth and sexual development. Eff ects on the immune system have also been reported.
Polychlorinated biphenyls (PCBs) are widely used in insulating fl uids for electrical transformers and capacitors, as well as fl ame-retardant plasti-cisers in PVC and other polymer applications. Th ese are highly persistent and bio-accumulative chemicals, rapidly becoming widespread in environ-ment and building up several thousand-fold in body tissues of wildlife. PCBs exhibit a wide range of toxic eff ects including suppression of the immune system, dysfunction of liver and reproductive systems, cancer, impairment of nervous system, behavioural changes etc.
Triphenyl phosphate (TPP) - TPP is one of several organo-phosphorus fl ame-retardants used in electronic equipment, for example in the casings of computer monitors. TPP is acutely toxic to aquatic life and a strong

PAGE | 15
inhibitor of a key enzyme system in human blood. It is also known to cause contact dermatitis in some individuals and is a possible endocrine disruptor.
Cadmium - Cadmium occurs in certain components such as SMD chip resistors, infra-red detectors and semi- conductor chips. It is a plastic stabiliser, and some older cathode ray tubes contain cadmium. Cadmium compounds are toxic and bio-accumulative with a possible risk of irrevers-ible health eff ects.
Mercury - It is estimated that 22 percent of annual world consumptio n of mercury is in electrical and electronic equipment. It is used in ther-mostats, sensors, relays, switches (e.g. on printed circuit boards and in measuring equipment), medical equipment, lamps, mobile phones and batteries. Th e fl uorescent tubes that are the source of light in a LCD con-tain mercury. Very small amounts of mercury are also found in the LCD backlights. Mercury use in displays is likely to increase as its use replaces cathode ray tubes. Mercury can cause damage to various organs including the brain and kidneys. Th e developing foetus is highly susceptible through maternal exposure to mercury. When inorganic mercury mixes in water, it is transformed into methylated mercury. Methylated mercury easily accumulates in living organisms and concentrates through the food chain, particularly via fi sh.
Hexavalent chromium/chromium VI - Chromium VI is used as corro-sion protection in untreated and galvanized steel plates and as a decorative or hardener for steel housings. It easily passes through cell membranes, and is then absorbed producing various toxic eff ects in contaminated cells. Chromium VI can cause damage to DNA and is extremely toxic in the environment.
Plastics including PVC - Plastics make up 13.8 pounds of an average computer. Poly-vinyl-chloride or PVC comprises 26 percent of plastics used in electronics. PVC is mainly used for cabling and computer hous-ings, although many computer moldings are now made with somewhat more benign ABS plastics. PVC is used for its fi re-retardant properties. As with many other chlorine- containing compounds, PVC forms dioxin when burned within a certain temperature range.
Barium - Barium is a soft silvery-white metal that is used in the front panel of a CRT of computer monitors to protect users from radiation. Studies have shown that short-term exposure to barium has caused brain swelling, muscle weakness, damage to the heart, liver, and spleen. Data on the eff ects of chronic barium exposures among humans is inadequate. Animal studies however reveal increased blood pressure and changes in
E-WASTE DEFINITION

PAGE | 16 E-WASTE TAMIL NADU BRACES UP FOR THE CHALLENGE
the heart from ingesting barium over a long period of time.
Beryllium - In computers beryllium is commonly found on mother-boards and “fi nger clips”. Copper beryllium alloy is used to strengthen the tensile strength of connectors and tiny plugs while maintaining electrical conductivity. Beryllium has recently been classifi ed as a human carcino-gen; its exposure can cause lung cancer. Th e primary health concern is the inhalation of beryllium dust, fume or mist. Workers who are constantly exposed to beryllium, even in small amounts, can develop what is known as chronic beryllium disease (beryllicosis), a disease that primarily aff ects the lungs. Exposure to beryllium also causes a form of skin disease that is characterized by poor wound healing and warts. Studies have shown that people can develop beryllicosis years after the last exposure.
Toners - One ubiquitous computer peripheral scrap is the plastic printer cartridge containing black and colour toners. Th e main ingredient of the black toner is a pigment commonly called carbon black - the general term used to describe the commercial powder form of carbon. Its inhala-tion can lead to respiratory tract irritation. Th e International Agency for Research on Cancer has classifi ed carbon black as a class 2B carcinogen, possibly carcinogenic to humans. Little information exists on the hazards of colour toners. Some reports indicate that such toners (cyan, yellow and magenta) contain heavy metals.
Phosphor and additives - Phosphor is an inorganic chemical compound that is applied as a coat on the interior of the CRT faceplate. Phosphor aff ects the display resolution and luminance of the images that are seen on the monitor. Th e hazards of phosphor in CRTs are not well known or reported, but the US Navy has not minced words about the hazards involved in some of their guidelines: “NEVER touch a CRT’s phosphor coating: it is extremely toxic. If you break a CRT, clean up the glass frag-ments very carefully. If you touch the phosphor seek medical attention immediately.” Th e phosphor coating contains heavy metals, such as cad-mium, and other rare earth metals, e.g. zinc, vanadium, etc. as additives. Th ese metals and their compounds are very toxic. Th is is a serious hazard for those who dismantle CRTs by hand.5
Impact of E-waste
As mentioned above, e-waste contains signifi cant quantities of toxic met-als and chemicals. If these are left untreated and disposed of in landfi lls or not recycled using scientifi cally tested methods, they leach into the surrounding soil, water and the atmosphere, and cause adverse eff ects to

PAGE | 17
Table 2. Hazards of e-waste recycling by informal sectorE-waste Components Process Potential occupational
hazardPotential environmental hazard
Cathode ray tubes (CRTs) and dumping.
Breaking and removal of copper yoke
• Silicosis. • Inhalation or contact
with phosphor containing cadmium or other metals.
• release of toxic phosphor.
Lead, barium and other heavy metals leach into groundwater,
Printed circuit boards (PCBs)
Disordering and removing computer chips.
• Tin and lead inhalation.• Possible brominated
dioxin, beryllium, cadmium, and mercury inhalation.
Air emission of these substances.
Dismantled PCBs processing
Open air burning of waste boards to remove metals inside
• Toxicity to workers and nearby residents from tin, lead, brominated dioxin, beryllium, cadmium and mercury inhalation.
• Respiratory irritation.
Tin and lead contamination of immediate environment including surface and ground waters. Brominated dioxins, beryllium, cadmium and mercury emissions.
Chips and other gold plated components.
Chemical stripping using nitric and hydrochloric acid along river banks
• Acid contact with eyes, skin may result in permanent injury.
• Inhalation of mists and fumes of acids, chlorine and sulphur dioxide gases can cause respiratory irritation to severe effects including pulmonary oedema, circulatory failure and death.
Hydrocarbons,heavy metals, brominated substances, etc., discharged directly into river or left on the banks. Acidifi es the river destroying fi sh and fl ora.
Plastics from Computer and peripherals
Shredding and low temperature melting to be reutilized in poor grade plastics.
Workers and community exposure to carcinogens like brominated and chlorinated dioxin, polycyclic aromatic Hydrocarbons (PAH)
Hydrocarbon ashes including PAHs discharged into air, water and soil.
Miscellaneous computer parts encased in rubber or plastic
Open air burning to recover steel and other metals.
Exposure to hydrocarbons including PAHs and dioxins.
Hydrocarbon ashes including PAHs discharged into air, water and soil.
E-WASTE DEFINITION

PAGE | 18 E-WASTE TAMIL NADU BRACES UP FOR THE CHALLENGE
human health and environment. Th e potential occupational and environ-mental hazard of some of the components are listed below:
Recycling Technologies
Recycling e-waste through improper technologies can lead to severe health and environmental damages. But if environmentally sound technologies are employed, e- waste recycling can benefi t the environment and econo-my. Realising the severity of climate change impacts, resources recovered are major boons. E-waste, if reused and recycled in an eco-friendly way, can be a major source of raw materials thus can minimise energy intensive mining of various metals like copper, gold etc.
In the section below, we describe some of the hazardous recycling and disposal techniques used globally for e-waste. In the following section we also look at some state-of-the-art technologies available for e-waste recycling.
Hazardous Technologies
Incineration: Incineration is the process of destroying waste through burning. Because of a variety of sub stances found in e-waste, incineration is associated with a major risk of generating and dispersing contaminants and toxic substances. Th e gases released dur-ing the burning and the residue ash is often toxic. Th is is especially true for incineration or co- incineration of e-waste with neither prior treatment nor sophisticated fl ue gas purifi ca-tion.
Studies of municipal solid waste incineration plants have shown that cop-per, which is present in printed circuit boards and cables, acts as a catalyst for dioxin formation when fl ame-retardants are incinerated. Th ese bro-minated fl ame-retardants when exposed to low temperature (600-800°C) can generate extremely toxic polybrominated dioxins (PBDDs) and furans (PBDFs). PVC, which is found in e-waste in signifi cant amounts, is highly corrosive when burnt and also induces the formation of dioxins. Its incineration also leads to the loss of valuable elements that can be recov-ered if sorted and processed separately.
Open burning: Since open fi res burn at relatively low temperatures, its use for waste disposal is far more polluting than controlled incineration

PAGE | 19
process. Inhalation of open fi re emissions can trigger asthma attacks, respiratory infections, and cause other problems such as coughing, wheezing, chest pain and eye irritation. Chronic exposure to open fi re emissions may lead to diseases such as emphysema and cancer. For example, open air burning of PVC releases hydrogen chlo-ride, which on inhalation mixes with water in the lungs to form hydrochloric acid. Th is can lead to corrosion of the lung tis-sues and several respiratory complications. Often open fi res burn with a lack of oxygen, forming carbon monoxide, which poisons the blood when inhaled. Th e residual ash becomes air-borne, and is dangerous if inhaled.6
Land fi lling: Land fi lling is one of the most widely used methods of waste dis-posal. It is also common knowledge that all landfi lls leak. Th e leachate often contains heavy metals and other toxic substances that contaminate groundwater resources. Even state-of-the-ar t landfi lls, which are sealed to prevent toxins from entering the ground, are not completely tight in the long-term. Older landfi ll sites and uncon-trolled dumps pose a much greater danger of releasing hazardous emissions. Mer-cury, cadmium and lead are among the most toxic leachate. Mercury, for example, will leach when certain electronic devices such as circuit breakers are destroyed. Lead is found to leach from broken lead- containing glass, such as the cone glass of cathode ray tubes from TVs and monitors. When brominated fl ame retarded plastics or plastics containing cadmium are land fi lled, both PBDE and cadmium may leach into soil and groundwa-ter. Similarly, land fi lled condensers emit hazardous PCBs.
Besides leaching, vaporisation is also a concern in landfi lls. For exam-ple, volatile compounds such as mercury or its compound dimethylene mercury are released through vaporisation. In addition, landfi lls are also prone to uncontrolled fi res, which can release toxic fumes. Impacts from the state-of-the- art landfi lls can be minimised by conditioning hazard-ous materials from e- waste separately and landfi lling only those fractions which cannot be further recycled.
E-WASTE DEFINITION

PAGE | 20 E-WASTE TAMIL NADU BRACES UP FOR THE CHALLENGE
State-of-the-art Technologies
Th e state-of-the-art recycling of e-waste comprises three steps:
Detoxication: Th e fi rst step in the recycling process is the removal of critical components from the e-waste in order to avoid dilution of and / or contamination with toxic sub- stances during the downstream pro-cesses. Critical components include, e.g., lead glass from CRT screens, CFC gases from refrigerators, light bulbs and batteries.
Shredding: Mechanical processing is the next step in e- waste treatment. In a large scale industrial opera-tion recyclable materials are separated from hazardous materials. Typical components of a mechanical pro-cessing plant are crushing units, shredders, magnetic- and eddy-current- and air-separators. Th e gas emis-sions are fi ltered and effl uents are treated to minimize environmental impact.
Refi ning: Th e third step in e-waste recycling is refi n-ing. Refi ning of resources in e-waste is possible, and the technical solutions exist to get back raw material with minimal environmental impact. Most of the fractions need to be refi ned or conditioned in order to be sold as secondary raw materials or to be disposed of in a fi nal disposal site, respectively. During the refi ning process, materials paid attention are: metals, plastics and glass.
Environmentally sound recycling of e- waste requires sophisticated tech-nology and processes, which are not only very expensive, but also need specifi c skills and training for the operation. Proper recycling of complex materials requires the expertise to recognize or determine the presence of hazardous or potentially hazardous constituents as well as desirable constituents (i.e. those with recoverable value), and then apply the com-pany’s capabilities and processes to recycle or treat both of these streams. Appropriate air pollution control devices for the fugitive and point source emissions are required.

C H A P T E R 2
Scenario in India andTamil Nadu
India, a country of over 1.12 billion people7, has witnessed sustained growth rate of over eight percent GDP8 in last few years. Th e pace of growth has been phenomenal - boosting developments across many sec-tors. Economic liberalisation has also resulted in a higher availability of goods and multiple choices for the consumers. Th e availability of choices coupled with surplus income with the Indian middle class (the middle class currently numbers some 50 million people, which by 2025 will be 583 million people - some 41 percent of the population9) has contributed signifi cantly to the changing consumption patterns. By 2020, about 30 percent of India's population will be between 25-44 years of age.10 Th is young and earning group would bring an unprecedented boom in con-sumption of consumer durables, especially EEE.
Th e IT industry has been one of the major drivers of growth in the past decade. At present, India has installed base of 36 million computers,

PAGE | 22 E-WASTE TAMIL NADU BRACES UP FOR THE CHALLENGE
which is likely to go up to 75 million by 2010. Th e country now has one personal computer for every 30 Indians. Th is represents a signifi cant im-provement over March 2007 fi gure of one computer for every 50 Indians.
Consumer electronics is one of the largest segments of Indian market. With a market size of Rs 15,949 crores in 200611, catering to a popula-tion of more than one billion, the consumer electronics industry in India is poised for exponential growth in the years to come. iSuppli Corpora-tion, an industry analyst, in its recent report predicts Rs. 27,019 crore business in audio/video consumer electronics in India by 2011 - a com-pound annual growth rate (CAGR) of 10.0 percent over Rs. 18,450 crore in 2007.
Television leads the consumer electronics market, with newer technolo-gies like Liquid Crystal Display (LCD) and Plasma Display Panel (PDP) gaining popularity. iSuppli predicts that domestic manufacturing is going to be a key characteristic of this growth in the years ahead. Although electronics production has remained a miniscule segment of overall Indian manufacturing for a long time, the trend is gradually changing.Th e market for consumer durables is also exhibiting accelerated growth rate of approximately 10-15 percent over last two years. Th e penetra-tion for most equipments being still very low, there is a huge potential of growth in this market. Th e recent economic downturn may impact the growth rate a little.
Scenario in Tamil Nadu
Tamil Nadu is among the most industrialised states in the country with a high Human Development Index. Chennai, the capital city of Tamil Nadu, is the gateway to South India with an international airport, sea-ports and good rail and road network connectivity. Coimbatore, Madurai and Tiruchirappalli, Salem and Tirunelveli are some of the other major towns in the state.
Tamil Nadu, with 6.05 percent of country’s population, is the sixth most populous state of the Indian Union after Uttar Pradesh, Maharashtra, Bihar, West Bengal and Andhra Pradesh. In March 2001 its population stood at 62,110,839. Its population density at 478 persons per square kilometre, up from 429 in 1991, is much higher than the national aver-age of 324, which makes it the eleventh most densely populated state. Th e state also has a high literacy rate of 75 percent in 2001.
Tamil Nadu is also home to a number of MNCs, business centres and manufacturing units. Th e state government initiated policy measures have made it a preferred destination for a number of IT companies from across

PAGE | 23
the globe. Th is has led to better opportunities, income and purchasing power for a large middle class, consequently boosting the manufacturing sector. But, in the absence of the state guidelines on e-waste disposal, the companies contract informal recyclers for this function. While companies have incentive in doing so, people, including those involved and aff ected in the process of disposal, are not socially conscious and aware of their situation.
IT Parks
Tamil Nadu was among the fi rst states in the Indian Union to formulate a comprehensive IT policy. As early as 1997, the state government released its policy for IT industry with a vision to make it its engine of growth, to achieve the goals spelt out in the Ninth Five Year Plan. Later in year 2002, Tamil Nadu released a new IT policy geared towards leveraging IT to herald prosperity in the state and to turn Tamil Nadu into a knowledge-empowered state.
Th e advent of Internet transformed the world into a global village and ushered in an era of IT-enabled services worldwide. As per the 2002 report of NASSCOM, IT and IT-enabled services industry accounted for over seven percent of India’s GDP and 30 percent of foreign exchange in its fi rst decade. IT industry has generated over four million jobs in the knowledge sector (IT and ITES industries). Th e state with its educated workforce and excellent administration could leverage this great opportu-nity. In its ITES Policy (2005) the government highlights the investment incentives for ITES in the state.
• 50 percent exemption on stamp duty for IT companies towards land registration and offi ce construction
• 30 percent subsidy to small and medium enterprises on stall rent for participation in national and international exhibitions
• Relaxed Floor Space Index (FSI) norms for IT buildings to enable the entry of smaller IT companies
Special Economic Zones
Special Economic Zones (SEZs) concept was brought in year 2000, through a revision in the EXIM Policy 1997- 2002 with a view to provide an internationally competitive and hassle free environment for export production. As per the Government of India guidelines, SEZs can be developed by public, private, joint sectors, or by the state governments or their agencies. Exploiting the full potential of the concept of SEZs would bring large dividends to the state in terms of economic and industrial
SCENARIO IN INDIA AND TAMIL NADU

PAGE | 24 E-WASTE TAMIL NADU BRACES UP FOR THE CHALLENGE
development and the generation of new employment opportunities. In the wake of these guidelines, Tamil Nadu Industrial Development Corpo-ration Limited set up an SEZ off ering better infrastructure, tax holidays and security.
Waste Growth
Th e phenomenal market growth for EEE has meant newer markets but also replacement market - indicating enormous end-of-life equipments joining the waste stream every year. Th e country has witnessed a sharp rise in the volume of e-waste generation, which as per the current estimates is around 400,000 tonnes annually. About 90 percent of e-waste is end-of-life house- hold appliances, IT and communication equipment and consumer electronics.
According to earlier studies, Maharashtra, Tamil Nadu, Andhra Pradesh and Karnataka are some of the leading e-waste generating states in the country.
E-waste Sources
Electronic waste is generated by three major sectors in India:
• Individuals and small businesses
• Large businesses, institutions, banks and government
• Original equipment manufacturers (OEMs)

PAGE | 25
Individuals and small businesses: Electronic equipment, computers in particular, are often discarded by households and small businesses, not because they are broken but simply because new technology has left them obsolete or undesirable. With today’s computer industry delivering new technologies and upgrades to the market about every 18 months, the use-ful life-span of a personal computer has shrunk from four or fi ve years to two years. Often new software is incompatible or insuffi cient with older hardware, forcing users to buy new machines.
Large corporations, institutions, banks and government: Large organi-sations upgrade hardware on a regular basis. In India, most large organisa-tions upgrade their hardware infrastructure at least in ever y 2-3 years, and at times much faster due to faster depreciation rate.
Original Equipment Manufacturers (OEMs): Th ough the EEE manu-facturing sector is still not very big in India, growth prospects have attracted many big OEMs to set up manufacturing and assembly units in the country. OEM units are supported by large component manufac-turing ancillary units. During manufacturing and assembling, substantial amount of waste is generated. In the absence of any regulation on manag-ing of e-waste, it is largely collected, recycled or dumped by the informal sector.
Th e informal or unorganised sector dealing with e- waste has little or no understanding of the characteristics and toxicity associated with this kind of waste. Most workers employed in this trade are migrant urban poor and include women who seek wage-earning opportunities. Unaware of the associated risks of the occupation, they get engaged in the most hazard-ous processes for a paltry income of about 5-6 USD per day. On the other hand waste traders deal in large volumes and make most of the profi ts. Generally this trade is located on the fringes of the larger cities, but of late it’s growing in smaller towns as well, exposing new areas to hazards of unregulated e-waste processing. Import of e-waste: While the domestic generation of e- waste continues to pose serious challenges, the problem is further aggravated by illegal imports of this waste into the country. Availability of cheap labour, weak environmental laws and ineffi cient enforcement mechanisms are largely responsible for such waste trade. Th ere is no study on the volume of il-legally imported e-waste. However, many isolated consignments sighted and located in the informal sector suggest that the volumes of imports are signifi cantly large. Closer scrutiny suggests that most of these con-signments originate in developed countries and are traded for economic reasons.
SCENARIO IN INDIA AND TAMIL NADU
PAGE | 26 E-WASTE TAMIL NADU BRACES UP FOR THE CHALLENGE
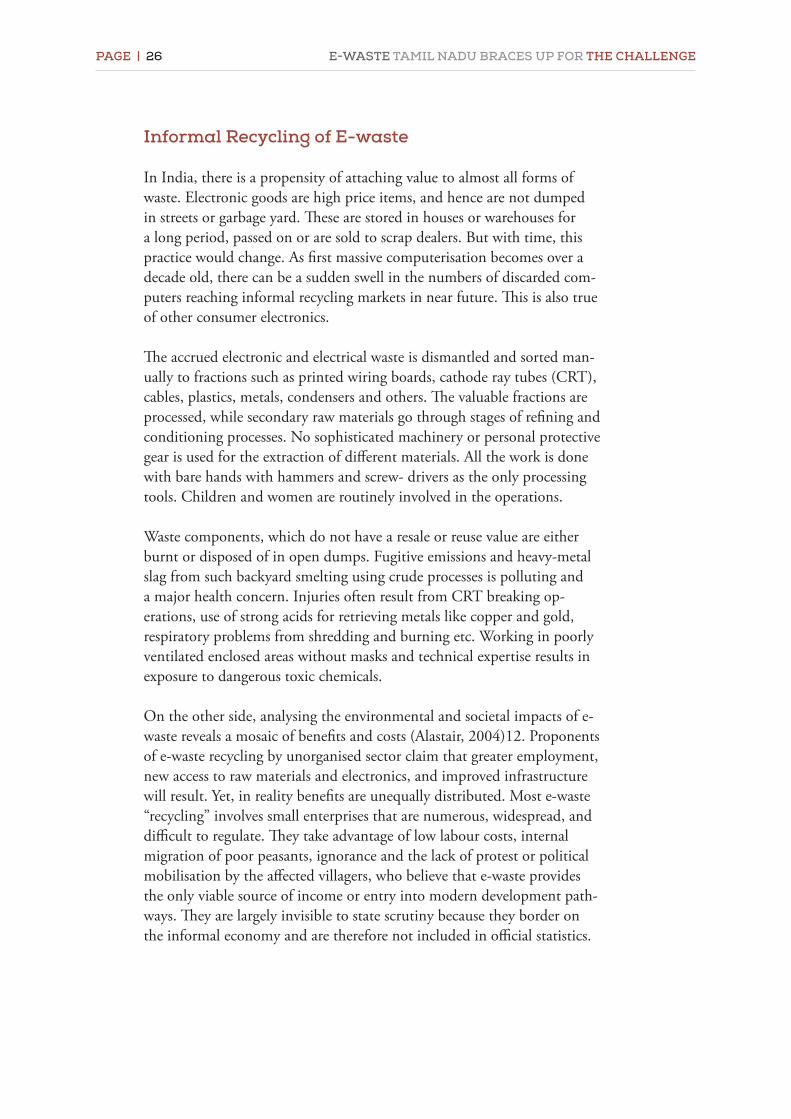
Informal Recycling of E-waste
In India, there is a propensity of attaching value to almost all forms of waste. Electronic goods are high price items, and hence are not dumped in streets or garbage yard. Th ese are stored in houses or warehouses for a long period, passed on or are sold to scrap dealers. But with time, this practice would change. As fi rst massive computerisation becomes over a decade old, there can be a sudden swell in the numbers of discarded com-puters reaching informal recycling markets in near future. Th is is also true of other consumer electronics.
Th e accrued electronic and electrical waste is dismantled and sorted man-ually to fractions such as printed wiring boards, cathode ray tubes (CRT), cables, plastics, metals, condensers and others. Th e valuable fractions are processed, while secondary raw materials go through stages of refi ning and conditioning processes. No sophisticated machinery or personal protective gear is used for the extraction of diff erent materials. All the work is done with bare hands with hammers and screw- drivers as the only processing tools. Children and women are routinely involved in the operations.
Waste components, which do not have a resale or reuse value are either burnt or disposed of in open dumps. Fugitive emissions and heavy-metal slag from such backyard smelting using crude processes is polluting and a major health concern. Injuries often result from CRT breaking op-erations, use of strong acids for retrieving metals like copper and gold, respiratory problems from shredding and burning etc. Working in poorly ventilated enclosed areas without masks and technical expertise results in exposure to dangerous toxic chemicals.
On the other side, analysing the environmental and societal impacts of e-waste reveals a mosaic of benefi ts and costs (Alastair, 2004)12. Proponents of e-waste recycling by unorganised sector claim that greater employment, new access to raw materials and electronics, and improved infrastructure will result. Yet, in reality benefi ts are unequally distributed. Most e-waste “recycling” involves small enterprises that are numerous, widespread, and diffi cult to regulate. Th ey take advantage of low labour costs, internal migration of poor peasants, ignorance and the lack of protest or political mobilisation by the aff ected villagers, who believe that e-waste provides the only viable source of income or entry into modern development path-ways. Th ey are largely invisible to state scrutiny because they border on the informal economy and are therefore not included in offi cial statistics.

PAGE | 27
Informal Recyclers in Tamil Nadu
Th e informal recycling sector in Tamil Nadu has a vast network of collec-tion, storage, segregation and fi nally material recovery. Th ese operations involve a large number of people including women and children during diff erent stages of operation, thus exposing them to various toxics and toxic and hazardous processes. While processing e-waste these units do not follow any environmental norms and safeguards. Th e workers them-selves have no knowledge of toxicity they are exposed to. In this way the urban backyard makeshift recycling units offl oad toxic constituents into the environment. Th ough the units fl ourish, the threat burgeons in the absence of regulations on environmentally sound recycling processes.
Regulations
Over the years the government has instituted a legal framework for better management of hazardous waste in the country. A brief purpose and ap-plicability of these regulations to e-waste is given below:
Factories Act 1948 (amended till 1987): Th e act lists several contaminants arising from manufacturing or recycling of electronic components.
Environmental Protection Rules 1986 (amended till 2004): Does not have any direct standard for pollutants emanating from electronics manufacturing or recycling units. However, certain PCB units fall in electroplating category, and are therefore required to abide by the effl uent disposal norms under schedule 1 of the rules.
Hazardous Wastes (Management, Handling and Transboundary Move-ment) Rules 2008: Th ese rules defi ne hazardous waste as “any waste which by reason of any of its physical, chemical, reactive, toxic, fl ammable, explosive or corrosive characteristics causes danger or is likely to cause danger to health or environment, whether alone or when in contact with other wastes or substances.” In Schedule 1, waste generated from the elec-tronic industry is considered as hazardous waste. Schedule 3 lists waste of various kinds as hazardous including one originating from electrical and electronic assemblies such as accumulators, batteries, mercury switches, glass from cathode ray tubes and other activated glass and PCB capaci-tors, or contaminated with constituents such as cadmium, mercury, lead, polychlorinated biphenyl or from which these have been removed, to an extent that they do not possess any of the constituents mentioned in Schedule 2.
• Part A of Schedule III (Basel No. 1180) consists of list of e-waste ap-plicable for import with prior informed consent.
SCENARIO IN INDIA AND TAMIL NADU

PAGE | 28 E-WASTE TAMIL NADU BRACES UP FOR THE CHALLENGE
• Part B of schedule III (Basel No. 1110) deals with list of e-waste ap-plicable for import and export not requiring prior informed consent.
DGFT (Exim policy 2002-07): Second-hand personal computers (PCs)/laptops are not permitted for import under EPCG scheme under the pro-visions of para 5.1 of the Exim Policy, even for service providers. Second- hand photocopier machines, air conditioners, diesel generating sets, etc, also cannot be imported under EPCG Scheme under the provisions of Para 5.1 of EXIM Policy, even if these are less than 10 years old.
Basel Convention: Th e Basel convention on the control of transboundary movements of hazardous wastes and their disposal, adopted by a confer-ence in Basel (Switzerland) in 1989, was developed under UNEP.
Guidelines: Guidelines for environmentally sound management of e-waste are given by CPCB.
Th e other related measures are:
• MoEF Guidelines for Management and Handling of Hazardous Wastes, 1991
• Guidelines for Safe Road Transport of Hazardous Chemicals, 1995
• Th e Public Liability Act, 1991
• Batteries (Management and Handling) Rules, 2001
• Th e National Environmental Tribunal Act, 1995
• Municipal Solid Wastes (Management and Handling) Rules, 2000 and 2002
Unfortunately, none of these regulations deal directly and specifi cally with e-waste. Th is situation requires the enactment of a special law dealing with the nuisance of e-waste. Unlike in developed countries, there are no set norms for collection and handling of electronic waste in India. Cheap labour, inadequacy and poor implementation of the environmental laws encourage developed countries to push their electronic wastes in countries like India.

C H A P T E R 4
Objective and StudyMethodology
Th is chapter defi nes the objectives of this study and discusses in detail the methodology adopted for the study including sampling, tools of data col-lection, and limitations of the study.
Statement of the Problem
Th e current practices of e-waste management in India suff er from a num-ber of drawbacks like absence of EEE inventory, unhealthy conditions of informal recycling, inadequate legislation, poor awareness and reluctance on part of the corporate inc to address the critical issues. Th e conse-quences are that (i) toxic materials enter the waste stream with no special precautions to avoid the known adverse eff ects on the environment and human health and (ii) resources are wasted when economically valuable materials are dumped or unhealthy conditions are developed during their informal recycling.

PAGE | 30 E-WASTE TAMIL NADU BRACES UP FOR THE CHALLENGE
As there is no separate collection of e-waste in India, there is no clear data on the quantity generated and disposed of each year and the resulting extent of environmental risk. Th is study is an attempt to quantify e-waste generated in Tamil Nadu, and its environmental impact. Th is will help in the development of effi cient policy approach for electronic waste manage-ment in the state, and in the country.
Why Tamil Nadu ?
Th e state of Tamil Nadu has been forerunner in IT revolution and was one of the fi rst states in the country to announce a separate “IT Policy” in the year 1997. With the government providing investment incentives, Tamil Nadu has become a popular destination for both hardware and software industry. At present, more than 1400 IT companies operating in the state. With such a large number of domestic and global MNCs in operation here, computers and peripherals use is also quite high in the state. Further, the high literacy level has resulted in greater penetration of computers in households. All this has contributed to e- waste growth in the state. Th ough there have been some attempts to study the e-waste recycling practices in the city of Chennai, statewide study is needed to ascertain the intensity of the problem.
Reports suggest that in Tamil Nadu WEEE is stored, processed, recycled, reused and fi nally disposed of in a manner that is detrimental to environ-ment. In light of this, TNPCB has identifi ed e-waste as a priority area for drawing up a well-orchestrated mechanism for its collection, treatment and disposal in the region.
Scope
Th e scope of this study covers personal computers, mobile phones, colour televisions, refrigerators and washing machine. Personal computers and mobile phones have been chosen because of their high rate of obsoles-cence and several hazardous metals and chemicals constituents. Other equipments such as colour televisions, refrigerators and washing machines have been included in the study for the sheer volume.
Objective
Th e objectives of this study are to
• Assess and quantify e-waste generated in Tamil Nadu
• Study current end-of-life management system for electronic reject
• Identify sources and trade routes of e-waste

PAGE | 31
• Identify e-waste hotspots in Chennai
• Observe the impacts of e-waste recycling on health, safety and the environment.
• Recommend an action plan for key stakeholders to ensure environ-mentally safe handling of e- waste.
Research Framework
Th e study employs various methods like review of exist-ing literature, structured and unstructured interviews, exploratory surveys and photo documentation to assess e-waste scenario in the state. Experi-ences from earlier studies of Toxics Link in Delhi, Chennai and Mumbai were used to plan the study.
Th e research was carried out in phases
• Review of the existing literature
• Structured interviews with the industry (public and private) to assess e-waste generation
• Exploratory survey of stakeholders to understand their perspective on EEE lifespan and disposal
• Exploratory visits and unstructured interviews with the informal recyclers
• Observation regarding the health and environmental impacts
• Analysis of the information collected
Literature review: Extensive literature review was undertaken to collect country specifi c information on e-waste. Various global assessment studies and methodologies were also reviewed. Open-ended questionnaire: For views of experts on e- waste, they were asked open-ended questions in one-to- one personal meetings. Th is helped in getting an over- all perspective of diff erent stakeholders working in the fi eld.
Structured questionnaires and interviews: Th e original equipment manu-facturers (OEMs) were contacted with structured questionnaire to assess the equipment market size, growth potential and disposal policies.
Exploratory survey: Diff erent segments of population - corporate, institutions and individuals - were surveyed to assess consumption and disposal patterns in WEEE. Th e questionnaire, part structured and part
OBJECTIVE AND STUDY METHODOLOGY

PAGE | 32 E-WASTE TAMIL NADU BRACES UP FOR THE CHALLENGE
exploratory in nature, were used to assess the lifespan of diff erent category of products and the disposal methods of the consumers. Exploratory sur-veys were also carried out to identify the sites of e-waste recycling, and to the processes involved in informal e-waste recycling in the state.
Traders, dismantlers and recyclers were interviewed to understand the market fl ow and the trade practices. Informal discussions were carried out and emerging trails were followed to investigate such activities. Th e recy-cling units were surveyed to assess their environmental and occupational health impacts. Also, information was gathered on volume of e-waste col-lected, method of collection and its re-entry into the formal system.
Sampling
Th e scope of the study included all fi ve corporations in Tamil Nadu - namely Chennai, Madurai, Coimbatore, Trichy and Salem. Th ese cities may be the major e-waste generating sites due to their cor-poration status, and therefore this purpo-sive sampling approach. To identify the lifespan and disposal pattern of EEE, data was collected both from organisations and households. We kept distinction in data from these two streams owing to diff er-ences in their usage and disposal pattern. Th e organisations were again classifi ed as large companies, medium companies, small companies, manufacturing units, service organisations and IT sectors. Th e consumers were also ques-tioned regarding their knowledge on e-waste and its hazardous contents.
Tools of Data Collection
Based on various estimates worldwide, questionnaire was prepared to de-duce the lifespan and disposal pattern of the equipments. Calculation of institutional and household usage in the fi ve cities was done separately.
One-on-one interaction was conducted in most cases, and interviews were based on general questions. Information was gathered on WEEE disposal from all users. Th e users were sensitised about the issue, and their opin-ions sought on possible solutions for safe disposal of WEEE. Th ey were specifi cally asked to mention whether the manufacturers, the users, the government, the informal recyclers should be responsible for minimising e-waste hazards.

PAGE | 33
Stakeholders
Manufacturers: Manufacturing facilities, which generate production waste, as well as importers or brand owners of electronic and electrical products are major stakeholders in e-waste management in the context of Extended Producer Responsibility (EPR), which is the new paradigm in waste management.
Users: Corporate users generate large quantities of e- waste annually. Cur-rently, business users either donate their discarded but working equip-ment to charitable organisations or auction them as scrap. However, custom bonded goods, especially in the case of IT companies, are stored till cleared by the authorities for disposal as scrap.
Household consumers generate small quantities of e-waste every year, but the total volume is huge given its market size. Toxics Link estimates that household e- waste accounts for 22 percent of junk computers in India. Currently out-of-use household computers are sold to door-to-door scrap collectors.
Recyclers: Formal e-waste recycling is an emerging concept in India. Cur-rently, collection, dismantling and recovery are done entirely by a well-established network in the informal sector. Even though the sector creates substantial value, especially by collecting and repairing disused equip-ment, some recovery processes employed are extremely dangerous. Th e environmental and occupational health is compromised at these primitive recycling units.
Data Analysis
Globally recognised Market Supply Method was used to analyse the data and assess the amount of e-waste generated in the state. Market Supply Method: To arrive at a realistic fi gure of WEEE genera-tion, we used the ‘Market Supply Method’, which was fi rst used in Ger-many for an investigation of WEEE assessment in 1991 and is based on the assumption that 100 percent of the units sold in a particular year will become obsolete at the end of the average life of the product. WEEE ris-ings were assessed based on the sales statistics and average lifespan of the products. Th e method assumes that equipment sold in a particular year will turn out as waste after completion of its useful lifespan. Th e other assumption is that there is a negligible variance in the average lifespan of electronic equipments (Wilkinson et al. 2001).
OBJECTIVE AND STUDY METHODOLOGY

PAGE | 34 E-WASTE TAMIL NADU BRACES UP FOR THE CHALLENGE
For the sales data in the region, leading OEMs of the fi ve listed equip-ments were approached. Since the total market size was not available, sales data and market share of individual companies in percentages were recorded. Based on the market share of the companies, the total market supply of a particular product was derived.
Users, both large and small, were contacted for calculating average lifes-pan of the products. Results for diff erent products were separately ana-lysed. In the case of personal computer the market was divided as business and individual users. Hence, average lifespan of a PC in business and in-dividual use was calculated separately based on the information obtained. But since sales data were not segment wise, we needed to arrive at a mean lifespan.
In calculating the mean lifespan of a PC, its average lifespan values in business and household environs was taken. But since businesses account for more than 70 percent of the total computer sales volume , 70 percent weightage was given to the average lifespan calculated for business user market. For obtaining lifespan of other equipments, same method was ap-plied. But since for other products household segment is the major mar-ket, more weightage was given to the average lifespan from households. (For details see annexure.)
Table 3. Average lifespan of electronic equipmentType of electronic equipment Average useful lifespan (Years)
Television 8
Personal computers 3
Refrigerator 7.5
Cellphone 2
Washing machine 8
Table 4. Average weight of electronic equipmentType of electronic equipment Average Weight (Kgs)
Television 25
Personal computers 27.2
Refrigerator 30
Cellphone 0.125
Washing machine 27
The average weight is based on the product literature survey.

PAGE | 35
Th e average lifespan of diff erent equipments thus calculated is shown in Table 3. It was calculated based on the user feedback, whereas average weight was obtained from the product literature survey.
Both the individual and corporate data were collected from the fi ve major cities of Tamil Nadu: Chennai, Madurai, Coimbatore, Trichy and Salem.
Limitations
Th e concept of e-waste recycling is in a nascent stage in Tamil Nadu. Hence, the study had the following limitations-
1 No offi cial fi gures available for the market size of the electronic products used in this study. Th e assessment fi gures are approximation based on limited information.
2 E-waste consists of various electronic and electrical equipments. But due to the limited nature of this study, the assessment took into ac-count only limited equipments.
3 Absence of information on end-of-life disposal procedures for WEEE. Th ere is a lack of awareness on e-waste and its disposal policy.
4 E-waste recycling has received a lot of media attention of late. Th is has made people in the informal recycling wary of sharing information on e-waste sites and processes.
5 Th ere was not much information available on import of e-waste in Tamil Nadu. Th e port offi cials did not have the required information because of the illegal nature of such imports.
OBJECTIVE AND STUDY METHODOLOGY

PAGE | 36 E-WASTE TAMIL NADU BRACES UP FOR THE CHALLENGE
C H A P T E R 5
Findings and Discussion
Tamil Nadu is the 11th largest state in size and among the foremost states in overall development. Th e per capita income in the state is among the highest in India, showing 350 percent growth in the last decade. Phe-nomenal growth in income coupled with high literacy rate has spawned the growth of consumer goods market, particularly of IT equipments like computers. Electronics manufacturing is a booming industry in Tamil Nadu. Companies like Nokia, Flextronics, Motorola, Sony-Ericsson, Foxconn, Samsung, Cisco, Moser Baer and Dell have chosen Chennai as their manufacturing hub in South Asia. Products manufactured include circuit boards and cellular phone handsets. Th e state, especially the capital Chennai, has also emerged as one of the favourite destinations for large corporates.
Among many positive impacts of this growth, is a negative impact of increased waste generation. Th e concern is signifi cant because of the waste toxicity, its volume and likely growth in next few years. . It is therefore imperative to assess the quantity of the waste generated, to help the state in setting up infrastructure for it management.
E-waste Assessment in Tamil Nadu
Toxics Link, in its study Scrapping the Hi-Tech Myth, in 2003 highlight-ed the problems concerned with e-waste in Delhi and in India. Subse-quently in 2003-04, a national level study conducted by IRGSSA assessed the amount of e-waste generated in each of the states and large cities. Th is study was based on the penetration method, and established Tamil Nadu as one of the leading e-waste generating states in the country.
In another study - Time is Running Out, Toxics Link highlighted the issues of e-waste in Tamil Nadu especially in the city of Chennai. Th e re-

PAGE | 37
port lay emphasis on the problem of imports of e-waste and the hazardous recycling practices in Chennai.
A nationwide assessment on e-waste was taken up by GTZ-MATI in 2007. Th is gave an estimate of total e-waste generation in the country. Lack of defi nite information on statewise generation and recycling prac-tices remained and hence didn’t help in supporting state level policies on e-waste management.
Personal Computers: With major computerisation across all sectors, use of personal computers has seen an unprecedented growth in recent years (Fig 2). Th e penetration of computers in the household segment has also seen an upward trend. Th ough there has been a slight downtrend in the overall sales in 2008, the market has stabilised and shown signs of resur-gence in2009. Th ese sales fi gures are collated from inter views and ques-tionnaire based survey conducted among major computer brands in the country.
Interviews with business users have shown an average lifespan of 2-4 years for a PC. Similar surveys with the household segment showed a little longer lifespan. We used these results to arrive at a mean functional lifes- pan of a computer as 3 years across all segments. Based on this input, we have used two separate methods for estimation of waste generation from desktop computers. Details of these methodologies are given below.
Th e Market Supply Method I is based on the assumption that 100 per-cent of the units sold in a particular year will become obsolete at the end of the aver-age life of the product. Now, if we apply our fi ndings of
FINDINGS AND DISCUSSION

PAGE | 38 E-WASTE TAMIL NADU BRACES UP FOR THE CHALLENGE
lifespan to this, we expect all PCs sold in the previous three years to come into the waste stream in the current year. Th erefore, the PCs sold in 2006 would be coming to the waste stream in 2009.
Table 5. Estimation of e-waste generated from desktop PCs in Tamil Nadu by Market Supply Method IYear No of sold
ComputerAverage Lifetime (years)
No of Obsolete PCs
Weight in kg
2001 1413432002 1782002003 1740782004 259740 141343 38445302005 410805 178200 48470402006 478933 174078 47349222007 532 690 259740 70649282008 453909 410805 111738962009 461250 478933 130269782010 544275 532690 144891682011 453909 123463252012 461250 125460002013 544275 14804280
Under market supply method 1,41,343 computers units sold in 2001, for example, will come out as waste in 2004, after their average life of three years. Table 5 represents the fi gures of total PCs being added to the mar-ket each year from 2001 to 2009 and the quantum of e-waste generated in the following years. At an average weight of 27.2 kg for a desktop PC, the table shows the quantum of e-waste generated each year from 2004 to 2013. Computer sales for the years 2009 and 2010 are estimates based on the industry projections. Th e fi gures for waste in the years 2012 and 2013 are based on these assumptions.
Th e Market Supply Method II is based on the assumption that a product may not become obsolete at the end of a particular period assumed to be its lifespan. Th e product may continue to be disposed of in varying quantities around its average lifetime. For example, when we deduce that the average lifespan of a desktop PC is three years, we are aware that some of it may get discarded before and some beyond the period of average lifespan.
Th is method also takes into account the market supply volumes. For each year, the number of PCs sold is stated and a distribution pattern is applied to calculate annual waste in each distribution range. Th e total waste gen-erated is fi nally achieved by adding the quantities generated in a particular year.

PAGE | 39
Industry information suggests 70 percent computer installations are in businesses and 30 percent in households. It has also been refl ected in the survey that computers in business sector have a shorter lifespan in com-parison to household sector. On account of this diff erential usage in busi-ness and household sectors, a weightage in the proportion of 70-30 has been given to analyse the survey results for year wise distribution pattern. Th e results of the distribution pattern in percentages are 45,15,25,15 in years 2,3,4,5 respectively.
For example, if around 410,805 computer units were sold in the year 2005, 45 percent of this or 184862 units will come out as waste in the second year of the sales, i.e. in the year 2007. In 2008 and 2009, 15 percent and 25 percent of it or 61620 and 102701 units, respectively, will be discarded. Th e remaining 15 percent or 61620 units will reach their end-of-life in 2010. Similar distribution pattern will be applied to the market sales fi gure of the other years. Th erefore waste in a particular year will be a cumulative of computers sold over four years (see Table 6). Th e waste fi gures calculated for year 2003-2005 and 2013 in this method are incomplete as the sales data for certain years are not available.
Table 6. Estimation of e-waste generated from desktopYear No. of PC sold Average lifetime
(years)No. of obsolete PC
Weight in Kgs
2(45%) 3(15%) 4(25%) 5(15%)
2001 1413432002 1782002003 174078 63604.35 17300382004 259740 101391.45 27578472005 410805 140400.85 38189032006 478933 208746.15 56778952007 532690 294072.75 79987792008 453909 368187.3 100146952009 461250 453212.7 123273852010 544275 465516.55 126620502011 480661.3 130739872012 507492 138037822013 265040.1 7209091
Th e fi ndings based on this method refl ect almost similar pattern of waste generation as evident from the Market Supply Method I. If we take a mean from these two methods (Table 7), the waste generated from computers in 2009 will be around 12677 tonnes and projected to reach around 13174 tonnes in 2012.
FINDINGS AND DISCUSSION

PAGE | 40 E-WASTE TAMIL NADU BRACES UP FOR THE CHALLENGE
Mobile phones: Th e Indian telecom industry has grown rapidly during the last few years. It has the third largest telecom network in the world and the second largest mobile network with over 400 million subscribers at the end of April 2009. Th e industry has witnessed rapid increase in its subscriber base over the past few years largely due to the declining mobile tariff s and availability of low cost handsets. In year 2008, the country wit-nessed monthly average increase of 10 million subscribers to mobile ser vices. Tamil Nadu’s growth in the cellular phone subscriptions in 2008 far out weighed the national average - it grew by 80 percent compared with the national average of 58 percent. Th e reasons attributed to the substan-tial growth in Tamil Nadu are lower call rates compared to other centres, large capital investments by the cellular operators, massive growth in retail operator base and fast pace of urbanisation.
Th e growth in the subscriber base is entwined with growth in mobile phone handset market. Th e handset sales, which was around 8.5 lakh units in 2005, rose to more than 13 lakh units in 2008, and is projected to grow at more than 20 percent in the next few years.
Table 7. Comparison and mean of method I & IIYear Market supply method
(kg)Market supply method 'A" (kg)
Average Value (in tonnes)
2009 13026978 12327385 126772010 14489168 12662050 135752011 12346325 13073987 127102012 12546000 13803782 13174

PAGE | 41
With newer features being added to mobile phones everyday, the replace-ment market has also grown substantially. Our surveys suggest that the life- time of a mobile phone is around two years. Under market supply method, it is estimated that in 2009 the amount of e-waste from mobile handsets would be around 137 tonnes. Th is fi gure is likely to touch 255 tonnes in 4 years.
Colour television: Th e history of colour television industry in India dates back to 1982 - the year India hosted Asian Games. In 1984-1985, the colour television industry was growing at an astounding rate of 140.3 percent. Subsequent years did see a slow down in its growth. However, the period after the liberalisation of the Indian economy marked a new begin-ning for colour television industry: two factors, lower price and greater entertainment from cable TV fuelled its rapid growth.
Table 8. Estimation of e-waste generated from mobile phones in Tamil Nadu by market supply methodYear No of Mobile
handsets soldAverage Life-time (2 years)
No of Obsolete Phones
Weight in kgs
2005 8588482006 9994852007 1096894 858848 1073562008 1188741 999485 1249362009 1331311 1096894 1371122010 1624199 1188741 1485932011 2046490 1331311 1664142012 1624199 2030252013 2046490 255811
FINDINGS AND DISCUSSION

PAGE | 42 E-WASTE TAMIL NADU BRACES UP FOR THE CHALLENGE
Almost 50 percent households in the state own one colour television set each. In recent years though there has been a slow down in the colour tel-evision market (fi gure 5). Th is is a result of the rapid growth in the LCD and plasma screen television sales, which is slowly replacing the normal fl at screen CTV. Th ese sales do not take into account the free distribution of television by the current government in Tamil Nadu. A 14-inch colour TV, with no brand name, is seen even in the most humble dwelling in the state.
According to a study, the colour television ownership in Tamil Nadu is around 53 percent.
Under Market Supply Method I, 2971 tonnes of waste was generated in Tamil Nadu in 2009 from CTVs sold in 2001. Th is calculation is based on sale of 118863
CTV units with lifespan of eight years and each weighing 25 kg (calcula-tion based on survey fi ndings).
Th is study does not take into account the waste arising from that B/W television owned by about one-third of households in Tamil Nadu.
Table 9. Estimation of e-waste generated from CTV in Tamil Nadu by market supply methodYear No of Colour
TVs sold Average Lifetime (8 years)
No of Obsolete TVs
Weight in kgs
2001 1188632002 1528522003 2008222004 3266932005 2536602006 3328222007 3126052008 2378452009 214915 118863 29715752010 152852 38213002011 200822 50205502012 326693 81673252013 253660 63415002014 332822 83205502015 312605 78151252016 237845 59461252017 214915 5372875

PAGE | 43
Refrigerators and washing machines: According to a market research re-port, 22 percent households in Tamil Nadu own a refrigerator and around 10 percent own a washing machine. Growth in refrigerator sales has been steady as evident in fi gure 6 and is expected to grow at the same rate for the current year.
Table 10. Estimation of e-waste generated from refrigerators in Tamil Nadu by Market supply methodYear No of Colour TVs
sold Average Lifetime (8 years)
No of Obsolete TVs
Weight in kgs
2001 1499402002 1632682003 2665602004 3082102005 3248702006 3415302007 3523592008 3665202009 374850 149940 44982002010 163268 48980402011 266560 79968002012 308210 92463002013 324870 97461002014 341530 102459002015 352359 105707702016 366520 109956002017 374850 11245500
FINDINGS AND DISCUSSION

PAGE | 44 E-WASTE TAMIL NADU BRACES UP FOR THE CHALLENGE
Washing machine sales have seen good growth, too, from only around 43,000 units sold in 2001 to 200,000 units expected to be sold in 2009 - a growth of 360 percent in less than a decade. It is interesting to note that unlike desktop computers and television there is hardly any unbranded market in washing machines and refrigerators.
Under market supply method the waste from refrigerators is estimated to be around 4500 tonnes in 2009 given eight years of lifespan, but is expected to go up to 10000 tonnes in next fi ve years.
Th e waste arising from washing machines is comparatively less owing to its lesser penetration in the state. In 2009, e-waste from washing machines is expected to be around 1100 tonnes and in 5 years it is expected to reach around 4000 tonnes.
We have not taken into account other electronic and electrical goods like air-conditioner, audio and video equipment, kitchen appliances, which have very good penetration in the Tamil Nadu households and will con-tribute to the total e-waste generated in the state.
E-waste in Chennai
Toxics Link fi rst conducted a study on e-waste in Chennai in year 2003-2004. Th e study had identifi ed sources and e-waste recycling hotspots in the city.14
Considerable quantities of e-waste are reported to be imported. However, no confi rmed fi gures are available as most of such trade is camoufl aged

PAGE | 45
and conducted under various pretext ranging from donations to mislabel-ling of the imported goods. Th e government trade data does not distin-guish between imports of new and old computers and peripheral parts, which makes it diffi cult to track what share of imports are used electronic goods.
Other Key Findings
Total number of household respondents surveyed was 250 and the com-pany respondents were 175 in the identifi ed 5 cities of Tamil Nadu.
TV Ownership Patterns
Currently conventional Cathode Ray Tube (CRT) television is the most commonly owned television across households in Tamil Nadu. Th e penetration of CRT fl at television has also increased in the last few years. Major brands in household segment are LG, BPL, Onida and Samsung. Th e most preferred size is 20-21 inches. Even though the number of large screen and LCD televisions is increasing in Indian market, most com-monly owned televisions are the 21 inches fl at screen. Th erefore, over the next few years only conventional CRT TVs will be seen in e-waste cycle stream.
Type of Computers Used in Households
About 60 percent households use assembled computers and 40 percent use branded ones. Management of the assembled computers may become an issue, but a closer look reveals that components used in such comput-ers are branded ones.
60 % Assembled
40 % Branded
FINDINGS AND DISCUSSION

PAGE | 46 E-WASTE TAMIL NADU BRACES UP FOR THE CHALLENGE
Lifespan of Mobile Phones
A little more than one-third (34%) respondents had changed their mobile phone handsets more than twice, and a few of them had even changed more than fi ve times in view of updated models, features, etc.
Sources of Mobile Phone E-waste
Manufacturing: Till recently major handset manufacturers like Nokia, Samsung, Motorola, Sony Ericsson, LG, imported or assembled their handsets in India for sales in the region. In 2005, Nokia set up its manu-facturing base in Cheenai, Motorola, Sony Ericsson followed suit, while LG and Samsung found base in other states. It is expected that domes-tic manufacturing will ultimately replace imports, and cellular handset industry here will eventually become export-oriented. Nokia has already reached a shipment volume of 50 million handsets, as on December 2008. Th is implies further increase in e-waste.
Cell phone repair shops: Th ere are two major categories of cellular hand-sets -.GSM (Global System for Mobile Communications) and CDMA (Code Division Multiple Access). A large number of cellular handsets brought for repairs are GSM technology phones. Sur vey of cell phone repairers in the selected fi ve cities of Tamil Nadu revealed that fewer CDMA handsets are brought for repairs, as their spare parts are rarely available. In GSM handsets some common faults that come up with use are related to circuit board, voice quality, signal recep-tion, microphone, and display. Useful parts of disused mobile phones are often used in repair works. E-waste generation at repair shops however is minimal as most handsets brought for repair are generally returned to the consumers whether repaired successfully or not.

PAGE | 47
Battery, which comprises almost one-third of mobile phone handset by weight, is a very important component for waste mitigation. Nowadays lithium-ion battery is used in most handsets. Th eir average life is one-and-a-half to two years. After completing its functional life, mobile phone bat-tery becomes valueless even in scrap. Th ere is no mechanism for dealing with old batteries; these are either discarded in dustbin or thrown away randomly. Some of the mobile repair shop owners know about the con-tents of these batteries, but not their hazardous nature. Th ey are also not aware of any legislation on e-waste disposal or management.
Total E-waste Generation in Tamil Nadu
The total e-waste generated in the state from the fi ve popular gadgets - personal computers, mobile phones, colour televisions, refrigerators and washing machines - is around 22,000 tonnes in 2009, and is expected to grow rapidly to around 35,000 tonnes in another fi ve years. These are projected fi gures and take into account the cur- rent growth rate and obsolescence rate of these equipments.
A close look at these fi gures makes it evident that the maximum waste in terms of weight, around 59 percent is generated from personal computers, and it is pro- jected to stay this way because of their short life span. Though mobile phones contribute only around one percent of e- waste in the state, their e-waste volume is signifi cant for recovery of precious metals.
The study assesses e-waste generated from businesses and households only. One major sec-tor - manufacturing - has not been covered due to lack of data from the government agencies as well as manufacturing units. With manu- facturing industry on the rise in Tamil Nadu, the waste generated from it will be signifi cant.
Table 12. Total e-waste generated in Tamil Nadu (in tonnes)Year PC Mobile
PhoneCTV Refrigera-
tor WM Total (in
Tonnes)2009 13027 137 2972 4498 1176 218102010 14489 149 3821 4898 2397 257542011 12346 166 5021 7997 2649 281792012 12546 203 8167 9246 3036 331992013 14804 256 6342 9746 3599 34746
FINDINGS AND DISCUSSION

PAGE | 48 E-WASTE TAMIL NADU BRACES UP FOR THE CHALLENGE
Repair and Maintenance
Households: A majority of respondents opt for authorised service centres for the repair and maintenance of electronic devices, but do not opt for annual maintenance contract (AMC) for repair and maintenance of their computers.
Companies: About 58 percent of companies interviewed have inter-nal departments for repairs and maintenance; 3.5 percent have annual maintenance contract for the computers used in their institutions, while nearly 40 percent adopt call on service for repair and maintenance of their computers.
Disposal Practices
Th is section discusses the behaviour associated with the disposal of used electronic products. In Chennai, house- holds and businesses (institutions included) are two streams of e-waste.
A majority of individual respondents disposed of their e-waste by way of exchange with some other product, giving it to friend/relative/ charitable organisation or by selling to computer repairers or informal recyclers, etc.
A majority of business and institutional establishments dispose of about eight percent of computers 86 percent of colour television sets, 82 percent of refrigerator and 44 percent of mobile phones in exchange schemes. While 18.5 percent of disused computers are sold to informal recyclers, only one percent reach formal recyclers. Most of the companies in Tamil Nadu are bonded with STPI (Software Technology Park India), where these companies have to take approval from STPI before disposing of their computers and other IT products. Th us, if a formal recycler ties up with bodies like STPI, sourcing of e-waste will become organised.
Note: None of the companies interviewed has a policy on e-waste.
Import of E-waste
Illegal imports are a major source of e-waste in India. In developed countries, it is expensive to recycle discarded electronics. Th us the used electronics are exported to developing nations, camoufl aged as charity or metal scrap. Such imported electronics usually have short life or are unfi t for use and ultimately add to e-waste stream.

PAGE | 49
In India this trade fl ourishes because of cheap labour that makes it eco-nomical to repair and reuse the equipment/components, and the absence of strict import regulations. Given these conditions, India has become a favourite dumping destination for e-waste.
Such imports are nonetheless illegal as India is a signator y to Basel Con-vention for Transboundar y Movement of Hazardous Substances. On the other hand, the clandestine nature of such imports makes it diffi cult to estimate the real quantities of e-waste dumping in the country. Th e Chennai Port Trust offi cials seem to be unaware of the entire issue. Also they do not have control over what happens to the mixed metal scrap after it lands at the port. Th ere seems to be no proper records of total metal scrap being imported and its constituents.
Recycling Practices
In Tamil Nadu both formal and informal units recycle electronic reject. However, recycling by formal sector is minuscule. Th ey have large capaci-ties, but have not been able to develop a designated collection mecha-nism. Th e bulk of e-waste is picked up by unorganised recyclers for mate-rial segregation, extraction and sale.
Operations of Informal Recycling Sector
Th e trade in e-waste is camoufl aged and thriving business in Chennai. Th e informal recycling units in the city carry out pre-processing, includ-ing repair and recover y of metals and precious metals. Th e conditions in which they operate are hazardous both for the individuals and environ-ment. Open burning and use of strong acids to retrieve metals are com-mon procedures; working in poorly ventilated or enclosed areas without masks and technical expertise results in exposure to dangerous and poi-soning chemicals. Labourers, many of them women and children, melt computer parts in strong acids, releasing a smoky stream of lead, dioxin and other toxins. Th ere are many informal recycling units located in dif-ferent parts of the city:
1. Rangarajapuram - (residential area)
2. Perungudi - IT highway
3. Th iruvanmiyur - (residential area)
4. Allandur - (residential and industrial area)
5. Guindy - (industrial area)
FINDINGS AND DISCUSSION

PAGE | 50 E-WASTE TAMIL NADU BRACES UP FOR THE CHALLENGE
6. Royapettah - (schools, colleges and hospitals)
7. Saidapet - (residential and commercial area)
8. Tripllicane - (residential area, hostels and colleges)
9. Richi Street - (commercial area)
10. Moore market - (commercial area)
11. Paadi - (industrial area)
12. Ambattur - (industrial area)
Certain markets in the city thrive entirely on e-waste reprocessing. Richie Street is popular for used electrical goods. New Moore Market, Chin-tadaripet, Pudupet are known for scrap or second-hand goods markets, while Royapuram and Th iruvotriyur have a number of units specialising in some recycling activities.
Th e city’s e-waste recycling hubs are concentrated in
1. Guindy industrial area,
2. Richi Street (scrap market )and
3. Th iruvanmiyur situated on the East Coast Road 15 unit employs three to four people, and receives around two to three personal computers per day. Discussions with a dealer on Richi Street, who has been operating for the past 10 years, revealed that he makes a profi t of Rs 15000 to 20000 per month. He sources e-waste from software companies. Units like his get e-waste through auctions and tenders.
Economics of e-waste recycling: Th ere are three major stakeholders in e-waste economics: Th e importers, who have their own e-waste recycling units and make the maximum profi ts; the scrap dealers, who make profi ts in the range of Rs 10,000 - 20,000 per month and the workers, who work for daily wages ranging from Rs 100 - 150.
Transportation of e-waste: E-waste is transported in all possible ways in-cluding open trucks, fi sh carts and public transport vehicles. Th e whole-sale scrap dealers buy e- waste either in auctions or through illegal agents, and sends it to small informal recyclers.
Formal e-waste recyclers: Th e main objective of a formal recycler is to collect, store, dismantle and recycle all electronic and electrical waste with least health or environmental impacts. Th e Central Pollution Control Board has issued a guideline detailing the process and technology for environmentally sound management of e-waste and most formal recyclers

PAGE | 51
are expected to comply with these guidelines. Th e formal recyclers are also expected to comply with occupational health and safety norms. Most re-cycling facilities in the city are in various stages of transition, growth and evolution, and are making eff orts in acquiring appropriate technologies for handling e-waste.
Collection method: Formal recyclers source their raw material (i.e. used electronic products) from large business organisations only. Most of these recyclers tie up with these institutions and sign a contract to pick up their disposable electronic products. Under such tie- ups, not only are the waste computers collected, but also other discarded electronic/electrical devices like tube lights, CDs, batteries, cables, etc., that may pose a threat to hu-man health and environment.
Operations of Formal Recyclers
Th ere are fi ve formal e-waste recyclers around Chennai who have been recognised by the Tamil Nadu Pollution Control Board - Th rishyiraya Recycling India Pvt Ltd, INAA Enterprises, AER World Wide (India) Private Ltd, TESAMM Recyclers India Pvt Ltd and Ultrust Solution (I) Pvt Ltd. Th e waste is obtained from software companies and is segregated by type.
Th e circuit boards from all electronic items are categorized into four types:
• Type A - Boards with gold-coated pin connectors - motherboard, circuit boards in hard disk, RAM, VGA, mobile phones.
• Type B - Boards with 80 percent integrated cir- cuits (ICs) - fax ma-chines, printers, and EPBX boards.
• Type C - Boards with 50 percent ICs - monitor, mouse, keyboard, phone boards.
• Type D - Board with 20 percent ICs - circuit boards in televisions, power supply unit boards.
Plastic scrap, shredded pieces, copper and aluminium components are exported for better returns. Iron scrap is sold to iron smelters and the glass to the CRT manufacturers. Rubber and phosphorus are accumulated at site due to lack of disposal methods.
FINDINGS AND DISCUSSION

PAGE | 52 E-WASTE TAMIL NADU BRACES UP FOR THE CHALLENGE
Formal Recyclers in Tamil Nadu
Trishyiraya Recycling (India) Pvt Ltd: It is in operation for the last seven years (pre-processing). Trishyiraya recycles all electronic and some electri-cal devices. Th is
100 percent export oriented unit, set up at a cost of 80 crore, has a capac-ity of 1000 t/year (2007) with an annual turnover of Rs 60,000,000. It collects e-waste from all major multinational companies. While foreign MNCs give e-waste free of charge, some Indian MNCs charge e- waste collection fee. Trishyiraya also gets scrap from Chennai Port Trust and Customs department.
Th e facility follows occupational and environmental compliances and is approved by the Ministry of Commerce, TNPCB, CPCB and MOEF. Its recycling unit is located in Chennai (MEPZ) and collection units in Pondicherr y, Madurai, Bangalore, Mumbai and Jodhpur. Th e circuit boards are exported as the facility does not have metal recovery technol-ogy.
The Misery of New Moore
The New Moore Market is located in underdeveloped North Chennai. It is a major site for recycling electronic scrap dumped by developed countries. The money is good, the risks grave. But there is very little concern about the risks or long-term implications of this business. The market streets are usually choked with smoke from burning electronic junk.
Children play with the hazardous waste strewn around. Many eke out a living from this junkyard. They scour the area for plastic scrap and smelt it with plastic wastes from wires and electronic equipment. This waste is then molded into plas-tic blocks, which are sold to bigger dealers to earn a few extra bucks.
Metals like iron, copper and gold are extracted by burning the scrap or by soak-ing them in concentrated acids. Workers keep their hands dipped in chemical solutions for long for treating and recovering wee bits of gold from some circuit boards. The burning and melting of these toxic substances puts their health at risk, most of them complain of breathing problems and skin ailments.
New Moore Market alone has a worker strength of 50, which includes women and children. The workers are paid a daily wage of Rs100 to 150, depending on their workload. These workers are just a small fraction of a huge population that is a part of this illegal but fl ourishing trade.
UL Trust Solutions (I) Pvt. Ltd: Started in June 2002, it is engaged in the collection and recycling of electrical and electronic scrap. Computers and
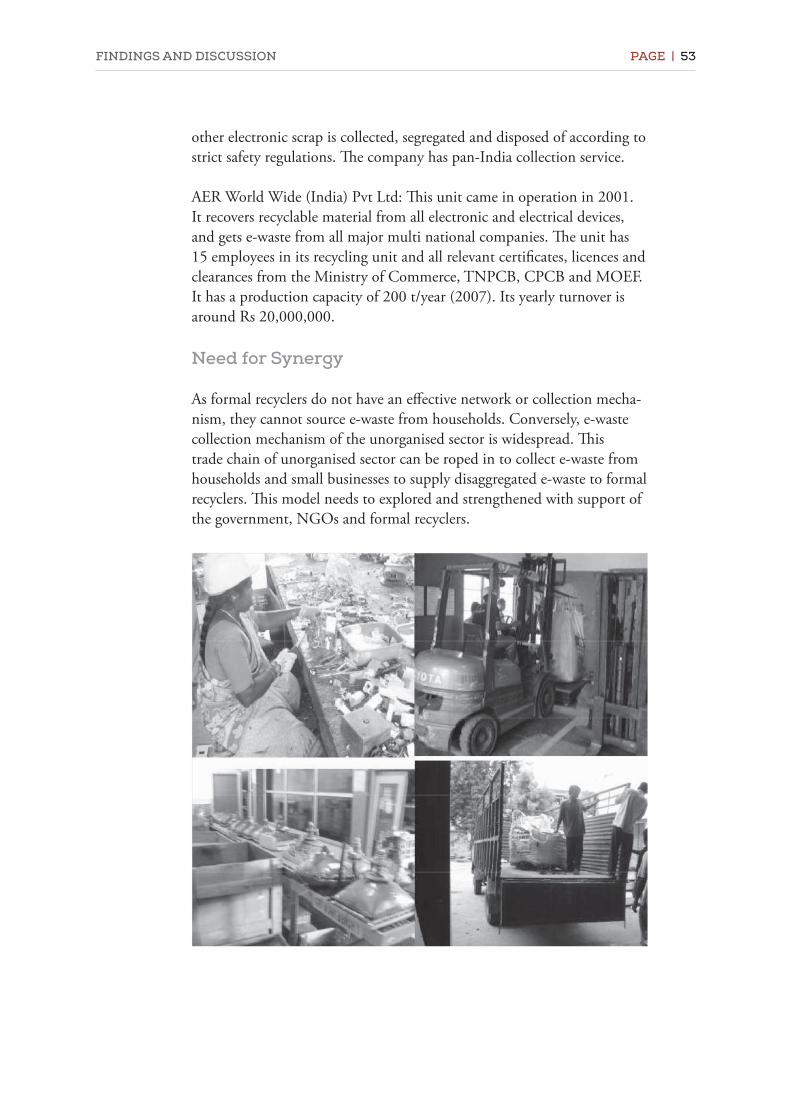
PAGE | 53
other electronic scrap is collected, segregated and disposed of according to strict safety regulations. Th e company has pan-India collection service.
AER World Wide (India) Pvt Ltd: Th is unit came in operation in 2001. It recovers recyclable material from all electronic and electrical devices, and gets e-waste from all major multi national companies. Th e unit has 15 employees in its recycling unit and all relevant certifi cates, licences and clearances from the Ministry of Commerce, TNPCB, CPCB and MOEF. It has a production capacity of 200 t/year (2007). Its yearly turnover is around Rs 20,000,000.
Need for Synergy
As formal recyclers do not have an eff ective network or collection mecha-nism, they cannot source e-waste from households. Conversely, e-waste collection mechanism of the unorganised sector is widespread. Th is trade chain of unorganised sector can be roped in to collect e-waste from households and small businesses to supply disaggregated e-waste to formal recyclers. Th is model needs to explored and strengthened with support of the government, NGOs and formal recyclers.
FINDINGS AND DISCUSSION

PAGE | 54 E-WASTE TAMIL NADU BRACES UP FOR THE CHALLENGE
E-waste Initiative in Tamil Nadu
In year 2005, Tamil Nadu Pollution Control Board (TNPCB) commis-sioned Centre for Environmental Sciences, Anna University, to make an inventory of all facilities generating, importing, storing and recycling e- waste. Th e Board observed that the major sources of e- waste in Tamil Nadu was the software companies, the government, public and corpo-rate sector, PC retailers and manufacturers, secondary market of old PCs and dumping from developed countries. Th e same year it constituted a fi ve-member committee to study issues in e-waste management in the state. Periodical stakeholder meetings were organised, and subsequently the Board gave its consent to establish and operate fi ve e-waste recycling facilities in Tiruvallur and Kancheepurm districts of Tamil Nadu.
Th e Board had also proposed that promoters of IT Parks provide com-mon or individual e-waste disposal facility. It requested the state IT Department to include provisions for e-waste management in the state’s IT Policy.
In the wake of learning of past few years, Tamil Nadu government is preparing a policy on e- waste management for the state. Th e said policy will also lay guidelines for the manufacturers of EEE in the management of e-waste.
Banks - a case study
Discussions with a few banks in the city revealed a system of auctioning e-waste to scrap dealers at most places. Indian Overseas Bank has a tie up with the computer manufacturers (HCL, WIPRO) for the replacement of old computers with the new ones, which the manufacturers sell to scrap dealers for a minimal amount.
State Bank of India normally gives its old computers to its own employees at a minimal rate, and Bank of Baroda normally gives its electrical and electronic wastes to scrap dealers through auction. These banks have no idea about what the dealers do with these wastes.

C H A P T E R 6
Recommendations and Conclusion
In view of its fi ndings on e-waste management in Tamil Nadu, Toxics Link recommends the following measures.
Policy on E-waste
Th e issue of waste has received policy makers’ attention, and the country has witnessed three separate regulations on waste management in the last 10 years. Yet, electronic waste, which has been identifi ed as a fast grow-ing toxic waste stream, does not have a specifi c legal framework to deal with its management. Currently it is covered under the Hazardous Waste (Management, Handling and Transboundary) Rules, 2008. But this Rule does not address all e-waste issues. Th e country has developed a guideline on hazardous waste management under this rule, but it has serious limita-

PAGE | 56 E-WASTE TAMIL NADU BRACES UP FOR THE CHALLENGE
tions in guiding e-waste management. Most stakeholders favour regula-tions at the national level for safe management of e-waste. In the inter-regnum of such national policy measure however the state level policy can bring order in e-waste management.
Extended producer responsibility
Extended producers’ responsibility (EPR) is a fundamental framework for e-waste management in many countries. Th is has been tested in many countries, and seems to be an appropriate framework in the manage-ment of e-waste. Th is concept needs to be mandated through a regula-tory framework and implemented for eff ective management of e-waste in India.
Develop suitable infrastructure
In view of the current assessment of e-waste generation in the state and its future growth projections, the state is required to evaluate not only its in-stalled e-waste processing capacity, but also the kind of technologies used to take up end-to- end recycling of such waste. Th e state policies should aim to create opportunities for investment in this sector with a longterm vision for adoption of high-end technologies for recycling such complex waste.
Create models
In the absence of a collection mechanism, models based on EPR can be eff ective. Waste collection is a major challenge faced by formal recycling units. Tie-up with local informal recycling sector can also be viable.
Information and Awareness
Absence of mass awareness on this issue in India is a serious bottleneck in its redressal. It is paramount that government develops a road map for creating awareness on various e-waste issues. Partnerships with NGOs can be very eff ective in this objective.
Dumping
Illegal imports are a major source of e-waste. It is an easy route for shift-ing the environmental cost from developed to developing countries. Th e government is required to plug this fault and assess the volume of such dumping. Engaging intelligence and surveillance agencies in this process

PAGE | 57
may be needed as other organizations may not be compatible for uncover-ing some dependable information.
Green Products
Th e manufactures should place emphasis on research and development of products that use less hazardous materials. Use of environmentally benign materials in the production process must be promoted. Long product life would also reduce the bulk of e-waste. Th is would involve considerable investment by manufacturers of electronic goods.
Action Plan
Th e following action plan by TNCB can defi ne positive interventions in the management of e-waste in the state
1. An institutional mechanism for tracking and monitoring WEEE/ e-waste inventory, generation, collection and transportation in associa-tion with other stakeholders.
2. Multi-stakeholder study tour of countries where collection, transpor-tation, dismantling and disposal of WEEE/E-waste is working ef-fi ciently. Th is tour will help develop stakeholders’ insights in the best practices with respect to each element in WEEE/e-waste management.
3. Develop a network for collection and transportation of WEEE/ e-waste in Tamil Nadu. TNCB can work as a catalyst in integrating in-formal sector in the collection and transportation system for e-waste.
4. Develop e-waste dismantling facility in Tamil Nadu that can be initiated under infrastructure development project and subsequently transferred to state infrastructure development agency. Further, it could also be promoted under public private partnership.
5. Capacity building of all the stakeholders, including TNPCB offi cials, local municipalities, existing dismantlers, customs, port authorities and NGOs.
Conclusion
Institutional infrastructure for e-waste collection, transportation, treat-ment, storage, recovery and disposal needs to be established at regional levels for its environ- mentally sound management. An eff ective take-back programme providing incentives for producers to design products that are less wasteful, contain fewer toxic components, and are easier to disas-semble, reuse, and recycle may help in reducing the wastes. Such a pro-
RECOMMENDATIONS AND CONCLUSION

PAGE | 58 E-WASTE TAMIL NADU BRACES UP FOR THE CHALLENGE
gramme should defi ne enforcement mechanism, set tar- gets for collec-tion, reuse or recycle, create incentives to encourage consumers to return disused electronic devices for reuse/recycle, and eff ect reporting require-ments for the manufacturers. End-of-life management should be made a priority in the design of new electronic products.

Reference
• Noraida B.T., Yousuf, 2005, A Study on Electronic Waste
• Greenpeace, Aug 2008, An Assessment of E-waste Take back in India
• UNEP, 2007, Vol.I, E Waste - Inventory Assessment Manual
• Kurian Joseph, 2007, Centre for Environmental Studies, Anna University, Chennai, India, Electronic Waste Management in India - Issues and Strategies
• Prasanna Kumar and S. Shrihari, Proceedings of the International Conference on Sustainable Solid Waste Management, Sep 2007, Chennai, Estimation and Material Flow Analysis of Waste Electrical and Electronic Equipment
• GTZ, November 2007, E-Waste Assessment in India.
• Praveen Dalal, 2007, E-Waste in India
• Society for Development Alternatives, Nov 2005, Facilitating Partner-ships for Environmentally Sound Management of e-Waste in India
• Maharashtra Pollution Control Board, Mar 2007, Report on Assess-ment of Electronic Wastes in Mumbai-Pune Area
• Aastair I. (2004), , Massachusetts Institute of Technology, Mapping Environmental Justice in Technology Flows: Computer Waste Impacts in Asia Global Environmental Politics 4:4, Asia-Pacifi c Regional Scop-ing Workshop on Environmentally Sound Management of Electronic Wastes, 19-22 November, 2002, Tianjin, China,
• Ammons J and Sarah B., 2003, Eliminating E-waste: Recycling through Reverse Production, www.lionhrtpub.com, accessed on 7 September 2005.
• CII (2006). E-waste management, Vol.12, Issue 1, Green Business Opportunities, Confederation of Indian Industry, Delhi.
• Devi B.S, Shobha S. V, Kamble R. K.2004. E-Waste: Th e Hidden harm of Technological Revolution, Journal IAEM, Vol.31, pp.196-205.

PAGE | 60 E-WASTE TAMIL NADU BRACES UP FOR THE CHALLENGE
• DIT 2003. Environmental management for Information Technology industry in India, Department of Information Technology, Govern-ment of India, pp.122-124.
• Envocare 2001. Mobile Phone Recycling, www.envocare.co.uk ac-cessed on 28 August 2005
• Mehra H.C. 2004. PC waste leaves toxic taste, Th e Tribune, 22 March 2004.
• Radha G. 2002. A Study of the Performance of the Indian IT Sector, www.nautilus.org, accessed on 21 June 2005.
• Ramachandra T.V and Saira V. K. 2004. Environmentally sound op-tions for waste management, Envis Journal of Human Settlements, March 2004.
• Sergio J. and Tohru M. 2005. Waste management of electric and electronic equipment: comparative analysis of end-of-life strategies, J. Mater. Cycles Waste Manag. 7:24-32
• Shobana Ramesh and Kurian Joseph 2006. Electronic waste genera-tion and management in an Indian city, Journal of Indian Association for Environmental Management, Vol. 33, No.2, pp 100-105
• Toxics Link. 2004. E-Waste in Chennai: Time is running out,
• www.toxicslink.org accessed on 14 June 2006.

EEE Sales in Tamil Nadu
Colour TelevisionsYear LG Samsung Onida Sony Others Total2001 13,075
11%17,82915%
15,45213%
22,58419%
49,92342%
1,18,863
2002 19,87013%
27,51318%
15,28510%
32,10021%
58,08438%
1,52,852
2003 32,13116%
34,14017%
18,0749%
46,18923%
70,28835%
2,00,822
2004 64,03219.6%
65,34020%
39,20312%
52,27016%
1,05,84832.4%
3,26,693
2005 50,73220%
60,87924%
20,2938%
50,73220%
71,02428%
2,53,660
2006 86,53426%
79,87724%
26,6258%
56,58017%
83,20625%
3,32,822
2007 93,78030%
81,27726%
13,1304.2%
56,27018%
68,14821.8%
3,12,605
2008 78,48933%
69,92729.4%
14,2706%
26,16311%
48,99620.6%
2,37,845
Annexure

PAGE | 62 E-WASTE TAMIL NADU BRACES UP FOR THE CHALLENGE
RefrigeratorsYear LG Samsung Others Total2001 13,494
916,49311
1,19,953 1,49,940
2002 22,85714
26,12216
1,14,289 1,63,268
2003 50,64619
53,31220
1,62,602 2,66,560
2004 73,97024
49,31316
1,84,927 3,08,210
2005 90,63827.9
45,48114
1,88,751 3,24,870
2006 99,04329
40,98312
2,01,504 3,41,530
2007 86,32824.5
63,42418
2,02,607 3,52,359
2008 89,79724.5
69,63819
2,07,085 3,66,520
2009 1,04,95828
78,71821
1,91,174 3,74,850
Mobile PhonesYear Nokia Samsung Motorola LG Sony Ericson Others
approxTotal Evolved
2005 6,69,90078%
64,4137.5%
55,8256.5%
21,4702.5%
42,8425%
4,2980.5%
8,58,848
2006 5,99,69060%
1,39,92814%
1,14,94011.5%
34,9803.5%
89,9539%
19,9942%
9,99,485
2007 5,81,35053%
1,53,56511%
93,2358.5%
87,7508%
1,31,62810%
49,3664.5%
10,96,894
2008 7,07,30059.5%
1,54,53510%
83,2107%
89,1557.5%
1,12,9308.5%
41,6113.5%
11,88,741
Sources:Nokia: Mr. Chandramouli Regional Manager SalesSamsung : Mr. Vinayagaraj Sr. HR Manager and Mr . Gopalakrishnan Regional Sales ManagerMotorola: Mr. Ramachandran Regional Sales ManagerLG: Mr Jagadeesh and Mr. Sujeeth of Regional salesSony Ericson: Mr. Vasantha Kumar Regional HR Manager and Mr. Sudheer Regional Sales Manager

PAGE | 63
Desktop ComputersYear HCL HP IBM Dell LG Others* Total
BrandedUnbranded Total
PC sales2001 23,760
18%46,20035%
11,8809%
NA 2,3761.8%
47,78436.2%
1,32,000 46,20035%
1,78,200
2002 24,50019%
39,97431%
11,0898.6%
NA 1,5471.2%
51,83740.2%
1,28,947 45.13135%
1,74,078
2003 38,48020%
53,87228%
17,8939.3%
NA 5,7723%
76,38339.7%
1,92,400 67.34035%
2,59,740
2004 60,86020%
82,16127%
29,2139.6%
16,432 10,9353%
1,04,67939.7%
3,04,300 1,06,50535%
4,10,805
2005 72,02020%
95,42726.5%
38,89110.8%
21,6066%
15,1244.2%
1,17,03232.5%
3,60,100 1,18,83333%
4,78,933
2006 99,64026%
93,89124.5%
45,22111.8%
24,5276.4%
20,1205.25%
99,83126.05%
3,83,230 1,49,460 5,32,690
2007 1, 09,04333.32%
82,79625.3%
37,30711.4%
26,5088.1%
9,4912.9%
62,11418.98%
3,27,259 1,26,65038.7%
4,53,909
2008 1,08,28831.6%
93,55227.3%
40,74411.89%
31,8709.3%
6,8542%
61,37417.91%
3,42,682 1,18,56834.96%
4,61,250
* Wipro, Acer, PCS,Zenith etc
ANNEXURE

Toxics Link Series on E-waste
• E-waste Flooding the City of Joy - (September 2007)• Mumbai Choking on E-waste - (February 2007)• E-waste in India : System Failure Imminent - (March 2004)• E waste in Chennai: Time is Running Out - (January 2004)• Scrapping the Hitech Myth - Computer Waste in India - (February 2003)

DELHIH-2, (Ground Gloor), Jangpura Extension, New Delhi - 110014T: +91-11-24328006, 24320711 F: +91-11-24321747 E: [email protected]
www.toxicslink.org