E THYLGLUCURONIDE (E T G) ASSESSED BY TWO METHODS FOLLOWING FRAGRANCE AND HAND SANITIZER EXPOSURE IN...
19
ETHYLGLUCURONIDE (ETG) ASSESSED BY TWO METHODS FOLLOWING FRAGRANCE AND HAND SANITIZER EXPOSURE IN MEN AND WOMEN Mollie Starkie, Pharm.D. Candidate Mercer University College of Pharmacy and Health Sciences
-
Upload
lester-cook -
Category
Documents
-
view
213 -
download
0
Transcript of E THYLGLUCURONIDE (E T G) ASSESSED BY TWO METHODS FOLLOWING FRAGRANCE AND HAND SANITIZER EXPOSURE IN...
ETHYLGLUCURONIDE (ETG) ASSESSED BY TWO METHODS FOLLOWING FRAGRANCE AND HAND SANITIZER EXPOSURE IN MEN AND WOMEN Mollie Starkie, Pharm.D. Candidate
Mercer University
College of Pharmacy and Health Sciences

BACKGROUND
OO CH3
COOH
HO
OH
HO
O
HOHO
COOH
O CH3OH
Ethylglucuronide

BACKGROUND
EtG analysisEnzyme multiplied immunoassay
technique (EMIT)Semi-quantitative laboratory screen for urinary EtG
Liquid chromatography-mass spectrometry-mass spectrometry (LC/MS/MS)Confirmatory test for urinary EtG
Positive EtG concentrations: range of 100-500 ng/mL

BACKGROUND
Cologne and perfume in US contains 78-83% alcohol by volume.
Hand sanitizer can contain 62% alcohol by volume.
Exposure to such products would increase ethanol exposure.

OBJECTIVES
Primary objective: Evaluate whether positive urine EtG results
were detected following: 1) fragrance exposure alone 2) combined fragrance plus hand sanitizer exposure in
men and women when evaluated with a screen (EMIT analysis)
and confirmatory test (LC/MS/MS analysis)
Secondary objectives:Comparison of EMIT analysis to LC/MS/MS
analysis Detection of gender differences between
the two analyses

HYPOTHESIS
Combined fragrance (cologne or perfume) and hand sanitizer exposure is more likely to produce positive EtG screen and confirmation results than the fragrance exposure alone.

METHODS

METHODS

Days 1-7:Abstinence from
alcohol consumption & use of cologne,
perfume, or hand sanitizer
Day 13:• Hand sanitizer
applied every 15 minutes for 8 hours
• Urine samples collected at end of 8 hour period & 4 hours later
Day 21:End collection of urine
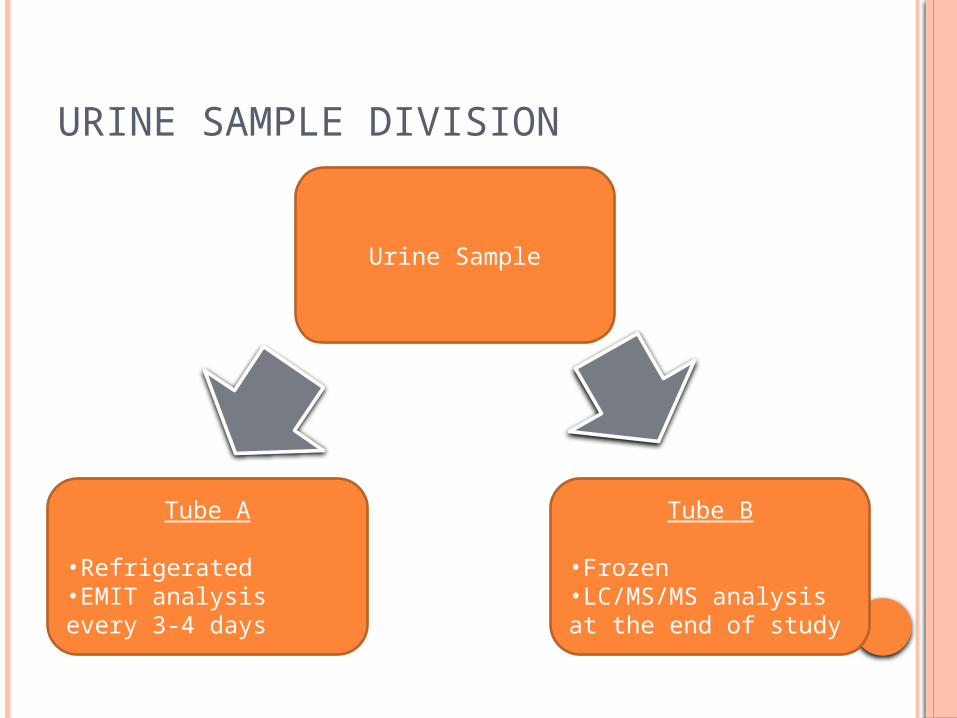
Urine Sample
Tube A
•Refrigerated•EMIT analysis every 3-4 days
Tube B
•Frozen•LC/MS/MS analysis at the end of study
URINE SAMPLE DIVISION

DEFINITIONS
POSITIVE RESULT: EtG concentration > 100 ng/mL
FALSE POSITIVE: EMIT positive screen result not confirmed by LC/MS/MS confirmation analysis
FALSE NEGATIVE: Negative EMIT screen but positive LC/MS/MS confirmation result
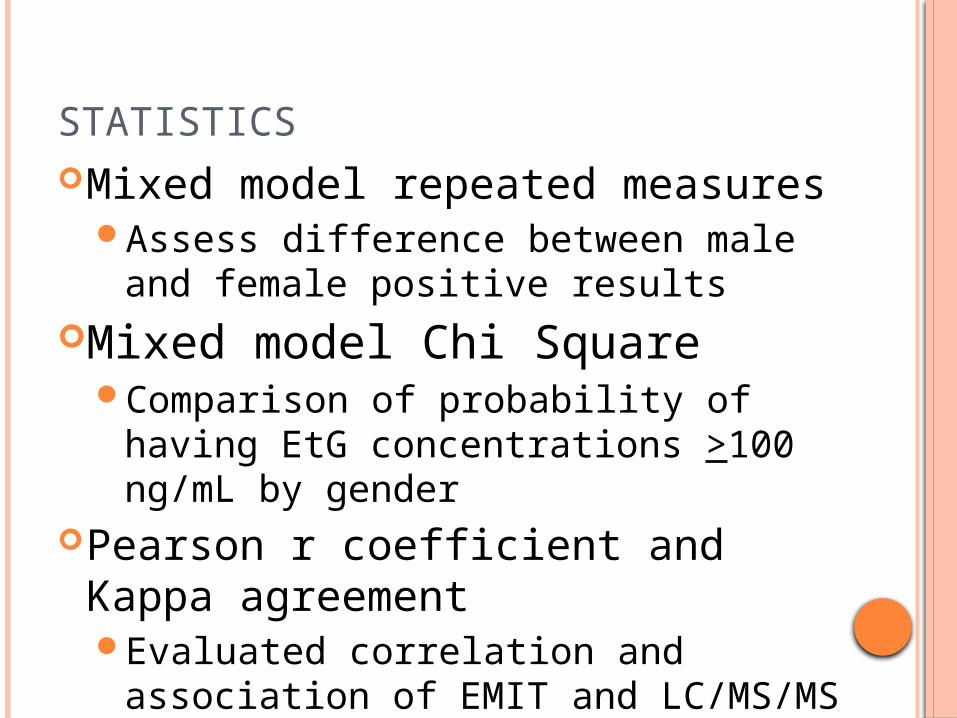
STATISTICSMixed model repeated measures
Assess difference between male and female positive results
Mixed model Chi Square Comparison of probability of having
EtG concentrations >100 ng/mL by gender
Pearson r coefficient and Kappa agreement Evaluated correlation and association
of EMIT and LC/MS/MS analyses

RESULTS

RESULTS
4 males & 4 females provided 128 urine samples
Range for EtG values: EMIT: 0-719 ng/mL LC/MS/MS: 0-711 ng/mL
Mean scores of EMIT and LC/MS/MS EtG positive = > 500 ng/mL, 100%
agreement EtG positive = >100 ng/mL, 37% agreement
(r = 0.42, p<0.001) Females less likely to test EMIT positive

RESULTSChart 1: Positive Results
Fragrance Alone Positive ResultsEMIT (%) LC/MS/MS (%)
Men (n=40) 7 (17.5) 0 (0)
Women (n=39*) 0 (0) 0 (0)Total (n=79) 7 (8.9) 0 (0)
Fragrance and Hand Sanitizer Positive ResultsEMIT (%) LC/MS/MS (%)
Men (n=24) 8 (33) 4 (16.7)
Women (n=25*) 5 (20) 3 (12)Total (n=49) 13 (26.5) 9 (18.4)
Total Positive ResultsTotal Positives False Positives
EMIT (%) LC/MS/MS(%) False Positives (%)
Men (n=64) 15 (23.4) 4 (6.3) 11 (17.2)
Women (n=64) 5 (7.8) 3 (4.7) 2 (3.1)
Total (n=128) 20 (15.6) 7 (5.5) 13 (10.2)
*On the morning of hand sanitizer application, 1 female subject provided first morning sample after hand sanitizer exposure.
False Positives (%)
Men (n=64) 11 (17.2)
Women (n=64) 2 (3.1)
Total (n=128) 13 (10.2)
1 2 3 4 5 6 7 8 9 10 11 12 13 14 15 16
-100.0
0.0
100.0
200.0
300.0
400.0
500.0
600.0
700.0
800.0
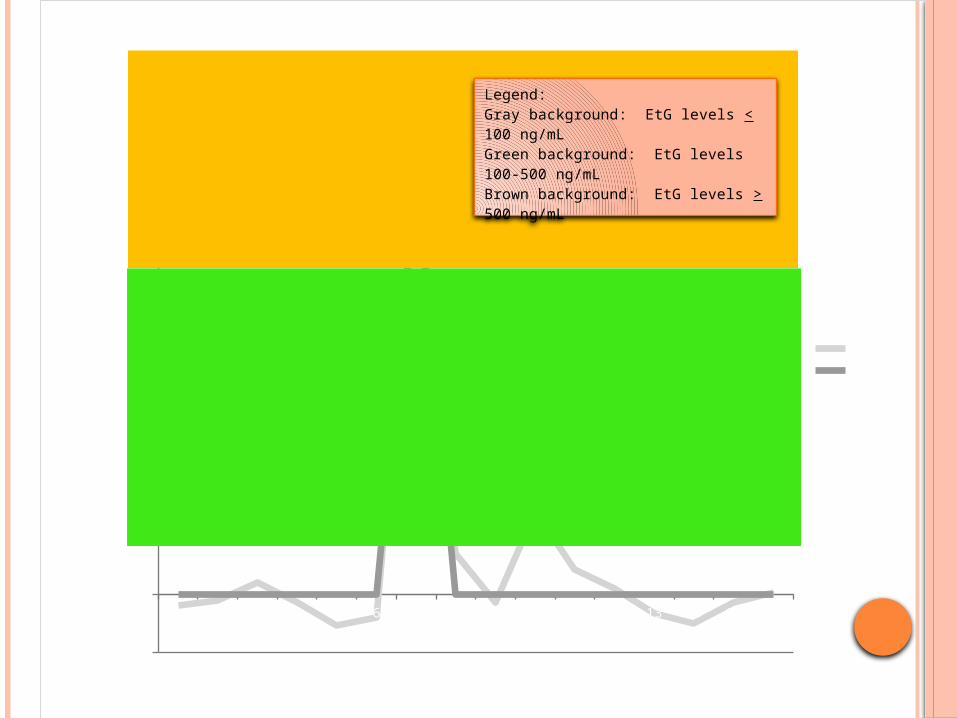
Graph of EMIT vs. LC/MS/MS analyses of female subject
EMIT LC/MS/MS
Collection Number
EtG
concentr
ati
on (
ng/m
L)
Legend:Gray background: EtG levels < 100 ng/mLGreen background: EtG levels 100-500 ng/mLBrown background: EtG levels > 500 ng/mL

CONCLUSIONS Study participants abstained from alcohol beverages
during the study. Positive EtG concentrations > 100 ng/mL were found
following exposure of fragrance alone and fragrance and hand sanitizer when evaluated with both analyses.
False positive results occurred more frequently in males.
In laboratory screens the biomarker EtG detects ethanol exposure from sources other than oral alcoholic intake and should not be used as a sole method to determine covert alcohol intake with positive levels defined as > 100 ng/mL.
Further research should be done to determine if false positives and false negatives results would occur with concentrations > 500 ng/mL.
REFERENCES1. Bean P. State of the art contemporary biomarkers of alcohol consumption. MLO
Med Lab Obs. 2005;37:10-2, 14, 16-7; quiz 18-9.2. Wurst FM, Vogel R, Jachau K, et al. Ethyl glucuronide discloses recent covert
alcohol use not detected by standard testing in forensic psychiatric inpatients. Alcohol Clin Exp Res. 2003;27:471-476.
3. Wurst FM, Metzger J, WHO/ISBRA Study on State and Trait Markers ofAlcohol Use and Dependence Investigators. The ethanol conjugate ethyl glucuronide is a useful marker of recent alcohol consumption. Alcohol Clin Exp Res. 2002;26:1114-1119.
4. Wurst FM, Kempter C, Seidl S, Alt A. Ethyl glucuronide--a marker of alcohol consumption and a relapse marker with clinical and forensic implications. Alcohol Alcohol. 1999;34:71-77.
5. Schmitt G, Droenner P, Skopp G, Aderjan R. Ethyl glucuronide concentration in serum of human volunteers, teetotalers, and suspected drinking drivers. J Forensic Sci. 1997;42:1099-1102.
6. Scott-Ham M, Burton FC. A study of blood and urine alcohol concentrations in cases of alleged drug-facilitated sexual assault in the united kingdom over a 3-year period. J Clin Forensic Med. 2006;13:107-111.
7. Skipper GE, Weinmann W, Thierauf A, et al. Ethyl glucuronide: A biomarker to identify alcohol use by health professionals recovering from substance use disorders. Alcohol Alcohol. 2004;39:445-449.
8. Dahl H, Stephanson N, Beck O, Helander A. Comparison of urinary excretion characteristics of ethanol and ethyl glucuronide. J Anal Toxicol. 2002;26:201-204.

QUESTIONS ??