
IRJET-ENHANCED PERFORMANCE OF OPTICAL OZONE SENSORS USING Au@Ag CORE-SHELL THIN FILM NANOISLANDS

sensors
Article
Effect of Contacting Surface on the Performance ofThin-Film Force and Pressure Sensors
Ka Po Maggie Tang 1 , Kit Lun Yick 1,2,* , Pui Ling Li 1, Joanne Yip 1 , King Hei Or 1
and Kam Hong Chau 1
1 Institute of Textiles and Clothing, The Hong Kong Polytechnic University, Hung Hom, Hong Kong;[email protected] (K.P.M.T.); [email protected] (P.L.L.);[email protected] (J.Y.); [email protected] (K.H.O.);[email protected] (K.H.C.)
2 Laboratory for Artificial Intelligence in Design, Hong Kong Science Park, Taipo, Hong Kong* Correspondence: [email protected]
Received: 26 October 2020; Accepted: 28 November 2020; Published: 30 November 2020
Abstract: Flexible force and pressure sensors are important for assessing the wear comfort of tightlyfitting apparel. Their accuracy and repeatability depend on the sensor itself and the contactingsurface. Measurements of the contact pressure on soft surfaces like human skin tend to be erroneous,which could be due to incorrect sensor calibrations. This study aims to examine the effects ofhuman body parameters such as the hardness and temperature of the contacting surface by usinga custom-made calibration setup and investigating the incorporation of rigid discs on the sensorsurface. Two commercial force sensors, FlexiForce and SingleTact, and one pressure sensor, Pliance X,are used in the investigation. The findings reveal that adding rigid discs on both sides of the forcesensors improves their sensitivity. Systematic calibration has been performed on the surfaces withdifferent temperatures and hardness. The results show that FlexiForce and Pliance X tend to beaffected by the changes in surface temperature and surface hardness. Prolonged testing time showsthat the time dependence of SingleTact and Pliance X sensor is lower, which suggests that they aremore suitable for lengthier evaluations in which interface pressure is exerted on the human body.In brief, sensor attachment and proper calibration should be thoroughly considered before usingsensors for applications on soft surfaces, like the human body.
Keywords: pressure comfort; force sensor; pressure sensor; sensor evaluation; hardness; temperature
1. Introduction
Pressure garments or elastic bandages are used in pressure therapy, for instance, to treathypertrophic scars following a burn injury. They help to control the formation of excess woundcollagen and suppress the growth of hypertrophic scars [1–3]. The pressure applied from such garmentsor bandages onto a hypertrophic scar normally ranges from 10–25 mmHg (i.e., 1.33–3.33 kPa) [4,5].Pressure garments have also been used to treat chronic venous disorders and venous leg ulcers [6,7].The pressure applied for these conditions is however much higher but still does not exceed 70 mmHg(i.e., 9.33 kPa) [8]. Controlling the applied pressure is important to treat various conditions and providea good wear condition, and the appropriate amount of induced pressure can contribute to improvingthe product design. Insufficient pressure means that the treatment is less effective whilst excessivepressure can lead to tissue damage, or might even require amputation in severe cases [9]. Nowadays,thin-film force and pressure sensors have been broadly utilized to measure the interfacial pressureof intimate apparel [10–13], compression stockings [8,9,14], sports compression garments [15,16],a posture correction girdle [17], and pressure garments for burn treatment [1,3,18], as well as the plantar
Sensors 2020, 20, 6863; doi:10.3390/s20236863 www.mdpi.com/journal/sensors

Sensors 2020, 20, 6863 2 of 20
foot pressure in gait analyses [19,20]. The thin-film force and pressure sensors help to control the exactpressure applied and optimize the fit of the end-products.
Pliance X sensors (Novel Electronics, Germany), which are capacitive sensors, have been widelyused in low interfacial pressure applications [1,2,21]. These sensors are sensitive, but very costly.Alternatively, force sensors like FlexiForce® (Tekscan, Boston, MA, USA) and SingleTact sensors havebeen developed to measure the interfacial pressure when force is applied to a known surface area [22].These force sensors are cost-effective and designed for low force measurements.
Many researchers have investigated the performance of various force sensors for theaforementioned applications [7,8,23,24]; however, no study has provided a comprehensive evaluationwith the same testing conditions. In addition, the sensors are mostly calibrated on a flat rigid surfaceby applying different known weights [6,15,23]. This may be acceptable for applications such as shoeinsoles where the contacting object is relatively flat. However, for applications where the sensor isplaced onto the human body which is compliant and has contours, the pressure might not be evenlydistributed across the sensor surface which would result in erroneous measurements. In view ofthis, some researchers have tried to simulate different end-use conditions and measured surfaceswith different geometries [9,14]. Surfaces with different curvatures have been one of their mainfocuses. For instance, Ferguson-Pell et al. [22] used the FlexiForce® sensor to measure pressure on rigidcylinders with different radii and found that changes in the curvature affect both the offset value andsensitivity of the sensor. This agrees with the findings in Komi et al. [25], and Buis and Convery [26]where changes in the surface curvature lead to an increase in measurement error. Surface curvaturealso leads to the problem of sensor bending. To reduce the likelihood of sensor bending when asensor is placed onto a curved surface and avoid saturation of the sensor from punctual appliedloads, researchers have attempted to remedy this problem by fixing attachments onto the sensor.For instance, Jensen et al. [27], Hall et al. [28], and Flórez and Velásquez [29] fixed a dome onto a sensorto increase its rigidity and thereby eliminate bending when the sensor comes into contact with a curvedsurface. Likitlersuang et al. [30] evaluated the possibility of adding a thin rigid disc (plastic disc witha thickness of 1.02 mm) on top of the sensor or underneath the sensor, and confirmed that addinga thin rigid disc between the sensor and human body and calibrating done on a compliant surfacehelp to reduce measurement errors. All of these studies suggest that the sensor surface should beproperly selected for compliant surface measurements and prove the importance of proper calibration.However, Likitlersuang et al. [30] conducted their tests on the forearm of their subject, which mightpotentially result in inaccuracies in the sensor readings, and therefore more systematic testing shouldbe carried out.
Apart from the sensor itself, the calibration method of a sensor affects the accuracy of themeasurement results. Most of the previous studies apply a series of dead weights to the sensorrepeatedly which range from 0 to 55 g [31], 2 to 52 g [16], 370 g to 11.2 kg [25], and 50 g to 1 kg [23].This process is, however, quite time-consuming and it can be difficult to place the weight in the sameposition of the sensor [23]. Most importantly, they did not calibrate the sensor or perform testing onsoft tissues that are similar to those of the human body, both of which potentially affect the accuracy ofthe final results. On the other hand, Khodasevych et al. [7] and Likitlersuang et al. [30] did consider thehardness of the contacting object. The former chose to use silicone with a hardness of 10 Shore A as thecontacting object whilst the latter used a polyurethane disc with a hardness of 60 Shore A to simulatethe soft skin at the body/device interface for pressure evaluation. However, both failed to provide muchinformation on how the hardness is related to human body tissues. The hardness of the human bodyconsiderably varies between individuals and different areas of the body; see Appendix A. Therefore,the effect of the hardness of the contacting object on the interface pressure should be systematicallystudied, thus providing a reliable tool for measurements of low interface pressure between the humanbody and different surface hardness.
Normally, calibration is performed at room temperature. However, the effect of differenttemperatures on the sensing performance of sensors has not been systematically evaluated. To date,
Sensors 2020, 20, 6863 3 of 20
no study has provided a comprehensive analysis of the effect of temperature on sensor performance.When a sensor is placed onto human skin, the temperature of the contacting surface is around 33 C.The local skin temperature can vary with activity intensity and climate. The temperature of humanskin ranges from 32.6 C at an environmental temperature of 25 C but increases to 35.5 C at anenvironmental temperature of 37 C [32]. In this case, the temperature difference between the skinsurface and calibrated condition can be higher than 10 C.
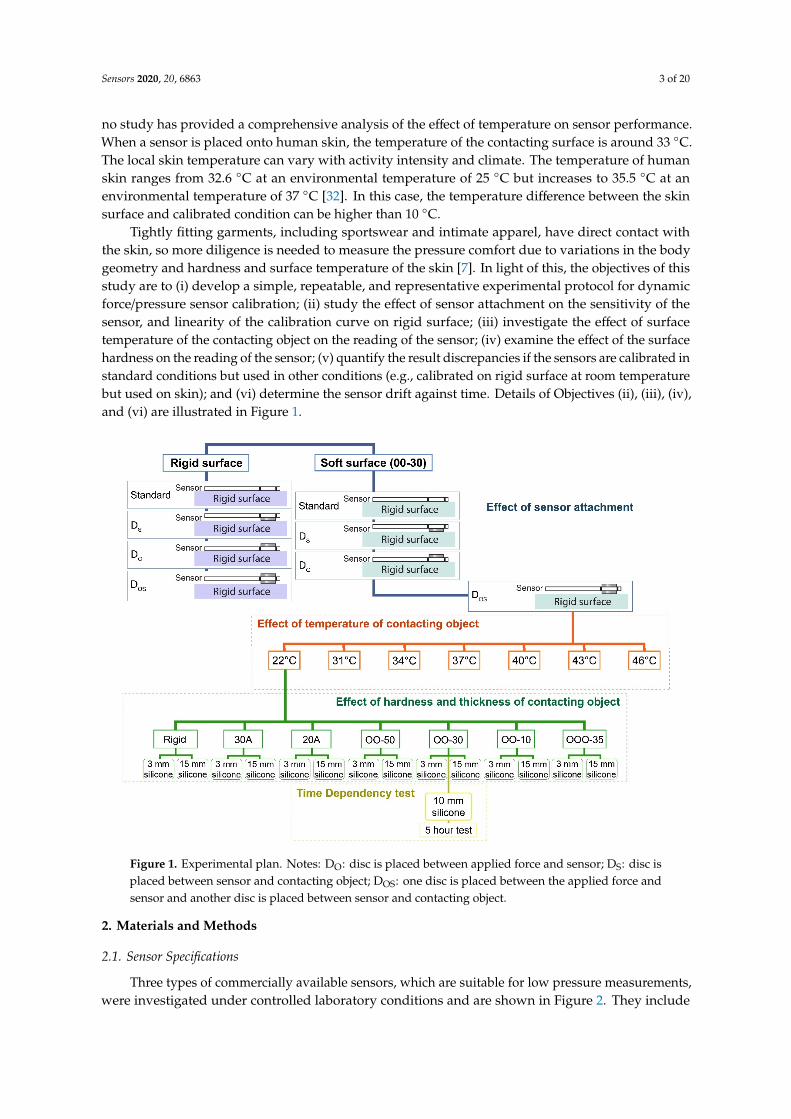
Tightly fitting garments, including sportswear and intimate apparel, have direct contact withthe skin, so more diligence is needed to measure the pressure comfort due to variations in the bodygeometry and hardness and surface temperature of the skin [7]. In light of this, the objectives of thisstudy are to (i) develop a simple, repeatable, and representative experimental protocol for dynamicforce/pressure sensor calibration; (ii) study the effect of sensor attachment on the sensitivity of thesensor, and linearity of the calibration curve on rigid surface; (iii) investigate the effect of surfacetemperature of the contacting object on the reading of the sensor; (iv) examine the effect of the surfacehardness on the reading of the sensor; (v) quantify the result discrepancies if the sensors are calibrated instandard conditions but used in other conditions (e.g., calibrated on rigid surface at room temperaturebut used on skin); and (vi) determine the sensor drift against time. Details of Objectives (ii), (iii), (iv),and (vi) are illustrated in Figure 1.
Sensors 2020, 20, x FOR PEER REVIEW 3 of 21
no study has provided a comprehensive analysis of the effect of temperature on sensor performance. When a sensor is placed onto human skin, the temperature of the contacting surface is around 33 °C. The local skin temperature can vary with activity intensity and climate. The temperature of human skin ranges from 32.6 °C at an environmental temperature of 25 °C but increases to 35.5 °C at an environmental temperature of 37 °C [32]. In this case, the temperature difference between the skin surface and calibrated condition can be higher than 10 °C.
Tightly fitting garments, including sportswear and intimate apparel, have direct contact with the skin, so more diligence is needed to measure the pressure comfort due to variations in the body geometry and hardness and surface temperature of the skin [7]. In light of this, the objectives of this study are to (i) develop a simple, repeatable, and representative experimental protocol for dynamic force/pressure sensor calibration; (ii) study the effect of sensor attachment on the sensitivity of the sensor, and linearity of the calibration curve on rigid surface; (iii) investigate the effect of surface temperature of the contacting object on the reading of the sensor; (iv) examine the effect of the surface hardness on the reading of the sensor; (v) quantify the result discrepancies if the sensors are calibrated in standard conditions but used in other conditions (e.g., calibrated on rigid surface at room temperature but used on skin); and (vi) determine the sensor drift against time. Details of Objectives (ii), (iii), (iv), and (vi) are illustrated in Figure 1.
Figure 1. Experimental plan. Notes: DO: disc is placed between applied force and sensor; DS: disc is placed between sensor and contacting object; DOS: one disc is placed between the applied force and sensor and another disc is placed between sensor and contacting object.
2. Materials and Methods
2.1. Sensor Specifications
Three types of commercially available sensors, which are suitable for low pressure measurements, were investigated under controlled laboratory conditions and are shown in Figure 2. They include the FlexiForce and SingleTact force sensors and Pliance X pressure sensor. Their specifications are summarized in Table 1.
Figure 1. Experimental plan. Notes: DO: disc is placed between applied force and sensor; DS: disc isplaced between sensor and contacting object; DOS: one disc is placed between the applied force andsensor and another disc is placed between sensor and contacting object.
2. Materials and Methods
2.1. Sensor Specifications
Three types of commercially available sensors, which are suitable for low pressure measurements,were investigated under controlled laboratory conditions and are shown in Figure 2. They include

Sensors 2020, 20, 6863 4 of 20
the FlexiForce and SingleTact force sensors and Pliance X pressure sensor. Their specifications aresummarized in Table 1.
Sensors 2020, 20, x FOR PEER REVIEW 4 of 21
The FlexiForce sensor is made of two layers of polyester film. A layer of conductive material is applied onto each layer of polyester film followed by a layer of pressure sensitive ink. This sensor is a variable resistor and connected to an inverted operational amplifier circuit, as shown in Figure 3a, which converts the measured resistance to a voltage [33]. The electrical resistance is reduced with higher applied pressure due to the displacement of the ink in the sensor during loading. The sensitivity of the sensor can be adjusted by changing the reference resistance (RF), in which a lower RF will result in reduced sensitivity of the sensor (i.e., increased force range). With reference to our desired pressure range, an RF of 460 kΩ was selected. The VOUT is connected to USB6001 (accuracy: 6 mV; ADC resolution: 14 bit; user-sampling rate: 20 samples/s) from National Instruments Corp. for data logging.
The SingleTact sensor is a capacitive force sensor which consists of a sensor dielectric that is laminated in two layers of electrodes [34]. The signal is converted by the supplied I2C board which is connected to the USB6001 converter for data logging. The manufacturer-recommended pinout diagram is shown in Figure 3b. The analog output swings from 0.5 V (no force applied) to 1.5 V, but the output in the zero force condition is arbitrary (fluctuating at around 0.5 V). The absolute voltage which corresponds to the applied force can be calculated by subtracting the zero force voltage from the measured voltage as follows: Voltage = Voltage − Voltage (1)
The Pliance X sensor is composed of two parallel plates separated by a dielectric medium. The change in capacitance occurs because of the variation in the distance between the two plates. The software provided was used to automatically record the output and used pressure as the unit.
As shown in Table 1, the FlexiForce and SingleTact sensors are particularly thin and deform easily. In order to avoid sensor bending, discs were attached to the sensors and four sensor conditions were tested as follows. Standard corresponds to the only sensor condition where no disc is adhered onto the sensor surface. DO (Disc-outside) corresponds to the condition where a disc is placed between the applied force and the sensor. DS (Disc-skin) corresponds to the condition where the disc is placed between the sensor and the contacting object. DOS (Discs-outside-and-skin) corresponds to the condition where one disc is placed between the applied force and the sensor, and another disc is placed between the sensor and the contacting object. The discs are made of 6061 aluminum with a thickness of 0.5 mm. As for the FlexiForce® sensor, aluminum discs that are 8 mm in diameter (70–85% of the sensing area as suggested by the manufacturer) are placed on top of the sensor whereas the bottom is 13 mm in diameter. The disc at the bottom is larger than the sensing area to ensure that the force applied is concentrated within the sensing area. For the SingleTact sensor, the diameter of the aluminum disc adhered to either side of the sensor is equivalent to the active sensing area (8 mm). Double-sided tape was used to adhere the disc onto the sensor.
Figure 2. Evaluated force and pressure sensors: (a) SingleTact force sensor, (b) FlexiForce® sensor and (c) Pliance X pressure sensor.
Figure 2. Evaluated force and pressure sensors: (a) SingleTact force sensor, (b) FlexiForce® sensor and(c) Pliance X pressure sensor.
Table 1. Sensor specifications.
CompanyName
ModelNumber Sensor Type Principle Operating
Range
Active Sensing AreaBased on Diameter
(mm)
Thickness(mm)
Tekscan(USA)
FlexiForceA201-1 Force sensor Electrical
resistance 0–454 g 9.53 0.203
SingleTact(USA) S8-10N Force sensor Capacitance 0–1000 g 8 0.35
Novel.de(Germany) Pliance X Pressure
sensor Capacitance 0.5–60 kPa 10 0.95
The FlexiForce sensor is made of two layers of polyester film. A layer of conductive material isapplied onto each layer of polyester film followed by a layer of pressure sensitive ink. This sensor isa variable resistor and connected to an inverted operational amplifier circuit, as shown in Figure 3a,which converts the measured resistance to a voltage [33]. The electrical resistance is reduced withhigher applied pressure due to the displacement of the ink in the sensor during loading. The sensitivityof the sensor can be adjusted by changing the reference resistance (RF), in which a lower RF will resultin reduced sensitivity of the sensor (i.e., increased force range). With reference to our desired pressurerange, an RF of 460 kΩ was selected. The VOUT is connected to USB6001 (accuracy: 6 mV; ADC resolution:14 bit; user-sampling rate: 20 samples/s) from National Instruments Corp. For data logging.
The SingleTact sensor is a capacitive force sensor which consists of a sensor dielectric that islaminated in two layers of electrodes [34]. The signal is converted by the supplied I2C board whichis connected to the USB6001 converter for data logging. The manufacturer-recommended pinoutdiagram is shown in Figure 3b. The analog output swings from 0.5 V (no force applied) to 1.5 V, but theoutput in the zero force condition is arbitrary (fluctuating at around 0.5 V). The absolute voltage whichcorresponds to the applied force can be calculated by subtracting the zero force voltage from themeasured voltage as follows:
Voltageforce = Voltagemeasured −Voltagezero force (1)
The Pliance X sensor is composed of two parallel plates separated by a dielectric medium.The change in capacitance occurs because of the variation in the distance between the two plates.The software provided was used to automatically record the output and used pressure as the unit.

Sensors 2020, 20, 6863 5 of 20
As shown in Table 1, the FlexiForce and SingleTact sensors are particularly thin and deform easily.In order to avoid sensor bending, discs were attached to the sensors and four sensor conditions weretested as follows. Standard corresponds to the only sensor condition where no disc is adhered ontothe sensor surface. DO (Disc-outside) corresponds to the condition where a disc is placed betweenthe applied force and the sensor. DS (Disc-skin) corresponds to the condition where the disc isplaced between the sensor and the contacting object. DOS (Discs-outside-and-skin) corresponds tothe condition where one disc is placed between the applied force and the sensor, and another disc isplaced between the sensor and the contacting object. The discs are made of 6061 aluminum with athickness of 0.5 mm. As for the FlexiForce® sensor, aluminum discs that are 8 mm in diameter (70–85%of the sensing area as suggested by the manufacturer) are placed on top of the sensor whereas thebottom is 13 mm in diameter. The disc at the bottom is larger than the sensing area to ensure that theforce applied is concentrated within the sensing area. For the SingleTact sensor, the diameter of thealuminum disc adhered to either side of the sensor is equivalent to the active sensing area (8 mm).Double-sided tape was used to adhere the disc onto the sensor.
Sensors 2020, 20, x FOR PEER REVIEW 5 of 21
Table 1. Sensor specifications.
Company Name
Model Number
Sensor Type Principle
Operating Range
Active Sensing Area
Based on Diameter
(mm)
Thickness (mm)
Tekscan (USA)
FlexiForce A201-1
Force sensor
Electrical resistance
0–454 g 9.53 0.203
SingleTact (USA) S8-10N Force
sensor Capacitance 0–1000 g 8 0.35
Novel.de (Germany) Pliance X
Pressure sensor Capacitance 0.5–60 kPa 10 0.95
Figure 3. (a) Circuit for FlexiForce® sensor, and (b) Pinout diagram of SingleTact sensor.
2.2. Testing Apparatus
Figure 4 illustrates a custom-made apparatus designed to load the sensor under a simulated skin condition. Unlike testing with dead weight calibration, loading can better approximate dynamic wear conditions; for example, short-term changes in pressure during physical activity or respiration. An acrylic plate with a thickness of 1 inch and resembles a vertical contacting surface, was firmly adhered to the base plate. For the conditions where the contacting surface is soft (like human skin), a layer of silicone (Smooth-On, Inc.) with different levels of hardness was adhered onto the acrylic plate. The hardness of these silicone samples is summarized in Table 2. For the conditions with a heated contacting surface, a heating pad which was connected to a 12 V power supply, was placed underneath the silicone layer and a resistance temperature detector (RTD) sensor (PT100, 2 mm × 10 mm, accuracy: 1/3 DIN) from RS Pro was placed on top of the silicone layer. The heater as well as the RTD sensor were connected to the E5CC digital temperature controller (ORMON, USA) to monitor the temperature changes and turn the heater on or off. As for the force/pressure sensor, it was affixed to the contacting surface by using 3M Micropore tape.
On the other hand, a force gauge (Model no.: Chatillon DFS II, 10 lb. Accuracy: ± 0.1%) (AMETEK, Inc., Bowen, PA, USA) was mounted on a linear translation stage which allows for movement of the XY axis. Two micrometer heads (Accuracy: ± 20 µm) were used to control the left/right and forward/backward movements of the force gauge. After the position of the loading surface was found to be in agreement with that of the sensor, it was ready for the calibration process.
Figure 3. (a) Circuit for FlexiForce® sensor, and (b) Pinout diagram of SingleTact sensor.
2.2. Testing Apparatus
Figure 4 illustrates a custom-made apparatus designed to load the sensor under a simulatedskin condition. Unlike testing with dead weight calibration, loading can better approximate dynamicwear conditions; for example, short-term changes in pressure during physical activity or respiration.An acrylic plate with a thickness of 1 inch and resembles a vertical contacting surface, was firmlyadhered to the base plate. For the conditions where the contacting surface is soft (like human skin),a layer of silicone (Smooth-On, Inc. (Macungie, PA, USA)) with different levels of hardness wasadhered onto the acrylic plate. The hardness of these silicone samples is summarized in Table 2.For the conditions with a heated contacting surface, a heating pad which was connected to a 12 Vpower supply, was placed underneath the silicone layer and a resistance temperature detector (RTD)sensor (PT100, 2 mm × 10 mm, accuracy: 1/3 DIN) from RS Pro was placed on top of the siliconelayer. The heater as well as the RTD sensor were connected to the E5CC digital temperature controller(ORMON, Hoffman Estates, IL, USA) to monitor the temperature changes and turn the heater on or off.As for the force/pressure sensor, it was affixed to the contacting surface by using 3M Micropore tape.

Sensors 2020, 20, 6863 6 of 20
Sensors 2020, 20, x FOR PEER REVIEW 6 of 21
By slowly moving the force gauge towards the force/pressure sensor at a speed of around 0.4 mm/min, the load applied as well as the force/pressure exerted onto the sensor were recorded. The LabVIEW 2015 program was used to record the data from both the force gauge and sensor. The control panel for the sensor calibration is shown in Figure 5.
Figure 4. Experimental setup for sensor calibration.
Table 2. Specifications of silicone.
Product Name Shore Hardness Dragon Skin TM 30 30 Shore A Dragon Skin TM 20 20 Shore A
Ecoflex™ 00-50 50 Shore OO Ecoflex™ 00-30 30 Shore OO Ecoflex™ 00-10 10 Shore OO Ecoflex™ GEL 35 Shore OOO
Figure 4. Experimental setup for sensor calibration.
Table 2. Specifications of silicone.
Product Name Shore Hardness
Dragon Skin TM 30 30 Shore ADragon Skin TM 20 20 Shore A
Ecoflex™ 00-50 50 Shore OOEcoflex™ 00-30 30 Shore OOEcoflex™ 00-10 10 Shore OOEcoflex™ GEL 35 Shore OOO
On the other hand, a force gauge (Model no.: Chatillon DFS II, 10 lb. Accuracy: ± 0.1%)(AMETEK, Inc., Bowen, PA, USA) was mounted on a linear translation stage which allows for movementof the XY axis. Two micrometer heads (Accuracy: ± 20 µm) were used to control the left/right andforward/backward movements of the force gauge. After the position of the loading surface was foundto be in agreement with that of the sensor, it was ready for the calibration process.
By slowly moving the force gauge towards the force/pressure sensor at a speed of around0.4 mm/min, the load applied as well as the force/pressure exerted onto the sensor were recorded.The LabVIEW 2015 program was used to record the data from both the force gauge and sensor.The control panel for the sensor calibration is shown in Figure 5.

Sensors 2020, 20, 6863 7 of 20
Sensors 2020, 20, x FOR PEER REVIEW 7 of 21
Figure 5. Control panel for sensor calibration.
2.3. Percentage Error
The percentage error of the sensor output was calculated as the difference between the applied (by force gauge) and measured (by sensor) pressures divided by the applied pressure. Equation (2) shows the calculation of the percentage error under a specific pressure level. Equation (3), on the other hand, shows the calculation of the mean percentage error under a specific range of pressures. = − / 100% (2)
= 1 − 100% (3)
where Pref is the reference pressure applied by the force gauge, Psens is the pressure measurement taken by the sensor, n is the sample number of a specific test run, and N is the total number of samples taken.
2.4. Repeatability Test
The ability of a sensor to provide the same response with the same amount of applied pressure during repeated measurements is known as its repeatability. Loading was gradually applied onto each sensor by the force gauge and this procedure was repeated five times. The coefficient of variation(CV%) of the sensor reading denotes the repeatability of the measurements.
2.5. Time dependency Test
Drift is the change in the output signal when a constant pressure is applied over a period of time and calculated by comparing the pressure value at time t with the initial steady value (data at 30 s after pressure application is regarded as being in the steady state). The pressure drift (DP) inpercentage is calculated as in Equation (4). The time dependency was tested by applying loads of 30 gram-force (gf) and 80 gf onto the sensor for 5 h (if applicable). = − 100% (4)
where Pt is the pressure at time t over which the pressure is applied, and Pi is the pressure at theinitial moment after pressure application.
Figure 5. Control panel for sensor calibration.
2.3. Percentage Error
The percentage error of the sensor output was calculated as the difference between the applied(by force gauge) and measured (by sensor) pressures divided by the applied pressure. Equation (2) showsthe calculation of the percentage error under a specific pressure level. Equation (3), on the other hand,shows the calculation of the mean percentage error under a specific range of pressures.
Percentage Error =∣∣∣/Pre f × 100% (2)
Mean Percentage Error =1N
N∑n=1
∣∣∣Psens(n) − Pre f (n)
∣∣∣Pre f (n)
× 100% (3)
where Pref is the reference pressure applied by the force gauge, Psens is the pressure measurement takenby the sensor, n is the sample number of a specific test run, and N is the total number of samples taken.
2.4. Repeatability Test
The ability of a sensor to provide the same response with the same amount of applied pressureduring repeated measurements is known as its repeatability. Loading was gradually applied onto eachsensor by the force gauge and this procedure was repeated five times. The coefficient of variation(CV%) of the sensor reading denotes the repeatability of the measurements.
2.5. Time Dependency Test
Drift is the change in the output signal when a constant pressure is applied over a period of timeand calculated by comparing the pressure value at time t with the initial steady value (data at 30 s afterpressure application is regarded as being in the steady state). The pressure drift (DP) in percentage iscalculated as in Equation (4). The time dependency was tested by applying loads of 30 gram-force (gf)and 80 gf onto the sensor for 5 h (if applicable).
DP =(Pt − Pi)
Pi× 100% (4)
where Pt is the pressure at time t over which the pressure is applied, and Pi is the pressure at the initialmoment after pressure application.

Sensors 2020, 20, 6863 8 of 20
3. Results and Discussion
3.1. Effect of Sensor Attachment
Adding an attachment to the surface of a sensor can properly support the sensor, enhance theuniformity of the force exerted onto the surface of the sensor, and minimize sensor deformation whenmounted on a soft surface. Preliminary studies have found that measurements on a soft surface tendsto provide a lower voltage reading than on a rigid surface which can be attributed to the sagging of thesurface of the contacting object. This section aims to investigate whether applying an attachment ontothe sensor surface would reduce its inaccuracy.
Four sensor conditions were used for the calibration of both the rigid and soft (30 Shore OO)surfaces by establishing a relationship between the applied load and sensor output. The calibrationcurves for FlexiForce sensor with the measured voltage in the y axis and applied pressure in the x axisare shown in Figure 6a,b. With reference to the distribution of the data points, it can be found that thelinearity of the FlexiForce data is excellent at rigid surface (Figure 6a). Its coefficient of determination(R2) is higher than 0.97 irrespective of the incorporation of an attachment disc. The linearity of sensoris not evaluated on the soft testing surface since the viscoelasticity property of soft materials can benonlinear. For the rigid contacting surface, it can be observed in Figure 6a that the calibration curves ofthe four sensor attachment conditions do not show remarkable differences. Therefore, this suggeststhat an additional attachment is not necessary when the sensor is used for measurements of a rigidand flat surface. However, if the contacting object is soft, there is a remarkable difference among thefour testing conditions as shown in Figure 6b. For the FlexiForce sensor, the slope for the Standardcondition is remarkably smaller (i.e., 0.2027) whereas the slope for DO, DS and DOS is larger—0.3541,0.3361, and 0.3833, respectively. This appears that the FlexiForce sensor with the DOS setting results inhigher sensitivity. In addition, the smallest detectable pressure for the Standard condition is 3.09 kPawhereas the cases of DO, DS, and DOS are just 1.58 kPa, 0.83 kPa, and 0.69 kPa, respectively. The sensorsin the Standard and DO conditions were pressed onto a soft contacting object and the soft surface mighthave deformed. Force was unevenly distributed and concentrated at the edge of the sensor, so a largerforce was required to trigger the sensor.
As for the SingleTact sensor, its calibration curves are shown in Figure 6c,d. The linearity of theSingleTact sensor on rigid surface is slightly less than that of the FlexiForce sensor, particularly forthe Standard condition in the low pressure range. For the result of rigid surface (Figure 6c), there areconsiderable differences in the R2 among Standard, DO, DS, and DOS. The R2 for DOS is the highest(R2 = 0.9790) whilst the R2 for Standard is the lowest (R2 = 0.9091). When comparing the correspondingcalibration curves of the measurements of the rigid and soft surfaces, the discrepancy for Standard isthe highest due to the poor rigid support of the sensor and vice versa for DOS. This suggests that DOS
offers little change in voltage with changes in the surface hardness.
Sensors 2020, 20, x FOR PEER REVIEW 8 of 21
3. Results and Discussion
3.1. Effect of Sensor Attachment
Adding an attachment to the surface of a sensor can properly support the sensor, enhance the uniformity of the force exerted onto the surface of the sensor, and minimize sensor deformation when mounted on a soft surface. Preliminary studies have found that measurements on a soft surface tends to provide a lower voltage reading than on a rigid surface which can be attributed to the sagging of the surface of the contacting object. This section aims to investigate whether applying an attachment onto the sensor surface would reduce its inaccuracy.
Four sensor conditions were used for the calibration of both the rigid and soft (30 Shore OO) surfaces by establishing a relationship between the applied load and sensor output. The calibration curves for FlexiForce sensor with the measured voltage in the y axis and applied pressure in the x axis are shown in Figure 6a,b. With reference to the distribution of the data points, it can be found that the linearity of the FlexiForce data is excellent at rigid surface (Figure 6a). Its coefficient of determination (R2) is higher than 0.97 irrespective of the incorporation of an attachment disc. The linearity of sensor is not evaluated on the soft testing surface since the viscoelasticity property of soft materials can be nonlinear. For the rigid contacting surface, it can be observed in Figure 6a that the calibration curves of the four sensor attachment conditions do not show remarkable differences. Therefore, this suggests that an additional attachment is not necessary when the sensor is used for measurements of a rigid and flat surface. However, if the contacting object is soft, there is a remarkable difference among the four testing conditions as shown in Figure 6b. For the FlexiForce sensor, the slope for the Standard condition is remarkably smaller (i.e., 0.2027) whereas the slope for DO, DS and DOS is larger—0.3541, 0.3361, and 0.3833, respectively. This appears that the FlexiForce sensor with the DOS setting results in higher sensitivity. In addition, the smallest detectable pressure for the Standard condition is 3.09 kPa whereas the cases of DO, DS, and DOS are just 1.58 kPa, 0.83 kPa, and 0.69 kPa, respectively. The sensors in the Standard and DO conditions were pressed onto a soft contacting object and the soft surface might have deformed. Force was unevenly distributed and concentrated at the edge of the sensor, so a larger force was required to trigger the sensor.
As for the SingleTact sensor, its calibration curves are shown in Figure 6c,d. The linearity of the SingleTact sensor on rigid surface is slightly less than that of the FlexiForce sensor, particularly forthe Standard condition in the low pressure range. For the result of rigid surface (Figure 6c), there areconsiderable differences in the R2 among Standard, DO, DS, and DOS. The R2 for DOS is the highest (R2 = 0.9790) whilst the R2 for Standard is the lowest (R2 = 0.9091). When comparing the corresponding calibration curves of the measurements of the rigid and soft surfaces, the discrepancy for Standard is the highest due to the poor rigid support of the sensor and vice versa for DOS. This suggests that DOS
offers little change in voltage with changes in the surface hardness.
Figure 6. Cont.

Sensors 2020, 20, 6863 9 of 20Sensors 2020, 20, x FOR PEER REVIEW 9 of 21
Figure 6. X-axis corresponds to applied pressure converted from force gauge reading. Y-axis corresponds to sensor reading in voltage. (a) FlexiForce sensor calibration curve on rigid surface, (b) FlexiForce sensor calibration curve on soft surface (silicone of 30 Shore OO hardness), (c) SingleTact sensor calibration curve on rigid surface, (d) SingleTact sensor calibration curve on soft surface (silicone of 30 Shore OO hardness).
3.2. Effect of Surface Temperature of Contacting Object
According to the FlexiForce Sensors User Manual [35], force sensors should be calibrated at the same temperature in which testing occurs. However, they are usually calibrated on an object at room temperature but applied on a surface with a higher temperature, like skin. This section aims to examine whether placing a sensor onto a surface with different temperatures would result in different sensor readings.
Figure 7 shows the sensor calibration curves of different sensors under various contacting temperatures. The calibration curves of the FlexiForce sensor is shown in Figure 7a, where it can be observed that the slope of the calibration curves increases with the contacting temperature. For every increase of 1 kPa of applied force, the increase in voltage is higher for higher temperature conditions (e.g., 0.348 V at 22 °C but 0.439 V at 46 °C). This suggests that sensitivity of the sensor increases with the contacting temperature.
A correlation analysis, as shown in Figure 8a, reveals that the slope of the calibration curve is positively and greatly related to the temperature of the contacting object (y = 0.0047x + 0.2186, R2 = 0.7702). The independent t-test results show that the slope of the calibration curve at a temperature of 22 °C does not show a significant difference with that at a temperature of 31 °C (p > 0.05) and 34 °C (p > 0.05), but is remarkably lower than that at 37 °C (p < 0.05), 40 °C (p < 0.05), 43 °C (p < 0.05) and 46 °C (p < 0.05). This suggests that calibration performed at room temperature can still be used to predict the conditions in which the contacting temperature is as high as 34 °C.
For the SingleTact sensor, the calibration curves, as shown in Figure 7b, are close to each other and overlapping. The correlation analysis, as shown in Figure 8b, shows that the slope of the calibration curve is negatively related to the temperature of the contacting object (R2 = 0.7058), thus suggesting that the sensitivity of the sensor decreases with the contacting temperature.
For the Pliance X sensor which is shown in Figure 7c, the calibration curves can be generally divided into two groups based on their slope. The first group consists of the samples with a lower contacting surface temperature (i.e., 22 °C, 31 °C, and 34 °C). Their slope is comparatively larger (ranges from 0.79 to 0.80). The second group includes the samples with a higher contacting surface temperature (i.e., 37 °C, 40 °C, 43 °C, and 46 °C) with a smaller slope (between 0.67 to 0.74). There is a steep change in the slope when the temperature increases from less than 34 °C to over 37 °C. The correlation analysis, as shown in Figure 8c, shows that the slope of the calibration curve has a moderate and negative correlation with the temperature of the contacting object (R2 = 0.5245).
Figure 6. X-axis corresponds to applied pressure converted from force gauge reading. Y-axis correspondsto sensor reading in voltage. (a) FlexiForce sensor calibration curve on rigid surface, (b) FlexiForcesensor calibration curve on soft surface (silicone of 30 Shore OO hardness), (c) SingleTact sensorcalibration curve on rigid surface, (d) SingleTact sensor calibration curve on soft surface (silicone of30 Shore OO hardness).
3.2. Effect of Surface Temperature of Contacting Object
According to the FlexiForce Sensors User Manual [35], force sensors should be calibrated atthe same temperature in which testing occurs. However, they are usually calibrated on an object atroom temperature but applied on a surface with a higher temperature, like skin. This section aims toexamine whether placing a sensor onto a surface with different temperatures would result in differentsensor readings.
Figure 7 shows the sensor calibration curves of different sensors under various contactingtemperatures. The calibration curves of the FlexiForce sensor is shown in Figure 7a, where it can beobserved that the slope of the calibration curves increases with the contacting temperature. For everyincrease of 1 kPa of applied force, the increase in voltage is higher for higher temperature conditions(e.g., 0.348 V at 22 C but 0.439 V at 46 C). This suggests that sensitivity of the sensor increases withthe contacting temperature.
A correlation analysis, as shown in Figure 8a, reveals that the slope of the calibration curveis positively and greatly related to the temperature of the contacting object (y = 0.0047x + 0.2186,R2 = 0.7702). The independent t-test results show that the slope of the calibration curve at a temperatureof 22 C does not show a significant difference with that at a temperature of 31 C (p > 0.05) and34 C (p > 0.05), but is remarkably lower than that at 37 C (p < 0.05), 40 C (p < 0.05), 43 C (p < 0.05)and 46 C (p < 0.05). This suggests that calibration performed at room temperature can still be used topredict the conditions in which the contacting temperature is as high as 34 C.
For the SingleTact sensor, the calibration curves, as shown in Figure 7b, are close to each other andoverlapping. The correlation analysis, as shown in Figure 8b, shows that the slope of the calibrationcurve is negatively related to the temperature of the contacting object (R2 = 0.7058), thus suggestingthat the sensitivity of the sensor decreases with the contacting temperature.
For the Pliance X sensor which is shown in Figure 7c, the calibration curves can be generallydivided into two groups based on their slope. The first group consists of the samples with a lowercontacting surface temperature (i.e., 22 C, 31 C, and 34 C). Their slope is comparatively larger(ranges from 0.79 to 0.80). The second group includes the samples with a higher contacting surfacetemperature (i.e., 37 C, 40 C, 43 C, and 46 C) with a smaller slope (between 0.67 to 0.74). There isa steep change in the slope when the temperature increases from less than 34 C to over 37 C.The correlation analysis, as shown in Figure 8c, shows that the slope of the calibration curve has amoderate and negative correlation with the temperature of the contacting object (R2 = 0.5245).

Sensors 2020, 20, 6863 10 of 20Sensors 2020, 20, x FOR PEER REVIEW 10 of 21
Figure 7. Calibration curves of different sensors measured on soft surface (silicone of 00-30 hardness) maintained at different temperatures: (a) FlexiForce sensor, (b) SingleTact sensor, and (c) Pliance X sensor.
Calibration is not carried out for some applications in realistic end-use conditions, and instead, their sensors are calibrated at room temperature only which might cause errors. Next, we quantify the error if the output of the sensor was converted based on a calibration temperature of 22 °C (regardless of the actual used temperature). The results are summarized in Table 3. In general, the percentage error is particularly high when pressure is less than 1 kPa because the measured voltage is close to zero. In addition, there is the trend in which the percentage error increases with the surface temperature of the contacting object. This again suggests that proper calibration based on actual use conditions is important.
Figure 7. Calibration curves of different sensors measured on soft surface (silicone of 00-30 hardness)maintained at different temperatures: (a) FlexiForce sensor, (b) SingleTact sensor, and (c) Pliance X sensor.
Sensors 2020, 20, x FOR PEER REVIEW 10 of 21
Figure 7. Calibration curves of different sensors measured on soft surface (silicone of 00-30 hardness) maintained at different temperatures: (a) FlexiForce sensor, (b) SingleTact sensor, and (c) Pliance X sensor.
Calibration is not carried out for some applications in realistic end-use conditions, and instead, their sensors are calibrated at room temperature only which might cause errors. Next, we quantify the error if the output of the sensor was converted based on a calibration temperature of 22 °C (regardless of the actual used temperature). The results are summarized in Table 3. In general, the percentage error is particularly high when pressure is less than 1 kPa because the measured voltage is close to zero. In
Sensors 2020, 20, x FOR PEER REVIEW 11 of 21
Figure 8. Correlation between slope of calibration curve and temperature of contacting object for (a) FlexiForce sensor, (b) SingleTact sensor, and (c) Pliance X sensor.
Briefly, the repeatability of the sensors is relatively constant with change in the contacting temperature (Table 4). The CV% is extremely high with the FlexiForce sensor when the pressure is less than 1 kPa. However, the CV% is reduced with increases in pressure. The repeatability of the Pliance X sensor is excellent. The average CV% is less than 5% on average. Finally, the repeatability of the SingleTact sensor is more than the FlexiForce but less than Pliance X.
Figure 8. Correlation between slope of calibration curve and temperature of contacting object for(a) FlexiForce sensor, (b) SingleTact sensor, and (c) Pliance X sensor.

Sensors 2020, 20, 6863 11 of 20
Calibration is not carried out for some applications in realistic end-use conditions, and instead,their sensors are calibrated at room temperature only which might cause errors. Next, we quantify theerror if the output of the sensor was converted based on a calibration temperature of 22 C (regardless ofthe actual used temperature). The results are summarized in Table 3. In general, the percentage erroris particularly high when pressure is less than 1 kPa because the measured voltage is close to zero.In addition, there is the trend in which the percentage error increases with the surface temperatureof the contacting object. This again suggests that proper calibration based on actual use conditionsis important.
Briefly, the repeatability of the sensors is relatively constant with change in the contactingtemperature (Table 4). The CV% is extremely high with the FlexiForce sensor when the pressure is lessthan 1 kPa. However, the CV% is reduced with increases in pressure. The repeatability of the PlianceX sensor is excellent. The average CV% is less than 5% on average. Finally, the repeatability of theSingleTact sensor is more than the FlexiForce but less than Pliance X.
3.3. Effect of Hardness of Human Tissue Surrogate
Force and pressure sensors are sometimes used on the interface between skin and apparel tomeasure the pressure applied by the apparel. As shown in Appendix A, the hardness of skin can vary.This section discusses whether hardness of a contacting object might cause variations in the calibrationcurve and sensor performance.
The FlexiForce and Pliance X sensors have widely spaced calibration curves (see Figure 9),particularly for the silicone samples with a thickness of 15 mm. The steeper curves correspond to amore rigid surface and more gentle curves to a softer surface. For the silicone layer with a thickness of3 mm, the slope of the calibration curve and hardness of the silicone surface do not have an obviousrelationship. Therefore, it can be concluded that the silicone layer with a thickness of 3 mm is not thickenough to show any changes. However, the use of a thicker silicone layer, like the silicone layer with athickness of 15 mm, shows a progressively larger slope with hardness of the contacting object.
The SingleTact sensor, however, shows that the seven calibration curves are mostly overlapping,except for the curve of the silicone layer labeled “GEL” with a thickness of 15 mm in Figure 9c,d.This implies that the surface hardness has less effect with the use of the SingleTact sensor.
To further investigate the error when the output of the sensor is converted based on the calibrationcurve of a rigid surface, the percentage error is calculated with reference to Equation (3) and the resultsare summarized in Table 5. In general, the percentage error is independent of the surface hardnessin the samples with a thin layer of silicone (i.e., silicone with a thickness of 3 mm). However, for thesamples with a thicker layer of silicone of 15 mm, the percentage error is reduced substantially withincreased hardness of the silicone. For the softest material investigated, which is labeled “GEL”,the average percentage error is as high as 39.7% with the FlexiForce sensor, but 18.2% for the SingleTactsensor and 25.8% with the Pliance X sensor. Therefore, this suggests that the sensors should be properlycalibrated for use on a soft medium especially the FlexiForce sensor.
In terms of testing repeatability, the CV% of the various testing conditions is summarized inTable 6. The table shows that the repeatability of the sensors does not depend on the surface hardness.In general, the CV% of the Pliance X sensor is low followed by SingleTact whereas FlexiForce providesfewer repeatable results.

Sensors 2020, 20, 6863 12 of 20
Table 3. Percentage error for different sensors when in contact with surface maintained at different temperatures with calibration at room temperature.
Temperature of Contacting Object
FlexiForce A SingleTact A Pliance X B
0kP
a≤
P<
1kP
a
1kP
a≤
P<
5kP
a
5kP
a≤
P<
9kP
a
9kP
a≤
P<
13kP
a
13kP
a≤
P<
17kP
a
Ave
rage
C
0kP
a≤
P<
1kP
a
1kP
a≤
P<
5kP
a
5kP
a≤
P<
9kP
a
9kP
a≤
P<
13kP
a
13kP
a≤
P<
17kP
a
Ave
rage
C
0kP
a≤
P<
1kP
a
1kP
a≤
P<
5kP
a
5kP
a≤
P<
9kP
a
9kP
a≤
P<
13kP
a
13kP
a≤
P<
17kP
a
Ave
rage
C
31 C 204.5 27.2 24.5 9.2 4.9 17.4 359.1 29.9 5.8 4.7 10.2 13.9 163.1 30.4 3.8 6.1 13 12.134 C 192.7 22.2 14.2 4.7 3.2 12.3 329 26.5 4.4 5.2 10.4 11.8 198.2 33.8 4.1 6.5 13.3 13.437 C 215.4 20.4 3.5 9.1 10.4 11.5 365.8 26.9 8 3.5 8 12.1 213.3 22.5 10 19.7 24.5 14.440 C 178.1 15.9 11.1 18.5 16.3 15.3 305.9 24.8 6.4 4.8 10.6 12.1 45.6 6 15.4 21.5 25.9 19.243 C 171.2 19.3 7.8 20.3 17.1 16 327.8 25.1 6 6.9 10.8 12.8 81.6 8.9 10.6 17.3 20.8 17.246 C 182.3 13.5 18.6 23.3 - 17.6 394.6 42 4.4 6.4 13 17.4 52.9 5.5 15.3 21.6 26.4 14.4
A The voltage reading measured in each condition is converted into a pressure based on surface calibration curve at temperature of 22 C as shown in Figure 7. (i.e., FlexiForce: Voltage =0.348 Pressure − 0.3406; SingleTact: Voltage = 0.0081 Pressure + 0.0123). The converted pressure is compared with the reference pressure based on Equation (2). B The measured pressure isdirectly compared with the reference pressure from the force gauge with Equation (2). C Average percentage error between 1 and 17 kPa is calculated.
Table 4. Repeatability of different sensors measured at different contacting temperatures (Coefficient of variation for repeated measurements of sensor reading).
Temperature of Contacting Object
FlexiForce SingleTact Pliance X
0kP
a≤
P<
1kP
a
1kP
a≤
P<
5kP
a
5kP
a≤
P<
9kP
a
9kP
a≤
P<
13kP
a
13kP
a≤
P<
17kP
a
Ave
rage
A
0kP
a≤
P<
1kP
a
1kP
a≤
P<
5kP
a
5kP
a≤
P<
9kP
a
9kP
a≤
P<
13kP
a
13kP
a≤
P<
17kP
a
Ave
rage
A
0kP
a≤
P<
1kP
a
1kP
a≤
P<
5kP
a
5kP
a≤
P<
9kP
a
9kP
a≤
P<
13kP
a
13kP
a≤
P<
17kP
a
Ave
rage
A
22 C 120.5 19.3 9.2 6 3.2 11.2 57 14.4 5 3.1 2.3 7.3 19 5.1 1.6 1.4 1.3 2.331 C 138 26.7 8.4 4 2.6 13.4 120 12.9 4.5 3.7 3.3 7.2 9.7 3 1.4 1.2 0.8 1.534 C 175.6 40 13.1 6.1 4.2 21 107.4 13 3.6 3 2.4 6.3 28.2 8.6 3.9 2.4 1.3 3.737 C 57.7 11.9 4.6 3.3 2.2 6.6 57.3 9.2 4.8 2.7 3.5 5.6 34.8 10.8 4.1 2.6 1.5 4.740 C 59 14.7 6 4.2 4.1 8.9 68.8 9.9 6.4 3.7 2.6 6.3 27 6 3 2.5 1.7 3.143 C 80.5 43 6.2 4.7 - 21 82.2 16.4 7.3 4.4 4.6 9.8 36.9 4.1 2 1.3 0.9 1.946 C 57.2 24.2 6.9 6.5 - 14.5 123.5 26.8 9.1 4.2 3.4 14.7 63.4 14.1 4.9 3.8 2.5 2.3
A Average CV between 1 and 17 kPa is calculated.

Sensors 2020, 20, 6863 13 of 20
Sensors 2020, 20, x FOR PEER REVIEW 13 of 21
3.3. Effect of Hardness of Human Tissue Surrogate
Force and pressure sensors are sometimes used on the interface between skin and apparel to measure the pressure applied by the apparel. As shown in Appendix A, the hardness of skin can vary. This section discusses whether hardness of a contacting object might cause variations in the calibration curve and sensor performance.
The FlexiForce and Pliance X sensors have widely spaced calibration curves (see Figure 9), particularly for the silicone samples with a thickness of 15 mm. The steeper curves correspond to a more rigid surface and more gentle curves to a softer surface. For the silicone layer with a thickness of 3 mm, the slope of the calibration curve and hardness of the silicone surface do not have an obvious relationship. Therefore, it can be concluded that the silicone layer with a thickness of 3 mm is not thick enough to show any changes. However, the use of a thicker silicone layer, like the silicone layer with a thickness of 15 mm, shows a progressively larger slope with hardness of the contacting object.
Figure 9. (a) FlexiForce sensor calibration curves on rigid and soft (silicone with thickness of 3 mm) surfaces, (b) FlexiForce sensor calibration curves on rigid and soft (silicone with thickness of 15 mm) surfaces, (c) SingleTact sensor calibration curves on rigid and soft (silicone with thickness of 3 mm) surfaces, (d) SingleTact sensor calibration curves on rigid and soft (silicone with thickness of 15 mm) surfaces, (e) Pliance X sensor calibration curves on rigid and soft (silicone with thickness of 3 mm)
Figure 9. (a) FlexiForce sensor calibration curves on rigid and soft (silicone with thickness of 3 mm)surfaces, (b) FlexiForce sensor calibration curves on rigid and soft (silicone with thickness of 15 mm)surfaces, (c) SingleTact sensor calibration curves on rigid and soft (silicone with thickness of 3 mm)surfaces, (d) SingleTact sensor calibration curves on rigid and soft (silicone with thickness of 15 mm)surfaces, (e) Pliance X sensor calibration curves on rigid and soft (silicone with thickness of 3 mm)surfaces, and (f) Pliance X sensor calibration curves on rigid and soft (silicone with thickness of15 mm) surfaces.

Sensors 2020, 20, 6863 14 of 20
Table 5. Percentage error of different sensors when in contact with surfaces with different hardness with calibration on rigid surface.
FlexiForce A SingleTact A Pliance X B
0kP
a≤
P<
1kP
a
1kP
a≤
P<
5kP
a
5kP
a≤
P<
9kP
a
9kP
a≤
P<
13kP
a
13kP
a≤
P<
17kP
a
Ave
rage
C
0kP
a≤
P<
1kP
a
1kP
a≤
P<
5kP
a
5kP
a≤
P<
9kP
a
9kP
a≤
P<
13kP
a
13kP
a≤
P<
17kP
a
Ave
rage
C
0kP
a≤
P<
1kP
a
1kP
a≤
P<
5kP
a
5kP
a≤
P<
9kP
a
9kP
a≤
P<
13kP
a
13kP
a≤
P<
17kP
a
Ave
rage
C
3 mm
30A 113.5 25.3 29.8 25.7 27 27 88.2 38.2 18.1 6.2 3.2 17 104.8 10.3 4.4 3.6 4 5.720A 112.1 17.1 18.9 22.2 25.1 19.7 151.7 33.8 5.8 3.4 3.8 11.6 49.6 8.9 3.9 2.1 1.8 4.2
00-50 111.7 12.5 17.4 17.6 21.1 15.8 119.7 28.5 19.3 8.2 2.3 14.6 34.5 14.4 15.2 12.2 11.1 13.300-30 113.4 11.5 20.2 24.9 23.4 19.2 85.7 36.4 21.1 6.9 2 16.7 15.5 4.7 5.7 4.5 6.3 5.300-10 112.7 19.7 25.6 26.2 28.4 24.5 90.4 44 20.6 10.6 3.1 19.6 45.2 7.7 2.5 6.7 11.2 7GEL 113.1 30.1 41.4 34.2 31.6 34.5 83 34.9 17.9 6.3 1.6 15.2 35.9 5.6 7.5 9 11.2 8.3
15 mm
30A 119 11 9.5 13.4 18.8 11.2 328.7 44.3 4.5 3.4 7.9 8.8 81.9 8.8 1.1 1.6 2.9 3.620A 113.1 26.1 23.5 22.9 28.1 24.7 170.2 20.6 13.4 4.5 2.6 10.4 59.4 25.4 12 6.8 1.8 11.6
00-50 111.7 35.9 26.5 26.2 27.9 29.3 721.9 28.4 14.9 7.1 2.2 13.2 149.7 18.8 2.2 7.2 14.1 10.600-30 113 20.7 31.9 28.6 27.1 27.1 140.3 17.4 12.9 3.8 2.1 9.1 121.2 16.2 7.8 16.9 22 15.700-10 115.1 32.2 36.8 34.9 35.5 34.8 129.3 28 18 6.3 7.6 15 158.3 14 25.9 34 37.7 27.9GEL 121.9 38.1 41.8 39.2 39.6 39.7 99.8 30.2 18.6 4.8 18.7 18.2 188.3 15.8 22.9 30.6 34 25.8
A The voltage reading measured for each condition is converted to pressure value based on calibration curve of rigid surface. (i.e., FlexiForce: Voltage = 0.5237 Pressure − 0.4312; SingleTact:Voltage = 0.0082 Pressure + 0.0055). The converted pressure value is compared with the reference pressure value by using Equation (2). B The measured pressure is directly compared withthe reference pressure from force gauge with Equation (2). C Average percentage error between 1 and 17 kPa is calculated.

Sensors 2020, 20, 6863 15 of 20
Table 6. Repeatability of different sensors measured on surfaces with different hardness. (Coefficient of variation for repeated measurements of sensor reading).
FlexiForce SingleTact Pliance X
0kP
a≤
P<
1kP
a
1kP
a≤
P<
5kP
a
5kP
a≤
P<
9kP
a
9kP
a≤
P<
13kP
a
13kP
a≤
P<
17kP
a
Ave
rage
A
0kP
a≤
P<
1kP
a
1kP
a≤
P<
5kP
a
5kP
a≤
P<
9kP
a
9kP
a≤
P<
13kP
a
13kP
a≤
P<
17kP
a
Ave
rage
A
0kP
a≤
P<
1kP
a
1kP
a≤
P<
5kP
a
5kP
a≤
P<
9kP
a
9kP
a≤
P<
13kP
a
13kP
a≤
P<
17kP
a
Ave
rage
A
Hard 63.3 12.1 6.6 3.2 - 9.3 63 20.1 6.7 5.2 5.2 12.4 8.8 3.5 2.3 1.7 1.3 2.2
3 mm
30A 79 25.9 8.2 6.7 3.6 14.3 27.6 9.5 3.4 3.4 3.4 5.1 5.4 9.6 9.1 5.6 5.2 7.620A 63.9 29.6 10.1 6 3.5 17.3 119.1 32.2 6.8 3.3 2.5 10.9 20.3 5.5 4.9 4.1 2.8 4.3
00-50 112.8 14 10.5 6 0 10.5 98.4 14.5 4.6 3.1 2.5 6.5 21.4 3.1 1.3 1.1 0.9 1.500-30 102.7 14.2 7 5 2.2 8.5 60.9 12.5 3.9 3.3 2.1 5.5 46.2 13.1 7.9 5.4 4.2 7.300-10 91.1 19.6 5.8 6.7 4.8 10.1 37.7 7.1 3.8 2.9 2.1 4 25.7 5.6 3.4 2.6 2.1 3.3GEL 44.7 18.9 9.4 5.6 3.5 9.9 72.8 12.9 6.1 3.7 2.8 6.4 138.4 17.2 4.8 2.8 1.7 6.1
15 mm
30A 59.5 14.5 7.4 4 - 9.3 117.9 10.3 3.2 2.9 2.3 4.9 15.2 6.6 3.5 2.6 2 2.220A 88.2 18.3 7.2 6.7 3.1 11.1 41.5 11.6 3.4 3.2 2.6 5.6 10.1 3.2 1.1 1.4 1.1 3.5
00-50 56.7 26.2 6.5 5.6 6.2 12.4 18.7 8.2 4.1 2.5 2 4.2 14.2 4.4 2.2 2 1.4 1.700-30 104.2 16.6 9 5.3 2.6 9.4 42.9 9.3 4.3 3.4 2.3 4.8 15.8 5.9 2.7 2.6 2.3 2.300-10 59.6 19.1 10.6 7.3 5.8 11.2 55.1 10.7 5.7 4.3 3 5.9 17.2 5.8 3.4 2.4 1.8 3.2GEL 45.6 39.6 10.7 6.5 4.9 15.6 59.6 10.7 3.6 4 3.4 5.6 19.5 4.8 2 1.5 1.2 3.2
A Average CV between 1 to 17 kPa is calculated.

Sensors 2020, 20, 6863 16 of 20
3.4. Effect of Time on Measurement Accuracy
The sensors were subjected to a constant load for 5 h (the Pliance X sensor was used for only 3 hdue to machine configurations) and the changes in pressure with time were measured. Two force levelsare presented (30 gf and 80 gf) in random order three times. As shown in Figure 10a,b, the degree ofthe pressure drift is greater with the FlexiForce sensor and shows an upward drift in pressure withtime, particularly for the first hour. Sensor drift may cause problems when high accuracy for a longperiod of time is required [24]. The pressure drift of the SingleTact sensor fluctuates between the zeropoints, thus giving positive and negative results intermittently. No obvious trend of the pressure driftcan be observed. The pressure drift of the Pliance X sensor is relatively constant throughout the entiretesting period.
Sensors 2020, 20, x FOR PEER REVIEW 17 of 21
3.4. Effect of Time on Measurement Accuracy
The sensors were subjected to a constant load for 5 h (the Pliance X sensor was used for only 3 h due to machine configurations) and the changes in pressure with time were measured. Two force levels are presented (30 gf and 80 gf) in random order three times. As shown in Figure 10a,b, the degree of the pressure drift is greater with the FlexiForce sensor and shows an upward drift in pressure with time, particularly for the first hour. Sensor drift may cause problems when high accuracy for a long period of time is required [24]. The pressure drift of the SingleTact sensor fluctuates between the zero points, thus giving positive and negative results intermittently. No obvious trend of the pressure drift can be observed. The pressure drift of the Pliance X sensor is relatively constant throughout the entire testing period.
(a) (b)
Figure 10. (a) Pressure drift of different sensors with time (applied load of 30 gf) and (b) Pressure drift of different sensors with time (with applied load of 80 gf).
4. Conclusions
A dynamic sensor calibration setup is proposed in this study. The applied pressure is progressively increased and recorded by using both a force gauge and force/pressure sensor. The sensor is calibrated by establishing a relationship between the applied pressure and the corresponding reading. The performance of the sensors including accuracy, repeatability and drift ismeasured. Testing is conducted with a focus on the properties of the contacting surface. Silicone layer samples with different thickness and hardness are attached to the calibration setup to simulate different skin conditions. The temperature of the skin surrogate is also controlled to simulate the skin temperature under different activity levels. The advantages of this dynamic sensation calibrationset-up include:
• Ensuring that force is applied in the same location of the sensor, thus enhancing repeatability of the calibration process;
• Ensuring that force is applied perpendicular to the plane of the sensor; • Simplicity of the set-up; • User-friendliness; • Efficiency in calibration time as compared to dead-weight calibration procedures; • Measuring the desired pressure range; and • Simulating the actual wear conditions where the contacting object is subjected to dynamic
pressure changes, e.g., breathing and body movement.
Three commercially available sensors, the FlexiForce, SingleTact and Pliance X sensors, are usedto determine the influence of the properties of the contacting surface. The FlexiForce and SingleTact sensors are relatively thin, so the effect of sensor attachment is studied. The results show that the plotted slope of the calibration curve is the smallest for the Standard condition where no support is
Figure 10. (a) Pressure drift of different sensors with time (applied load of 30 gf) and (b) Pressure driftof different sensors with time (with applied load of 80 gf).
4. Conclusions
A dynamic sensor calibration setup is proposed in this study. The applied pressure is progressivelyincreased and recorded by using both a force gauge and force/pressure sensor. The sensor iscalibrated by establishing a relationship between the applied pressure and the corresponding reading.The performance of the sensors including accuracy, repeatability and drift is measured. Testing isconducted with a focus on the properties of the contacting surface. Silicone layer samples with differentthickness and hardness are attached to the calibration setup to simulate different skin conditions.The temperature of the skin surrogate is also controlled to simulate the skin temperature under differentactivity levels. The advantages of this dynamic sensation calibration set-up include:
• Ensuring that force is applied in the same location of the sensor, thus enhancing repeatability ofthe calibration process;
• Ensuring that force is applied perpendicular to the plane of the sensor;• Simplicity of the set-up;• User-friendliness;• Efficiency in calibration time as compared to dead-weight calibration procedures;• Measuring the desired pressure range; and• Simulating the actual wear conditions where the contacting object is subjected to dynamic pressure
changes, e.g., breathing and body movement.
Three commercially available sensors, the FlexiForce, SingleTact and Pliance X sensors, are usedto determine the influence of the properties of the contacting surface. The FlexiForce and SingleTactsensors are relatively thin, so the effect of sensor attachment is studied. The results show that the

Sensors 2020, 20, 6863 17 of 20
plotted slope of the calibration curve is the smallest for the Standard condition where no support isprovided to the sensor surface, whereas DOS (i.e., aluminum discs are adhered to both sides of thesensor) can improve the sensitivity of the sensor. Therefore, adhering discs on both sides of the sensorsurface can ensure that force is evenly distributed on the sensor and prevent sensor deformation.
The effect of the surface temperature and hardness has also been evaluated. It is found that thechange in sensor output depends on the underlying surface and the different sensors are affected todifferent extents. The calibration curves of the surfaces of different temperatures and hardness arecompared. The curves for the FlexiForce and Pliance X sensor spread widely, thus suggesting that theyare more sensitive to the changes in temperature and hardness of the contacting surface. The sensitivityof the FlexiForce sensor increases with contacting temperature and surface hardness. The sensitivityof Pliance X sensor, on the other hand, decreases with contacting temperature but increases withsurface hardness. As for the SingleTact sensor, most of its calibration curves are close to each otherand overlapping. The sensitivity of this sensor decreases with the contacting temperature and surfacehardness has less impact on its accuracy.
The percentage error is also calculated in which measurements are converted based on the“standard” calibration condition. When measurements are taken on the surfaces with a highertemperature (refer to calibration curve at temperature of 22 C), the FlexiForce, SingleTact, and Pliance Xsensors all obtain a similar percentage error. When the measurement is performed on a soft surface(refer to calibration curve obtained with rigid surface), the percentage error is particularly high for theFlexiForce sensor. This suggests that individual surface calibrations are necessary when the FlexiForcesensor is used on softer material.
In terms of sensor repeatability, the performance of Pliance X is generally better when testedon surfaces with different temperatures and hardness. In contrast, the repeatability of FlexiForce iscomparatively lower.
Finally, these three sensors are subjected to pressure for a longer period of time (5 h for FlexiForceand SingleTact, and 3 h for Pliance X). SingleTact and Pliance X provide a lower pressure drift%,thus implying that they are more suitable for measurements that require a prolonged period of time.
Author Contributions: Conceptualization, K.L.Y.; software and hardware development, K.P.M.T., K.H.O.,and K.H.C.; sample testing, K.P.M.T. and P.L.L.; writing—original draft preparation, K.P.M.T.; writing—reviewand editing, K.P.M.T., K.L.Y., P.L.L., J.Y., K.H.O., K.H.C.; supervision, K.L.Y. All authors have read and agreed tothe published version of the manuscript.
Funding: This research was funded by InnoHK Fund (AIR@InnoHK cluster, AiDLab) and the Innovation andTechnology Fund, ITF/Tier 3 Project ITF/276/18.
Conflicts of Interest: The authors declare no conflict of interest.
Appendix A
Table A1. Hardness of Human Body or Human Body Surrogate.
Author Hardness Body Area/Simulation Material
Muthu [36] 20 Shore A SkinWettels et al. [37] 20–50 Shore A SkinDerler et al. [38] 42.5 Shore A Lorica® Soft fabric
Romanelli and Falanga [39] 16 Shore A Leg50 Shore A Lipodermatosclerosis zone of venous ulcers
Wettenschwiler et al. [40] 30 Shore A Entire body prosthesesCruz et al. [41] 10–90 Shore A Breast prostheses
Chanda [42] 30 Shore A/ 10 Shore OO Skin tissue surrogateSim et al. [43] 27 to 84 Shore OO Skin simulant
Pittar et al. [44] 13.3–28 Shore A Human scalp19 Shore A Skin simulant
Cabibihan et al. [45] 30–86 Shore OO Soft artificial handFalland-Cheung et al. [46] 0–65 Shore A Human skin

Sensors 2020, 20, 6863 18 of 20
References
1. Yu, L.A.; Yick, P.K.; Ng, P.S.; Yip, P.J. The Effect of Pressure and Fabrication of Pressure Therapy Gloves onHand Sensitivity and Dexterity. J. Burn. Care. Res. 2015, 36, e162–e175. [CrossRef] [PubMed]
2. Yu, A.; Yick, K.L.; Ng, S.P.; Yip, J. Prediction of fabric tension and pressure decay for the development ofpressure therapy gloves. Text. Res. J. 2013, 83, 269–287. [CrossRef]
3. Yu, A.; Yick, K.L.; Ng, S.P.; Yip, J. Orthopaedic textile inserts for pressure treatment of hypertrophic scars.Text. Res. J. 2016, 86, 1549–1562. [CrossRef]
4. Van den Kerckhove, E.; Stappaerts, K.; Fieuws, S.; Laperre, J.; Massage, P.; Flour, M.; Boeckx, W. The assessmentof erythema and thickness on burn related scars during pressure garment therapy as a preventive measurefor hypertrophic scarring. Burns 2005, 31, 696–702. [CrossRef] [PubMed]
5. Lai, H.Y.; Li-Tsang, W.P.; Ping, Z.Y. Effect of different pressure magnitudes on hypertrophic scar in a Chinesepopulation. Burns 2010, 36, 1234–1241. [CrossRef]
6. Liu, R.; Kwok, Y.L.; Li, Y.; Lao, T.T.; Zhang, X.; Dai, X.Q. Objective evaluation of skin pressure distribution ofgraduated elastic compression stockings. Dermatol. Surg. 2005, 31, 615–624. [CrossRef]
7. Khodasevych, I.; Parmar, S.; Troynikov, O. Flexible sensors for pressure therapy: Effect of substrate curvatureand stiffness on sensor performance. Sensors 2017, 17, 2399. [CrossRef]
8. Parmar, S.; Khodasevych, I.; Troynikov, O. Evaluation of flexible force sensors for pressure monitoring intreatment of chronic venous disorders. Sensors 2017, 17, 1923. [CrossRef]
9. Khaburi, J.A.; Dehghani-Sanij, A.A.; Nelson, E.A.; Hutchinson, J. Pressure mapping bandage prototype:Development and testing. In Proceedings of the International Conference on Biomedical Engineering (ICoBE),Penang Island, Malaysia, 27–28 February 2012; pp. 430–435. [CrossRef]
10. Lim, N.Y.; Ng, S.P.; Yu, W.; Fan, J. Pressure evaluation of body shapers. In Innovation and Technology ofWomen’s Intimate Apparel; Yu, W., Fan, J., Ng, S.P., Eds.; Woodhead Publishing: Cambridge, UK, 2014.
11. Coltman, C.E.; McGhee, D.E.; Steele, J.R. Bra strap orientations and designs to minimise bra strap discomfortand pressure during sport and exercise in women with large breasts. Sports Med. Open 2015, 1, 21. [CrossRef]
12. Bowles, K.-A.; Steele, J.R. Effects of strap cushions and strap orientation on comfort and sports bra performance.Med. Sci. Sports Exerc. 2013, 45, 1113–1119. [CrossRef]
13. Zhuo, W.L.; Sheng, C.D.; Wei, Q.F.; Bin, L. Effect of elastic materials on pressure comfort of tight-fit bra.Appl. Mech. Mater. 2011, 221–226. [CrossRef]
14. Flaud, P.; Bassez, S.; Counord, J.L. Comparative in vitro study of three interface pressure sensors used toevaluate medical compression hosiery. Dermatol. Surg. 2010, 36, 1930–1940. [CrossRef] [PubMed]
15. McLaren, J.; Helmer, R.; Horne, S.; Blanchonette, I. Preliminary development of a wearable device fordynamic pressure measurement in garments. Procedia Eng. 2010, 2, 3041–3046. [CrossRef]
16. Lin, Y.; Choi, K.-F.; Luximon, A.; Yao, L.; Hu, J.; Li, Y. Finite element modeling of male leg and sportswear:Contact pressure and clothing deformation. Text. Res. J. 2011, 81, 1470–1476. [CrossRef]
17. Chan, W.-Y.; Yip, J.; Yick, K.-L.; Ng, S.-P.; Lu, L.; Cheung, K.M.-C.; Kwan, K.Y.-H.; Cheung, J.P.-Y.;Yeung, K.W.-K.; Tse, C.-Y. Mechanical and clinical evaluation of a shape memory alloy and conventionalstruts in a flexible scoliotic brace. Ann. Biomed. Eng. 2018, 46, 1194–1205. [CrossRef] [PubMed]
18. Aiman, A.F.; Salleh, M.N.; Ismail, K.A. Pressure distribution from two different types of fabrics headgarments with Silon-LTS®face mask for hypertrophic burn scar treatment. In Proceedings of the InternationalConference on Biomedical Engineering (ICoBE), Penang, Malaysia, 30–31 March 2015; pp. 1–5. [CrossRef]
19. Razak, A.; Hadi, A.; Zayegh, A.; Begg, R.K.; Wahab, Y. Foot plantar pressure measurement system: A review.Sensors 2012, 12, 9884–9912. [CrossRef]
20. Parikesit, E.; Mengko, T.L.R.; Zakaria, H. Wearable gait measurement system based on accelerometer andpressure sensor. In Proceedings of the International Conference on Instrumentation, Communications,Information Technology, and Biomedical Engineering, Bandung, West Java, Indonesia, 8–9 November 2011;pp. 395–398. [CrossRef]
21. Zheng, R.; Yu, W.; Fan, J. Pressure evaluation of 3D seamless knitted bras and conventional wired bras.Fiber. Polym. 2009, 10, 124. [CrossRef]
22. Ferguson-Pell, M.; Hagisawa, S.; Bain, D. Evaluation of a sensor for low interface pressure applications.Med. Eng. Phys. 2000, 22, 657–663. [CrossRef]
Sensors 2020, 20, 6863 19 of 20
23. Hollinger, A.; Wanderley, M.M. Evaluation of Commercial Force-Sensing Resistors. In Proceedings of theInternational Conference on New Interfaces for Musical Expression, Paris, France, 4–8 June 2006; pp. 4–8.
24. Karjalainen, O.-P. Capacitive Measurement for Robot Z-Axis Position; Tampere University of Technology:Tampere, Finland, 2017.
25. Komi, E.R.; Roberts, J.R.; Rothberg, S.J. Evaluation of thin, flexible sensors for time-resolved grip forcemeasurement. Proc. Inst. Mech. Eng. C 2007, 221, 1687–1699. [CrossRef]
26. Buis, A.W.P.; Convery, P. Calibration problems encountered while monitoring stump/socket interfacepressures with force sensing resistors: Techniques adopted to minimise inaccuracies. Prosthet. Orthot. Int.1997, 21, 179–182. [CrossRef]
27. Jensen, T.R.; Radwin, R.G.; Webster, J.G. A conductive polymer sensor for measuring external finger forces.J. Biomech. 1991, 24, 851–858. [CrossRef]
28. Hall, R.S.; Desmoulin, G.T.; Milner, T.E. A technique for conditioning and calibrating force-sensing resistorsfor repeatable and reliable measurement of compressive force. J. Biomech. 2008, 41, 3492–3495. [CrossRef][PubMed]
29. Flórez, J.A.; Velásquez, A. Calibration of Force Sensing Resistors (fsr) for Static and Dynamic Applications.In Proceedings of the IEEE Andescon, Bogota, Colombia, 15–17 September 2010; pp. 1–6. [CrossRef]
30. Likitlersuang, J.; Leineweber, M.J.; Andrysek, J. Evaluating and improving the performance of thin film forcesensors within body and device interfaces. Med. Eng. Phys. 2017, 48, 206–211. [CrossRef] [PubMed]
31. Liu, R.; Kwok, Y.-L.; Li, Y.; Lao, T.-T. Fabric mechanical-surface properties of compression hosiery and theireffects on skin pressure magnitudes when worn. Fibres Text. East. Eur. 2010, 18, 79.
32. Park, S.J.; Tamura, T. Distribution of evaporation rate on human body surface. Ann. Physiol. Anthropol. 1992,11, 593–609. [CrossRef] [PubMed]
33. Tekscan, N.D. Best Practices in Electrical Integration of the FlexiForce™ Sensor. Available online: https://www.tekscan.com/resources/product-guide/best-practices-electrical-integration-flexiforce-sensor (accessed on9 October 2020).
34. Bethaves, T. Interface pressure measurement: Testing and selecting sensors. J. Wound. Care. 2002, 11, 325–329.[CrossRef] [PubMed]
35. Tekscan, N.D. FlexiForce Sensors User Manual. Available online: https://www.tekscan.com/support/faqs/flexiforce-user-manual (accessed on 9 October 2020).
36. Muthu, J.E. Mechanics of Silicon Micro Needle Penetration in Human Cadaver Skin and Skin Substitutes;Lehigh University: Bethlehem, PA, USA, 2007.
37. Wettels, N.; Marshall, P.; Peters, B.; Mahmoudzadeh, J. Polymer-Fabric Pressure Sensor for Space Suits.In Proceedings of the 48th International Conference on Environmental Systems, Albuquerque, NM, USA,8–12 July 2018.
38. Derler, S.; Schrade, U.; Gerhardt, L. Tribology of human skin and mechanical skin equivalents in contact withtextiles. Wear 2007, 263, 1112–1116. [CrossRef]
39. Romanelli, M.; Falanga, V. Use of a durometer to measure the degree of skin induration in lipodermatosclerosis.J. Am. Acad. Dermatol. 1995, 32, 188–191. [CrossRef]
40. Wettenschwiler, P.D.; Annaheim, S.; Lorenzetti, S.; Ferguson, S.J.; Stämpfli, R.; Psikuta, A.; Rossi, R.M.Validation of an instrumented dummy to assess mechanical aspects of discomfort during load carriage.PLoS ONE 2017, 12, e0180069. [CrossRef] [PubMed]
41. Cruz, P.; Hernandez, F.; Zuñiga, M.; Rodríguez, J.; Figueroa, R.; Vertiz, A.; Pineda, Z. A Biomimetic Approachfor Designing a Full External Breast Prosthesis: Post-Mastectomy. Appl. Sci. 2018, 8, 357. [CrossRef]
42. Chanda, A. Biomechanical Modeling of Human Skin Tissue Surrogates. Biomimetics 2018, 3, 18. [CrossRef][PubMed]
43. Sim, D.J.K.; Kim, S.M.; Kim, S.S.; Doh, I. Portable Skin Analyzers with Simultaneous Measurements ofTransepidermal Water Loss, Skin Conductance and Skin Hardness. Sensors 2019, 19, 3857. [CrossRef][PubMed]
44. Pittar, N.; Winter, T.; Falland-Cheung, L.; Tong, D.; Waddell, J. Scalp simulation–A novel approach tosite-specific biomechanical modeling of the skin. J. Mech. Behav. Biomed. Mater. 2018, 77, 308–313. [CrossRef]
45. Cabibihan, J.-J.; Joshi, D.; Srinivasa, Y.M.; Chan, M.A.; Muruganantham, A. Illusory sense of human touchfrom a warm and soft artificial hand. IEEE Trans. Neural Syst. Rehabil. Eng. 2014, 23, 517–527. [CrossRef]

Sensors 2020, 20, 6863 20 of 20
46. Falland-Cheung, L.; Pittar, N.; Tong, D.; Waddell, J.N. Investigation of dental materials as skin simulantsfor forensic skin/skull/brain model impact testing. Forensic Sci. Med. Pathol. 2015, 11, 552–557. [CrossRef][PubMed]
Publisher’s Note: MDPI stays neutral with regard to jurisdictional claims in published maps and institutionalaffiliations.
© 2020 by the authors. Licensee MDPI, Basel, Switzerland. This article is an open accessarticle distributed under the terms and conditions of the Creative Commons Attribution(CC BY) license (http://creativecommons.org/licenses/by/4.0/).


