E. R. Ingham - soilACE
13
I. Session 2 - Paper 2 – Ingham, Slaughter 127 THE SOIL FOODWEB – SOIL AND COMPOSTS AS LIVING ECOSYSTEMS Elaine R. Ingham 1,2 and Matthew D. Slaughter 2 1 Graduate Research, Southern Cross University, Lismore, NSW and 2 Soil Foodweb, Inc. 1128 NE 2 nd St. Suite 120 Corvallis, OR 97330 [email protected] The soil food web consists of bacteria, fungi, including mycorrhizal fungi, protozoa, nematodes, micro arthropods and a range of aboveground predators, from earthworms to spiders, mice, birds, etc (Ingham et al. 1986, part I and II). The precise composition of each group in this food web varies with soil types (mineral composition, depth of horizons, structure, texture, etc), with organic food resources present, with prevailing temperatures, climate, etc, as outlined by the classic work by Hans Jenny. It seems beyond the capability of our limited resources, however, to comprehend the actual diversity of these organisms in soil or compost. Recent estimates of species diversity in soil, and most likely in compost as well, puts molecular diversity in the millions of species of bacteria per kg of soil or compost. Fungal diversity is possibly not quite so great, but still beyond easy, or possibly more importantly, affordable, assessment, at least at this time. But all is not hopeless, because if we use a more affordable level of resolution, we can summarize biology at a less finely resolved level. Assessment of bacterial or fungal biomass, with separation of active biomass and total biomass, is much more easily performed than molecular assessments. The question then becomes what method(s) to use to assess biomass (Ingham et al, 1986). Table 1. Methods used to assess bacterial and fungal biomass in soil and compost. Direct Microscope Methods – the organisms are examined and the proper criteria must be met in order to measure the organism and include it in the assessment of numbers, or more precisely, biomass (length and width of the organism measured). • Light microscope methods o Jones and Mollison possibly developed the original means of measuring organism numbers and biomass in soil, although arguments are valid that Van Leeuwenhoek examined soil and compost. These early light microscope I International Conference SOIL AND COMPOST ECO-BIOLOGY September 15th – 17th 2004, León - Spain
Transcript of E. R. Ingham - soilACE

I. Session 2 - Paper 2 – Ingham, Slaughter 127
THE SOIL FOODWEB – SOIL AND COMPOSTS AS LIVING
ECOSYSTEMS Elaine R. Ingham1,2 and Matthew D. Slaughter2
1Graduate Research, Southern Cross University, Lismore, NSW
and 2Soil Foodweb, Inc.
1128 NE 2nd St. Suite 120 Corvallis, OR 97330
The soil food web consists of bacteria, fungi, including mycorrhizal fungi, protozoa, nematodes, micro arthropods and a range of aboveground predators, from earthworms to spiders, mice, birds, etc (Ingham et al. 1986, part I and II). The precise composition of each group in this food web varies with soil types (mineral composition, depth of horizons, structure, texture, etc), with organic food resources present, with prevailing temperatures, climate, etc, as outlined by the classic work by Hans Jenny. It seems beyond the capability of our limited resources, however, to comprehend the actual diversity of these organisms in soil or compost. Recent estimates of species diversity in soil, and most likely in compost as well, puts molecular diversity in the millions of species of bacteria per kg of soil or compost. Fungal diversity is possibly not quite so great, but still beyond easy, or possibly more importantly, affordable, assessment, at least at this time. But all is not hopeless, because if we use a more affordable level of resolution, we can summarize biology at a less finely resolved level. Assessment of bacterial or fungal biomass, with separation of active biomass and total biomass, is much more easily performed than molecular assessments. The question then becomes what method(s) to use to assess biomass (Ingham et al, 1986). Table 1. Methods used to assess bacterial and fungal biomass in soil and compost. Direct Microscope Methods – the organisms are examined and the proper criteria must be met in order to measure the organism and include it in the assessment of numbers, or more precisely, biomass (length and width of the organism measured).
• Light microscope methods o Jones and Mollison possibly developed the original means of measuring
organism numbers and biomass in soil, although arguments are valid that Van Leeuwenhoek examined soil and compost. These early light microscope
I International Conference SOIL AND COMPOST ECO-BIOLOGY September 15th – 17th 2004, León - Spain

128 I. Session 2 - Paper 2 – Ingham, Slaughter
methods were limited by the ability of the microscopes at the time to resolve individuals, especially those whose refractive index is the same or close to water.
• Phase contrast microscopy o The limitation is the ability to see “ghost hyphae” (similar refractive index as
water) and to differentiate bacteria from clay colloids which are the same size and general shape as bacteria.
• Differential Interference Microscopy o Shadowing methods allow visualization of all organisms, as long as they have
surfaces. Refractive index is no longer a limitation. Length and width of the organism can be clearly resolved. Bio volume is calculated, and either bio volume, or biomass used as a comparison of bacteria, fungi, protozoa and nematodes.
Plate Methods – • Soil or compost samples are spread on specific media containing one to five kinds of
carbon food resources, incubated at one temperature, one moisture level, one humidity, and at reduced oxygen levels (lid on the plate restricts oxygen exchange during incubation). It is not possible that ALL the organisms in soil could possibly grow in these limited conditions. Most assessments of diversity suggest LESS THAN 0.01% of the actual diversity is capable of growing on any one, or even four to eight different media incubated in lab conditions. Selection is for DISEASE organisms, because that is what plate methods were developed to assess. Even as a means of assessing numbers, at least a 100-fold reduction in actual numbers of any ONE species is what will grow on the plate medium (Ablett, 2001).
Chloroform Fumigation (Ingham and Horton, 1987) • The concept is that fumigating the soil will kill all the organisms in the soil, and then
inoculation with bacteria will result in use of the dead biomass. Carbon dioxide evolution will then be a measure of the dead biomass.
• Problems with this method are rife, not least of which is that bacterial inoculation is not necessary, because fumigation NEVER kills all the organisms in the soil. How could a method where all the organisms in a sample are not killed purport to be a measure of total biomass?
• See Ingham and Horton 1986 where some of the extreme problems with this method are documented, not least of which is the fact that sometimes bacteria are the dominant organisms growing up after fumigation, and sometimes fungi are the organisms that grow after fumigation. It is commonly known that bacterial and fungal metabolism are extremely different in their efficiency on different carbon sources (textbooks of introductory microbiology).
Enzyme Methods (Sylvia, et al., 1999) • Total biomass cannot be determined using this approach • Functional activity can be assessed, specifically for whatever function is of interest, for
example, cellulose decomposition, or dehydrogenase activity. But, no one method measures ALL activity. Even FDA staining is a measure of AEROBIC respiration, and does not include strict anaerobic activity, or facultative anaerobes growing anaerobically.
• Several researchers have suggested that one or another enzyme could be indicative of general activity, but interpreting this for all systems, in all conditions, without first testing in all those conditions is fraught with danger.
I. Session 2 - Paper 2 – Ingham, Slaughter 129
There are biologists who use plate counts methods to assess numbers of individuals of bacteria, and fungi. But most microbiologists know, “numbers of fungi” is a nonsensical concept. Consider that one fungal individual can produce millions of spores, each of which can become a colony on a plate medium. Consider that the largest individual organism on this planet is a single fungus. This one individual currently occupies a several square mile area in a Michigan forest. It may be a few cm deep into the soil, to more than half a meter deep. A close second to that fungus exists in Wisconsin. Perusal of the Guinness Book of World Records should bring readers up-to-date on which fungal individual is the current record holder, as will reading Nature, or Science. If several soil samples were taken from either location, the soil blended to break up lumps and make the sample uniform, and the soil plated “out” so the fungus could grow, then thousands of colonies would likely be the result, growing on that plate medium. Does that mean in fact there are thousands of individuals of that fungus present in the soil? There is only one individual fungus, to the best of anyone’s knowledge. Plate counts methods are clearly mis-leading, and require real understanding of how to interpret what they in fact mean, not just a simple, and highly incorrect assessment of “huge numbers of fungi in this soil”. Bacteria exist as very small individuals, and thus plate methods possibly work “better” for assessing their numbers. Still, only a very few bacterial species can actually grow on plate count media, so there is a built in bias with plate methods for “lab rats”. Therefore, use of plate counts to assess “numbers” results in mis-leading conclusions about soil. Biomass determinations are the approach that must be used when we need to compare bacteria versus fungi. Chloroform fumigation methods to assess fungal versus bacterial biomass is not possible. Fumigation methods measure the carbon dioxide respired from the biomass of bacteria, fungi, protozoa and nematodes killed by chloroform fumigation. Ingham and Horton (1987) showed that an unknown and highly variable portion of the actual biomass of organisms present in any fumigated sample is actually killed by chloroform. If not everything is killed, then how can a method be said to measure total biomass? If bacteria are the predominant organism that grows after fumigation, using the dead organisms, then more carbon dioxide will be respired than if fungi are predominant following fumigation. This difference in fungal versus bacterial use of substrates is taught in Introductory Microbiology classes, and goes back to Thimann, Louis Pasteur, and Koch at the dawn of our understanding of microbiology. How could anyone imagine that it makes no difference whether the dead biomass is used by mostly bacteria, or mostly fungi? The infamous “k” value used to convert carbon dioxide respired to biomass depends on what the researcher’s bias, not on any solid, consistent, reliable or documented science (Ingham and Horton, 1987). As paper after paper on chloroform fumigation is examined, it becomes apparent that different soils require different “k” values in order to make the data “make sense”. When the carbon dioxide generated from the killed sample can be less than what is generated from the “control”, or not-killed sample, it is clear that this method does not hold up to rigorous scientific standards. And even if somehow a claim that this method is useful as a “general indication” of biomass, it is impossible to separate the carbon dioxide respired by bacteria, from that respired by

130 I. Session 2 - Paper 2 – Ingham, Slaughter
fungi, or protozoa, nematodes or earthworms. Imagine one small earthworm, or earthworm egg present in a fumigated soil or compost sample. The carbon dioxide released from that dead body would be enormous. Chloroform fumigation is not useful as a means of understanding what the biology is doing in soil. Do we need to know the difference between bacteria and fungi? Scanning electron micrographs of compost (Fig 1, 2) differential interference micrographs of compost or soil, or even light microscope pictures of compost and soil demonstrate how widely different the bacterial versus fungal biomass can be from compost to compost. Fungal biomass is predominant in some samples, while bacteria are dominant in others. As compost, or soil, is scanned, this predominance remains throughout the whole sample, through the whole compost pile, through the whole forest, agricultural field, and so forth. Fig 1. Scanning electron micrograph of fully aerobic compost. Note the large number of bacteria, fungal strands and protozoa present in the field of view.
How important is it to be able to differentiate bacteria from fungi? Measuring Bacterial versus Fungal Microbial Biomass Comparing biomass values across ecosystems, moving from less productive to more productive ecosystems, of bacteria and fungi, there is a clear relationship between bacterial versus fungal dominance and increasing productivity. This assessment has been repeated numerous times by Soil Foodweb Inc., and the entire database of over 100,000 soils that have been examined and assessed document this same information.

I. Session 2 - Paper 2 – Ingham, Slaughter 131
Fig 2. Scanning electron micrograph of anaerobic, smelly, putrefying organic matter. Quite a few bacteria can be seen in this micrograph, but fungi are lacking. Aeration channels are almost non-existent as well.
Sample 3
Table 2. Bacterial and fungal biomass (micrograms of active or total biomass per gram dry weight of material, measured in the fresh material but converted to per dry weight after assessment of moisture) in increasing productivity (plant material produced per year) ecosystems. Ecosystem Bacterial Biomass Fungal Biomass Fungal Active Total Active Total Diameter Weedy field 56 147 11 64 2.0 ChemGarden 78 144 3 19 2.0 ChemPasture 44 128 14 55 2.5 NonChemPasture 84 117 23 83 2.5 Clearcut fir site 17 124 16 74 3.0 NonChemGarden 81 180 30 47 2.5 OrgPotato 94 229 10 238 2.5 OrgStrawberry 340 531 22 702 2.5 15yr old fir 165 245 29 1275 2.5 800 yr old fir 194 558 80 2946 3.0 forest Coefficient of Variation (%) 18 12 8 17 0.5

132 I. Session 2 - Paper 2 – Ingham, Slaughter
Ecosystems were characterized by the vegetation present. Chem prefix indicates use of chemical pesticides and high levels of inorganic fertilizer applications (greater than 100 pounds inorganic fertilizer per acre per year). Org indicates no inorganic fertilizers or pesticide applications. NonChem means use of inorganic fertilizers below 100 pounds per acre per year. Forests were maintained by the US Forest Service (H.J. Andrews LTER site, Blue River, Oregon) All biomass measures performed as per Ingham et al. 1986. Active bacterial and active fungal biomass determined by staining with fluorescein diacetate, and measuring length and width of bacteria and fungi meeting morphological criteria for those organisms. Training requires 6 to 12 months to be able to properly assess morphology. Total bacteria determined using FITC protein staining, and measurement of all bacteria present, but separated from clays as clay does not accumulate great enough protein levels to be mistaken for bacteria. Total fungal biomass and fungal diameters determined using DIC microscopy. Soil Foodweb Inc has also examined the relationship between plate count values (index as determined by BBC Labs, Tempe, AR, see website www.bbclabs.com) and direct microscope assessments. These same relationships, between plate measures and direct determinations, have been documented by the Extension Service personnel in southern Colorado. Table 3. Comparison of plate count methods and direct methods in the assessment of ecosystem productivity, from most productive systems to less productive systems. Ecosystem Plate Count Total Biomass (µg/g dry weight) “Index” Bacteria Fungi Old Growth Conifer forest 0 500 1200
(no growth on plates) Pasture 2 lb weight gain 5 675 830 per animal per day 1 lb weight gain 6 230 50 per animal per day Agricultural field 180 bushel yield 7 450 400 100 bushel yield 12 210 75 The measures taken in Table 3 were not replicated, but the trend is clear, despite the lack of replication of each ecosystem. These relationships have been repeated by other researchers, and their data should be forthcoming. Is real compost made of plant matter? One of the factors we have been examining is of what is compost really comprised? There is a significant difference between poor compost, which really should be called mulch, or
I. Session 2 - Paper 2 – Ingham, Slaughter 133
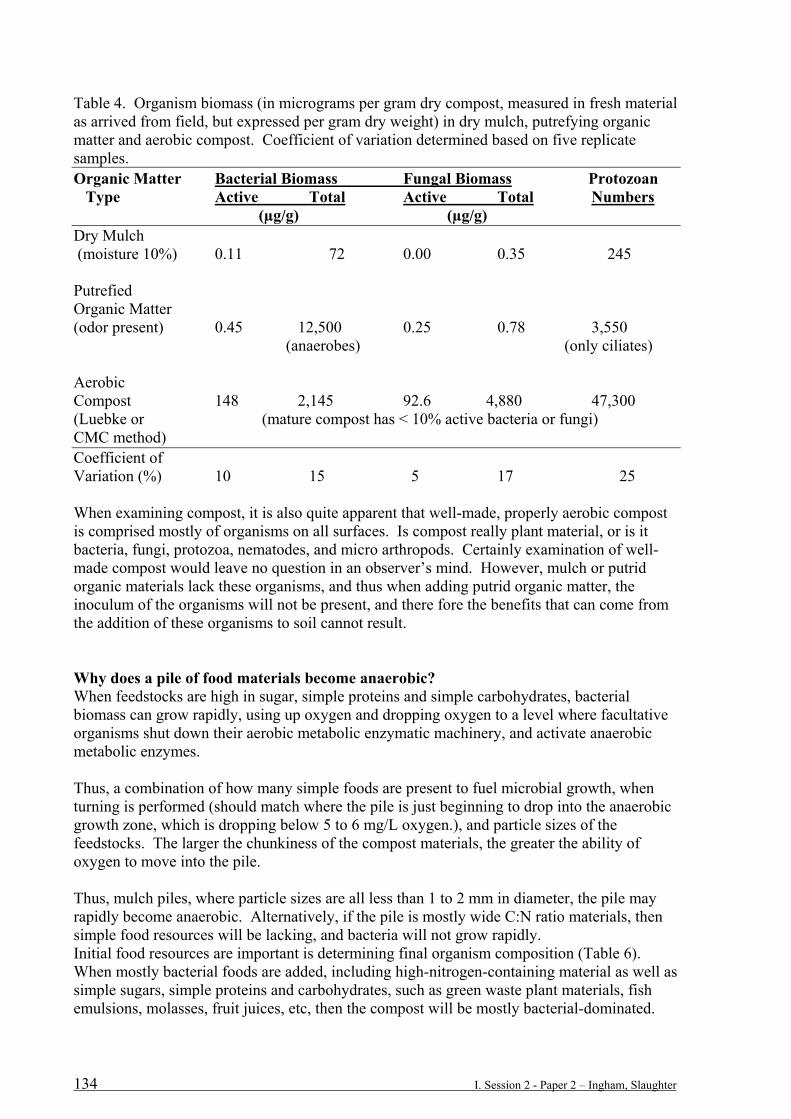
putrefying organic matter, and the decomposition process has not truly occurred. Whether the composting process has not yet truly begun (compost too dry, lacking organisms, lacking nitrogen source), or decomposition is dominated by anaerobic processes (putrefying organic matter), the “take-home” message here is that these kinds of not-properly composted materials should not be called compost. Compost is by definition an aerobic process. The final material should be dominated by aerobic bacteria, fungi, protozoa, nematodes and possibly even micro arthropods, if the compost has been allowed to mature properly (rarely turned). Examination of improperly composted materials shows low to no biology present in the material, whether because the compost was too dry or because it was anaerobic (see Figures above and Table 4 below). Plant materials that have become anaerobic can be easily detected by the sulphurous, or ammonia smells, or by the volatile organic acids produced during anaerobic metabolism (acetic acid, butyric acid, valeric acid) and other aromatic compounds only produced in conditions where oxygen is limited (e.g., putrescine). The scanning electron micrographs most clearly show the situation between mulch, anaerobic compost and aerobically produced compost. Compost is made of organisms, if the compost is made properly. This then is a simple test of compost quality. Prepare a one-to-one dilution of compost and water (use good quality water, not tap water), and examine it wit a light microscope. Protozoa, bacteria and fungal strands should be immediately apparent (see Compost Quality: Light Microscope Methods, by E. R. Ingham, Soil Foodweb Inc., 2004, website – www.soilfoodweb.com) Clearly, organism biomass and activity can be used to assess whether compost has been composted correctly, what type of method was used in the decomposition process, and whether the compost will contain the biology needed for transfer to the soil, and improvement of organism numbers in the soil.
134 I. Session 2 - Paper 2 – Ingham, Slaughter
Table 4. Organism biomass (in micrograms per gram dry compost, measured in fresh material as arrived from field, but expressed per gram dry weight) in dry mulch, putrefying organic matter and aerobic compost. Coefficient of variation determined based on five replicate samples. Organic Matter Bacterial Biomass Fungal Biomass Protozoan Type Active Total Active Total Numbers (µg/g) (µg/g) Dry Mulch (moisture 10%) 0.11 72 0.00 0.35 245 Putrefied Organic Matter (odor present) 0.45 12,500 0.25 0.78 3,550 (anaerobes) (only ciliates) Aerobic Compost 148 2,145 92.6 4,880 47,300 (Luebke or (mature compost has < 10% active bacteria or fungi) CMC method) Coefficient of Variation (%) 10 15 5 17 25 When examining compost, it is also quite apparent that well-made, properly aerobic compost is comprised mostly of organisms on all surfaces. Is compost really plant material, or is it bacteria, fungi, protozoa, nematodes, and micro arthropods. Certainly examination of well-made compost would leave no question in an observer’s mind. However, mulch or putrid organic materials lack these organisms, and thus when adding putrid organic matter, the inoculum of the organisms will not be present, and there fore the benefits that can come from the addition of these organisms to soil cannot result. Why does a pile of food materials become anaerobic? When feedstocks are high in sugar, simple proteins and simple carbohydrates, bacterial biomass can grow rapidly, using up oxygen and dropping oxygen to a level where facultative organisms shut down their aerobic metabolic enzymatic machinery, and activate anaerobic metabolic enzymes. Thus, a combination of how many simple foods are present to fuel microbial growth, when turning is performed (should match where the pile is just beginning to drop into the anaerobic growth zone, which is dropping below 5 to 6 mg/L oxygen.), and particle sizes of the feedstocks. The larger the chunkiness of the compost materials, the greater the ability of oxygen to move into the pile. Thus, mulch piles, where particle sizes are all less than 1 to 2 mm in diameter, the pile may rapidly become anaerobic. Alternatively, if the pile is mostly wide C:N ratio materials, then simple food resources will be lacking, and bacteria will not grow rapidly. Initial food resources are important is determining final organism composition (Table 6). When mostly bacterial foods are added, including high-nitrogen-containing material as well as simple sugars, simple proteins and carbohydrates, such as green waste plant materials, fish emulsions, molasses, fruit juices, etc, then the compost will be mostly bacterial-dominated.
I. Session 2 - Paper 2 – Ingham, Slaughter 135
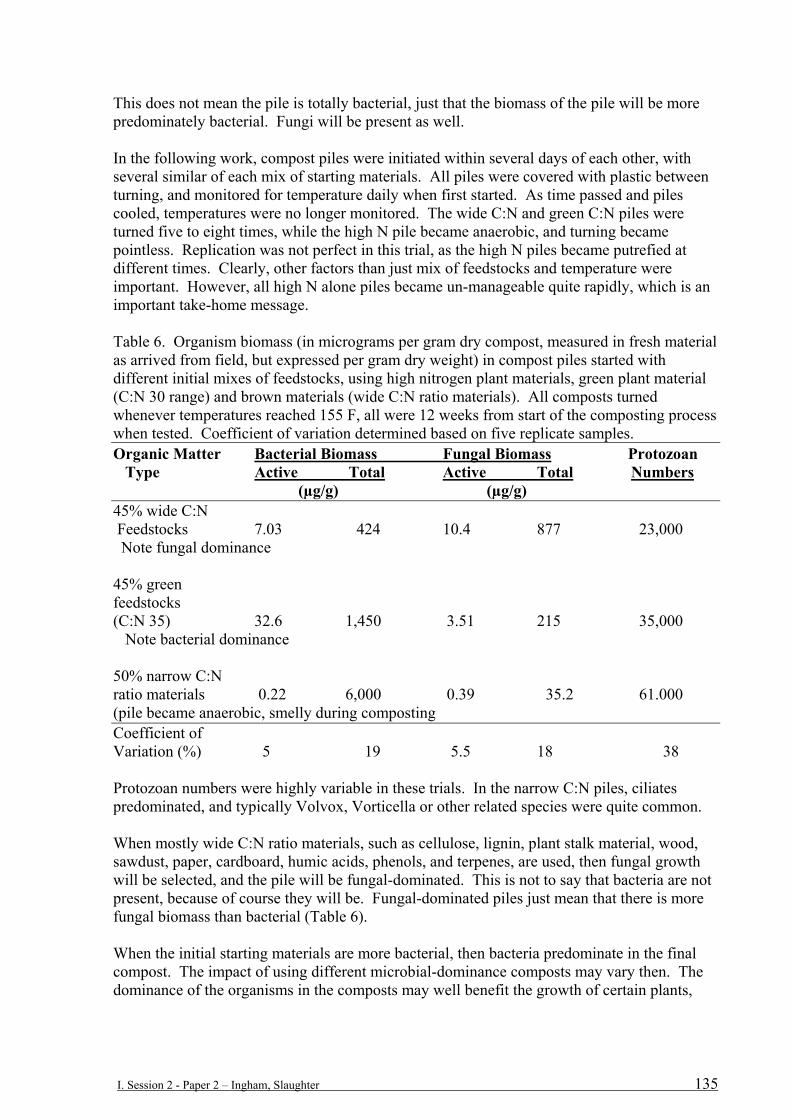
This does not mean the pile is totally bacterial, just that the biomass of the pile will be more predominately bacterial. Fungi will be present as well. In the following work, compost piles were initiated within several days of each other, with several similar of each mix of starting materials. All piles were covered with plastic between turning, and monitored for temperature daily when first started. As time passed and piles cooled, temperatures were no longer monitored. The wide C:N and green C:N piles were turned five to eight times, while the high N pile became anaerobic, and turning became pointless. Replication was not perfect in this trial, as the high N piles became putrefied at different times. Clearly, other factors than just mix of feedstocks and temperature were important. However, all high N alone piles became un-manageable quite rapidly, which is an important take-home message. Table 6. Organism biomass (in micrograms per gram dry compost, measured in fresh material as arrived from field, but expressed per gram dry weight) in compost piles started with different initial mixes of feedstocks, using high nitrogen plant materials, green plant material (C:N 30 range) and brown materials (wide C:N ratio materials). All composts turned whenever temperatures reached 155 F, all were 12 weeks from start of the composting process when tested. Coefficient of variation determined based on five replicate samples. Organic Matter Bacterial Biomass Fungal Biomass Protozoan Type Active Total Active Total Numbers (µg/g) (µg/g) 45% wide C:N Feedstocks 7.03 424 10.4 877 23,000 Note fungal dominance 45% green feedstocks (C:N 35) 32.6 1,450 3.51 215 35,000 Note bacterial dominance 50% narrow C:N ratio materials 0.22 6,000 0.39 35.2 61.000 (pile became anaerobic, smelly during composting Coefficient of Variation (%) 5 19 5.5 18 38 Protozoan numbers were highly variable in these trials. In the narrow C:N piles, ciliates predominated, and typically Volvox, Vorticella or other related species were quite common. When mostly wide C:N ratio materials, such as cellulose, lignin, plant stalk material, wood, sawdust, paper, cardboard, humic acids, phenols, and terpenes, are used, then fungal growth will be selected, and the pile will be fungal-dominated. This is not to say that bacteria are not present, because of course they will be. Fungal-dominated piles just mean that there is more fungal biomass than bacterial (Table 6). When the initial starting materials are more bacterial, then bacteria predominate in the final compost. The impact of using different microbial-dominance composts may vary then. The dominance of the organisms in the composts may well benefit the growth of certain plants,

136 I. Session 2 - Paper 2 – Ingham, Slaughter
and not others. Work needs to be done to understand the plant requirements of each plant species, cultivar, etc. The beneficial interactions that bacteria, fungi, protozoa and nematodes provide to plants have been well-covered in many other publications, and the reader is therefore directed to the Soil Biology Primer, 2000, Coleman and Ingham, (1988), Hunt at al., (1987, 1988), and Sylvia et al, (1999). Can organisms in composts and in liquid composts (aerated compost teas) benefit plant growth? Composts have been shown to be beneficial to the growth of many plant species. As shown by Highland, et al., 2004 (ESA meetings, 2004), well-made, aerobic compost can replace the use of peat moss in green house and nursery potting trials. Plants grown in the compost pots actually had higher visual quality than the plants growth in potting mixes. There are reports in the literature showing that “compost” addition did not benefit plant growth. It is quite likely that compost microbial quality was completely ignored in these studies, and that in fact, putrid organic matter, not compost, was used in these failed trials. Since compost can clearly be beneficial to plant growth, what about liquid composts? If it is in fact the organisms, as well as the foods the organisms need to grow, which benefits plant health, then we should be able to extract the organisms from the compost, move them into water, and use watering systems to apply the benefits of the compost. Is that possible? We have shown this to be the case in example after example after example in the field. Literally hundreds of trials have been performed, with benefits apparent, and clear, IF the proper biology is maintained in the liquid. If the biology is not present in the teas, then benefits are not seen. For example, the following study was performed on sets of tomato plants received from a local nursery where the tomato plants were showing signs of blight. All the plants were infected to some extent, and so the nursery was going to throw them all away. We obtained the plants from the nursery, which prefers not to be named because the perception might get out that they have poor quality plants if they allow their name to be used. A third of the plants were treated with compost tea #1, a third with compost tea #2, and a third with nothing but water. Which compost tea will do the job? How can you tell which is going to work, or will both work? The following assessment shows that aerated compost tea can benefit plant growth significantly, that plants infected with blight can be brought back from certain death, and the assays that should be performed to be able to be predictive about whether the compost tea will work or not. All groups of plants were grown in the lab, using grow lights, watering at the same time and with the same water. Plants from the treatment with compost tea #2 survived and were taken home to plant in people’s gardens. In one case, the plant bore fruit until mid-December. In the case of compost tea #1, all plants died within a week of application of the “tea”. All plant treated with water died within days of initiating this trial.

I. Session 2 - Paper 2 – Ingham, Slaughter 137
Table 7. Groups of tomato infected with blight, obtained from a local nursery, were treated with water (control, all of which died within a few days, data not shown), with tea #1 and tea #2. Different methods of assessing compost tea organisms were performed, in order to demonstrate which set of assays is most effective at predicting which tea will be able to prevent blight in tomato.
Tea lacking Tea CapableSuppressiveness of Suppressing Disease
Plate Methods (MPN or CFU) TSA 1.6 (0.5) X 108 1.6 (0.7) X 108
King’s B 5.0 (1.4) X 103 1.2 (0.2) X 103
Cellulose 35 (12) 210 (43) Spore-formers 7.9 (0.4) X 102 0.3 (0.1) X 102
Direct Microscopy (ug per ml)Active Bacteria 8.0 (2.6) 12.7 (5.0)Total Bacteria 25.1 (1.0) 245 (34)Active Fungi 0.00 3.76 (1.00)Total Fungi 0.35 (0.12) 11.1 (2.33)
Leaf Coverage (%)Bacterial 27 (4.7) 86.9 (9.7)Fungal 0 5.1 (0.6)
Disease All died None died(5 plants) of blight
Clearly, plate count methods were not in any way predictive of which compost tea contained the appropriate biology to deal with the blight infestation. In the tea which did not suppress blight, there was actually a higher number of species and more individuals of pseudomonades in the not-effective tea. Many pseudomonades, which is what King’s B medium selects for, are disease-causing organisms. So, higher numbers, or higher number of species does not necessarily lead to any conclusion about tea quality. The same pattern is seen with the spore-forming bacterial plate counts – even though the plate assessments indicated “better”, in fact, the tea was not as effective. Thus, plate count methods are not predictive of whether tea will “work” or not. Direct microscopy clearly is a predictive method for assessing whether there will be a benefit to plants. More bacterial biomass, more active bacterial biomass, higher fungal activity and higher total fungal biomass were present in the effective compost tea. More organism numbers in the tea, the greater the coverage of the leaf surfaces with those organisms, and the greater the barrier against disease-causing organisms. The more the organisms are present, the greater the competition against diseases. Thus, leaf coverage is also another highly effective method for predicting whether compost tea will reduce, or even prevent blight in tomato.

138 I. Session 2 - Paper 2 – Ingham, Slaughter
Conclusions There should be no question that properly made compost is actually mainly biomass of micro organisms, including bacteria, fungi, protozoa and nematodes. Clearly, it is important to know whether bacteria or fungi are the predominant organisms in the compost, or soil. Compost contains mostly beneficial organisms, since any pathogenic organisms will be out-competed, suppressed and inhibited by the enormous diversity of organisms growing in compost. Unless something about the composting process goes wrong, and begins to select for pathogen growth. Most plant pathogens are facultative anaerobes, and thus reduced oxygen conditions are typically selective for plant pathogens. Thus when composts “go anaerobic”, then that putrid pile should not be counted as compost. Composting is an aerobic process. Diversity of organisms in compost will clearly be enhanced by increasing the diversity of the food resources from which the pile is made, by maintaining aerobic conditions and improving nutrient cycling in the pile (Soil Biology Primer, 2000). Since it is the biology that explains so much of the benefit of compost, then liquid composts will also give great benefits, as long as the organisms are present and functioning in the liquid compost, or aerated compost tea. For more information about compost tea, please read the Compost Tea Brewing Manual, Ingham, 2004. References Coleman, D.C. and E.R. Ingham. (1988). Carbon, nitrogen, phosphorus and sulfur cycling in terrestrial ecosystems. Biogeochemistry 5:3-6. Hunt, H.W., E.R. Ingham, D.C. Coleman, E.T. Elliott and C.P.P. Reid. (1988). Nitrogen limitation of decomposition and primary production in short grass, mountain meadow and lodgepole pine forest. Ecology 69:1009-1016. Hunt, H.W., D.C. Coleman, E.R. Ingham, R.E. Ingham, E.T. Elliott, J.C. Moore, C.P.P. Reid and C.R. Morley. (1987). The detrital food web in a short grass prairie. Biol. Fert. Soil 3:57-68. Ingham, R.E., J.A. Trofymow, E.R. Ingham and D.C. Coleman. (1985). Interactions of bacteria, fungi and their nematode grazers: Effects on nutrient cycling and plant growth. Ecological Monographs 55:119-140. Ingham, E.R., C. Cambardella and D.C. Coleman. (1986). Manipulation of bacteria, fungi and protozoa by biocides in lodgepole pine forest soil microcosms: Effects on organism interactions and nitrogen mineralization. Can. J. Soil Sci. 66:261-272. Ingham, E.R., J.A. Trofymow, R.N. Ames, H.W. Hunt, C.R. Morley, J.C. Moore and D.C. Coleman. (1986). Trophic interactions and nitrogen cycling in a semiarid grassland soil. Part I. Seasonal dynamics of the natural populations, their interactions and effects on nitrogen cycling. J. Applied Ecology 23:597-614.

I. Session 2 - Paper 2 – Ingham, Slaughter 139
Ingham, E.R., J.A. Trofymow, R.N. Ames, H.W. Hunt, C.R. Morley, J.C. Moore and D.C. Coleman. (1986). Trophic interactions and nitrogen cycling in a semiarid grassland soil. Part II. System responses to removal of different groups of soil microbes or fauna. J. Applied Ecology 23:615-630. Ingham, E.R. and K.A. Horton. (1987). Bacterial, fungal and protozoan responses to chloroform fumigation in stored prairie soil. Soil Biol. Biochem. 19:545-550.