E. I. STURDZA FUNDS Plc - Fondsvermittlung24.de · 2017-06-07 · E.I. Sturdza Funds Plc Contents 1...
234
E. I. STURDZA FUNDS Plc (An umbrella fund with variable share capital and segregated liability between Sub-Funds) ANNUAL REPORT AND AUDITED FINANCIAL STATEMENTS for the year ended 31 December 2016
Transcript of E. I. STURDZA FUNDS Plc - Fondsvermittlung24.de · 2017-06-07 · E.I. Sturdza Funds Plc Contents 1...
E. I. STURDZA FUNDS Plc
(An umbrella fund with variable share capital and segregated liability between Sub-Funds)
ANNUAL REPORT AND AUDITED FINANCIAL STATEMENTS
for the year ended 31 December 2016

E.I. Sturdza Funds Plc
Contents
1
Company Information 2-5
Investment Manager’s Report
- Strategic China Panda Fund 6-8
- Strategic Euro Bond Fund 9-15
- Nippon Growth (UCITS) Fund 16-17
- Strategic Europe Value Fund 18-21
- Strategic Global Bond Fund 22-28
- Strategic US Momentum and Value Fund 29-31
- Strategic Global Quality Fund 32-35
- Strategic European Smaller Companies Fund 36-39
- Strategic Quality Emerging Bond Fund 40-47
- Strategic Beta Flex Fund 48-49
Directors’ Report and Statement of Director’s Responsibilities 50-57
Depository’s Report 58-59
Independent Auditor’s Report 60-61
Statement of Financial Position 62-64
Statement of Comprehensive Income 65-68
Statement of Changes in Net Assets Attributable to Holders of Redeemable
Participating Shares 69-73
Statement of Cash Flows 74
Notes to the Financial Statements 75-165
Schedule of Investments
- Strategic China Panda Fund 166-168
- Strategic Euro Bond Fund 169-172
- Nippon Growth (UCITS) Fund 173-175
- Strategic Europe Value Fund 176-179
- Strategic Global Bond Fund 180-182
- Strategic US Momentum and Value Fund 183-185
- Strategic Global Quality Fund 186-188
- Strategic European Smaller Companies Fund 189-191
- Strategic Quality Emerging Bond Fund 192-195
- Strategic Beta Flex Fund 196
Schedule of Changes in Investments
- Strategic China Panda Fund 197-198
- Strategic Euro Bond Fund 199-200
- Nippon Growth (UCITS) Fund 201-202
- Strategic Europe Value Fund 203-204
- Strategic Global Bond Fund 205-206
- Strategic US Momentum and Value Fund 207-208
- Strategic Global Quality Fund 209-210
- Strategic European Smaller Companies Fund 211-212
- Strategic Quality Emerging Bond Fund 213-214
- Strategic Beta Flex Fund 215
Appendix I 216-225
Supplementary Information 226-232
UCITS V remuneration disclosure 233 No notification pursuant to Sec. 310 of the German Capital Investment Code (Kapitalanlagegesetzbuch) has been filed for the Strategic
European Smaller Companies Fund, the Strategic Quality Emerging Bond Fund and the Strategic Beta Flex Fund and the shares in the Strategic
European Smaller Companies Fund, the Strategic Quality Emerging Bond Fund and the Strategic Beta Flex Fund may not be marketed to
investors in the Federal Republic of Germany.

E.I. Sturdza Funds Plc
Company Information
2
Directors L. Georges Gutmans
Denise Kinsella*
Brian Dillon
Johannes Yntema**
Gavin Farrell
*Independent Director
All Directors are non-executive Directors
Registered Office Chartered Corporate Services
4th Floor
76 Baggot Street Lower
Dublin 2
Ireland
Investment Manager and Global Distributor
E.I. Sturdza Strategic Management Limited
3rd Floor, France House,
Sir William Place
St Peter Port
Guernsey GY1 1GX
Investment Adviser to
- Strategic China Panda Fund
LBN Advisers (Cayman) Limited
P.O. Box 309, Ugland House
South Church Street, George Town
Grand Cayman, Cayman Islands
Investment Adviser to Banque Eric Sturdza SA***
- Strategic Euro Bond Fund, 112 Rue du Rhône
C.P. 3024, 1211 Geneva 3
Switzerland
- Strategic Global Bond Fund and
- Strategic US Momentum and Value Fund
- Strategic Quality Emerging Bond Fund
Investment Adviser to
- Nippon Growth (UCITS) Fund
Evarich Asset Management
Level 11, Aoyama Palacio Tower, 3-6-7
Kita-Aoyama Minato-ku
Tokyo 107-0061
Japan
Investment Adviser to
- Strategic Europe Value Fund
Lofoten Asset Management Limited
25 North Row
- Strategic Global Quality Fund London
W1K 6DJ
Investment Adviser to
- Strategic European Smaller Companies Fund
Pascal Investment Advisers SA.
Rue du Rhône 116 P.O. Box 3445
1211 Geneva 3
Switzerland

E.I. Sturdza Funds Plc
Company Information (continued)
3
Investment Adviser to
- Strategic Beta Flex Fund
Sofia Gestione del Patrimonio SGR S.p.A.
Via Fiori Oscuri
5 20121 Milan
Italy
Administrator (up to 3rd November 2016) HSBC Securities Services (Ireland) Limited
1 Grand Canal Square
Grand Canal Harbour
Dublin 2
Ireland
Administrator (from 4th November 2016) SS&C Financial Services (Ireland) Limited (formerly
Globeop Financial Services (Ireland) Limited
1st Floor, La Touche House
IFSC
Dublin 1
Ireland
Company Secretary Sanne Group Plc
4th Floor
76 Baggot Street Lower
Dublin 2
Ireland
Depository (up to 3rd
November 2016) HSBC Institutional Trust Services (Ireland) Limited
1 Grand Canal Square
Grand Canal Harbour
Dublin 2
Ireland
Depository (from 4th November 2016) BNY Mellon Trust Company (Ireland) Limited
Guild House
Guild Street
IFSC
Dublin 1
Ireland
Auditor KPMG
1 Harbourmaster Place
IFSC
Dublin 1
Ireland

E.I. Sturdza Funds Plc
Company Information (continued)
4
Listing Sponsor, Legal and Tax Advisers
(Ireland)
Dillon Eustace
33 Sir John Rogerson’s Quay
Dublin 2
Ireland
Governance Services Bridge Consulting
33 Sir John Rogerson’s Quay
Dublin 2
Ireland
Swiss Representative and Paying Agent Banque Eric Sturdza S.A.***
112 Rue du Rhone, C.P.
3024, 1211 Geneva 3
Switzerland
UK Facilities Agent Global Funds Registration Limited
7 Chertsey Road
Woking
Surrey GU21 5AB
United Kingdom
French Centralising Correspondent Caceis Bank
1/3, Place Valhubert 75013
Paris
France
German Paying Agent and Information Agent Marcard, Stein & Co.
Ballindamm 36
D-20095 Hamburg
Germany
Austrian Paying Agent, Information Agent Erste Bank
and Tax Representative Der Oesterreichischen Sparkassen AG
Graben 21
1010 Wien
Austria
Swedish Paying Agent Skandinaviska Enskilda Banken AB
KBBV
106 40 Stockholm
Sweden
Visiting address: Kungsträdgårdsgatan 8

E.I. Sturdza Funds Plc
Company Information (continued)
5
***On 15 February 2016 Banque Baring Brothers Sturdza S.A changed its legal and company name to
Banque Eric Sturdza SA
**Resigned effective 31 December 2016
Spanish Representative Allfunds Bank SA
Estafeta 6, La Moraleja
Complejo Plaza de la Fuente
Alcobendas 28109 Madrid
Spain
Italian Paying Agent Allfunds Bank SA
Via Avrelio Saffi 26
Milan MI
Italy
Luxembourg Paying Agent HSBC Bank Plc, Luxembourg Branch
16, Boulevard d’Avranches
L-1160 Luxembourg
R.C.S. Luxembourg, B 178.455
E.I. Sturdza Funds Plc
Investment Manager’s Report
for the year ended 31 December 2016
Strategic China Panda Fund
6
The Investment Manager’s report has been compiled with the assistance of the Investment Adviser, LBN
Advisers (Cayman) Limited (Non-discretionary adviser).
FUND PERFORMANCE
During the year under review the USD class returned -2.43%. In comparison the benchmark, MSCI China
Total Return Index, returned 0.90%.
MARKET OVERVIEW
2016 was not only another year of high market volatility in China, but also a year of black swans. Brexit, a
collapse of Chinese equities triggered by the introduction of a circuit breaker mechanism and Donald Trump
winning the US presidential election were all surprises to the market. In hindsight, the black swans were
blessings in disguise as equities rebounded sharply following the events. Take the China stock market plunge
in early 2016 for example, the Chinese government quickly responded by removing the circuit breaker
mechanism and introducing stimulus measures to restore market confidence. Renewed expectation of
monetary easing in the developed world post Brexit also excited the market. As for Donald Trump’s win of the
US presidential election, it was after all welcomed by the market, as Trump’s policy was believed to boost US
growth. MSCI China total return index edged up slightly by 1.15% last year albeit with volatility from -20%
to +10% in the year. 2016 was however a dismal year for A shares with the CSI300 index losing 11.3% in
local currency terms or nearly 18% in US dollar terms.
The economy has trended better since the second half of last year with improving trade, PMI(Purchasing
Managers Index), industrial output growth and electricity consumption growth. Stimulus measures like
accelerated infrastructure spending, loosening of property tightening policies and the consumption tax cut on
car purchase introduced since late 2015/early 2016 have worked. The government’s stepped up effort to curb
over capacity in steel and coal industries has also greatly improved the profitability of upstream industries.
With sustained PMI (Purchasing Managers Index) above 50 and positive PPI (Producer Price Index) since late
third quarter, one should expect bottoming out of earnings of manufacturers. The improving macro and
earnings trend has so far been overshadowed by fear of renminbi depreciation. In 2015, Renminbi devalued
by 4.64%. In 2016, the depreciation deepened to 7%. It is thought that the accelerated Renminbi devaluation
has turned global investors away from investing in China.
Shenzhen-Hong Kong stock connect was finally given the green light last year. It failed to excite the market
however as it had long been expected by investors. Conversely, the Chinese government’s approval of direct
Hong Kong stock purchase by Chinese insurance companies was a positive surprise to the market. Southbound
buying turned out to be a major driver of the market rally in the second half of the year. Mainland investors
saw value in Hong Kong stocks which traded at a big discount to the A shares and the buying was
concentrated on blue chip names with yield like financials. Since financials make up 30% of MSCI China
index, buying by mainland funds provided strong support to Hong Kong stock market. This partly explains
why the Hong Kong market was up but A share market was down last year.
Sector wise, the poor performers of 2015 like Macau gaming, energy, commodities, Hong Kong retailers and
deep cyclicals outperformed the market as expectation on these sectors was overly bearish at the beginning of
the year. Technology, education and banking sectors also outperformed the market.
E.I. Sturdza Funds Plc
Investment Manager’s Report (continued)
for the year ended 31 December 2016
Strategic China Panda Fund (continued)
7
MARKET OVERVIEW (CONTINUED)
Performance of the internet sector was mixed however. Rebalancing of MSCI China to include more ADRs
(mostly internet names) in May did not help the sector Among the big cap stocks, Alibaba, Netease and
Tencent went up but JD, Baidu, VIPS and Ctrip went down in the year. ADRs with privatization angle even
collapsed as the Chinese regulator weighed curbs on ADR relisting on the A share market.
MARKET OUTLOOK
The Investment Adviser sees a strong US dollar and the potential trade war between China and the US as the
biggest risks for China in 2017. Donald Trump’s plan to cut tax and increase infrastructure spending in the US
is inflationary. US long bond yields and the US dollar have spiked since Trump’s win of US presidential
election last November. This has led to asset reallocation from emerging markets, including China to the US.
If a strong US dollar is to continue, global investors will remain hesitant to revisit China despite an improving
macro trend, as was already the case last year. Besides, Donald Trump’s threat to impose punitive tax on
Chinese imports and overturn the “One China” policy has raised concern on a potential trade war between the
US and China. This is considered possible but unlikely as any unwise move by Trump is likely to trigger
retaliation from China. After all, China is also a big market to the US and so a trade war between the two
countries is not necessarily in the best interests of Americans. For one thing, inflation in the US will spike up
immediately if 45% punitive tax is imposed on Chinese imports as the additional tax on Chinese imported
goods would immediately be passed over to Americans.
In 2016, mainland funds were a major force that supported the Hong Kong stock market. With expectation of
further Renminbi depreciation, we see foreign interest in Hong Kong/China remaining subdued but inflows
from mainland funds (which see Hong Kong stocks as quasi US dollar assets) taking an even larger market
share in the market turnover of the Hong Kong stock market. Since mainland funds are known for their active
trading, increasing market volatility in the Hong Kong stock market is expected to become the new norm.
Growth slowdown in China seems to have stabilized after a number of stimulating policies. Quarterly GDP
growth was kept at 6.7% from the first quarter to the fourth quarter of 2016. It is expected that the government
will set a lower GDP growth target, say 6.5%, for 2017. The market should be well prepared for this however,
as the government has been lowering the GDP growth target every year ever since Xi took office as the
President of China in 2013. Given low market expectation, any positive surprise in growth may lead to a
market re-rating.
In the A share market, the national team (Huijin, CSFC, Social Security Fund and Wutongshu Investment
Platform) is a major player in the domestic market as it holds around Rmb 2.7trillion A-shares or 6% of total
market cap. In 2016, it stepped in to stabilize the market at a time when the market was under tremendous
selling pressure but trimmed position whenever the market rebounded. We expect the A share market to trade
in a tight range as long as this invisible hand stays.

E.I. Sturdza Funds Plc
Investment Manager’s Report (continued)
for the year ended 31 December 2016
Strategic China Panda Fund (continued)
8
PORTFOLIO STRATEGY
The Investment Adviser is constructive on Chinese equities and valuation is supportive at low teen 2017 P/E.
This is at the low end of market valuation in Asia but it is not the major reason why the Investment Adviser
remains positive. First, Renminbi devaluation is considered a blessing in disguise as it helps to restore the
competitiveness of Chinese exporters. Exporters have been under pressure of late following concerns of a
potential trade war between the US and China, which is deemed unlikely given the consequences for both
countries. The Investment Adviser remains committed to its investment in exporters as it sees earnings upside
risk. Firstly, the market is still behind the curve in factoring in their margin expansion from Renminbi
depreciation. Second, growth slowdown in China is well contained under the invisible hand of the financially
strong government. There is simply no hard landing risk. Third, suppressed consumption demand as a result of
anti-corruption is finally recovering after a few years of clamp down, as per improving retail sales of liquor
and luxury goods. The Investment Adviser has begun to deploy cash into selective Hong Kong and global
retailers. Fourth, supply-side reform is working. Strong intervention from the government, obsolete capacity
in industries with over-capacity such as steel, coal and paper packaging has resulted in a big improvement of
the profitability of upstream industries. The Investment Adviser started building a position in paper packaging
companies last year on the view that they benefit from price increase on industry consolidation, this strategy
has worked and a potential for more re-rating this year can be seen.
Unlike last year, the Investment Adviser is not in favour of yield plays given rising interest rate expectation,
but rather in favour of education, technology and internet sectors. These sectors have managed to deliver stellar
earnings growth despite challenging domestic economy and this is expected to continue. After all, service
industries and new economy are set to play an increasingly important role in the economy as China transforms
from an investment centric to consumption centric economy. The portfolio remains underweight in Chinese
financials but overweight in non-Chinese financials like AIA and HSBC as they benefit from the rising interest
rate trend. The Investment Adviser considers the A share market as too policy driven and would rather gain
exposure through Hong Kong listed stocks and ADRs. The weighting in A shares was zero at the end of 2016
and will remain so for the foreseeable future.
LBN Advisers (Cayman) Limited
E.I. Sturdza Strategic Management Limited
January 2017

E.I. Sturdza Funds Plc
Investment Manager’s Report (continued)
for the year ended 31 December 2016
Strategic Euro Bond Fund
9
The Investment Manager’s report has been compiled with the assistance of the Investment Adviser, Banque
Eric Sturdza SA (Discretionary adviser).
FUND PERFORMANCE
In terms of performance, the year was a good surprise. The portfolio strategy implemented in July 2015 has
eventually been rewarded in 2016 after Mr. Draghi’s announcements. The portfolio was essentially invested in
APP bonds and, due to the global environment (including the Brexit in June), euro bonds performed
dramatically despite very low yields and improving macroeconomic data during the second half of the year. In
this context, the Sub-Fund reached a performance which was substantially higher than expected: +0.63% YTD
on December 30th (standard Acc. EUR share class), +0.93% (EUR Institutional share class) and -0.2% (CHF
share class) whilst the benchmark Euribor 3m had a negative performance of -0.22%.
MARKET OVERVIEW
In January, all eyes were focused on any bad news that could deteriorate the political and economic
climate in 2016: fears of hard landing in China (and renminbi devaluation), negative rates in Japan, oil
prices and commodity prices in general, emerging markets, the (too hawkish) Fed but also Brexit, Spain
(with no Government), migrants in Europe, turmoil in Brazil, Donald Trump and Italian banks. The BoJ
took the market by surprise, adopting a negative interest rate policy but other Central banks did not
change their key rates and policies. In Europe, Mr Draghi said that the ECB program would be reviewed
in March with “no limits” on how far they can go.
In February, concerns about a possible Brexit impacted the GBP bond market (both yields and currency),
uncertainty about the size of Italian banks’ non-performing loans and about the exposure to the oil & gas
sector in European Banks balance sheet led to a drop of subordinated bank debt (including CoCos).
Regarding Central Banks activity, the Fed stayed in “wait and see” mode. Mrs Yellen said that due to
economic conditions, only gradual increases would be implemented. She added that it was not necessary
to cut rates but in saying that, she gave substance to the thesis that it was a possible scenario in the
coming months.
In March, the major event, driver of the behaviour of financial markets, has by far been the ECB’s
meeting on March 10th. In the global bond market, concerns about a possible Brexit, US Presidential
election and political turmoil in Brazil had a less pronounced impact. However, the strong rebound of oil
prices, from $33.70 to $38.30 helped the recovery of risky asset markets to the detriment of safe havens.
As expected, the ECB did not miss its target with an expanded QE (EUR 80 billion / month instead of 60)
open to corporate bonds purchases, a deposit rate decreased to -0.4% (from -0.3%) and a new TLTRO,
which was probably the less commented measure but the most important. The expanded APP (Asset
Purchase Program) added private corporate bonds (CSPP, Corporate Sector Purchase Program) to
government-owned corporates (known as PSPP, Public Sector Purchase Program). In the US, Mrs Yellen
said that the Fed should “proceed cautiously”. The US Central bankers were still in “wait and see” mode:
they were convinced that the pace of the domestic economy deserved a rate hike but they had difficulties
analysing the potential impact of a weaker global growth (first and foremost in China) on the behaviour of
the US economy.
E.I. Sturdza Funds Plc
Investment Manager’s Report (continued)
for the year ended 31 December 2016
Strategic Euro Bond Fund (continued)
10
MARKET OVERVIEW (CONTINUED)
In April, concerns about Brexit and Greece in Europe combined with US Presidential election and
Dilma’s probable impeachment in Brazil were among the key drivers of the markets, but with a less
pronounced impact than the pursuit of the strong rebound of oil prices, from $38.30 to $45.90. Central
banks did not change their monetary policies. In the US, the Fed left its rate unchanged but opened the
door to raising interest rates in June thanks to an improvement in global financial markets.
In May, markets seemed to hold their breath before a busy and hectic month of June. In the US, Ms
Yellen’s speech pointed to improvements in the US economy, confirming that the Fed was open to raising
rates soon. In Europe, concerns about Brexit rose sharply. In this environment, oil prices continued to
climb, from $45.9 to $49.1 while gold fell sharply (-6%) from $1,293 to $1,213 an ounce. In the US, the
economy seemed to gain momentum and the release of minutes from the FOMC meeting in April showed
that the Fed was ready to raise interest rates at every meeting including on June 15th. In June, Brexit led to
a flight to quality towards US Treasuries and Bunds. At the same time, low quality debt such as high yield
and deeply subordinated bank debt fell sharply, in line with equity markets. The other major event was
the poor number of 38,000 jobs created in the US, the smallest number in five years. As a result, market
participants decreased dramatically the probability of a Fed rate hike in July and after Brexit, they started
to price in (up to 20%) a possible rate cut in December! In Europe, as expected, the ECB started its CSPP
program on June 8th. At the same time, peripheral banks (Spanish and Italian) became the biggest
borrowers of the TLTRO program.
In July, risky assets recovered strongly as the slowdown due to Brexit had not yet materialized. In line with
equity markets, low quality debt as high yield and deeply subordinated debt rebounded following their post-
Brexit sharp correction. In this context, IG Corporates, US Treasuries and Bunds managed also to perform
well. In the US, 287,000 jobs were added in June, easing concerns after last month’s poor number. Globally
US Data was better than expected with housing momentum and confidence continuing to point up. As a result,
market participants cancelled the probability of a Fed rate cut in December and started to price in a possible
rate hike (up to 35%) before the end of the year. In Europe, as expected, the ECB left monetary policy
unchanged but remained ready to increase stimulus should economic forecasts dramatically change following
UK Referendum. Any expansion of the current Asset Purchase Programme (APP) would need changes in
bonds eligibility rules given ultra-low yields environment. The BoE didn’t cut rates but offered additional
liquidity operations and reduced capital requirements.
In August, macroeconomic data was strong in Europe and in the US. In the Eurozone, the PMI index showed a
recovery confirmed by the unemployment rate which reached 10.1%, the lowest in five years. Some
disappointing data in southern Europe was offset by the French recovery. In the US, job creations reached
255k this month and hourly average earnings rose to 2.6% annualized (a major indicator of future inflationary
pressures). Home sales were encouraging and home construction reached its highest level in five months. As a
consequence, market participants were waiting impatiently for the Central bankers meeting in Jackson Hole in
order to dispel prevailing doubts about their monetary policies and first and foremost Ms Yellen’s speech as
the Fed has the most unclear or unpredictable behaviour. This indicates clearly that nobody really knows in
which direction the macroeconomic environment is moving, including the FOMC members!
E.I. Sturdza Funds Plc
Investment Manager’s Report (continued)
for the year ended 31 December 2016
Strategic Euro Bond Fund (continued)
11
MARKET OVERVIEW (CONTINUED)
In Emerging markets, inflows accumulation and risk appetite continued to drive the market as the Fed
monetary policy normalization process was considered by the market to remain slow and prudent. In Brazil, as
expected, President Dilma Rousseff was removed from office as more than two-thirds senators voted for
impeachment, leaving its successor the task of implementing difficult reforms to rescue the economy from
recession. With positive technical factors and stable commodity prices, major credit markets performed well
during the month with Turkish assets retracing most of the correction linked to the July Turkish Coup Attempt.
In September, markets were driven by China (non-performing loans), Japan (the slope of the yield curve
managed by the BoJ), the US presidential election and the drop of Deutsche Bank shares (fears about the
future of the European banking sector, mostly Germans and Italians). Macroeconomic data was strong in
Europe and softer in the US. In the Eurozone, the Q2 GDP reached +0.3% and confidence indicators
improved. In the US, the ISM indicators (both manufacturing and non-manufacturing) decreased and job
creations reached 151k instead of 180k expected by the consensus. Consequently, the Fed voted 7-3 to leave
its rates unchanged and the ECB did not modify its policy. Regarding other major Central banks, another BoE
rate cut was considered likely in the United Kingdom and a new wave of unconventional easing began in
Japan. The main concern had already been mentioned by the Investment Adviser the month before: the 3
month US$ Libor had already increased by 25 bps and a Fed rate hike would only be a readjustment of official
key rates with the level of money market rates. This US$ Libor increase was not circumstantial at all.
Corporate loans and mortgages in USD were increasing; the cost of a currency hedging had already increased
(2% to hedge the USD against the CHF) and the cost of leverage for banks and hedge funds was higher. As a
result, negative flows affected the US Treasury curve and should this trend continue, it would become
unsustainable. In this environment, a Fed rate hike becomes less relevant than money market rates evolution.
In October, markets had been driven by the US presidential election, the probable Fed rate hike in December
and the incredible rumour of tapering in Europe. Macroeconomic data were stronger in the US, led by
consumer spending, labour market (both employment and wage growth), industrial production and residential
real estate. In Europe, two major economic sets of data gave the impression that the situation was improving:
the Spanish unemployment rate decreased below 20% for the first time in six years and the German Ifo index
reach a two-year high. Consequently, the Fed was supposed to raise its Fed fund rate on December 14th
even
though there was a FOMC meeting on November 2nd
(considered as too close to the Presidential election). In
Europe, an incredible rumour affected the bond market. The ECB would consider a tapering of its QE. Some
ECB members contradicted this rumour that led to a jump in the euro and Bund yields. The official version of
the ECB continued to be that they were open to further stimulus. In the meantime, they took advantage of this
correction to purchase short term bonds which climbed above the deposit rate.
In November, markets had been driven by the US presidential election outcome and the victory of Donald
Trump. Against all odds, stocks rallied and safe havens such as gold and bonds underperformed dramatically.
The most frequent argument that explains this behaviour is that Mr Trump’s policy would spur growth and
favour inflation. Mr Trump’s program contains many uncertainties: what exactly is this program? Will it be
implemented? After how many years will the first results be seen? Will the majority of the Republicans at the
Congress vote for some controversial measures? It is too early to develop a new economic scenario and the US
economy will not change dramatically in the coming weeks or months. Just after the announcement of
Trump’s victory, the markets’ behaviour was logical: a Treasury rally (30y at 2.52%), gold above 1330, Swiss
franc rally reaching 0.9550 against USD, S&P future limit down (-5%).
E.I. Sturdza Funds Plc
Investment Manager’s Report (continued)
for the year ended 31 December 2016
Strategic Euro Bond Fund (continued)
12
MARKET OVERVIEW (CONTINUED)
Then, all of these markets turned, equities rallied substantially and safe havens started a decrease. In this
environment, the only behaviour which seemed “normal” was the drop of some Emerging currencies (the
Mexican peso being the most emblematic) and the widening of Emerging market bond spreads. This Treasury
sell-off has been massively amplified by the record volumes of transactions. The decrease of the bond markets
(i.e. the increase of bond yields) can be explained by the accumulation of massive sell orders. Initially, market
participants thought that these orders came from China but once analysed the origin of these trades showed
that Hedge Funds and CTAs were the leaders of this market action and that high-frequency trading was
primarily responsible for the amplification of the sell-off.
In December, markets had been driven by the two major Central bank meetings, the FOMC and the ECB. In
the US, the Fed raised its Fed Fund rate to 0.5%-0.75%. This decision was unanimous for the first time since
July and was responding to the strength of the labour market and economic growth. In addition, the Fed
mentioned that inflation expectations had risen “considerably”. In Europe, the ECB extended its QE program
until (at least) the end of 2017 but will reduce its asset purchases from 80 to 60 billion EUR after March.
Sovereign bonds yielding below -0.4% and bonds maturing below two years were to be included in the
purchase list. This was clearly an increase of the QE (60x9= 540 billion EUR instead of 80x6=480 expected)
but the markets responded badly to the decrease of monthly purchases. During December, US economic
indicators showed that growth was rising from modest to moderate, employment still expanding and the
housing sector continued to show signs of improvement. On another hand, consumption indicators were
disappointing and the strength of the US Dollar was mentioned as a threat by the Fed in its beige book. The
European economy was still improving as consumption, business confidence; consumer confidence and
unemployment suggest an improvement in the pace of the recovery. But inflation remains too low. After
November was dominated by the outcome of the Presidential election in the US, all eyes were focused on
Europe. As expected, in Italy, Matteo Renzi lost his referendum and resigned. In France, Mr Hollande decided
not to stand again for election as President in May. In terms of rescue plans, the Greek short-term debt relief
had been frozen by the Eurogroup Finance Ministers and the ECB announced that the amount of capital
needed by Monte dei Paschi to avoid bankruptcy was 8.8 billion EUR instead of 5! Outside Europe, the main
event was the OPEC agreement on November 30th to cut the output (up to 1.8 million barrels/day), leading to a
jump of oil prices from $45 to $55 in December.
In this context, the German 2y yield decreased from -0.35% to -0.80% (-45bp), the 5y yield from -0.05%
to -0.54% (-50bp) and the 10y Bund yield from +0.63% to +0.2% (-42bp).
With increasing concerns about risks surrounding Italian politics and fragile economic recovery, Italian
10y yield increased from 1.60% to 1.82% (+22bp). Spanish 10y yield was more resilient, decreasing from
1.77% to 1.38% (-39bp). In the US, the 2y US Treasury yield increased from 1.05% to 1.19% (+14bp),
the 5y yield from 1.76% to 1.93% (+17bp), the 10y from 2.27% to 2.45% (+18bp) and the 30y long bond
from 3.02% to 3.07% (+5bp). On the credit side, the European iTraxx Main decreased from 77 bps to 72
bps (Post-Brexit banks and cyclicals spreads widening having been largely retraced afterwards) while the
US corporate CDX index decreased from 88 bps to 68 bps. In Emerging Markets, the CDX 10y EM index
spread tightened dramatically from 369 bps to 286 bps (-83 bps) finishing the year 2016 tighter than on the
eve of the Presidential election!

E.I. Sturdza Funds Plc
Investment Manager’s Report (continued)
for the year ended 31 December 2016
Strategic Euro Bond Fund (continued)
13
MARKET OUTLOOK
The Investment Adviser’s global outlook has not changed for the moment. Mr Trump is not a magician and
during his 4-year mandate, the US will not avoid a recession or at least a significant slowdown. In terms of
growth, the trend will remain broadly the same. Regarding inflation, a significant reflation is considered
unlikely. The Investment Adviser believes that the current behaviour of the US Treasury bond market looks
like the Taper tantrum in June 2013. The sell-off in the Treasury market could continue in Q1 2017 but the
Treasury yield curve is probably already normalised at the current levels. Regarding Europe, The ECB must
maintain its policy (massive QE) as we will see the first real consequences of the Brexit in one year (probably
Q4 2017 / Q1 2018). Emerging Markets will stay volatile but technical factors such as low net issuance,
negative or low yields environment in most Developed Markets, higher commodities and oil prices (OPEC’s
behaviour is bullish for Emerging bonds), stabilisation of emerging currencies and a “not-too-hawkish” Fed
suggest that the environment will remain supportive for further spread tightening. Any correction would be a
buying opportunity.
PORTFOLIO STRATEGY
In 2016, the Sub-Fund started the year with a size of EUR 127 million and declined to EUR 66 million at
the end of December due to the launch of Strategic Quality Emerging Bond Fund in April. Some investors
switched from the low yielding Euro fund into a more attractive yielding fund despite more risk and more
volatility. During the year, the investment grade corporate bond exposure remained stable around 90%
until end of June before being increased to a peak at 99.1% in December. The Investment Manager
managed actively the modified duration of the Sub-Fund: the duration decreased from 2.2 to 2 in January,
then stayed between 2.3-2.4 until March, increasing to 2.7-2.8 in April and May and finally decreasing to
2.2 in June for risk management purposes before the Brexit. As yields reached historical lows post-Brexit,
the modified duration was maintained around 2.2 until the end of August. In October, the duration was
moderately raised to 2.5 and maintained unchanged until the end of the year. Regarding the credit
exposure, the S&P score of the Sub-Fund has been maintained around 78 in January, increasing to around
84 in February and March, and rising to around 86-87 in Q2 and progressively increasing to a peak at
88.9 in December.
In January, the Investment Adviser focused its attention on the decrease of the weight of bonds maturing
in 2021, reducing Pepsico, Essilor, Toyota, Syngenta and Rolls Royce. It sold Klépierre 2016, and
reduced KFW and Enel to decrease their weight below 5%. Finally, as the Sub-Fund bought the new
Sagess 2023, LVMH and Sagess 2022 were sold. The Modified Duration of the Sub-Fund stayed above 2
and the duration overlay policy was maintained with a short position of 250 Bobls and 70 Bunds instead
of 50 in December 2015 (in order to hedge the duration of the new Sagess 2023).
In February, the Investment Adviser continued to favour high quality and liquidity and to decrease the
duration overlay (i.e. long 6-10y A and BBB rated credit with duration partially hedge by short Bund and
Bobl futures). It focused its attention on the decrease of the weight of bonds maturing in 2021, reducing
TenneT and Essilor and selling the remaining positions in Toyota, Rolls-Royce, AstraZeneca, PepsiCo,
Siemens and Syngenta. It also reduced KFW and IBM 2020, Deutsche Bahn 2024, RTE-EDF 2023 and
Nederlandse Gasunie 2022 (switch against the new Temasek 2022).
E.I. Sturdza Funds Plc
Investment Manager’s Report (continued)
for the year ended 31 December 2016
Strategic Euro Bond Fund (continued)
14
PORTFOLIO STRATEGY (CONTINUED)
It implemented a duration extension trade in FCE (Ford Credit Europe), selling the old issue maturing in
September 2016, against the 1.875% 2019. On the buy side, two new issues were included in the
portfolio: Schlumberger 2019 (strong AA rated Oil & Gas services company offering a very attractive
spread due to current weak oil prices) and Temasek 2022 (Sovereign Fund of Singapore government,
AAA rated, first issue in euro). Finally, the Investment Adviser, despite its strategy of avoiding bonds
maturing in 2021, increased substantially Renault Crédit International 2021 as Renault’s recovery was
impressive and deserved a rating upgrade. The timing of the purchase, on February 15th and 16
th, just after
the publication of the earnings was optimal as Moody’s eventually upgraded Renault on the 18th. The
Modified Duration of the Sub-Fund stayed above 2 (around 2.4) and the duration overlay policy was
reduced dramatically with a short position of 140 Bobls instead of 250 in January, simultaneously with
the sale of bonds maturing in 2021. However, the Sub-Fund stayed short 70 Bunds in order to hedge the
whole 7-9y government-owned corporate position (Sagess 2023, Aéroports de Paris 2023, RTE-EDF
2023 and Deutsche Bahn 2024).
In March, the Investment Adviser bought two government-owned corporate bonds that may be included
in the new APP of the ECB with a very high probability: Proximus (ex-Belgacom), the Belgian telecom
operator, and Fortum, the Finnish utility company. It sold the remaining stake in Deutsche Bahn and took
profit on US issuers, selling Oracle and decreasing the weight of IBM. The Modified Duration of the Sub-
Fund stayed above 2 (around 2.3) and the duration overlay policy was not modified.
In April, the Investment Adviser sold or decreased the weight of the following names (mostly taking
profit on Eurozone governments and PSPP): Netherlands, Belgium, Ireland, KfW, Enexis, TenneT (2020
and 2021), Enel, Sagess, Nederlandse Gasunie and RTE-EdF. The Modified Duration of the Sub-Fund
increased significantly, from 2.3 to around 2.7 and the duration overlay policy was reduced from -1.6 to
-1.0.
In May, the Investment Adviser sold or decreased the weight of the following Government bonds and
PSPP: KfW 2020, Snam 2016, Belgium 2020 and Terna 2018. At the same time, it increased the weight
of CSPP names, buying three new issuers: Total 2021 (Oil & Gas, France), Iberdrola 2020 (Oil & Gas,
Spain) and ENI (Oil & Gas, Italy). It also took profit on some low-yielding BBB names, selling the whole
position TeliaSonera 2017 and decreasing the position Wolters Kluwer 2018. The Modified Duration of
the Sub-Fund increased slightly, from 2.7 to around 2.8 and the duration overlay policy was increased
from -1.0 to -1.2.
In June, the Investment Adviser sold Enel 2026 (CSPP) and bought Valeo 2024. It also slightly decreased
the weight of Nederlandse Gasunie 2022. Finally, it increased the duration overlay in order to decrease
the overall modified duration of the Sub-Fund from 2.8 (close to the authorized maximum of 3) to 2.3 due
to uncertainties around Brexit.
In July, the Investment Adviser continued to favour high quality and liquidity. Yields having reached new
lows post-Brexit, meant it took profit on most of Finish Government 2020 exposure and decreased the weight
of Wuerth 2018, Nederlandse Watershapsbank 2019, Tennet 2020, Enexis 20 and Nederlandse Gasunie 2022.
Finally, it maintained the duration overlay unchanged to 2.1 in the current low yield environment.

E.I. Sturdza Funds Plc
Investment Manager’s Report (continued)
for the year ended 31 December 2016
Strategic Euro Bond Fund (continued)
15
PORTFOLIO STRATEGY (CONTINUED)
In August, the Investment Adviser continued to favour high quality and liquidity. With yields continuing the
trend of new lows post-Brexit, it took profit on most Government bonds, selling the remaining position in
Finland 2020 and decreasing the French OAT position to EUR 1 million. In order to increase the average yield
of the portfolio, Linde was partially sold (offering a very tight spread that could widen depending on the
outcome of negotiations with Praxair) and the weight of Valeo was increased. The duration was maintained
around 2.1 in the current low yield environment, with portfolio duration around 3.8 and a duration overlay
position of -1.7.
In September, the trends continued and the remaining position in the French OAT 2020 was sold and the
weight of Wolters Kluwer 2018 decreased in order to maintain the S&P score of the portfolio below 90 points.
Finally, Telstra 2017 was switched into Telstra 2022 (duration extension trade). The duration was increased
slightly from 2.1 to 2.3, with portfolio duration around 3.8 and duration overlay position of -1.5.
In October, the Investment Advisor adopted a more defensive approach with particular focus on duration
management . Since Q2 2012, the particularity of Strategic Euro Bond Fund was to be partially invested in
medium-term corporate bonds (7-10y) with most of the duration being hedged with a short position in the
Future market (both 5y Bobl and 10y Bund).
Due to the behaviour of the market and the increasing probability of tensions in the inter-bank market, the
Investment Adviser decided to abandon this approach in favour of investments in Floating Rate corporates
(non-Financials), i.e. bonds with low duration (between 0 and 0.3) and coupons indexed on the 3 month
Euribor. As a result, all bonds maturing above Q3 2022 were sold (Proximus 2024, Valeo 2024, Aéroports de
Paris 2023, RTE-EDF 2023, Nederlandse Gasunie 2023, Sagess 2023). At the same time short Bunds and
Bobls were bought back. Almost 16% of the Sub-Fund had been invested in FRNs issued by Anheuser Busch
Inbev, Honda, Coca Cola, Total, 3M and General Electric. The weight of Total 2021 had been reduced in order
to increase the weight of the FRN and Terna 2019 was sold, switched against FCE 2019.
Earlier in October, issuers which had a weight to close to 5% were reduced (Enexis 2020, TenneT 2020,
Nederlandse WaterschapsBank 2019 and Würth 2018). The duration was slightly increased to 2.5, with
portfolio duration decreased from 3.8 to 2.5 and duration overlay increased from -1.5 to 0.0.
In November, the Investment Adviser did not modify its new approach implemented in October, favouring
investments in Floating Rate corporates (non-Financials), i.e. bonds with low duration (between 0 and 0.3) and
coupons indexed on the 3 month Euribor. The duration was maintained around 2.5.
In December, this approach remained unchanged, favouring investments in Floating Rate corporates (non-
Financials), i.e. bonds with low duration (between 0 and 0.3) and coupons indexed on the 3 month Euribor. As
usual in December, the trading activity was lower due to low liquidity. The Investment Adviser sold KfW
2020, decreased the weight of Nederlandse WaterschapsBank 2019, Terna 2018 and Snam 2019. It also
bought 1 million EUR of Bund 2026 at 96.478 and sold it at 97.133 in order to take advantage of the volatility
of 10y German yields. The duration was maintained around 2.5. In terms of portfolio diversification, the Sub-
Fund held 34 issues from 33 different issuers.
Banque Eric Sturdza SA
E.I. Sturdza Strategic Management Limited
January 2017

E.I. Sturdza Funds Plc
Investment Manager’s Report (continued)
for the year ended 31 December 2016
Nippon Growth (UCITS) Fund
16
The Investment Manager’s report has been compiled with the assistance of the Investment Adviser, Evarich
Asset Management (Non-discretionary adviser).
FUND PERFORMANCE
The net asset value per share for the Sub-Fund, on a Japanese yen basis as of 30 December 2016 went
down 2.2% compared with that of 30 December 2015, while the TOPIX declined 1.9% during the same
period. Thus the Sub-Fund underperformed the index just slightly. The Sub-Fund put four new names
(Shimadzu, SCSK, Seibu Holdings and Mitsubishi Motors) into the portfolio with three stocks (Lixil,
Keihin and Sumitomo Forestry) sold out. Overweightings in banks and real estate damaged the
performance. The best five performers among the TSE 33 sectors were miscellaneous manufacturing, oil,
machinery, commerce (mainly trading companies) and fishery & forestry, while the worst five sectors
were air transportation, utilities, pharmaceuticals, marine transportation, and transport equipment.
MARKET OVERVIEW
The Japanese stock market had a poor start to the new year with 6 consecutive days of decline, which is
unprecedented in the post war era. This was partially because the Japanese market held up relatively well
in 2015, and partially because the JPY appreciated rapidly against the US dollar. On 20 January 2016 the
WTI crude oil fell to a 12 year low at USD26.5/bbl, which made a huge negative impact on the stock
market with the TOPIX falling to almost 1300, 16% off year to date. Against this background, the BoJ
announced the adoption of negative interest rates on 29 January.
The market fell sharply again in February due to rapid movements in forex and long-term bond yields.
Concerns arose over the earnings of financials. But on 26-27 February, the G20 meeting was held in
Shanghai, where finance ministers and central bankers declared clearly “we will use all policy tools –
monetary, fiscal and structural – individually and collectively to achieve strong growth”. In March, the
Japanese market rebounded for the first time in four months. China announced monetary easing at the end
of February together with fiscal stimulus and structural reforms, which contributed to the recovery of
commodity prices. But on 24 June, when it became clear that the “leave” camp had won a majority in the
UK’s EU referendum, the JPY strengthened to 99 against the US dollar and the market declined at the
greatest rate in more than 16 years. The Japanese economy itself remained on course for a sound recovery
with industrial production gathering momentum (3Q +1.3% QoQ, 2Q +0.2% QoQ, and 1Q -1.0% QoQ),
and job offers to applicants ratio rising to 1.41x in November, the highest since July 1991. The biggest
changes to the Japanese market did not materialize until a more aggressive fiscal policy was taken by the
government. Prime Minister Abe’s cabinet approved an economic stimulus package with JPY28.1 trillion
on 2 August to combat deflation and shore up the economy with infrastructure investment and enhanced
welfare services. The supplementary budget for FY2016, as part of the JPY28.1 trillion package, was
legalised in the Diet on 11 October. Investors, in particular foreign investors, came back to the market as
big buyers, encouraged by the huge fiscal stimulus. Mr. Trump’s victory on the US presidential election
changed investors’ mind quite drastically. The TOPIX recorded three months straight rise from October to
December, and ended the year at 1518 (down 1.9% YoY).

E.I. Sturdza Funds Plc
Investment Manager’s Report (continued)
for the year ended 31 December 2016
Nippon Growth (UCITS) Fund (continued)
17
MARKET OUTLOOK
There are plenty of signs that the Japanese economy is returning to strong growth. The job offers to
applicants ratio in December 2016 increased to 1.43x, the highest in the past 25 years. Industrial
production in December rose 0.5% MoM, and the government estimates that industrial production in
January 2017 would rise 3.0% MoM, and further increase 0.8% MoM in February. Corporate profits for
4Q 2016 started from late January 2017, it is expected that corporate profits in general would be sharply
revised up, judging from the level of the economic activity and currency movements.
The Basel Committee on Banking Supervision announced on 3rd January 2017 that a meeting of the
world’s top bank supervisors and central bankers was scheduled for 7-8th January to consider a
contentious reform package that had been postponed until at least the next meeting scheduled in March.
This results in key parts of the reform still not being agreed between the US and the European
supervisors. The US supervisors are said to be requesting stricter rules on the so-called output floor that
limits banks’ lending. European banks have welcomed this postponement as it means the committee will
be dealing with a new US administration. Mr Donald Trump has said he wants to relax financial
regulation so this postponement looks to be good news for global economic growth and the banking
sector on a long term view. But for the short term, uncertainty over the banking system may continue for a
few months, meaning investors may be discouraged from investing in banking stocks. We hope this
matter will be resolved at the next meeting. For Japanese banks, the level of the output floor does not
matter, as they have built strong balance sheets to prepare for it. What matters is how quickly the
uncertainty on the rules is removed.
For the time being, market attention should be focused on President Trump’s policies, which should be
clearer in February. There remains some uncertainty on his defense and trade policies, but we believe that
his top priority should be how to strengthen the US economy, which in turn would be very positive for
global economic growth.
The Japanese stock market should be one of the major beneficiaries of these policies. Mr. Abe is expected
to utilise fiscal policy more effectively and speed up structural reforms from now on with the BoJ
maintaining monetary easing until 2% CPI is foreseeable. We think the Japanese stock market would rise
almost 50% with the TOPIX touching to 2300 by the end of 2018.
PORTFOLIO STRATEGY
The Sub-Fund is increasing its allocation to the machinery and IT service sectors with the conviction that
capex will expand significantly as the labour shortage is getting serious and capacity constraints are
emerging. Cyclical sectors such as steel and nonferrous metals are also targeted for higher exposure. The
Sub-Fund retains a very positive stance towards banks and trading companies, while defensive sectors
such as foods, pharmaceuticals and utilities are avoided.
Evarich Asset Management
E.I. Sturdza Strategic Management Limited
January 2017

E.I. Sturdza Funds Plc
Investment Manager’s Report (continued)
for the year ended 31 December 2016
Strategic Europe Value Fund
18
The Investment Manager’s Report has been compiled with the assistance of the Investment Adviser,
Lofoten Asset Management Limited (Discretionary adviser).
FUND PERFORMANCE - NAV per share
The EUR Class fell EUR 16.67 to EUR 195.56. A total return of -7.85%.
The EUR Institutional Class fell EUR 12.81 to EUR 171.77. A total return of -6.94%.
The CHF Class fell CHF 14.21 to CHF 153.71. A total return of -8.46%.
The GBP Institutional Class fell GBP 9.89 to GBP 125.88. A total return of -7.28%.
The EUR Retail Share Class fell EUR 8.97 to EUR 82.11. A total return of -8.87%.
The EUR Institutional Distribution Class fell EUR 7.49 to EUR 93.36. A total return of -7.43%.
The USD Class was launched on the 10th March 2016. It fell USD 0.05 to USD 99.95. A total return of
-0.05%.
The USD Institutional Class fell USD 5.72 to USD 91.74. A total return of -5.87%.
The EUR Super Institutional Class was launched on 25 August 2016. It fell 5.38 to EUR 94.62. A total
return of -5.38%.
The USD Super Institutional Class was launched on 25 August 2016. It fell 5.13 to USD 94.87. A total
return of -5.13%.
During the period in question the benchmark MSCI Europe Total Return Index increased by 2.58%.
MARKET OVERVIEW
European markets had a difficult start to the year driven by concerns regarding China, weakening oil
prices, weaker than expected economic data and the perceived risk of a global slowdown. The oil price
(NYMEX WTI CRUDE) bottomed out around $29 per barrel in January but rose from there to finish the
half around $48 with further gains following the discussions surrounding oil production caps by OPEC.
European markets also rallied from their lows in February as the ECB responded to weaker than expected
growth and inflation by extending their quantitative easing policies. In Japan the BoJ surprised investors
with a move to a negative interest rate policy, before changing tack and instituting a zero target for ten
year yields. Meanwhile US equities gained as a dovish sounding Janet Yellen saw forecasts for interest
rate raises were pushed further out.
The UK’s EU referendum result was the most important news in the first six months and it saw sterling
weakening 10.4% against the Euro to the end of December, while hitting a 31 year low against the dollar.
The decision forced the resignation of Prime Minister David Cameron and led to the formation of a new
Government under Theresa May, tasked with the challenge of becoming the first country in Europe to
attempt to exit the EU by triggering Article 50.
The second half was dominated by more political news, in Europe the Italian referendum, French
primaries and Brexit preparations all pushed volatility higher. Government bond yields and financials
both notably benefited as inflation expectations rose in the autumn and then again after the election
victory for Donald Trump. The victory, alongside improving US economic data, lead to a large year-end
rally in equity markets and in the dollar. The US 10year yield rose from 1.8% at the end of October to
2.4% at the end of the year while inflation expectations also increased. In December the Federal Reserve
took the decision to raise the benchmark interest rate by a further 25bps and increased it’s expectation for
the number of rate hikes in 2017.

E.I. Sturdza Funds Plc
Investment Manager’s Report (continued)
for the year ended 31 December 2016
Strategic Europe Value Fund (continued)
19
PORTFOLIO STRATEGY
The Sub-Fund employs a bottom up stock picking strategy with a strong preference for high quality
business models as evidenced by high margins at the operating level and/or return on capital employed,
ideally combined with visible revenue. The aim is to buy these companies at a discount to the intrinsic
value. As a result of this philosophy, sector allocation is a consequence of the investment process rather
than a driver of it. The portfolio will normally have a structural bias towards sectors such as consumer
staples, consumer discretionary, healthcare, IT, media and support service sectors whilst avoiding the
commercial banks, insurance and commodity sectors.
Going into 2016, the Investment Adviser became increasingly concerned about the global outlook and
throughout the first half of the year the Sub-Fund positioning became more cautious as underlying data
deteriorated. Earnings growth ex-financials was going backwards in both Europe and the US. In Europe
expectations for further growth were the lowest they have been for some time and in the US profits as a
percentage of GDP looked to have peaked. On top of this there were political concerns regarding Brexit,
US Election and referendums across Europe. Given this backdrop the portfolio was defensively
positioned.
The Sub-Fund had a strong start to the year and closed the first half ahead of its benchmark by 4.2%*.
However the second half of the year proved more challenging as the portfolio was hit by the perfect
storm. A strong sector rotation as inflation expectations rose alongside several stock specific issues. The
Investment Adviser initially saw the sector rotation as short-term and therefore did not change the Sub-
Fund’s positioning. However, following the US election result on the 8th of November it became clear the
new US administration would look to make changes and that inflation and interest rate expectations
would move higher in the short-term as well as the longer term. The Investment Adviser rebalanced the
portfolio to increase the Sub-Fund’s exposure to financials. These companies have visible top lines but
less so in terms of margins. As such they are not normally in the Sub-Fund, however should the yield
curve steepen they stand to benefit. The Investment Adviser will be watching them very carefully.
For the year 2016 the Strategic Europe Value Fund underperformed its benchmark by -9.5%*, with an
annual return of -6.9%*. At a sector level, over the year, Energy and Materials were the best performing
sectors in the benchmark returning 32.3% and 28.6% respectively; these are sectors where the Sub-Fund
does not typically invest and was not invested. The worst performing sectors in the benchmark over the
year were Health Care, -9.4% and Telecommunication Services, -13.6%. The Sub-Fund is invested in the
Health Care sector but not the Telecommunication sector.
On a total return basis Sophos was the best performing stock in the portfolio, advancing 28.5%. Sophos
was listed on the London Stock Exchange in June 2015 and is a leader in the provision of Information
Technology security products and services to the mid-market. Sophos is focused on cloud-enabled end-
user and network security solutions, which is a high growth segment of the market. Sophos has a large
and loyal client base with high recurring subscription revenue.
Reynolds American returned 18.6% during the period held. The US cigarette maker is a great example of a
very well run, high quality compounding stock. In October Reynolds was bid for by BAT, shortly after which
the Investment Adviser closed the position.

E.I. Sturdza Funds Plc
Investment Manager’s Report (continued)
for the year ended 31 December 2016
Strategic Europe Value Fund (continued)
20
PORTFOLIO STRATEGY (CONTINUED)
Auto Trader returned 15.6%. The Sub-Fund re-established a position following the Brexit referendum result in
June, the Investment Adviser had recently met with management and the share price had declined 32% post
the event.
SAP delivered a total return of 14.3%. The company is going through an upgrade cycle driven by HANA.
The bottom 5 contributors to total return for 2016 were GrandVision, Galenica, Livanova, Bayer and Qiagen.
GrandVision is a global optical retailer with a top 3 market position in the 43 geographies within which it
operates. The company disappointed on poor operating performance, notably in Italy where they are merging a
large acquisition with their current business. The Investment Adviser expects the problems to be temporary
and to not affect the investment case longer-term and hence remains invested.
Galenica is a global pharmaceutical company. The market did not like the Relypsa deal as although there are
strategic merits the cash and time it would take until 2019 to become EPS accretive. Relypsa’s drug is called
Veltassa, a first in class potassium binder which has blockbuster potential.
Livanova, a small medtech company, disappointed on its top line guidance and the shares came off sharply,
despite maintaining its bottom line guidance. It has also had some issues with a product in the US, although
this was sector-wide and they believe they have a solution in place. The investment case is unchanged and the
Sub-Fund still holds a position in Livanova.
Bayer, a German multinational chemical, pharmaceutical and life sciences company, announced a deal with
Monsanto indicating a strategic shift in the company’s direction of travel. The position was exited.
Qiagen, a provider of pharmaceutical technologies and research, issued a profit warning in early January after
half of the programs within their companion diagnostics franchise were delayed or discontinued in Q4 2015.
The Investment Adviser subsequently sold the shares.
MARKET OUTLOOK
The Investment Adviser remains concerned about global volatility for 2017. It seems clear that it will be
another year driven by politics. At the time of writing, the President-elect in America has yet to take
office, time will tell which policies he will focus on and over what timeframe he will likely be able to
implement them. In Europe investors will be concerned by events including the Dutch elections in March,
the French presidential elections in April/May, the German elections likely to be in October and the
possibility of an early Italian election. Populist party support in France and Germany has recently been
around 30% and 12% respectively, as such they cannot form parties on their own but it is clear that the
political momentum in Europe is with those seeking change. Most pressing of all for Europe will be the
UK triggering Article 50 by the end of March. There continues to be significant uncertainty regarding
what sort of exit the UK will have from the EU and the potential economic challenges both sides of the
discussion will face as a consequence.
E.I. Sturdza Funds Plc
Investment Manager’s Report (continued)
for the year ended 31 December 2016
Strategic Europe Value Fund (continued)
21
MARKET OUTLOOK (CONTINUED)
More positively the Investment Adviser is now broadly seeing economic data improve in both Europe and
the US. This bodes well for companies in the Sub-Fund. When the markets are moved by the macro rather
than the companies this will tend to present investment opportunities for those with a long-term view
prepared to look through the noise. The Investment Adviser is looking forward to investing in 2017.
Lofoten Asset Management Limited
E.I. Sturdza Strategic Management Limited
January 2017
*Refers to EUR Institutional Share Class

E.I. Sturdza Funds Plc
Investment Manager’s Report (continued)
for the year ended 31 December 2016
Strategic Global Bond Fund
22
The Investment Manager’s report has been compiled with the assistance of the Investment Adviser, Banque
Eric Sturdza SA (Discretionary adviser).
FUND PERFORMANCE
In terms of performance, the year was positive until November, when Mr Trump’s presidential election victory
increased volatility. The portfolio strategy implemented in 2015 favoring 30y US Treasuries and the decision
to split the position between nominal bonds and TIPS (inflation-linked) in January, started to bear fruit in Q2
and performed well until Q3. In this context, the Sub-Fund achieved positive performance despite the major
post-election sell-off: +0.27% YTD on December 30th (USD share class) whilst the benchmark (ICE LIBOR
3m USD +1%) had a performance of + 1.66%. Due to the decision of the PBoC (Chinese Central bank) to
weaken the renminbi, the performance of the RMB share class was -3.73%, 4% lower than the USD share
class. This was largely expected due to the shift in the Chinese strategy avoiding a currency that is too strong.
MARKET OVERVIEW
In January, all eyes were focused on any bad news that could deteriorate the political and economic
climate in 2016: fears of a hard landing in China (and renminbi devaluation), negative rates in Japan, oil
prices and commodity prices in general, Emerging markets, the (too hawkish) Fed but also Brexit, Spain
(with no Government), migrants in Europe, turmoil in Brazil, Donald Trump and Italian banks. The BoJ
took the market by surprise, adopting a negative interest rate policy but other Central banks did not
change their key rates and policies. In Europe, Mr Draghi said that the ECB program would be reviewed
in March with “no limits” on how far they can go.
In February, concerns about a possible Brexit impacted the GBP bond market (both yields and currency),
uncertainty about the size of Italian banks’ non-performing loans and the exposure to the oil & gas sector
in European banks balance sheet led to a fall in subordinated bank debt (including CoCos). Regarding
Central banks activity, the Fed stayed in “wait and see” mode. Mrs Yellen said that due to economic
conditions, only gradual increases would be implemented. She added that it was not necessary to cut rates
but in saying that, she gave substance to the thesis that it was a possible scenario in the coming months.
In March, the major event and driver of the behaviour of financial markets, has by far been the ECB’s
meeting on March 10th. In the global bond market, concerns about a possible Brexit, US Presidential
election and political turmoil in Brazil had a less pronounced impact. However, the strong rebound of oil
prices, from $33.70 to $38.30 helped the recovery of risky asset markets to the detriment of safe havens.
As expected, the ECB did not miss its target with an expanded QE (EUR 80 billion / month instead of 60)
open to corporate bonds purchases, a deposit rate decreased to -0.4% (from -0.3%) and a new TLTRO,
which was probably the less commented measure but the most important. The expanded APP (Asset
Purchase Program) added private corporate bonds (CSPP, Corporate Sector Purchase Program) to
government-owned corporates (known as PSPP, Public Sector Purchase Program). In the US, Mrs Yellen
said that the Fed should “proceed cautiously”. The US Central bankers were still in “wait and see” mode:
they were convinced that the pace of the domestic economy deserved a rate hike but they had difficulties
in analysing the potential impact of a weaker global growth (first and foremost in China) on the behaviour
of the US economy.

E.I. Sturdza Funds Plc
Investment Manager’s Report (continued)
for the year ended 31 December 2016
Strategic Global Bond Fund (continued)
23
MARKET OVERVIEW (CONTINUED)
In April, concerns about Brexit and Greece in Europe combined with US Presidential election and
Dilma’s probable impeachment in Brazil were among the key drivers of the markets, but with a less
pronounced impact than the pursuit of the strong rebound of oil prices, from $38.30 to $45.90. Central
Banks did not change their monetary policies. In the US, the Fed left its rate unchanged but opened the
door to raising interest rates in June thanks to an improvement in global financial markets.
In May, markets seemed to hold their breath before a busy and hectic month of June. In the US, Ms
Yellen’s speech pointed out improvements in the US economy, confirming that the Fed was open to
raising rates soon. In Europe, concerns about Brexit rose sharply. In this environment, oil prices
continued to climb, from $45.9 to $49.1 while gold fell sharply (-6%) from $1,293 to $1,213 an ounce. In
the US, the economy seemed to gain momentum and the release of minutes from the FOMC meeting in
April showed that the Fed was ready to raise interest rates at every meeting including on June 15th.
In June, Brexit led to a flight to quality towards US Treasuries and Bunds. At the same time, low quality
debt such as high yield and deeply subordinated bank debt fell sharply, in line with equity markets. The
other major event was the poor number of 38,000 jobs created in the US, the smallest number in five
years. As a result, market participants decreased dramatically the probability of a Fed rate hike in July and
after Brexit, they started to price in (up to 20%) a possible rate cut in December! In Europe, as expected,
the ECB started its CSPP program on June 8th. At the same time, peripheral banks (Spanish and Italian)
became the biggest borrowers of the TLTRO program.
In July, risky assets recovered strongly as the slowdown due to the Brexit had not yet materialized. In line with
equity markets, low quality debt as high yield and deeply subordinated debt rebounded following their post-
Brexit sharp correction. In this context, IG Corporates, US Treasuries and Bunds, managed also to perform
well. In the US, 287’000 jobs were added in June, easing concerns after last months poor number. Globally US
Data were better than expected with housing momentum and confidence continuing to point up. As a result,
market participants cancelled the probability of a Fed rate cut in December and started to price in a possible
rate hike (up to 35%) before the end of the year. In Europe, as expected, the ECB left monetary policy
unchanged but remained ready to increase stimulus should economic forecasts dramatically change following
UK Referendum. Any expansion of the current Asset Purchase Programme (APP) will need changes in bonds
eligibility rules given ultra-low yields environment. The BoE didn’t cut rates but offered additional liquidity
operations and reducing capital requirements.
In August, macroeconomic data was strong in Europe and in the US. In the Eurozone, the PMI index showed a
recovery confirmed by the unemployment rate which reached 10.1%, the lowest in five years. Some
disappointing data in southern Europe was offset by the French recovery. In the US, job creations reached
255k this month and hourly average earnings rose to 2.6% annualized (a major indicator of future inflationary
pressures). Home sales were encouraging and home construction reached its highest level in five months. As a
consequence, market participants were waiting impatiently for the Central bankers meeting in Jackson Hole in
order to dispel prevailing doubts about their monetary policies and first and foremost Ms Yellen’s speech as
the Fed has the most unclear or unpredictable behaviour.

E.I. Sturdza Funds Plc
Investment Manager’s Report (continued)
for the year ended 31 December 2016
Strategic Global Bond Fund (continued)
24
MARKET OVERVIEW (CONTINUED)
This indicated clearly that nobody really knew in which direction the macroeconomic environment was
moving, including the FOMC members! In Emerging markets, inflows accumulation and risk appetite have
continued to drive the market as the Fed monetary policy normalization process is considered by the market to
remain slow and prudent. In Brazil, as expected, President Dilma Rousseff was removed from office as more
than two-thirds of senators voted for impeachment, leaving its successor the task of implementing difficult
reforms to rescue the economy from recession. With positive technical factors and stable commodity prices,
major credit markets performed well during the month with Turkish assets retracing most of the correction
linked to the July Turkish Coup Attempt.
In September, markets have been driven by China (non-performing loans), Japan (the slope of the yield curve
managed by the BoJ), the US presidential election and the drop of Deutsche Bank shares (fears about the
future of the European banking sector, mostly Germans and Italians). Macroeconomic data was strong in
Europe and softer in the US. In the Eurozone, the Q2 GDP reached +0.3% and confidence indicators
improved. In the US, the ISM indicators (both manufacturing and non-manufacturing) decreased and job
creations reached 151k instead of 180k expected by the consensus. Consequently, the Fed voted 7-3 to leave
its rates unchanged and the ECB did not modify its policy. Regarding other major Central banks, another BoE
rate cut was likely in the United Kingdom and a new wave of unconventional easing began in Japan. The main
concern had already been mentioned by the Investment Advisor the month before: the 3 month US$ Libor had
already increased by 25 bp and a Fed rate hike would only be a readjustment of official key rates with the level
of money market rates. This US$ Libor increase was not circumstantial at all. Corporate loans and mortgages
in USD were increasing; the cost of a currency hedge had already increased (by 2% to hedge the USD against
the CHF), the cost of leverage for banks and hedge funds was higher. As a result, negative flows affected the
US Treasury curve to an unsustainable level. In this environment, a Fed rate hike becomes less relevant than
money market rates evolution.
In October, markets had been driven by the US presidential election, the probable Fed rate hike in December
and the incredible rumour of tapering in Europe. Macroeconomic data was stronger in the US, led by
consumer spending, labour market (both employment and wage growth), industrial production and residential
real estate. In Europe, two major sets of economic data gave the impression that the situation was improving:
the Spanish unemployment rate decreased below 20% for the first time in six years and the German Ifo index
reach a two-year high. Consequently, the Fed is supposed to raise its Fed fund rate on December 14th
even
though there was a FOMC meeting on November 2nd
(considered as too close to the Presidential election). In
Europe, an incredible rumour affected the bond market. The ECB would consider a tapering of its QE. Some
ECB members contradicted this rumour that led to a jump in the euro and Bund yields. The official version of
the ECB continued to be that they were open to further stimulus. In the meantime, they took advantage of this
correction to purchase short term bonds which climbed above the deposit rate.
In November, markets had been driven by the US presidential election outcome and the victory of Donald
Trump. Against all odds, stocks rallied and safe havens such as gold and bonds underperformed dramatically.
The most frequent argument that explains this behaviour is that Mr Trump’s policy would spur growth and
favour inflation. Mr Trump’s program contains many uncertainties: what exactly is this program? Will it be
implemented? After how many years will it see the first results? Will the majority of the Republicans at the
Congress vote for some controversial measures? It is too early to develop a new economic scenario and the US
economy will not change dramatically in the coming weeks or months.

E.I. Sturdza Funds Plc
Investment Manager’s Report (continued)
for the year ended 31 December 2016
Strategic Global Bond Fund (continued)
25
MARKET OVERVIEW (CONTINUED)
Just after the announcement of Trump’s victory, the markets’ behaviour was logical: a Treasury rally (30y at
2.52%), gold above 1330, Swiss franc rally reaching 0.9550 against USD, S&P future limit down (-5%). Then,
all these markets turned, equities rallying substantially and safe havens starting a decrease. In this environment,
the only behaviour which seemed “normal” was the drop of some Emerging currencies (the Mexican peso
being the most emblematic) and the widening of Emerging market bond spreads. This Treasury sell-off has
been massively amplified by the record volumes of transactions. The decrease of the bond markets (i.e. the
increase of bond yields) can be explained by the accumulation of massive sell orders. Initially, market
participants thought that these orders came from China but once analysed the origin of these trades it appeared
that Hedge Funds and CTAs were the leaders of this market action and that high-frequency trading was
primarily responsible for the amplification of the sell-off.
In December, markets had been driven by the two major Central Banks meetings, the FOMC and the ECB. In
the US, the Fed raised its Fed Fund rate to 0.5%-0.75%. This decision was unanimous for the first time since
July and was responding to the strength of the labour market and economic growth. In addition, the Fed
mentioned that inflation expectations had risen “considerably”. In Europe, the ECB extended its QE program
until (at least) the end of 2017 but reduced its asset purchases from 80 to 60 billion EUR after March.
Sovereign bonds yielding below -0.4% and bonds maturing below two years will be included in the purchase
list. This was clearly an increase of the QE (60x9= 540 billion EUR instead of 80x6=480 expected) but the
markets did not really like the decrease of monthly purchase. US economic indicators showed that growth was
rising from modest to moderate, employment was still expanding and the housing sector continued to show
signs of improvement. On another hand, consumption indicators were disappointing and the strength of the US
Dollar was mentioned as a threat by the Fed in its beige book. The European economy was still improving as
consumption, business confidence, consumer confidence and unemployment suggest an improvement in the
pace of the recovery. But inflation remains too low. After November was dominated by the outcome of the
Presidential election in the US, all eyes were now focused on Europe. As expected, in Italy, Matteo Renzi lost
his referendum and resigned. In France, Mr Hollande decided not to stand again for election as President in
May. In terms of rescue plans, the Greek short-term debt relief had been frozen by the Eurogroup Finance
Ministers and the ECB announced that the amount of capital needed by Monte dei Paschi to avoid bankruptcy
was 8.8 billion EUR instead of 5! Outside Europe, the main event was the OPEC agreement on November 30th
to cut the output (up to 1.8 million barrels/day), leading to a jump of oil prices from $45 to $55 in December.
In this context, the German 2y yield decreased from -0.35% to -0.80% (-45bp), the 5y yield from -0.05%
to -0.54% (-50bp) and the 10y Bund yield from +0.63% to +0.2% (-42bp). With increasing concerns
about risks surrounding Italian politics and fragile economic recovery, Italian 10y yield increased from
respectively 1.60% to 1.82% (+22bp). Spanish 10y yield was more resilient, decreasing from 1.77% to
1.38% (-39bp). In the US, the 2y US Treasury yield increased from 1.05% to 1.19% (+14bp), the 5y yield
from 1.76% to 1.93% (+17bp), the 10y from 2.27% to 2.45% (+18bp) and the 30y long bond from 3.02%
to 3.07% (+5bp). On the credit side, the European iTraxx Main decreased from 77 bp to 72 bp (Post-
Brexit banks and cyclicals spreads widening having largely recovered the following months) while the US
corporate CDX index decreased from 88 bp to 68 bp. In Emerging Markets, the CDX 10y EM index
spread tightened dramatically from 369 bp to 286 bp (-83 bp) finishing the year 2016 tighter than on the eve
of the Presidential election!

E.I. Sturdza Funds Plc
Investment Manager’s Report (continued)
for the year ended 31 December 2016
Strategic Global Bond Fund (continued)
26
PORTFOLIO STRATEGY
In 2016, the Sub-Fund started the year with a size of USD 95 million and declined to USD 64 million at
the end of December due to the launch of Strategic Quality Emerging Bond Fund in April. Some
investors switched from the high quality but lower yield USD fund into a more attractive yielding fund
despite more risk and more volatility. During this year, the Investment Manager managed actively the
modified duration of the Sub-Fund: the duration increased from 4.1 to 4.6 in January and continued to
increase progressively until 5.9 in April. In May, for risk management purposes before the Brexit, the
duration had been decreased to 4.5 and stayed around 4.6 in June. Yields having reached historical lows
post-Brexit, the modified duration was maintained around 4.9 until the end of August. In October, the
duration was moderately raised to 6 before being decreased aggressively after Mr Trump’s presidential
election victory to 4.8 in November and to 3.8 in December.
In January 2016, The Investment Adviser did not change the strategy it had implemented back in June
2015, favouring high quality and liquidity. The only Corporate bond transaction that had been made was
the sale of the remaining position in Mubadala Abu Dhabi 2021. Consequently, there was no longer a
Middle East position in the portfolio. Regarding US Treasuries, the Investment Advisor implemented the
following strategy: it switched 20% of its exposure to 30y Treasuries into 30y TIPS (i.e. Inflation Linked
Treasuries) as the inflation breakeven was very attractive. In terms of duration and duration overlay, the
Investment Advisor increased substantially the modified duration of the Sub-Fund from 4.1 to 4.6.
In February, a KfW (German government) duration extension trade was implemented: KfW maturing in
March 2016 was sold against KfW 2021. More importantly, the strategy which consists of being exposed
to 30y US Treasuries has been amended.
This exposure actually included three different strategies:
-1: Long 30y Treasuries outright
-2: Long 30y inflation-linked Treasuries outright
-3: Long 30y Treasuries / short 2y and 5y notes futures (flattening 2-30y and 5-30y)
Due to the fact that the Fed could postpone any rate hike in Q1 and Q2 2016, the Investment Adviser
thought that 2y and 5y yields could continue rallying simultaneously with 30y yields. Consequently, the
third strategy (flattening) has been removed. The Investment Advisor sold the Treasury maturing in
August 2044 (whole position) and bought back the totality of the short future position (i.e. 100 2y notes
and 100 5y notes). In terms of duration, the Investment Advisor increased substantially the modified
duration of the Sub-Fund from 4.6 to 5.3.
In March, the Investment Adviser sold Goldman Sachs, Republic of Poland and Procter & Gamble (profit
taking). It decreased the weight of EDF, KfW, Rentenbank, EDC, Cisco and Oracle. More importantly,
the exposure to 30y bonds was amended. Temasek 2042 (AAA Singapore Government) has been
decreased against the purchase of the new US Treasury 2.5% February 2046. Then, the position in the US
Treasury 2044 was reduced significantly in order to increase investments in 30y inflation-linked Treasury
2043. In terms of duration, the Investment Adviser increased the modified duration of the Sub-Fund from
5.3 to 5.6.

E.I. Sturdza Funds Plc
Investment Manager’s Report (continued)
for the year ended 31 December 2016
Strategic Global Bond Fund (continued)
27
PORTFOLIO STRATEGY (CONTINUED)
In April, the Investment Adviser bought the new Korea Resources 2021 in the primary market, decreasing
the weight of General Electric 2017. It sold the remaining position in Temasek 2042 (AAA Singapore
Government) against the 30y benchmark US Treasury 2.5% February 2046. Finally, it also increased the
weight of this position when 30y yields climbed to 2.75% on April 26th pushing the modified duration of
the Sub-Fund to 5.9.
In May, following the minutes of the April FOMC and Ms Yellen’s comments, the Investment Adviser
partly took profit on the huge 30y Treasury position, selling USD 5 million US Treasury 3% 2045,
switched against a US T-Bond maturing in December 2016. Consequently, the modified duration of the
Sub-Fund, which had been raised to 5.9 when 30y yields reached 2.75%, decreased to 4.5.
In June, the Investment Adviser slightly decreased the weight of 30y US Treasuries (already decreased in
May) and added a position in EDP Finance 2021. The modified duration of the Sub-Fund, which had been
decreased from 5.9 to 4.5 in May, stayed around 4.6.
In July, the Investment Adviser added new positions in LVMH 2017, McDonald 2018, Pepsico 2019, Orange
2019, Hyundai Capital America 2020. The modified duration of the Sub-Fund was increased from around 4.6
to 4.9 by buying additional 30yr Treasury on a yield retracement level of 2.35%.
In August, the modified duration of the Sub-Fund has been maintained between 4.9 and 5.0. The Investor
Adviser was waiting for a correction in the 30y US Treasury yield but it did not materialized in August.
Anticipating this to happen in September, the position in long bond and long TIPS (inflation linked) would be
increased, which could lead to a substantial increase of duration towards 6.
Consequently, in September, the Investment Adviser increased the weight of the TIPS 2043 (Inflation-linked
US Treasury) and US Treasury 2046 when the US curve steepened, and invested in Shell 2019 and Korea Gas
2021 (switched against the sale of US Treasury December 2016) in order to keep the weight of corporate
bonds above 50%. The modified duration increased from 5.0 to 5.4.
In October, the Investment Adviser increased the weight of the TIPS 2043 (Inflation-linked US Treasury) and
US Treasury 2046 when the US curve steepened and sold the remaining position in US Treasury maturing in
December 2016. It also implemented a switch, selling Korea Ressources 2021 (Government-owned but in a
challenging sector, coal) and buying Tesco November 2017 (1y maturity yielding above 2%), a British falling
angel (BB+ rated) in a recovery phase. The modified duration increased from 5.4 to 6.0.
During November, the Investment Adviser adopted a more defensive approach with particular focus on
duration management. Due to the behaviour of the market recently and the increasing probability of tensions in
the inter-bank market, the Investment Adviser started to build a significant portion of investments (around
6.7% at Month end) in Floating Rate Notes (mainly non-Financial corporates), i.e. bonds with low duration
(between 0 and 0.3) and coupons indexed on the 3 month USD Libor. Consequently, it bought the following
FRN bonds: Ford Motor Credit 2018, Apple 2018, Cisco 2018, Siemens 2018, Exxon Mobil 2018, Toronto
Dominion 2018 (the only financial issue), Roche 2019 and Nissan 2019. Regarding the sell-off in the 30y
Treasury market, the Investment Adviser had previously identified two major stop-loss levels: 2.81% and
3.13%. Once the yield climbed above this first level, it sold half of the position in 30y bonds at 2.84% (and a
small position at 2.99%).
E.I. Sturdza Funds Plc
Investment Manager’s Report (continued)
for the year ended 31 December 2016
Strategic Global Bond Fund (continued)
28
PORTFOLIO STRATEGY (CONTINUED)
Consequently, the position in 30y Treasuries decreased substantially from $ 8 to $3.5 million but the
investments in TIPS (inflation-linked) had been kept. The proceeds of this sale were reinvested in short term
corporates (Toyota 2017, RCI banque 2018, Honda 2018 and Pfizer 2019). Finally, due to a weight
approaching 5% of the portfolio, positions in Engie 2017, Linde 2018 and EDF 2019 were reduced. The
modified duration decreased from 6.0 to 4.8 and could be decreased substantially in December should 30y
Treasury yield climb above 3.13% (second stop-loss level that would trigger the sale of the remaining stake in
long bonds).
During December, the Investment Adviser did not modify its approach implemented in November, favouring
investments in Floating Rate Notes, i.e. bonds with low duration (between 0 and 0.3) and coupons indexed on
the 3 month USD Libor (which reached 1% at month end). The weight of Floaters (6.7% on November 30th)
climbed above 10% in December. The weight of the following FRN bonds had been increased: Ford Motor
Credit 2018, Apple 2018, Cisco 2018, Siemens 2018, Exxon Mobil 2018 and Nissan 2019. Regarding the sell-
off in the 30y Treasury market, the Investment Adviser had identified a second major stop-loss level at 3.13%
(after 2.81% in November). Once the yield climbed above this level,remaining position in 30y bonds at 3.16%
were sold. As a result, the position in 30y Treasuries which had already decreased substantially from $ 8 to
$3.5 million in November had been totally sold in December. The investments in TIPS (inflation-linked) have
been slightly decreased (from $ 6 to 5.5 million). The proceeds of these sales were reinvested in short term
corporates by increasing the positions in Tesco 2017 and Honda 2018. In addition, due to a weight
approaching 5% of the portfolio, positions in Engie 2017, Linde 2018 and Enel 2019 were reduced. Sanofi
2021 had been sold due to uncertainties around the purchase of Actelion (initially taken over by Johnson &
Johnson) and a possible litigation risk after the Dépakine scandal in France. Finally, the Investment Adviser
initiated a position in US Treasury 2026 at 2.38% as the evolution of 10y Treasury yields looks more clear
than the behaviour of 30y long bonds. The modified duration decreased from 4.8 to 3.8 In terms of portfolio
diversification, the Sub-Fund held 42 issues from 37 different issuers.
MARKET OUTLOOK
The Investment Adviser’s global outlook remains unchanged. Mr Trump is not a magician and during his 4-
year mandate, the US will not avoid a recession or at least a significant slowdown. In terms of growth, the
trend will remain broadly the same. Regarding inflation, a significant reflation is considered unlikely. The
Investment Adviser believes that the current behaviour of the US Treasury bond market looks like the Taper
tantrum in June 2013. The sell-off in the Treasury market could continue in Q1 2017 but the Treasury yield
curve is probably already normalised at the current levels.Regarding Europe, The ECB must maintain its
policy (massive QE) as the first real consequences of the Brexit in one year (probably Q4 2017 / Q1 2018) are
seen. Emerging Markets will stay volatile but technical factors such as low net issuance, negative or low yields
environment in most Developed Markets, higher commodities and oil prices (OPEC’s behaviour is bullish for
Emerging bonds), stabilisation of emerging currencies and a “not-too-hawkish” Fed suggest that the
environment will remain supportive for further spread tightening. Any correction would be a buying
opportunity.
Banque Eric Sturdza SA
E.I. Sturdza Strategic Management Limited
January 2017
E.I. Sturdza Funds Plc
Investment Manager’s Report (continued)
for the year ended 31 December 2016
Strategic US Momentum & Value Fund
29
The Investment Manager’s Report has been compiled with the assistance of the Investment Advisor, Banque
Eric Sturdza S.A. (Discretionary adviser).
FUND PERFORMANCE
In 2016, the Sub-Fund returned -1.91% whilst the MSCI USA returned 10.89%.
MARKET OVERVIEW
Even though the US economy was already building momentum, the ongoing shift in the economic narrative
was bolstered by the potential impact of a Republican Party sweep in the second half of 2016. Therefore,
heading into 2017 the US was already poised for an economic backdrop that was likely to see real GDP
growth increase above the post-recession average. The election basically took an already decent starting point
and diluted some of the downside risks as the increased prospective for significant fiscal policy has the
potential to alter the growth trajectory for a number of years.
A central point that supports this pro-growth view is the healthy state of US households. Households are not
only gaining from a tighter labor market, which has a positive impact on wage pressures, they also seem to be
in balance. Household liabilities are still growing at a year-over-year rate that is lower than any historical cycle
low. This combined with the boost we’ve seen in aggregate incomes, has extended the de-levering process
beyond what is typically defined as the final stages of a recovery as the creation and the resulting correction of
imbalances has most often been a good leading indicator of a faltering expansion. Currently the US economy
seems to be far away from such a situation. The Investment Advisor believes that increases in rates will be
implemented under the right circumstances (i.e. rising growth and inflation prospects), which would offset any
increase in mortgage costs. Also in terms of the US consumer, households have been saving more in recent
years and the possibility for a sudden cash flow increase (through, for example, tax reform) could boost real
consumption and extend the economic expansion. Even though anything regarding tax relief policy and its
potential effect on the backdrop is just speculation at this point, most sentiment metrics have moved higher. An
example would be the Conference Board Consumer Confidence Index that surged from 100 to 107. This is a
good sign as sentiment shifts are more common to see in the mid-cycle part of an economic recovery and
therefore also supports the idea that increased spending could occur even before any actual tax rate changes are
implemented.
The refreshed optimism on the economic outlook and backdrop was accompanied by a noteworthy increase in
hiring plans. Usually, this is a leading indicator for the unemployment rate. Also, the share of small firms
expecting higher real sales went up to pre-crisis ranges. Such moves are usually witnessed in early stages of an
expansion and the small business sector, which is responsible for an important chunk of net new hiring, might
only now start participating in the current recovery and could also prolong the cycle.
The Sub-Fund underperformed its benchmark essentially due to sector allocation. The exposure to financials
(approx. +31% over the second half of 2016), which has substantially been increased (from 3.8% to 12.4%)
through the use of an ETF and the weighting of the two banks held by the Sub-Fund, remains slightly below
the 14.6% exposure of its benchmark. Also the Sub-Fund’s overexposure to healthcare hasn’t, as of yet, helped
in terms of relative performance as this sector as a whole has as a whole has remained flat over this same
period.

E.I. Sturdza Funds Plc
Investment Manager’s Report (continued)
for the year ended 31 December 2016
Strategic US Momentum & Value Fund
30
MARKET OVERVIEW (CONTINUED)
Finally, the cash held by the Sub-Fund detracted from performance against the benchmark and has been
reduced from approximately 14% to currently 4.4% was also a relative performance deterrent. Nonetheless,
the sentiment rotation that has taken place and which is poised to continue leaves the Investment Advisor
convinced that maintaining the Sub-Fund’s investment discipline will generate outperformance over time as
the backdrop improves and investors will want to buy companies that are cheap on a relative basis and grow at
a steady and above average pace.
On the selection level, positions in Alaska Airlines, Skyworks Solutions, and Team Health have been closed
whilst a position in Envision Healthcare has been initiated. Alaska Airlines is considered a great stock but had
an elevated beta and a slowing growth outlook. Also, in the pursuit of rendering the portfolio sturdier the
company did not match the desired profile. As such the position was closed after the stock price had recovered.
Skyworks Solutions was closed for two reasons: (1) the desire to reduce the portfolio’s exposure to similar
themes (also a result of wanting to make the portfolio sturdier) such as Apple and its supply chain and (2) the
fact that Skyworks Solutions also had an elevated beta, a stock price that had recovered, and a slowing growth
outlook. Envision Healthcare was initiated to replace Team Health as a health care services provider. Not only
does Envision Healthcare have a larger market capitalization and lower beta, it also offers a more steady
growth profile (more historical data available) on both a historical and forward looking perspective.
PORTFOLIO STRATEGY
The strategy is to achieve NAV appreciation above that of its benchmark index (MSCI USA) by selecting
companies with a stellar track record of persistent growth throughout varying cycles but which have attributes
that are underappreciated by the market based on a wide set of fundamental valuation metrics. The Sub-Fund’s
aims to select companies which exhibit high levels of price and earnings momentum, at prices which are
deemed undervalued compared to their growth perspectives. A central tenet of the strategy is to focus on the
discrepancy between the market’s valuation of a company’s growth profile and both its actual realized and
potential growth. The process makes full use of both quantitative screens and fundamental analysis to select
the most attractive companies within the mandate’s universe. The Sub-Fund aims at maintaining a portfolio of
at least 25 stocks, and exhibits sectoral diversification. The Sub-Fund can be described as following a bottom-
up selection process with top-down-conscious portfolio construction. It is thus a natural consequence of the
strategy and process that specific sectors or otherwise defined groups of stocks exhibit a weighting discrepancy
when compared to the benchmarks.
MARKET OUTLOOK
As mentioned in the previous report, a key factor for GDP growth is the US consumer. The signs that have
been elaborated in the “Market Overview” segment of this report are encouraging and all point towards an
economic cycle that has the potential to be prolonged.
In terms of the US election, the Investment Advisor believes that president-elect Trump has highlighted factors
that could enhance economic activity (regulatory change/easing and tax reform) and hurt the backdrop
(restricting trade). For now though, the Investment Advisor believes that the net result will be positive but of
course it depends on how much of what has been said will actually be implemented and more critically how
much common ground can be found between President-elect Trump and Congress.The Investment Advisor’s
thoughts on the market reaction post-election are that expectations of fiscal stimulus (i.e. higher spending on
infrastructure and defense, tax reform etc.) resulted in the industrial, defense, financial, and healthcare sectors

E.I. Sturdza Funds Plc
Investment Manager’s Report (continued)
for the year ended 31 December 2016
Strategic US Momentum and Value Fund (continued)
31
MARKET OUTLOOK (CONTINIUED)
to rally alongside “value” stocks in general. For the Investment Advisor, the defense play has been overdone
whilst financials still have some leeway and healthcare and transport are still below historical norms.
Therefore, the Sub-Fund will maintain its overweight in healthcare and the exposure to financials and
transportation will be slowly increased as was the case before the election.
Looking forwards, the Investment Advisor thinks that the industries which could perform best in a rising rate
environment are technology, commodities and energy. However, in the current cycle financials have (up until
now) the highest sensitivity to increases in 10-year bond yields. The Investment Advisor also believes that
potential changes in tax policy will impact sectors differently. Those with higher current tax rates (i.e.
healthcare services, transports, consumer staples, and in some cases financials) have the potential to see a
strong earnings boost. The Investment Advisor is nonetheless aware that sectors with lower current tax rates
(i.e. energy and technology) could see their multiples become more expensive on a relative basis. Another big
subject that was raised since Trump’s election is cash repatriation. As it is well known, many companies have
moved their operations overseas so that they can generate and recognize a large chunk of their earnings in
more tax friendly locations. Generally speaking, technology companies are amongst the ones that have the
highest levels of cash “stuck” overseas and the Investment Advisor believes that they would be the ones to
benefit the most from an increased ability to access that cash. Examples of these would be Alphabet and Apple
which are both held in the Sub-Fund.
Looking forward the Investment Advisor remains confident in the Sub-Fund’s strategy, positioning and
potential for outperformance. Indeed, the sector rotation, which accelerated following Trump’s election, is
expected to continue and most importantly, the expected earnings growth of the Sub-Fund’s holdings should
offer substantially better upside than the market.
Banque Eric Sturdza SA
E.I. Sturdza Strategic Management Limited
January 2017
E.I. Sturdza Funds Plc
Investment Manager’s Report (continued)
for the year ended 31 December 2016
Strategic Global Quality Fund
32
The Investment Manager’s Report has been compiled with the assistance of the Investment Adviser, Lofoten
Asset Management Limited (Discretionary adviser).
FUND PERFORMANCE
The NAV per share of the USD Institutional. Class fell USD 6.07 to USD 108.49. A total return of
-5.30%.
The USD Class was launched on the 12th Feb 2016. It rose USD 0.80 to USD 100.80. A total return of
+0.80%.
The CHF Class was launched on the 3rd
June 2016. It fell CHF -10.05 to CHF 89.95. A total return of
-10.05%.
During the period in question the benchmark MSCI Daily Total Return Net World Index increased by
5.33%.
MARKET OVERVIEW
The volatility of 2015 continued into 2016 with the markets falling at the start of the year on fears of a
US recession, a slowdown in global growth, weakness in Chinese industrial data and the falling price
of oil. The European and American central banks responded with fresh monetary easing and dovish
words respectively, and this helped the market regain most of their losses by the end of the first
quarter. European, Japanese and American yields fell significantly in the first quarter and continued to
do so throughout the half.
In Q2 the markets were volatile but traded largely sideways until the UK referendum on June 23rd.
Expectations were for a status quo vote to remain and hence the days following the result saw
significant moves in all asset classes. In the following two days the S&P fell 5.4%, the STOXX 600
10.9% and the FTSE 100 5.6%. Over the same period sterling fell 12% against the Dollar and 8.4%
against the Euro. Since the event, UK 10year gilt yields have fallen 37.7% to end the half at 0.86, as
US 10year treasuries fell 15.5% and German 10year debt went negative for the first time, ending the
half at -0.14%. The uncertainty this raises surrounding both the UK and the EU concerns investors
globally and with clarity unlikely to be provided while the negotiations are ongoing volatility is to be
expected.
The second half of the year was dominated by political news flows, in Europe around the Italian
referendum, French primaries and Brexit negotiations. The lead up to the US election also impacted on
major currencies and on the fortunes of different companies and sectors. This all caused volatility to
increase and to a year-end rally following the election of Donald Trump. The US 10year yield rose
from 1.8% at the end of October to 2.4% at the end of the year as inflation expectations also increased.
In December the Federal Reserve made the decision to raise the benchmark interest rate by a further
25bps and increased it’s expectation for the number of rate hikes in 2017.
Japanese equities declined significantly in the first half of the year with most of the move happening in
the first two months as the Yen strengthened throughout the period against the dollar. After a period of
calm both moves reversed, with the Nikkei rallying ~16% post the US elections as the Yen fell from
103 to close around 117 against the dollar.
E.I. Sturdza Funds Plc
Investment Manager’s Report (continued)
for the year ended 31 December 2016
Strategic Global Quality Fund (continued)
33
MARKET OVERVIEW (CONTINUED)
Emerging markets ended their negative streak in 2016, finishing up 11.2% despite sweeping political
change during the year. Recovery in commodity prices helped to support emerging market assets
which were additionally boosted by a continued search for yield. For Emerging Market debt in
particular, the perception that political risks had stabilized boosted foreign capital inflows.
PORTFOLIO STRATEGY
The Sub-Fund employs a bottom up stock picking strategy with a strong preference for high quality
business models as evidenced by high margins at the operating level and/or return on capital employed,
ideally combined with visible revenue. The aim is to buy these companies at a discount to the intrinsic
value. As a result of this philosophy, sector allocation is a consequence of the investment process rather than
a driver of it.The portfolio will normally have a structural bias towards sectors such as consumer staples,
consumer discretionary, healthcare, IT, media and support service sectors whilst avoiding the commercial
banks, insurance and commodity sectors.
Going into 2016, the Investment Adviser became increasingly concerned about the global outlook and
throughout the first half of the year the Sub-Fund positioning became more cautious as underlying data
deteriorated. Earnings growth ex-financials was going backwards in both Europe and the US. In
Europe expectations for further growth were the lowest they have been for some time and in the US
profits as a percentage of GDP looked to have peaked. On top of this there were political concerns
regarding Brexit, US Election and referendums across Europe. Given this backdrop the portfolio was
defensively positioned.
The Sub-Fund performed fine in the first half, closing 1.1%* ahead of its benchmark. For the full year,
however, the Sub-Fund was hit by the perfect storm and underperformed its index by 12.8%*. A strong
sector rotation as inflation expectations rose alongside several stock specific issues. Most of the
underperformance came from allocation and currency effects rather than stock selection. More
specifically, the best preforming sectors in the benchmark were Energy and Materials, returning 26.4%
and 22.5% respectively, neither of which the Sub-Fund is invested in. The worst performing sectors in
the benchmark over the year were Health Care (-6.6%) and Consumer Staples (1.6%), both of which
the Sub-Fund was, and is, invested in.
In terms of attribution the best performing stocks were Reynolds American, Altria Group, Japan Tobacco,
Fresenius Medical Care and Equifax.
Reynolds is a US cigarette maker and a great example of a very well run, high quality compounder. The
company was bid for in October by BAT.
Also in the tobacco sector, Altria benefitted from the ABI and SAB merger, receiving $5.3billion in cash
and a 9.6% share in the newly formed company for its 27% stake in SAB.
Equifax provides information and analytical tools to businesses, governments and consumers. It has data on
91million businesses and 800million individuals worldwide. The company beat expectations every quarter
in 2016 as it continues to shift towards becoming a more diversified risk management solutions provider.
E.I. Sturdza Funds Plc
Investment Manager’s Report (continued)
for the year ended 31 December 2016
Strategic Global Quality Fund (continued)
34
PORTFOLIO STRATEGY (CONTINUED)
Fresenius Medical Care runs around 3,579 small dialysis centers worldwide. Their revenues are highly
recurring as patients often live close to their dialysis centers and become a part of that community. With
high single digit topline growth and mid-teens EBIT margins
The bottom five contributors to performance for 2016 were H&R Block, KAO Corp, Qiagen, Smith &
Nephew and Heineken Holding.
The competitive pressure were greater that anticipated with regards to H&R Block and therefore the
position was closed.
The position in Qiagen has also been exited. Qiagen issued a profit warning in early January after half of the
programs within their companion diagnostics franchise were delayed or discontinued in Q4 2015.
Smith & Nephew saw significant management change as the CEO sadly became ill and the CFO left for
Burberry. The shares subsequently recovered but were then hurt by the sector rotation in the second half of
the year. The Sub-Fund still holds a position in Smith and Nephew.
Heineken suffered due to the sector rotation which took place in the second half of the year. Heineken is
continuing to improve its offering whilst managing its cost base and as such the investment case is
unchanged. The Sub-Fund still has a position in Heineken.
MARKET OUTLOOK
The Investment Adviser remains concerned about global volatility for 2017. It seems clear that it will
be another year driven by politics. The President-elect in America has yet to take office, time will tell
which policies he will focus on and over what timeframe he will likely be able to implement them. In
Europe investors will be concerned by events including the Dutch elections in March, the French
presidential elections in April/May, the German elections likely to be in October and the possibility of
an early Italian election. Populist party support in France and Germany has recently been around 30%
and 12% respectively, as such they cannot form parties on their own but it is clear that the political
momentum in Europe is with those seeking change. Most pressing of all for Europe will be the UK
triggering Article 50 by the end of March. There continues to be significant uncertainty regarding what
sort of exit the UK will have from the EU and the potential economic challenges both sides of the
discussion will face as a consequence.

E.I. Sturdza Funds Plc
Investment Manager’s Report (continued)
for the year ended 31 December 2016
Strategic Global Quality Fund (continued)
35
MARKET OUTLOOK (CONTINUED)
More positively the Investment Adviser is now broadly seeing economic data improve in both Europe
and the US. This bodes well for companies in the Sub-Fund. When the markets are moved by the
macro rather than the companies this will tend to present investment opportunities for those with a
long-term view prepared to look through the noise. The Investment Adviser is looking forward to
investing in 2017.
Going forward the Sub-Fund will focus on Europe and the US.
Lofoten Asset Management Limited
E.I. Sturdza Strategic Management Limited
January 2017
*Refers to Institutional Share Class
E.I. Sturdza Funds Plc
Investment Manager’s Report (continued)
for the year ended 31 December 2016
Strategic European Smaller Companies Fund
36
The Investment Manager’s report has been compiled with the assistance of the Investment Advisers, Pascal
Investment Adviser SA (Non-discretionary adviser).
FUND PERFORMANCE
During the covered period, the net asset value per share of the EUR class increased by EUR 134.32 from EUR
993.04 to EUR 1’127.36, a total return of +13.53%. The STOXX 600 Total Return Index increased by +0.67%
over the same period leading to a 12.74% annual outperformance.
The Sub-Fund outperformed its benchmark for 10 months out of 12. More importantly, it outperformed its
benchmark for every single quarter and as a consequence for each semester as well. The outperformance comes
from the fact that the Sub-Fund managed to limit its decline to 33% of the benchmark’s drawdown in the first
semester and captured 163% of the second half’s upturn.
The +13.53% performance can be divided between +17.04% of gross portfolio performance and -3.51% of fees
and expenses.
At the individual stock level, the biggest contributors to performance during the period were Aubay (+1.53%
contribution to the performance), Jacquet Metal Services (+1.37%) and Trigano (+1.37%) while the most
important detractors were Fermentalg (-1.04%), Norma (-0.67%) and Beneteau (-0.50%). Out of the 41
positions held by the Sub-Fund during the period: 32 of them were profitable (+20.41% contribution) this year
and 9 of them were loss making (-3.27% contribution) leading to a profitability ratio of 78%.
The Sub-Fund was launched on May 5th, 2015. As such, the first anniversary was celebrated in the course of
the second calendar quarter this year. Since inception, the Sub-Fund’s performance was +12.74% and
compares favorably versus the Sub-Fund’s benchmark index, STOXX 600 Total Return Index, which declined
by 3.45%, translating into an 16.19% outperformance over close to 20 months.
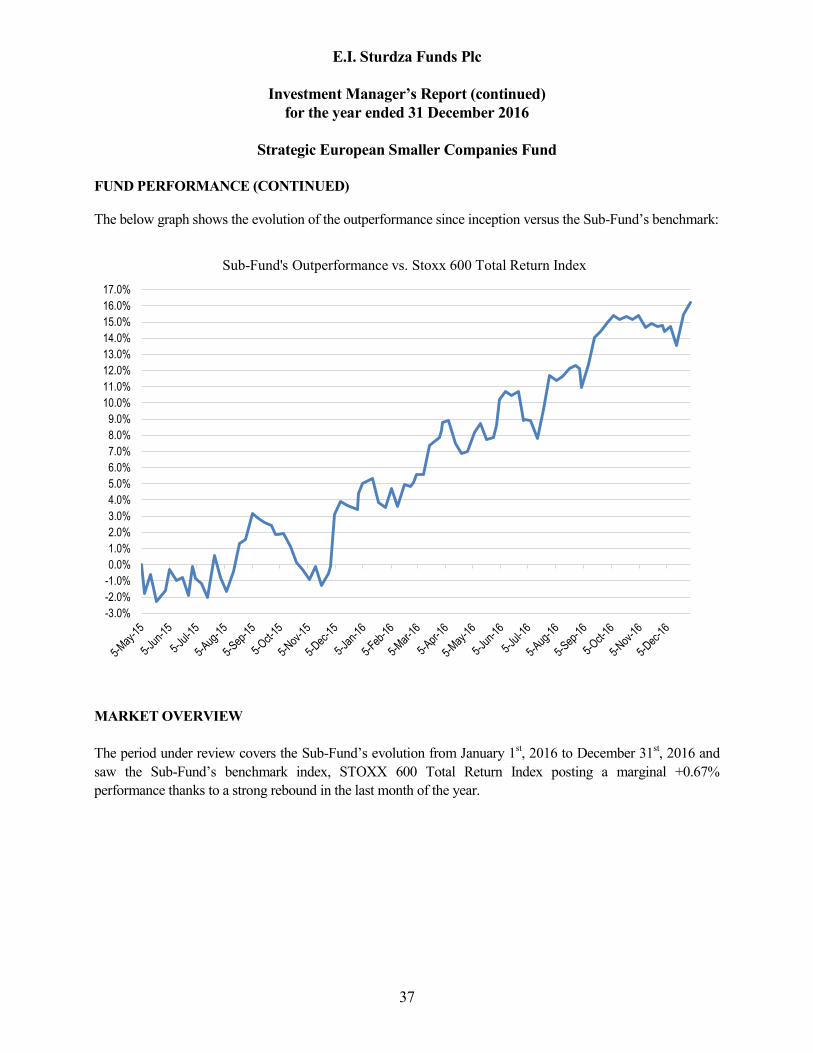
E.I. Sturdza Funds Plc
Investment Manager’s Report (continued)
for the year ended 31 December 2016
Strategic European Smaller Companies Fund
37
FUND PERFORMANCE (CONTINUED)
The below graph shows the evolution of the outperformance since inception versus the Sub-Fund’s benchmark:
MARKET OVERVIEW
The period under review covers the Sub-Fund’s evolution from January 1st, 2016 to December 31
st, 2016 and
saw the Sub-Fund’s benchmark index, STOXX 600 Total Return Index posting a marginal +0.67%
performance thanks to a strong rebound in the last month of the year.
-3.0%
-2.0%
-1.0%
0.0%
1.0%
2.0%
3.0%
4.0%
5.0%
6.0%
7.0%
8.0%
9.0%
10.0%
11.0%
12.0%
13.0%
14.0%
15.0%
16.0%
17.0%
Sub-Fund's Outperformance vs. Stoxx 600 Total Return Index

E.I. Sturdza Funds Plc
Investment Manager’s Report (continued)
for the year ended 31 December 2016
Strategic European Smaller Companies Fund
38
MARKET OVERVIEW (CONTINUED)
The year was divided in two parts, coinciding exactly with the two semesters. The first semester was heavily
down (-8.81%) followed by a sharp upturn (+10.40%) in the second one. Chinese slowdown and Brexit fears
were the main reasons for the weak development at the beginning of the year. The outcome of the US elections
was the biggest piece of news of the latter part of the year.
Contrary to what market participants might have anticipated, it triggered a stock market rally coupled with
significant rotations between asset classes and sectors. After the facts, it appears that many investors were
patiently holding off investing prior to the elections results. Investors’ reallocation towards risk assets resumed
after the US elections in spite of the Italian referendum results.
PORTFOLIO STRATEGY
The investment strategy deployed by the Investment Adviser remains unchanged and relies on the belief that,
over time, a company’s stock price converges with the company’s intrinsic value, such a value being
determined through an analysis of the discretionary free cash flows that the business generates, based upon
normalized margins and normalized return on capital employed. Our screening concentrates on companies with
understandable businesses and predictable earnings and cash flow streams. One of the consequences of this
strategy leads to structural and permanent underweighting in some sectors being financials, real estate,
pharmaceuticals and commodity related companies.
The Investment Adviser believes that holding positions in fewer stocks allows its “best ideas” to have a
meaningful impact on the Sub-Fund’s performance. Accordingly, the portfolio might typically include
approximately 30 stocks.
As of December 31st, the five biggest holdings of the Sub-Fund were:
1. Spie (France) 4.34%
2. Tarkett (France) 4.11%
3. Norma (Germany) 4.05%
4. SAF-Holland (Germany) 3.91%
5. Jacquet Metal Services (France) 3.90%
Another aspect of the strategy is based on disciplined investing i.e. the ability to wait patiently for the market to
present opportunities in order to deploy capital in great businesses at appropriate discount to their intrinsic
value. The market downturns in the first two months of the year and in June proved to be a good example of
that strategy and enabled the Sub-Fund to initiate new positions at very attractive levels. 13 new positions were
initiated this year and 7 investments were exited, increasing the number of positions to 33 at year end.

E.I. Sturdza Funds Plc
Investment Manager’s Report (continued)
for the year ended 31 December 2016
Strategic European Smaller Companies Fund
39
MARKET OUTLOOK
With the Italian referendum behind us now, financial markets have demonstrated this year, on several
occasions, their ability to cope with unexpected and disruptive events. Global activity had been accelerating for
months and economic conditions across the world seems to be in fact fairly positive, leaving us comfortable
with the global macroeconomic picture. In the Eurozone, the recovery remains on track and exporting
companies should benefit from the Euro weakness for the months to come.
Looking ahead, 2017 should mark the end of an era with unconventional monetary policies across the globe, no
inflation and a zero or negative interest rate environment. As a consequence, riskier asset classes should be
favored and equity markets mechanically benefit from that change of paradigm, notably the European equity
space that suffered its longest net outflow streak since 2012.
The investment Adviser shall continue to deploy the Sub-Fund’s assets with discipline and selectivity.
Pascal Investment Advisers SA
E.I. Sturdza Strategic Management Limited
January 2017

E.I. Sturdza Funds Plc
Investment Manager’s Report (continued)
for the year ended 31 December 2016
Strategic Quality Emerging Bond Fund
40
The Investment Manager’s report has been compiled with the assistance of the Investment Adviser, Banque
Eric Sturdza SA (Discretionary adviser).
FUND PERFORMANCE
The Sub-Fund was launched on 28 April 2016. For the period from inception to October 2016 performance
reached unexpected levels, outperforming the benchmark by 1.91% over this period, which was unexpected
due to the initial construction phase of the Sub-Fund. This was attributed to the rally of US treasuries
(underlying USD yields) and the behavior of emerging bond spreads. In November, the performance was
impacted by Mr. Trump’s presidential election victory as Treasury and emerging spreads volatility increased.
In December, both spreads and rates stabilized and initiated a strong recovery.
Since the Sub-Fund inception date, the returns of each class for the period ended December 30th, were as
follows:
+0.71% (USD share class) vs +1.81% for the benchmark (ICE LIBOR 3MTH USD +2%)
-2.77% (USD Institutional share class)*
-0.59% (EUR share class) and -0.23% (EUR Institutional share class)
-0.86% (CHF share class)
*Inception date 22.09.2016
MARKET OVERVIEW (FROM JANUARY TO DECEMBER 2016)
In January, all eyes were focused on any bad news that could deteriorate the political and economic
climate in 2016: fears of a hard landing in China (and renminbi devaluation), negative rates in Japan, oil
prices and commodity prices in general, Emerging markets, the (too hawkish) Fed but also Brexit, Spain
(with no Government), migrants in Europe, turmoil in Brazil, Donald Trump and Italian banks. The BoJ
took the market by surprise, adopting a negative interest rate policy but other Central Banks did not
change their key rates and policies. In Europe, Mr. Draghi said that the ECB program would be reviewed
in March with “no limits” on how far they could go.
In February, concerns about a possible Brexit impacted the GBP bond market (both yields and currency),
uncertainty about the size of Italian banks’ non-performing loans and about the exposure to the oil & gas
sector in European banks balance sheet led to a drop of subordinated bank debt (including CoCos).
Regarding Central banks activity, the Fed stayed in “wait and see” mode. Mrs. Yellen said that due to
economic conditions, only gradual increases would be implemented. She added that it was not necessary
to cut rates but in saying that, she gave substance to the thesis that it was a possible scenario in the
coming months.
In March, the major event and driver of the behaviour of financial markets, was the ECB’s meeting on
March 10th. In the global bond market, concerns about a possible Brexit, US Presidential election and
political turmoil in Brazil had a less pronounced impact. However, the strong rebound of oil prices, from
$33.70 to $38.30 helped the recovery of risky asset markets to the detriment of safe havens.

E.I. Sturdza Funds Plc
Investment Manager’s Report (continued)
for the year ended 31 December 2016
Strategic Quality Emerging Bond Fund (continued)
41
MARKET OVERVIEW (FROM JANUARY TO DECEMBER 2016) (CONTINUED)
As expected, the ECB did not miss its target with an expanded QE (EUR 80 billion / month instead of 60)
open to corporate bonds purchases, a deposit rate decreased to -0.4% (from -0.3%) and a new TLTRO,
which was probably the less commented measure but the most important. The expanded APP (Asset
Purchase Program) added private corporate bonds (CSPP, Corporate Sector Purchase Program) to
government-owned corporates (known as PSPP, Public Sector Purchase Program). In the US, Mrs Yellen
said that the Fed should “proceed cautiously”.
The US Central bankers were still in “wait and see” mode: they were convinced that the pace of the
domestic economy deserved a rate hike but they had difficulties to analyse the potential impact of a
weaker global growth (first and foremost in China) on the behaviour of the US economy.
In April, concerns about Brexit and Greece in Europe combined with the US Presidential election and
Dilma’s probable impeachment in Brazil were among the key drivers of the markets, but with a less
pronounced impact than the pursuit of the strong rebound of oil prices, from $38.30 to $45.90. Central
Banks did not change their monetary policies. In the US, the Fed left its rate unchanged but opened the
door to raising interest rates in June thanks to an improvement in global financial markets.
In May, markets seemed to hold their breath before a busy and hectic month of June. In the US, Ms
Yellen’s speech pointed out improvements in the US economy, confirming that the Fed was open to
raising rates soon. In Europe, concerns about Brexit rose sharply. In this environment, oil prices
continued to climb, from $45.9 to $49.1 while gold fell sharply (-6%) from $1,293 to $1,213 an ounce. In
the US, the economy seemed to gain momentum and the release of minutes from the FOMC meeting in
April showed that the Fed was ready to raise interest rates at every meeting including on June 15th. In
June, Brexit led to a flight to quality towards US Treasuries and Bunds. At the same time, low quality
debt such as high yield and deeply subordinated bank debt fell sharply, in line with equity markets. The
other major event was the poor number of 38,000 jobs created in the US, the smallest number in five
years. As a result, market participants decreased dramatically the probability of a Fed rate hike in July and
after Brexit, they started to price in (up to 20%) a possible rate cut in December! In Europe, as expected,
the ECB started its CSPP program on June 8th. At the same time, peripheral banks (Spanish and Italian)
became the biggest borrowers of the TLTRO program.
In July, risky assets recovered strongly as the slowdown due to the Brexit did not yet materialize. In line with
equity markets, low quality debt as high yield and deeply subordinated debt rebounded following their post-
Brexit sharp correction. In this context, IG Corporates, US Treasuries and Bunds managed also to perform
well. In the US, 287,000 jobs were added in June, easing concerns after last month’s poor number. Globally
US Data was better than expected with housing momentum and confidence continuing to point up. As a result,
market participants cancelled the probability of a Fed rate cut in December and started to price in a possible
rate hike (up to 35%) before the end of the year.

E.I. Sturdza Funds Plc
Investment Manager’s Report (continued)
for the year ended 31 December 2016
Strategic Quality Emerging Bond Fund (continued)
42
MARKET OVERVIEW (FROM JANUARY TO DECEMBER 2016) (CONTINUED)
In Europe, as expected, the ECB left monetary policy unchanged but remained ready to increase stimulus
should economic forecasts dramatically change following UK Referendum. Any expansion of the current
Asset Purchase Programme (APP) would need changes in bonds eligibility rules given ultra-low yields
environment. The BoE didn’t cut rates but offered additional liquidity operations and reduced capital
requirements.
In August, macroeconomic data was strong in Europe and in the US. In the Eurozone, the PMI index showed a
recovery confirmed by the unemployment rate which reached 10.1%, the lowest in five years. Some
disappointing data in southern Europe was offset by the French recovery. In the US, job creations reached
255k this month and hourly average earnings rose to 2.6% annualized (a major indicator of future inflationary
pressures). Home sales were encouraging and home construction reached its highest level in five months. As a
consequence, market participants were waiting impatiently for the Central bankers meeting in Jackson Hole in
order to dispel prevailing doubts about their monetary policies and first and foremost Ms Yellen’s speech as
the Fed had the most unclear or unpredictable behaviour. This indicates clearly that nobody really knew in
which direction the macroeconomic environment was moving, including the FOMC members! In Emerging
markets, inflows accumulation and risk appetite continued to drive the market as the Fed monetary policy
normalization process was considered by the market to remain slow and prudent. In Brazil, as expected,
President Dilma Rousseff was removed from office as more than two-thirds senators voted for impeachment,
leaving its successor the task of implementing difficult reforms to rescue the economy from recession. With
positive technical factors and stable commodity prices, major credit markets performed well during the month
with Turkish assets retracing most of the correction linked to the July Turkish Coup Attempt.
In September, markets were driven by China (non-performing loans), Japan (the slope of the yield curve
managed by the BoJ), the US presidential election and the drop of Deutsche Bank shares (fears about the
future of the European banking sector, mostly German and Italian). Macroeconomic data was strong in Europe
and softer in the US. In the Eurozone, the Q2 GDP reached +0.3% and confidence indicators improved. In the
US, the ISM indicators (both manufacturing and non-manufacturing) decreased and job creations reached
151k instead of 180k expected by the consensus. Consequently, the Fed voted 7-3 to leave its rates unchanged
and the ECB did not modify its policy. Regarding other major Central Banks, another BoE rate cut was
considered likely in the United Kingdom and a new wave of unconventional easing possible in Japan. The
main concern had already been mentioned by the Investment Adviser last month: the 3 month US$ Libor had
already increased by 25 bps and a Fed rate hike would only be a readjustment of official key rates with the
level of money market rates. This $ Libor increase was not anecdotal at all. Corporate loans and mortgages in
USD were increasing; the cost of a currency hedging had already increased (2% to hedge the USD against the
CHF) and the cost of leverage for banks and hedge funds was higher. As a result, negative flows affected the
US Treasury curve and should this trend continue, it would become unsustainable. In this environment, a Fed
rate hike becomes less relevant than money market rates evolution.

E.I. Sturdza Funds Plc
Investment Manager’s Report (continued)
for the year ended 31 December 2016
Strategic Quality Emerging Bond Fund (continued)
43
MARKET OVERVIEW (FROM JANUARY TO DECEMBER 2016) (CONTINUED)
In October, markets had been driven by the US presidential election, the probable Fed rate hike in December
and the incredible rumour of tapering in Europe. Macroeconomic data was stronger in the US, led by
consumer spending, labour market (both employment and wage growth), industrial production and residential
real estate. In Europe, two major sets of economic data gave the impression that the situation was improving:
the Spanish unemployment rate decreased below 20% for the first time in six years and the German Ifo index
reach a two-year high. Consequently, the Fed was supposed to raise its Fed fund rate on December 14th
even
though there was a FOMC meeting on November 2nd
(considered too close to the Presidential election). In
Europe, an incredible rumour affected the bond market. The ECB would consider a tapering of its QE. Some
ECB members contradicted this rumour that led to a jump in the euro and Bund yields. The official version of
the ECB continued to be that they were open to further stimulus. In the meantime, they took advantage of this
correction to purchase short term bonds which climbed above the deposit rate.
In November, markets were driven by the US presidential election outcome and the victory of Donald Trump.
Against all odds, stocks rallied and safe havens such as gold and bonds underperformed dramatically. The
most frequent argument that explains this behaviour is that Mr Trump’s policy would spur growth and favour
inflation. Mr Trump’s program contains many uncertainties: what exactly is this program? Will it be
implemented? After how many years will the first results be seen? Will the majority of the Republicans at the
Congress vote for some controversial measures? It is too early to develop a new economic scenario and the US
economy will not change dramatically in the coming weeks or months.
Just after the announcement of Trump’s victory, the markets’ behaviour was logical: a Treasury rally (30y at
2.52%), gold above 1330, Swiss franc rally reaching 0.9550 against USD, S&P future limit down (-5%). Then,
all of these markets turned, equities rallied substantially and safe havens started a decrease. In this
environment, the only behaviour which seemed “normal” was the drop of some Emerging currencies (the
Mexican peso being the most emblematic) and the widening of Emerging market bond spreads. This Treasury
sell-off had been massively amplified by the record volumes of transactions. The decrease of the bond markets
(i.e. the increase of bond yields) can be explained by the accumulation of massive sell orders. Initially, market
participants thought that these orders came from China but once analysed the origin of these trades showed
that Hedge Funds and CTAs were the leaders of this market action and that high-frequency trading was
primarily responsible for the amplification of the sell-off.
E.I. Sturdza Funds Plc
Investment Manager’s Report (continued)
for the year ended 31 December 2016
Strategic Quality Emerging Bond Fund (continued)
44
MARKET OVERVIEW (FROM JANUARY TO DECEMBER 2016) (CONTINUED)
In December, markets had been driven by the two major Central Banks meetings, the FOMC and the ECB. In
the US, the Fed raised its Fed Fund rate to 0.5%-0.75%. This decision was unanimous for the first time since
July and was responding to the strength of the labour market and economic growth. In addition, the Fed
mentioned that inflation expectations had risen “considerably”. In Europe, the ECB extended its QE program
until (at least) the end of 2017 but will reduce its asset purchases from 80 to 60 billion EUR after March.
Sovereign bonds yielding below -0.4% and bonds maturing below two years will be included in the purchase
list. This was clearly an increase of the QE (60x9= 540 billion EUR instead of 80x6=480 expected) but the
markets responded badly the decrease of monthly purchase. This month, US economic indicators showed that
growth was rising from modest to moderate, employment was still expanding and the housing sector continued
to show signs of improvement. On another hand, consumption indicators were disappointing and the strength
of the US Dollar was mentioned as a threat by the Fed in its beige book. The European economy was still
improving as consumption, business confidence; consumer confidence and unemployment suggest an
improvement in the pace of the recovery. But inflation remains too low. After November was dominated by
the outcome of the Presidential election in the US, all eyes were focused on Europe this month. As expected, in
Italy, Matteo Renzi lost his referendum and resigned.In France, Mr. Hollande decided not to stand again for
election as President in May. In terms of rescue plans, the Greek short-term debt relief has been frozen by the
Eurogroup Finance Ministers and the ECB announced that the amount of capital needed by Monte dei Paschi
to avoid bankruptcy was 8.8 billion EUR instead of 5! Outside Europe, the main event was the OPEC
agreement on November 30th to cut the output (up to 1.8 million barrels/day), leading to a jump of oil prices
from $45 to $55 in December.
In this context, the German 2y yield decreased from -0.35% to -0.80% (-45bp), the 5y yield from - 0.05%
to -0.54% (-50bp) and the 10y Bund yield from +0.63% to +0.2% (-42bp). With increasing concerns
about risks surrounding Italian politics and fragile economic recovery, Italian 10y yield increased from
1.60% to 1.82% (+22bp). Spanish 10y yield was more resilient, decreasing from 1.77% to 1.38% (-39bp).
In the US, the 2y US Treasury yield increased from 1.05% to 1.19% (+14bp), the 5y yield from 1.76% to
1.93% (+17bp), the 10y from 2.27% to 2.45% (+18bp) and the 30y long bond from 3.02% to 3.07%
(+5bp). On the credit side, the European iTraxx Main decreased from 77 bps to 72 bps (Post-Brexit banks
and cyclicals spreads widening having largely recovered the following months) while the US corporate
CDX index decreased from 88 bps to 68 bps.In Emerging Markets, the CDX 10y EM index spread
tightened dramatically from 369 bps to 286 bps (-83 bps) finishing the year 2016 tighter than on the eve of
the Presidential election!
PORTFOLIO STRATEGY
Since the inception of the Sub-Fund on April 28th with USD 35 million, the size of the Sub-Fund increased
progressively to reach USD 52 million at the end of December as some investors switched from lower beta
bond funds into this more attractive yielding fund despite more risk and more volatility. Since the launching,
the Investment Adviser managed the portfolio with a cautious stance. The number of issuers bought in order to
provide sufficient diversification was maintained around 35 along the year. In terms of geographical
breakdown at the end of the year, the top 3 countries were Russia (19.2%), Brazil (10.8%) and India (8.2%),
Turkey exposure being reduced following the Turkish coup attempt in July. Along the year, inflows were
mostly invested with an objective of reducing spread volatility and lowering the risk profile. As a result, the
top 3 sectors were Governments (32.7%) followed by Materials (18.3%) and Energy (18.0%), with a rating
allocation of 47.7%
E.I. Sturdza Funds Plc
Investment Manager’s Report (continued)
for the year ended 31 December 2016
Strategic Quality Emerging Bond Fund (continued)
45
PORTFOLIO STRATEGY (continued)
BB, 45.8% BBB and 4.8% A-AA (and 1.7% cash). The Modified Duration reached a peak at 6.4 in October
before being decreased to 5.8 in November.
In June, the Investment Adviser sold African Export-Import Bank 2021 and partially switched Gazprom
2034 into Vnesheconombank 2025. The weight of Export Credit Bank of Turkey 2019, Turkiye Garanti
Bankasi 2022 and State Oil Co. of Azerbaijan 2023 were increased. In terms of geographical breakdown,
the top 3 countries remained Russia (18%), Turkey (17%) and Brazil (9%). The top 3 sectors were now
Government (32%), Energy (18%) and Basic Materials (13%), and the rating allocation was 54% BB,
36% BBB and 3% A (and 7% cash). The modified duration slightly decreased to 5.8 at month end.
In July, the Investment Adviser switched out of BNDES 2020 and Croatia 2021 on downgrade risks
perspectives. Following the Turkish coup attempt, the entire exposure to Export Credit Bank of Turkey,
Turkiye Garanti Bankasi 2022 was sold and the weight of Anadolou Efes 22 and Turkcell 2025 was reduced.
Proceeds and inflows were mostly invested in A-BBB issuers with an objective of reducing spread volatility
and lowering the risk profile: Development Bank of Kazakhstan 2022, State Oil of the Azerbaijan 2023,
Hungarian Development Bank 2020, Poland 2026, Export-Import Bank of India 2023, Romania 2024,
Azerbaijan 2024, Namibia 25 vs Namibia 21, China Development Bank 2026, Lithuania 2020, MMC Norilsk
Nickel 2022. In terms of geographical breakdown, the top 3 countries were Russia (16.9%), Brazil (7%) and
Hungary (6.2%). The top 3 sectors were Government (40.7%), Energy (16.5%) and Basic Materials (12.6%).
The rating allocation was 44.9% BB, 35.9% BBB, 3.8% A and 7.4% AA (and 8% cash). The modified
duration reached 6.04 at month end.
In August, the assets under management of the Sub-Fund climbed significantly to reach $50 million. Due to
the strong rally that took place year to date, the Investment Adviser took the decision to keep a substantial
amount in cash (almost 6%) and partially invest this new money in the safest names, such as Lithuania and
China Development bank. A small position in Tencent 2020 was also purchased. The weight of the existing
investments in Norilsk nickel, Severstal, Eskom, Pertamina, Bharti Airtel, Namibia, Anglogold, State oil Co.
of Azerbaijan, Pemex and Tata motors was increased. In terms of geographical breakdown, the top 3 countries
were Russia (17%), India (7%) and Brazil (6%). The rating allocation was 48% Investment Grade and 46%
Crossover (BB+ and BB). The breakdown of the portfolio in terms of market allocation was 90% Emerging
Markets, 4% Developed Markets (US Treasuries) and 6% cash. In terms of sector allocation, the Investment
Adviser favoured Corporates (52%) followed by Sovereign & Government Agencies (40%) and Financials
(only 2%). In reality, in terms of risk, this allocation to corporates is lower as most of these companies are
partially or totally government-owned. The modified duration stayed around 6 during the month.
In September, the assets under management of the Sub-Fund climbed significantly from $50 to $55 million.
Due to the strong rally that took place year to date, the Investment Adviser took the decision to keep a
substantial amount in cash (almost 6%) and to increase slightly the weight of US long bonds simultaneously
with the same purchase for Strategic Global Bond Fund ($1 million, half in TIPS 2043, half in US Treasury
2046). The Investment Adviser increased the weight of the following holdings: Anglogold 2022, Norilsk
1Nickel 2022, Namibia 2025, Bharti Airtel 2024, Tata Motors 2020, Grupo Bimbo 2044 and Sberbank 2019.
It also added a new name in the portfolio: Suzano 2026, a BB+ rated Brazilian pulp and paper producer. In
terms of geographical breakdown, the top 3 countries were Russia (17.1%), Brazil (8.6%) and India (8.0%).

E.I. Sturdza Funds Plc
Investment Manager’s Report (continued)
for the year ended 31 December 2016
Strategic Quality Emerging Bond Fund (continued)
46
PORTFOLIO STRATEGY (continued)
5.9% cash. In terms of sector allocation, the Investment Advisor favoured Governments (39.6%) followed by
Materials (16.3%) and Energy (14.6%). The modified duration reached 6.4 during the month.
In October, the assets under management of the Sub-Fund climbed from $55 to $57 million. The Investment
Adviser increased the weight of the following holdings: Sberbank 2019, Mol 2019, Tencent 2020, Romania
2024, Codelco 2025, Namibia 2025 and Gazprom 2034. It also added a new name in the portfolio: BRF 2024,
a Ba1/BBB rated Brazilian food producer (mainly meat, poultry and pork but also pizza, pasta and frozen
vegetables). In terms of geographical breakdown, the top 3 countries were Russia (18.3%), Brazil (10.0%) and
India (7.6%). The rating allocation was 46.9% Investment Grade and 49.9% Crossover (BB+ and BB). The
breakdown of the portfolio in terms of market allocation was 92.4% Emerging Markets, 4.4% Developed
Markets (US Treasuries) and 3.2% cash. In terms of sector allocation, the Investment Advisor favoured
Governments (37.6%) followed by Materials (16.6%) and Energy (15.9%). The modified duration stayed
around 6.4 during the month.
In November, the Investment Adviser increased the weight of Mol 2019 and sold the whole position in Eskom
2021 due to a possible lack of support of the South-African government that could lead to a multiple-notch
downgrade. A small position ($ 1 million) in 30y US Treasury was sold at 2.84% (stop-loss level). In terms of
geographical breakdown, the top 3 countries were Russia (18.8%), Brazil (10.1%) and India (7.7%). The rating
allocation was 45.8% Investment Grade and 49.2% Crossover (BB+ and BB). The breakdown of the portfolio
in terms of market allocation was 92.3% Emerging Markets, 2.7% Developed Markets (US Treasuries) and
5.0% cash. In terms of sector allocation, the Investment Adviser favoured Governments (34.0%) followed by
Energy (17.0%) and Materials (16.9%). The modified duration decreased from 6.4 to 5.8 during the month.
In December, the Investment Adviser sold the remaining position in 30y TIPS and slightly decreased the
positions in two Russian issuers, Gazprom and VnesheconomBank as their weight reached 5%. In terms of
geographical breakdown, the top 3 countries were Russia (19.2%), Brazil (10.8%) and India (8.2%). The rating
allocation was 50.4% Investment Grade and 47.3% Crossover (BB+ and BB). The breakdown of the portfolio
in terms of market allocation was 97.7% Emerging Markets and 2.3% cash. In terms of sector allocation, the
Investment Advisor favoured Governments (32.7%) followed by Materials (18.3%) and Energy (18.0%). The
modified duration increased slightly from 5.8 to 5.9 during the month. In terms of portfolio diversification, the
Sub-Fund held 35 issues from 35 different issuers.
MARKET OUTLOOK
Regarding Europe, the Investment Advisor believes that the ECB will stay ultra-accommodative in the
coming months, especially after Brexit. Mr Draghi will not hesitate to implement other non-conventional
measures if needed. The economic conditions are slightly improving in the Eurozone but not enough to
prompt the ECB to modify its policy and Bund yields to climb substantially. The problem is still low
inflation and Mr Draghi has announced a decrease of his inflation forecast in 2018 to 1.8%, still below the
ECB target of 2%.

E.I. Sturdza Funds Plc
Investment Manager’s Report (continued)
for the year ended 31 December 2016
Strategic Quality Emerging Bond Fund (continued)
47
MARKET OUTLOOK (CONTINUED)
It means that “Super Mario” admits implicitly that the ECB will not reach its goal during the two coming
years. Regarding the Fed’s policy, the behaviour of the FOMC in 2016 is still unclear: inflation is low but
will increase gradually (due to the base effect after the sharp decrease of oil prices in 2015), oil prices
seem to stabilize around $45, international issues are unclear (Brexit today but do not forget China) and
the Fed is still expecting more rate hikes than the market. The Investment Adviser still believes that there
will be no more than one rate hike this year and that the probability of a rate cut in December will
increase gradually (simultaneously with the probability of a recession in 2017). Emerging Markets will
stay volatile but the current environment, with low yields in the US, Europe and Japan, higher
commodities and oil prices, stabilisation of emerging currencies and a “not-too-hawkish” Fed leave room
for further spread tightening.
Banque Eric Sturdza SA
E.I.Sturdza Strategic Management Limited
January 2017

E.I. Sturdza Funds Plc
Investment Manager’s Report (continued)
for the year ended 31 December 2016
Strategic Beta Flex Fund
48
The Investment Manager’s report has been compiled with the assistance of the Investment Adviser, Sofia
Gestione del Patrimonio Sgr (Italy) (Non-discretionary adviser).
FUND PERFORMANCE
The Sub-Fund launched at the end of 2016, on 23 December. As such, no performance review has been
included.
MARKET OVERVIEW
Last year was characterized by two very distinct phases, the first two months saw the fall of the stock markets
due to the fears of a hard landing of the Chinese economy, followed by a slow recovery which gradually
gained traction, with sustained volatility from time to time. 2016 was full of very important political events
with unexpected outcomes: it turned out that all the events that the consensus judged as “worst case scenario”
produced unexpectedly positive market dynamics.
From the political point of view, “Brexit” and the election results in the United States are the direct
consequence of a growing intolerance for the consequences of globalization. In the Eurozone periphery the
inefficiency of austerity policies allowed the spread of an increasingly “anti – Euro” feeling.
In 2016 a true revolution was experienced, with the recurring themes that characterised the last few years
coming to an end. The Central Banks moved towards a new path and language, giving up on the negative rates
policy and focusing instead on how to drop out of the huge package of unconventional policies they had put to
work.
All these factors, together with the changes potentially introduced by Trump policy, led to a violent sector
rotation and to a hint of global rebalancing of investments in stocks and bonds, showing how unbalanced the
risk / reward ratio on the bond markets had been.
MARKET OUTLOOK
In 2017 the context is still positive for the equity markets for many reasons: first of all the monetary policies
will remain generally accommodative; and secondly, there is still not enough of a tightening effect from rates
and inflation. When short-term US rates exceed certain thresholds, it will be particularly critical due to the late
stage of the economic cycle. A more defensive portfolio structure will be increasingly appropriate for the
second part of the year, as the financial markets may experience some stress and volatility.
Political risk has not fully vanished, the elections scheduled in France, Germany and Italy in 2017 could lead to
some volatility, but planning investments from a strategic point of view means analysing the economic context
and not focusing on the individual event, especially when talking about European politics, which is, by
definition, volatile.

E.I. Sturdza Funds Plc
Investment Manager’s Report (continued)
for the year ended 31 December 2016
Strategic Beta Flex Fund
49
MARKET OUTLOOK (CONTINUED)
The first part of the year could be interesting for equity investments and for risky assets in general, even with
the anticipated volatility. The revision of inflation expectations is the first positive driver for an equity
repricing, and a sustained rise of the risk-free yields will be very favourable for banking and insurance sectors,
both for equities and credit.
In the event of a positive global scenario, the European area could offer a benefit in relative terms. For
example, with a reduction of the political risk premium, there is the possibility for a repricing of the European
valuations and a convergence towards more global ones. In a still very problematic local landscape, with low
inflation and lacklustre growth and huge imbalances between "core" and periphery, the main support to the
potential upside of European equities will come from the global context. So, as long as the bullish driver
comes from outside Europe and as there are no clear sources of internal growth yet, it is desirable that
aggressive and effective fiscal policies are put in place as soon as possible, only of course, if the crowded
electoral agenda of 2017 will allow it.
The risks to this example are readily identifiable and help to create a positive outlook but with the possibility of
substantial increases in volatility during the year.
PORTFOLIO STRATEGY
The Investment Advisor expects that 2017 will show two different trends, one for each semester, so it is ready
to adopt two different approaches in the portfolio construction.
In the first semester both macro and behavioural analysis show very interesting targets for the Eurostoxx50
index, so it is estimated to be close to the maximum net exposure allowed. Even if the forecasted scenarios are
positive the Investment Adviser believes it will have to actively manage hedging, increasing it tactically from
time to time when the equity risk premium shrinks too much or when politics provokes an increase in
volatility.
Sofia Gestione del Patrimonio Sgr (Italy)
E.I. Sturdza Strategic Management Limited
January 2017

E.I. Sturdza Funds Plc
Directors’ Report
for the year ended 31 December 2016
50
The Directors submit their Annual Report and financial statements for the year ended 31 December 2016.
Activities, Business Review and Future Prospects
The Directors have directed the affairs of the Company in accordance with the Companies Act 2014. A
detailed business review is outlined in the Investment Manager’s Reports on pages 6-49. Significant
events during the year have been disclosed on page on 54-56, including the change in Administrator and
Depository during the year.
Risk Management Objectives and Policies
The information in relation to the use by the Company of financial instruments and the financial risk
management objectives and policies of the Company and the exposures of the Company to market risk
(currency risk, interest rate risk and price risk), liquidity risk and credit risk are outlined in Note 7 to these
financial statements.
Key performance indicators monitored by the Directors for each of the Sub-Funds include: NAV
timeliness; NAV accuracy; Reconciliations (Cash and Assets); and the Incidents and Errors log.
Results and Dividends
The results for the year are shown in the Statement of Comprehensive Income on pages 64-65. Please see
Note 12 of the financial statements for details of dividends approved during the year.
Directors
The Directors of the Company are detailed on page 2.
Directors’ Responsibility Statement
The Directors are responsible for preparing the Annual Report and the Company’s financial statements, in
accordance with applicable law and regulations.
Company Law requires the Directors to prepare financial statements for each financial year. Under that
law the Directors have elected to prepare the financial statements in accordance with International
Financial Reporting Standards (“IFRS”) as adopted by the EU and applicable law.
Under Company Law, the Directors must not approve the financial statements unless they are satisfied
that they give a true and fair view of the assets, liabilities and financial position of the Company and of its
profits for that year.
In preparing the financial statements, the Directors are required to:
select suitable accounting policies and then apply them consistently;
make judgments and estimates that are reasonable and prudent;
state whether the financial statements have been prepared in accordance with IFRS as adopted by the
European Union ("EU") and ensure that they contain additional information required by the
Companies Act 2014; and
prepare the financial statements on the going concern basis unless it is inappropriate to presume that
the Company will continue in business for a period of at least 12 months from 31 December 2016.
E.I. Sturdza Funds Plc
Directors’ Report (continued)
for the year ended 31 December 2016
51
Directors’ Responsibility Statement (continued)
The Directors are responsible for keeping adequate accounting records that disclose with reasonable
accuracy at any time the assets, liabilities, financial position and profit or loss of the Company and enable
them to ensure that its financial statements comply with the Companies Act 2014, the European
Communities (Undertakings for Collective Investment in Transferable Securities) Regulations, 2011 and
the Central Bank (Supervision and Enforcement Act 2013 (Section 48(1)) (Undertakings for Collective
Investment in Transferable Securities) Regulations 2015. They are also responsible for safeguarding the
assets of the company and hence for taking reasonable steps for the prevention and detection of fraud and
other irregularities. Under the Central Bank’s UCITS Regulations, the Directors are required to entrust the
assets of the Company to the Depository for safe-keeping. In carrying out this duty, the Company has
delegated custody of the Company’s assets to BNY Mellon Trust Company (Ireland) Limited of Guild
House, Guild Street, IFSC, Dublin 1, Ireland.
The Central Bank UCITS Regulations came into effect on 1 November 2015. The Central Bank UCITS
Regulations consolidate into one location all of the requirements which the Central Bank imposes on
UCITS, UCITS management companies and depositories of UCITS. They supplement existing legislative
requirements, in particular the Central Bank (Supervision and Enforcement Act 2013 (Section 48(1))
(Undertakings for Collective Investment in Transferable Securities) Regulations 2015 (the "Central Bank
UCITS Regulations").
The Directors are also responsible for preparing a Directors’ Report that complies with the requirements
of the Companies Act, 2014.
The Directors are responsible for the maintenance and integrity of the corporate and financial information
included on the Company’s website. Legislation in the Republic of Ireland governing the preparation and
dissemination of financial statements may differ from legislation in other jurisdictions.
Corporate Governance Statement
The Company is subject to compliance with the requirements of the Companies Act, 2014 and with, the
Central Bank UCITS Regulations, as applicable to the Company. The Company is not subject to the EC
(Takeover Bids (Directive 2004/25/EC)) Regulations 2006.
The European Communities (Directive 2006/46/EC) Regulations (S.I. 450 of 2009 and S.I. 83 of 2010)
requires the inclusion of a corporate governance statement in the Directors’ Report. Relevant information
on the Company’s governance arrangements for the year ended 31 December 2016 is set out below.
Presently, the Company is subject to corporate governance practices imposed by:
i) The Memorandum and Articles of Association of the Company;
ii) The Companies Act, 2014;
iii) The European Communities (Undertakings for Collective Investment in Transferable Securities)
Regulations, 2011 and the Central Bank UCITS Regulations issued by the Central Bank; and
iv) The Irish Stock Exchange (“ISE”) Code of Listing Requirements and Procedures.
Copies of all of the above are available for inspection at the Company’s registered office at 4th Floor, 76
Baggot Street Lower, Dublin 2, Ireland.
E.I. Sturdza Funds Plc
Directors’ Report (continued)
for the year ended 31 December 2016
52
Corporate Governance Statement (continued)
With effect from 1 January 2013, the Directors have adopted the Code on Corporate Governance for
Collective Investment Schemes and Management Companies published by the Irish Fund Industry
Association (the “IFIA Code”), following an assessment of the measures included in the IFIA Code as
being consistent with its existing corporate governance principles and procedures for the financial year.
This publication is available from the IFIA website (www.irishfunds.ie).
Internal control and risk management systems in relation to financial reporting
The Directors are responsible for establishing and maintaining adequate internal control and risk
management systems in relation to the financial reporting processes of the Company. Such systems are
designed to manage, rather than eliminate, the risk of error or fraud in achieving the Company’s financial
reporting objectives and can only provide reasonable and not absolute assurance against material
misstatement or loss.
The Board has procedures in place which are designed to ensure that all relevant accounting records are
properly maintained and are readily available, including production of annual and half yearly financial
statements. The Board has appointed the Administrator to maintain the accounting records of the
Company. The Administrator is authorised and regulated by the Central Bank and must comply with the
rules imposed by the Central Bank. From time to time, the Board of Directors receives reports with
respect to the Administrator’s financial accounting and reporting routines.
The annual and half yearly financial statements of the Company are produced by the Administrator and
reviewed by the Investment Manager. They are required to be approved by the Board and the annual and
half yearly financial statements of the Company are required to be filed with the Central Bank. As certain
shares in the Company are listed on the Irish Stock Exchange (ISE), the annual financial statements of the
Company are also required to be filed with the ISE.
The annual financial statements are required to be audited by an independent auditor who reports annually
to the Board on their findings. As part of its review procedures, the Board receives presentations from
relevant parties including consideration of IFRS accounting standards and their impact on the annual
financial statements, and presentations and reports on the audit process. The Board evaluates and
discusses significant accounting and reporting issues as the need arises.
Board composition and activities
The Directors of the Company meet regularly to review the business and affairs of the Company and they
also discuss and evaluate significant accounting and reporting issues as the need arises. The minimum
required number of Directors is two, which is also the minimum number of Directors required for a
meeting to take place. At year end there were four non-executive Directors, one of whom is independent
and three of whom do not hold an executive function with the Investment Manager or any of its affiliates.
One Director resigned effective 31 December2016. The Directors are listed on page 2.
The business of the Company is managed by the Directors, who are responsible for the Company’s
overall direction and strategy, including review of investment management performance, administration
of the Company’s Sub-Funds and compliance with the Company’s regulatory requirements. Custody of
the Company’s assets is maintained by an independent Depository, BNY Mellon Trust Company
(Ireland) Limited.

E.I. Sturdza Funds Plc
Directors’ Report (continued)
for the year ended 31 December 2016
53
Corporate Governance Statement (continued)
Board composition and activities (continued)
The Board meets at least four times a year, and more frequently if required, to review the operations of
the Company, address matters of strategic importance and to receive reports from the Administrator, the
Depository and the Investment Manager. During the financial year the Board met fourteen times. A
Director may convene a meeting of Directors at any time.
Questions arising at any meeting of the Directors are generally decided by consensus, but majority voting
can be used if necessary to reach a decision. If there are an equal number of votes for or against a
resolution the Chairman of the meeting can effectively decide the matter by exercising a second or casting
vote.
In accordance with the requirements of the Central Bank’s UCITS Regulations, all transactions carried out
with the Company by the Promoter, Investment Manager, Depository, Investment Advisers and
associates/group companies (“connected parties”) must be carried out as if negotiated at arm’s length and be in
the best interests of Shareholders. The Directors are satisfied that there are arrangements (evidenced by written
procedures) in place to ensure that the obligations set out in the UCITS Regulations are applied to all
transactions with connected parties and transactions with connected parties entered into during the period
complied with the obligations set out in UCITS Regulations.
Dealings with Shareholders
The convening and conduct of Shareholders’ meetings are governed by Irish company law and the
Memorandum and Articles of Association. Shareholders together holding 5 per cent or more in aggregate
of the shares of the Company in issue may at any time request that the directors convene a meeting of
Shareholders to consider any matters that may be proposed by the Shareholders requesting the meeting.
A meeting of Shareholders held in accordance with the provisions of the Memorandum and Articles of
Association may by a 75% majority of those voting approve a change to the Memorandum and Articles of
Association or a proposal to wind up the Company. A simple majority vote is required for most other
proposals, including proposals to determine that the Directors shall retire, or to terminate any of its Sub-
Funds, and any material change in the investment objective and policies or the investment restrictions set
out in the Prospectus issued by the Company.
Twenty one clear days’ notice at least of every meeting shall be given to Shareholders in the manner
provided in the Memorandum and Articles of Association. At any general meeting a resolution put to the
vote of the meeting shall be decided on a show of hands unless before or upon the declaration of the result
of the show of hands a poll is demanded by the Chairman or by at least two Members present in person or
by proxy or any Shareholder or Shareholders present in person or by proxy representing at least one tenth
of the Shares in issue having the right to vote at the meeting. Unless a poll is so demanded, a declaration
by the Chairman that a resolution has been carried, or carried unanimously, or by a particular majority, or
lost, or not carried by a particular majority, and an entry to that effect in the book containing the minutes
of the proceedings of the Company shall be conclusive evidence of the fact without proof of the number
or proportion of the votes recorded in favour of or against such resolution.
If a poll is duly demanded, it shall be taken in such manner and at such place as the Chairman may direct
(including the use of ballot or voting papers or tickets) and the result of a poll shall be deemed to be the
resolution of the meeting at which the poll was demanded.
E.I. Sturdza Funds Plc
Directors’ Report (continued)
for the year ended 31 December 2016
54
Compliance Statement
The Directors’ of the Company acknowledge their responsibility for ensuring the Company’s compliance with
relevant obligations. In doing so, they confirm that:
(i) A compliance policy statement has been prepared and approved by the Board
(ii) Appropriate arrangements and structures are in place to ensure material compliance with the
relevant obligations; and
(iii) A review of the effectiveness of the procedures and arrangements has been completed during
the year.
Principal risks and uncertainties
The Company is an umbrella fund with segregated liability between Sub-Funds. The principal risks facing
the Company relate primarily to the holding of financial instruments and markets in which it invests. The
most significant types of financial risks to which the Company is exposed are market risk, credit risk and
liquidity risk. Market risk includes other price risk, currency risk and interest rate risk. Details of the risks
associated with financial instruments are included in Note 7 to the financial statements.
Accounting records
The measures taken by the Directors to secure compliance with the Company’s obligation to keep
adequate accounting records are the use of appropriate systems and procedures and employment of
competent service providers. The accounting records are kept at SS&C Financial Services (Ireland)
Limited (formerly, GlobeOp Financial Services (Ireland) Limited), 1st Floor, La Touche House, IFSC,
Dublin 1, Ireland.
Legislation in the Republic of Ireland governing the preparation and dissemination of financial statements
may differ from legislation in other jurisdictions.
Directors’ and Secretary’s Interests in the Share Capital of the Company
The Company’s Secretary did not hold any interest, beneficial or otherwise, in the share capital of the
Company during or at the end of the year.
Directors’ interests are disclosed in Note 11.
Significant events during the year
The JPY Class A of the Nippon Growth (UCITS) Fund, which had previously been closed to
subscriptions, was reopened on 1 January 2016 for new investment, and the performance fee of the class
was reduced to 12.5 per cent effective from 1 January 2016.
In relation to the Strategic China Panda Fund securities that were suspended during 2015, Sound Global
Limited stock was sold on 22 January 2016. Sihuan Pharmaceuticals resumed trading on 29 February
2016 and was sold in April 2016.

E.I. Sturdza Funds Plc
Directors’ Report (continued)
for the year ended 31 December 2016
55
Significant events during the year (continued)
The CHF Institutional Class of Strategic Euro Bond Fund was delisted on 20 January 2016 as a result of
the share class being fully redeemed.
On 15 February 2016 Banque Baring Brothers Sturdza S.A. changed its legal and company name to
Banque Eric Sturdza S.A.
From 18 March 2016, UCITS V depository liability provisions became effective.
Two new Sub-Funds were launched during the year, Strategic Quality Emerging Bond Fund was
approved by the Central Bank of Ireland on 14 April 2016 and Strategic Beta Flex Fund was approved by
the Central Bank of Ireland on 12 December 2016.
On 1 July 2016, the performance fees payable to the Investment Manager across the Sub-Funds were
reduced as follows:
For Strategic China Panda Fund the performance fee reduced from 20 per cent to 10 per cent of
the relative outperformance for the USD Institutional Class, Hedged Euro Institutional Class,
Hedged Sterling Institutional Class and Hedged CHF Institutional Class and from 20 per cent
to15 per cent for USD Class, Hedged Euro Class, Hedged Sterling Class and Hedged CHF Class.
For Nippon Growth (UCITS) Fund, the performance fee reduced from 20 per cent to 10 per cent
of the relative outperformance for the JPY Class D Institutional, Euro Hedged Institutional Class,
CHF Hedged Institutional Class, GBP Hedged Institutional Class and USD Hedged Institutional
Class and from 20 per cent to 15 per cent for JPY Class B Accumulating, JPY Class C
Distributing, Euro Hedged Class, CHF Hedged Class, GBP Hedged Class, USD Hedged Class,
Euro Hedged R Class and USD Hedged R Class.
For Strategic Europe Value Fund, the performance fee reduced from 20 per cent to 15 per cent of
the relative outperformance for the Euro Class, GBP Class, CHF Class, USD Class, EUR R Class
and USD R Class.
For Strategic US Momentum and Value Fund, the performance fee reduced from 15 per cent to
10 per cent of the relative outperformance for the USD Institutional Class, EUR Hedged
Institutional Class, GBP Hedged Institutional Class and CHF Hedged Institutional Class Shares.
In the Strategic European Smaller Companies Fund, the performance fee reduced from 20 per
cent to 15 per cent of the relative outperformance for the Euro Class, Euro X Class, USD Class,
CHF Class Shares.
On 10 August 2016 revised Fund Supplements were issued for the Nippon Growth (UCITS) Fund, the
Strategic China Panda Fund, the Strategic European Smaller Companies Fund, the Strategic Europe Value
Fund and the Strategic US Momentum and Value Fund primarily to include the following:
change to the calculation methodology of the performance fee to permit crystallization upon
redemption.
Standardisation of subscription and redemption settlement dates,
Removal of minimum follow on subscription and redemption criteria.
Establishment of new share classes.

E.I. Sturdza Funds Plc
Directors’ Report (continued)
for the year ended 31 December 2016
56
Significant events during the year (continued)
On 5 September 2016 the Memorandum and Articles of Association were approved by Shareholders and
revised to comply with recent and impending legal and regulatory requirements.
On 12 September 2016 a performance fee of 10 per cent of the relative outperformance for the Euro
Class, GBP Class, USD Class, CHF Class, Euro Institutional Class, GBP Institutional Class, USD
Institutional Class and CHF Institutional Classes of the Strategic Global Quality Fund was introduced.
Following the closure of Strategic Emerging Europe Fund in 2015, the “Withdrawal of Approval” request
was submitted to the Central Bank of Ireland, and revocation was completed on 23 September 2016.
On 4 November 2016 the Administrator was changed from HSBC Securities Services (Ireland) Limited,
to SS&C Financial Services (Ireland) Limited (formerly, GlobeOp Financial Services (Ireland) Limited).
In conjunction with this change, the Depository was changed from HSBC Institutional Services (Ireland)
Limited to BNY Mellon Trust Company (Ireland) Limited.
On 7 November 2016 a full consolidation of the Prospectus was undertaken to consolidate all changes which
occurred throughout the year. In addition:
The Strategic Europe Value Fund and the Strategic Global Quality Fund investment policies were
updated to permit a maximum of 10% investment in long dated bonds in the event of a downturn
in the market;
There was a reduction to the performance fee charged on the Strategic Europe Value Fund. All
share classes with the exception of the super institutional classes now charge a 10% performance
fee.
During the year, the following share classes were launched and listed on the Irish Stock Exchange:
Share Class
Launch Date
Date listed on Irish
Stock Exchange
Strategic Global Quality Fund - USD Class 16 February 2016 17 February 2016
Strategic Global Quality Fund - CHF Class 7 June 2016 9 June 2016
Strategic Quality Emerging Bond Fund - USD Class 28 April 2016 Not listed
Strategic Quality Emerging Bond Fund - Euro Institutional
Class 28 April 2016 Not listed
Strategic Quality Emerging Bond Fund - CHF Class 28 April 2016 Not listed
Strategic Quality Emerging Bond Fund - Euro Class 28 April 2016 Not listed
Strategic Quality Emerging Bond Fund- USD Institutional
Class 22 September 2016 Not listed
Strategic Europe Value Fund - USD Class 11 March 2016 15 March 2016
Strategic Europe Value Fund - EUR Super Institutional Class 24 August 2016 29 September 2016
Strategic Europe Value Fund - USD Super Institutional Class 25 August 2016 29 September 2016
Strategic European Smaller Companies – Euro X Class 7 October 2016 20 October 2016
Strategic Beta Flex Fund- Euro Class 23 December 2016 Not listed
Johannes Yntema resigned as a Director of the Company effective 31 December 2016.

E.I. Sturdza Funds Plc
Directors’ Report (continued)
for the year ended 31 December 2016
57
Events since the year end
On 12 January 2017, the EUR Institutional Class was launched in Strategic Beta Flex Fund.
A new Sub-Fund, Strategic Opportunities Japan Fund, was approved by the Central Bank of Ireland on 15
February 2017.
Audit Committee
The Company has not established an audit committee. Given the size, nature and complexity of the
Company and the existing processes and procedures adopted by the Company, the Directors considered
the requirement to have an audit committee and decided to retain responsibility for this function.
Independent Auditors
In accordance with section 383(2) of the Companies Act, 2014, the auditor KPMG, Chartered
Accountants and Registered Auditors, will continue in office.
The Directors confirm to the best of their knowledge so far as each of the Directors is aware, there is no
relevant audit information of which the Company’s auditor is unaware and each Director has taken all the
reasonable steps he or she ought to have taken as a Director to make himself or herself aware of any
relevant audit information and to establish that the Company’s auditor is aware of that information.
By order of the Board
Brian Dillon
Denise Kinsella
12 April 2017
58
REPORT FROM THE DEPOSITORY TO THE SHAREHOLDERS
We have enquired into the conduct of E.I. Sturdza Funds Plc during the period 1 January 2016 to 3 November
2016, in our capacity as Depositary to the Company.
This report including the opinion has been prepared for and solely for the shareholders in the Company, as a
body, in accordance with the European Communities (Undertakings for Collective Investment in Transferable
Securities) Regulations 2011 (as amended) and Central Bank (Supervision and Enforcement Act 2013 (Section
48(1)) (Undertakings for Collective Investment in Transferable Securities) Regulations 2015 (the “UCITS
Regulations”), and for no other purpose. We do not, in giving this opinion, accept or assume responsibility for
any other purpose or to any other person to whom this report is shown.
Responsibilities of the Depositary
Our duties and responsibilities are outlined in the UCITS Regulations. One of those duties is to enquire into
the conduct of the Company in each annual accounting period and report thereon to the shareholders.Our
report shall state whether, in our opinion, the Company has been managed in that period, in accordance with
the provisions of the Company’s Memorandum and Articles of Association and the UCITS Regulations. It is
the overall responsibility of the Company to comply with these provisions. If the Company has not so
complied, we as Depositary must state why this is the case and outline the steps which we have taken to
rectify the situation.
Basis of Depositary Opinion
The Depositary conducts such reviews as it, in its reasonable opinion, considers necessary in order to comply
with its duties as outlined in UCITS Regulations and to ensure that, in all material respects, the Company has
been managed (i) in accordance with the limitations imposed on its investment and borrowing powers by the
provisions of its constitutional documentation and the appropriate regulations and (ii) otherwise in accordance
with the Company’s constitutional documentation and the appropriate regulations.
Opinion
In our opinion, the Company has been managed during the period, in all material respects:
(i) in accordance with the limitations imposed on the investment and borrowing powers of the Company by
the Memorandum & Articles of Association and the UCITS Regulations; and
(ii) Otherwise in accordance with the provisions of the Memorandum & Articles of Association and the
UCITS Regulations.
On behalf of
HSBC Institutional Trust Services (Ireland) DAC
1 Grand Canal Square
Grand Canal Harbour
Dublin 2
Ireland
4 April 2017

59
REPORT FROM THE DEPOSITORY TO THE SHAREHOLDERS
For the period from 04 November 2016 to 31 December 2016 (the “Period”)
BNY Mellon Trust Company (Ireland) Limited (the “Depository” “us”, “we”, or “our”), has enquired into the
conduct of E.I. Sturdza Funds plc (the “Company”) for the Period ended 31 December 2016, in its capacity as
Depository to the Company.
This report including the opinion has been prepared for and solely for the shareholders in the Company, in
accordance with our role as Depository to the Company and for no other purpose. We do not, in giving this
opinion, accept or assume responsibility for any other purpose or to any other person to whom this report is
shown.
Responsibilities of the Depository
Our duties and responsibilities are outlined in Regulation 34 of the of the European Communities
(Undertakings for Collective Investment in Transferable Securities) Regulations 2011 (S.I. No 352 of 2011), as
amended (the “Regulations”).
Our report shall state whether, in our opinion, the Company has been managed in that period in accordance
with the provisions of the Company’s Memorandum and Articles of Association and the Regulations. It is the
overall responsibility of the Company to comply with these provisions. If the Company has not been so
managed, we as Depository must state in what respects it has not been so managed and the steps which we
have taken in respect thereof.
Basis of Depository Opinion
The Depository conducts such reviews as it, in its reasonable opinion, considers necessary in order to comply
with its duties and to ensure that, in all material respects, the Company has been managed (i) in accordance
with the limitations imposed on its investment and borrowing powers by the provisions of its constitutional
documentation and the appropriate regulations and (ii) otherwise in accordance with the Company’s
constitutional documentation and the appropriate regulations.
Opinion
In our opinion, the Company has been managed during the Period, in all material respects:
(i) in accordance with the limitations imposed on the investment and borrowing powers of the Company by
the Memorandum and Articles of Association and by the Regulations; and
(ii) otherwise in accordance with the provisions of the Memorandum and Articles of Association and the
Regulations.
__________________________
For and on behalf of BNY Mellon Trust Company (Ireland) Limited,
Guild House,
Guild Street,
IFSC,
Dublin 1.
David Kelly
60
Independent Auditor’s report to the members of E.I. Sturdza Funds Plc
We have audited the financial statements of E.I. Sturdza Funds Plc (“the Company”) for the year ended 31
December 2016 which comprise the Statement of Financial Position, Statement of Comprehensive Income,
Statement of Changes in Net Assets Attributable to Holders of Redeemable Participating Shares, Statement of
Cash Flows and the related notes. The financial reporting framework that has been applied in their preparation
is Irish law and International Financial Reporting Standards (IFRS) as adopted by the European Union. Our
audit was conducted in accordance with International Standards on Auditing (UK and Ireland).
Opinions and conclusions arising from our audit
1 Our opinion on the financial statements is unmodified
In our opinion the financial statements:
give a true and fair view of the assets, liabilities and financial position of the Company as at 31
December 2016 and of its changes in net assets attributable to holders of redeemable participating
shares for the year then ended;
have been properly prepared in accordance with IFRS as adopted by the European Union; and
have been properly prepared in accordance with the requirements of the Companies Act 2014, the
European Communities (Undertakings for Collective Investment in Transferable Securities)
Regulations 2011 and the Central Bank (Supervision and Enforcement) Act 2013 (Section 48(1))
(Undertakings for Collective Investment in Transferable Securities) Regulations 2015.
2 Our conclusions on other matters on which we are required to report by the Companies Act 2014
are set out below
We have obtained all the information and explanations which we consider necessary for the purposes of our
audit.
In our opinion the accounting records of the Company were sufficient to permit the financial statements to be
readily and properly audited and the financial statements are in agreement with the accounting records.
In our opinion the information given in the Directors’ Report is consistent with the financial statements.
In addition we report, in relation to information given in the Corporate Governance Statement on pages xx-xx,
that:
based on knowledge and understanding of the Company and its environment obtained in the course of our
audit, no material misstatements in the information identified above have come to our attention; and
based on the work undertaken in the course of our audit, in our opinion:
- the description of the main features of the internal control and risk management systems in relation to
the process for preparing the financial statements is consistent with the financial statements and has
been prepared in accordance with the Companies Act 2014,
- the Company is not subject to the European Communities (Takeover Bids (Directive 2004/25/EC))
Regulations 2006 and therefore not required to include information relating to voting rights and other
matters required by those Regulations and specified by the Companies Act 2014 for our consideration in
the Corporate Governance Statement,
- the Corporate Governance Statement contains the information required by the Companies Act 2014.
3 We have nothing to report in respect of matters on which we are required to report by exception
ISAs (UK & Ireland) require that we report to you if, based on the knowledge we acquired during our audit,
we have identified information in the annual report that contains a material inconsistency with either that
knowledge or the financial statements, a material misstatement of fact, or that is otherwise misleading.
61
Independent Auditor’s report to the members of E.I. Sturdza Funds Plc (continued)
In addition, the Companies Act 2014 requires us to report to you if, in our opinion, the disclosures of directors’
remuneration and transactions required by sections 305 to 312 of the Act are not made.
Basis of our report, responsibilities and restrictions on use
As explained more fully in the Statement of Directors’ Responsibilities set out on page xx, the directors are
responsible for the preparation of the financial statements and for being satisfied that they give a true and fair
view and otherwise comply with the Companies Act 2014. Our responsibility is to audit and express an
opinion on the financial statements in accordance with Irish law and International Standards on Auditing (UK
and Ireland). Those standards require us to comply with the Financial Reporting Council’s Ethical Standards
for Auditors.
An audit undertaken in accordance with ISAs (UK & Ireland) involves obtaining evidence about the amounts
and disclosures in the financial statements sufficient to give reasonable assurance that the financial statements
are free from material misstatement, whether caused by fraud or error. This includes an assessment of: whether
the accounting policies are appropriate to the Company’s circumstances and have been consistently applied
and adequately disclosed; the reasonableness of significant accounting estimates made by the directors; and the
overall presentation of the financial statements.
In addition, we read all the financial and non-financial information in the Annual Report to identify material
inconsistencies with the audited financial statements and to identify any information that is apparently
materially incorrect based on, or materially inconsistent with, the knowledge acquired by us in the course of
performing the audit. If we become aware of any apparent material misstatements or inconsistencies we
consider the implications for our report.
Whilst an audit conducted in accordance with ISAs (UK & Ireland) is designed to provide reasonable
assurance of identifying material misstatements or omissions it is not guaranteed to do so. Rather the auditor
plans the audit to determine the extent of testing needed to reduce to an appropriately low level the probability
that the aggregate of uncorrected and undetected misstatements does not exceed materiality for the financial
statements as a whole. This testing requires us to conduct significant audit work on a broad range of assets,
liabilities, income and expense as well as devoting significant time of the most experienced members of the
audit team, in particular the engagement partner responsible for the audit, to subjective areas of the accounting
and reporting.
Our report is made solely to the Company’s members, as a body, in accordance with section 391 of the
Companies Act 2014. Our audit work has been undertaken so that we might state to the Company’s members
those matters we are required to state to them in an auditor’s report and for no other purpose. To the fullest
extent permitted by law, we do not accept or assume responsibility to anyone other than the Company and the
Company’s members as a body, for our audit work, for this report, or for the opinions we have formed.
12 April 2017
Colm Clifford
for and on behalf of
KPMG
Chartered Accountants, Statutory Audit Firm
1 Harbourmaster Place
IFSC
Dublin 1
Ireland
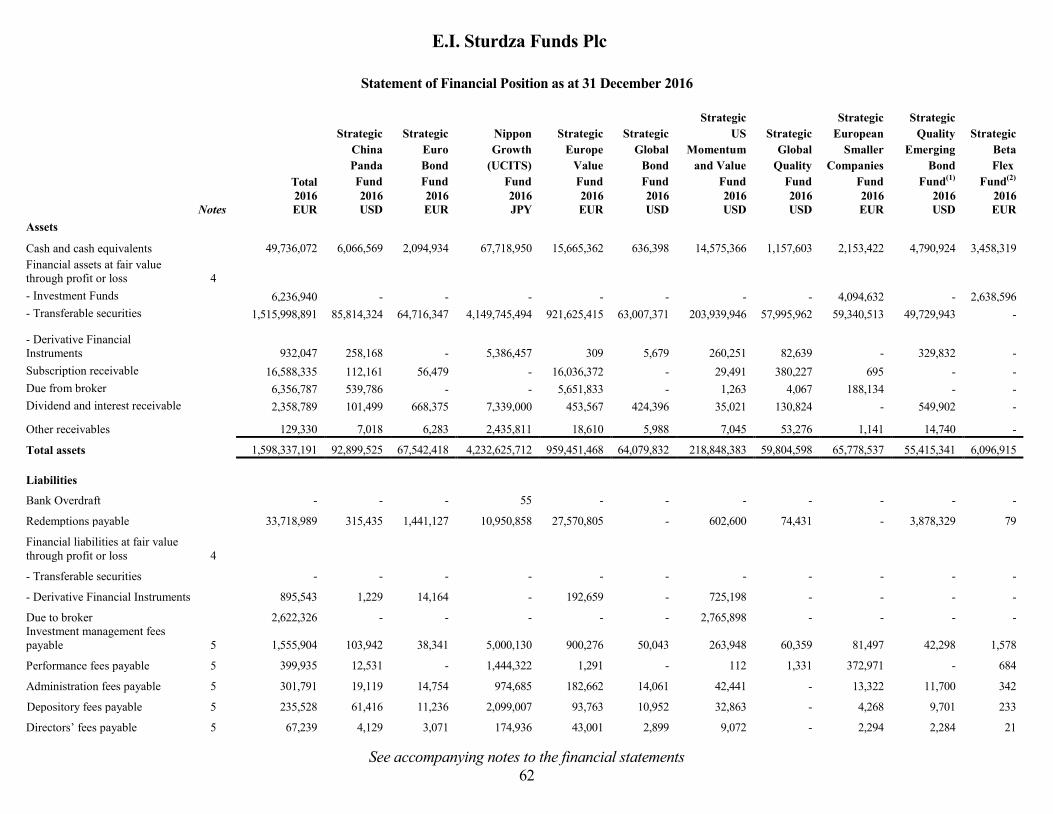
E.I. Sturdza Funds Plc
Statement of Financial Position as at 31 December 2016
See accompanying notes to the financial statements
62
Total
Strategic
China
Panda
Fund
Strategic
Euro
Bond
Fund
Nippon
Growth
(UCITS)
Fund
Strategic
Europe
Value
Fund
Strategic
Global
Bond
Fund
Strategic
US
Momentum
and Value
Fund
Strategic
Global
Quality
Fund
Strategic
European
Smaller
Companies
Fund
Strategic
Quality
Emerging
Bond
Fund(1)
Strategic
Beta
Flex
Fund(2)
2016 2016 2016 2016 2016 2016 2016 2016 2016 2016 2016
Notes EUR USD EUR JPY EUR USD USD USD EUR USD EUR
Assets
Cash and cash equivalents 49,736,072 6,066,569 2,094,934 67,718,950 15,665,362 636,398 14,575,366 1,157,603 2,153,422 4,790,924 3,458,319
Financial assets at fair value
through profit or loss 4
- Investment Funds 6,236,940 - - - - - - - 4,094,632 - 2,638,596
- Transferable securities 1,515,998,891 85,814,324 64,716,347 4,149,745,494 921,625,415 63,007,371 203,939,946 57,995,962 59,340,513 49,729,943 -
- Derivative Financial
Instruments 932,047 258,168 - 5,386,457 309 5,679 260,251 82,639 - 329,832 -
Subscription receivable 16,588,335 112,161 56,479 - 16,036,372 - 29,491 380,227 695 - -
Due from broker 6,356,787 539,786 - - 5,651,833 - 1,263 4,067 188,134 - -
Dividend and interest receivable 2,358,789 101,499 668,375 7,339,000 453,567 424,396 35,021 130,824 - 549,902 -
Other receivables 129,330 7,018 6,283 2,435,811 18,610 5,988 7,045 53,276 1,141 14,740 -
Total assets 1,598,337,191 92,899,525 67,542,418 4,232,625,712 959,451,468 64,079,832 218,848,383 59,804,598 65,778,537 55,415,341 6,096,915
Liabilities
Bank Overdraft - - - 55 - - - - - - -
Redemptions payable 33,718,989 315,435 1,441,127 10,950,858 27,570,805 - 602,600 74,431 - 3,878,329 79
Financial liabilities at fair value
through profit or loss 4
- Transferable securities - - - - - - - - - - -
- Derivative Financial Instruments 895,543 1,229 14,164 - 192,659 - 725,198 - - - -
Due to broker 2,622,326 - - - - - 2,765,898 - - - -
Investment management fees
payable 5 1,555,904 103,942 38,341 5,000,130 900,276 50,043 263,948 60,359 81,497 42,298 1,578
Performance fees payable 5 399,935 12,531 - 1,444,322 1,291 - 112 1,331 372,971 - 684
Administration fees payable 5 301,791 19,119 14,754 974,685 182,662 14,061 42,441 - 13,322 11,700 342
Depository fees payable 5 235,528 61,416 11,236 2,099,007 93,763 10,952 32,863 - 4,268 9,701 233
Directors’ fees payable 5 67,239 4,129 3,071 174,936 43,001 2,899 9,072 - 2,294 2,284 21

E.I. Sturdza Funds Plc
Statement of Financial Position as at 31 December 2016 (continued)
See accompanying notes to the financial statements
63
On behalf of the Board
Brian Dillon Denise Kinsella 12 April 2017
(1)
For the period 28 April 2016 (commenced operations) to 31 December 2016 (2) For the period 23 December 2016 (commenced operations) to 31 December 2016
Total
Strategic
China
Panda
Fund
Strategic
Euro
Bond
Fund
Nippon
Growth
(UCITS)
Fund
Strategic
Europe
Value
Fund
Strategic
Global
Bond
Fund
Strategic
US
Momentum
and Value
Fund
Strategic
Global
Quality
Fund
Strategic
European
Smaller
Companies
Fund
Strategic
Quality
Emerging
Bond
Fund(1)
Strategic
Beta
Flex
Fund(2)
2016 2016 2016 2016 2016 2016 2016 2016 2016 2016 2016
EUR USD EUR JPY EUR USD USD USD EUR USD EUR
Interest payable 13,334 6,099 3,564 21,199 438 55 267 - 3,056 17 -
Sundry payables and accrued
expenses 1,758,431 246,612 118,587 16,299,864 365,416 77,626 142,943 4,185 61,986 55,194 580,718
Total liabilities 41,569,020
770,512 1,644,844 36,965,056 29,350,311 155,636 4,585,342 140,306 539,394 3,999,523 583,655
Net assets attributable to holders
of redeemable participating
shares 1,556,768,171 92,129,013 65,897,574 4,195,660,656 930,101,157 63,924,196 214,263,041 59,664,292 65,239,143 51,415,818 5,513,260

E.I. Sturdza Funds Plc
Statement of Financial Position as at 31 December 2015
See accompanying notes to the financial statements
64
(1) Strategic Emerging Europe Fund was terminated on 21 July 2015
Total
Strategic
China
Panda
Fund
Strategic
Euro
Bond
Fund
Nippon
Growth
(UCITS)
Fund
Strategic
Emerging
Europe
Fund(1)
Strategic
Europe
Value
Fund
Strategic
Global
Bond
Fund
Strategic US
Momentum
and Value
Fund
Strategic
Global
Quality
Fund
Strategic
European
Smaller
Companies
Fund
2015 2015 2015 2015 2015 2015 2015 2015 2015 2015
Notes EUR USD EUR JPY USD EUR USD USD USD EUR
Assets
Cash and cash equivalents 48,913,519 8,798,695 2,309,882 411,506,165 - 18,085,897 3,136,445 14,334,155 274,732 926,124
Financial assets at fair value
through profit or loss 4
- Transferable securities 1,721,267,562 145,050,864 122,213,555 21,558,306,996 - 888,020,486 90,650,310 308,095,280 12,470,123 33,742,936
- Derivative Financial Instruments 19,079,710 19,747,628 - 1,088,278 - 675,204 77,453 155,000 - -
Subscription receivable 6,577,572 136,029 79,694 - - 5,932,256 - - 328,520 137,900
Due from broker 42,112,143 7,432,595 865,433 - - 11,542 251,525 36,956,926 - 133,017
Dividends and interest receivable 3,270,158 62,926 1,592,956 27,725,869 - 483,088 878,575 104,487 20,294 -
Other receivables 86,488 32,448 4,378 882,446 - 13,827 4,603 6,977 22,564 211
Total assets 1,841,307,152 181,261,185 127,065,898 21,999,509,754 - 913,222,300 94,998,911 359,652,825 13,116,233 34,940,188
Liabilities
Redemptions payable 4,416,646 12,797 71,496 220,374,843 - 2,563,617 - 7,986 - 74,478
Financial liabilities at fair value
through profit or loss 4 - - - - - - - - - -
- Derivative Financial Instruments 2,171,732 170,494 178,089 75,457,379 - 459,270 65,054 791,990 11,231 -
Due to broker 35,066,718 6,260,566 - - - - - 31,825,396 - -
Investment management fees payable 5 1,791,725 200,025 67,844 23,613,904 - 868,213 74,163 400,682 10,604 43,668
Performance fees payable 5 13,173,467 795,500 - 2 - 12,050,740 - - - 390,290
Administration fees payable 5 289,177 33,655 23,075 3,957,328 - 123,476 18,260 59,060 - 10,138
Depository fees payable 5 147,700 16,066 11,026 1,897,646 - 54,197 8,624 28,604 - 18,873
Directors’ fees payable 5 73,907 8,474 5,889 1,018,339 - 32,766 4,761 14,913 - 1,536
Interest payable 2,136 - - - - - - - - 2,136
Sundry payables and accrued expenses 1,190,697 223,825 202,444 21,623,253 - 223,913 186,757 205,351 - 31,617
Total liabilities 58,323,905 7,721,402 559,863 347,942,694 - 16,376,192 357,619 33,333,982 21,835 572,736
Net assets attributable to holders of
redeemable participating shares 1,782,983,247 173,539,783 126,506,035 21,651,567,060 - 896,846,108 94,641,292 326,318,843 13,094,398 34,367,452
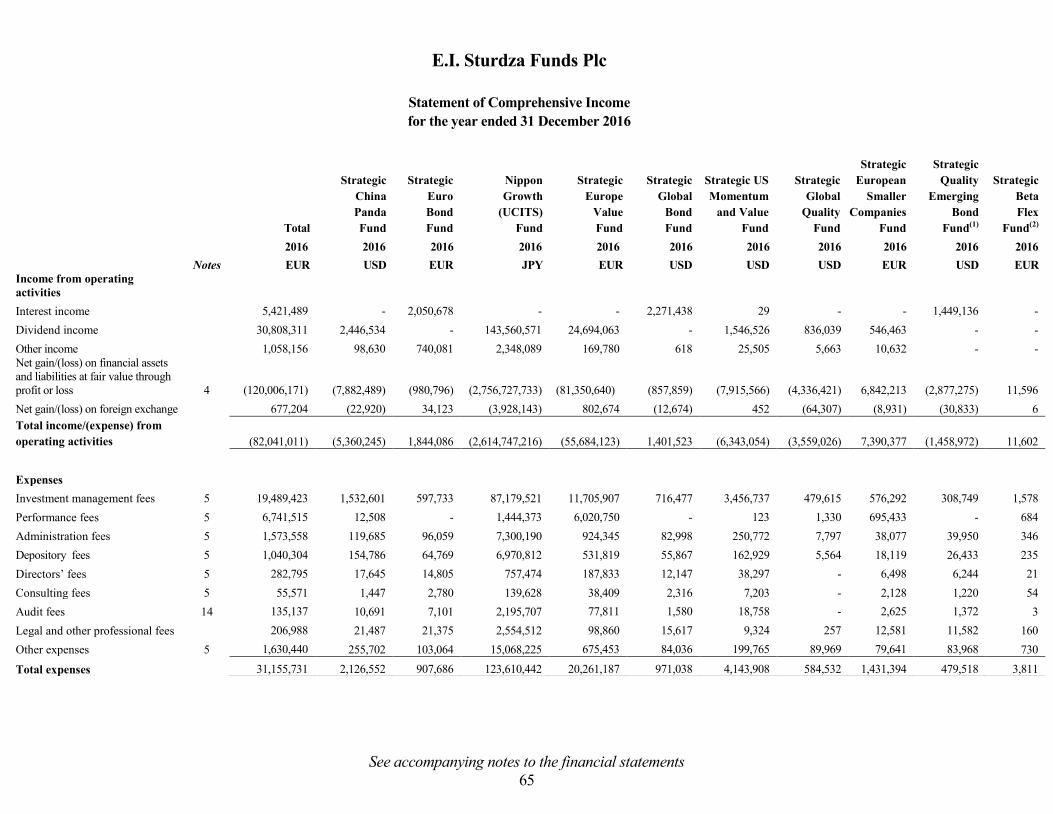
E.I. Sturdza Funds Plc
Statement of Comprehensive Income
for the year ended 31 December 2016
See accompanying notes to the financial statements
65
Total
Strategic
China
Panda
Fund
Strategic
Euro
Bond
Fund
Nippon
Growth
(UCITS)
Fund
Strategic
Europe
Value
Fund
Strategic
Global
Bond
Fund
Strategic US
Momentum
and Value
Fund
Strategic
Global
Quality
Fund
Strategic
European
Smaller
Companies
Fund
Strategic
Quality
Emerging
Bond
Fund(1)
Strategic
Beta
Flex
Fund(2)
2016 2016 2016 2016 2016 2016 2016 2016 2016 2016 2016
Notes EUR USD EUR JPY EUR USD USD USD EUR USD EUR
Income from operating
activities
Interest income 5,421,489 - 2,050,678 - - 2,271,438 29 - - 1,449,136 -
Dividend income 30,808,311 2,446,534 - 143,560,571 24,694,063 - 1,546,526 836,039 546,463 - -
Other income 1,058,156 98,630 740,081 2,348,089 169,780 618 25,505 5,663 10,632 - -
Net gain/(loss) on financial assets
and liabilities at fair value through
profit or loss 4 (120,006,171) (7,882,489) (980,796) (2,756,727,733) (81,350,640) (857,859) (7,915,566) (4,336,421) 6,842,213 (2,877,275) 11,596
Net gain/(loss) on foreign exchange 677,204 (22,920) 34,123 (3,928,143) 802,674 (12,674) 452 (64,307) (8,931) (30,833) 6
Total income/(expense) from
operating activities (82,041,011) (5,360,245) 1,844,086 (2,614,747,216) (55,684,123) 1,401,523 (6,343,054) (3,559,026) 7,390,377 (1,458,972) 11,602
Expenses
Investment management fees 5 19,489,423 1,532,601 597,733 87,179,521 11,705,907 716,477 3,456,737 479,615 576,292 308,749 1,578
Performance fees 5 6,741,515 12,508 - 1,444,373 6,020,750 - 123 1,330 695,433 - 684
Administration fees 5 1,573,558 119,685 96,059 7,300,190 924,345 82,998 250,772 7,797 38,077 39,950 346
Depository fees 5 1,040,304 154,786 64,769 6,970,812 531,819 55,867 162,929 5,564 18,119 26,433 235
Directors’ fees 5 282,795 17,645 14,805 757,474 187,833 12,147 38,297 - 6,498 6,244 21
Consulting fees 5 55,571 1,447 2,780 139,628 38,409 2,316 7,203 - 2,128 1,220 54
Audit fees 14 135,137 10,691 7,101 2,195,707 77,811 1,580 18,758 - 2,625 1,372 3
Legal and other professional fees 206,988 21,487 21,375 2,554,512 98,860 15,617 9,324 257 12,581 11,582 160
Other expenses 5 1,630,440 255,702 103,064 15,068,225 675,453 84,036 199,765 89,969 79,641 83,968 730
Total expenses 31,155,731 2,126,552 907,686 123,610,442 20,261,187 971,038 4,143,908 584,532 1,431,394 479,518 3,811
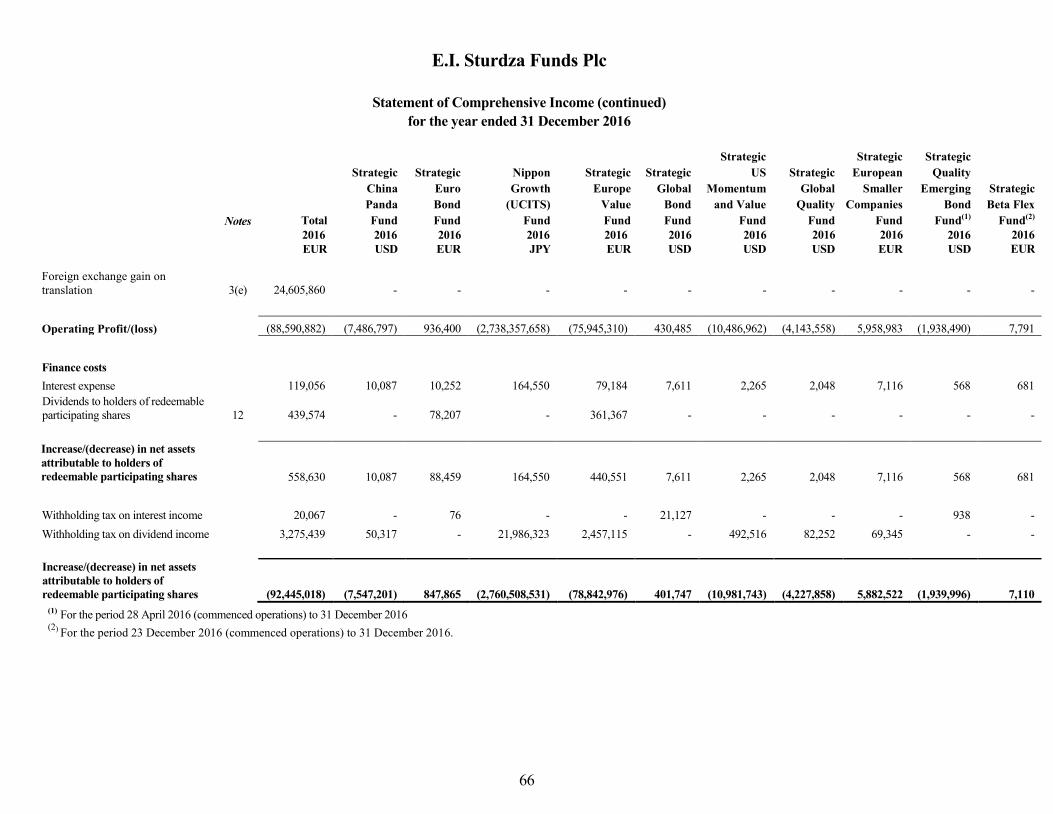
E.I. Sturdza Funds Plc
Statement of Comprehensive Income (continued)
for the year ended 31 December 2016
66
(1) For the period 28 April 2016 (commenced operations) to 31 December 2016 (2) For the period 23 December 2016 (commenced operations) to 31 December 2016.
Notes Total
Strategic
China
Panda
Fund
Strategic
Euro
Bond
Fund
Nippon
Growth
(UCITS)
Fund
Strategic
Europe
Value
Fund
Strategic
Global
Bond
Fund
Strategic
US
Momentum
and Value
Fund
Strategic
Global
Quality
Fund
Strategic
European
Smaller
Companies
Fund
Strategic
Quality
Emerging
Bond
Fund(1)
Strategic
Beta Flex
Fund(2)
2016 2016 2016 2016 2016 2016 2016 2016 2016 2016 2016
EUR USD EUR JPY EUR USD USD USD EUR USD EUR
Foreign exchange gain on
translation 3(e) 24,605,860 - - - - - - - - - -
Operating Profit/(loss) (88,590,882) (7,486,797) 936,400 (2,738,357,658) (75,945,310) 430,485 (10,486,962) (4,143,558) 5,958,983 (1,938,490) 7,791
Finance costs
Interest expense 119,056 10,087 10,252 164,550 79,184 7,611 2,265 2,048 7,116 568 681
Dividends to holders of redeemable
participating shares 12 439,574 - 78,207 - 361,367 - - - - - -
Increase/(decrease) in net assets
attributable to holders of
redeemable participating shares
before tax 558,630 10,087 88,459 164,550 440,551 7,611 2,265 2,048 7,116 568 681
Withholding tax on interest income 20,067 - 76 - - 21,127 - - - 938 -
Withholding tax on dividend income 3,275,439 50,317 - 21,986,323 2,457,115 - 492,516 82,252 69,345 - -
Increase/(decrease) in net assets
attributable to holders of
redeemable participating shares (92,445,018) (7,547,201) 847,865 (2,760,508,531) (78,842,976) 401,747 (10,981,743) (4,227,858) 5,882,522 (1,939,996) 7,110
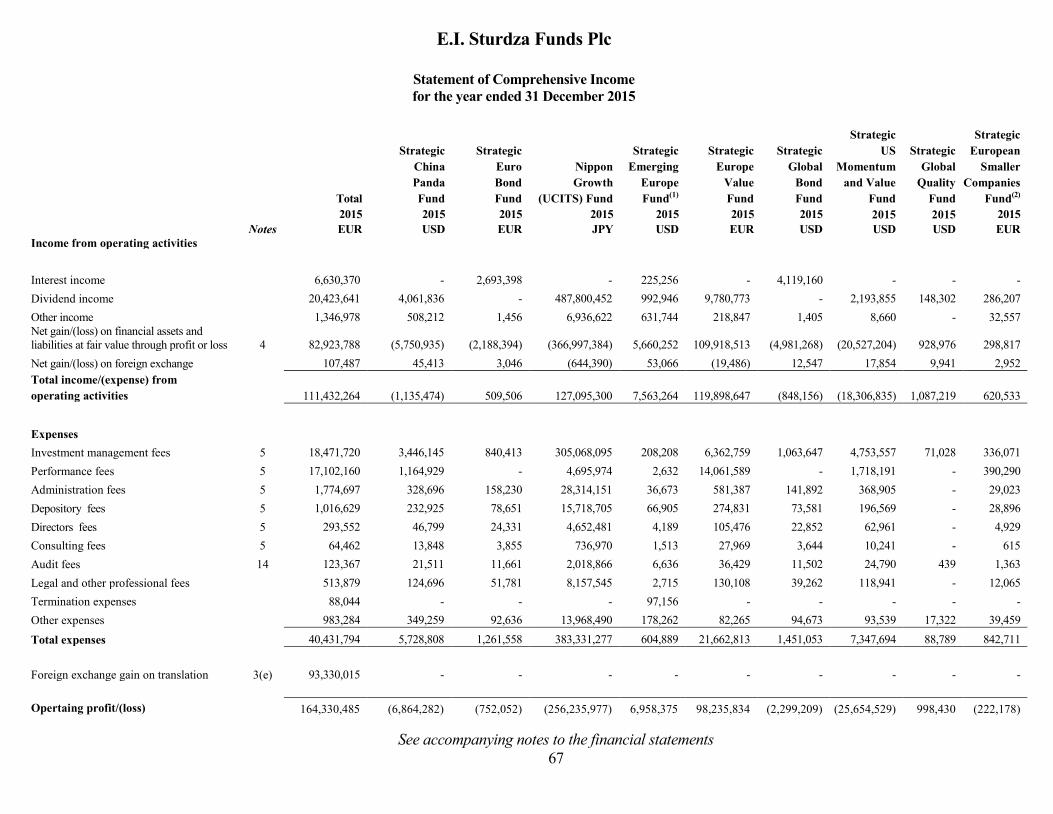
E.I. Sturdza Funds Plc
Statement of Comprehensive Income
for the year ended 31 December 2015
See accompanying notes to the financial statements
67
Total
Strategic
China
Panda
Fund
Strategic
Euro
Bond
Fund
Nippon
Growth
(UCITS) Fund
Strategic
Emerging
Europe
Fund(1)
Strategic
Europe
Value
Fund
Strategic
Global
Bond
Fund
Strategic
US
Momentum
and Value
Fund
Strategic
Global
Quality
Fund
Strategic
European
Smaller
Companies
Fund(2)
2015 2015 2015 2015 2015 2015 2015 2015 2015 2015
Notes EUR USD EUR JPY USD EUR USD USD USD EUR
Income from operating activities
Interest income 6,630,370 - 2,693,398 - 225,256 -
4,119,160 - - -
Dividend income 20,423,641 4,061,836 - 487,800,452 992,946 9,780,773 - 2,193,855 148,302 286,207
Other income 1,346,978 508,212 1,456 6,936,622 631,744 218,847 1,405 8,660 - 32,557
Net gain/(loss) on financial assets and
liabilities at fair value through profit or loss 4 82,923,788 (5,750,935) (2,188,394) (366,997,384) 5,660,252 109,918,513 (4,981,268) (20,527,204) 928,976 298,817
Net gain/(loss) on foreign exchange 107,487 45,413 3,046 (644,390) 53,066 (19,486) 12,547 17,854 9,941 2,952
Total income/(expense) from
operating activities 111,432,264 (1,135,474) 509,506 127,095,300 7,563,264 119,898,647 (848,156) (18,306,835) 1,087,219 620,533
Expenses
Investment management fees 5 18,471,720 3,446,145 840,413 305,068,095 208,208 6,362,759 1,063,647 4,753,557 71,028 336,071
Performance fees 5 17,102,160 1,164,929 - 4,695,974 2,632 14,061,589 - 1,718,191 - 390,290
Administration fees 5 1,774,697 328,696 158,230 28,314,151 36,673 581,387 141,892 368,905 - 29,023
Depository fees 5 1,016,629 232,925 78,651 15,718,705 66,905 274,831 73,581 196,569 - 28,896
Directors fees 5 293,552 46,799 24,331 4,652,481 4,189 105,476 22,852 62,961 - 4,929
Consulting fees 5 64,462 13,848 3,855 736,970 1,513 27,969 3,644 10,241 - 615
Audit fees 14 123,367 21,511 11,661 2,018,866 6,636 36,429 11,502 24,790 439 1,363
Legal and other professional fees 513,879 124,696 51,781 8,157,545 2,715 130,108 39,262 118,941 - 12,065
Termination expenses 88,044 - - - 97,156 - - - - -
Other expenses 983,284 349,259 92,636 13,968,490 178,262 82,265 94,673 93,539 17,322 39,459
Total expenses 40,431,794 5,728,808 1,261,558 383,331,277 604,889 21,662,813 1,451,053 7,347,694 88,789 842,711
Foreign exchange gain on translation 3(e) 93,330,015 - - - - - - - - -
Opertaing profit/(loss) 164,330,485 (6,864,282) (752,052) (256,235,977) 6,958,375 98,235,834 (2,299,209) (25,654,529) 998,430 (222,178)
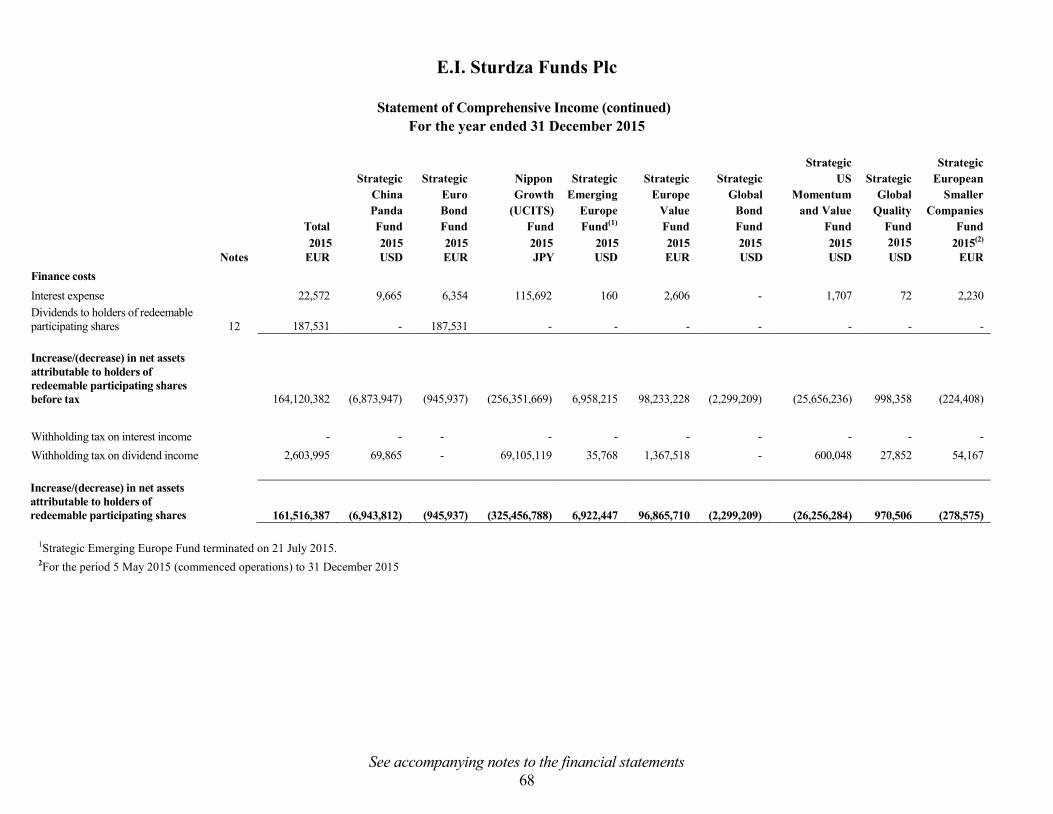
E.I. Sturdza Funds Plc
Statement of Comprehensive Income (continued)
For the year ended 31 December 2015
See accompanying notes to the financial statements
68
Total
Strategic
China
Panda
Fund
Strategic
Euro
Bond
Fund
Nippon
Growth
(UCITS)
Fund
Strategic
Emerging
Europe
Fund(1)
Strategic
Europe
Value
Fund
Strategic
Global
Bond
Fund
Strategic
US
Momentum
and Value
Fund
Strategic
Global
Quality
Fund
Strategic
European
Smaller
Companies
Fund
2015 2015 2015 2015 2015 2015 2015 2015 2015 2015(2)
Notes EUR USD EUR JPY USD EUR USD USD USD EUR
Finance costs
Interest expense 22,572 9,665 6,354 115,692 160 2,606 - 1,707 72 2,230
Dividends to holders of redeemable
participating shares 12 187,531 - 187,531 - - - - - - -
Increase/(decrease) in net assets
attributable to holders of
redeemable participating shares
before tax 164,120,382 (6,873,947) (945,937) (256,351,669) 6,958,215 98,233,228 (2,299,209) (25,656,236) 998,358 (224,408)
Withholding tax on interest income - - - - - - - - - -
Withholding tax on dividend income 2,603,995 69,865 - 69,105,119 35,768 1,367,518 - 600,048 27,852 54,167
Increase/(decrease) in net assets
attributable to holders of
redeemable participating shares 161,516,387 (6,943,812) (945,937) (325,456,788) 6,922,447 96,865,710 (2,299,209) (26,256,284) 970,506 (278,575)
1Strategic Emerging Europe Fund terminated on 21 July 2015. 2For the period 5 May 2015 (commenced operations) to 31 December 2015

E.I. Sturdza Funds Plc
Statement of Changes in Net Assets Attributable to Holders of Redeemable Participating Shares
For the year ended 31 December 2016
See accompanying notes to the financial statements
69
Strategic
China
Panda
Fund
Strategic
Euro
Bond
Fund
Nippon
Growth
(UCITS)
Fund
Strategic
Europe
Value
Fund
Strategic
Global
Bond
Fund
Strategic
US
Momentum
and Value
Fund
Strategic
Global
Quality
Fund
Strategic
European
Smaller
Companies
Fund
Strategic
Quality
Emerging
Bond
Fund(1)
Strategic
Beta Flex
Fund(2)
2016 2016 2016 2016 2016 2016 2016 2016 2016 2016
USD EUR JPY EUR USD USD USD EUR USD EUR
Net assets attributable to redeemable participating
shares at beginning of year/period 173,539,783 126,506,035 21,651,567,060 896,846,108 94,641,292 326,318,843 13,094,398 34,367,452 - -
Proceeds from redeemable participating shares
issued:
- USD Class 3,143,067 - - 1,706,046 8,515,804 6,324,014 19,935,604 - 26,582,186 -
- Euro Class - - - 136,355,875 - - - 24,731,219 14,838,746 5,506,150
- Eurp Class X - - - - - - - 10,099,473 - -
- Hedged Euro Class 1,472,940 - 17,476,032 - - 389,005 - - - -
- Euro Distributing Class - 105,470 - - - - - - - -
- Euro Accumulating Class - 5,162,085 - - - - - - - -
- JPY Class B Accumulating - - 125,124,500 - - - - - - -
- EUR Institutional Class - 13,705,476 - 418,386,646 - - - - 3,314,562 -
- CHF Accumulating Class - 1,517,371 - - - - - - - -
- Euro Hedged Institutional Class 3,319,735 - 62,125,120 - - - - - - -
- Hedged CHF Class - - - - - 816,420 - - - -
- USD Institutional Class 12,696,726 - - 7,019,632 - 7,678,535 30,575,477 - 6,500,000 -
- USD Super Institutuional Class - - - 2,217,508 - - - - - -
- GBP Institutional Class - - - 1,536,294 - - - - - -
- CHF Class - - - 9,775,125 - - 8,015,909 - 12,291,696 -
- Euro Retail Class - - - 10,685,869 - - - - - -
- Euro Super Institutional Class - - - 158,373,889 - - - - - -
- Euro Institutional Distributing Class - - - 27,864,103 - - - - - -
Total proceeds from redeemable participating
shares issued shares issued 20,632,468 20,490,402 204,725,652 773,920,987 8,515,804 15,207,974 58,526,990 34,830,692 63,527,190 5,506,150

E.I. Sturdza Funds Plc
Statement of Changes in Net Assets Attributable to Holders of Redeemable Participating Shares
For the year ended 31 December 2016 (continued)
See accompanying notes to the financial statements
70
Strategic
China
Panda
Fund
Strategic
Euro
Bond
Fund
Nippon
Growth
(UCITS)
Fund
Strategic
Europe
Value
Fund
Strategic
Global
Bond
Fund
Strategic
US
Momentum
and Value
Fund
Strategic
Global
Quality
Fund
Strategic
European
Smaller
Companies
Fund
Strategic
Quality
Emerging
Bond
Fund(1)
Strategic
Beta Flex
Fund(2)
2016 2016 2016 2016 2016 2016 2016 2016 2016 2016
USD EUR JPY EUR USD USD USD EUR USD EUR
Payment on the redemption of
participating shares:
- USD Class (32,984,044) - - (470,341) (28,909,412) (75,687,855) (1,838,676) - (7,025,049) -
- Hedged Euro Class (22,887,296) - (2,104,329,195) - - (13,992,248) - - - -
- Hedged Streling Class (348,758) - - - - - - - - -
- Euro Distributing Class - (6,707,990) - - - - - - - -
- Euro Super Instittutional Class - - - (4,157,774) - - - - - -
- Euro Accumulating Class - (20,307,657) - - - - - - - -
- JPY Class A - - (219,242,355) - - - - - - -
- JPY Class B Accumulating - - (4,353,776,225) - - - - - - -
- RMB Class - - - - (10,725,235) - - - - -
- EUR Institutional Class - (44,812,215) - (423,956,546) - - - - - -
- Euro Institutional Distributing Class - - - (54,115,086) - - - - - -
- Euro Retail Class - - - (2,309,685) - - - - - -
- Euro Hedged Institutional Class - - (151,788,877) - - - - - - -
- CHF Accumulating Class - (9,757,167) - - - - - - - -
- CHF Class - - - (20,706,178) - - (230,023) - (1,793,353) -
- JPY Class D Institutional - - (5,747,703,812) - - - - - - -
- USD Institutional Class (29,645,908) - - (13,693,801) - (19,316,247) (5,660,539) - - -
- USD Super Institutional Class - - - (50,513) - - - - - -
- GBP Institutional Class - - (2,323,283,061) (1,528,888) - - - - - -
- CHF Institutional Class - (361,699) - - - - - - - -
- Hedged CHF Class - - - - - (7,285,683) - - - -
- Euro Class - - - (140,834,150) - - - (9,841,523) (1,352,974) -
- Euro Hedged Institutional Class (8,630,031) - - - - - - - - -
Total payment on the redemption of
participating shares (94,496,037) (81,946,728) (14,900,123,525) (661,822,962) (39,634,647) (116,282,033) (7,729,238) (9,841,523) (10,171,376) -
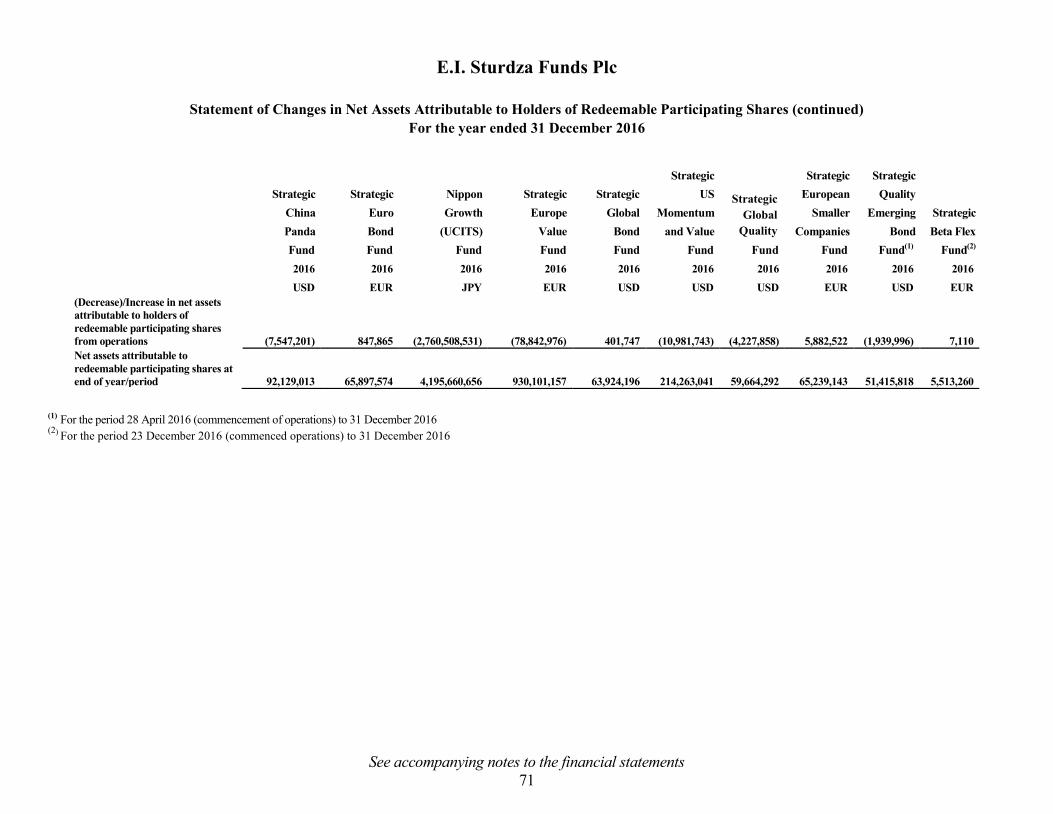
E.I. Sturdza Funds Plc
Statement of Changes in Net Assets Attributable to Holders of Redeemable Participating Shares (continued)
For the year ended 31 December 2016
See accompanying notes to the financial statements
71
(1) For the period 28 April 2016 (commencement of operations) to 31 December 2016 (2) For the period 23 December 2016 (commenced operations) to 31 December 2016
Strategic
China
Panda
Fund
Strategic
Euro
Bond
Fund
Nippon
Growth
(UCITS)
Fund
Strategic
Europe
Value
Fund
Strategic
Global
Bond
Fund
Strategic
US
Momentum
and Value
Fund
Strategic
Global
Quality
Fund
Strategic
European
Smaller
Companies
Fund
Strategic
Quality
Emerging
Bond
Fund(1)
Strategic
Beta Flex
Fund(2)
2016 2016 2016 2016 2016 2016 2016 2016 2016 2016
USD EUR JPY EUR USD USD USD EUR USD EUR
(Decrease)/Increase in net assets
attributable to holders of
redeemable participating shares
from operations (7,547,201) 847,865 (2,760,508,531) (78,842,976) 401,747 (10,981,743) (4,227,858) 5,882,522 (1,939,996) 7,110
Net assets attributable to
redeemable participating shares at
end of year/period 92,129,013 65,897,574 4,195,660,656 930,101,157 63,924,196 214,263,041 59,664,292 65,239,143 51,415,818 5,513,260

E.I. Sturdza Funds Plc
Statement of Changes in Net Assets Attributable to Holders of Redeemable Participating Shares
For the year ended 31 December 2015
See accompanying notes to the financial statements
72
Strategic
China
Panda
Fund
Strategic
Euro
Bond
Fund
Nippon
Growth
(UCITS)
Fund
Strategic
Emerging
Europe
Fund(1)
Strategic
Europe
Value
Fund
Strategic
Global
Bond
Fund
Strategic
US
Momentum
and Value
Fund
Strategic
Global
Quality
Fund
Strategic
European
Smaller
Companies
Fund
2015 2015 2015 2015 2015 2015 2015 2015 2015(2)
USD EUR JPY USD EUR USD USD USD EUR
Net assets attributable to redeemable participating shares
at beginning of year
366,572,309 111,564,523 21,318,487,451 78,401,391 248,696,174 115,460,846 286,441,996 5,056,567 -
Proceeds from redeemable participating shares issued:
- USD Class 35,028,001 - - 520,088 - 25,792,831 95,404,530 - -
- Euro Class - - - - 224,610,326 - - - 38,614,662
- Euro Hedged Class 7,522,708 - 541,505,862 214,001 - - 15,759,323 - -
- Hedged Sterling Class 268,653 - - - - - - - -
- Euro Distributing Class - 1,358,175 - - - - - - -
- Euro Accumulating Class - 7,329,445 - - - - - - -
- JPY Class B - - 4,529,249,995 - - - - - -
- RMB Class - - - - - 565,910 - - -
- EUR Institutional Class - 48,849,185 - - 360,302,015 - - - -
- CHF Accumulating Class - 5,531,757 - - - - - - -
- Euro Hedged Institutional Class 7,856,452 - 520,454,376 - - - - - -
- JPY Class D Institutional - - 3,033,038,748 - - - - - -
- CHF Hedged Class - - - - - - 17,684,707 - -
- USD Institutional Class 17,578,010 - - - 10,245,696 - 38,198,533 7,172,598 -
- USD Select Institutional Class - - - 12,347,493 - - - - -
- GBP Institutional Class - - - - 11,185,481 - - - -
- GBP Hedged Institutional Class - - 442,393,456 - - - - - -
- CHF Class - - - - 21,021,105 - - - -
- Euro Retail Class - - - - 9,850 - - - -
- Euro Institutional Distributing class - - - - 50,521,549 - - - -
Total proceeds from redeemable participating
shares issued
68,253,824 63,068,562 9,066,642,437 13,081,582 677,896,022 26,358,741 167,047,093 7,172,598 38,614,662

E.I. Sturdza Funds Plc
Statement of Changes in Net Assets Attributable to Holders of Redeemable Participating Shares (continued)
For the year ended 31 December 2015
See accompanying notes to the financial statements
73
1Strategic Emerging Europe Fund terminated on 21 July 2015.
2For the period 5 May 2015 (commenced operations) to 31 December 2015
Strategic
China
Panda
Fund
Strategic
Euro
Bond
Fund
Nippon
Growth
(UCITS)
Fund
Strategic
Emerging
Europe
Fund(1)
Strategic
Europe
Value
Fund
Strategic
Global
Bond
Fund
Strategic US
Momentum
and Value
Fund
Strategic
Global
Quality
Fund
Strategic
European
Smaller
Companies
Fund(2)
2015 2015 2015 2015 2015 2015 2015 2015 2015
USD EUR JPY USD EUR USD USD USD EUR
Payment on the redemption of participating shares:
- USD Class (161,842,893) - - (7,144,058)
- (33,552,742) (64,115,036) - -
- Euro Hedged Class (43,565,696) - (1,028,308,784) (13,130,704)
- - (21,822,505) - -
- Hedged Sterling Class (468,393) - - - - - - - -
- Euro Distributing Class - (8,024,301) - - - - - - -
- Euro Accumulating Class - (15,564,621) - - - - - - -
- JPY Class A - - (140,913,812) - - - - - -
- JPY Class B - - (3,921,835,863) - - - - - -
- JPY Class C - - (32,819,200) - - - - - -
- RMB Class - - - - - (11,326,344) - - -
- EUR Institutional Class - (15,322,368) - - (34,892,797) - - - -
- CHF Accumulating Class - (6,284,647) - - - - - - -
- CHF Class - - - - (11,889,952) - - - -
- JPY Class D Institutional - - (2,135,799,578) - - - - - -
- USD Institutional Class (48,280,811) - - (1,663,026)
- - (364,424) (105,273) -
- USD Select Institutional Class - - - (76,467,632)
- - - - -
- GBP Institutional Class - - - - (406,761) - - - -
- GBP Hedged Institutional Class - - (414,248,897) - - - - - -
- CHF Institutional Class - (1,985,176) - - - - - - -
- CHF Hedged Class - - - - - - (14,611,997) - -
- Euro Class - - - - (79,422,288) - - - (3,968,635)
- Euro Hedged Institutional Class (184,745) (734,179,906) - - - - - -
Total payment on the redemption of participating shares (254,342,538) (47,181,113) (8,408,106,040) (98,405,420) (126,611,798) (44,879,086) (100,913,962) (105,273) (3,968,635)
(Decrease)/increase in net assets attributable to holders of
redeemable participating shares from operations (6,943,812) (945,937) (325,456,788) 6,922,447 96,865,710 (2,299,209) (26,256,284) 970,506 (278,575)
Net assets attributable to redeemable participating shares
at the end of year 173,539,783 126,506,035 21,651,567,060 - 896,846,108 94,641,292 326,318,843 13,094,398 34,367,452

E.I. Sturdza Funds Plc
Statement of Cash Flows
for the year ended 31 December 2016
74
Total Total
2016 2015
EUR EUR
Cash flows from operating activities
(Decrease)/increase in net assets attributable to holders of redeemable participating
shares from operations (92,445,018) 161,516,387
Adjustment to reconcile (decrease)/ increase in net assets attributable to
redeemable redeemable
Redeemable participating shares to net cash used in operating activities:-
Net decrease /(increase) in receivables 36,623,883 (7,023,339)
Net (decrease) /increase in liabilities (44,781,039) 2,383,212
Net decrease /(increase) in investments 215,903,205 (554,458,613)
Net cash inflow/(outflow) from operations 115,301,031 (397,582,353)
Cash flows from financing activities
Proceeds on issue of participating redeemable shares 976,707,695 1,096,890,482
Payments on the redemption of redeemable participating shares (1,091,186,173) (689,635,086)
Net cash (used in)/provided by financing activities (114,478,478) 407,255,396
Net movement in cash and cash equivalents 822,553 9,673,043
Cash and cash equivalents at beginning of the year 48,913,519 39,240,476
Cash and cash equivalents at end of the year 49,736,072 48,913,519
Cash and cash equivalents at end of the year is comprised of :
Cash and cash equivalents 49,736,072 48,913,519
Cash and cash equivalents at end of the year 49,736,072 48,913,519
Supplementary disclosure of cash flow information
Interest received 6,231,272 7,322,623
Dividend received 30,909,896 19,908,621
Interest paid
(11,198) (20,436)
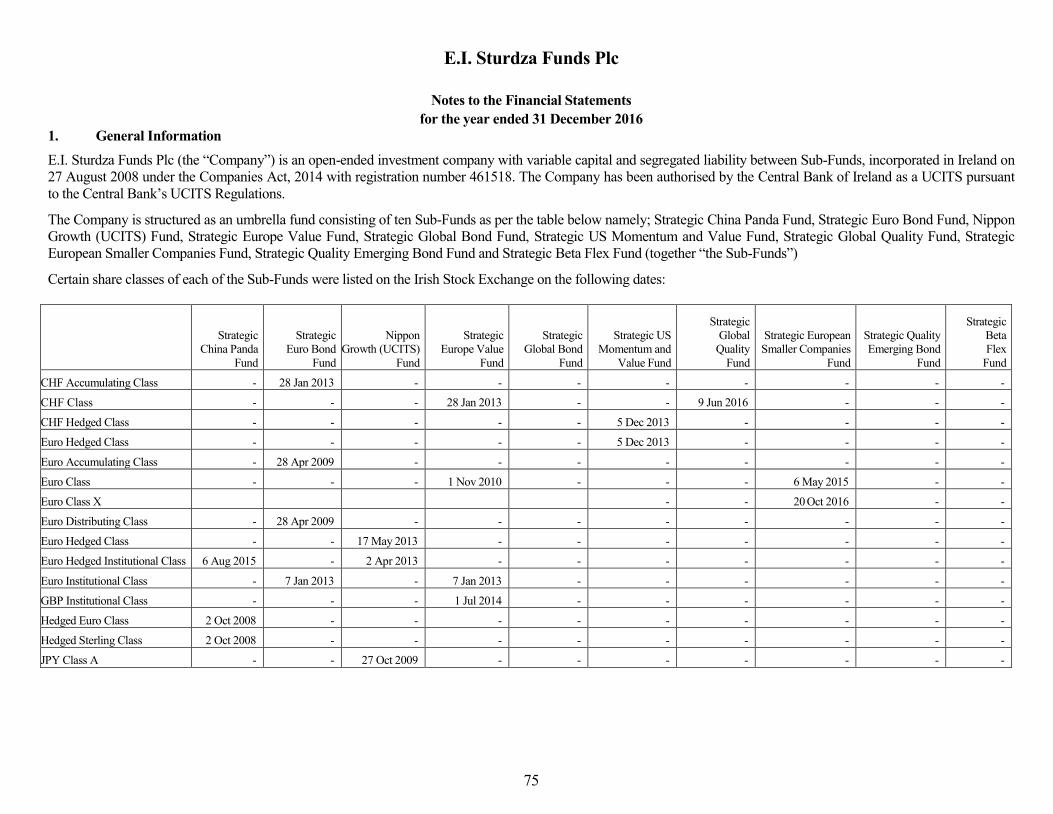
E.I. Sturdza Funds Plc
Notes to the Financial Statements
for the year ended 31 December 2016
75
1. General Information
E.I. Sturdza Funds Plc (the “Company”) is an open-ended investment company with variable capital and segregated liability between Sub-Funds, incorporated in Ireland on
27 August 2008 under the Companies Act, 2014 with registration number 461518. The Company has been authorised by the Central Bank of Ireland as a UCITS pursuant
to the Central Bank’s UCITS Regulations.
The Company is structured as an umbrella fund consisting of ten Sub-Funds as per the table below namely; Strategic China Panda Fund, Strategic Euro Bond Fund, Nippon
Growth (UCITS) Fund, Strategic Europe Value Fund, Strategic Global Bond Fund, Strategic US Momentum and Value Fund, Strategic Global Quality Fund, Strategic
European Smaller Companies Fund, Strategic Quality Emerging Bond Fund and Strategic Beta Flex Fund (together “the Sub-Funds”)
Certain share classes of each of the Sub-Funds were listed on the Irish Stock Exchange on the following dates:
Strategic
China Panda
Fund
Strategic
Euro Bond
Fund
Nippon
Growth (UCITS)
Fund
Strategic
Europe Value
Fund
Strategic
Global Bond
Fund
Strategic US
Momentum and
Value Fund
Strategic
Global
Quality
Fund
Strategic European
Smaller Companies
Fund
Strategic Quality
Emerging Bond
Fund
Strategic
Beta
Flex
Fund
CHF Accumulating Class - 28 Jan 2013 - - - - - - - -
CHF Class - - - 28 Jan 2013 - - 9 Jun 2016 - - -
CHF Hedged Class - - - - - 5 Dec 2013 - - - -
Euro Hedged Class - - - - - 5 Dec 2013 - - - -
Euro Accumulating Class - 28 Apr 2009 - - - - - - - -
Euro Class - - - 1 Nov 2010 - - - 6 May 2015 - -
Euro Class X
- - 20 Oct 2016 - -
Euro Distributing Class - 28 Apr 2009 - - - - - - - -
Euro Hedged Class - - 17 May 2013 - - - - - - -
Euro Hedged Institutional Class 6 Aug 2015 - 2 Apr 2013 - - - - - - -
Euro Institutional Class - 7 Jan 2013 - 7 Jan 2013 - - - - - -
GBP Institutional Class - - - 1 Jul 2014 - - - - - -
Hedged Euro Class 2 Oct 2008 - - - - - - - - -
Hedged Sterling Class 2 Oct 2008 - - - - - - - - -
JPY Class A - - 27 Oct 2009 - - - - - - -

E.I. Sturdza Funds Plc
Notes to the Financial Statements (continued)
for the year ended 31 December 2016
76
1. General Information (continued)
Strategic
China Panda
Fund
Strategic
Euro Bond
Fund
Nippon
Growth (UCITS)
Fund
Strategic
Europe Value
Fund
Strategic
Global Bond
Fund
Strategic US
Momentum and
Value Fund
Strategic
Global
Quality
Fund
Strategic European
Smaller Companies
Fund
Strategic Quality
Emerging Bond
Fund
Strategic
Beta
Flex
Fund
JPY Class B Accumulating - - 18 Jan 2010 - - - - - - -
JPY Class D Institutional - - 27 May 2013 - - - - - - -
RMB Class - - - - 18 Jul 2012 - - - - -
USD Class 2 Oct 2008 - - 15 Mar 2016 12 Jun 2012 2 Jul 2012 17 Feb 2016 - - -
USD Institutional Class 13 Mar 2014 - - 4 Dec 2015 - 30 Jun 2014 30 Dec 2014 - - -
Euro Institutional Distributing
Class - - - 11 Nov 2015 - - - - - -
Euro Retail Class - - - 18 Dec 2015 - - - - - -
Euro Super Institutional Class - - - 29 Sep 2016 - - - - -
USD Super Institutional Class - - - 29 Sep 2016 - - - - - -

E.I. Sturdza Funds Plc
Notes to the Financial Statements (continued)
for the year ended 31 December 2016
77
2. Basis of preparation
(a) Statement of compliance
The Financial Statements are prepared in accordance with International Financial Reporting Standards (IFRS)
as adopted by the EU and interpretations adopted by the International Accounting Standards Board (IASB).
The accounting policies set out in note 3 have been applied in preparing the financial statements for the
financial year ended 31 December 2016. The comparative information for the financial year ended 31
December 2015 presented in these financial statements have been prepared on consistent basis. These financial
statements have been prepared on a going concern basis.
These financial statements are also prepared in accordance with the Companies Act, 2014.
(b) Basis of measurement
The financial statements have been prepared on an historical cost basis, except for financial instruments
classified at fair value through profit or loss that have been measured at fair value.
(c) Functional and presentation currency
These financial statements are presented in Euro (€), which is the Company’s functional currency (Note 3(e)).
(d) Use of estimates and judgments
The preparation of financial statements, in conformity with IFRS requires management to make estimates and
assumptions that affect the reported amounts of assets and liabilities and disclosure of contingent assets and
liabilities at the date of the financial statements and the reported amounts of revenues and expenses during the
year. Actual results could differ from those estimates. The estimates and underlying assumptions are reviewed
on an ongoing basis. Revisions to accounting estimates are recognised in the year in which the estimate is
revised if the revision affects only that year or in the year of the revision and future years if the revision affects
both current and future years.
For financial instruments, where a quoted price is not available the Directors use a variety of techniques and
make assumptions that are based on market conditions existing at the statement of financial position date,
further details of which are outlined in Note 3(a)(iv) of the financial statements.
3. Significant Accounting Policies
The significant accounting policies adopted by the Company are as follows:
(a) Financial instruments
(i) Classification
The Company has classified its investments into the financial assets and liabilities at fair value through profit
or loss category in accordance with International Accounting Standards (“IAS”) 39.
E.I. Sturdza Funds Plc
Notes to the Financial Statements (continued)
for the year ended 31 December 2016
78
3. Significant Accounting Policies (continued)
(a) Financial instruments (continued)
(i) Classification (continued)
This category has two sub-categories: financial assets and liabilities held for trading, and those designated as at
fair value through profit or loss upon initial recognition. Financial assets or liabilities held for trading are
acquired or incurred principally for the purpose of selling or repurchasing in the short term. All investments
and derivative contracts have been categorised as held for trading.
(ii) Recognition and initial measurement
Financial assets and liabilities at fair value through profit and loss are recognised initially on the trade date at
which the Company becomes a party to contracted provisions of the instruments. Other financial assets and
liabilities are recognised on the date they are originated.
Financial assets and liabilities at fair value though profit or loss are measured initially at fair value, with
transaction costs recognised in the profit and loss. Financial assets or financial liabilities not at fair value
through profit and loss are measured initially at fair value plus transaction costs that are directly attributable to
its acquisition or issue.
(iii) Derecognition
A financial asset is derecognised when the Company no longer has control over the contractual rights that
comprise that asset. This occurs when the contractual rights to the cash flow from the asset expire or when it
transfers the rights to receive the contractual cash flows in a transaction in which substantially all of the risks
and rewards of ownership of the financial asset are transferred or in which the Company neither transfers nor
retains substantially all of the risks and rewards of ownership and does not retain control of the financial asset.
A financial liability is derecognised when it is extinguished or when the obligation specified in the contract is
discharged, cancelled or expired. Assets held for trading that are sold are derecognised and corresponding
receivables from the buyer for the payment are recognised as of the date the Company commits to sell the
assets.
(iv) Subsequent measurement
After initial measurement, the Company measures financial instruments which are classified as at fair value
through profit or loss, at their fair values. Fair value is the price that would be received to sell an asset or paid
to transfer a liability in an orderly transaction between market participants at the measurement date in the
principal or, in its absence, the most advantageous market to which the Fund has access at that date. The fair
value of a liability reflects its non-performance risk.
When available the Company measures the fair value of an instrument using the quoted price in an active
market for that instrument. A market is considered to be “active” if transactions for that asset or liability take
place with sufficient frequency and value to provide pricing information on an ongoing basis.
If a quoted market price is not available on a recognised stock exchange or from a reputable
broker/counterparty, the fair value of the financial instruments may be estimated by the Directors using
valuation techniques, including use of recent arm’s length market transactions, reference to the current fair
value of another instrument that is substantially the same, discounted cash flow techniques, option pricing
models or any other valuation technique that provides a reliable estimate of prices obtained in actual market
transactions.
E.I. Sturdza Funds Plc
Notes to the Financial Statements (continued)
for the year ended 31 December 2016
79
3. Significant Accounting Policies (continued)
(a) Financial instruments (continued)
(iv) Subsequent measurement (continued)
Where discounted cash flow techniques are used, estimated future cash flows are based on the Directors’ best
estimates and the discount rate used is a market rate at the Statement of Financial Position date applicable for
an instrument with similar terms and conditions. Where other pricing models are used, inputs are based on
market data available at the Statement of Financial Position date. Fair values for unquoted equity investments
are estimated, if possible, using price/earnings ratios for similar listed companies adjusted to reflect the specific
circumstances of the issuer.
Gains and losses arising from changes in the fair value of the ‘financial assets or financial liabilities at fair
value through profit or loss’ category are included in the Statement of Comprehensive Income in the year in
which they arise.
Realised gains and losses are calculated using the average cost method for Strategic China Panda Fund,
Strategic Euro Bond Fund, Nippon Growth (UCITS) Fund, Strategic Europe Value Fund and for Strategic
US Momentum and Value Fund. Strategic Global Bond Fund, Strategic Global Quality Fund, Strategic
European Smaller Companies Fund, Strategic Quality Emerging Bond Fund and Strategic Beta Flex Fund
using FIFO method. Net gain on financial assets and liabilities at fair value through profit or loss includes all
realised and unrealised fair value changes and foreign exchange differences but excludes interest on cash and
cash equivalents and dividend income.
Interest earned on fixed income securities is recorded on an effective interest rate basis (EIR) and is included
as a gain on financial assets and liabilities at fair value through profit or loss for the Strategic Euro Bond Fund,
the Strategic Global Bond Fund, and Strategic Quality Emerging Bond Fund.
(v) Specific instruments
Forward foreign exchange contracts
Forward foreign exchange contracts are fair valued by reference to the forward price at which a new forward
contract of the same size and maturity could be undertaken at the valuation date. The unrealised gain or loss on
open forward foreign exchange contracts is calculated as the difference between the forward rate for the
transaction specified in the contract and the forward rate on the valuation date as reported in published sources,
multiplied by the face amount of the forward contract. Any resulting unrealised gains are recorded as assets
and losses as liabilities in the Statement of Financial Position. Realised gains and losses are recognised in the
Statement of Comprehensive Income at the time the forward foreign exchange contract settles. Realised and
unrealised gains and losses applicable to forward foreign exchange contracts entered into at Sub-Funds level
are allocated at Sub-Fund level.
Futures Contracts
During a period in which futures contracts are open, changes in the value of the contracts are recognised as
unrealised gains and losses by marking-to-market on a daily basis to reflect the value of the contracts at the end
of each day’s trading. Futures contracts are valued at the settlement price established each day by the exchange
on which they are traded and the Company’s investment therein, representing unrealised gain or loss on the
contracts, is included in the Statement of Financial Position and in the Statement of Comprehensive Income.
Commission charges to open such contracts are expensed at the time that the contracts are opened.

E.I. Sturdza Funds Plc
Notes to the Financial Statements (continued)
for the year ended 31 December 2016
80
3. Significant Accounting Policies (continued)
(a) Financial instruments (continued)
(v) Specific instruments (continued)
Options
Options are valued at fair value based on the closing price on the relevant valuation date provided by the
relevant counterparty.
The premium on written call options exercised is added to the proceeds from the sale of the underlying security
or foreign currency in determining the realised gain or loss. The premium on written put options exercised is
subtracted from the cost of the securities or foreign currencies purchased. Premiums received from written
options, which expire unexercised, are treated as realised gains. For unsettled positions, unrealised gains or
losses are recognised in the Statement of Comprehensive Income.
Equitised participation notes Equitised participation notes are valued at fair value based on the closing price of the underlying reference
asset and prevailing spot currency exchange rate on the relevant valuation day. The notes represent an
exposure to reference assets such as equity securities.
The Company purchases a fully equitised instrument traded over the counter and designed to replicate the
performance of the underlying reference asset, similar to a total return swap but issued in note form and traded
over the counter with a selected market counterparty. Although the fair value of the participation note varies
dependent on the fair value of the underlying reference asset the participation note also bears a degree of credit
risk in addition to the market risk of the underlying reference asset as a result of the exposure to the
counterparty generated by the over the counter nature of the position.
As at the year end there was no counterparty exposure with respect to equitised participation notes.
(vi) Offsetting financial instruments
Financial assets and liabilities are offset and the net amount reported in Note 7 when there is a legally
enforceable right to set off the recognised amounts and there is an intention to settle on a net basis, or realise
the asset and settle the liability simultaneously.
The Company holds master netting or similar agreements with BNY Mellon Trust Company (Ireland)
Limited and Royal Bank of Scotland for the Strategic China Panda Fund, Strategic Euro Bond Fund, Nippon
Growth (UCITS) Fund, Strategic Europe Value Fund, Strategic Global Bond Fund, Strategic US Momentum
and Value Fund, Strategic Global Quality Fund, Strategic European Smaller Companies Fund, Strategic
Quality Emerging Bond Fund and Strategic Beta Flex Fund. The Company is considered to have a legally
enforceable right to set-off recognised amounts as further described in Note 7 to the financial statements,
however it is not expected to realise the relevant assets and settle the liabilities simultaneously and therefore
has not offset the relevant financial assets and liabilities under such agreements. During the year the Company
also held a master netting agreement or similar with HSBC Bank plc.
(b) Cash and cash equivalents
Cash comprises cash on hand and demand deposits. Cash equivalents are short term, highly liquid investments
that are readily convertible to known amounts of cash and which are subject to insignificant changes in value,
and are held for the purpose of the meeting short-term cash commitments rather than for investments or other
purposes.

E.I. Sturdza Funds Plc
Notes to the Financial Statements (continued)
for the year ended 31 December 2016
81
3. Significant Accounting Policies (continued)
(c) Taxation
Dividends, interest and capital gains (if any) received on investments made by the Sub-Funds may be subject
to withholding taxes imposed by the country from which the investment income/gains are received and such
taxes may not be recoverable by the Sub-Funds or its shareholders.
Income that is subject to such tax is recognised gross of the taxes and the corresponding withholding tax is
recognised as a tax expense.
(d) Other income
Other income includes income received from securities lending (Note 8), tax refunds and other miscellaneous
income. Investments on loan under securities lending agreements continue to be recognised in the Statement of
Financial Position as the Company continues to be exposed to all gains and losses arising from the ownership
of the securities and are measured in accordance with the accounting policies for financial instruments held for
trading.
(e) Foreign currency translation
(i) Functional and presentation currency
Items included in the Company’s financial statements are measured and presented using the currency of the
primary economic environment in which it operates (the ‘functional currency’). The Euro is the functional as
well as presentation currency for the Company.
The Sub-Funds functional and presentation currencies are as below:
Functional currency Presentation currency
Strategic China Panda Fund USD USD
Strategic Euro Bond Fund EUR EUR
Nippon Growth (UCITS) Fund JPY JPY
Strategic Europe Value Fund EUR EUR
Strategic Global Bond Fund USD USD
Strategic US Momentum and Value Fund USD USD
Strategic Global Quality Fund USD USD
Strategic European Smaller Companies Fund EUR EUR
Strategic Quality Emerging Bond Fund USD USD
Strategic Beta Flex Fund EUR EUR
For the purpose of aggregating the financial statements of the Sub-Funds, the Statement of Financial Position
figures for the Strategic China Panda Fund, Nippon Growth (UCITS) Fund, Strategic Global Bond Fund,
Strategic US Momentum and Value Fund, Strategic Global Quality Fund and Strategic Quality Emerging
Bond Fund have been translated to Euro at the exchange rate ruling at the year end, while the Statement of
Comprehensive Income, Statement of Changes in Net Assets Attributable to Holders of Redeemable
Participating Shares and Statement of Cash Flows have been translated at the average exchange rate for the
year. The resulting gain or loss that arises at the Company level has no effect on the Net Asset Value per share
attributable to the individual Sub-Funds.
E.I. Sturdza Funds Plc
Notes to the Financial Statements (continued)
for the year ended 31 December 2016
82
3. Significant Accounting Policies (continued)
(e) Foreign currency translation (continued)
(ii) Foreign currency transactions
Monetary assets and liabilities denominated in currencies other than Euro are translated into Euro at the closing
rates of exchange at each year end. Transactions during the year, including purchases and sales of securities,
income and expenses, are translated at the rate of exchange prevailing on the date of the transaction. Foreign
currency translation gains and losses are included in realised and unrealised gain and loss on investments, in
the Statement of Comprehensive Income. Non-monetary assets and liabilities measured at fair value are re-
translated into Euro at the prevailing foreign exchange rate on the date at which fair value is determined.
(f) Amounts due from and to brokers
Amounts due from and to brokers represent receivables for securities sold and payables for securities
purchased that have been contracted for but not yet settled or delivered on the Statement of Financial Position
date, respectively.
(g) Dividend income
Dividends are credited to the Statement of Comprehensive Income on the dates on which the relevant
securities are listed as “ex-dividend”. Income is shown gross of any non-recoverable withholding taxes, which
are disclosed separately in the Statement of Comprehensive Income, and net of any tax credits.
(h) Interest income and expense
Interest income and interest expense are recognised in the Statement of Comprehensive Income on an effective
interest rate basis.
(i) Fees and Expenses
All expenses, including management and performance fees, are recognised in the Statement of Comprehensive
Income on an accruals basis.
(j) Redeemable participating shares
Redeemable participating shares are redeemable at the shareholder’s option and are classified as financial
liabilities. The participating shares can be put back to the Sub-Funds on any dealing day for cash equal to a
proportionate share of the Sub-Fund’s Net Asset Value.
(k) Transaction costs
Transaction costs are incremental costs that are directly attributable to the acquisition, issue or disposal of a
financial asset or financial liability. An incremental cost is one that would not have been incurred if the entity
had not acquired, issued or disposed of the financial instrument.
Transaction costs on the purchase of bonds and forwards are included on the purchase and sale price of the
investment. They cannot be practically or reliably gathered as they are embedded in the cost of the investment
and cannot be separately verified or disclosed.

E.I. Sturdza Funds Plc
Notes to the Financial Statements (continued)
for the year ended 31 December 2016
83
3. Significant Accounting Policies (continued)
(k) Transaction costs (continued)
Transaction costs on purchases and sales of equities, options and futures are included in net gains/(losses) on
investments in the Statement of Comprehensive Income for each Sub-Fund.
(l) Standards, amendments and interpretations that are effective 1 January 2016 and have been
adopted by the Company
Amendments to IAS 1 Presentation of Financial Statements: In December 2014, the International
Accounting Standards Board issued amendments to IAS 1 Presentation of Financial Statements and an
exposure draft proposing amendments to IAS 7 Statement of Cash Flows as part of its Disclosure Initiative.
The following narrow-scope amendments have been made to IAS 1:
Materiality and aggregation: clarifies that an entity should not obscure useful information by
aggregating or disaggregating information; and that materiality considerations apply to the
primary statements, notes and any specific disclosure requirements in IFRSs, i.e. disclosures
specifically required by IFRSs need to be provided only if the information is material.
Statement of Financial Position and Statement of Comprehensive Income: clarifies that the list of
line items specified by IAS 1 for these statements can be disaggregated and aggregated as
relevant. Additional guidance has been added on the presentation of subtotals in these statements.
Presentation of items of other comprehensive income (“OCI”): clarifies that an entity’s share of
OCI of equity-accounted associates and joint ventures should be presented in aggregate as single
line items based on whether or not it will subsequently be reclassified to profit or loss.
Notes: clarifies that entities have flexibility when designing the structure of the notes and
provides guidance on how to determine a systematic order of the notes. Also, unhelpful examples
regarding the identification of a significant accounting policy have been removed.
The amendments are applicable for annual periods beginning on or after 1 January 2016, with early adoption
permitted. Based on the initial assessment, this standard is not expected to have a material impact on the
Company.
Amendments to IFRS 10, IFRS 12 and IAS 28: On 18 December 2014, the International Accounting
Standards Board (IASB) issued Investment Entities: Applying the Consolidation Exception (amendments to
IFRS 10, IFRS 12 and IAS 28). The amendments address the following issues that have arisen in applying the
investment entities exception under IFRS 10 Consolidated Financial Statements:
Exemption from preparing consolidated financial statements: the amendments clarify that the
exemption from presenting consolidated financial statements applies to a parent entity that is a
subsidiary of an investment entity, when the investment entity measures all of its subsidiaries at
fair value.
Subsidiary that provides services that support the investment entity’s investment activities: the
amendments clarify that only a subsidiary that is not an investment entity itself and provides
support services to the investment entity is consolidated. All other subsidiaries of an investment
entity are measured at fair value.

E.I. Sturdza Funds Plc
Notes to the Financial Statements (continued)
for the year ended 31 December 2016
84
3. Significant Accounting Policies (continued)
(l) Standards, amendments and interpretations that are effective 1 January 2016 and have been
adopted by the Company (continued)
Amendments to IFRS 10, IFRS 12 and IAS 28: (continued)
Application of the equity method by a non-investment entity that has an interest in an associate or joint venture
that is an investment entity: the amendments to IAS 28 Investments in Associates and Joint Ventures allow the
investor, when applying the equity method, to retain the fair value measurement applied by the investment
entity associate or joint venture to its interests in subsidiaries.
The amendments are applied retrospectively for annual periods beginning on or after 1 January 2016, with
early adoption permitted. Based on the initial assessment, this standard is not expected to have a material
impact on the Company.
(m) Accounting standards in issue that are not yet effective and have not been early adopted
IFRS 15, 'Revenue from Contracts with Customers' (effective 1 January, 2018): IFRS 15 requires entities
to recognise revenue to depict the transfer of promised goods or services to customers in an amount that
reflects the consideration to which the entity expects to be entitled in exchange for those goods or services.
This core principle is achieved through a five step methodology that is required to be applied to all contracts
with customers. This standard is not expected to have a material impact on the Company.
IFRS 9, ‘Financial Instruments’ (effective 1 January 2018): IFRS 9, published in July 2014, will replace
the existing guidance in IAS 39. It includes revised guidance on the classification and measurement of
financial instruments, including a new expected credit loss model for calculating impairment on financial
assets, and the new general hedge accounting requirements. It also carries forward the guidance on recognition
and derecognition of financial instruments from IAS 39.
IFRS 9 is effective for annual reporting periods beginning on or after 1 January 2018, with early adoption
permitted. Based on the initial assessment, this standard is not expected to have a material impact on the
Company.
Amendments to IAS 12 – ‘Income Taxes’ issued by IASB effective 1 January 2017 clarify that:
Unrealised losses on debt instruments measured at fair value in the financial statements but at cost for
tax purposes can give rise to deductible temporary differences.
The carrying amount of an asset does not limit the estimation of probable future taxable profits
Estimates for future taxable profits excludes tax deductions resulting from the reversal of those
deductible temporary differences.
An entity assesses a deferred tax asset in combination with other deferred tax assets. Where tax law
restricts the utilisation of tax losses, an entity would assess a deferred tax asset in combination with
other deferred tax assets of the same type.

E.I. Sturdza Funds Plc
Notes to the Financial Statements (continued)
for the year ended 31 December 2016
85
3. Significant Accounting Policies (continued)
(m) Accounting standards in issue that are not yet effective and have not been early adopted
(continued)
The amendments are effective for annual periods beginning on or after 1 January 2017. Earlier application is
permitted. As transition relief, an entity may recognise the change in the opening equity of the earliest
comparative period in opening retained earnings on initial application without allocating the change between
opening retained earnings and other components of equity. This standard is not expected to have a material
impact on the Company.
Amendments to IAS 7: Statement of Cash Flows (effective 1 January 2017): The International Accounting
Standards Board (IASB) has published amendments to IAS 7 'Statement of Cash Flows'. The amendments are
intended to clarify IAS 7 to improve information provided to users of financial statements about an entity's
financing activities. To achieve this objective, the IASB requires that the following changes in liabilities
arising from financing activities are disclosed (to the extent necessary): (i) changes from financing cash flows;
(ii) changes arising from obtaining or losing control of subsidiaries or other businesses; (iii) the effect of
changes in foreign exchange rates; (iv) changes in fair values; and (v) other changes. They are effective for
annual periods beginning on or after 1 January 2017, with earlier application being permitted.This standard is
not expected to have a material impact on the Company.

E.I. Sturdza Funds Plc
Notes to the Financial Statements (continued)
for the year ended 31 December 2016
86
4. Financial Assets and Liabilities at Fair Value through Profit or Loss
Total
Strategic
China
Panda
Fund
Strategic
Euro
Bond
Fund
Nippon
Growth
(UCITS)
Fund
Strategic
Europe
Value
Fund
Strategic
Global
Bond
Fund
Strategic US
Momentum
and Value
Fund
Strategic
Global
Quality
Fund
Strategic
European
Smaller
Companies
Fund
Strategic
Quality
Emerging
Bond
Fund(1)
Strategic
Beta
Flex
Fund(2)
2016 2016 2016 2016 2016 2016 2016 2016 2016 2016 2016
EUR USD EUR JPY EUR USD USD USD EUR USD EUR
Financial Assets at Fair Value
through Profit or Loss
Held for trading:
Investment funds 6,236,940 - - - - - - - 4,094,632 - 2,638,596
Transferable securities
- Equity securities 1,344,397,202 85,814,324 - 4,149,745,494 921,625,415 - 203,939,946 57,995,962 59,340,513 - -
- Debt securities 171,601,689 - 64,716,347 - - 63,007,371 - - - 49,729,943 -
Financial derivatives - - - - - - - - - -
- Forward foreign exchange contracts 796,992 258,168 - 5,386,457 309 5,679 117,801 82,639 - 329,832 -
- Option Contracts 135,055 - - - - - 142,450 - - - - Total financial assets at fair value
through profit or loss 1,523,167,878 86,072,492 64,716,347 4,155,131,951 921,625,724 63,013,050 204,200,197 58,078,601 63,435,145 50,059,775 2,638,596
Financial Liabilities at Fair Value
through Profit or Loss
Held for trading:
Transferable securities
- Equity Securities - - - - - - - - - - -
Financial derivatives
- Forward foreign exchange contracts (209,124) (1,229) (14,164) - (192,659) - (1,198) - - - -
- Option Contracts (686,419) - - - - - (724,000) - - - - Total financial liabilities at fair
value through profit or loss (895,543) (1,229) (14,164) - (192,659) - (725,198) - - - -
Net gain/(loss) on financial assets
and liabilities at fair value through
profit or loss
(120,006,171) (7,882,489) (980,796) (2,756,727,733) (81,350,640)
(857,859) (7,915,566) (4,336,421) 6,842,213 (2,877,275)(1) 11,596(2)
(1)For the period 28 April 2016 (commenced operations) to 31 December 2016.
(2) For the period 23 December 2016 (commenced operations) to 31 December 2016
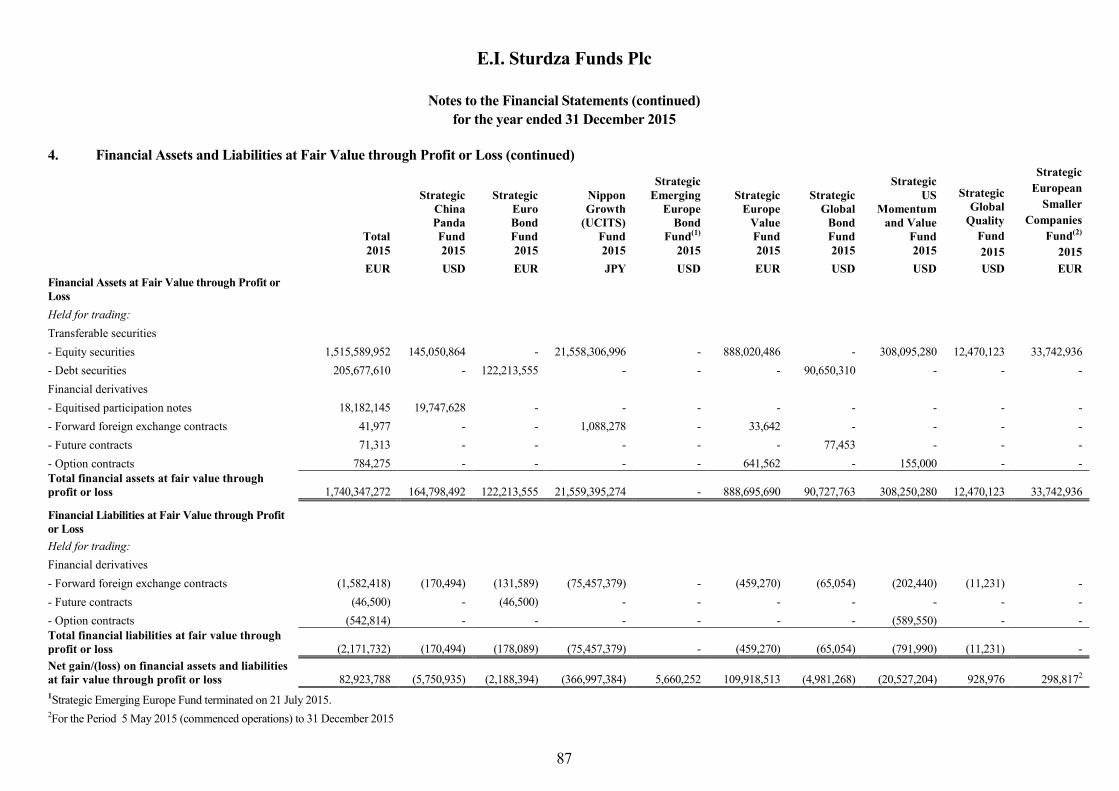
E.I. Sturdza Funds Plc
Notes to the Financial Statements (continued)
for the year ended 31 December 2015
87
4. Financial Assets and Liabilities at Fair Value through Profit or Loss (continued)
Total
Strategic
China
Panda
Fund
Strategic
Euro
Bond
Fund
Nippon
Growth
(UCITS)
Fund
Strategic
Emerging
Europe
Bond
Fund(1)
Strategic
Europe
Value
Fund
Strategic
Global
Bond
Fund
Strategic
US
Momentum
and Value
Fund
Strategic
Global
Quality
Fund
Strategic
European
Smaller
Companies
Fund(2)
2015 2015 2015 2015 2015 2015 2015 2015 2015 2015
EUR USD EUR JPY USD EUR USD USD USD EUR
Financial Assets at Fair Value through Profit or
Loss
Held for trading:
Transferable securities
- Equity securities 1,515,589,952 145,050,864 - 21,558,306,996 - 888,020,486 - 308,095,280 12,470,123 33,742,936
- Debt securities 205,677,610 - 122,213,555 - - - 90,650,310 - - -
Financial derivatives
- Equitised participation notes 18,182,145 19,747,628 - - - - - - - -
- Forward foreign exchange contracts 41,977 - - 1,088,278 - 33,642 - - - -
- Future contracts 71,313 - - - - - 77,453 - - -
- Option contracts 784,275 - - - - 641,562 - 155,000 - - Total financial assets at fair value through
profit or loss 1,740,347,272 164,798,492 122,213,555 21,559,395,274 - 888,695,690 90,727,763 308,250,280 12,470,123 33,742,936
Financial Liabilities at Fair Value through Profit
or Loss
Held for trading:
Financial derivatives
- Forward foreign exchange contracts (1,582,418) (170,494) (131,589) (75,457,379) - (459,270) (65,054) (202,440) (11,231) -
- Future contracts (46,500) - (46,500) - - - - - - -
- Option contracts (542,814) - - - - - - (589,550) - - Total financial liabilities at fair value through
profit or loss (2,171,732) (170,494) (178,089) (75,457,379) - (459,270) (65,054) (791,990) (11,231) -
Net gain/(loss) on financial assets and liabilities
at fair value through profit or loss 82,923,788 (5,750,935) (2,188,394) (366,997,384) 5,660,252 109,918,513 (4,981,268) (20,527,204) 928,976 298,8172
1Strategic Emerging Europe Fund terminated on 21 July 2015. 2For the Period 5 May 2015 (commenced operations) to 31 December 2015

E.I. Sturdza Funds Plc
Notes to the Financial Statements (continued)
for the year ended 31 December 2016
88
4. Financial Assets and Liabilities at Fair Value through Profit or Loss (continued)
The following tables present the financial instruments carried on the Statement of Financial Position by caption
and by level within the fair valuation hierarchy as at 31 December 2016 and 31 December 2015.
Strategic China Panda Fund Level 1 Level 2 Level 3 Total
2016 2016 2016 2016
USD USD USD USD
Financial Assets at Fair Value
through Profit or Loss
Held for trading:
- Equity securities 85,814,324 - - 85,814,324
- Forward foreign exchange contracts - 258,168 - 258,168
Total financial assets at fair value
through profit or loss 85,814,324 258,168 - 86,072,492
Financial Liabilities at Fair Value
through Profit or Loss
Held for trading:
- Forward foreign exchange contracts - 1,229 - 1,229
Total financial liabilities at fair value
through profit or loss - 1,229 - 1,229
The following table includes a roll forward of Level 3 reconciliation for the period/year ended 31 December
2016 and 31 December 2015.
2016 2015
Total Total
USD USD
Opening Balance 6,624,397 -
Transfer from Level 1 - 13,244,228
Purchases - 840,517
Sales/Settlements (4,591,553) (1,847,218)
Realised Gains/(Losses) (4,621,290) 490,238
Unrealised Gains/(Losses) 2,588,446 (6,103,368)
Closing Balance - 6,624,397
The Company considers transfers between levels to have occurred at the beginning of the reporting period
Strategic China Panda Fund Level 1 Level 2 Level 3 Total
2015 2015 2015 2015
USD USD USD USD
Financial Assets at Fair Value
through Profit or Loss
Held for trading:
- Equity securities 134,999,590 3,426,877 6,624,397 145,050,864
- Equitised participation notes - 19,747,628 - 19,747,628
Total financial assets at fair value
through profit or loss 134,999,590 23,174,505 6,624,397 164,798,492
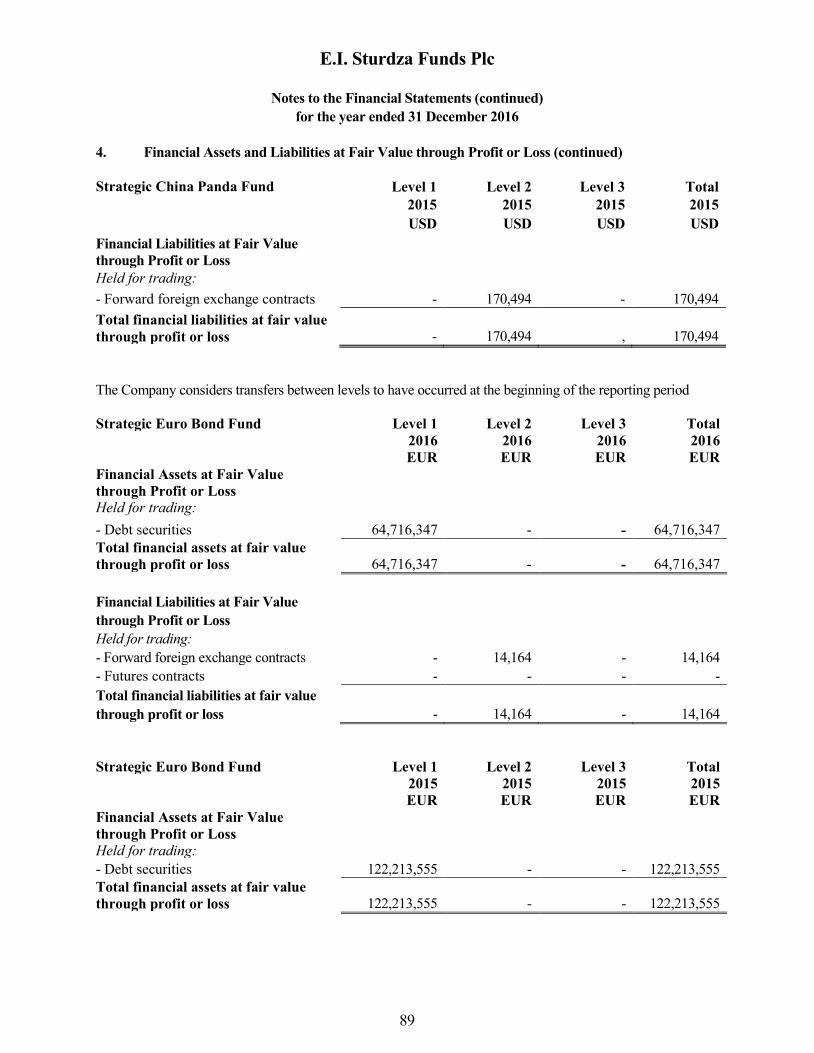
E.I. Sturdza Funds Plc
Notes to the Financial Statements (continued)
for the year ended 31 December 2016
89
4. Financial Assets and Liabilities at Fair Value through Profit or Loss (continued)
Strategic China Panda Fund Level 1 Level 2 Level 3 Total
2015 2015 2015 2015
USD USD USD USD
Financial Liabilities at Fair Value
through Profit or Loss
Held for trading:
- Forward foreign exchange contracts - 170,494 - 170,494
Total financial liabilities at fair value
through profit or loss - 170,494 , 170,494
The Company considers transfers between levels to have occurred at the beginning of the reporting period
Strategic Euro Bond Fund Level 1 Level 2 Level 3 Total
2016 2016 2016 2016
EUR EUR EUR EUR
Financial Assets at Fair Value
through Profit or Loss
Held for trading:
- Debt securities 64,716,347 - - 64,716,347
Total financial assets at fair value
through profit or loss 64,716,347 - - 64,716,347
Financial Liabilities at Fair Value
through Profit or Loss
Held for trading:
- Forward foreign exchange contracts - 14,164 - 14,164
- Futures contracts - - - -
Total financial liabilities at fair value
through profit or loss - 14,164 - 14,164
Strategic Euro Bond Fund Level 1 Level 2 Level 3 Total
2015 2015 2015 2015
EUR EUR EUR EUR
Financial Assets at Fair Value
through Profit or Loss
Held for trading:
- Debt securities 122,213,555 - - 122,213,555
Total financial assets at fair value
through profit or loss 122,213,555 - - 122,213,555
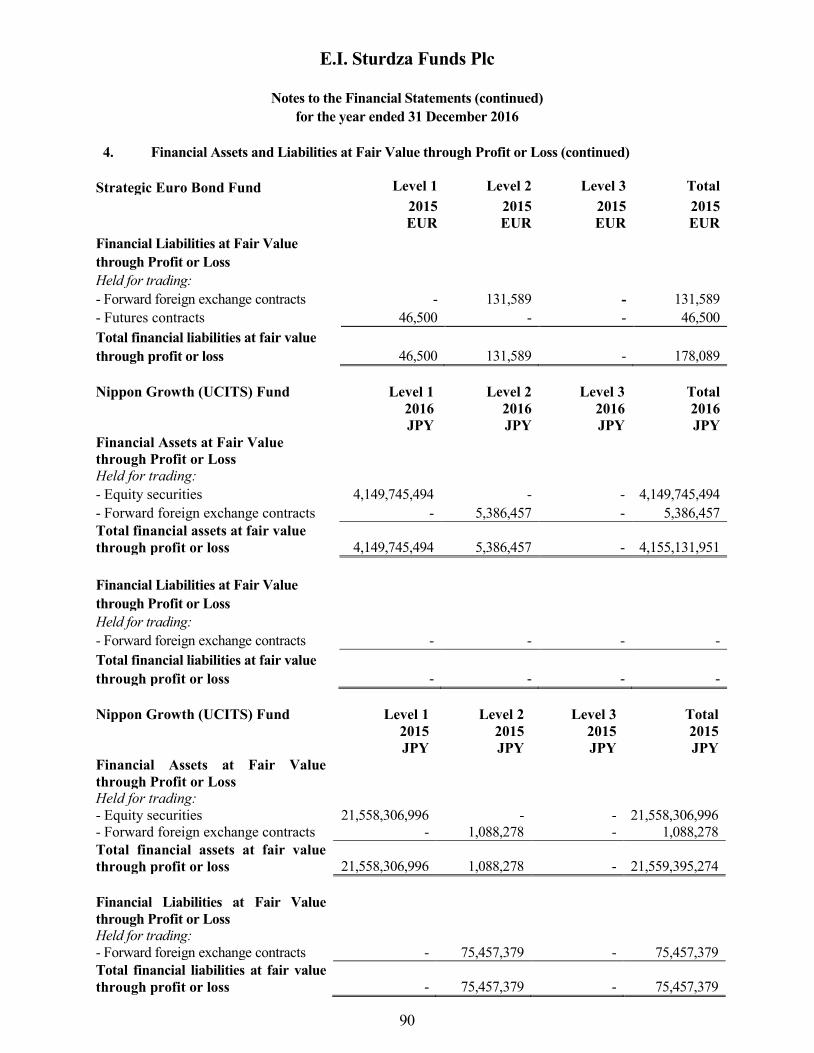
E.I. Sturdza Funds Plc
Notes to the Financial Statements (continued)
for the year ended 31 December 2016
90
4. Financial Assets and Liabilities at Fair Value through Profit or Loss (continued)
Strategic Euro Bond Fund Level 1 Level 2 Level 3 Total
2015 2015 2015 2015
EUR EUR EUR EUR
Financial Liabilities at Fair Value
through Profit or Loss
Held for trading:
- Forward foreign exchange contracts - 131,589 - 131,589
- Futures contracts 46,500 - - 46,500
Total financial liabilities at fair value
through profit or loss 46,500 131,589 - 178,089
Nippon Growth (UCITS) Fund Level 1 Level 2 Level 3 Total
2016 2016 2016 2016
JPY JPY JPY JPY
Financial Assets at Fair Value
through Profit or Loss
Held for trading:
- Equity securities 4,149,745,494 - - 4,149,745,494
- Forward foreign exchange contracts - 5,386,457 - 5,386,457
Total financial assets at fair value
through profit or loss 4,149,745,494 5,386,457 - 4,155,131,951
Financial Liabilities at Fair Value
through Profit or Loss
Held for trading:
- Forward foreign exchange contracts - - - -
Total financial liabilities at fair value
through profit or loss - - - -
Nippon Growth (UCITS) Fund Level 1 Level 2 Level 3 Total
2015 2015 2015 2015
JPY JPY JPY JPY
Financial Assets at Fair Value
through Profit or Loss
Held for trading:
- Equity securities 21,558,306,996 - - 21,558,306,996
- Forward foreign exchange contracts - 1,088,278 - 1,088,278
Total financial assets at fair value
through profit or loss 21,558,306,996 1,088,278 - 21,559,395,274
Financial Liabilities at Fair Value
through Profit or Loss
Held for trading:
- Forward foreign exchange contracts - 75,457,379 - 75,457,379
Total financial liabilities at fair value
through profit or loss - 75,457,379 - 75,457,379
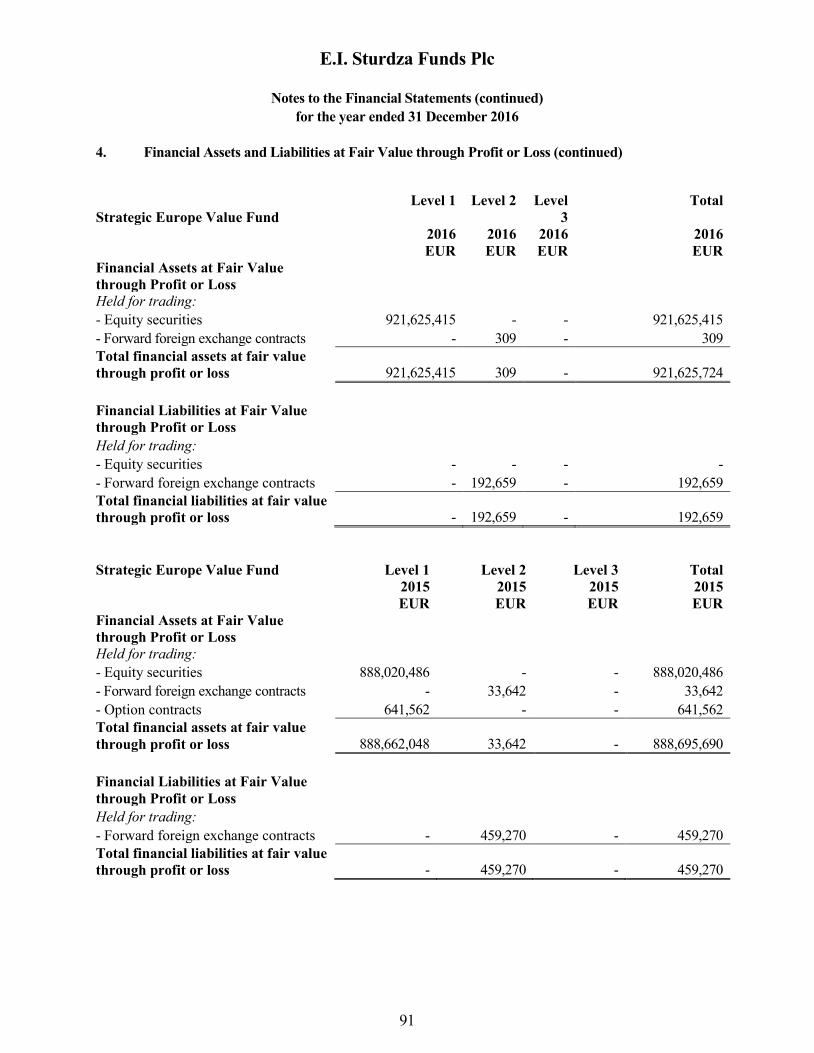
E.I. Sturdza Funds Plc
Notes to the Financial Statements (continued)
for the year ended 31 December 2016
91
4. Financial Assets and Liabilities at Fair Value through Profit or Loss (continued)
Strategic Europe Value Fund
Level 1 Level 2 Level
3
Total
2016 2016 2016 2016
EUR EUR EUR EUR
Financial Assets at Fair Value
through Profit or Loss
Held for trading:
- Equity securities 921,625,415 - - 921,625,415
- Forward foreign exchange contracts - 309 - 309
Total financial assets at fair value
through profit or loss 921,625,415 309 - 921,625,724
Financial Liabilities at Fair Value
through Profit or Loss
Held for trading:
- Equity securities - - - -
- Forward foreign exchange contracts - 192,659 - 192,659
Total financial liabilities at fair value
through profit or loss - 192,659 - 192,659
Strategic Europe Value Fund Level 1 Level 2 Level 3 Total
2015 2015 2015 2015
EUR EUR EUR EUR
Financial Assets at Fair Value
through Profit or Loss
Held for trading:
- Equity securities 888,020,486 - - 888,020,486
- Forward foreign exchange contracts - 33,642 - 33,642
- Option contracts 641,562 - - 641,562
Total financial assets at fair value
through profit or loss 888,662,048 33,642 - 888,695,690
Financial Liabilities at Fair Value
through Profit or Loss
Held for trading:
- Forward foreign exchange contracts - 459,270 - 459,270
Total financial liabilities at fair value
through profit or loss - 459,270 - 459,270

E.I. Sturdza Funds Plc
Notes to the Financial Statements (continued)
for the year ended 31 December 2016
92
4. Financial Assets and Liabilities at Fair Value through Profit or Loss (continued)
Strategic Global Bond Fund Level 1 Level 2 Level 3 Total
2016 2016 2016 2016
USD USD USD USD
Financial Assets at Fair Value
through Profit or Loss
Held for trading:
- Debt securities 63,007,371 - - 63,007,371
- Forward foreign exchange contracts - 5,679 - 5,679
Total financial assets at fair value
through profit or loss 63,007,371 5,679 - 63,013,050
Financial Liabilities at Fair Value
through Profit or Loss
Held for trading:
- Forward foreign exchange contracts - - - -
Total financial liabilities at fair value
through profit or loss - - - -
Strategic Global Bond Fund Level 1 Level 2 Level 3 Total
2015 2015 2015 2015
USD USD USD USD
Financial Assets at Fair Value
through Profit or Loss
Held for trading:
- Debt securities 90,650,310 - - 90,650,310
- Future contracts 77,453 - - 77,453
Total financial assets at fair value
through profit or loss 90,727,763 - - 90,727,763
Financial Liabilities at Fair Value
through Profit or Loss
Held for trading:
- Forward foreign exchange contracts - 65,054 - 65,054
Total financial liabilities at fair value
through profit or loss - 65,054 - 65,054

E.I. Sturdza Funds Plc
Notes to the Financial Statements (continued)
for the year ended 31 December 2016
93
4. Financial Assets and Liabilities at Fair Value through Profit or Loss (continued)
Strategic US Momentum and Value
Fund Level 1 Level 2 Level 3 Total
2016 2016 2016 2016
USD USD USD USD
Financial Assets at Fair Value
through Profit or Loss
Held for trading:
- Equity securities 203,939,946 - - 203,939,946
- Option contracts 142,450 - - 142,450
- Forward foreign exchange contracts - 117,801 - 117,801
Total financial assets at fair value
through profit or loss 204,082,396 117,801 - 204,200,197
Financial Liabilities at Fair Value
through Profit or Loss
Held for trading:
- Forward foreign exchange contracts - 1,198 - 1,198
- Option contracts 724,000 - - 724,000
Financial Liabilities at Fair Value
through Profit or Loss 724,000 1,198 - 725,198
Strategic US Momentum and Value
Fund Level 1 Level 2 Level 3 Total
2015 2015 2015 2015
USD USD USD USD
Financial Assets at Fair Value
through Profit or Loss
Held for trading:
- Equity securities 308,095,280 - - 308,095,280
- Option contracts 155,000 - - 155,000
Total financial assets at fair value
through profit or loss 308,250,280 - - 308,250,280
Financial Liabilities at Fair Value
through Profit or Loss
Held for trading:
- Forward foreign exchange contracts - 202,440 - 202,440
- Option contracts 589,550 - - 589,550
Financial Liabilities at Fair Value
through Profit or Loss 589,550 202,440 - 791,990

E.I. Sturdza Funds Plc
Notes to the Financial Statements (continued)
for the year ended 31 December 2016
94
4. Financial Assets and Liabilities at Fair Value through Profit or Loss (continued)
Strategic Global Quality Fund Level 1 Level 2 Level 3 Total
2016 2016 2016 2016
USD USD USD USD
Financial Assets at Fair Value
through Profit or Loss
Held for trading:
- Equity securities 57,995,962 - - 57,995,962
- Forward foreign exchange contracts - 82,639 - 82,639
Total financial assets at fair value
through profit or loss 57,995,962 82,639 - 58,078,601
Financial Liabilities at Fair Value
through Profit or Loss
Held for trading:
- Forward foreign exchange contracts - - - -
Financial Liabilities at Fair Value
through Profit or Loss - - - -
Strategic Global Quality Fund Level 1 Level 2 Level 3 Total
2015 2015 2015 2015
USD USD USD USD
Financial Assets at Fair Value
through Profit or Loss
Held for trading:
- Equity securities 12,470,123 - - 12,470,123
Total financial assets at fair value
through profit or loss 12,470,123 - - 12,470,123
Financial Liabilities at Fair Value
through Profit or Loss
Held for trading:
- Forward foreign exchange contracts - 11,231 - 11,231
Financial Liabilities at Fair Value
through Profit or Loss - 11,231 - 11,231

E.I. Sturdza Funds Plc
Notes to the Financial Statements (continued)
for the year ended 31 December 2016
95
4. Financial Assets and Liabilities at Fair Value through Profit or Loss (continued)
Strategic European Smaller
Companies Fund Level 1 Level 2 Level 3 Total
2016 2016 2016 2016
EUR EUR EUR EUR
Financial Assets at Fair Value
through Profit or Loss
Held for trading:
- Investment Funds 4,094,632 - - 4,094,632
- Equity securities 59,340,513 - - 59,340,513
Total financial assets at fair value
through profit or loss 63,435,145 - - 63,435,145
Strategic European Smaller
Companies Fund Level 1 Level 2 Level 3 Total
2015 2015 2015 2015
EUR EUR EUR EUR
Financial Assets at Fair Value
through Profit or Loss
Held for trading:
- Investment Funds 2,998,733 - - 2,998,733
- Equity securities 30,744,203 - - 30,744,203
Total financial assets at fair value
through profit or loss 33,742,936 - - 33,742,936
Strategic Quality Emerging Bond
Fund Level 1 Level 2 Level 3 Total
2016 2016 2016 2016 USD USD USD USD
Financial Assets at Fair Value through
Profit or Loss
Held for trading:
- Debt securities 49,729,943 - - 49,729,943
- Forward foreign exchange contracts - 329,832 - 329,832
Total financial assets at fair value
through profit or loss 49,729,943 329,832 - 50,059,775

E.I. Sturdza Funds Plc
Notes to the Financial Statements (continued)
for the year ended 31 December 2016
96
4. Financial Assets and Liabilities at Fair Value through Profit or Loss (continued)
Strategic Beta Flex Fund Level 1 Level 2 Level 3 Total
2016 2016 2016 2016
EUR EUR EUR EUR
Financial Assets at Fair Value through
Profit or Loss
Held for trading:
- Investment Funds 2,638,596 - - 2,638,596
Total financial assets at fair value
through profit or loss 2,638,596 - - 2,638,596
IFRS 13 requires disclosure of financial instruments based on a fair value hierarchy that prioritises the inputs to
valuation techniques used to measure fair value. The hierarchy gives the highest priority to unadjusted quoted
prices in active markets for identical assets or liabilities (Level 1 measurements) and the lowest priority to
unobservable inputs (Level 3 measurements).
The three levels of the fair value hierarchy are described as follows:
Level 1 Inputs that reflect unadjusted quoted prices in active markets for identical assets or
liabilities that the Company has the ability to access at the measurement date; Level 2 Inputs other than quoted prices that are observable for the asset or liability either directly
or indirectly, including inputs in markets that are not considered to be active;
Level 3 Inputs that are unobservable.
Inputs are used in applying the various valuation techniques and broadly refer to the assumptions that market
participants use to make valuation decisions, including assumptions about risk. Inputs may include price
information, volatility statistics, specific and broad credit data, liquidity statistics, and other factors. A financial
instrument’s level within the fair value hierarchy is based on the lowest level of any input that is significant to
the fair value measurement. However, the determination of what constitutes “observable” requires significant
judgment by the Company. The Company considers observable data to be that market data which is readily
available, regularly distributed or updated, reliable and verifiable, not proprietary, and provided by independent
sources that are actively involved in the relevant market. The categorisation of a financial instrument within the
hierarchy is based upon the pricing transparency of the instrument and does not necessarily correspond to the
Company’s perceived risk of that instrument.
Investments
Investments whose values are traded based on quoted market prices in active markets, and are therefore
classified within level 1, include active traded listed equities, certain U.S. government and sovereign
obligations, and certain money market securities. The Company does not adjust the quoted price for such
instruments, even in situations where the Company holds a large position and a sale could reasonably impact
the quoted price.
Investments that trade in markets that are not considered to be active, but are valued based on quoted market
prices, dealer quotations or alternative pricing sources supported by observable inputs are classified within
level 2. As level 2 investments include positions that are not traded in active markets and/or are subject to

E.I. Sturdza Funds Plc
Notes to the Financial Statements (continued)
for the year ended 31 December 2016
97
4. Financial Assets and Liabilities at Fair Value through Profit or Loss (continued)
transfer restrictions, valuations may be adjusted to reflect illiquidity and/or non-transferability, which are
generally based on available market information.
Investments classified within level 3 have significant unobservable inputs, as they trade infrequently or not at
all. When observable prices are not available for these securities, the Directors use one or more valuation
techniques (e.g., the market approach or the income approach) for which sufficient and reliable data is
available. Within level 3, the use of the market approach generally consists of using comparable market
transactions, while the use of the income approach generally consists of the net present value of estimated
future cash flows, adjusted as appropriate for liquidity, credit, market and/or other risk factors.
Derivative Instruments
Derivative instruments can be exchange-traded or privately negotiated over-the-counter ("OTC"). Exchange-
traded derivatives, such as futures contracts and exchange traded option contracts, are typically classified
within level 1 or level 2 of the fair value hierarchy depending on whether or not they are deemed to be actively
traded.
OTC derivatives, such as generic forwards contracts, have inputs which can generally be corroborated by
market data and are therefore classified within level 2. In instances where models are used, the value of an
OTC derivative depends upon the contractual terms of, and specific risks inherent in, the instrument as well as
the availability and reliability of observable inputs. Such inputs include market prices for reference securities,
yield curves, credit curves, measures of volatility, prepayment rates and correlations of such inputs.
The fair value hierarchy for the Company’s assets and liabilities not measured at fair value is level 1 for cash
and cash equivalents and level 2 for subscriptions receivable, redemptions payable, due to/from broker and
short-term receivables and payables. The fair value is not disclosed as carrying value is an approximation of
the fair value given the short term nature of instruments.

E.I. Sturdza Funds Plc
Notes to the Financial Statements (continued)
for the year ended 31 December 2016
98
5. Fees and Expenses
Other Expenses
The Other Expenses figure included in the Statement of Comprehensive Income includes front end load
fees, tax advisory fees, administrator ancillary services fees, director’s insurance, listing fees, regulatory
fees, establishment costs, bank charges, broker fees and adjustments to fee estimates accrued at year end
that were subsequently clarified post year end.
Investment Manager’s Fees
The Investment Manager is entitled to a fee payable out of the assets of the relevant Sub-Fund an annual fee
accrued at each Valuation Point and payable monthly in arrears at the following rates:
Class Name
Strategic
China
Panda
Fund
Nippon
Growth
(UCITS)
Fund
Strategic
Euro
Bond
Fund
Strategic
Europe
Value
Fund
Strategic
Global
Bond
Fund
EUR Hedged Class 1.50% 1.50% - - -
Sterling Hedged Class 1.50% - - - -
EUR Hedged Institutional Class 1.00% 1.00% - - -
USD Institutional Class 1.00% - - 0.90% -
USD Class 1.50% - - 1.50% 0.90%
JPY Class A - 1.50% - - -
JPY Class B Accumulating - 1.50% - - -
JPY Class D Institutional - 1.00% - - -
CHF Accumulating Class - - 0.75% - -
Euro Accumulating Class - - 0.75% - -
Euro Distributing Class - - 0.75% - -
Euro R Class - - - 2.20% -
Euro Institutional Distributing Class - - - 0.90% -
Euro Super Institutional Class - - - 0.90% -
USD Super Institutional Class - - - 0.90% -
CHF Class - - - 1.50% -
EUR Class - - - 1.50% -
RMB Class - - - - 0.90%
EUR Institutional Class - - 0.45% 0.90% -
GBP Institutional Class - - - 0.90% -
GBP Hedged Institutional Class - 1.00% - - -
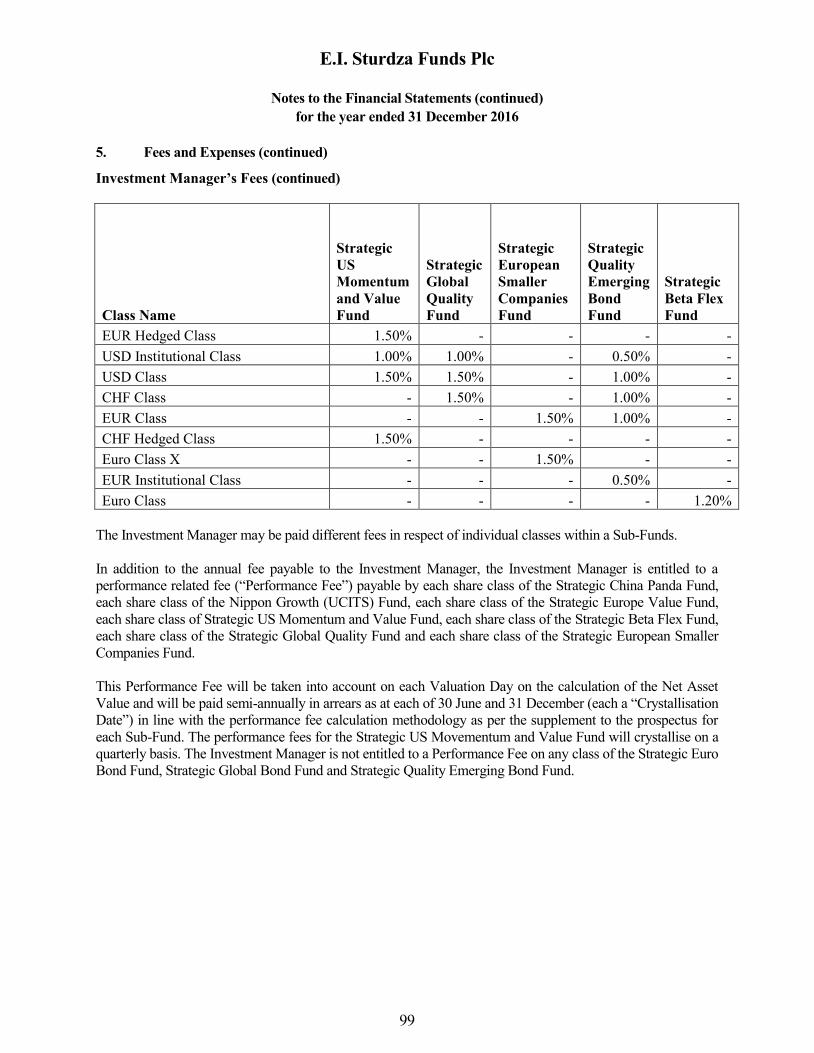
E.I. Sturdza Funds Plc
Notes to the Financial Statements (continued)
for the year ended 31 December 2016
99
5. Fees and Expenses (continued)
Investment Manager’s Fees (continued)
Class Name
Strategic
US
Momentum
and Value
Fund
Strategic
Global
Quality
Fund
Strategic
European
Smaller
Companies
Fund
Strategic
Quality
Emerging
Bond
Fund
Strategic
Beta Flex
Fund
EUR Hedged Class 1.50% - - - -
USD Institutional Class 1.00% 1.00% - 0.50% -
USD Class 1.50% 1.50% - 1.00% -
CHF Class - 1.50% - 1.00% -
EUR Class - - 1.50% 1.00% -
CHF Hedged Class 1.50% - - - -
Euro Class X - - 1.50% - -
EUR Institutional Class - - - 0.50% -
Euro Class - - - - 1.20%
The Investment Manager may be paid different fees in respect of individual classes within a Sub-Funds.
In addition to the annual fee payable to the Investment Manager, the Investment Manager is entitled to a
performance related fee (“Performance Fee”) payable by each share class of the Strategic China Panda Fund,
each share class of the Nippon Growth (UCITS) Fund, each share class of the Strategic Europe Value Fund,
each share class of Strategic US Momentum and Value Fund, each share class of the Strategic Beta Flex Fund,
each share class of the Strategic Global Quality Fund and each share class of the Strategic European Smaller
Companies Fund.
This Performance Fee will be taken into account on each Valuation Day on the calculation of the Net Asset
Value and will be paid semi-annually in arrears as at each of 30 June and 31 December (each a “Crystallisation
Date”) in line with the performance fee calculation methodology as per the supplement to the prospectus for
each Sub-Fund. The performance fees for the Strategic US Movementum and Value Fund will crystallise on a
quarterly basis. The Investment Manager is not entitled to a Performance Fee on any class of the Strategic Euro
Bond Fund, Strategic Global Bond Fund and Strategic Quality Emerging Bond Fund.

E.I. Sturdza Funds Plc
Notes to the Financial Statements (continued)
for the year ended 31 December 2016
100
5. Fees and Expenses (continued)
Investment Manager’s Fees (continued)
Classes Name
Strategic
China
Panda Fund
Nippon
Growth
(UCITS)
Fund
Strategic
Europe Value
Fund
Strategic US
Momentum
and
Value Fund
EUR Hedged Class 15.00% 2
15.00% 2
- 15.00%
Sterling Hedged Class 15.00% 2
- - -
EUR Hedged Institutional Class 10.00% 1
10.00% 1
- -
USD Institutional Class 10.00% 1
- 10.00% 10.00% 3
USD Class 15.00% 2
- 10.00% 15.00%
JPY Class A - 12.50% - -
JPY Class B Accumulating - 15.00% 2
- -
JPY CLASS D Institutional - 10.00% 1
- -
Euro R Class - - 10.00% -
Euro Institutional Distributing Class - - 10.00% -
Euro Institutional Class - - 10.00% -
Sterling Institutional Class - 15.00% 10.00% -
CHF Class - - 10.00% 15.00%
EUR Class - - 10.00% -
Classes Name
Strategic
Global
Quality
Fund
Strategic
European
Smaller
Companies
Fund
Strategic
Beta Flex
Fund
USD Institutional Class 10.00% - -
USD Class 10.00% - -
JPY Class A - - -
CHF Class 10.00% - -
EUR Class - 15.00% 2
-
CHF Hedged Class - - -
Euro Class X - 15.00% 2
-
Euro Class - - 10.00%
1 - On 1st July 2016, the performance fee rates were reduced from 20% to 10%
2 - On 1st July 2016, the performance fee rates were reduced from 20% to 15%
3 - On 1st July 2016, the performance fee rates were reduced from 15% to 10%
E.I. Sturdza Funds Plc
Notes to the Financial Statements (continued)
for the year ended 31 December 2016
101
5. Fees and Expenses (continued)
Investment Manager’s Fees (continued)
The Performance Fee is calculated for each individual share tranche subscribed as at a relevant valuation
point. For each subsequent subscription, the subscription amount is added to the Performance Fee as a
separate share tranche.
Investment Management fees for the year ended 31 December 2016 amounted to EUR 19,489,423 (2015:
EUR 18,471,720) of which EUR 1,555,904 (2015: EUR 1,791,725) was payable at year end.
Performance fees for the year ended 31 December 2016 amounted to EUR 6,741,515 (2015: EUR
17,102,160) of which EUR 399,935 (2015: EUR 13,173,467) was payable at year end.
Investment Adviser’s Fees
The investment Adviser’s Fees methodology of each of the Sub-Funds is set out in the relevant
supplemental prospectus relating to the Sub-Funds issued by the Company. All fees payable to any
appointed Investment Adviser shall be paid by the Investment Manager out of the remuneration it
receives pursuant to the terms of the Investment Management Agreement. All fees payable to any
appointed sub-investment adviser shall be paid by the Investment Adviser out of the remuneration it
receives pursuant to the terms of the Investment Management Agreement.
Administrators’s Fees
Until 3 November 2016; HSBC Securities Services (Ireland) Limited was the Administrator and entitled to a
fee payable out of the assets of the Company. An annual fee accrued at each Valuation Point and payable
monthly in arrears was charged at the following rates for Strategic European Smaller Companies Fund and
Strategic Global Quality Fund:
0.09% per annum of the Net Asset of each Sub-Fund on the portion of the Net Asset Value up to EUR
350 million;
0.05% per annum of the Net Asset of each Sub-Fund on the portion of the Net Asset Value in excess
of EUR 350 million;
subject to a monthly minimum fee of EUR 2,000 borne by each Sub-Fund (plus VAT, if any thereon).
The following rates were applied for Strategic China Panda Fund, Strategic Euro Bond Fund, Nippon Growth
(UCITS) Fund, Strategic Europe Value Fund, Strategic Global Bond Fund, Strategic Quality Emerging Bond
Fund and Strategic US Momentum and Value Fund:
0.1% per annum of the Net Asset of each Sub-Fund on the portion of the Net Asset Value up to EUR
350 million;
0.075% per annum of the Net Asset of each Sub-Fund on the portion of the Net Asset Value in excess
of EUR 350 million;
subject to a monthly minimum fee of EUR 4,000 and borne by each Sub-Fund (plus VAT, if any thereon).
On 4 November 2016; SS&C Financial Services (Ireland) Limited became the Administrator and is entitled to
a minimum fee of up to $166,667 per month (the “Monthly Minimum Fee”). The Monthly Minimum Fee is
applied when the calculated basis point fee is less than the minimum. Fees are calculated for each tier of assets
multiplied by the appropriate basis point figure as per below table.
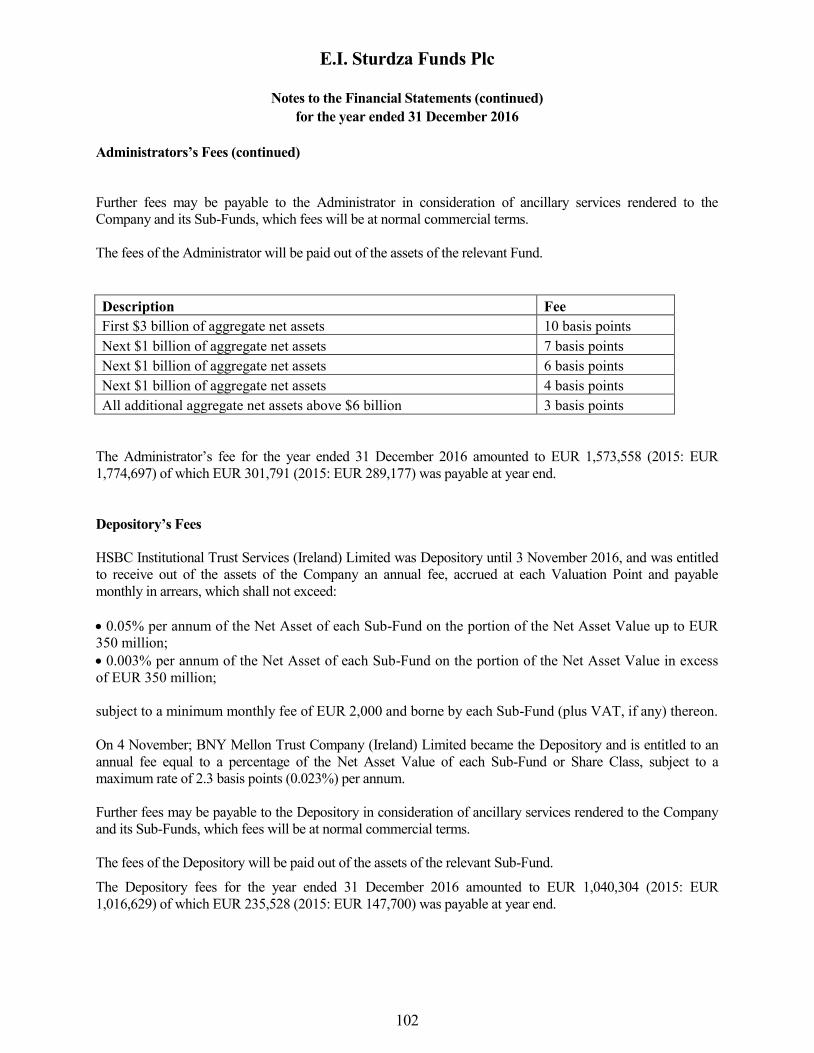
E.I. Sturdza Funds Plc
Notes to the Financial Statements (continued)
for the year ended 31 December 2016
102
Administrators’s Fees (continued)
Further fees may be payable to the Administrator in consideration of ancillary services rendered to the
Company and its Sub-Funds, which fees will be at normal commercial terms.
The fees of the Administrator will be paid out of the assets of the relevant Fund.
Description Fee
First $3 billion of aggregate net assets 10 basis points
Next $1 billion of aggregate net assets 7 basis points
Next $1 billion of aggregate net assets 6 basis points
Next $1 billion of aggregate net assets 4 basis points
All additional aggregate net assets above $6 billion 3 basis points
The Administrator’s fee for the year ended 31 December 2016 amounted to EUR 1,573,558 (2015: EUR
1,774,697) of which EUR 301,791 (2015: EUR 289,177) was payable at year end.
Depository’s Fees
HSBC Institutional Trust Services (Ireland) Limited was Depository until 3 November 2016, and was entitled
to receive out of the assets of the Company an annual fee, accrued at each Valuation Point and payable
monthly in arrears, which shall not exceed:
0.05% per annum of the Net Asset of each Sub-Fund on the portion of the Net Asset Value up to EUR
350 million;
0.003% per annum of the Net Asset of each Sub-Fund on the portion of the Net Asset Value in excess
of EUR 350 million;
subject to a minimum monthly fee of EUR 2,000 and borne by each Sub-Fund (plus VAT, if any) thereon.
On 4 November; BNY Mellon Trust Company (Ireland) Limited became the Depository and is entitled to an
annual fee equal to a percentage of the Net Asset Value of each Sub-Fund or Share Class, subject to a
maximum rate of 2.3 basis points (0.023%) per annum.
Further fees may be payable to the Depository in consideration of ancillary services rendered to the Company
and its Sub-Funds, which fees will be at normal commercial terms.
The fees of the Depository will be paid out of the assets of the relevant Sub-Fund.
The Depository fees for the year ended 31 December 2016 amounted to EUR 1,040,304 (2015: EUR
1,016,629) of which EUR 235,528 (2015: EUR 147,700) was payable at year end.

E.I. Sturdza Funds Plc
Notes to the Financial Statements (continued)
for the year ended 31 December 2016
103
5. Fees and Expenses (continued)
Directors’ Fees
The Articles of Association authorise the Directors to charge a fee for their services at a rate determined by the
Directors. The Directors shall receive a fee for their services up to a total aggregate maximum fee of Euro
400,000 per annum, or such other amount as may from time to time be disclosed in the annual report of the
Company. Any increase above the maximum permitted fee will be notified in advance to Shareholders. Each
Director may be entitled to special remuneration if called upon to perform any special or extra services to the
Company. All Directors will be entitled to reimbursement by the Company of expenses properly incurred in
connection with the business of the Company or the discharge of their duties.
The Directors fees for the year ended 31 December 2016 amounted to EUR 282,795 (2015: EUR 293,552) of
which EUR 67,239 (2015:EUR 73,907) was payable at year end.
Consulting Fees
The Company has appointed Bridge Consulting to provide services to assist the Directors in carrying out
the management functions specified by the Central Bank of Ireland. Bridge Consulting receives an annual
fee for governance services of no more than EUR 50,000, payable out of the assets of the Company,
accrued weekly and payable quarterly in arrears.
The Consulting fees for the year ended 31 December 2016 amounted to EUR 55,571 (2015: EUR 64,462). The
reason that this exceeds EUR 50,000 is due to the foreign exchange conversion across the Sub-Funds.
Legal Fees
The Company has appointed Dillon Eustace as Irish legal adviser to the Company. The legal fees for the
year ended 31 December 2016 amounted to EUR 169,462 (2015: EUR 135,920).
Company Secretarial Fees
The Company has appointed Sanne Group Plc as company secretary to the Company. The Company
Secretarial fees for the year ended 31 December 2016 amounted to EUR 23,441 (2015: EUR 19,993).
Transaction costs
The below table provides a breakdown of the total transaction costs for the year ended 31 December 2016
and 2015.
2016 2015
Strategic China Panda Fund USD 908,716 USD 2,515,950
Strategic Euro Bond Fund EUR 3,228 EUR 4,150
Nippon Growth (UCITS) Fund JPY 15,640,773 JPY 13,803,223
Strategic Emerging Europe Fund - USD 525,721
Strategic Europe Value Fund EUR 4,965,792 EUR 2,586,452
Strategic Global Bond Fund USD 2,879 USD 21,231
Strategic US Momentum & Value Fund USD 271,858 USD 424,738
Strategic Global Quality Fund USD 170,588 USD 24,392
Strategic European Smaller Companies Fund EUR 70,568 EUR 42,310
Strategic Beta Flex Fund EUR 57 -
Total EUR 6,391,374 EUR 5,918,935

E.I. Sturdza Funds Plc
Notes to the Financial Statements (continued)
for the year ended 31 December 2016
104
6. Share Capital
The authorised share capital of the Company is 500,000,000,000 shares of no par value initially designated as
redeemable participating shares and 300,000 redeemable non-participating shares of no par value.
The Company’s objective is managing the redeemable share capital to ensure a stable and strong base to
maximise returns to all investors, and to manage liquidity risk arising from redemptions.
The Company is a self managed UCITS company and the minimum capital requirement is met by taking into
account the participating and non-participating shares.
Non-participating shares do not entitle the holders thereof to any dividend and on a winding up entitle the
holders thereof to receive the amount paid up thereon but do not otherwise entitle them to participate in the
assets of the Company. The Directors have the power to allot shares in the capital of the Company on such
terms and in such manner as they may think fit. The authorised share capital of the Company is 300,000
redeemable non-participating shares of no par value and 500,000,000,000 participating shares of no par value.
There are two non-participating shares currently in issue. Non-participating shares have not been included in
these financial statements.
The movement in the number of participating redeemable shares during the year is as follows:
At
1 January 2016
Shares
Issued
Shares
Redeemed
At
31 December 2016
Strategic China Panda Fund
-USD Class 33,088.640 1,420.933 (15,993.786) 18,515.787
-Hedged Euro Class 17,314.616 641.393 (10,185.025) 7,770.984
-Hedged Sterling Class 266.200 - (129.006) 137.194
-USD Institutional Class 58,908.812 15,480.798 (36,153.212) 38,236.398
-Euro Hedged Institutional Class 7,050.896 3,388.186 (8,199.000) 2,240.082
Strategic Euro Bond Fund
-Euro Distributing Class 9,030.216 76.774 (6,272.702) 2,834.288
-Euro Accumulating Class 39,694.226 4,524.700 (14,935.455) 29,283.471
-EUR Institutional Class 50,770.137 13,402.798 (41,317.588) 22,855.347
-CHF Accumulating Class 22,965.573 1,685.026 (10,463.920) 14,186.679
-CHF Institutional Class 400.000 - (400.000) -
Nippon Growth (UCITS) Fund
-Euro Hedged Class 23,449.153 149.241 (19,492.475) 4,105.919
-JPY Class A Class 3,446.854 - (2,563.249) 883.605
-JPY Class B Class 89,645.329 1,782.740 (60,678.589) 30,749.480
-JPY Class D Institutional 129,966.402 - (117,661.611) 12,304.791
-Euro Hedged Institutional Class 3,224.472 519.982 (1,277.441) 2,467.013
-Sterling Hedged Institutional Class 12,800.993 - (12,800.993) -

E.I. Sturdza Funds Plc
Notes to the Financial Statements (continued)
for the year ended 31 December 2016
105
6. Share Capital (continued)
At
1 January 2016
Shares
Issued
Shares
Redeemed
At
31 December 2016
Strategic Europe Value Fund
-Euro Class 1,545,166.670 681,132.753 (711,825.400) 1,514,474.023
-EUR Institutional Class 2,331,943.404 2,386,911.201 (2,451,148.253) 2,267,706.352
-CHF Class 376,556.327 67,528.272 (143,918.355) 300,166.244
-Sterling Institutional Class 106,596.633 9,603.952 (9,822.772) 106,377.813
-Euro Institutional Distributing Class 505,364.797 288,622.833 (562,128.159) 231,859.471
-USD Institutional Class 108,630.000 83,522.707 (168,996.970) 23,155.737
-Euro Retail Class 98.500 112,642.584 (24,934.446) 87,806.638
-USD Class - 18,166.330 (5,199.597) 12,966.733
-EUR Super Institutional Class - 1,636,047.279 (45,134.631) 1,590,912.648
-USD Super Institutional Class - 24,840.816 (600.000) 24,240.816
Strategic Global Bond Fund
-USD Class 69,575.564 7,957.101 (27,251.408) 50,281.257
-RMB Class 21,290.112 - (77.010) 21,213.102
Strategic US Momentum and Value
Fund
-USD Class 325,934.376 8,662.503 (106,144.046) 228,452.833
-Euro Hedged Class 28,449.848 694.096 (25,137.424) 4,006.520
-CHF Hedged Class 26,725.349 1,713.642 (14,513.237) 13,925.754
-USD Institutional Class 92,835.326 15,871.403 (40,475.281) 68,231.448
Strategic Global Quality Fund
-USD Institutional Class 114,304.970 267,739.774 (49,925.415) 332,119.329
-USD Class - 185,453.398 (18,262.192) 167,191.206
-CHF Class - 79,194.756 (2,584.933) 76,609.823
Strategic European Smaller
Companies Fund
-Euro Class 34,614.798 23,767.356 (10,044.691) 48,337.463
-Euro X Class - 10,073.144 - 10,073.144
Strategic Quality Emerging
Bond Fund
-CHF Class - 11,956.212 (1,718.212) 10,238.000
-EUR Class - 13,062.564 (1,260.324) 11,802.240
-EUR Institutional Class - 3,006.260 - 3,006.260
-USD Class - 26,368.060 (6,942.820) 19,425.240
-USD Institutional Class - 6,508.220 - 6,508.220
Strategic Beta Flex Fund
-Euro Class - 5,506.150 - 5,506.150
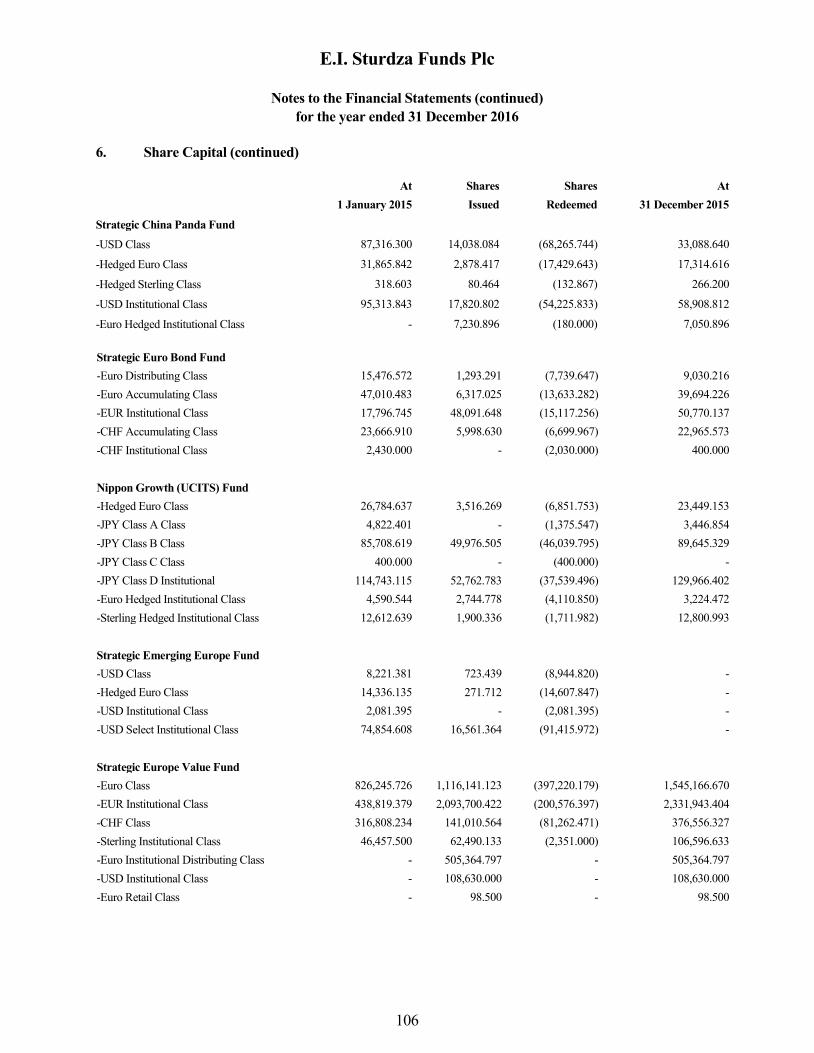
E.I. Sturdza Funds Plc
Notes to the Financial Statements (continued)
for the year ended 31 December 2016
106
6. Share Capital (continued)
At
1 January 2015
Shares
Issued
Shares
Redeemed
At
31 December 2015
Strategic China Panda Fund
-USD Class 87,316.300 14,038.084 (68,265.744) 33,088.640
-Hedged Euro Class 31,865.842 2,878.417 (17,429.643) 17,314.616
-Hedged Sterling Class 318.603 80.464 (132.867) 266.200
-USD Institutional Class 95,313.843 17,820.802 (54,225.833) 58,908.812
-Euro Hedged Institutional Class - 7,230.896 (180.000) 7,050.896
Strategic Euro Bond Fund
-Euro Distributing Class 15,476.572 1,293.291 (7,739.647) 9,030.216
-Euro Accumulating Class 47,010.483 6,317.025 (13,633.282) 39,694.226
-EUR Institutional Class 17,796.745 48,091.648 (15,117.256) 50,770.137
-CHF Accumulating Class 23,666.910 5,998.630 (6,699.967) 22,965.573
-CHF Institutional Class 2,430.000 - (2,030.000) 400.000
Nippon Growth (UCITS) Fund
-Hedged Euro Class 26,784.637 3,516.269 (6,851.753) 23,449.153
-JPY Class A Class 4,822.401 - (1,375.547) 3,446.854
-JPY Class B Class 85,708.619 49,976.505 (46,039.795) 89,645.329
-JPY Class C Class 400.000 - (400.000) -
-JPY Class D Institutional 114,743.115 52,762.783 (37,539.496) 129,966.402
-Euro Hedged Institutional Class 4,590.544 2,744.778 (4,110.850) 3,224.472
-Sterling Hedged Institutional Class 12,612.639 1,900.336 (1,711.982) 12,800.993
Strategic Emerging Europe Fund
-USD Class 8,221.381 723.439 (8,944.820) -
-Hedged Euro Class 14,336.135 271.712 (14,607.847) -
-USD Institutional Class 2,081.395 - (2,081.395) -
-USD Select Institutional Class 74,854.608 16,561.364 (91,415.972) -
Strategic Europe Value Fund
-Euro Class 826,245.726 1,116,141.123 (397,220.179) 1,545,166.670
-EUR Institutional Class 438,819.379 2,093,700.422 (200,576.397) 2,331,943.404
-CHF Class 316,808.234 141,010.564 (81,262.471) 376,556.327
-Sterling Institutional Class 46,457.500 62,490.133 (2,351.000) 106,596.633
-Euro Institutional Distributing Class - 505,364.797 - 505,364.797
-USD Institutional Class - 108,630.000 - 108,630.000
-Euro Retail Class - 98.500 - 98.500
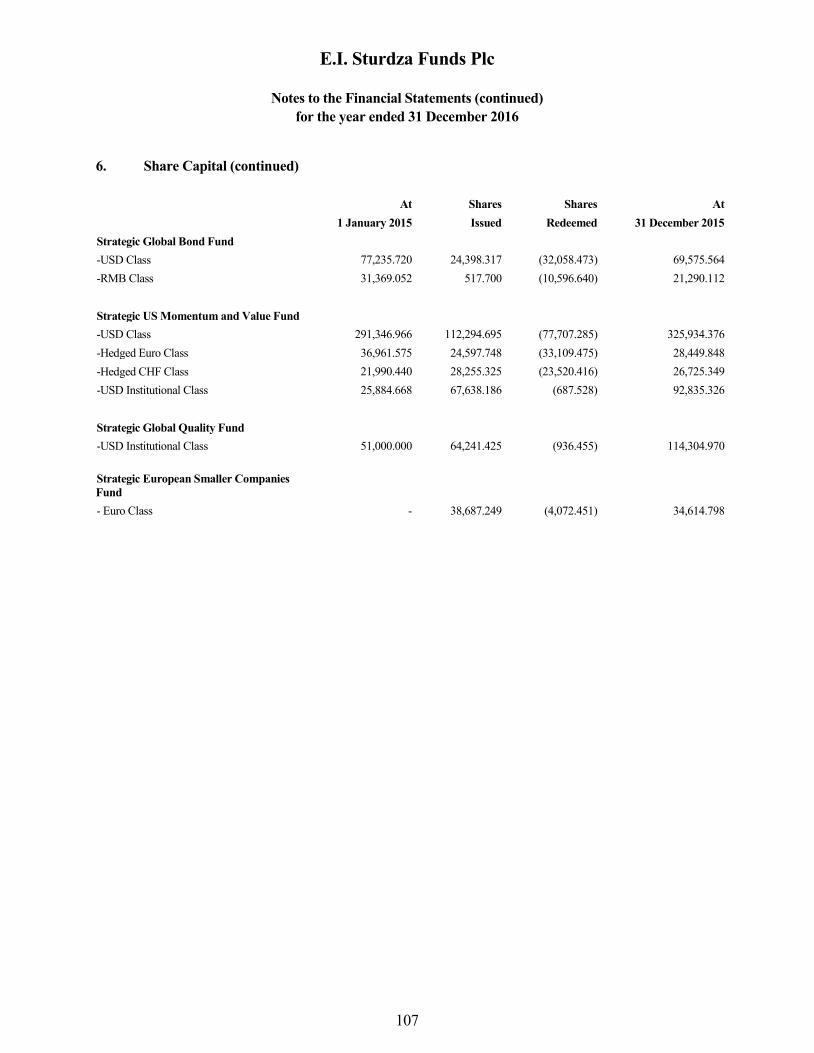
E.I. Sturdza Funds Plc
Notes to the Financial Statements (continued)
for the year ended 31 December 2016
107
6. Share Capital (continued)
At
1 January 2015
Shares
Issued
Shares
Redeemed
At
31 December 2015
Strategic Global Bond Fund
-USD Class 77,235.720 24,398.317 (32,058.473) 69,575.564
-RMB Class 31,369.052 517.700 (10,596.640) 21,290.112
Strategic US Momentum and Value Fund
-USD Class 291,346.966 112,294.695 (77,707.285) 325,934.376
-Hedged Euro Class 36,961.575 24,597.748 (33,109.475) 28,449.848
-Hedged CHF Class 21,990.440 28,255.325 (23,520.416) 26,725.349
-USD Institutional Class 25,884.668 67,638.186 (687.528) 92,835.326
Strategic Global Quality Fund
-USD Institutional Class 51,000.000 64,241.425 (936.455) 114,304.970
Strategic European Smaller Companies
Fund
- Euro Class - 38,687.249 (4,072.451) 34,614.798

E.I. Sturdza Funds Plc
Notes to the Financial Statements (continued)
for the year ended 31 December 2016
108
7. Risks Associated with Financial Instruments
Risk profile
The Company’s risks are those set out in the Prospectus and each supplement and any consideration of risk
here should be viewed in the context of the Prospectus which is the primary documentation governing the
operations of the Company and any subscriptions and redemptions.
The Company’s activities expose it to a variety of financial risks: market risk (including equity price risk,
currency risk and interest rate risk), credit risk and liquidity risk. The Company’s overall risk management
process focuses on the unpredictability of financial markets and seeks to mitigate potential adverse effects on
the Company’s financial performance.
The Investment Manager seeks to mitigate the financial risk in the Company in its daily risk management
process. From year to year, the Company’s exposure to risk will alter as market conditions change and as the
components of the portfolio change and are adjusted through trading, subscriptions and redemptions. With
regard to the objectives, policies and processes for managing the risk, whilst adapting to the current market
conditions, the approach will remain consistent from year to year.
The Investment Manager has advised the Directors that the Commitment Approach to measuring position
exposure is an adequate measure of risk and the global exposure and leverage of each Sub-Fund is calculated
on this basis.
Limitations of sensitivity analyses
The sensitivity analyses in the notes below, of the risk factors, represent sensitivity analyses of the effect of
movements in various risk variables on the Company’s performance. In certain cases a linear relationship
between movements in the risk variable and the Company’s performance is assumed to create the sensitivity
analyses. In reality, a linear relationship is unlikely. The various analysis shown are static scenarios and
represent the effect on the Company of movements in a single risk variable. In reality, the Company is affected
by dynamic movements in these risk variables and in a global context the risk variables have certain inter-
relationships which cause dynamic movements in the variables. As a result, it should be noted that movements
to the Company may be greater than that shown in the sensitivity analysis.
The analysis is that of a reasonably possible change in the relevant risk variable and not a worst case or best
case analysis. IFRS 7, ‘Financial Instruments Disclosure’, does not require a sensitivity analysis of the worst
case scenario, but states that analysis should be of reasonably possible changes. The analysis should not be
taken to rule out a worst case scenario occurring in the future the impact of which is greater than the
represented adverse movements in Company performance.
It should be noted that future exposures may differ from exposures at the Statement of Financial Position date.
The potential for changes in the fair value or cash flows of the Sub-Funds’ investment portfolios is referred to
as Market Risk. Categories of Market Risk include equity price risk, currency risk and interest rate risk.
(a) Market Risk
(i) Equity Price Risk
Equity price risk is the risk that the value of instruments will fluctuate as a result of changes in market prices
(other than those arising from interest rate risk or currency risk), whether caused by factors specific to an
individual investment, its issuer or all factors affecting all instruments traded in the market. The equity
securities held by the Sub-Funds are held at fair value with fair value changes recognised in the Statement of
Comprehensive Income.

E.I. Sturdza Funds Plc
Notes to the Financial Statements (continued)
for the year ended 31 December 2016
109
7. Risks Associated with Financial Instruments (continued)
(a) Market Risk (continued)
(i) Equity Price Risk (continued)
All changes in market conditions will therefore directly affect net investment income for these Sub-Funds. The
Sub-Funds manage this exposure to individual price movements of underlying positions by only making
investments which are in line with the investment restrictions.The investment restrictions aim to ensure that the
Sub-Funds are not overly exposed to individual investments through spreading the investment across a
significant number of investments, and ensuring that the investments that are made are subject to conditions
such as being listed or traded on a recognised world exchange or are subject to market capitalisation
requirements.
The below table provides an analysis of the management’s best estimate of the effect on net assets and
profit/(loss) of the respective Sub-Fund due to a reasonably possible change in market indices, with all other
variables held constant. In practice, the actual results may differ from the sensitivity analysis below and the
difference could be material. Following is the analysis as at 31 December 2016 and 31 December 2015:
Sub-Fund Market index
Change in
market
index
Portfolio
Beta
Effect on net
assets and
profit/(loss)
31 December
2016
31 December
2016
31 December
2016
Strategic China Panda
Fund
MXCN China (in USD
terms) +5% 0.67 USD3,086,322
Strategic China Panda
Fund
MXCN China (in USD
terms) -5% 0.67 USD(3,086,322)
Nippon Growth (UCITS)
Fund
TOPIX TOTAL
RETURN +5% 1.30 JPY272,717,943
Nippon Growth (UCITS)
Fund
TOPIX TOTAL
RETURN -5% 1.30 JPY(272,717,943)
Strategic Europe Value Fund MSCI EUROPE NET
TOTAL RETURN +5% 0.78 EUR36,273,945
Strategic Europe Value Fund MSCI EUROPE NET
TOTAL RETURN -5% 0.78 EUR(36,273,945)
Strategic US Momentum and
Value Fund
MSCI USA NET
TOTAL RETURN +5% 0.99 USD10,606,021
Strategic US Momentum and
Value Fund
MSCI USA NET
TOTAL RETURN -5% 0.99 USD(10,606,021)
Strategic Global Quality
Fund
MSCI WORLD NET
TOTAL RETURN +5% 0.74 USD2,207,579
Strategic Global Quality
Fund
MSCI WORLD NET
TOTAL RETURN -5% 0.74 USD(2,207,579)
Strategic European Smaller
Companies Fund
STOXX EUROPE 600
NET RETURN +5% 0.85 EUR2,772,664
Strategic European Smaller
Companies Fund
STOXX EUROPE 600
NET RETURN -5% 0.85 EUR(2,772,664)

E.I. Sturdza Funds Plc
Notes to the Financial Statements (continued)
for the year ended 31 December 2016
110
7. Risks Associated with Financial Instruments (continued)
(a) Market Risk (continued)
(i) Equity Price Risk (continued)
Sub-Fund Market index
Change in
market
index
Portfolio
Beta
Effect on net
assets and
profit/(loss)
31 December
2015
31
December
2015
31 December
2015
Strategic China Panda
Fund
MSCI DAILY TOTAL
RETURN CHINA (in USD
terms) +5% 0.80 USD6,941,591
Strategic China Panda
Fund
MSCI DAILY TOTAL
RETURN CHINA (in USD
terms) -5% 0.80 USD(6,941,591)
Nippon Growth (UCITS)
Fund TOPIX TOTAL RETURN +5% 0.99 JPY1,071,752,569
Nippon Growth (UCITS)
Fund TOPIX TOTAL RETURN -5% 0.99 JPY(1,071,752,569)
Strategic Europe Value
Fund
MSCI EUROPE NET TOTAL
RETURN +5% 0.85 EUR38,115,960
Strategic Europe Value
Fund
MSCI EUROPE NET TOTAL
RETURN -5% 0.85 EUR(38,115,960)
Strategic US Momentum
and Value Fund S&P 500 +5% 0.94 USD15,336,986
Strategic US Momentum
and Value Fund S&P 500 -5% 0.94 USD(15,336,986)
Strategic Global Quality
Fund
MSCI WORLD NET TOTAL
RETURN +5% 0.75 USD491,040
Strategic Global Quality
Fund
MSCI WORLD NET TOTAL
RETURN -5% 0.75 USD(491,040)
Strategic European
Smaller Companies Fund
STOXX EUROPE 600 NET
RETURN +5% 0.63 EUR1,082,575
Strategic European
Smaller Companies Fund
STOXX EUROPE 600 NET
RETURN -5% 0.63 EUR(1,082,575)
This analysis is not provided for the Strategic Euro Bond Fund, Strategic Global Bond Fund and the Strategic
Quality Emerging Bond Fund as these Sub-Funds do not hold equity securities and therefore do not have a
significant exposure to movement in equity prices.

E.I. Sturdza Funds Plc
Notes to the Financial Statements (continued)
for the year ended 31 December 2016
111
7. Risks Associated with Financial Instruments (continued)
(a) Market Risk (continued)
(ii) Currency Risk
Currency risk is the risk that the fair value of a financial instrument will fluctuate because of changes in foreign
exchange rates. The Sub-Funds may hold assets or liabilities denominated in currencies other than the
functional currencies of the respective Sub-Funds. Each Sub-Fund may, therefore, be exposed to currency risk
as the value of the assets and liabilities denominated in other currencies other than the functional currency may
fluctuate as a result of movements in the exchange rates.
The Sub-Funds may enter into forward foreign exchange contracts to hedge the currency exposures of
securities denominated in a currency other than the functional currency of the relevant Sub-Fund and to hedge
against other changes in currency rates which may have an impact on a Sub-Fund. Forward foreign exchange
contracts may be also used by the Investment Manager to hedge the currency exposure on behalf of investors
invested in foreign currency share classes offered by each Sub-Fund in relation to the functional currency of
that Sub-Fund.
Any financial instruments used to implement such strategies with respect to one or more classes shall be
assets/liabilities of a Sub-Fund as a whole but will be attributable to the relevant class and the gains/losses on
and the costs of the relevant financial instruments will accrue solely to the relevant class.
The table below outlines the Sub-Funds’ net foreign currency risk exposure as at the Statement of Financial
Position date.
Strategic China Panda Fund
31 December 2016
Non-Monetary Asset Monetary Asset and
Forward FX Total
and Liabilites and Liabilities Contract
(notional amounts) USD USD USD USD
Euro - (232,988) 18,975,130 18,742,142
Great British Pound - (408) 353,123 352,715
Hong Kong Dollar 73,896,011 4,765,521 (3,869,114) 74,792,418
Swiss Franc - (370) - (370)
Chinese Yuan - 43,829 - 43,829
Total 73,896,011 4,575,584 15,459,139 93,930,734
31 December 2015
Non-Monetary Asset Monetary Asset and
Forward FX Total
and Liabilities Contract
(notional amounts) USD USD USD USD
Euro - (136,493) 48,211,080 48,074,587
Great British Pound - 2,635 866,696 869,331
Hong Kong Dollar 129,414,972 8,371,232 - 137,786,204
Swiss France - (219) - (219)
Total 129,414,972 8,237,155 49,077,776 186,729,903

E.I. Sturdza Funds Plc
Notes to the Financial Statements (continued)
for the year ended 31 December 2016
112
7. Risks Associated with Financial Instruments (continued)
(a) Market Risk (continued)
(ii) Currency Risk (continued)
The forward fx contract exposure amounts in the above table arise as a result of forward contracts entered into
by the Company to hedge currency risk exposure on the following non-base share classes.
Total Net Assets Total Net Assets 2016 2015 USD USD
Hedged Euro Class 17,104,180 40,981,966
Hedged Sterling Class 359,828 867,288
Euro Hedged Institutional Class 2,138,787 7,230,052
Strategic Euro Bond Fund
31 December 2016
Monetary Asset Forward FX Total
and Liabilities Contract
(notional amounts)
EUR EUR EUR
Swiss Franc (1,858) 12,653,514 12,651,656
Great British Pound (11,738) - (11,738)
US Dollar (21,236) - (21,236)
Total (34,832) 12,653,514 12,618,682
31 December 2015
Monetary Asset Forward FX Total
and Liabilities Contract
(notional amounts)
EUR EUR EUR
Swiss Franc 29,580 21,135,647 21,165,227
Great British Pound (5,498) - (5,498)
US Dollar (95,959) - (95,959)
Total (71,877) 21,135,647 21,063,770
The forward fx contract exposure amounts in the above table arise as a result of forward contracts entered into
by the Company to hedge currency risk exposure on the following non-base share classes.
Total Net Assets Total Net Assets 2016 2015 EUR EUR
CHF Accumulating class 12,867,848 20,729,790
CHF Institutional class - 363,921

E.I. Sturdza Funds Plc
Notes to the Financial Statements (continued)
for the year ended 31 December 2016
113
7. Risks Associated with Financial Instruments (continued)
(a) Market Risk (continued) (ii) Currency Risk (continued)
Nippon Growth (UCITS) Fund
31 December 2016
Monetary Asset Forward FX Total
and Liabilities Contract
(notional amounts)
JPY JPY JPY
Euro (3,748,544) 901,275,478 897,526,934
Great British Pound (2,000,837) - (2,000,837)
US Dollar (4,127,743) - (4,127,743)
Swiss Franc (31,149) - (31,149)
Total (9,908,273) 901,275,478 891,367,205
31 December 2015
Monetary Asset Forward FX Total
and Liabilities Contract
(notional amounts)
JPY JPY JPY
Euro (16,848,740) 3,839,860,791 3,823,012,051
Great British Pound 3,495,622 2,691,218,036 2,694,713,658
US Dollar (3,148,089) - (3,148,089)
Swiss France (23,173) - (23,173)
Total (16,524,380) 6,531,078,827 6,514,554,447
The forward fx contract exposure amounts in the above table arise as a result of forward contracts entered into
by the Company to hedge currency risk exposure on the following non-base share classes.
Total Net Assets Total Net Assets 2016 2015 JPY JPY
Hedged Euro Class 526,742,253 3,339,942,954
Euro Hedged Institutional Class 373,661,452 541,072,758
GBP Hedged Institutional Class - 2,714,022,513

E.I. Sturdza Funds Plc
Notes to the Financial Statements (continued)
for the year ended 31 December 2016
114
7. Risks Associated with Financial Instruments (continued)
(a) Market Risk (continued)
(ii) Currency Risk (continued)
Strategic Europe Value Fund 31 December 2016
Non-Monetary Asset Monetary Asset Forward FX Total
and Liabilites and Liabilities Contract
(notional amounts)
EUR EUR EUR EUR
US Dollar 68,594,653 1,904,864 5,386,342 75,885,859
Great British Pound 264,491,726 2,649,378 14,209,079 281,350,183
Danish Krone 32,434,077 13,399 - 32,447,476
Swedish Krona 32,655,290 66,369 - 32,721,659
Swiss Franc 70,132,219 1,914,608 42,734,226 114,781,053
Total 468,307,965 6,548,618 62,329,647 537,186,230
31 December 2015
Non-Monetary Asset Monetary Forward FX Total
Asset and Liabilities
Contract (notional amounts)
EUR EUR EUR EUR
US Dollar 95,371,073
387,746 9,664,965 105,423,784
Great British Pound 249,631,837
183,960 19,463,956 269,279,753
Danish Krone 41,248,161 7,822 - 41,255,983
Swedish Krona 46,217,861 4,200 - 46,222,061
Swiss Franc 95,690,516 (1,317,731) 57,770,115 152,142,900
Total 528,159,448 (734,003) 86,899,036 614,324,481
The forward fx contract exposure amounts in the above table arise as a result of forward contracts entered into
by the Company to hedge currency risk exposure on the following non-base share classes.
Total Net Assets Total Net Assets 2016 2015 EUR EUR
CHF Class 43,039,890 58,118,660
Sterling Institutional Class 15,687,500 19,646,940
USD Institutional Class 2,014,039 9,748,035
USD Class 1,228,751 -
USD Super Institutional Class 2,180,352 -
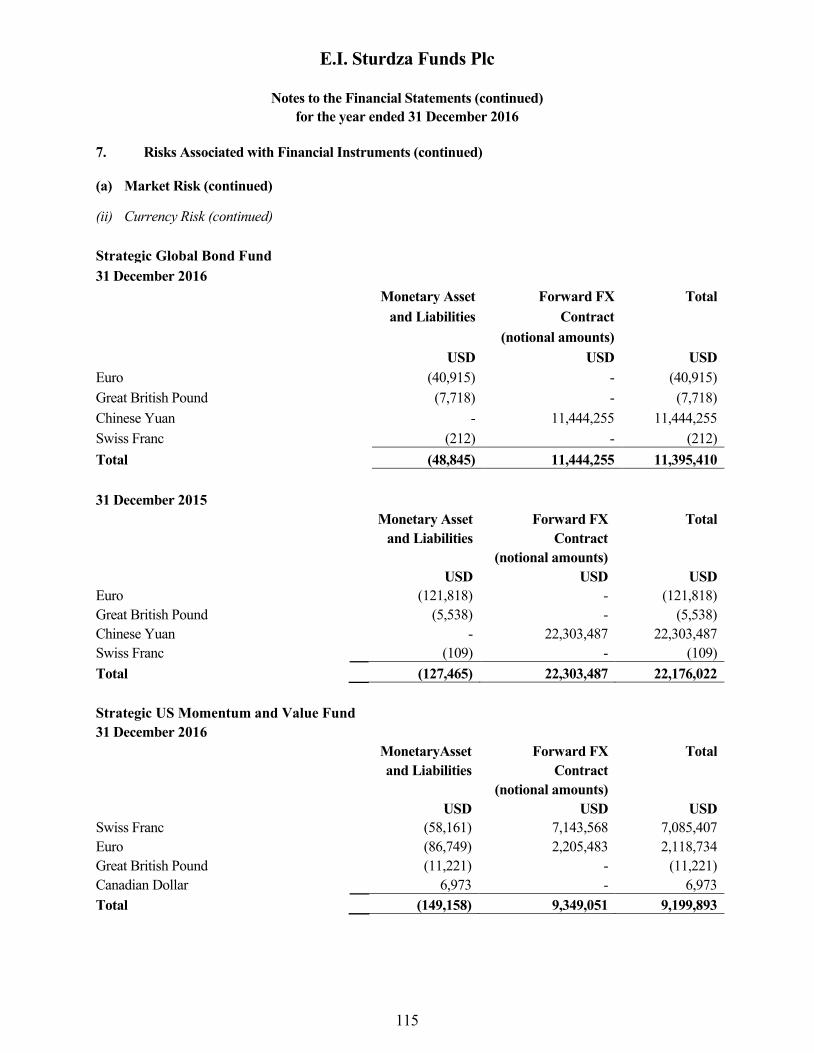
E.I. Sturdza Funds Plc
Notes to the Financial Statements (continued)
for the year ended 31 December 2016
115
7. Risks Associated with Financial Instruments (continued)
(a) Market Risk (continued)
(ii) Currency Risk (continued)
Strategic Global Bond Fund
31 December 2016
Monetary Asset Forward FX Total
and Liabilities Contract
(notional amounts)
USD USD USD
Euro (40,915) - (40,915)
Great British Pound (7,718) - (7,718)
Chinese Yuan - 11,444,255 11,444,255
Swiss Franc (212) - (212)
Total (48,845) 11,444,255 11,395,410
31 December 2015
Monetary Asset Forward FX Total
and Liabilities Contract
(notional amounts)
USD USD USD
Euro (121,818) - (121,818)
Great British Pound (5,538) - (5,538)
Chinese Yuan - 22,303,487 22,303,487
Swiss Franc (109) - (109)
Total (127,465) 22,303,487 22,176,022
Strategic US Momentum and Value Fund
31 December 2016
MonetaryAsset Forward FX Total
and Liabilities Contract
(notional amounts)
USD USD USD
Swiss Franc (58,161) 7,143,568 7,085,407
Euro (86,749) 2,205,483 2,118,734
Great British Pound (11,221) - (11,221)
Canadian Dollar 6,973 - 6,973
Total (149,158) 9,349,051 9,199,893
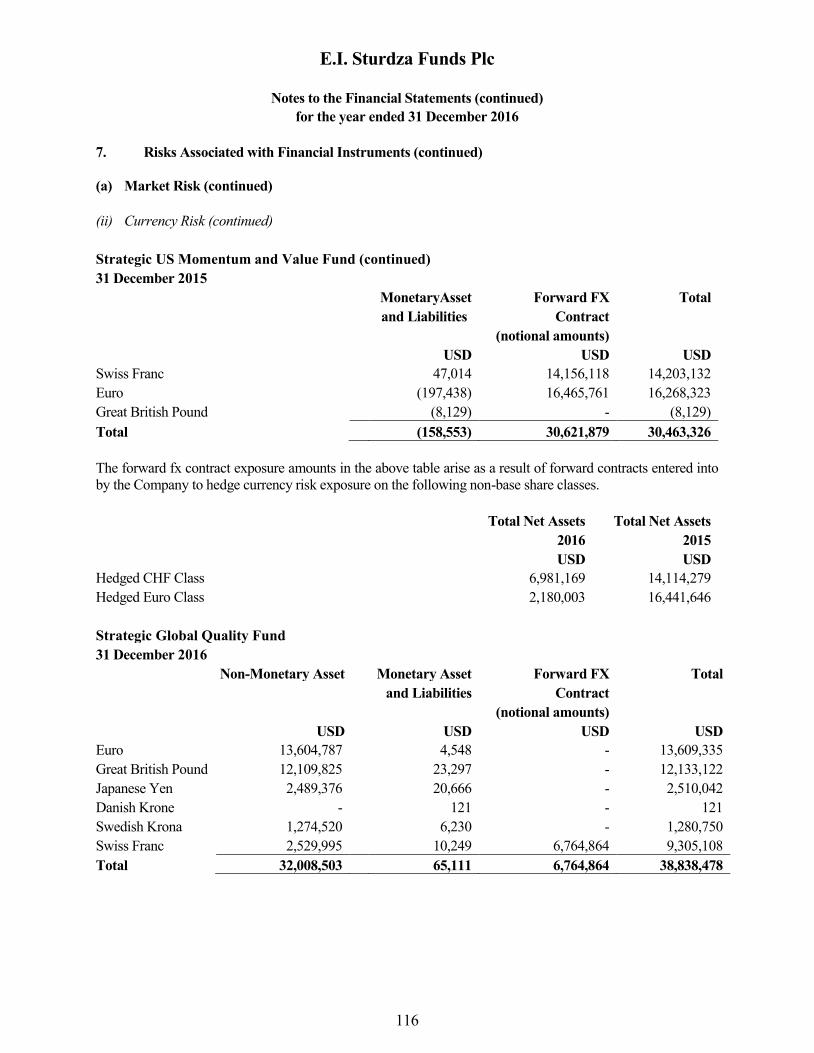
E.I. Sturdza Funds Plc
Notes to the Financial Statements (continued)
for the year ended 31 December 2016
116
7. Risks Associated with Financial Instruments (continued)
(a) Market Risk (continued)
(ii) Currency Risk (continued)
Strategic US Momentum and Value Fund (continued)
31 December 2015
MonetaryAsset Forward FX Total
and Liabilities Contract
(notional amounts)
USD USD USD
Swiss Franc 47,014 14,156,118 14,203,132
Euro (197,438) 16,465,761 16,268,323
Great British Pound (8,129) - (8,129)
Total (158,553) 30,621,879 30,463,326
The forward fx contract exposure amounts in the above table arise as a result of forward contracts entered into
by the Company to hedge currency risk exposure on the following non-base share classes.
Total Net Assets Total Net Assets
2016 2015
USD USD
Hedged CHF Class 6,981,169 14,114,279
Hedged Euro Class 2,180,003 16,441,646
Strategic Global Quality Fund
31 December 2016
Non-Monetary Asset Monetary Asset Forward FX Total
and Liabilities Contract
(notional amounts)
USD USD USD USD
Euro 13,604,787 4,548 - 13,609,335
Great British Pound 12,109,825 23,297 - 12,133,122
Japanese Yen 2,489,376 20,666 - 2,510,042
Danish Krone - 121 - 121
Swedish Krona 1,274,520 6,230 - 1,280,750
Swiss Franc 2,529,995 10,249 6,764,864 9,305,108
Total 32,008,503 65,111 6,764,864 38,838,478
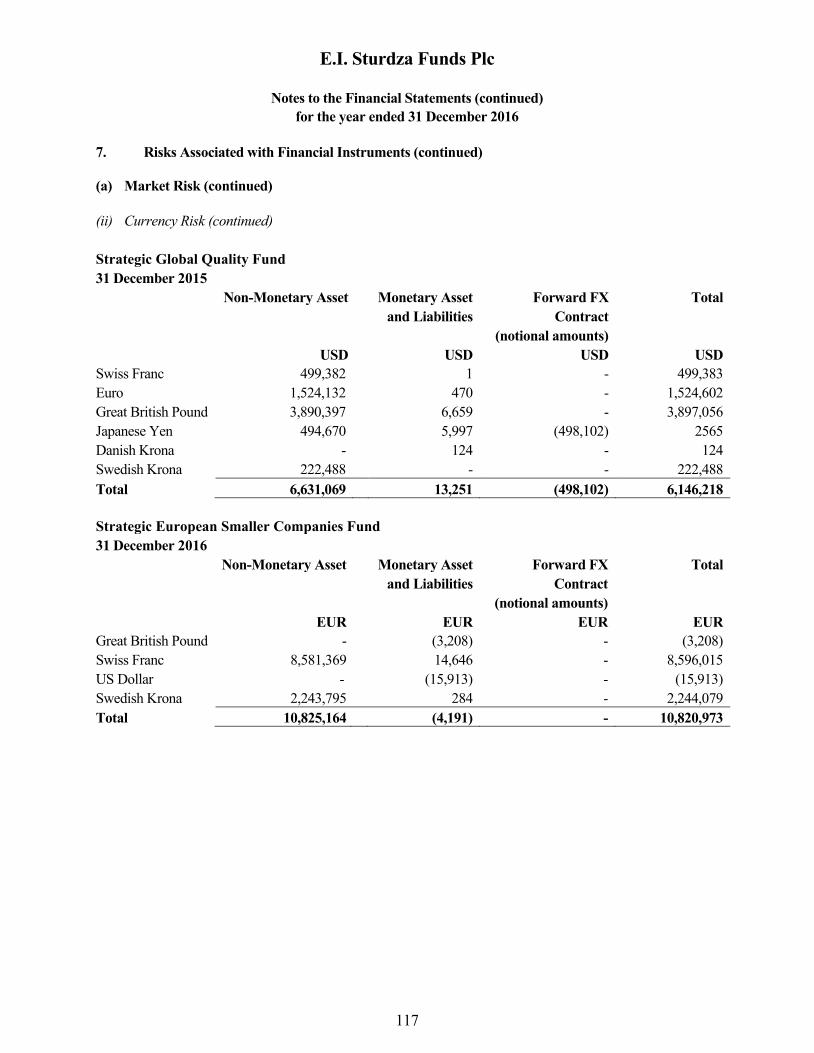
E.I. Sturdza Funds Plc
Notes to the Financial Statements (continued)
for the year ended 31 December 2016
117
7. Risks Associated with Financial Instruments (continued)
(a) Market Risk (continued)
(ii) Currency Risk (continued)
Strategic Global Quality Fund
31 December 2015
Non-Monetary Asset Monetary Asset Forward FX Total
and Liabilities Contract
(notional amounts)
USD USD USD USD
Swiss Franc 499,382 1 - 499,383
Euro 1,524,132 470 - 1,524,602
Great British Pound 3,890,397 6,659 - 3,897,056
Japanese Yen 494,670 5,997 (498,102) 2565
Danish Krona - 124 - 124
Swedish Krona 222,488 - - 222,488
Total 6,631,069 13,251 (498,102) 6,146,218
Strategic European Smaller Companies Fund
31 December 2016
Non-Monetary Asset Monetary Asset Forward FX Total
and Liabilities Contract
(notional amounts)
EUR EUR EUR EUR
Great British Pound - (3,208) - (3,208)
Swiss Franc 8,581,369 14,646 - 8,596,015
US Dollar - (15,913) - (15,913)
Swedish Krona 2,243,795 284 - 2,244,079
Total 10,825,164 (4,191) - 10,820,973
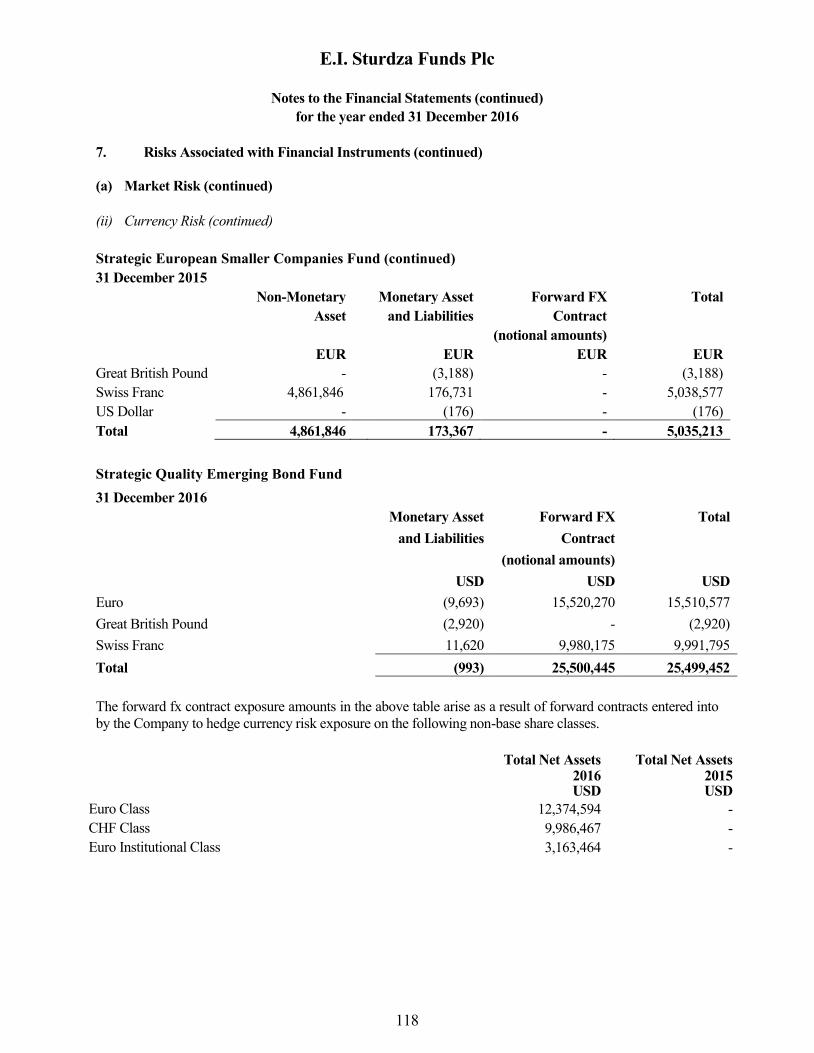
E.I. Sturdza Funds Plc
Notes to the Financial Statements (continued)
for the year ended 31 December 2016
118
7. Risks Associated with Financial Instruments (continued)
(a) Market Risk (continued)
(ii) Currency Risk (continued)
Strategic European Smaller Companies Fund (continued)
31 December 2015
Non-Monetary Monetary Asset Forward FX Total
Asset and Liabilities Contract
(notional amounts)
EUR EUR EUR EUR
Great British Pound - (3,188) - (3,188)
Swiss Franc 4,861,846 176,731 - 5,038,577
US Dollar - (176) - (176)
Total 4,861,846 173,367 - 5,035,213
Strategic Quality Emerging Bond Fund
31 December 2016
Monetary Asset Forward FX Total
and Liabilities Contract
(notional amounts)
USD USD USD
Euro (9,693) 15,520,270 15,510,577
Great British Pound (2,920) - (2,920)
Swiss Franc 11,620 9,980,175 9,991,795
Total (993) 25,500,445 25,499,452
The forward fx contract exposure amounts in the above table arise as a result of forward contracts entered into
by the Company to hedge currency risk exposure on the following non-base share classes.
Total Net Assets Total Net Assets 2016 2015 USD USD
Euro Class 12,374,594 -
CHF Class 9,986,467 -
Euro Institutional Class 3,163,464 -

E.I. Sturdza Funds Plc
Notes to the Financial Statements (continued)
for the year ended 31 December 2016
119
7. Risks Associated with Financial Instruments (continued)
(a) Market Risk (continued)
(ii) Currency Risk (continued)
Strategic Beta Flex Fund
31 December 2016
Monetary Asset Forward FX Total
and Liabilities Contract
(notional amounts)
EUR EUR EUR
Great British Pound (5) - (5)
US Dollar (509) - (509)
Total (514) - (514)
At 31 December 2016, had any non-functional currencies strengthened by 5% in relation to the respective
functional currency of each of the Sub-Funds, with all other variables held constant, net assets attributable to
holders of redeemable participating shares would have increased by the amounts shown below.
Strategic China Panda Fund
31 December 2016 31 December 2015
USD USD
Euro 937,107
937,107.00
2,403,729
Great British Pound 17,636 43,467
Hong Kong Dollar 3,739,621 6,889,310
Swiss Franc
(19) (11)
Chinese Yuan 2,191 -
Total 4,696,536 9,336,495
Strategic Euro Bond Fund
31 December 2016 31 December 2015
EUR EUR
Swiss Franc
632,583 1,058,262
Great British Pound (587) (275)
US Dollar (1,062) (4,798)
Total 630,934 1,053,189

E.I. Sturdza Funds Plc
Notes to the Financial Statements (continued)
for the year ended 31 December 2016
120
7. Risks Associated with Financial Instruments (continued)
(a) Market Risk (continued)
(ii) Currency Risk (continued)
Nippon Growth (UCITS) Fund
31 December 2016 31 December 2015
JPY JPY
Euro 44,876,347 191,150,603
Great British Pound (100,042) 134,735,683
US Dollar (206,387) (157,404)
Swiss Franc (1,557) (1,159)
Total 44,568,361 325,727,722
Strategic Europe Value Fund
31 December 2016 31 December 2015
EUR EUR
US Dollar 3,794,293 5,271,189
Great British Pound 14,067,509 13,463,988
Danish Krona 1,622,374 2,062,799
Swedish Krona 1,636,083 2,311,103
Swiss Franc 5,739,053 7,607,145
Total 26,859,312 30,716,224
Strategic Global Bond Fund
31 December 2016 31 December 2015
USD USD
Euro (2,046) (6,091)
Great British Pound (386) (277)
Chinese Renminbi Yuan 572,213 1,115,174
Swiss Franc (11) (5)
Total 569,770 1,108,801
Strategic US Momentum and Value Fund
31 December 2016 31 December 2015
USD USD
Swiss Franc 354,270 710,157
Euro 105,937 813,416
Great British Pound (561) (407)
Canadian Dollar 349 -
Total 459,995 1,523,166

E.I. Sturdza Funds Plc
Notes to the Financial Statements (continued)
for the year ended 31 December 2016
121
7. Risks Associated with Financial Instruments (continued)
(a) Market Risk (continued)
(ii) Currency Risk (continued)
Strategic Global Quality Fund
31 December 2016 31 December 2015
USD USD
Swiss Franc 465,255 24,969
Euro 680,467 76,230
Great British Pound 606,656 194,853
Danish Krona 6 6
Swedish Krona 64,038 11,124
Japanese Yen 125,502 128
Total 1,941,924 307,311
A 5% decrease in non-functional currencies in relation to the respective functional currency of each of the Sub-
Funds, with all other variables held constant, would lead to a corresponding decrease in the net assets
attributable to holders of redeemable participating shares by the exact amounts as shown in the above tables.
The estimated movement is based on management’s determination of a reasonably possible change in foreign
exchange rates. In practice, the actual results may differ from the sensitivity analysis above and the difference
could be material.
Strategic European Smaller Companies Fund
31 December 2016 31 December 2015
EUR EUR
Swiss Franc 429,801 251,929
Great British Pound (160) (159)
Swedish Krona 112,204 -
US Dollar (796) (9)
Total 541,049 251,761
Strategic Quality Emerging Bond Fund
31 December 2016
USD
Euro 775,529
Great British Pound (146)
Swiss Franc 499,590
Total 1,274,973
Strategic Beta Flex Fund
31 December 2016
EUR
Great British Pound -
U.S.Dollar (25)
Total (25)

E.I. Sturdza Funds Plc
Notes to the Financial Statements (continued)
for the year ended 31 December 2016
122
7. Risks Associated with Financial Instruments (continued)
(a) Market Risk (continued)
(iii) Interest Rate Risk
Interest rate risk is the risk that the fair value of future cash flows of a financial instrument will fluctuate
because of changes in market interest rates.
The portfolio of investments held by the Strategic Euro Bond Fund, Strategic Global Bond Fund and Strategic
Quality Emerging Bond Fund includes debt securities. The fair values of debt securities will fluctuate in
response to changes in market interest rates. Increases and decreases in prevailing interest rates generally
translate into decreases and increases in fair values of those instruments. Additionally fair values of interest
rate sensitive instruments may be affected by the creditworthiness of the issuer, prepayment options, relative
values of alternative investments, the liquidity of the instrument and other general market conditions. Fixed
interest rate investments may be more sensitive to interest rate changes than variable rate investments.
The majority of the financial assets and liabilities held by the other Sub-Funds, Strategic China Panda Fund,
Nippon Growth (UCITS) Fund, Strategic Europe Value Fund, Strategic US Momentum and Value Fund,
Strategic European Smaller Companies Fund, Strategic Global Quality Fund and Strategic Beta Flex Fund are
non-interest bearing. Interest bearing financial assets and liabilities include cash at bank which matures or
reprices in the short-term, no longer than 3 months. As a result, these Sub-Funds are subject to limited
exposure to fair value interest rate risk due to fluctuations in the prevailing levels of market interest rates.
The Investment Manager mitigates interest rate risk by constructing a diversified portfolio of debt securities
with differing modified duration and term to maturity characteristics, which acts to reduce the Sub-Fund’s
overall exposure to interest rate risk. The Investment Manager constantly monitors its view of the Sub-Fund’s
exposure to interest rate risk and makes decisions accordingly about the composition of the Sub-Fund’s
portfolio of debt securities in order to ensure the interest rate risk in the portfolio is maintained at an
appropriate level.
The following tables detail the Sub-Funds’ exposure to interest rate risk at 31 December 2016. It includes the
Sub-Funds’ assets and liabilities at fair values, categorised by the earlier of contractual re-pricing or maturity
date measured by the carrying value of assets and liabilities.
Strategic Euro Bond Fund
31 December 2016
Less than 1
year
1-3
years
More than
3 years
Non-interest
bearing
bearing
Total
EUR EUR EUR EUR EUR
Non interest bearing
Derivative contracts (fair value) - - - (14,164) (14,164)
Other assets and liabilities - - - (899,543) (899,543)
Cash flow interest rate risk
Debt securities 29,232,950 35,483,397 - 64,716,347
Cash at bank 2,094,934 - - - 2,094,934
Total 2,094,934 29,232,950 35,483,397 (913,707) 65,897,574

E.I. Sturdza Funds Plc
Notes to the Financial Statements (continued)
for the year ended 31 December 2016
123
7. Risks Associated with Financial Instruments (continued)
(a) Market Risk (continued)
(iii) Interest Rate Risk (continued)
Strategic Euro Bond Fund (continued)
Strategic Global Bond Fund
31 December 2016
Less than 1
year
1-3
years
More than 3
years
Non-interest
bearing Total
USD USD USD USD USD
Non interest bearing
Derivative contracts (fair value) 5,679 5,679
Other assets and liabilities 274,748 274,748
Cash flow interest rate risk
Debt securities 14,091,356 31,144,026 17,771,989 - 63,007,371
Cash at bank 636,398 - - - 636,398
Total 14,727,754 31,144,026 17,771,989 280,427 63,924,196
31 December 2015
Less than 1
year
1-3
years
More than 3
years
Non-interest
bearing Total
USD USD USD USD USD
Non interest bearing
Derivative contracts (fair value) - - - 12,399 12,399
Other assets and liabilities - - - 842,138 842,138
Cash flow interest rate risk
Debt securities 23,857,168 25,719,886 41,073,256 - 90,650,310
Cash at bank 3,136,445 - - - 3,136,445
Total 26,993,613 25,719,886 41,073,256 854,537 94,641,292
31 December 2015
Less than 1
year
1-3
years
More than
3 years
Non-interest
bearing
bearing
Total
EUR EUR EUR EUR EUR
Non interest bearing
Derivative contracts (fair value) - - - (178,089) (178,089)
Other assets and liabilities - - - 2,160,687 2,160,687
Cash flow interest rate risk
Debt securities 4,045,350 22,291,805 95,876,400 - 122,213,555
Cash at bank 2,309,882 - - - 2,309,882
Total 6,355,232 22,291,805 95,876,400 1,982,598 126,506,035
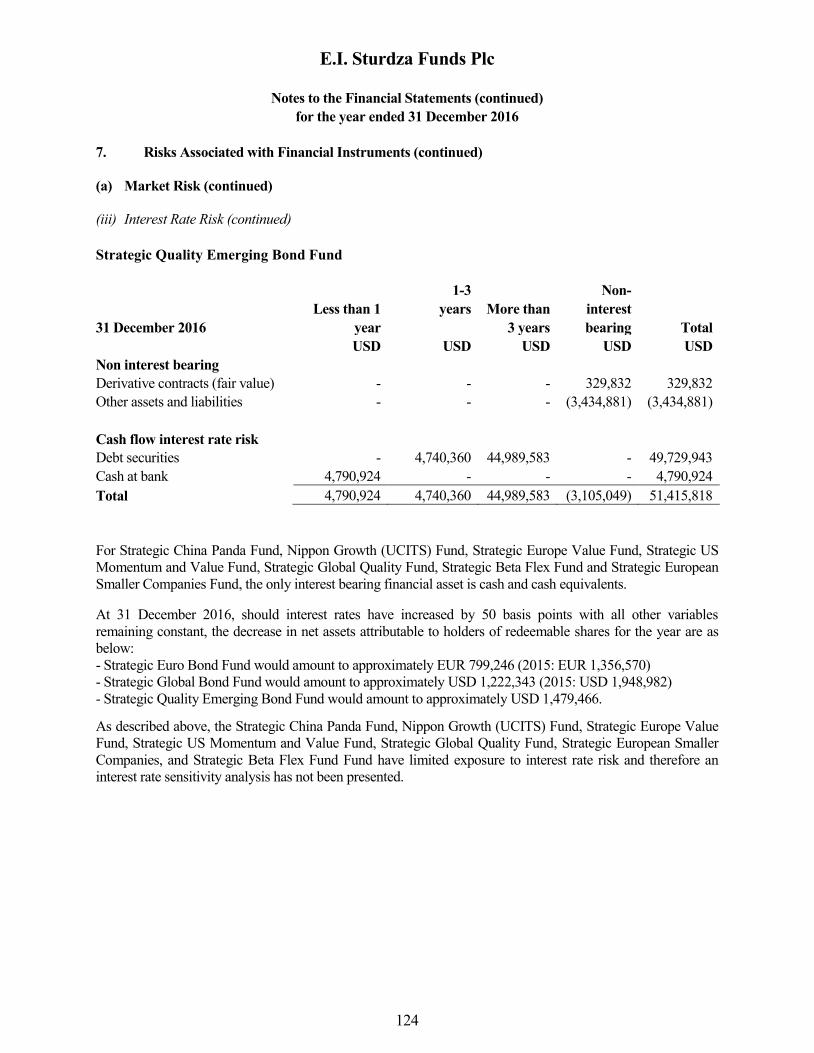
E.I. Sturdza Funds Plc
Notes to the Financial Statements (continued)
for the year ended 31 December 2016
124
7. Risks Associated with Financial Instruments (continued)
(a) Market Risk (continued)
(iii) Interest Rate Risk (continued)
Strategic Quality Emerging Bond Fund
31 December 2016
Less than 1
year
1-3
years More than
3 years
Non-
interest
bearing Total
USD USD USD USD USD
Non interest bearing
Derivative contracts (fair value) - - - 329,832 329,832
Other assets and liabilities - - - (3,434,881) (3,434,881)
Cash flow interest rate risk
Debt securities - 4,740,360 44,989,583 - 49,729,943
Cash at bank 4,790,924 - - - 4,790,924
Total 4,790,924 4,740,360 44,989,583 (3,105,049) 51,415,818
For Strategic China Panda Fund, Nippon Growth (UCITS) Fund, Strategic Europe Value Fund, Strategic US
Momentum and Value Fund, Strategic Global Quality Fund, Strategic Beta Flex Fund and Strategic European
Smaller Companies Fund, the only interest bearing financial asset is cash and cash equivalents.
At 31 December 2016, should interest rates have increased by 50 basis points with all other variables
remaining constant, the decrease in net assets attributable to holders of redeemable shares for the year are as
below:
- Strategic Euro Bond Fund would amount to approximately EUR 799,246 (2015: EUR 1,356,570)
- Strategic Global Bond Fund would amount to approximately USD 1,222,343 (2015: USD 1,948,982)
- Strategic Quality Emerging Bond Fund would amount to approximately USD 1,479,466.
As described above, the Strategic China Panda Fund, Nippon Growth (UCITS) Fund, Strategic Europe Value
Fund, Strategic US Momentum and Value Fund, Strategic Global Quality Fund, Strategic European Smaller
Companies, and Strategic Beta Flex Fund Fund have limited exposure to interest rate risk and therefore an
interest rate sensitivity analysis has not been presented.
E.I. Sturdza Funds Plc
Notes to the Financial Statements (continued)
for the year ended 31 December 2016
125
7. Risks Associated with Financial Instruments (continued)
(b) Credit Risk and collateral provided
Credit risk is the risk that a counterparty to a financial instrument will fail to discharge an obligation or
commitment that it has entered into with the Company. It arises principally from debt securities held and also
from derivative financial assets, cash and cash equivalents and balances due from brokers. Credit risk is
generally higher when a non-exchange traded financial instrument is involved because the counterparty for
non-exchange traded financial instruments is not backed by an exchange clearing house.
Credit risk includes settlement risk which is the risk that a counterparty will not discharge an obligation to
deliver a security or its value in cash when the Company has already delivered the security or its value in cash
as per the agreement.
Credit risk associated with investing activities is managed by the Investment Manager as part of the overall
investment process. To reduce the Company’s counterparty credit exposures, securities trading is primarily
conducted on authorised exchanges and on a delivery-versus-payment basis.
The assets which do not trade this way will be exposed to different forms of credit risk. When these securities
are sold delivery is only made once the custodian has received payment. The trade will fail if either party fails
to meet its obligation.
The Strategic Euro Bond Fund, Strategic Global Bond Fund and Strategic Qualtiy Emerging Bond Fund invest
in debt securities which are subject to credit risk. The Investment Manager analyses the credit risk of the Sub-
Fund’s debt securities prior to purchase and continues to monitor developments in credit quality subsequently.
Balances under due from brokers represent primarily sales transactions awaiting settlement and cash collateral
from derivatives. Credit risk relating to unsettled transactions is considered small due to the short settlement
period involved and the high quality of the brokers used.
As at 31 December 2016, the significant balance of the amount due from brokers was concentrated with one
broker, The Bank of New York Mellon, having a credit rating of AA- (Standard and Poor’s). The credit rating
of the brokers are monitored on a quarterly basis.
Substantially all the assets and cash held by the Company is held with The Bank of New York Mellon
Bankruptcy or insolvency by The Bank of New York Mellon may cause the Company’s rights with respect to
the cash held to be delayed or limited.
The Investment Manager monitors the credit rating of The Bank of New York Mellon on a monthly basis, as
reported by Standard and Poor’s, Moody’s and Fitch. In addition, the Investment Manager monitors the
financial position of The Bank of New York Mellon on a quarterly basis by reviewing earnings releases. If the
credit quality or the financial position of this bank deteriorates significantly the Investment Manager will
recommend to the Board of Directors that the cash holdings be moved to another bank.

E.I. Sturdza Funds Plc
Notes to the Financial Statements (continued)
for the year ended 31 December 2016
126
7. Risks Associated with Financial Instruments (continued)
(b) Credit Risk and collateral provided (continued)
The Company will also be exposed to a credit risk in relation to the counterparties with whom it transacts or
places margin or collateral in respect of transactions in Derivative Financial Instruments and may bear the risk
of counterparty default. The Investment Manager seeks to enter into netting agreements with counterparties
that would allow receivables and payables to that counterparty to be offset. Additionally, certain Sub-Funds
engage in securities lending activities which expose the Sub-Funds to credit risk. The maximum exposure of
each Sub-Funds is equal to the value of the securities loaned at 31 December 2016 as described in Note 8. To
mitigate this risk, the Sub-Funds take collateral which is in excess of the value of the securities loaned as
disclosed in Note 8. The programme is indemnified by The Bank of New York Mellon in the event of broker
default.
The below table provides an analysis of the Company’s main financial assets at the Statement of Financial
Position date that are exposed to credit risk together with the relevant counterparty’s credit rating as reported
by Standard and Poor’s and Moody’s.
Strategic China Panda Fund
At 31 December 2016
Counterparty Credit Rating USD
Financial assets
Forward foreign exchange contracts
The Bank of New York Mellon AA- 256,939
Cash and cash equivalents The Bank of New York Mellon AA- 6,065,757
Cash and cash equivalents HSBC Bank Plc AA- 812
Total 6,323,508
Strategic China Panda Fund
At 31 December 2015
Counterparty Credit Rating USD
Financial assets
Equitised participation notes HSBC Bank Plc AA- 8,884,131
Morgan Stanley BBB+ 10,863,497
Forward foreign exchange contracts
HSBC Bank Plc AA- (170,494)
Cash and cash equivalents HSBC Bank Plc AA- 8,798,695
Total 28,375,829
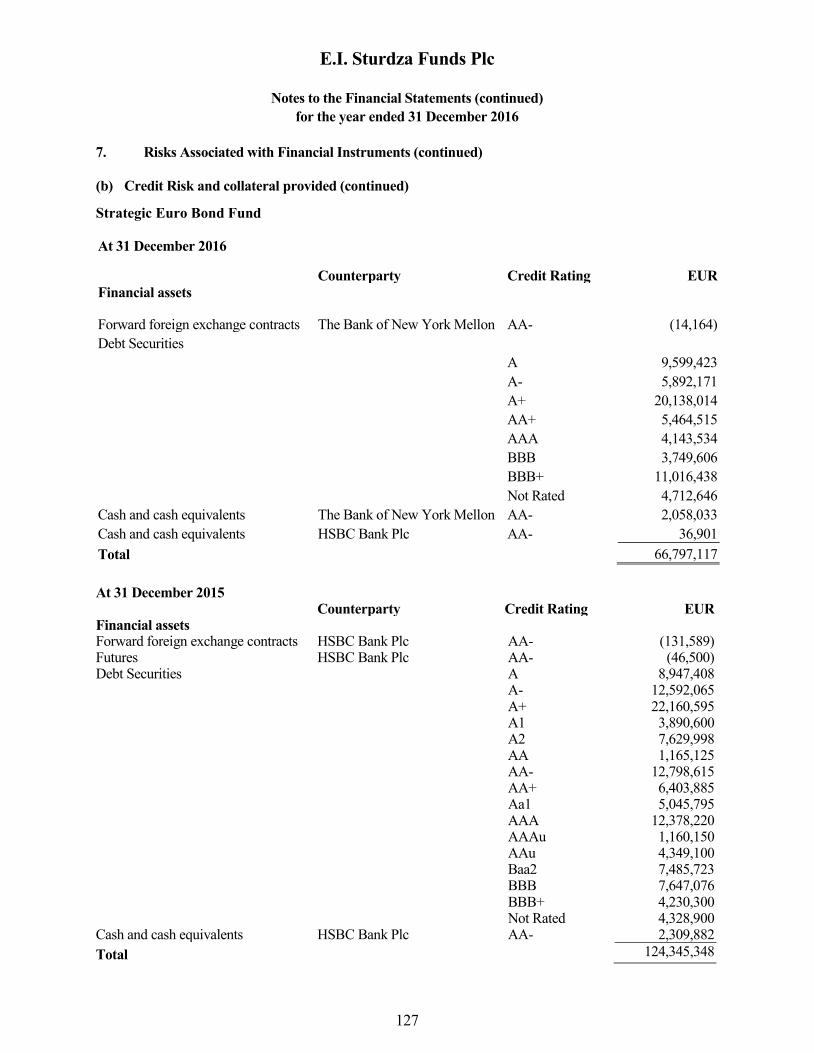
E.I. Sturdza Funds Plc
Notes to the Financial Statements (continued)
for the year ended 31 December 2016
127
7. Risks Associated with Financial Instruments (continued)
(b) Credit Risk and collateral provided (continued) Strategic Euro Bond Fund
At 31 December 2016
Counterparty Credit Rating EUR
Financial assets
Forward foreign exchange contracts The Bank of New York Mellon AA- (14,164)
Debt Securities
A 9,599,423
A- 5,892,171
A+ 20,138,014
AA+ 5,464,515
AAA 4,143,534
BBB 3,749,606
BBB+ 11,016,438
Not Rated 4,712,646
Cash and cash equivalents The Bank of New York Mellon AA- 2,058,033
Cash and cash equivalents HSBC Bank Plc AA- 36,901
Total 66,797,117
At 31 December 2015 Counterparty Credit Rating EUR Financial assets Forward foreign exchange contracts HSBC Bank Plc AA- (131,589) Futures HSBC Bank Plc AA- (46,500) Debt Securities A 8,947,408 A- 12,592,065
A+ 22,160,595 A1 3,890,600 A2 7,629,998 AA 1,165,125 AA- 12,798,615 AA+ 6,403,885 Aa1 5,045,795 AAA 12,378,220 AAAu 1,160,150 AAu 4,349,100 Baa2 7,485,723 BBB 7,647,076 BBB+ 4,230,300 Not Rated 4,328,900 Cash and cash equivalents HSBC Bank Plc AA- 2,309,882
Total 124,345,348
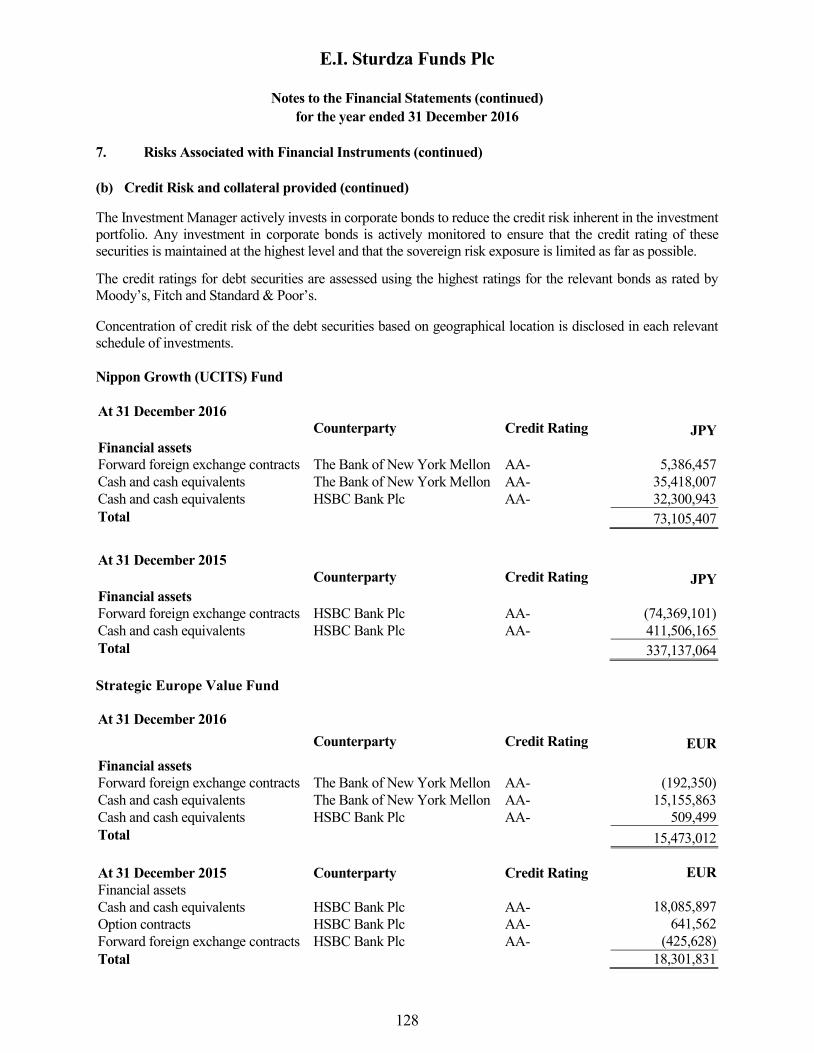
E.I. Sturdza Funds Plc
Notes to the Financial Statements (continued)
for the year ended 31 December 2016
128
7. Risks Associated with Financial Instruments (continued)
(b) Credit Risk and collateral provided (continued)
The Investment Manager actively invests in corporate bonds to reduce the credit risk inherent in the investment
portfolio. Any investment in corporate bonds is actively monitored to ensure that the credit rating of these
securities is maintained at the highest level and that the sovereign risk exposure is limited as far as possible.
The credit ratings for debt securities are assessed using the highest ratings for the relevant bonds as rated by
Moody’s, Fitch and Standard & Poor’s.
Concentration of credit risk of the debt securities based on geographical location is disclosed in each relevant
schedule of investments.
Nippon Growth (UCITS) Fund
At 31 December 2016
Counterparty Credit Rating JPY
Financial assets
Forward foreign exchange contracts The Bank of New York Mellon AA- 5,386,457
Cash and cash equivalents The Bank of New York Mellon AA- 35,418,007
Cash and cash equivalents HSBC Bank Plc AA- 32,300,943
Total 73,105,407
At 31 December 2015
Counterparty Credit Rating JPY
Financial assets
Forward foreign exchange contracts HSBC Bank Plc AA- (74,369,101)
Cash and cash equivalents HSBC Bank Plc AA- 411,506,165
Total 337,137,064
Strategic Europe Value Fund
At 31 December 2016
Counterparty Credit Rating EUR
Financial assets
Forward foreign exchange contracts The Bank of New York Mellon AA- (192,350)
Cash and cash equivalents The Bank of New York Mellon AA- 15,155,863
Cash and cash equivalents HSBC Bank Plc AA- 509,499
Total 15,473,012
At 31 December 2015 Counterparty Credit Rating EUR
Financial assets
Cash and cash equivalents HSBC Bank Plc AA- 18,085,897
Option contracts HSBC Bank Plc AA- 641,562
Forward foreign exchange contracts HSBC Bank Plc AA- (425,628)
Total 18,301,831
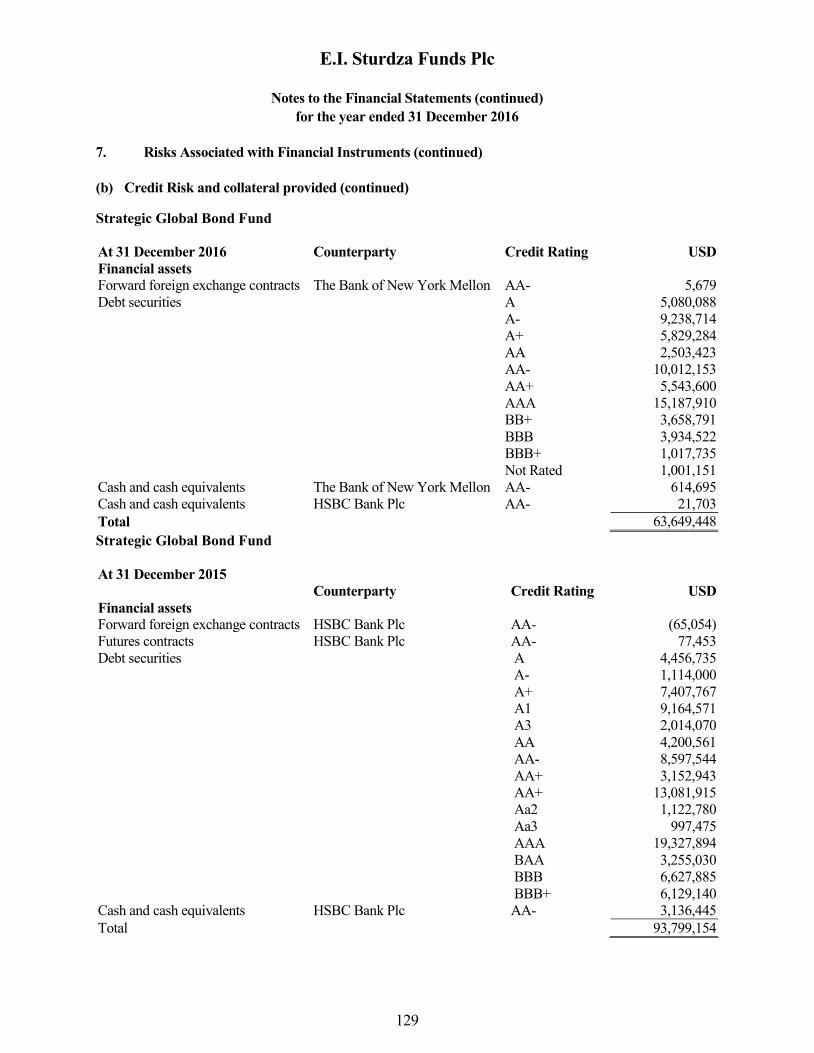
E.I. Sturdza Funds Plc
Notes to the Financial Statements (continued)
for the year ended 31 December 2016
129
7. Risks Associated with Financial Instruments (continued)
(b) Credit Risk and collateral provided (continued)
Strategic Global Bond Fund
At 31 December 2016 Counterparty Credit Rating USD
Financial assets
Forward foreign exchange contracts The Bank of New York Mellon AA- 5,679
Debt securities A 5,080,088
A- 9,238,714
A+ 5,829,284
AA 2,503,423
AA- 10,012,153
AA+ 5,543,600
AAA 15,187,910
BB+ 3,658,791
BBB 3,934,522
BBB+ 1,017,735
Not Rated 1,001,151
Cash and cash equivalents The Bank of New York Mellon AA- 614,695
Cash and cash equivalents HSBC Bank Plc AA- 21,703
Total 63,649,448
Strategic Global Bond Fund
At 31 December 2015
Counterparty Credit Rating USD
Financial assets
Forward foreign exchange contracts HSBC Bank Plc AA- (65,054)
Futures contracts HSBC Bank Plc AA- 77,453
Debt securities A 4,456,735
A- 1,114,000
A+ 7,407,767
A1 9,164,571
A3 2,014,070
AA 4,200,561
AA- 8,597,544
AA+ 3,152,943
AA+ 13,081,915
Aa2 1,122,780
Aa3 997,475
AAA 19,327,894
BAA 3,255,030
BBB 6,627,885
BBB+ 6,129,140
Cash and cash equivalents HSBC Bank Plc AA- 3,136,445
Total 93,799,154

E.I. Sturdza Funds Plc
Notes to the Financial Statements (continued)
for the year ended 31 December 2016
130
7. Risks Associated with Financial Instruments (continued)
(b) Credit Risk and collateral provided (continued)
Strategic US Momentum and Value Fund
At 31 December 2016
Counterparty Credit Rating USD
Financial assets
Forward foreign exchange contracts The Bank of New York Mellon AA- 116,603
Option contracts Cantor Fitzgerald BBB- 142,450
Options contracts Royal Bank Of Scotland AA- (724,000)
Cash and cash equivalents The Bank of New York Mellon AA- 12,774,750
Cash and cash equivalents Royal Bank Of Scotland AA- 1,735,051
Cash and cash equivalents HSBC Bank Plc AA- 65,565
Total 14,110,419
Strategic US Momentum and Value Fund
At 31 December 2015
Counterparty Credit Rating USD
Financial assets
Forward foreign exchange contracts HSBC Bank Plc AA- (202,440)
Option contracts HSBC Bank Plc AA- (434,550)
Cash and cash equivalents HSBC Bank Plc AA- 14,334,155
Total 13,697,165
Strategic Global Quality Fund
At 31 December 2016
Counterparty Credit Rating USD
Financial assets
Forward foreign exchange contracts The Bank of New York Mellon AA- 82,639
Cash and cash equivalents The Bank of New York Mellon AA- 1,128,654
Cash and cash equivalents HSBC Bank Plc AA- 28,949
Total 1,240,242
At 31 December 2015
Counterparty Credit Rating USD
Financial assets
Forward foreign exchange contracts HSBC Bank Plc AA- 274,732
Cash and cash equivalents HSBC Bank Plc AA- (11,231)
Total 263,501

E.I. Sturdza Funds Plc
Notes to the Financial Statements (continued)
for the year ended 31 December 2016
131
7. Risks Associated with Financial Instruments (continued)
(b) Credit Risk and collateral provided (continued)
Strategic European Smaller Companies Fund
At 31 December 2016
Counterparty Credit Rating EUR
Financial assets
Cash and cash equivalents The Bank of New York Mellon AA- 2,060,033
Cash and cash equivalents HSBC Bank Plc AA- 93,389
Total 2,153,422
At 31 December 2015
Counterparty Credit Rating EUR
Financial assets
Cash and cash equivalents HSBC Bank Plc AA- 926,124
Total 926,124
Strategic Quality Emerging Bond Fund
At 31 December 2016
Counterparty Credit Rating USD
Financial assets
Forward foreign exchange contracts The Bank of New York Mellon AA- 329,832
Debt Securities A- 3,924,974
A+ 1,429,315
BB 4,444,368
BB+
18,548,253
BBB 3,007,671
BBB- 16,157,844
BBB+ 2,217,518
Cash and cash equivalents The Bank of New York Mellon AA- 4,755,463
Cash and cash equivalents HSBC Bank Plc AA- 35,461
Total 54,850,699
Strategic Beta Flex Fund
At 31 December 2016
Counterparty Credit Rating EUR
Financial assets
Cash and cash equivalents The Bank of New York Mellon AA- 3,458,319
Total 3,458,319

E.I. Sturdza Funds Plc
Notes to the Financial Statements (continued)
for the year ended 31 December 2016
132
7. Risks Associated with Financial Instruments (continued)
(b) Credit Risk and collateral provided (continued)
Amounts due from and to brokers
For the purpose of providing margin or collateral in respect of transactions in techniques and instruments, the
Company may transfer, mortgage, charge or encumber any assets or cash forming part of the relevant Fund in
accordance with normal market practice.
Collateral received and any investment of such collateral must meet the requirements of the Central Bank as
set out in the Central Bank’s UCITS Regulations. Collateral received on a title transfer basis should be held by
the Depository. For other types of collateral arrangement, the collateral can be held by a third party Depostitary
which is subject to prudential supervision, and which is unrelated to the provider of the collateral.
Non-cash collateral cannot be sold, pledged or re-invested. Cash collateral may only be reinvested in:
(i) deposits with relevant institutions;
(ii) high-quality government bonds;
(iii) reverse repurchase agreements provided the transactions are with credit institutions subject to prudential
supervision and the Sub-Fund is able to recall at any time the full amount of cash on an accrued basis; and
(iv) short-term money market funds as defined in the ESMA Guidelines on a Common Definition of European
Money Market Funds.
In addition, all reinvested cash collateral must be diversified in terms of country, market and issuers. This
diversification requirement is deemed satisfied if the maximum exposure to any given issuer is 20% of the
Sub-Fund’s net asset value. Where the Sub-Fund is exposed to different counterparties, the different baskets of
collateral should be aggregated to calculate the 20% limit of exposure to a single issuer.
The level of collateral required to be posted may vary by counterparty with which the Sub-Fund trades. The
haircut policy applied to posted collateral will be negotiated on a counterparty basis and will vary depending
on the class of asset received by the Sub-Fund, taking into account the credit standing and price volatility of
the relevant counterparty.

E.I. Sturdza Funds Plc
Notes to the Financial Statements (continued)
for the year ended 31 December 2016
133
7. Risks Associated with Financial Instruments (continued)
(b) Credit Risk and collateral provided (continued)
Concentration Risk : Sector wise allocation of debt securities
The portfolio of investments held by the Strategic Euro Bond Fund, Strategic Global Bond Fund and Strategic
Quality Emerging Bond Fund includes debt securities. The following table shows the allocation of debt
securities by sectors at 31 December 2016 and 31 December 2015.
Sector
Strategic Euro
Bond Fund
Strategic Global
Bond Fund
Strategic
Quality
Emerging
Bond Fund(1)
Strategic
Euro Bond
Fund
Strategic Global
Bond Fund
2016 2016 2016 2015 2015
Basic materials 4.11% 3.96% 18.62% 6.03% 3.84%
Communications 4.44% 7.46% 8.69% 5.33% 6.79%
Consummer, Non-Cyclical 8.68% 13.04% 6.48% 5.55% 12.03%
Consumer, Cyclical 23.42% 12.36% 2.08% 14.49% 5.55%
Energy 13.63% 4.34% 18.58% 3.20% -
Financial 6.52% 15.85% 23.32% 10.95% 21.31%
Government - - - 12.88% 29.21%
Industrial 13.91% 2.54% 3.17% 10.15% 4.53%
Sovereign 8.55% 16.24% 19.06% - -
Technology 1.66% 6.80% - 3.49% 5.01%
Utilities 15.08% 17.41% - 27.93% 11.73%
100.00% 100.00% 100.00% 100.00% 100.00% (1) For the period 28 April 2016 (commenced operations) to 31 December 2016
(c) Liquidity Risk
Liquidity risk is the risk that an entity will encounter difficulty in meeting obligations associated with financial
liabilities.
The Company’s Prospectus provides for the daily creation and cancellation of shares for Strategic China Panda
Fund, Strategic Euro Bond Fund, Nippon Growth (UCITS) Fund, Strategic Europe Value Fund, Strategic
Global Bond Fund, Strategic US Momentum and Value Fund, Strategic Global Quality Fund, weekly Strategic
European Smaller Companies Fund, Strategic Quality Emerging Bond Fund, Strategic Beta Flex Fund and it is
therefore exposed to the liquidity risk of meeting shareholder redemptions at any time. The Company therefore
invests the majority of its assets in investments that are traded in an active market and can be readily disposed
of.
The Company’s financial instruments also comprise investments in derivative contracts traded over-the-
counter, which are not traded in an organised public market and which generally may be illiquid. As a result,
the Company may not be able to liquidate quickly some of its investments in these instruments at an amount
close to its fair value in order to meet its liquidity requirements, or to respond to specific events such as
deterioration in the credit worthiness of any particular issuer.
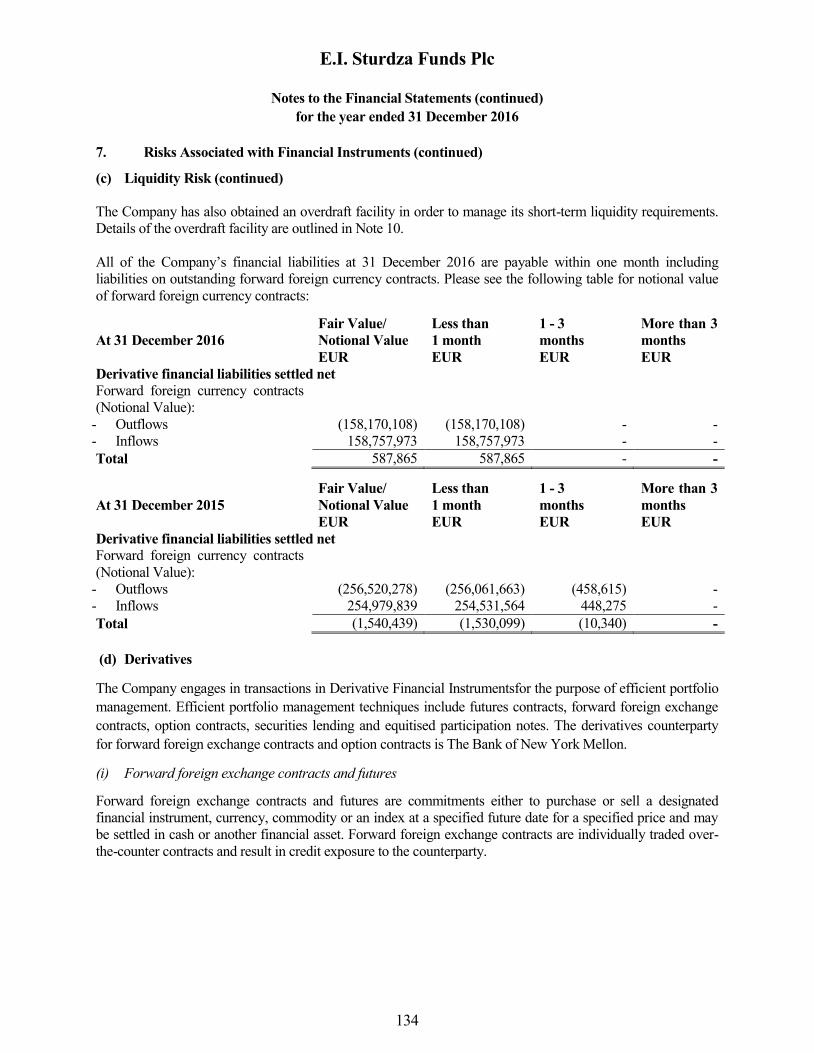
E.I. Sturdza Funds Plc
Notes to the Financial Statements (continued)
for the year ended 31 December 2016
134
7. Risks Associated with Financial Instruments (continued)
(c) Liquidity Risk (continued)
The Company has also obtained an overdraft facility in order to manage its short-term liquidity requirements.
Details of the overdraft facility are outlined in Note 10.
All of the Company’s financial liabilities at 31 December 2016 are payable within one month including
liabilities on outstanding forward foreign currency contracts. Please see the following table for notional value
of forward foreign currency contracts:
At 31 December 2016
Fair Value/
Notional Value
Less than
1 month
1 - 3
months
More than 3
months
EUR EUR EUR EUR
Derivative financial liabilities settled net
Forward foreign currency contracts
(Notional Value):
- Outflows (158,170,108) (158,170,108) - -
- Inflows 158,757,973 158,757,973 - -
Total 587,865 587,865 - -
At 31 December 2015
Fair Value/
Notional Value
Less than
1 month
1 - 3
months
More than 3
months
EUR EUR EUR EUR
Derivative financial liabilities settled net
Forward foreign currency contracts
(Notional Value):
- Outflows (256,520,278) (256,061,663) (458,615) -
- Inflows 254,979,839 254,531,564 448,275 -
Total (1,540,439) (1,530,099) (10,340) -
(d) Derivatives
The Company engages in transactions in Derivative Financial Instrumentsfor the purpose of efficient portfolio
management. Efficient portfolio management techniques include futures contracts, forward foreign exchange
contracts, option contracts, securities lending and equitised participation notes. The derivatives counterparty
for forward foreign exchange contracts and option contracts is The Bank of New York Mellon.
(i) Forward foreign exchange contracts and futures
Forward foreign exchange contracts and futures are commitments either to purchase or sell a designated
financial instrument, currency, commodity or an index at a specified future date for a specified price and may
be settled in cash or another financial asset. Forward foreign exchange contracts are individually traded over-
the-counter contracts and result in credit exposure to the counterparty.

E.I. Sturdza Funds Plc
Notes to the Financial Statements (continued)
for the year ended 31 December 2016
135
7. Risks Associated with Financial Instruments (continued)
(d) Derivatives (continued)
(i) Forward foreign exchange contracts and futures (continued)
Forward foreign exchange contracts result in exposure to market risk based on changes in market prices
relative to contracted amounts. Market risks arise due to the possible movement in foreign currency exchange
rates, indices, and securities’ values underlying these instruments. In addition, because of the low margin
deposits normally required in relation to notional contract sizes, a high degree of leverage may be typical of a
futures or forward trading account. As a result, a relatively small price movement in an underlying of a futures
or forward contract may result in substantial losses to the Company. Forward contracts are generally traded
over-the-counter and therefore are subject to greater liquidity risk.
If prices fluctuate during a single day’s trading beyond those limits, the Company could be prevented from
promptly liquidating unfavourable positions and thus could be subject to substantial losses.
Notional amounts are the underlying reference amounts to stock exchange indices, equities and foreign
currencies upon which the fair value of the forward contracts traded by the Company are based. While notional
amounts do not represent the current fair value and are not necessarily indicative of the future cash flows of the
Company’s forward foreign exchange, the underlying price changes in relation to the variables specified by the
notional amounts affect the fair value of these derivative financial instruments.
Strategic China Panda Fund
As at 31 December 2016, the Sub-Fund held the following forward foreign exchange contracts:
Bought amount Sold amount Maturity date Unrealised gain/(loss)
USD
USD 3,868,621 HKD (30,000,000) 03/01/2017 (764)
EUR 78,546 USD (82,383) 04/01/2017 470
EUR 15,991,083 USD (16,661,941) 26/01/2017 226,079
USD 82,486 EUR (78,546) 26/01/2017 (465)
GBP 285,805 USD (349,869) 26/01/2017 3,501
EUR 1,988,812 USD (2,072,247) 26/01/2017 28,118
256,939
As at 31 December 2015, the Sub-Fund held the following forward foreign exchange contracts:
Bought amount Sold amount Maturity date Unrealised gain/(loss)
USD
EUR 37,705,247 USD (41,118,138) 29/01/2016 (138,643)
EUR 6,653,784 USD (7,256,052) 29/01/2016 (24,466)
GBP 587,627 USD (874,082) 29/01/2016 (7,385)
(170,494)

E.I. Sturdza Funds Plc
Notes to the Financial Statements (continued)
for the year ended 31 December 2016
136
7. Risks Associated with Financial Instruments (continued)
(d) Derivatives (continued)
(i) Forward foreign exchange contracts and futures (continued)
Strategic Euro Bond Fund
As at 31 December 2016, the Sub-Fund held the following forward foreign exchange contracts:
Bought amount Sold amount Maturity date Unrealised gain/(loss)
EUR
CHF 13,562,731 EUR (12,669,523) 26/01/2017 (14,132)
EUR 9,112 CHF (9,799) 26/01/2017 (32)
(14,164)
As at 31 December 2015, the Sub-Fund held the following forward foreign exchange contracts:
Bought amount Sold amount Maturity date Unrealised gain/(loss)
EUR
CHF 22,586,424 EUR (20,900,332) 29/01/2016 (129,319)
CHF 396,504 EUR (366,904) 29/01/2016 (2,270)
(131,589)
Nippon Growth (UCITS) Fund
As at 31 December 2016, the Sub-Fund held the following forward foreign exchange contracts:
Bought amount Sold amount Maturity date Unrealised gain/(loss)
JPY
EUR 4,385,039 JPY (536,321,215) 26/01/2017 3,134,517
JPY 12,513,606 EUR (101,580) 26/01/2017 17,043
EUR 3,109,792 JPY (380,349,473) 26/01/2017 2,222,943
JPY 8,776,895 EUR (71,247) 26/01/2017 11,954
5,386,457
As at 31 December 2015, the Sub-Fund held the following forward foreign exchange contracts:
Bought amount Sold amount Maturity date Unrealised gain/(loss)
JPY
JPY 146,351,947 EUR (1,113,582) 29/01/2016 951,284
EUR 26,422,220 JPY (3,481,531,803) 29/01/2016 (31,576,023)
JPY 21,076,094 EUR (160,367) 29/01/2016 136,994
EUR 4,260,119 JPY (561,335,853) 29/01/2016 (5,091,079)
GBP 15,188,120 JPY (2,730,008,313) 29/01/2016 (38,790,277)
(74,369,101)

E.I. Sturdza Funds Plc
Notes to the Financial Statements (continued)
for the year ended 31 December 2016
137
7. Risks Associated with Financial Instruments (continued)
(d) Derivatives (continued)
(i) Forward foreign exchange contracts and futures (continued)
Strategic Europe Value Fund
As at 31 December 2016, the Sub-Fund held the following forward foreign exchange contracts:
Bought amount Sold amount Maturity date Unrealised gain/(loss)
EUR
EUR 1,398,077 GBP (1,200,000) 03/01/2017 (7,245)
CHF 95,090 EUR (88,621) 04/01/2017 76
CHF 45,771,648 EUR (42,757,240) 26/01/2017 (47,691)
CHF 250,000 EUR (233,092) 26/01/2017 183
EUR 232,992 CHF (250,000) 04/01/2017 (201)
EUR 88,659 CHF (95,090) 26/01/2017 70
USD 1,288,245 EUR (1,236,595) 26/01/2017 (16,791)
EUR 3,665 GBP (3,130) 26/01/2017 1
EUR 11,827 GBP (10,061) 26/01/2017 48
GBP 10,061 EUR (11,836) 03/01/2017 (53)
GBP 13,332,713 EUR (15,672,277) 26/01/2017 (63,297)
USD 2,111,340 EUR (2,026,689) 26/01/2017 (27,519)
USD 2,285,667 EUR (2,194,026) 26/01/2017 (29,791)
(192,350)
As at 31 December 2015, the Sub-Fund held the following forward foreign exchange contracts:
Bought amount Sold amount Maturity date Unrealised gain/(loss)
EUR
CHF 1,547,195 EUR (1,433,319) 29/01/2016 (10,482)
CHF 61,272,097 EUR (56,698,092) 29/01/2016 (350,814)
GBP 424,995 EUR (579,449) 29/01/2016 (2,702)
GBP 13,917,689 EUR (18,982,481) 29/01/2016 (95,272)
USD 245,986 EUR (224,515) 29/01/2016 1,817
USD 10,258,264 EUR (9,406,807) 29/01/2016 31,825
(425,628)
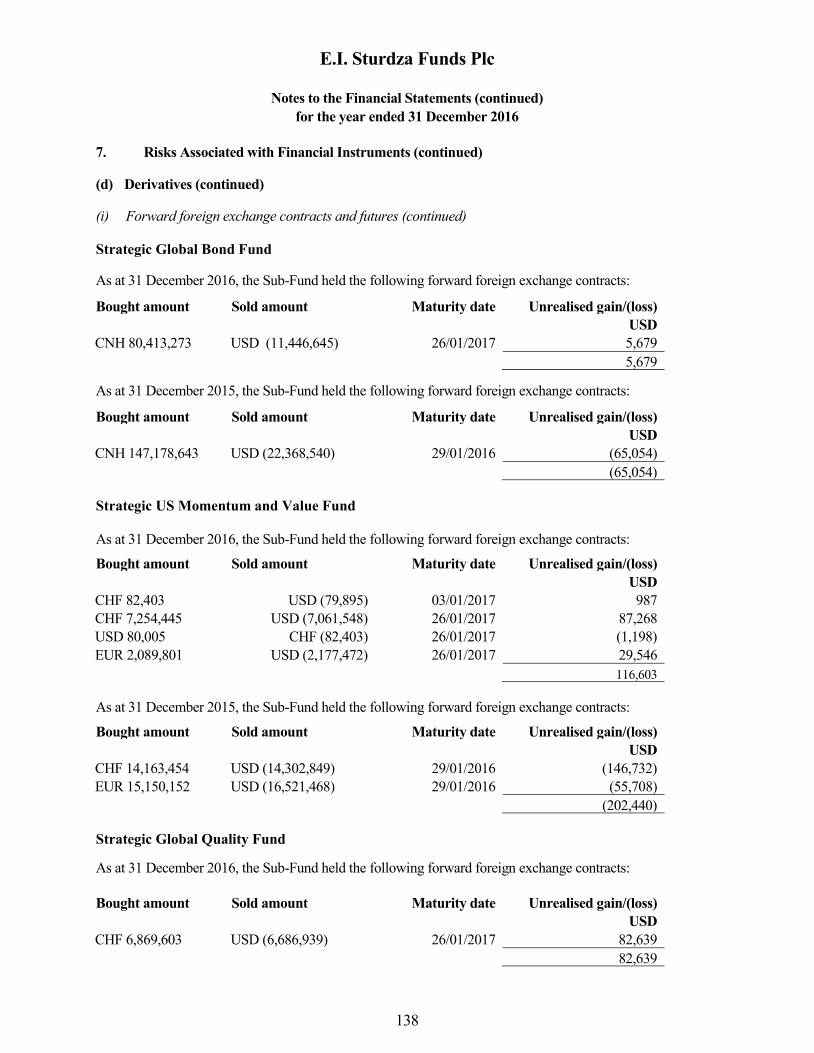
E.I. Sturdza Funds Plc
Notes to the Financial Statements (continued)
for the year ended 31 December 2016
138
7. Risks Associated with Financial Instruments (continued)
(d) Derivatives (continued)
(i) Forward foreign exchange contracts and futures (continued)
Strategic Global Bond Fund As at 31 December 2016, the Sub-Fund held the following forward foreign exchange contracts:
Bought amount Sold amount Maturity date Unrealised gain/(loss)
USD
CNH 80,413,273 USD (11,446,645) 26/01/2017 5,679
5,679
As at 31 December 2015, the Sub-Fund held the following forward foreign exchange contracts:
Bought amount Sold amount Maturity date Unrealised gain/(loss)
USD
CNH 147,178,643 USD (22,368,540) 29/01/2016 (65,054)
(65,054)
Strategic US Momentum and Value Fund
As at 31 December 2016, the Sub-Fund held the following forward foreign exchange contracts:
Bought amount Sold amount Maturity date Unrealised gain/(loss)
USD
CHF 82,403 USD (79,895) 03/01/2017 987
CHF 7,254,445 USD (7,061,548) 26/01/2017 87,268
USD 80,005 CHF (82,403) 26/01/2017 (1,198)
EUR 2,089,801 USD (2,177,472) 26/01/2017 29,546
116,603
As at 31 December 2015, the Sub-Fund held the following forward foreign exchange contracts:
Bought amount Sold amount Maturity date Unrealised gain/(loss)
USD
CHF 14,163,454 USD (14,302,849) 29/01/2016 (146,732)
EUR 15,150,152 USD (16,521,468) 29/01/2016 (55,708)
(202,440)
Strategic Global Quality Fund
As at 31 December 2016, the Sub-Fund held the following forward foreign exchange contracts:
Bought amount Sold amount Maturity date Unrealised gain/(loss)
USD
CHF 6,869,603 USD (6,686,939) 26/01/2017 82,639
82,639
E.I. Sturdza Funds Plc
Notes to the Financial Statements (continued)
for the year ended 31 December 2016
139
7. Risks Associated with Financial Instruments (continued)
(d) Derivatives (continued)
Strategic Global Quality Fund (continued)
(i) Forward foreign exchange contracts and futures (continued)
As at 31 December 2015, the Sub-Fund held the following forward foreign exchange contracts:
Bought amount Sold amount Maturity date Unrealised gain/(loss)
USD
USD 486,872 JPY (59,800,000) 03/02/2016 (11,231)
(11,231)
Strategic Quality Emerging Bond Fund As at 31 December 2016, the Sub-Fund held the following forward foreign exchange contracts:
Bought amount Sold amount Maturity date Unrealised gain/(loss)
USD
CHF 10,134,696 USD (9,865,213) 26/01/2017 121,917
EUR 11,717,500 USD (12,209,072) 26/01/2017 165,661
EUR 2,988,702 USD (3,114,084) 26/01/2017 42,254
329,832
(ii) Options
As at 31 December 2016, the Company has no exposure to the Option contracts within the portfolio for the
Strategic Europe Value Fund.
As at 31 December 2015, the Company maintained exposure to the following option positions within the
portfolio for the Strategic Europe Value Fund:
March 2016 Strike price: 1900 Put Options on S&P 500 Index 260 contracts
As at 31 December 2016, the Company maintained exposure to the following option positions within the
portfolio for the Strategic US Momentum and Value Fund:
January 2017 Strike Price: 97.5 Call Options on Apple Inc (400) contracts
June 2017 Strike Price: 70 Call Options on CVS Health Corp 140 contracts

E.I. Sturdza Funds Plc
Notes to the Financial Statements (continued)
for the year ended 31 December 2016
140
7. Risks Associated with Financial Instruments (continued)
(d) Derivatives (continued)
(ii) Options (continued)
As at 31 December 2015, the Company maintained exposure to the following option positions within the
portfolio for the Strategic US Momentum and Value Fund:
January 2016 Strike price: 155 Call Options on Becton Dickinson 200 contracts
January 2016 Strike price: 55 Call Options on Carmax 1000 contracts
January 2016 Strike price: 310 Call Options on Allergan (150) contracts
January 2016 Strike price: 315 Call Options on Allergan (300) contracts
January 2016 Strike price: 400 Call Options on Amerco (100) contracts
January 2016 Strike price: 150 Call Options on Avago Technologies (150) contracts
January 2016 Strike price: 62.5 Call Options on Carmax (1000) contracts
January 2016 Strike price: 55 Call Options on Jarden (750) contracts
January 2016 Strike price: 57.5 Call Options on Jarden (600) contracts
The Investment Manager considers the residual risk inherent in holding option positions to be insignificant.
The options held represent a hedge within the portfolio to the risk factor exposures to which the Strategic
Europe Value Fund and Strategic US Momentum and Value Fund are exposed. As a consequence the
Investment Manager considers these option positions to be covered option positions.
(iii) Equitised participation notes
Equitised participation notes are valued at fair value based on the closing price of the underlying reference
asset and prevailing spot currency exchange rate on the relevant valuation day. The notes represent an
exposure to reference assets such as equity securities. The Company purchases a fully equitised instrument
traded over the counter and designed to replicate the performance of the underlying reference asset, similar to a
total return swap but issued in note form and traded over the counter with a selected market counterparty.
Although the fair value of the participation note varies dependent on the fair value of the underlying reference
asset the participation note also bears a degree of credit risk in addition to the market risk of the underlying
reference asset as a result of the exposure to the counterparty generated by the over the counter nature of the
position.
At 31 December 2016, Strategic China Panda Fund did not hold equitised participation notes.
At 31 December 2015, Strategic China Panda Fund held equitised participation notes.
E.I. Sturdza Funds Plc
Notes to the Financial Statements (continued)
for the year ended 31 December 2016
141
7. Risks Associated with Financial Instruments (continued)
(d) Derivatives (continued)
(iv) Offsetting Financial Instruments Strategic China Panda Fund
31 December 2016
Financial assets which are subject to enforceable master netting arrangements or similar agreements, are
detailed in the following table.
Description of
type of Financial
Assets
Gross amount
of recognised
Financial
Assets
USD
Gross amount
of Financial
Liabilities offset
in the Statement
of Financial
Position
USD
Net amount of
Financial Assets
presented in the
Statement of
Financial Position
USD
Gross amounts not
offset in the Statement
of Financial Position
Net
amount
USD
Financial
instrument
USD
Cash
Collateral
received
USD
Derivatives 258,168 - 258,168 (1,229) - 256,939
258,168 - 258,168 (1,229) - 256,939
Financial liabilities which are subject to enforceable master netting arrangements or similar agreements, are
detailed in the following table.
Description of
type of Financial
Liabilities
Gross amount
of recognised
Financial
Liabilities
USD
Gross amount
of Financial
Assets offset in
the Statement
of Financial
Position
USD
Net amount of
Financial
Liabilities
presented in the
Statement of
Financial Position
USD
Gross amounts not
offset in the Statement
of Financial Position
Net
amount
USD
Financial
instrument
USD
Cash
Collateral
pledged
USD
Derivatives (1,229) - (1,229) 1,229 - -
(1,229) - (1,229) 1,229 - -
E.I. Sturdza Funds Plc
Notes to the Financial Statements (continued)
for the year ended 31 December 2016
142
7. Risks Associated with Financial Instruments (continued)
(d) Derivatives (continued)
(iv) Offsetting Financial Instruments (continued)
Strategic China Panda Fund (continued)
31 December 2015
Financial liabilities which are subject to enforceable master netting arrangements or similar agreements, are
detailed in the following table.
Description of
type of Financial
Liabilities
Gross amount
of recognised
Financial
Liabilities
USD
Gross amount
of Financial
Assets offset in
the Statement
of Financial
Position
USD
Net amount of
Financial
Liabilities
presented in the
Statement of
Financial Position
USD
Gross amounts not
offset in the Statement
of Financial Position
Net
amount
USD
Financial
instrument
USD
Cash
Collateral
pledged
USD
Derivatives (170,494) - (170,494) - - (170,494)
(170,494) - (170,494) - - (170,494)
Strategic Euro Bond Fund
31 December 2016
Financial liabilities which are subject to enforceable master netting arrangements or similar agreements, are
detailed in the following table.
Description of
type of Financial
Liabilities
Gross amount
of recognised
Financial
Liabilities
EUR
Gross amount
of Financial
Assets offset in
the Statement
of Financial
Position
EUR
Net amount of
Financial
Liabilities
presented in the
Statement of
Financial Position
EUR
Gross amounts not
offset in the Statement
of Financial Position
Net
amount
EUR
Financial
instrument
EUR
Cash
Collateral
pledged
EUR
Derivatives (14,164) - (14,164) - - (14,164)
(14,164) - (14,164) - - (14,164)
E.I. Sturdza Funds Plc
Notes to the Financial Statements (continued)
for the year ended 31 December 2016
143
7. Risks Associated with Financial Instruments (continued)
(d) Derivatives (continued)
(iv) Offsetting Financial Instruments (continued)
31 December 2015
Financial liabilities which are subject to enforceable master netting arrangements or similar agreements, are
detailed in the following table.
Description of
type of Financial
Liabilities
Gross amount
of recognised
Financial
Liabilities
EUR
Gross amount
of Financial
Assets offset in
the Statement
of Financial
Position
EUR
Net amount of
Financial
Liabilities
presented in the
Statement of
Financial Position
EUR
Gross amounts not
offset in the Statement
of Financial Position
Net
amount
EUR
Financial
instrument
EUR
Cash
Collateral
pledged
EUR
Derivatives (178,089) - (178,089) - - (178,089)
(178,089) - (178,089) - - (178,089)
Nippon Growth (UCITS) Fund
31 December 2016
Financial assets which are subject to enforceable master netting arrangements or similar agreements are
detailed in the following table.
Description of
type of Financial
Assets
Gross amount
of recognised
Financial
Assets
JPY
Gross amount
of Financial
Liabilities
offset in the
Statement of
Financial
Position
JPY
Net amount of
Financial Assets
presented in the
Statement of
Financial
Position
JPY
Gross amounts not
offset in the Statement
of Financial Position
Net
amount
JPY
Financial
instrument
JPY
Cash
Collateral
received
JPY
Derivatives 5,386,457 - 5,386,457 - - 5,386,457
5,386,457 - 5,386,457 - - 5,386,457

E.I. Sturdza Funds Plc
Notes to the Financial Statements (continued)
for the year ended 31 December 2016
144
7. Risks Associated with Financial Instruments (continued)
(d) Derivatives (continued)
(iv) Offsetting Financial Instruments (continued) Nippon Growth (UCITS) Fund (continued)
31 December 2015
Financial assets which are subject to enforceable master netting arrangements or similar agreements are
detailed in the following table.
Description of
type of Financial
Assets
Gross amount
of recognised
Financial
Assets
JPY
Gross amount
of Financial
Liabilities
offset in the
Statement of
Financial
Position
JPY
Net amount of
Financial Assets
presented in the
Statement of
Financial
Position
JPY
Gross amounts not
offset in the Statement
of Financial Position
Net
amount
JPY
Financial
instrument
JPY
Cash
Collateral
received
JPY
Derivatives 1,088,278 - 1,088,278 (1,088,278) - -
1,088,278 - 1,088,278 (1,088,278) - -
Financial liabilities which are subject to enforceable master netting arrangements or similar agreements, are
detailed in the following table.
Description of
type of Financial
Liabilities
Gross amount
of recognised
Financial
Liabilities
JPY
Gross amount
of Financial
Assets offset in
the Statement
of Financial
Position
JPY
Net amount of
Financial
Liabilities
presented in the
Statement of
Financial Position
JPY
Gross amounts not
offset in the Statement
of Financial Position
Net
amount
JPY
Financial
instrument
JPY
Cash
Collateral
pledged
JPY
Derivatives (75,457,379) - (75,457,379) 1,088,278 - (74,369,101)
(75,457,379) - (75,457,379) 1,088,278 - (74,369,101)
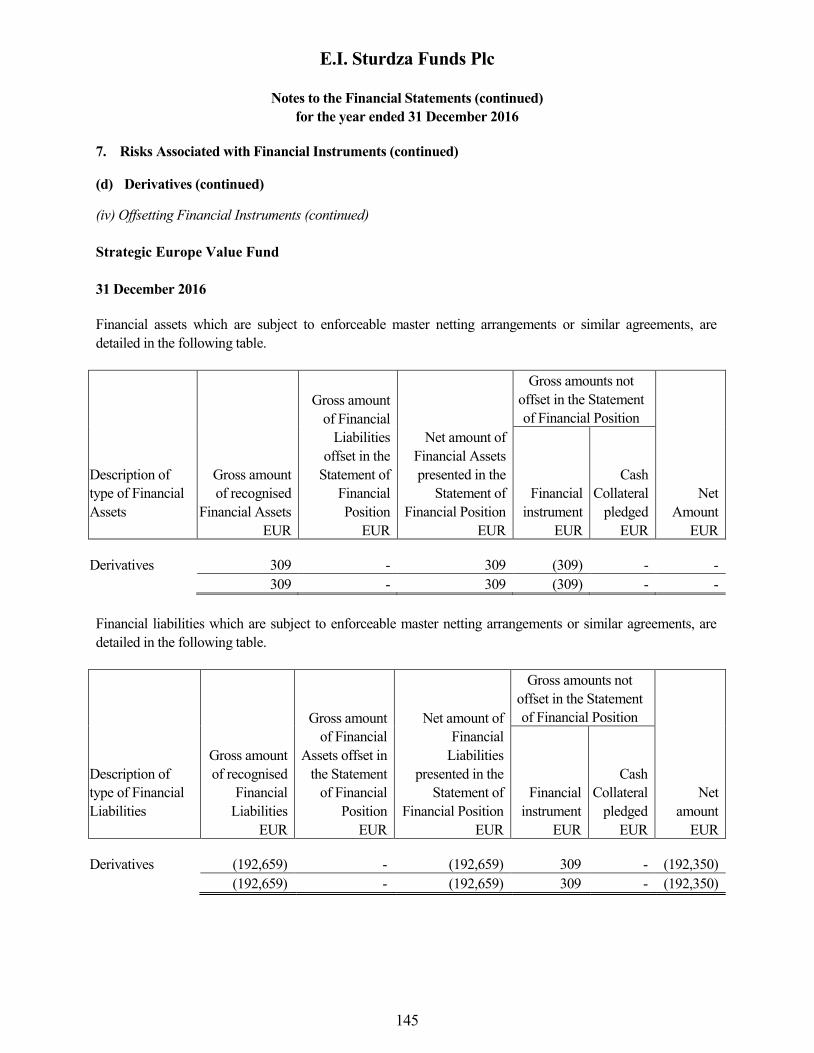
E.I. Sturdza Funds Plc
Notes to the Financial Statements (continued)
for the year ended 31 December 2016
145
7. Risks Associated with Financial Instruments (continued)
(d) Derivatives (continued)
(iv) Offsetting Financial Instruments (continued)
Strategic Europe Value Fund
31 December 2016
Financial assets which are subject to enforceable master netting arrangements or similar agreements, are
detailed in the following table.
Description of
type of Financial
Assets
Gross amount
of recognised
Financial Assets
EUR
Gross amount
of Financial
Liabilities
offset in the
Statement of
Financial
Position
EUR
Net amount of
Financial Assets
presented in the
Statement of
Financial Position
EUR
Gross amounts not
offset in the Statement
of Financial Position
Net
Amount
EUR
Financial
instrument
EUR
Cash
Collateral
pledged
EUR
Derivatives 309 - 309 (309) - -
309 - 309 (309) - -
Financial liabilities which are subject to enforceable master netting arrangements or similar agreements, are
detailed in the following table.
Description of
type of Financial
Liabilities
Gross amount
of recognised
Financial
Liabilities
EUR
Gross amount
of Financial
Assets offset in
the Statement
of Financial
Position
EUR
Net amount of
Financial
Liabilities
presented in the
Statement of
Financial Position
EUR
Gross amounts not
offset in the Statement
of Financial Position
Net
amount
EUR
Financial
instrument
EUR
Cash
Collateral
pledged
EUR
Derivatives (192,659) - (192,659) 309 - (192,350)
(192,659) - (192,659) 309 - (192,350)
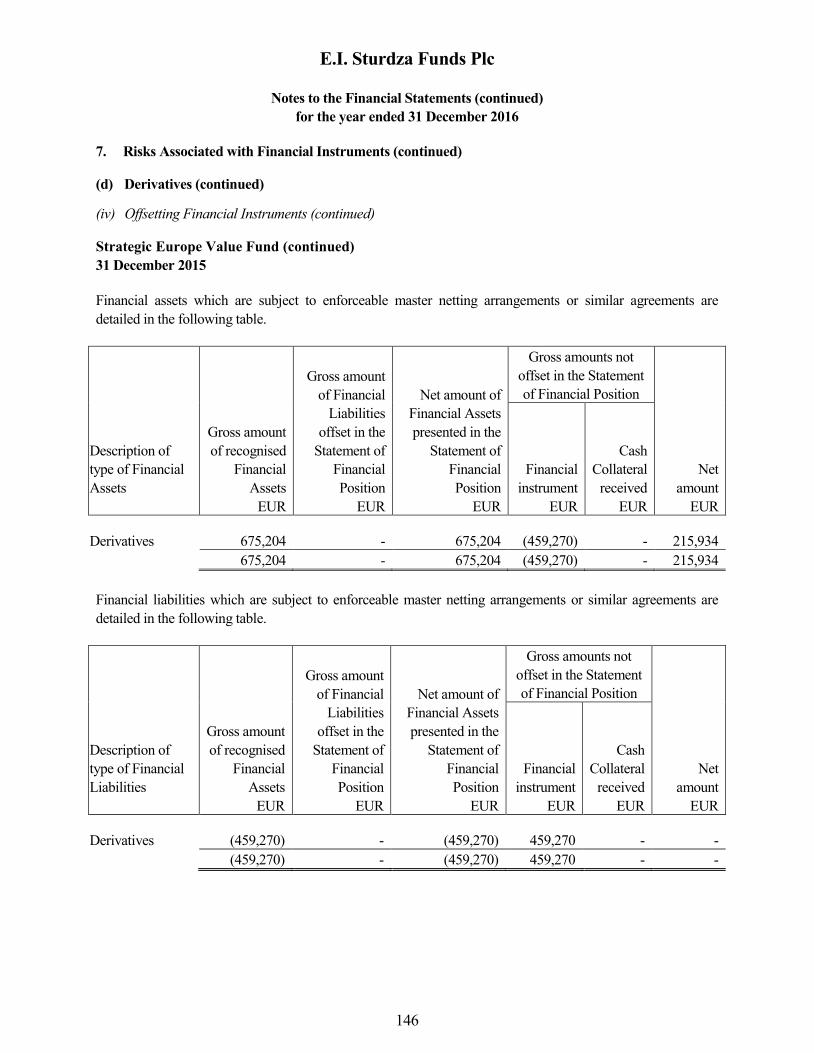
E.I. Sturdza Funds Plc
Notes to the Financial Statements (continued)
for the year ended 31 December 2016
146
7. Risks Associated with Financial Instruments (continued)
(d) Derivatives (continued)
(iv) Offsetting Financial Instruments (continued)
Strategic Europe Value Fund (continued)
31 December 2015
Financial assets which are subject to enforceable master netting arrangements or similar agreements are
detailed in the following table.
Description of
type of Financial
Assets
Gross amount
of recognised
Financial
Assets
EUR
Gross amount
of Financial
Liabilities
offset in the
Statement of
Financial
Position
EUR
Net amount of
Financial Assets
presented in the
Statement of
Financial
Position
EUR
Gross amounts not
offset in the Statement
of Financial Position
Net
amount
EUR
Financial
instrument
EUR
Cash
Collateral
received
EUR
Derivatives 675,204 - 675,204 (459,270) - 215,934
675,204 - 675,204 (459,270) - 215,934
Financial liabilities which are subject to enforceable master netting arrangements or similar agreements are
detailed in the following table.
Description of
type of Financial
Liabilities
Gross amount
of recognised
Financial
Assets
EUR
Gross amount
of Financial
Liabilities
offset in the
Statement of
Financial
Position
EUR
Net amount of
Financial Assets
presented in the
Statement of
Financial
Position
EUR
Gross amounts not
offset in the Statement
of Financial Position
Net
amount
EUR
Financial
instrument
EUR
Cash
Collateral
received
EUR
Derivatives (459,270) - (459,270) 459,270 - -
(459,270) - (459,270) 459,270 - -

E.I. Sturdza Funds Plc
Notes to the Financial Statements (continued)
for the year ended 31 December 2016
147
7. Risks Associated with Financial Instruments (continued)
(d) Derivatives (continued)
(iv) Offsetting Financial Instruments (continued)
Strategic Global Bond Fund
31 December 2016
Financial assets which are subject to enforceable master netting arrangements or similar agreements, are
detailed in the following table.
Description of
type of Financial
Assets
Gross amount
of recognised
Financial Assets
USD
Gross amount
of Financial
Liabilities
offset in the
Statement of
Financial
Position
USD
Net amount of
Financial Assets
presented in the
Statement of
Financial Position
USD
Gross amounts not
offset in the Statement
of Financial Position
Net
amount
USD
Financial
instrument
USD
Cash
Collateral
pledged
USD
Derivatives 5,679 - 5,679 - - 5,679
5,679 - 5,679 - - 5,679
31 December 2015
Financial assets which are subject to enforceable master netting arrangements or similar agreements are
detailed in the following table.
Description of
type of Financial
Assets
Gross amount
of recognised
Financial
Assets
USD
Gross amount of
Financial
Liabilities offset
in the Statement
of Financial
Position
USD
Net amount of
Financial
Assets
presented in the
Statement of
Financial
Position
USD
Gross amounts not
offset in the Statement
of Financial Position
Net
amount
USD
Financial
instrument
USD
Cash
Collateral
received
USD
Derivatives 77,453 - 77,453 (65,054) - 12,399
77,453 - 77,453 (65,054) - 12,399

E.I. Sturdza Funds Plc
Notes to the Financial Statements (continued)
for the year ended 31 December 2016
148
7. Risks Associated with Financial Instruments (continued)
(d) Derivatives (continued)
(iv) Offsetting Financial Instruments (continued)
Strategic Global Bond Fund (continued)
31 December 2015
Financial liabilities which are subject to enforceable master netting arrangements or similar agreements are
detailed in the following table.
Description of
type of Financial
Liabilities
Gross amount
of recognised
Financial
Liabilities
USD
Gross amount of
Financial Asset
offset in the
Statement of
Financial
Position
USD
Net amount of
Financial
Assets
presented in the
Statement of
Financial
Position
USD
Gross amounts not
offset in the Statement
of Financial Position
Net
amount
USD
Financial
instrument
USD
Cash
Collateral
received
USD
Derivatives (65,054) - (65,054) 65,054 - -
(65,054) - (65,054) 65,054 - -
Strategic US Momentum and Value Fund
31 December 2016
Financial assets which are subject to enforceable master netting arrangements or similar agreements, are
detailed in the following table.
Description of
type of Financial
Assets
Gross amount
of recognised
Financial
Assets
USD
Gross amount
of Financial
Liabilities offset
in the Statement
of Financial
Position
USD
Net amount of
Financial
Liabilities
presented in the
Statement of
Financial Position
USD
Gross amounts not
offset in the Statement
of Financial Position
Net
amount
USD
Financial
instrument
USD
Cash
Collateral
pledged
USD
Derivatives 260,251 - 260,251 (260,251) - -
260,251 - 260,251 (260,251) - -

E.I. Sturdza Funds Plc
Notes to the Financial Statements (continued)
for the year ended 31 December 2016
149
7. Risks Associated with Financial Instruments (continued)
(d) Derivatives (continued)
(iv) Offsetting Financial Instruments (continued)
Strategic US Momentum and Value Fund (continued)
31 December 2016
Financial liabilities which are subject to enforceable master netting arrangements or similar agreements, are
detailed in the following table.
Description of
type of Financial
Liabilities
Gross amount
of recognised
Financial
Liabilities
USD
Gross amount
of Financial
Assets offset in
the Statement
of Financial
Position
USD
Net amount of
Financial
Liabilities
presented in the
Statement of
Financial Position
USD
Gross amounts not
offset in the Statement
of Financial Position
Net
amount
USD
Financial
instrument
USD
Cash
Collateral
pledged
USD
Derivatives (725,198) - (725,198) 260,251 - (464,947)
(725,198) - (725,198) 260,251 - (464,947)
31 December 2015
Financial assets which are subject to enforceable master netting arrangements or similar agreements are
detailed in the following table.
Description of
type of Financial
Assets
Gross amount
of recognised
Financial
Assets
USD
Gross amount of
Financial
Liabilities offset
in the Statement
of Financial
Position
USD
Net amount of
Financial
Assets
presented in the
Statement of
Financial
Position
USD
Gross amounts not
offset in the Statement
of Financial Position
Net
amount
USD
Financial
instrument
USD
Cash
Collateral
received
USD
Derivatives 155,000 - 155,000 (155,000) - -
155,000 - 155,000 (155,000) - -

E.I. Sturdza Funds Plc
Notes to the Financial Statements (continued)
for the year ended 31 December 2016
150
7. Risks Associated with Financial Instruments (continued)
(d) Derivatives (continued)
(iv) Offsetting Financial Instruments (continued)
Strategic US Momentum and Value Fund (continued)
31 December 2015 (continued)
Financial liabilities which are subject to enforceable master netting arrangements or similar agreements are
detailed in the following table.
Description of
type of
Financial
Liabilities
Gross amount
of recognised
Financial
Assets
USD
Gross amount
of Financial
Liabilities offset
in the Statement
of Financial
Position
USD
Net amount of
Financial Assets
presented in the
Statement of
Financial
Position
USD
Gross amounts not
offset in the Statement
of Financial Position
Net
amount
USD
Financial
instrument
USD
Cash
Collateral
received
USD
Derivatives (791,990) - (791,990) 155,000 - (636,990)
(791,990) - (791,990) 155,000 - (636,990)
Strategic Global Quality Fund
31 December 2016
Financial assets which are subject to enforceable master netting arrangements or similar agreements are
detailed in the following table.
Description of
type of
Financial Assets
Gross amount
of recognised
Financial Assets
USD
Gross amount
of Financial
Liabilities offset
in the Statement
of Financial
Position
USD
Net amount of
Financial Assets
presented in the
Statement of
Financial
Position
USD
Gross amounts not offset in
the Statement of Financial
Position
Net
amount
USD
Financial
instrument
USD
Cash
Collateral
received
USD
Derivatives 82,639 - 82,639 - - 82,639
82,639 - 82,639 - - 82,639

E.I. Sturdza Funds Plc
Notes to the Financial Statements (continued)
for the year ended 31 December 2016
151
7. Risks Associated with Financial Instruments (continued)
(d) Derivatives (continued)
(iv) Offsetting Financial Instruments (continued)
Strategic Global Quality Fund (continued)
31 December 2015
Financial liabilities which are subject to enforceable master netting arrangements or similar agreements are
detailed in the following table.
Description of
type of Financial
Liabilities
Gross amount
of recognised
Financial
Liabilities
USD
Gross amount
of Financial
Assets offset in
the Statement
of Financial
Position
USD
Net amount of
Financial
Liabilities
presented in the
Statement of
Financial Position
USD
Gross amounts not
offset in the Statement
of Financial Position
Net
amount
USD
Financial
instrument
USD
Cash
Collateral
pledged
USD
Derivatives (11,231) - (11,231) - - (11,231)
(11,231) - (11,231) - - (11,231)
Strategic Quality Emerging Bond Fund
31 December 2016
Financial assets which are subject to enforceable master netting arrangements or similar agreements are
detailed in the following table.
Description of
type of Financial
Assets
Gross amount
of recognised
Financial
Assets
USD
Gross amount
of Financial
Liabilities
offset in the
Statement of
Financial
Position
USD
Net amount of
Financial Assets
presented in the
Statement of
Financial
Position
USD
Gross amounts not
offset in the Statement
of Financial Position
Net
amount
USD
Financial
instrument
USD
Cash
Collateral
received
USD
Derivatives 329,832 - 329,832 - - 329,832
329,832 - 329,832 - - 329,832

E.I. Sturdza Funds Plc
Notes to the Financial Statements (continued)
for the year ended 31 December 2016
152
8. Securities lending
The Company on behalf of Strategic China Panda Fund, Strategic Euro Bond Fund, Nippon Growth (UCITS)
Fund, Strategic Europe Value Fund, Strategic Global Bond Fund, Strategic US Momentum and Value Fund,
Strategic Global Quality Fund, Strategic European Smaller Companies Fund, Strategic Beta Flex Fund and
Strategic Quality Emerging Bond Fund was engaged in a securities lending program in accordance with an
agreement with HSBC Bank plc (the “Bank”), a related party to the Depository, as securities lending agent
dated 22 September 2014. The Company was lending securities with a value of up to 15% of the net asset
value of each fund. The Company receives collateral to in the form of government securities, equities,
certificates of deposit and cash against the loaned securities.
The Company was entitled to 70% of such securities lending income and the Bank was entitled to 30% of the
securities lending income as its fee under the agreement. The Bank meets any additional custody charges and
other operating costs incurred under this agreement out of its own fee.
Collateral held on behalf of the Company was minimum margin of between 102.5% and 105% of the value of
the securities on loan.
The Securities lending agreement with the bank terminated on 4 November 2016. As a result none of the
Sub-Funds held any securities on loan and there were no corresponding collateral held by any of the Sub-
Funds as at 31 December 2016.
At 31 December 2015, the aggregate value of the securities on loan and the corresponding collateral held by
the Sub-Funds are shown below:
Fund Name
Aggregate value of
securities on loan
EUR
*Aggregate value of
collateral held
EUR
Strategic China Panda Fund 6,982,680 10,718,130
Nippon Growth (UCITS) Fund 2,022,134 2,135,211
Strategic Europe Value Fund 1,034,522 1,093,965
Total 10,039,336 13,947,306
* Collateral held in the form of other securities
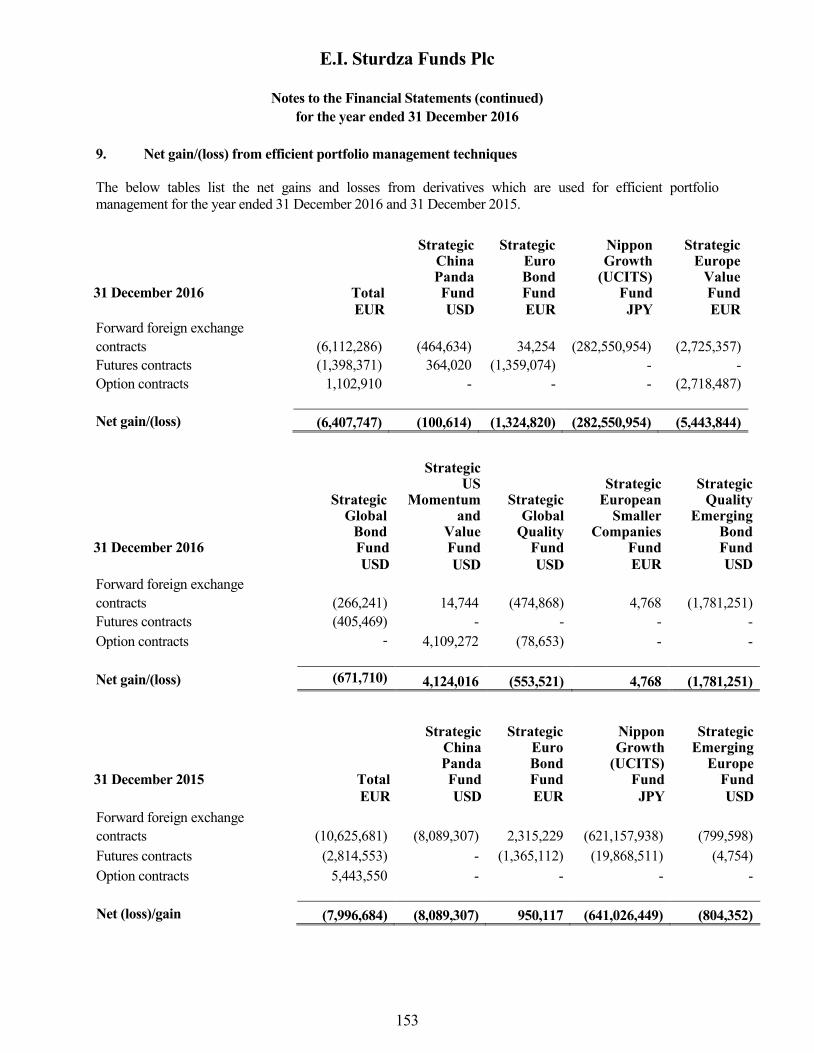
E.I. Sturdza Funds Plc
Notes to the Financial Statements (continued)
for the year ended 31 December 2016
153
9. Net gain/(loss) from efficient portfolio management techniques
The below tables list the net gains and losses from derivatives which are used for efficient portfolio
management for the year ended 31 December 2016 and 31 December 2015.
31 December 2016 Total
Strategic China Panda Fund
Strategic Euro Bond Fund
Nippon Growth
(UCITS) Fund
Strategic Europe
Value Fund
EUR USD EUR JPY EUR
Forward foreign exchange
contracts (6,112,286) (464,634) 34,254 (282,550,954) (2,725,357)
Futures contracts (1,398,371) 364,020 (1,359,074) - -
Option contracts 1,102,910 - - - (2,718,487)
Net gain/(loss) (6,407,747) (100,614) (1,324,820) (282,550,954) (5,443,844)
31 December 2016
Strategic Global
Bond Fund
Strategic US
Momentum and
Value Fund
Strategic Global
Quality Fund
Strategic European
Smaller Companies
Fund
Strategic Quality
Emerging Bond Fund
USD USD USD EUR USD
Forward foreign exchange
contracts (266,241) 14,744 (474,868) 4,768 (1,781,251)
Futures contracts (405,469) - - - -
Option contracts - 4,109,272 (78,653) - -
Net gain/(loss) (671,710) 4,124,016 (553,521) 4,768 (1,781,251)
31 December 2015 Total
Strategic China Panda Fund
Strategic Euro Bond Fund
Nippon Growth
(UCITS) Fund
Strategic Emerging
Europe Fund
EUR USD EUR JPY USD
Forward foreign exchange
contracts (10,625,681) (8,089,307) 2,315,229 (621,157,938) (799,598)
Futures contracts (2,814,553) - (1,365,112) (19,868,511) (4,754)
Option contracts 5,443,550 - - - -
Net (loss)/gain (7,996,684) (8,089,307) 950,117 (641,026,449) (804,352)
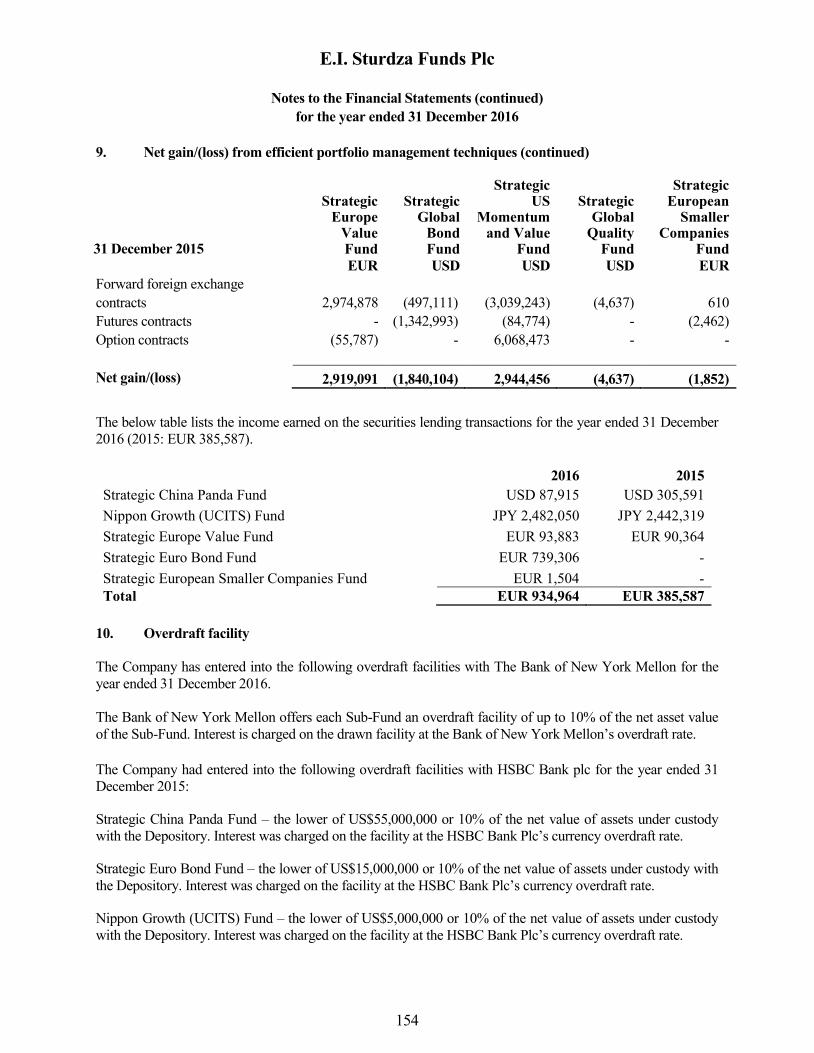
E.I. Sturdza Funds Plc
Notes to the Financial Statements (continued)
for the year ended 31 December 2016
154
9. Net gain/(loss) from efficient portfolio management techniques (continued)
31 December 2015
Strategic Europe
Value Fund
Strategic Global
Bond Fund
Strategic US
Momentum and Value
Fund
Strategic Global
Quality Fund
Strategic European
Smaller Companies
Fund
EUR USD USD USD EUR
Forward foreign exchange
contracts 2,974,878 (497,111) (3,039,243) (4,637) 610
Futures contracts - (1,342,993) (84,774) - (2,462)
Option contracts (55,787) - 6,068,473 - -
Net gain/(loss) 2,919,091 (1,840,104) 2,944,456 (4,637) (1,852)
The below table lists the income earned on the securities lending transactions for the year ended 31 December
2016 (2015: EUR 385,587).
2016 2015
Strategic China Panda Fund USD 87,915 USD 305,591
Nippon Growth (UCITS) Fund JPY 2,482,050 JPY 2,442,319
Strategic Europe Value Fund EUR 93,883 EUR 90,364
Strategic Euro Bond Fund EUR 739,306 -
Strategic European Smaller Companies Fund EUR 1,504 -
Total EUR 934,964 EUR 385,587
10. Overdraft facility
The Company has entered into the following overdraft facilities with The Bank of New York Mellon for the
year ended 31 December 2016.
The Bank of New York Mellon offers each Sub-Fund an overdraft facility of up to 10% of the net asset value
of the Sub-Fund. Interest is charged on the drawn facility at the Bank of New York Mellon’s overdraft rate.
The Company had entered into the following overdraft facilities with HSBC Bank plc for the year ended 31
December 2015:
Strategic China Panda Fund – the lower of US$55,000,000 or 10% of the net value of assets under custody
with the Depository. Interest was charged on the facility at the HSBC Bank Plc’s currency overdraft rate. Strategic Euro Bond Fund – the lower of US$15,000,000 or 10% of the net value of assets under custody with
the Depository. Interest was charged on the facility at the HSBC Bank Plc’s currency overdraft rate. Nippon Growth (UCITS) Fund – the lower of US$5,000,000 or 10% of the net value of assets under custody
with the Depository. Interest was charged on the facility at the HSBC Bank Plc’s currency overdraft rate.

E.I. Sturdza Funds Plc
Notes to the Financial Statements (continued)
for the year ended 31 December 2016
155
10. Overdraft facility (continued)
Strategic Emerging Europe Fund – the lower of US$12,000,000 or 10% of the net value of assets under
custody with the Depository. Interest was charged on the facility at the HSBC Bank Plc’s currency overdraft
rate.
Strategic Europe Value Fund – the lower of US$30,000,000 or 10% of the net value of assets under custody
with the Depository. Interest was charged on the facility at the HSBC Bank Plc’s currency overdraft rate.
Strategic Global Bond Fund – the lower of US$17,000,000 or 10% of the net value of assets under custody
with the Depository. Interest was charged on the facility at the HSBC Bank Plc’s currency overdraft rate. Strategic US Momentum and Value Fund – the lower of US$25,000,000 or 10% of the net value of assets
under custody with the Depository. Interest was charged on the facility at the HSBC Bank Plc’s currency
overdraft rate.
Strategic Global Quality Fund – the lower of US$10,000,000 or 10% of the net value of assets under custody
with the Depository. Interest was charged on the facility at the HSBC Bank Plc’s currency overdraft rate.
Strategic European Smaller Companies Fund – the lower of US$8,000,000 or 10% of the net value of assets
under custody with the Depository. Interest was charged on the facility at the HSBC Bank Plc’s currency
overdraft rate.
The assets and cash balances held by the Depository, HSBC Institutional Trust Services (Ireland) Limited,
were held as collateral for the above overdraft facilities.

E.I. Sturdza Funds Plc
Notes to the Financial Statements (continued)
for the year ended 31 December 2016
156
11. Related Parties and Connected Parties
(i) Related Parties
The below table provides an analysis of related party transactions for the year ended 31 December 2016:
Name
Relationship Transaction type Fees paid
E.I. Sturdza Strategic
Management Limited
Investment Manager, Promoter &
Common Directors
Investment management
services
See note 5
Banque Eric Sturdza
SA
Investment Adviser/Shareholder Investment adviser services See note 5
Dillon Eustace
Common Director/Partner Legal and tax advice See note 5
L. Georges Gutmans, Gavin Farrell, Directors of the Company, are also Directors of the Investment Manager
and other investment funds managed by the Investment Manager. Brian Dillon is a Director of the Company
and also a partner of Dillon Eustace, the Irish Legal and Irish Tax Adviser of the Company. Denise Kinsella is
a Director of Pâris Bertrand Sturdza Investments Plc, which is managed by Banque Pâris Bertrand Sturdza SA.
Banque Pâris Bertrand Sturdza SA is a corporate affiliate of the Investment Manager. Johannes Yntema who is
a Director of Banque Eric Sturdza SA (effective 15 February 2016), Investment Adviser to the Strategic Euro
Bond Fund, Strategic Global Bond Fund and Strategic US Momentum and Value Fund has resigned from the
Board of the Company with effect from 1 January 2017.

E.I. Sturdza Funds Plc
Notes to the Financial Statements (continued)
for the year ended 31 December 2016
157
11. Related Parties and Connected Parties (continued)
Related party shareholding
The below table provides an analysis of the number of shares held in the Company by related parties as at 31
December 2016.
Name Relationship Share Class No of Shares
2016 2015
Strategic China Panda Fund
Banque Eric Sturdza
SA*
Investment Adviser to
other Sub-Funds USD Class
6,584.16 10,209.18
Hedged Euro Class 2,711.03 5,185.86
Hedged Sterling Class 3.76 39.22
Euro Hedged Institutional
Class 1,181.08 480.90
Banque Pâris Bertrand
Sturdza SA
A corporate affiliate
of the Investment
Manager and Banque
Eric Sturdza SA*
USD Class 144.85 43.94
Hedged Euro Class 1,408.48 1408.48
L.Georges Gutmans Director Hedged Euro Class 20.62 20.62
Strategic Euro Bond Fund
Banque Eric Sturdza
SA*
Investment Adviser Euro Distributing Class
2,529.91 8,980.46
Euro Accumulating Class 24,005.76 37,429.19
Euro Institutional Class 3,733.92 8,006.22
CHF Accumulating Class 13,338.59 22,498.58
CHF Institutional Class Nil 400.00
Nippon Growth (UCITS) Fund
Banque Eric Sturdza
SA*
Investment Adviser JPY Class A
883.61 3,247.12
JPY Class B 15,856.80 69,138.01
Hedged Euro Class 731.30 14,782.22
JPY Class D Institutional Nil 11,203.64
Hedged Euro Institutional
Class 482.54 Nil

E.I. Sturdza Funds Plc
Notes to the Financial Statements (continued)
for the year ended 31 December 2016
158
11. Related Parties and Connected Parties (continued)
Related party shareholding (continued)
The below table provides an analysis of the number of shares held in the Company by related parties as at 31
December 2016 (continued).
Name Relationship Share Class No of Shares
2016 2015
Strategic Europe Value Fund Banque Eric Sturdza SA* Investment Adviser
to other Sub-Funds
Euro Class 479,263.10 665,321.17
EUR Institutional Class 195,211.90 248,898.93
CHF Class 241,738.72 349,303.33
Euro Institutional Distributing Class 47,919.88 44,660.78
Euro Retail Class 98.50 98.50
Banque Paris Bertrand
Sturdza
A corporate affiliate
of the Investment
Manager and Banque
Eric Sturdza SA
Euro Institutional Class 2,244.00 Nil
L.Georges Gutmans Director CHF Class 1,071.08 840.00
The Guardian Angel
Trust
A trust for
beneficiaries related
to L. Georges
Gutmans (Director of
the Company)
CHF Class 299.78 299.78
Jan Willem Goudriaan Family member of
Willem Vinke (PM to
Investment Adviser
of Strategic Europe
Value Fund)
Euro Class 190.00 190.00
Azure Trust Company
Limited
Trust company of
Willem Vinke (PM
of Investment
Adviser of Strategic
Europe Value Fund,
beneficiary of this
trust)
Euro Institutional Class 1,756.71 1,756.71
DB Retirement
Investment Scheme
Pension plan of
Rosemary Diana
Rachel Bichard (wife
of PM of Investment
Advisor of Strategic
Europe Value Fund)
Euro Class 296.91 296.91

E.I. Sturdza Funds Plc
Notes to the Financial Statements (continued)
for the year ended 31 December 2016
159
11. Related Parties and Connected Parties (continued)
Related party shareholding (continued)
The below table provides an analysis of the number of shares held in the Company by related parties as at 31
December 2016 (continued).
Name Relationship Share Class No of Shares
2016 2015
Strategic Global Bond Fund
Banque Eric Sturdza SA*
Investment Adviser
USD Class 46,996.60 64,906.03
RMB Class 521.74 598.75
Banque Pâris Bertrand
Sturdza SA
A corporate affiliate of
the Investment
Manager and Banque
Eric Sturdza SA*
RMB Class 251.50 440.32
Strategic US Momentum and Value Fund
Banque Eric Sturdza SA* Investment Adviser USD Class 158,820.50 247,610.88
Hedged Euro Class 3,757.00 15,129.49
Hedged CHF Class 13,888.81 25,242.28
USD Institutional Class 67,131.45 67,831.45
Strategic Global Quality Fund Banque Eric Sturdza
SA*
Investment Adviser to
other Sub-Funds
USD Class 150,882.00 Nil
CHF Class 63,033.38 Nil
USD Institutional Class 239,967.50 76,504.62
E.I. Sturdza Strategic
Management Limited
Investment Manager USD Institutional Class 10,000.00 10,000.00
Willem Vinke PM to Investment
Adviser of Strategic
Global Quality Fund
USD Institutional Class 2,500.00 5,000.00
WPV Family Investment
Trust A trust for
beneficiaries related to
Willem Vinke (PM to
Investment Adviser of
Strategic Global
Quality Fund)
USD Institutional Class 5,000.00 5,000.00
L.Georges Gutmans Director USD Institutional Class 2,500.00 2,500.00
The Guardian Angel
Trust
A trust for
beneficiaries related to
L. Georges Gutmans
(Director of the
Company)
USD Institutional Class 1,000.00 1,000.00
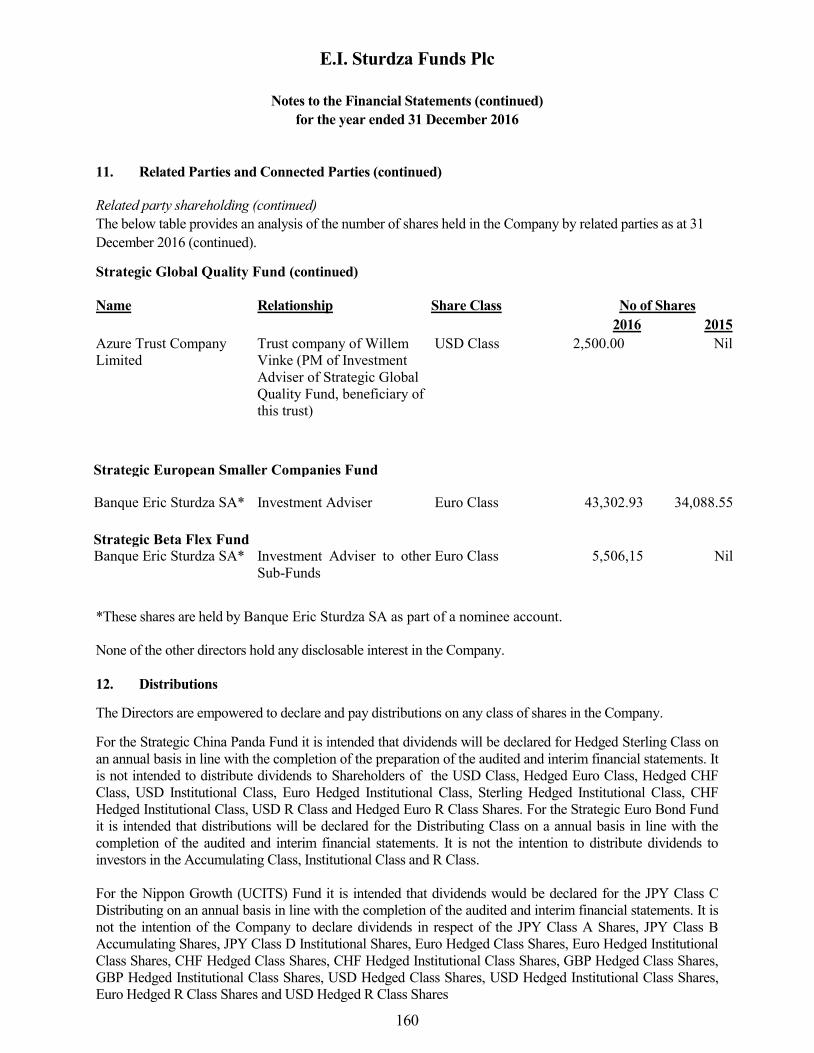
E.I. Sturdza Funds Plc
Notes to the Financial Statements (continued)
for the year ended 31 December 2016
160
11. Related Parties and Connected Parties (continued)
Related party shareholding (continued)
The below table provides an analysis of the number of shares held in the Company by related parties as at 31
December 2016 (continued).
Strategic Global Quality Fund (continued)
Name Relationship Share Class No of Shares 2016 2015
Azure Trust Company
Limited
Trust company of Willem
Vinke (PM of Investment
Adviser of Strategic Global
Quality Fund, beneficiary of
this trust)
USD Class 2,500.00 Nil
Strategic European Smaller Companies Fund
Banque Eric Sturdza SA* Investment Adviser Euro Class 43,302.93 34,088.55
Strategic Beta Flex Fund
Banque Eric Sturdza SA* Investment Adviser to other
Sub-Funds
Euro Class 5,506,15 Nil
*These shares are held by Banque Eric Sturdza SA as part of a nominee account.
None of the other directors hold any disclosable interest in the Company.
12. Distributions
The Directors are empowered to declare and pay distributions on any class of shares in the Company.
For the Strategic China Panda Fund it is intended that dividends will be declared for Hedged Sterling Class on
an annual basis in line with the completion of the preparation of the audited and interim financial statements. It
is not intended to distribute dividends to Shareholders of the USD Class, Hedged Euro Class, Hedged CHF
Class, USD Institutional Class, Euro Hedged Institutional Class, Sterling Hedged Institutional Class, CHF
Hedged Institutional Class, USD R Class and Hedged Euro R Class Shares. For the Strategic Euro Bond Fund
it is intended that distributions will be declared for the Distributing Class on a annual basis in line with the
completion of the audited and interim financial statements. It is not the intention to distribute dividends to
investors in the Accumulating Class, Institutional Class and R Class.
For the Nippon Growth (UCITS) Fund it is intended that dividends would be declared for the JPY Class C
Distributing on an annual basis in line with the completion of the audited and interim financial statements. It is
not the intention of the Company to declare dividends in respect of the JPY Class A Shares, JPY Class B
Accumulating Shares, JPY Class D Institutional Shares, Euro Hedged Class Shares, Euro Hedged Institutional
Class Shares, CHF Hedged Class Shares, CHF Hedged Institutional Class Shares, GBP Hedged Class Shares,
GBP Hedged Institutional Class Shares, USD Hedged Class Shares, USD Hedged Institutional Class Shares,
Euro Hedged R Class Shares and USD Hedged R Class Shares

E.I. Sturdza Funds Plc
Notes to the Financial Statements (continued)
for the year ended 31 December 2016
161
12. Distributions (continued)
For Strategic Quality Emerging Bond Fund it is intended that dividends would be declared for the USD
Distributing Class, EUR Distributing Class, CHF Distributing Class and GBP Distributing Class on a semi-
annual basis in line with the completion of the audited and interim financial statements.
For the Strategic Europe Value Fund it is intended that dividends would be declared for the Euro Institutional
Distributing Class on a semi-annual and an annual basis in line with the completion of the audited and interim
financial statements. It is not the intention to distribute dividends to investors in the the Euro Class, CHF Class,
GBP Class, USD Class, Euro Institutional Class, CHF Institutional Class, GBP Institutional Class, USD
Institutional Class, Euro R Class, USD R Class Shares, Euro Super Institutional Class Shares, CHF Super
Institutional Class Shares, GBP Super Institutional Class Shares, USD Super Institutional Class Shares.
For the Strategic Global Bond Fund, Strategic US Momentum and Value Fund, Strategic Global Quality Fund
and Strategic European Smaller Companies Fund, Strategic Beta Flex Fund it is not the current intention of the
Directors that dividends be recommended for payment to Shareholders in the Funds.
The dividends declared and paid during the year ended 31 December 2016 were as follows.
Fund Share Class Date Dividend per share
EUR
Gross amount
EUR Strategic Euro Bond Fund Euro Distributing Class 26 September
2016 12.98 78,206
Strategic Europe Value
Fund
Euro Institutional
Distributing Class
27 September
2016 0.50 361,367
The dividends declared and paid during year ended 31 December 2015 were as follows.
Fund Share Class Date Dividend per share
EUR
Gross amount
EUR
Strategic Euro Bond Fund Euro Distributing Class 18 May 2015 13.59 187,531
13. Comparative figures
The comparative figures for the Statement of Financial Position are as at 31 December 2015. The comparative
figures for the Statement of Comprehensive Income, Statement of Changes in Net Assets Attributable to
Holders of Redeemable Shares and Statement of Cash Flows are for the year ended 31 December 2015.
14. Auditors’ Remuneration
Fees and expenses paid to statutory auditors, KPMG Ireland, in respect of the financial year are as follows:
2016 2015
EUR EUR
Audit of financial statements *80,344 79,500
Tax advisory services 36,350 25,583
116,694 105,083
The fees in the above table are calculated exclusive of VAT.
*Total VAT on these fees totals €18,443.

E.I. Sturdza Funds Plc
Notes to the Financial Statements (continued)
for the year ended 31 December 2016
162
15. Taxation
Under current law and practice the Company qualifies as an investment undertaking as defined in Section
739B of the Taxes Consolidation Act, 1997, as amended. As such, it is not chargeable to Irish tax on its
income or gains.
However, Irish tax may arise on the happening of a “chargeable event”. A chargeable event includes any
distribution payments to shareholders or any encashment, redemption, cancellation or transfer of shares.
No Irish tax will arise on the Company in respect of chargeable events in respect of:
(a) a shareholder who is neither an Irish resident nor ordinarily resident in Ireland for tax purposes, at the time
of the chargeable event, provided appropriate valid declarations in accordance with the provisions of the Taxes
Consolidation Act, 1997, as amended, are held by the Company; and
(b) certain exempted Irish tax resident shareholders who have provided the Company with the necessary
signed statutory declarations and the Company is not in possession of any information which would
reasonably suggest that the information contain therein is no longer materially correct.
16. Significant matters arising during the year
The JPY Class A of the Nippon Growth (UCITS) Fund, which had previously been closed to
subscriptions, was reopened on 1 January 2016 for new investment, and the performance fee of the class
was reduced to 12.5 per cent effective from 1 January 2016.
In relation to the Strategic China Panda Fund securities that were suspended during 2015, Sound Global
Limited stock was sold on 22 January 2016. Sihuan Pharmaceuticals resumed trading on 29 February
2016 and was sold in April 2016.
The CHF Institutional Class of Strategic Euro Bond Fund was delisted on 20 January 2016 as a result of
the share class being fully redeemed.
On 15 February 2016 Banque Baring Brothers Sturdza S.A. changed its legal and company name to
Banque Eric Sturdza S.A.
From 18 March 2016, UCITS V depository liability provisions became effective.
Two new Sub-Funds were launched. Strategic Quality Emerging Bond Fund was approved by the Central
Bank of Ireland on 14 April 2016 and Strategic Beta Flex Fund was approved by the Central Bank of
Ireland on 12 December 2016.
On 1 July 2016, the performance fees payable to the Investment Manager across the Sub-Funds were
reduced as follows:
For Strategic China Panda Fund the performance fee reduced from 20 per cent to 10 per cent of
the relative outperformance for the USD Institutional Class, Hedged Euro Institutional Class,
Hedged Sterling Institutional Class and Hedged CHF Institutional Class and from 20 per cent to
15 per cent for USD Class, Hedged Euro Class, Hedged Sterling Class and Hedged CHF Class.

E.I. Sturdza Funds Plc
Notes to the Financial Statements (continued)
for the year ended 31 December 2016
163
16. Significant matters arising during the year (continued)
For Nippon Growth (UCITS) Fund, the performance fee reduced from 20 per cent to 10 per cent
of the relative outperformance for the JPY Class D Institutional, Euro Hedged Institutional Class,
CHF Hedged Institutional Class, GBP Hedged Institutional Class and USD Hedged Institutional
Class and from 20 per cent to 15 per cent for JPY Class B Accumulating, JPY Class C
Distributing, Euro Hedged Class, CHF Hedged Class, GBP Hedged Class, USD Hedged Class,
Euro Hedged R Class and USD Hedged R Class.
For Strategic Europe Value Fund, the performance fee reduced from 20 per cent to 15 per cent of
the relative outperformance for the Euro Class, GBP Class, CHF Class, USD Class, EUR R Class
and USD R Class.
For Strategic US Momentum and Value Fund, the performance fee reduced from 15 per cent to
10 per cent of the relative outperformance for the USD Institutional Class, EUR Hedged
Institutional Class, GBP Hedged Institutional Class and CHF Hedged Institutional Class Shares.
In the Strategic European Smaller Companies Fund, the performance fee reduced from 20 per
cent to 15 per cent of the relative outperformance for the Euro Class, Euro X Class, USD Class,
CHF Class Shares.
On 10 August 2016 revised Fund Supplements were issued for the Nippon Growth (UCITS) Fund, the
Strategic China Panda Fund, the Strategic European Smaller Companies Fund, the Strategic Europe Value
Fund and the Strategic US Momentum and Value Fund primarily to include the following:
change to the calculation methodology of the performance fee to permit crystallization upon
redemption.
Standardisation of subscription and redemption settlement dates,
Removal of minimum follow on subscription and redemption criteria.
Establishment of new share classes.
On 5 September 2016 the Memorandum and Articles of Association were updated to comply with recent
and impending legal and regulatory requirements.
On 12 September 2016 a performance fee of 10 per cent of the relative outperformance for the Euro
Class, GBP Class, USD Class, CHF Class, Euro Institutional Class, GBP Institutional Class, USD
Institutional Class and CHF Institutional Classes of the Strategic Global Quality Fund was introduced.
Following the closure of Strategic Emerging Europe Fund in 2015, the “Withdrawal of Approval” request
was submitted to the Central Bank of Ireland, and revocation was completed on 23 September 2016.
On 4 November 2016 the Administrator was changed from HSBC Securities Services (Ireland) Limited,
to SS&C Financial Services (Ireland) Limited (formerly, GlobeOp Financial Services (Ireland) Limited).
In conjunction with this change, the Depository was changed from HSBC Institutional Services (Ireland)
Limited to BNY Mellon Trust Company (Ireland) Limited.

E.I. Sturdza Funds Plc
Notes to the Financial Statements (continued)
for the year ended 31 December 2016
164
16. Significant matters arising during the year (continued)
On 7 November 2016 a full consolidation of the Prospectus was undertaken to consolidate all changes which
occurred throughout the year. In addition:
The Strategic Europe Value Fund and the Strategic Global Quality Fund investment policies were
updated to permit a maximum of 10% investment in long dated bonds in the event of a downturn
in the market;
Reduction to the performance fee charged on the Strategic Europe Value Fund. All share classes
with the exception of the super institutional classes now charge a 10% performance fee.
During the year, the following share classes were launched and listed on the Irish Stock Exchange:
Share Class
Launch Date
Date listed on
Irish
Stock Exchange
Strategic Global Quality Fund - USD Class 16 February 2016 17 February 2016
Strategic Global Quality Fund - CHF Class 7 June 2016 9 June 2016
Strategic Quality Emerging Bond Fund - USD Class 28 April 2016 Not listed
Strategic Quality Emerging Bond Fund - Euro Institutional Class 28 April 2016 Not listed
Strategic Quality Emerging Bond Fund - CHF Class 28 April 2016 Not listed
Strategic Quality Emerging Bond Fund - Euro Class 28 April 2016 Not listed
Strategic Quality Emerging Bond Fund- USD Institutional Class 22 September 2016 Not listed
Strategic Europe Value Fund - USD Class 11 March 2016 15 March 2016
Strategic Europe Value Fund - EUR Super Institutional Class 24 August 2016 29 September 2016
Strategic Europe Value Fund - USD Super Institutional Class 25 August 2016 29 September 2016
Strategic European Smaller Companies – Euro X Class 7 October 2016 20 October 2016
Strategic Beta Flex Fund- Euro Class 23 December 2016 Not listed
Johannes Yntema resigned as a Director of the Company effective 31 December 2016.
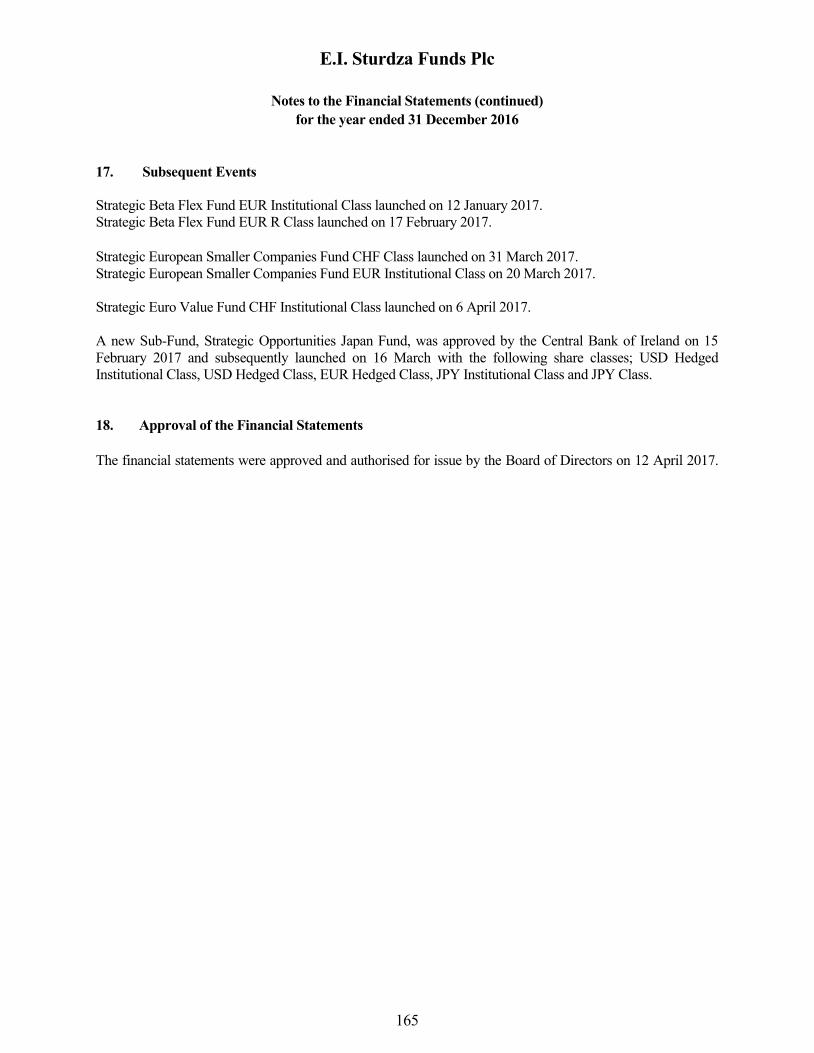
E.I. Sturdza Funds Plc
Notes to the Financial Statements (continued)
for the year ended 31 December 2016
165
17. Subsequent Events
Strategic Beta Flex Fund EUR Institutional Class launched on 12 January 2017.
Strategic Beta Flex Fund EUR R Class launched on 17 February 2017.
Strategic European Smaller Companies Fund CHF Class launched on 31 March 2017.
Strategic European Smaller Companies Fund EUR Institutional Class on 20 March 2017.
Strategic Euro Value Fund CHF Institutional Class launched on 6 April 2017.
A new Sub-Fund, Strategic Opportunities Japan Fund, was approved by the Central Bank of Ireland on 15
February 2017 and subsequently launched on 16 March with the following share classes; USD Hedged
Institutional Class, USD Hedged Class, EUR Hedged Class, JPY Institutional Class and JPY Class.
18. Approval of the Financial Statements
The financial statements were approved and authorised for issue by the Board of Directors on 12 April 2017.

E.I. Sturdza Funds Plc
Notes to the Financial Statements (continued)
for the year ended 31 December 2016
165
Strategic China Panda Fund
Fair Value % of
Holding Financial Assets at Fair Value through Profit or Loss USD Net Assets
Transferable Securities
Transferable securities admitted to official stock exchange listing or dealt in on another regulated market
Equity Securities
Bermuda
3,386,000 Global Brands Group Holding Ltd 449,827 0.49
2,422,800 Man Wah Holdings Ltd 1,640,585 1.78
2,769,000 Nine Dragons Paper Holdings Ltd 2,510,730 2.73
4,601,142 5.00
Cayman Islands
565,000 AAC Technologies Holdings Inc 5,133,946 5.57
75,200 Alibaba Group Holding Ltd 6,603,312 7.17
168,000 Asm Pacific Technology Ltd 1,780,076 1.93
542,000 China Medical System Holdings Ltd 858,459 0.93
646,000 China State Construction International Holdings Ltd 966,523 1.05
2,008,200 Chow Tai Fook Jewellery Group Ltd 1,535,973 1.67
66,500 CK Hutchison Holdings Ltd 753,932 0.82
6,166,475 Far East Consortium International Ltd/Hk 2,632,612 2.86
4,408,000 Goodbaby International Holdings Ltd 2,109,295 2.29
4,767,000 International Housewares Retail Co Ltd 996,052 1.08
970,000 Jnby Design Ltd 920,813 1.00
3,229,000 Lee & Man Paper Manufacturing Ltd 2,507,185 2.72
2,811,400 Luen Thai Holdings Ltd 1,185,747 1.29
1,354,000 Minth Group Ltd 4,217,524 4.58
92,300 New Oriental Education & Technology Group Inc 3,885,830 4.22
4,495,500 Nexteer Automotive Group Ltd 5,334,425 5.79
771,000 Pacific Textiles Holdings Ltd 837,314 0.91
6,968,000 SITC International Holdings Co Ltd 4,242,013 4.60
578,000 Sunny Optical Technology Group Co Ltd 2,530,984 2.75
20,201 Tal Education Group 1,417,100 1.54
377,500 Tencent Holdings Ltd 9,236,472 10.03
3,013,100 Texhong Textile Group Ltd 4,080,606 4.43
4,400,000 Tongda Group Holdings Ltd 1,135,023 1.23
2,192,000 Uni-President China Holdings Ltd 1,546,500 1.68
66,447,716 72.14
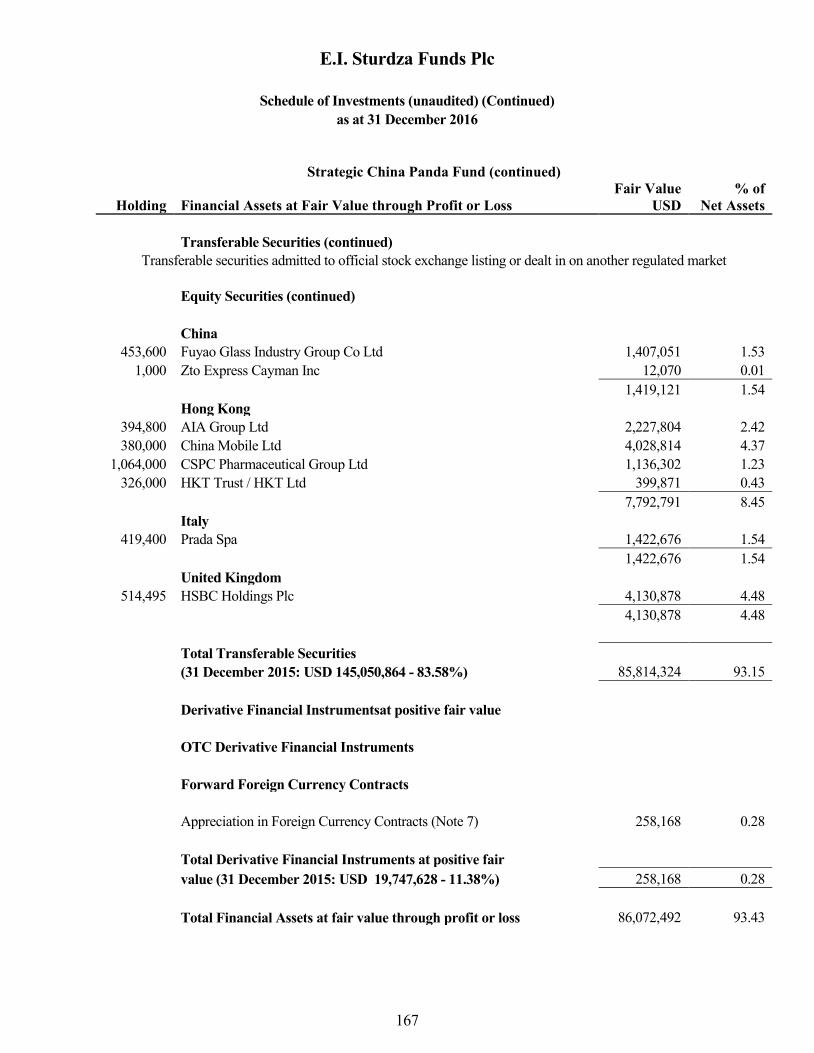
E.I. Sturdza Funds Plc
Schedule of Investments (unaudited) (Continued)
as at 31 December 2016
167
Strategic China Panda Fund (continued)
Fair Value % of
Holding Financial Assets at Fair Value through Profit or Loss USD Net Assets
Transferable Securities (continued)
Transferable securities admitted to official stock exchange listing or dealt in on another regulated market
Equity Securities (continued)
China
453,600 Fuyao Glass Industry Group Co Ltd 1,407,051 1.53
1,000 Zto Express Cayman Inc 12,070 0.01
1,419,121 1.54
Hong Kong
394,800 AIA Group Ltd 2,227,804 2.42
380,000 China Mobile Ltd 4,028,814 4.37
1,064,000 CSPC Pharmaceutical Group Ltd 1,136,302 1.23
326,000 HKT Trust / HKT Ltd 399,871 0.43
7,792,791 8.45
Italy
419,400 Prada Spa 1,422,676 1.54
1,422,676 1.54
United Kingdom
514,495 HSBC Holdings Plc 4,130,878 4.48
4,130,878 4.48
Total Transferable Securities
(31 December 2015: USD 145,050,864 - 83.58%) 85,814,324 93.15
Derivative Financial Instrumentsat positive fair value
OTC Derivative Financial Instruments
Forward Foreign Currency Contracts
Appreciation in Foreign Currency Contracts (Note 7) 258,168 0.28
Total Derivative Financial Instruments at positive fair
value (31 December 2015: USD 19,747,628 - 11.38%) 258,168 0.28
Total Financial Assets at fair value through profit or loss 86,072,492 93.43

E.I. Sturdza Funds Plc
Schedule of Investments (unaudited) (Continued)
as at 31 December 2016
168
Strategic China Panda Fund (continued)
Fair Value % of
Holding Financial Liabilities at Fair Value through Profit or Loss USD Net Assets
Derivative Financial Instruments at negative fair value
OTC Derivative Financial Instruments
Forward Foreign Currency Contracts
Depreciation in Foreign Currency Contracts (Note 7) (1,229) 0.00
Total Derivative Financial Instruments at negative fair (1,229) 0.00
value (31 December 2015: USD (170,494) (0.10)%)
Total Financial Liabilities at fair value (1,229) 0.00
through profit or loss
Total Financial Assets and Liabilities at fair value through profit or
loss 86,071,263 93.43
Cash and cash equivalents* 6,066,569 6.58
Other Assets and Liabilities (8,819) (0.01)
Total Net Assets Attributable to Holders
of Redeemable Participating Shares 92,129,013 100.00
Analysis of Total Assets
Transferable securities 85,814,324 92.37
OTC Derivative Financial Instruments 258,168 0.28
Cash and cash equivalents 6,066,569 6.53
Other Assets (inclusive of derivative collateral of USD Nil) 760,464 0.82
Total Assets 92,899,525 100.00
* Cash and cash equivalents are held with The Bank of New York
Mellon (AA-).

E.I. Sturdza Funds Plc
Schedule of Investments (unaudited) (continued)
as at 31 December 2016
169
Strategic Euro Bond Fund
Fair Value % of
Holding Financial Assets at Fair Value through Profit or Loss EUR Net Assets
Transferable Securities
Transferable securities admitted to official stock exchange listing or dealt in on another regulated market
Debt Securities
Australia
1,000,000 Telstra Corp Ltd 3.5% 21/09/2022 1,175,148 1.78
1,175,148 1.78
Austria
1,000,000 Autobahnen- Und Schnellstrassen-Finanzierungs-AG 1.75%21/10/2020 1,073,760 1.63
2,000,000 OEBB Infrastruktur Ag , 3.50% , 10/19/2020 2,281,517 3.46
1,500,000 Telekom FinanzmanAGement Gmbh 3.13% 03/12/2021 1,701,360 2.58
5,056,637 7.67
Belgium
2,000,000 Anheuser-Busch Inbev SA/NV 0.06% 29/03/2018 2,005,642 3.04
2,005,642 3.04
Finland
1,000,000 Tyottomyysvakuutusrahasto 0.38% 23/09/2019 1,017,632 1.54
1,017,632 1.54
France
500,000 Essilor International SA 1.75% 09/04/2021 533,197 0.81
2,500,000 RCI Banque SA 2.25% 29/03/2021 2,682,895 4.07
2,500,000 Schlumberger Finance France SAs 0.63% 12/02/2019 2,537,737 3.85
2,500,000 Total Capital International SA 0% 19/03/2020 2,505,131 3.80
8,258,960 12.53
Germany
2,500,000 Daimler AG 2.63% 02/04/2019 2,652,570 4.03
1,000,000 Linde AG 1.75% 17/09/2020 1,066,530 1.62
3,719,100 5.65
Italy
1,000,000 Eni SPA 4.25% 03/02/2020 1,125,649 1.71
500,000 SNAM SPA 5% 18/01/2019 550,484 0.84
500,000 Terna Rete Elettrica Nazionale SPA 2.88% 16/02/2018 516,227 0.78
2,192,360 3.33
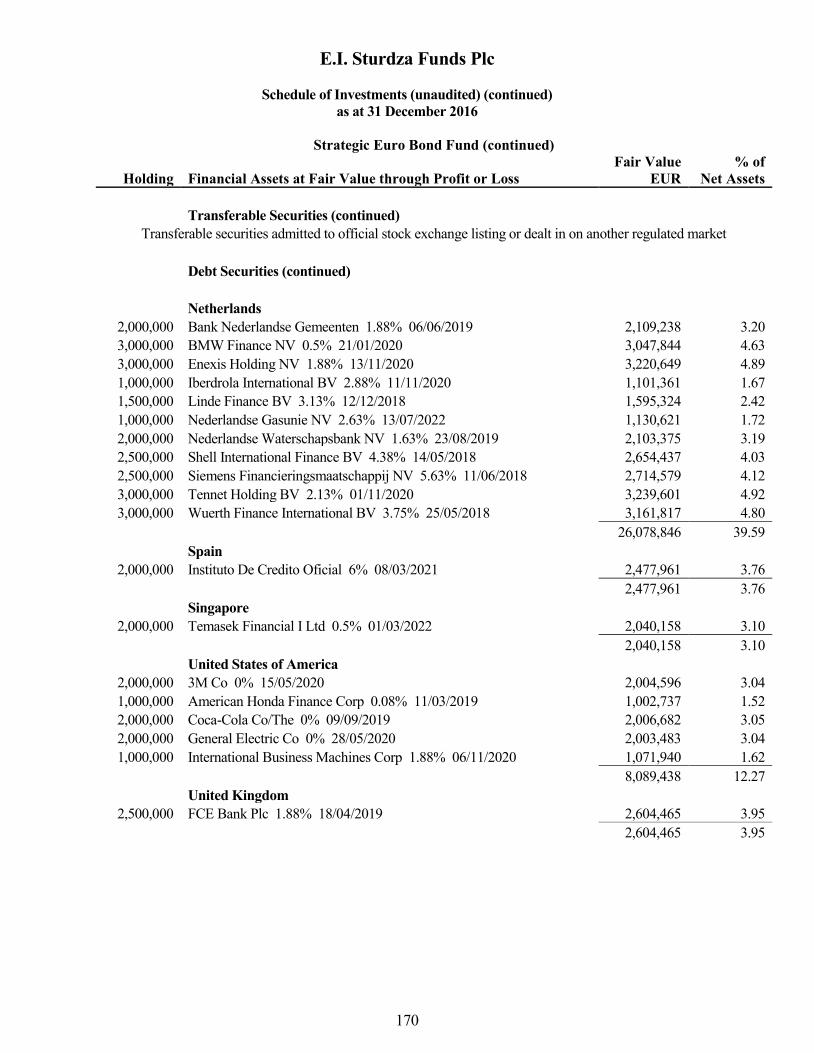
E.I. Sturdza Funds Plc
Schedule of Investments (unaudited) (continued)
as at 31 December 2016
170
Strategic Euro Bond Fund (continued)
Fair Value % of
Holding Financial Assets at Fair Value through Profit or Loss EUR Net Assets
Transferable Securities (continued)
Transferable securities admitted to official stock exchange listing or dealt in on another regulated market
Debt Securities (continued)
Netherlands
2,000,000 Bank Nederlandse Gemeenten 1.88% 06/06/2019 2,109,238 3.20
3,000,000 BMW Finance NV 0.5% 21/01/2020 3,047,844 4.63
3,000,000 Enexis Holding NV 1.88% 13/11/2020 3,220,649 4.89
1,000,000 Iberdrola International BV 2.88% 11/11/2020 1,101,361 1.67
1,500,000 Linde Finance BV 3.13% 12/12/2018 1,595,324 2.42
1,000,000 Nederlandse Gasunie NV 2.63% 13/07/2022 1,130,621 1.72
2,000,000 Nederlandse Waterschapsbank NV 1.63% 23/08/2019 2,103,375 3.19
2,500,000 Shell International Finance BV 4.38% 14/05/2018 2,654,437 4.03
2,500,000 Siemens Financieringsmaatschappij NV 5.63% 11/06/2018 2,714,579 4.12
3,000,000 Tennet Holding BV 2.13% 01/11/2020 3,239,601 4.92
3,000,000 Wuerth Finance International BV 3.75% 25/05/2018 3,161,817 4.80
26,078,846 39.59
Spain
2,000,000 Instituto De Credito Oficial 6% 08/03/2021 2,477,961 3.76
2,477,961 3.76
Singapore
2,000,000 Temasek Financial I Ltd 0.5% 01/03/2022 2,040,158 3.10
2,040,158 3.10
United States of America
2,000,000 3M Co 0% 15/05/2020 2,004,596 3.04
1,000,000 American Honda Finance Corp 0.08% 11/03/2019 1,002,737 1.52
2,000,000 Coca-Cola Co/The 0% 09/09/2019 2,006,682 3.05
2,000,000 General Electric Co 0% 28/05/2020 2,003,483 3.04
1,000,000 International Business Machines Corp 1.88% 06/11/2020 1,071,940 1.62
8,089,438 12.27
United Kingdom
2,500,000 FCE Bank Plc 1.88% 18/04/2019 2,604,465 3.95
2,604,465 3.95

E.I. Sturdza Funds Plc
Schedule of Investments (unaudited) (continued)
as at 31 December 2016
171
Strategic Euro Bond Fund (continued)
Fair Value % of
Holding Financial Liabilities at Fair Value through Profit or Loss EUR Net Assets
Transferable Securities (continued)
Transferable securities admitted to official stock exchange listing or dealt in on another regulated market
Debt Securities (continued)
Total Transferable Securities
(31 December 2015: EUR 122,213,555 – 96.61%) 64,716,347 98.21
Total Financial Assets at fair value through profit or loss 64,716,347 98.21
Derivative Financial Instruments at negative fair value
OTC Derivative Financial Instruments
Forward Foreign Currency Contracts
Depreciation in Foreign Currency Contracts (Note-7) (14,164) (0.02)
(14,164) (0.02)
Total Derivative Financial Instruments at negative fair value (31
December 2015: EUR (178,089) – (0.14)%) (14,164) (0.02)
Total Financial Liabilities at fair value at fair value
through profit or loss (14,164) (0.02)
Total Financial Assets and Liabilities at fair value
through profit or loss
Cash and cash equivalents* 2,094,934 3.18
Other Assets and Liabilities (899,543) (1.37)
Total Net Assets Attributable to Holders of Redeemable
Participating Shares 65,897,574 100.00
Analysis of Total Assets
Transferable securities 64,716,347 95.82
OTC derivative financial instruments - 0.00

E.I. Sturdza Funds Plc
Schedule of Investments (unaudited) (continued)
as at 31 December 2016
172
Strategic Euro Bond Fund (continued)
Fair Value % of
Holding Financial Liabilities at Fair Value through Profit or Loss EUR Net Assets
Analysis of Total Assets (continued)
Cash and cash equivalents 2,094,934 3.10
Other assets (inclusive of derivative collateral of EUR NIL) 731,137 1.08
Total Assets 67,542,418 100.00
*Cash and cash equivalents are held with The Bank of New York
Mellon (AA-).
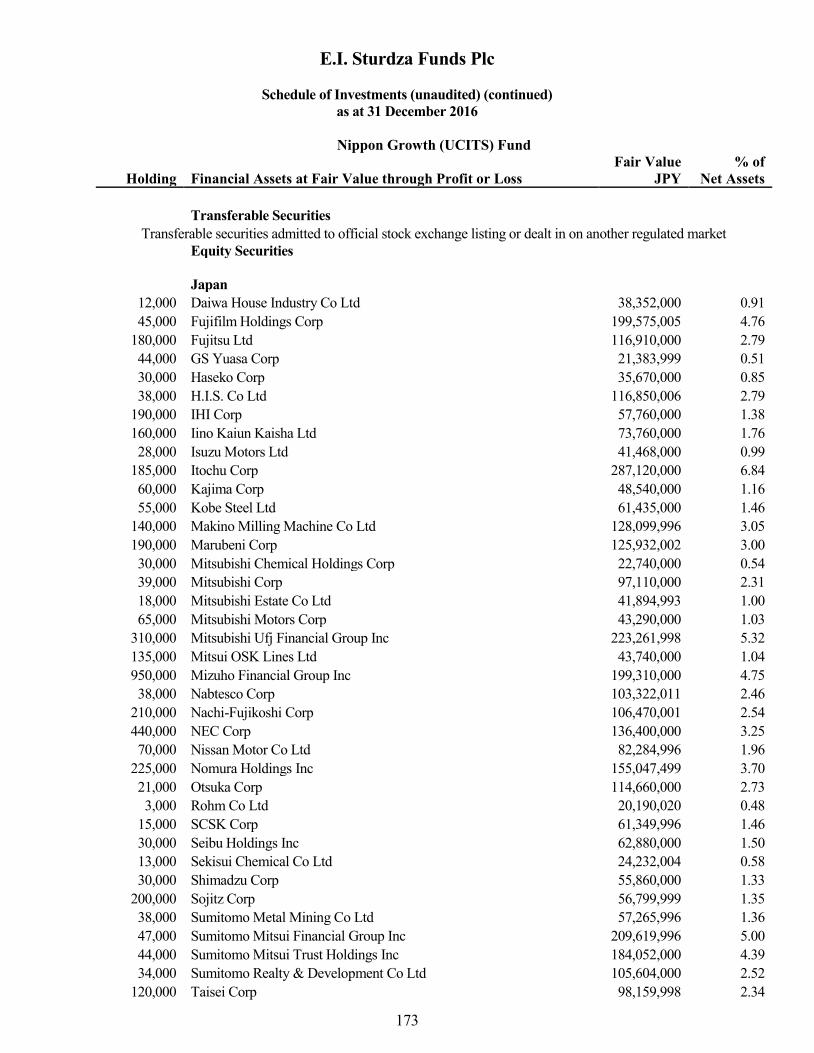
E.I. Sturdza Funds Plc
Schedule of Investments (unaudited) (continued)
as at 31 December 2016
173
Nippon Growth (UCITS) Fund
Fair Value % of
Holding Financial Assets at Fair Value through Profit or Loss JPY Net Assets
Transferable Securities
Transferable securities admitted to official stock exchange listing or dealt in on another regulated market
Equity Securities
Japan
12,000 Daiwa House Industry Co Ltd 38,352,000 0.91
45,000 Fujifilm Holdings Corp 199,575,005 4.76
180,000 Fujitsu Ltd 116,910,000 2.79
44,000 GS Yuasa Corp 21,383,999 0.51
30,000 Haseko Corp 35,670,000 0.85
38,000 H.I.S. Co Ltd 116,850,006 2.79
190,000 IHI Corp 57,760,000 1.38
160,000 Iino Kaiun Kaisha Ltd 73,760,000 1.76
28,000 Isuzu Motors Ltd 41,468,000 0.99
185,000 Itochu Corp 287,120,000 6.84
60,000 Kajima Corp 48,540,000 1.16
55,000 Kobe Steel Ltd 61,435,000 1.46
140,000 Makino Milling Machine Co Ltd 128,099,996 3.05
190,000 Marubeni Corp 125,932,002 3.00
30,000 Mitsubishi Chemical Holdings Corp 22,740,000 0.54
39,000 Mitsubishi Corp 97,110,000 2.31
18,000 Mitsubishi Estate Co Ltd 41,894,993 1.00
65,000 Mitsubishi Motors Corp 43,290,000 1.03
310,000 Mitsubishi Ufj Financial Group Inc 223,261,998 5.32
135,000 Mitsui OSK Lines Ltd 43,740,000 1.04
950,000 Mizuho Financial Group Inc 199,310,000 4.75
38,000 Nabtesco Corp 103,322,011 2.46
210,000 Nachi-Fujikoshi Corp 106,470,001 2.54
440,000 NEC Corp 136,400,000 3.25
70,000 Nissan Motor Co Ltd 82,284,996 1.96
225,000 Nomura Holdings Inc 155,047,499 3.70
21,000 Otsuka Corp 114,660,000 2.73
3,000 Rohm Co Ltd 20,190,020 0.48
15,000 SCSK Corp 61,349,996 1.46
30,000 Seibu Holdings Inc 62,880,000 1.50
13,000 Sekisui Chemical Co Ltd 24,232,004 0.58
30,000 Shimadzu Corp 55,860,000 1.33
200,000 Sojitz Corp 56,799,999 1.35
38,000 Sumitomo Metal Mining Co Ltd 57,265,996 1.36
47,000 Sumitomo Mitsui Financial Group Inc 209,619,996 5.00
44,000 Sumitomo Mitsui Trust Holdings Inc 184,052,000 4.39
34,000 Sumitomo Realty & Development Co Ltd 105,604,000 2.52
120,000 Taisei Corp 98,159,998 2.34
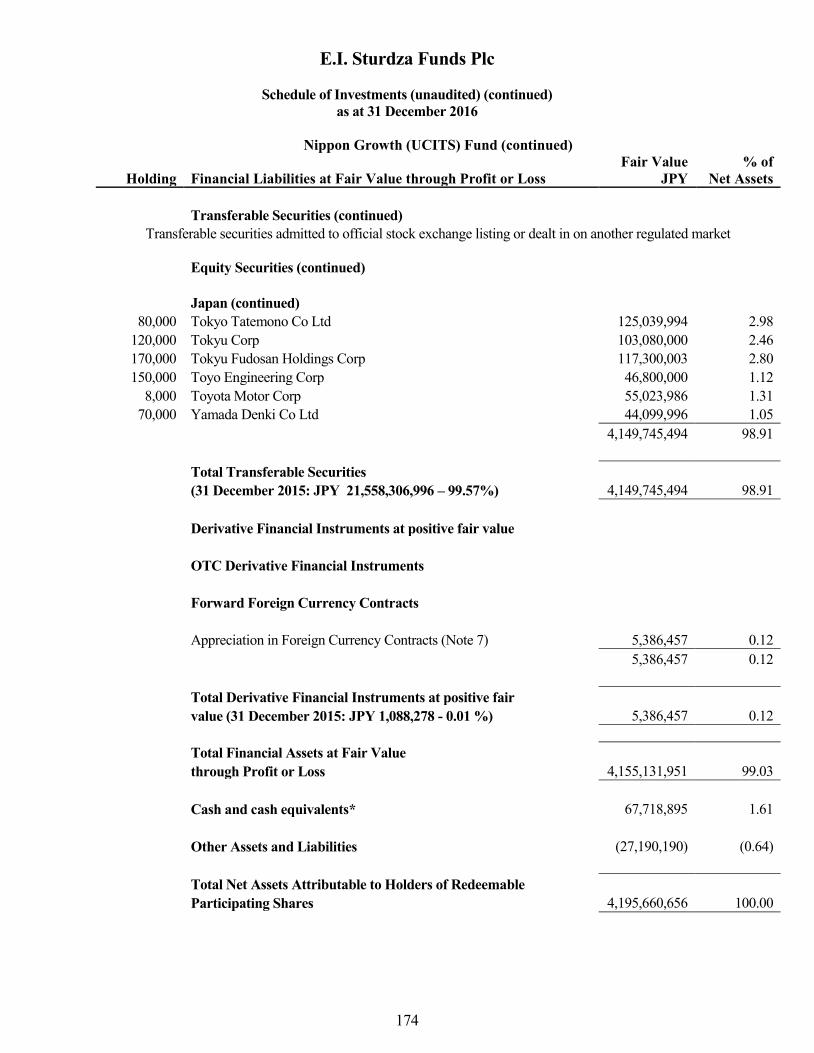
E.I. Sturdza Funds Plc
Schedule of Investments (unaudited) (continued)
as at 31 December 2016
174
Nippon Growth (UCITS) Fund (continued)
Fair Value % of
Holding Financial Liabilities at Fair Value through Profit or Loss JPY Net Assets
Transferable Securities (continued)
Transferable securities admitted to official stock exchange listing or dealt in on another regulated market
Equity Securities (continued)
Japan (continued)
80,000 Tokyo Tatemono Co Ltd 125,039,994 2.98
120,000 Tokyu Corp 103,080,000 2.46
170,000 Tokyu Fudosan Holdings Corp 117,300,003 2.80
150,000 Toyo Engineering Corp 46,800,000 1.12
8,000 Toyota Motor Corp 55,023,986 1.31
70,000 Yamada Denki Co Ltd 44,099,996 1.05
4,149,745,494 98.91
Total Transferable Securities
(31 December 2015: JPY 21,558,306,996 – 99.57%) 4,149,745,494 98.91
Derivative Financial Instruments at positive fair value
OTC Derivative Financial Instruments
Forward Foreign Currency Contracts
Appreciation in Foreign Currency Contracts (Note 7) 5,386,457 0.12
5,386,457 0.12
Total Derivative Financial Instruments at positive fair
value (31 December 2015: JPY 1,088,278 - 0.01 %) 5,386,457 0.12
Total Financial Assets at Fair Value
through Profit or Loss 4,155,131,951 99.03
Cash and cash equivalents* 67,718,895 1.61
Other Assets and Liabilities (27,190,190) (0.64)
Total Net Assets Attributable to Holders of Redeemable
Participating Shares 4,195,660,656 100.00
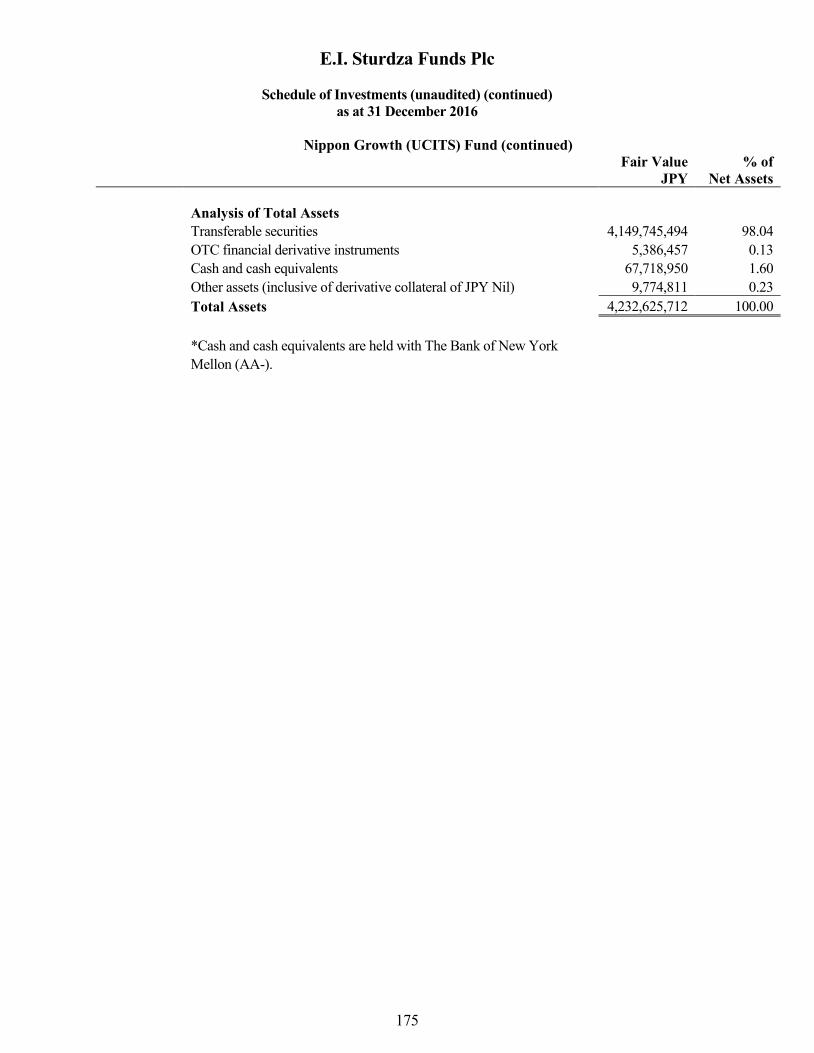
E.I. Sturdza Funds Plc
Schedule of Investments (unaudited) (continued)
as at 31 December 2016
175
Nippon Growth (UCITS) Fund (continued)
Fair Value % of
JPY Net Assets
Analysis of Total Assets
Transferable securities 4,149,745,494 98.04
OTC financial derivative instruments 5,386,457 0.13
Cash and cash equivalents 67,718,950 1.60
Other assets (inclusive of derivative collateral of JPY Nil) 9,774,811 0.23
Total Assets 4,232,625,712 100.00
*Cash and cash equivalents are held with The Bank of New York
Mellon (AA-).
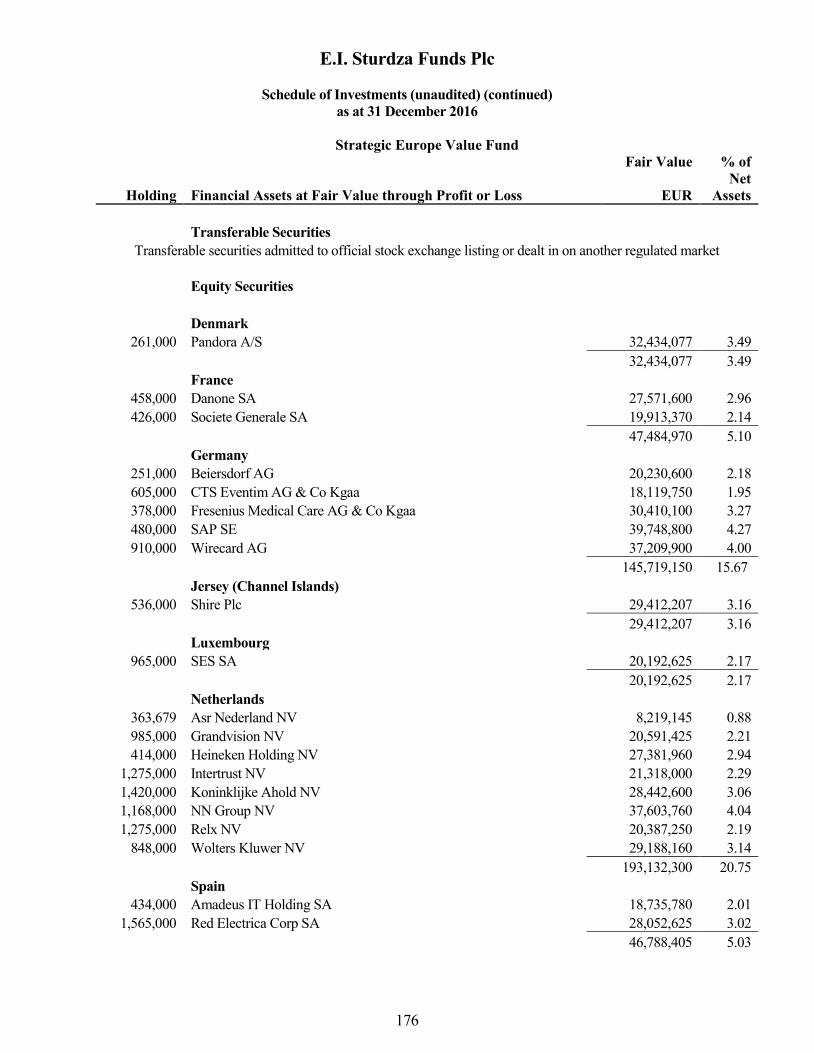
E.I. Sturdza Funds Plc
Schedule of Investments (unaudited) (continued)
as at 31 December 2016
176
Strategic Europe Value Fund
Fair Value % of
Holding Financial Assets at Fair Value through Profit or Loss EUR
Net
Assets
Transferable Securities
Transferable securities admitted to official stock exchange listing or dealt in on another regulated market
Equity Securities
Denmark
261,000 Pandora A/S 32,434,077 3.49
32,434,077 3.49
France
458,000 Danone SA 27,571,600 2.96
426,000 Societe Generale SA 19,913,370 2.14
47,484,970 5.10
Germany
251,000 Beiersdorf AG 20,230,600 2.18
605,000 CTS Eventim AG & Co Kgaa 18,119,750 1.95
378,000 Fresenius Medical Care AG & Co Kgaa 30,410,100 3.27
480,000 SAP SE 39,748,800 4.27
910,000 Wirecard AG 37,209,900 4.00
145,719,150 15.67
Jersey (Channel Islands)
536,000 Shire Plc 29,412,207 3.16
29,412,207 3.16
Luxembourg
965,000 SES SA 20,192,625 2.17
20,192,625 2.17
Netherlands
363,679 Asr Nederland NV 8,219,145 0.88
985,000 Grandvision NV 20,591,425 2.21
414,000 Heineken Holding NV 27,381,960 2.94
1,275,000 Intertrust NV 21,318,000 2.29
1,420,000 Koninklijke Ahold NV 28,442,600 3.06
1,168,000 NN Group NV 37,603,760 4.04
1,275,000 Relx NV 20,387,250 2.19
848,000 Wolters Kluwer NV 29,188,160 3.14
193,132,300 20.75
Spain
434,000 Amadeus IT Holding SA 18,735,780 2.01
1,565,000 Red Electrica Corp SA 28,052,625 3.02
46,788,405 5.03
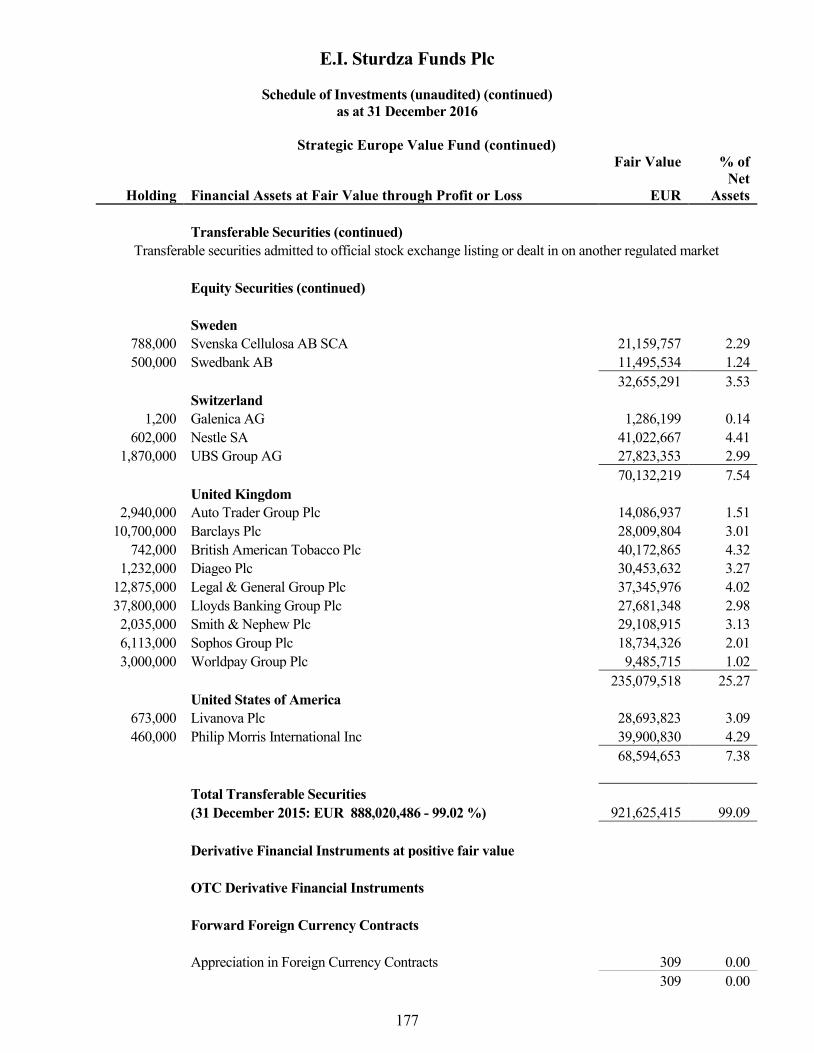
E.I. Sturdza Funds Plc
Schedule of Investments (unaudited) (continued)
as at 31 December 2016
177
Strategic Europe Value Fund (continued)
Fair Value % of
Holding Financial Assets at Fair Value through Profit or Loss EUR
Net
Assets
Transferable Securities (continued)
Transferable securities admitted to official stock exchange listing or dealt in on another regulated market
Equity Securities (continued)
Sweden
788,000 Svenska Cellulosa AB SCA 21,159,757 2.29
500,000 Swedbank AB 11,495,534 1.24
32,655,291 3.53
Switzerland
1,200 Galenica AG 1,286,199 0.14
602,000 Nestle SA 41,022,667 4.41
1,870,000 UBS Group AG 27,823,353 2.99
70,132,219 7.54
United Kingdom
2,940,000 Auto Trader Group Plc 14,086,937 1.51
10,700,000 Barclays Plc 28,009,804 3.01
742,000 British American Tobacco Plc 40,172,865 4.32
1,232,000 Diageo Plc 30,453,632 3.27
12,875,000 Legal & General Group Plc 37,345,976 4.02
37,800,000 Lloyds Banking Group Plc 27,681,348 2.98
2,035,000 Smith & Nephew Plc 29,108,915 3.13
6,113,000 Sophos Group Plc 18,734,326 2.01
3,000,000 Worldpay Group Plc 9,485,715 1.02
235,079,518 25.27
United States of America
673,000 Livanova Plc 28,693,823 3.09
460,000 Philip Morris International Inc 39,900,830 4.29
68,594,653 7.38
Total Transferable Securities
(31 December 2015: EUR 888,020,486 - 99.02 %) 921,625,415 99.09
Derivative Financial Instruments at positive fair value
OTC Derivative Financial Instruments
Forward Foreign Currency Contracts
Appreciation in Foreign Currency Contracts 309 0.00
309 0.00
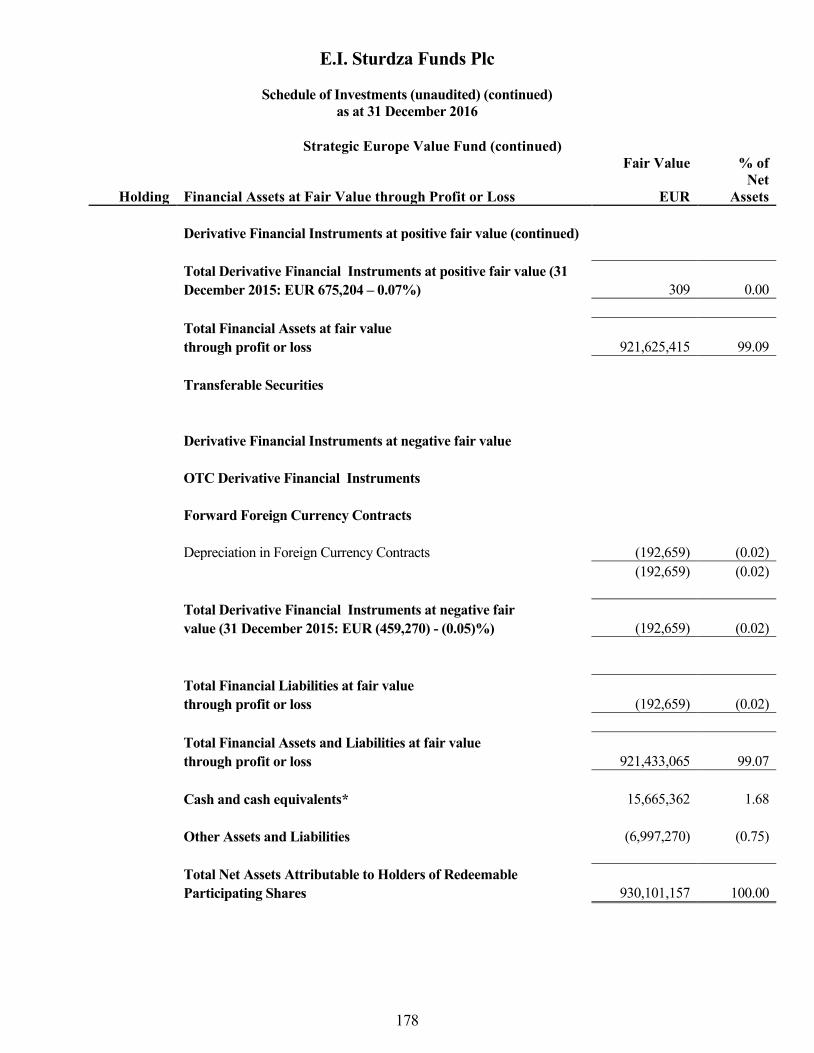
E.I. Sturdza Funds Plc
Schedule of Investments (unaudited) (continued)
as at 31 December 2016
178
Strategic Europe Value Fund (continued)
Fair Value % of
Holding Financial Assets at Fair Value through Profit or Loss EUR
Net
Assets
Derivative Financial Instruments at positive fair value (continued)
Total Derivative Financial Instruments at positive fair value (31
December 2015: EUR 675,204 – 0.07%) 309 0.00
Total Financial Assets at fair value
through profit or loss 921,625,415 99.09
Transferable Securities
Derivative Financial Instruments at negative fair value
OTC Derivative Financial Instruments
Forward Foreign Currency Contracts
Depreciation in Foreign Currency Contracts (192,659) (0.02)
(192,659) (0.02)
Total Derivative Financial Instruments at negative fair
value (31 December 2015: EUR (459,270) - (0.05)%) (192,659) (0.02)
Total Financial Liabilities at fair value
through profit or loss (192,659) (0.02)
Total Financial Assets and Liabilities at fair value
through profit or loss 921,433,065 99.07
Cash and cash equivalents* 15,665,362 1.68
Other Assets and Liabilities (6,997,270) (0.75)
Total Net Assets Attributable to Holders of Redeemable
Participating Shares 930,101,157 100.00

E.I. Sturdza Funds Plc
Schedule of Investments (uaudited) (continued)
as at 31 December 2016
179
Strategic Europe Value Fund (continued)
Fair Value % of
EUR
Net
Assets
Analysis of Total Assets
Transferable securities 921,625,415 96.06
OTC derivative financial instruments 309 0.00
Cash and cash equivalents 15,665,362 1.63
Other assets (inclusive of derivative collateral of EUR NIL) 22,160,382 2.31
Total Assets 959,451,468 100.00
*Cash and cash equivalents are held with The Bank of New York
Mellon (AA-).

E.I. Sturdza Funds Plc
Schedule of Investments (unaudited) (continued)
as at 31 December 2016
180
Strategic Global Bond Fund
Fair Value % of
Holding Financial Assets at Fair Value through Profit or Loss USD Net Assets
Transferable Securities
Transferable securities admitted to official stock exchange listing or dealt in on another regulated market
Debt Securities
Austria
3,000,000 Oesterreichische Kontrollbank AG 5% 25/04/2017 3,035,358 4.75
3,035,358 4.75
Canada
3,000,000 Export Development Canada 1.5% 03/10/2018 3,007,587 4.70
500,000 Toronto-Dominion Bank/The 1.42% 23/07/2018 501,251 0.78
2,000,000 Toronto-Dominion Bank/The 1.63% 13/03/2018 2,002,172 3.13
5,511,010 8.61
France
2,500,000 Electricite De France SA 6.5% 26/01/2019 2,719,513 4.25
2,500,000 Engie SA 1.63% 10/10/2017 2,500,681 3.91
1,000,000 Lvmh Moet Hennessy Louis Vuitton SA 1.63% 29/06/2017 1,001,151 1.57
1,000,000 Orange SA 2.75% 06/02/2019 1,013,381 1.59
500,000 RCI Banque SA 3.5% 03/04/2018 509,272 0.80
7,743,998 12.12
Germany
3,000,000 KFW 1.63% 15/03/2021 2,945,219 4.61
2,500,000 Linde AG 1.5% 18/04/2018 2,495,850 3.90
5,441,069 8.51
Netherlands
2,000,000 EDP Finance Bv , 5.25% , 01/14/2021 2,117,500 3.31
2,500,000 ENEL Finance International Nv , 5.13% , 10/07/2019 2,672,931 4.18
2,000,000 Shell International Finance BV 1.38% 10/05/2019 1,980,053 3.10
1,100,000 Siemens Financieringsmaatschappij NV 1.21% 25/05/2018 1,100,741 1.72
500,000 Siemens Financieringsmaatschappij NV 1.45% 25/05/2018 499,476 0.78
8,370,701 13.09
Republic of Korea
1,000,000 Korea Gas Corp 1.88% 18/07/2021 958,608 1.50
958,608 1.50
Singapore
1,000,000 SingTel Group Treasury Pte Ltd 3.25% 30/06/2025 999,504 1.56
999,504 1.56
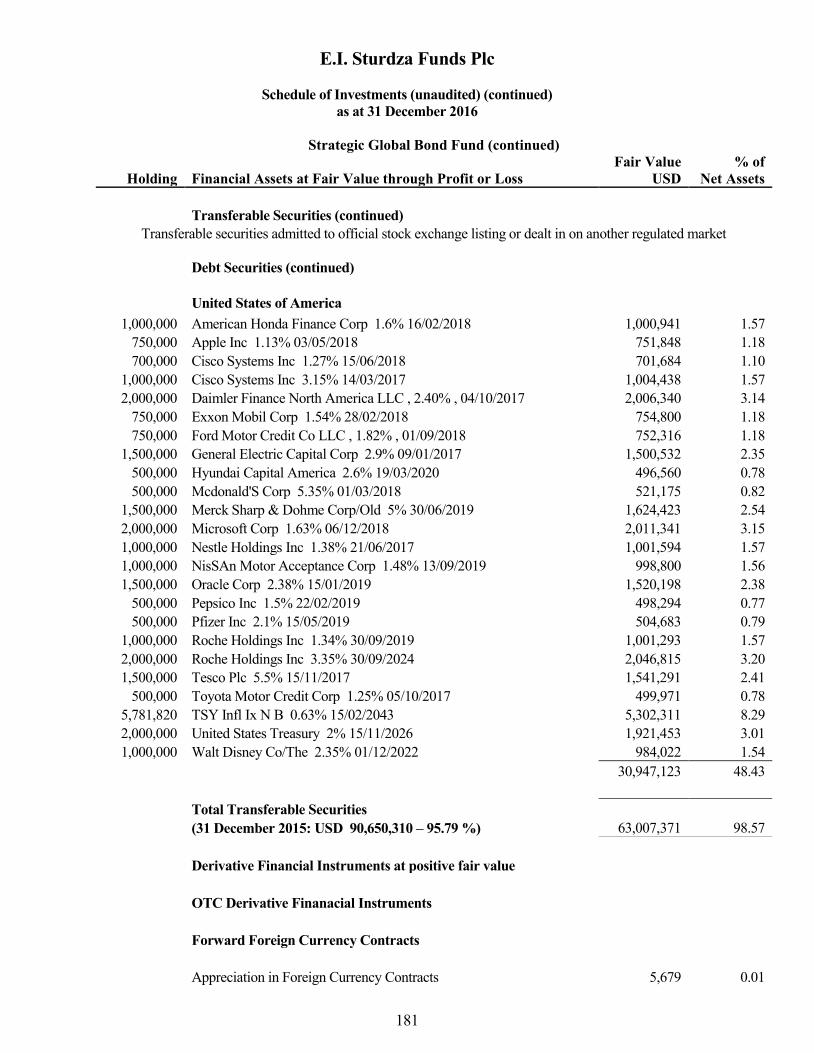
E.I. Sturdza Funds Plc
Schedule of Investments (unaudited) (continued)
as at 31 December 2016
181
Strategic Global Bond Fund (continued)
Fair Value % of
Holding Financial Assets at Fair Value through Profit or Loss USD Net Assets
Transferable Securities (continued)
Transferable securities admitted to official stock exchange listing or dealt in on another regulated market
Debt Securities (continued)
United States of America
1,000,000 American Honda Finance Corp 1.6% 16/02/2018 1,000,941 1.57
750,000 Apple Inc 1.13% 03/05/2018 751,848 1.18
700,000 Cisco Systems Inc 1.27% 15/06/2018 701,684 1.10
1,000,000 Cisco Systems Inc 3.15% 14/03/2017 1,004,438 1.57
2,000,000 Daimler Finance North America LLC , 2.40% , 04/10/2017 2,006,340 3.14
750,000 Exxon Mobil Corp 1.54% 28/02/2018 754,800 1.18
750,000 Ford Motor Credit Co LLC , 1.82% , 01/09/2018 752,316 1.18
1,500,000 General Electric Capital Corp 2.9% 09/01/2017 1,500,532 2.35
500,000 Hyundai Capital America 2.6% 19/03/2020 496,560 0.78
500,000 Mcdonald'S Corp 5.35% 01/03/2018 521,175 0.82
1,500,000 Merck Sharp & Dohme Corp/Old 5% 30/06/2019 1,624,423 2.54
2,000,000 Microsoft Corp 1.63% 06/12/2018 2,011,341 3.15
1,000,000 Nestle Holdings Inc 1.38% 21/06/2017 1,001,594 1.57
1,000,000 NisSAn Motor Acceptance Corp 1.48% 13/09/2019 998,800 1.56
1,500,000 Oracle Corp 2.38% 15/01/2019 1,520,198 2.38
500,000 Pepsico Inc 1.5% 22/02/2019 498,294 0.77
500,000 Pfizer Inc 2.1% 15/05/2019 504,683 0.79
1,000,000 Roche Holdings Inc 1.34% 30/09/2019 1,001,293 1.57
2,000,000 Roche Holdings Inc 3.35% 30/09/2024 2,046,815 3.20
1,500,000 Tesco Plc 5.5% 15/11/2017 1,541,291 2.41
500,000 Toyota Motor Credit Corp 1.25% 05/10/2017 499,971 0.78
5,781,820 TSY Infl Ix N B 0.63% 15/02/2043 5,302,311 8.29
2,000,000 United States Treasury 2% 15/11/2026 1,921,453 3.01
1,000,000 Walt Disney Co/The 2.35% 01/12/2022 984,022 1.54
30,947,123 48.43
Total Transferable Securities
(31 December 2015: USD 90,650,310 – 95.79 %) 63,007,371 98.57
Derivative Financial Instruments at positive fair value
OTC Derivative Finanacial Instruments
Forward Foreign Currency Contracts
Appreciation in Foreign Currency Contracts 5,679 0.01

E.I. Sturdza Funds Plc
Schedule of Investments (unaudited) (continued)
as at 31 December 2016
182
Strategic Global Bond Fund (continued)
Fair Value % of
Holding Financial Liabilities at Fair Value through Profit or Loss USD Net Assets
Derivative Financial Instruments at positive fair value (continued)
Total Derivative Financial Instruments at positive fair
value (31 December 2015: USD 77,453 - 0.08%) 5,679 0.01
Total Financial Assets at fair value
through profit or loss 63,013,050 98.58
Cash and cash equivalents* 636,398 0.99
Other Assets and Liabilities 274,748 0.43
Total Net Assets Attributable to Holders of Redeemable
Participating Shares 63,924,196 100.00
Analysis of Total Assets
Transferable securities 63,007,371 98.33
OTC derivative financial instruments 5,679 0.01
Cash and cash equivalents 636,398 0.99
Other assets (inclusive of derivative collateral of USD Nil) 430,384 0.67
Total Assets 64,079,832 100.00
*Cash and cash equivalents are held with The Bank of New York
Mellon (AA-).

E.I. Sturdza Funds Plc
Schedule of Investments (unaudited) (continued)
as at 31 December 2016
183
Strategic US Momentum and Value Fund
Fair Value % of
Holding Financial Assets at Fair Value through Profit or Loss USD Net Assets
Transferable Securities
Transferable securities admitted to official stock exchange listing or dealt in on another regulated market
Equity Securities
Canada
18,700 Canadian Pacific Railway Ltd 2,669,798 1.25
2,669,798 1.25
Jersey (Channel Islands)
47,000 Shire Plc 8,007,859 3.74
8,007,859 3.74
Netherlands
10,000 NXP Semiconductor NV 980,100 0.46
980,100 0.46
Singapore
45,900 Broadcom Ltd 8,113,743 3.79
8,113,743 3.79
United States of America
40,300 Allergan Plc 8,463,403 3.95
25,750 Alliance Data Systems Corp 5,883,875 2.75
10,725 Alphabet Inc 8,499,026 3.97
20,800 AMERCO 7,687,472 3.59
72,000 AO Smith Corp 3,409,200 1.59
82,100 Apple Inc 9,508,822 4.44
10,325 Autozone Inc 8,154,582 3.81
145,000 Bank Of The Ozarks Inc 7,625,550 3.56
4,100 Becton Dickinson And Co 678,755 0.32
21,350 Biogen Idec Inc 6,054,433 2.83
47,000 Casey'S General Stores Inc 5,587,360 2.61
73,600 Celgene Corp 8,519,200 3.98
56,700 Cerner Corp 2,685,879 1.25
66,700 Citrix Systems Inc 5,956,977 2.78
76,800 Cognizant Technology Solutions Corp 4,303,104 2.01
87,500 Comcast Corp 6,041,875 2.82
67,400 CVS Health Corp 5,318,534 2.48
52,900 Dollar Tree Inc 4,082,822 1.91
530,800 Financial Select Sector Spdr Fund 12,341,102 5.72
38,700 Eplus Inc 4,458,240 2.08
50,100 Ishares Russell 2000 ETF 6,755,985 3.15
138,500 Kroger Co/The 4,779,635 2.23
61,500 Mastercard Inc 6,349,875 2.96
75,400 New Amethyst Corp 4,772,066 2.23

E.I. Sturdza Funds Plc
Schedule of Investments (unaudited) (continued)
as at 31 December 2016
184
Strategic US Momentum and Value Fund (continued)
Fair Value % of
Holding Financial Assets at Fair Value through Profit or Loss USD Net Assets
Transferable Securities (continued)
Transferable securities admitted to official stock exchange listing or dealt in on another regulated market
Equity Securities (continued)
United States (continued)
4,820 Priceline Group Inc/The 7,066,409 3.30
60,000 Quintiles Transnational Holdings Inc 4,563,000 2.13
13,950 Sherwin-Williams Co/The 3,748,923 1.75
43,200 Signature Bank/New York NY 6,488,640 3.03
3,000 SPDR S&P 500 Etf Trust 670,590 0.31
28,600 Union Pacific Corp 2,965,248 1.38
41,700 Universal Health Services Inc 4,436,046 2.07
80,900 Visa Inc 6,311,818 2.95
184,168,446 85.94
Total Transferable Securities
(31 December 2015: USD 308,095,280 – 94.41 %) 203,939,946 95.18
Derivative Financial Instruments at positive fair value
Derivative Financial Instruments dealt on a regulated market
Covered Option Contracts
140
Cvs Health Corp Call Option, Strike Price Usd 70.0000 , Expiry
16/06/2017 142,450 0.07
142,450 0.07
OTC Derivative Financial Instruments
Forward Foreign Currency Contracts
Appreciation in Foreign Currency Contracts 117,801 0.05
Total Derivative Financial Instruments at positive fair
value (31 December 2015: USD 155,000 - 0.05%) 260,251 0.12
Total Financial Assets at fair value
through profit or loss 204,200,197 95.30

E.I. Sturdza Funds Plc
Schedule of Investments (unaudited) (continued)
as at 31 December 2016
185
Strategic US Momentum and Value Fund (continued)
Fair Value % of
Holding Financial Liabilities at Fair Value through Profit or Loss USD Net Assets
Derivative Financial Instruments at negative fair value
Derivative Financial Instruments dealt on a regulated market
Covered Option Contracts
(400) Apple Inc Call Option, Strike Price Usd 97.5000 , Expiry 20/01/2017 (724,000) (0.33)
(724,000) (0.33)
OTC Derivative Financial Instruments
Forward Foreign Currency Contracts
Depreciation in Foreign Currency Contracts (Note 7) (1,198) 0.00
Total Derivative Financial Instruments at negative fair (1,198) 0.00
value (31 December 2015: USD (791,990)- (0.24)%)
Total Financial Liabilities at fair value
through profit or loss (725,198) (0.33)
Total Financial Assets and Liabilities at fair value
through profit or loss 203,474,999 94.97
Cash and cash equivalents* 14,575,366 6.80
Other Assets and Liabilities (3,787,324) (1.77)
Total Net Assets attributable to the Holders of Redeemable
Participating Shares 214,263,041 100.00
Analysis of Total Assets
Transferable securities 203,939,946 93.19
Derivative Financial Instrumentsdealt on a regulated market 142,450 0.00
OTC Derivative Financial Instruments 117,801 0.00
Cash and cash equivalents 14,575,366 6.66
Other assets (inclusive of derivative collateral of USD Nil) 72,820 0.00
Total Assets 218,848,383 100.00
*Cash and cash equivalents are held with The Bank of New York
Mellon (AA-) and Royal Bank of Scotland (AA-) (rating from
Standard & Poor’s ).
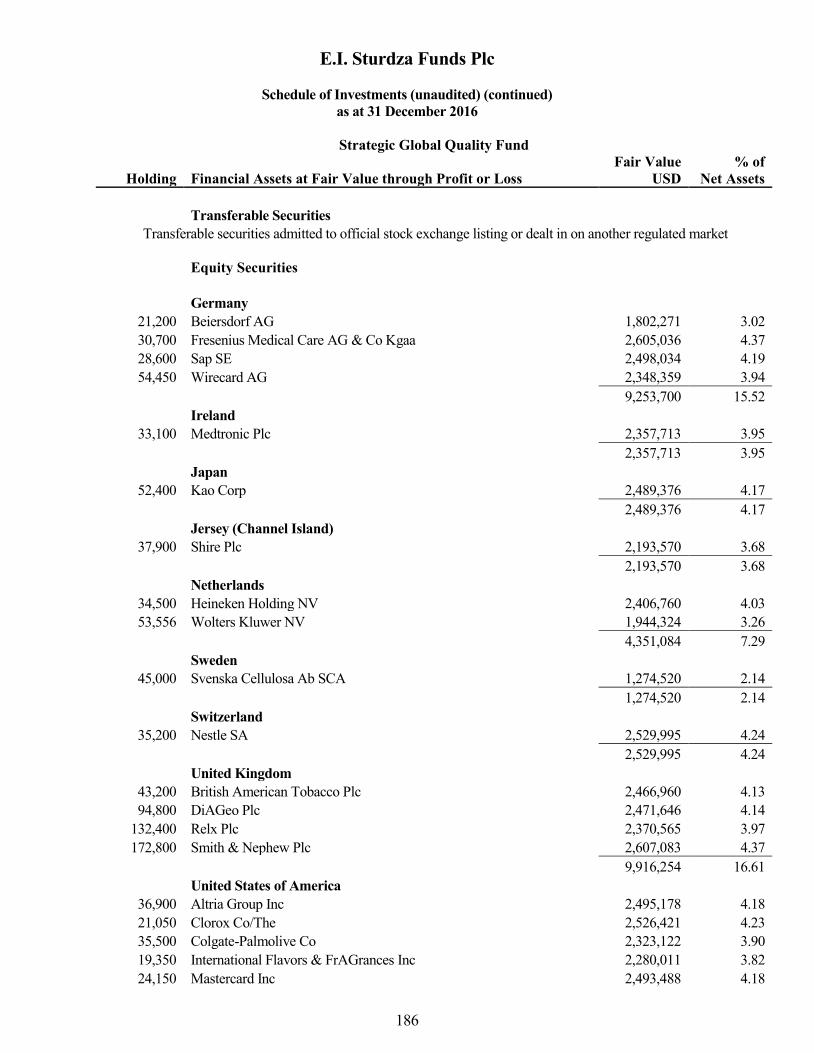
E.I. Sturdza Funds Plc
Schedule of Investments (unaudited) (continued)
as at 31 December 2016
186
Strategic Global Quality Fund
Fair Value % of
Holding Financial Assets at Fair Value through Profit or Loss USD Net Assets
Transferable Securities
Transferable securities admitted to official stock exchange listing or dealt in on another regulated market
Equity Securities
Germany
21,200 Beiersdorf AG 1,802,271 3.02
30,700 Fresenius Medical Care AG & Co Kgaa 2,605,036 4.37
28,600 Sap SE 2,498,034 4.19
54,450 Wirecard AG 2,348,359 3.94
9,253,700 15.52
Ireland
33,100 Medtronic Plc 2,357,713 3.95
2,357,713 3.95
Japan
52,400 Kao Corp 2,489,376 4.17
2,489,376 4.17
Jersey (Channel Island)
37,900 Shire Plc 2,193,570 3.68
2,193,570 3.68
Netherlands
34,500 Heineken Holding NV 2,406,760 4.03
53,556 Wolters Kluwer NV 1,944,324 3.26
4,351,084 7.29
Sweden
45,000 Svenska Cellulosa Ab SCA 1,274,520 2.14
1,274,520 2.14
Switzerland
35,200 Nestle SA 2,529,995 4.24
2,529,995 4.24
United Kingdom
43,200 British American Tobacco Plc 2,466,960 4.13
94,800 DiAGeo Plc 2,471,646 4.14
132,400 Relx Plc 2,370,565 3.97
172,800 Smith & Nephew Plc 2,607,083 4.37
9,916,254 16.61
United States of America
36,900 Altria Group Inc 2,495,178 4.18
21,050 Clorox Co/The 2,526,421 4.23
35,500 Colgate-Palmolive Co 2,323,122 3.90
19,350 International Flavors & FrAGrances Inc 2,280,011 3.82
24,150 Mastercard Inc 2,493,488 4.18

E.I. Sturdza Funds Plc
Schedule of Investments (unaudited) (continued)
as at 31 December 2016
187
Strategic Global Quality Fund (continued)
Fair Value % of
Holding Financial Assets at Fair Value through Profit or Loss USD Net Assets
Transferable Securities (continued)
Transferable securities admitted to official stock exchange listing or dealt in on another regulated market
Equity Securities (continued)
United States of America (continued)
49,000 Microsoft Corp 3,044,860 5.10
39,400 Philip Morris International Inc 3,604,706 6.04
43,600 Reynolds American Inc 2,443,344 4.10
31,000 Visa Inc 2,418,620 4.05
23,629,750 39.60
Total Transferable Securities
(31 December 2015: USD 12,470,123 – 95.23 %) 57,995,962 97.20
Derivative Financial Instruments at positive fair value
Forward Foreign Currency Contracts
Appreciation in Foreign Currency Contracts 82,639 0.14
Total Derivative Financial Instruments at positive fair
value (31 December 2015: USD Nil - Nil%) 82,639 0.14
Total Financial Assets at fair value
through profit or loss 58,078,601 97.34
Cash and cash equivalents* 1,157,603 1.94
Other Assets and Liabilities 428,088 0.72
Total Net Assets attributable to the Holders of
Redeemable Participating Shares 59,664,292 100.00

E.I. Sturdza Funds Plc
Schedule of Investments (unaudited) (continued)
as at 31 December 2016
188
Strategic Global Quality Fund (continued)
Fair Value % of
Holding Financial Liabilities at Fair Value through Profit or Loss USD Net Assets
Analysis of Total Assets
Transferable securities 57,995,962 96.98
OTC Derivative Financial Instruments 82,639 0.14
Cash and cash equivalents 1,157,603 1.94
Other assets (inclusive of derivative collateral of USD Nil) 568,394 0.94
Total Assets 59,804,598 100.00
* Cash and cash equivalents are held with The Bank of New York
Mellon (AA-).
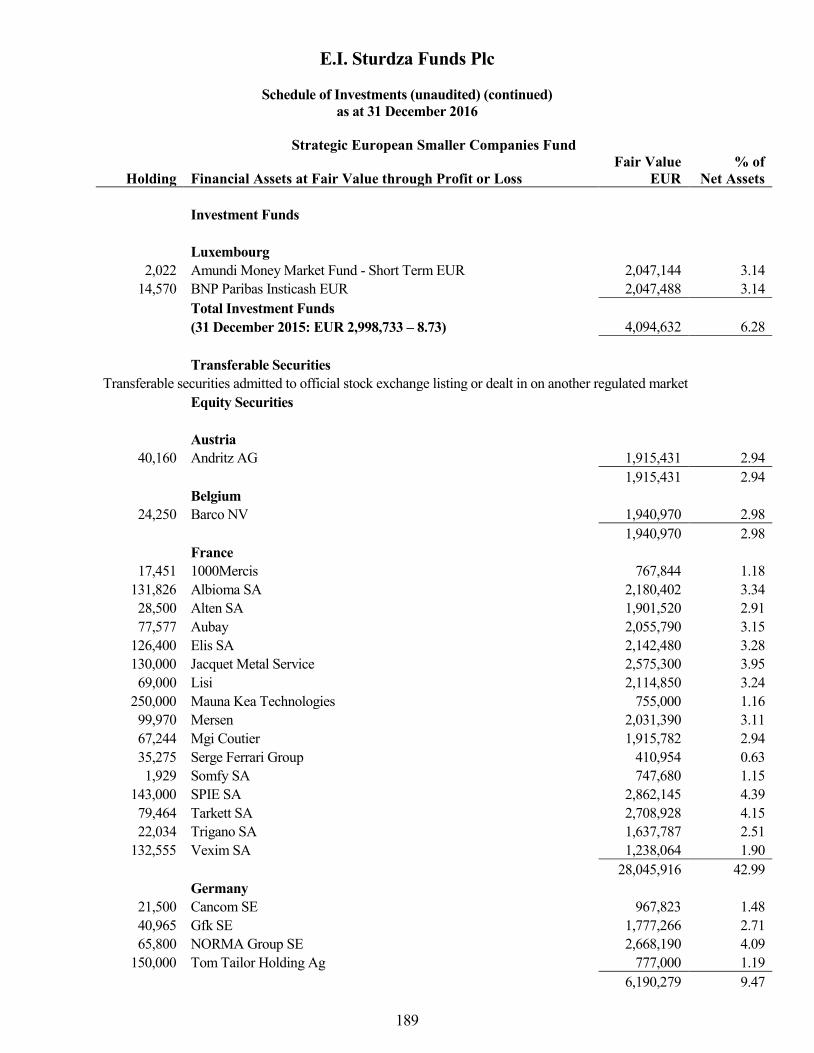
E.I. Sturdza Funds Plc
Schedule of Investments (unaudited) (continued)
as at 31 December 2016
189
Strategic European Smaller Companies Fund
Fair Value % of
Holding Financial Assets at Fair Value through Profit or Loss EUR Net Assets
Investment Funds
Luxembourg
2,022 Amundi Money Market Fund - Short Term EUR 2,047,144 3.14
14,570 BNP Paribas Insticash EUR 2,047,488 3.14
Total Investment Funds
(31 December 2015: EUR 2,998,733 – 8.73) 4,094,632 6.28
Transferable Securities
Transferable securities admitted to official stock exchange listing or dealt in on another regulated market
Equity Securities
Austria
40,160 Andritz AG 1,915,431 2.94
1,915,431 2.94
Belgium
24,250 Barco NV 1,940,970 2.98
1,940,970 2.98
France
17,451 1000Mercis 767,844 1.18
131,826 Albioma SA 2,180,402 3.34
28,500 Alten SA 1,901,520 2.91
77,577 Aubay 2,055,790 3.15
126,400 Elis SA 2,142,480 3.28
130,000 Jacquet Metal Service 2,575,300 3.95
69,000 Lisi 2,114,850 3.24
250,000 Mauna Kea Technologies 755,000 1.16
99,970 Mersen 2,031,390 3.11
67,244 Mgi Coutier 1,915,782 2.94
35,275 Serge Ferrari Group 410,954 0.63
1,929 Somfy SA 747,680 1.15
143,000 SPIE SA 2,862,145 4.39
79,464 Tarkett SA 2,708,928 4.15
22,034 Trigano SA 1,637,787 2.51
132,555 Vexim SA 1,238,064 1.90
28,045,916 42.99
Germany
21,500 Cancom SE 967,823 1.48
40,965 Gfk SE 1,777,266 2.71
65,800 NORMA Group SE 2,668,190 4.09
150,000 Tom Tailor Holding Ag 777,000 1.19
6,190,279 9.47
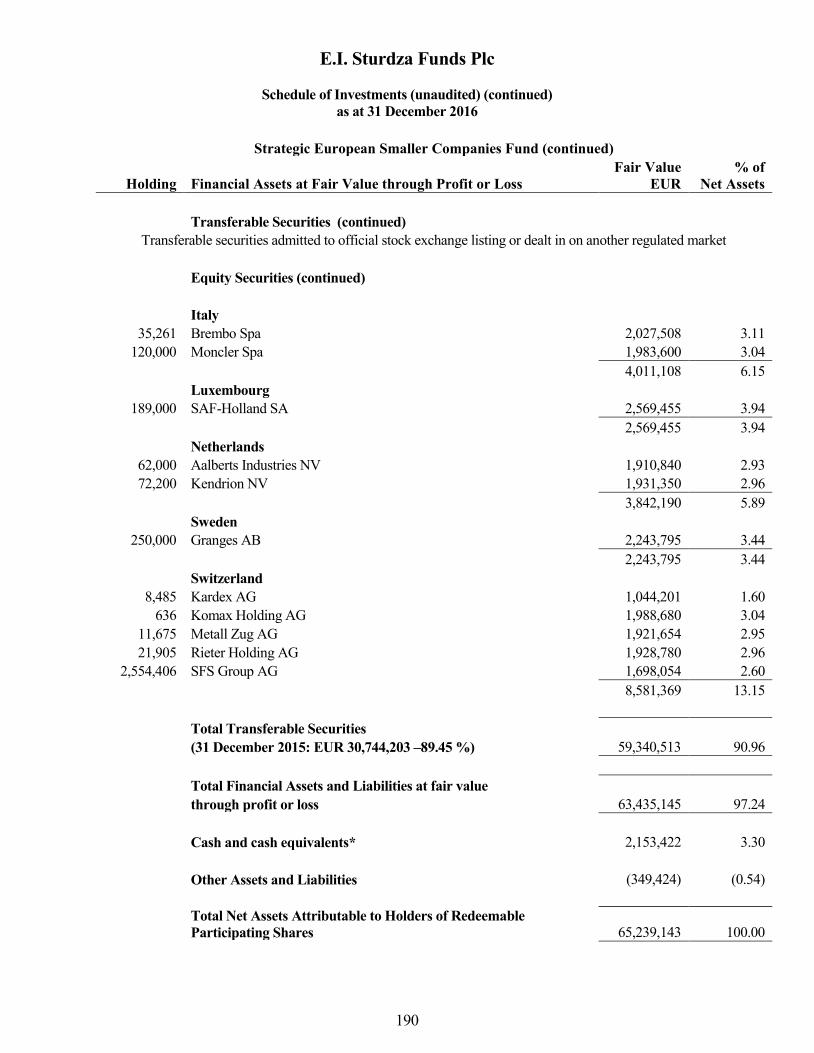
E.I. Sturdza Funds Plc
Schedule of Investments (unaudited) (continued)
as at 31 December 2016
190
Strategic European Smaller Companies Fund (continued)
Fair Value % of
Holding Financial Assets at Fair Value through Profit or Loss EUR Net Assets
Transferable Securities (continued)
Transferable securities admitted to official stock exchange listing or dealt in on another regulated market
Equity Securities (continued)
Italy
35,261 Brembo Spa 2,027,508 3.11
120,000 Moncler Spa 1,983,600 3.04
4,011,108 6.15
Luxembourg
189,000 SAF-Holland SA 2,569,455 3.94
2,569,455 3.94
Netherlands
62,000 Aalberts Industries NV 1,910,840 2.93
72,200 Kendrion NV 1,931,350 2.96
3,842,190 5.89
Sweden
250,000 Granges AB 2,243,795 3.44
2,243,795 3.44
Switzerland
8,485 Kardex AG 1,044,201 1.60
636 Komax Holding AG 1,988,680 3.04
11,675 Metall Zug AG 1,921,654 2.95
21,905 Rieter Holding AG 1,928,780 2.96
2,554,406 SFS Group AG 1,698,054 2.60
8,581,369 13.15
Total Transferable Securities
(31 December 2015: EUR 30,744,203 –89.45 %) 59,340,513 90.96
Total Financial Assets and Liabilities at fair value
through profit or loss 63,435,145 97.24
Cash and cash equivalents* 2,153,422 3.30
Other Assets and Liabilities (349,424) (0.54)
Total Net Assets Attributable to Holders of Redeemable
Participating Shares 65,239,143 100.00
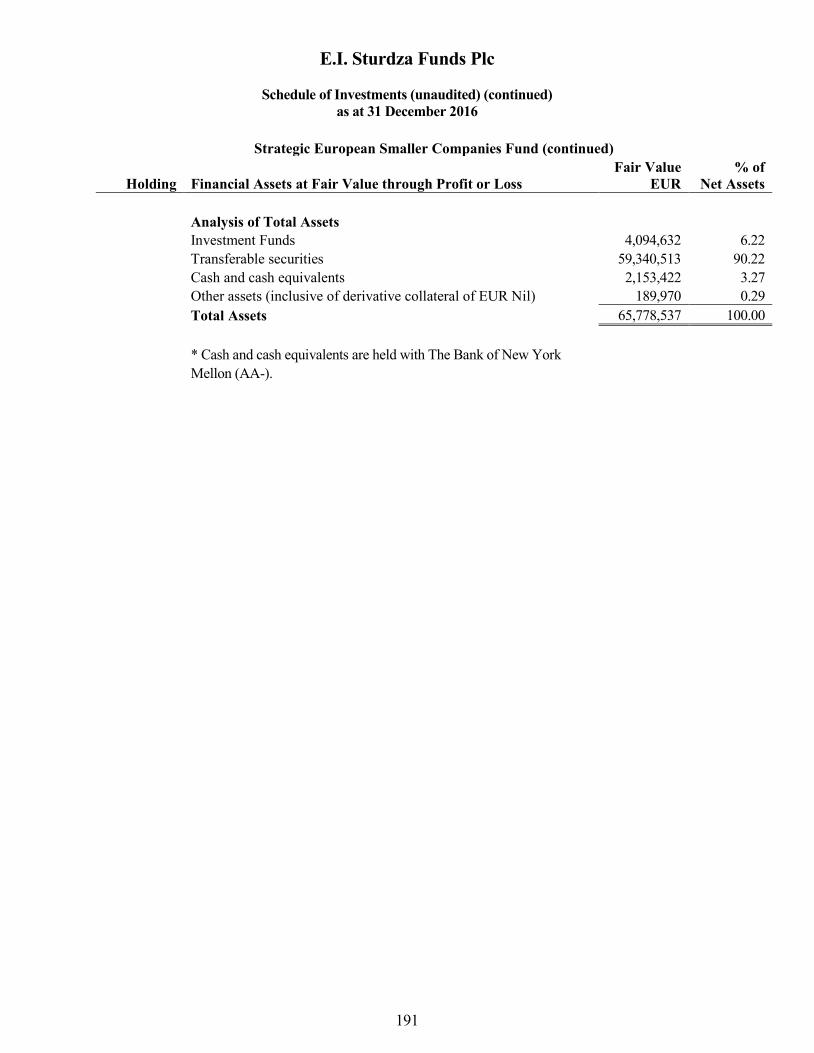
E.I. Sturdza Funds Plc
Schedule of Investments (unaudited) (continued)
as at 31 December 2016
191
Strategic European Smaller Companies Fund (continued)
Fair Value % of
Holding Financial Assets at Fair Value through Profit or Loss EUR Net Assets
Analysis of Total Assets
Investment Funds 4,094,632 6.22
Transferable securities 59,340,513 90.22
Cash and cash equivalents 2,153,422 3.27
Other assets (inclusive of derivative collateral of EUR Nil) 189,970 0.29
Total Assets 65,778,537 100.00
* Cash and cash equivalents are held with The Bank of New York
Mellon (AA-).

E.I. Sturdza Funds Plc
Schedule of Investments (unaudited) (continued)
as at 31 December 2016
192
Strategic Quality Emerging Bond Fund
Fair Value % of
Holding Financial Assets at Fair Value through Profit or Loss USD Net Assets
Transferable Securities
Transferable securities admitted to official stock exchange listing or dealt in on another regulated market
Debt Securities
Austria
1,500,000 Bahia Sul Holdings Gmbh 5.75% 14/07/2026 1,449,375 2.82
1,449,375 2.82
Azerbaijan
500,000 Azerbaijan Republic OF (Government) 4.75% 18/03/2024 498,640 0.97
1,500,000 State Oil Co Of The Azerbaijan Republic 4.75% 13/03/2023 1,462,313 2.84
1,960,953 3.81
Brazil
1,000,000 BRF SA 4.75% 22/05/2024 976,500 1.90
976,500 1.90
Cayman Islands
1,500,000 Embraer Overseas Ltd 5.7% 16/09/2023 1,575,000 3.06
1,500,000 Fibria Overseas Finance Ltd 5.25% 12/05/2024 1,503,750 2.92
1,000,000 Tencent Holdings Ltd 2.88% 11/02/2020 1,004,081 1.95
4,082,831 7.93
Chile
1,750,000 Corp Nacional Del Cobre De Chile 4.5% 16/09/2025 1,778,644 3.46
1,778,644 3.46
China
1,500,000 China Development Bank Corp 3% 01/06/2026 1,429,316 2.78
1,429,316 2.78
Colombia
1,500,000 Ecopetrol SA 5.88% 18/09/2023 1,591,500 3.10
500,000 Colombia Republic OF (Government) 4% 26/02/2024 506,250 0.98
2,097,750 4.08
Hungary
2,000,000 MFB Magyar Fejlesztesi Bank ZRT 6.25% 21/10/2020 2,210,362 4.30
2,210,362 4.30
India
500,000 Export-Import Bank Of India 4% 14/01/2023 509,934 0.99
500,000 Oil India Ltd 5.38% 17/04/2024 533,933 1.04
1,000,000 Tata Motors Ltd 4.63% 30/04/2020 1,034,040 2.01
2,077,907 4.04
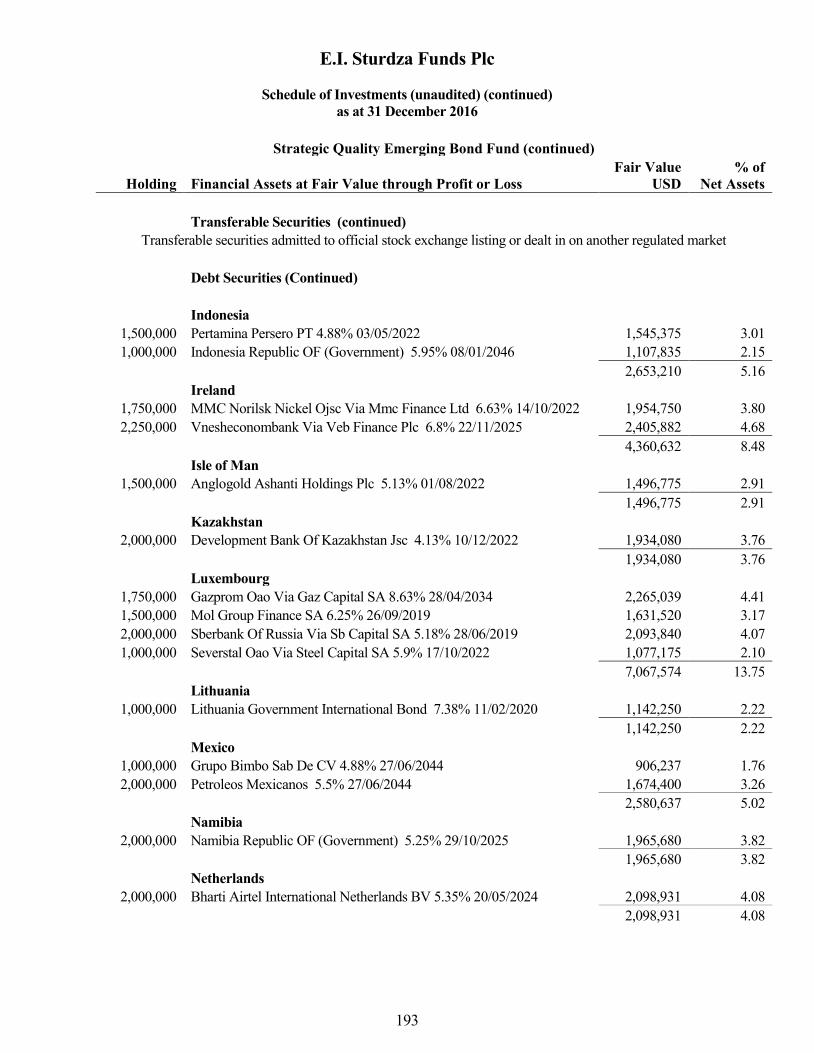
E.I. Sturdza Funds Plc
Schedule of Investments (unaudited) (continued)
as at 31 December 2016
193
Strategic Quality Emerging Bond Fund (continued)
Fair Value % of
Holding Financial Assets at Fair Value through Profit or Loss USD Net Assets
Transferable Securities (continued)
Transferable securities admitted to official stock exchange listing or dealt in on another regulated market
Debt Securities (Continued)
Indonesia
1,500,000 Pertamina Persero PT 4.88% 03/05/2022 1,545,375 3.01
1,000,000 Indonesia Republic OF (Government) 5.95% 08/01/2046 1,107,835 2.15
2,653,210 5.16
Ireland
1,750,000 MMC Norilsk Nickel Ojsc Via Mmc Finance Ltd 6.63% 14/10/2022 1,954,750 3.80
2,250,000 Vnesheconombank Via Veb Finance Plc 6.8% 22/11/2025 2,405,882 4.68
4,360,632 8.48
Isle of Man
1,500,000 Anglogold Ashanti Holdings Plc 5.13% 01/08/2022 1,496,775 2.91
1,496,775 2.91
Kazakhstan
2,000,000 Development Bank Of Kazakhstan Jsc 4.13% 10/12/2022 1,934,080 3.76
1,934,080 3.76
Luxembourg
1,750,000 Gazprom Oao Via Gaz Capital SA 8.63% 28/04/2034 2,265,039 4.41
1,500,000 Mol Group Finance SA 6.25% 26/09/2019 1,631,520 3.17
2,000,000 Sberbank Of Russia Via Sb Capital SA 5.18% 28/06/2019 2,093,840 4.07
1,000,000 Severstal Oao Via Steel Capital SA 5.9% 17/10/2022 1,077,175 2.10
7,067,574 13.75
Lithuania
1,000,000 Lithuania Government International Bond 7.38% 11/02/2020 1,142,250 2.22
1,142,250 2.22
Mexico
1,000,000 Grupo Bimbo Sab De CV 4.88% 27/06/2044 906,237 1.76
2,000,000 Petroleos Mexicanos 5.5% 27/06/2044 1,674,400 3.26
2,580,637 5.02
Namibia
2,000,000 Namibia Republic OF (Government) 5.25% 29/10/2025 1,965,680 3.82
1,965,680 3.82
Netherlands
2,000,000 Bharti Airtel International Netherlands BV 5.35% 20/05/2024 2,098,931 4.08
2,098,931 4.08

E.I. Sturdza Funds Plc
Schedule of Investments (unaudited) (continued)
as at 31 December 2016
194
Strategic Quality Emerging Bond Fund (continued)
Fair Value % of
Holding Financial Assets at Fair Value through Profit or Loss USD Net Assets
Transferable Securities (continued)
Transferable securities admitted to official stock exchange listing or dealt in on another regulated market
Debt Securities (Continued)
Peru
1,000,000 Corp Financiera De Desarrollo SA 3.25% 15/07/2019 1,015,000 1.97
1,015,000 1.97
Poland
1,250,000 Poland Republic OF (Government) 3.25% 06/04/2026 1,202,515 2.34
1,202,515 2.34
Romania
1,500,000 Romania Republic OF (Government) 4.88% 22/01/2024 1,592,010 3.12
1,592,010 3.12
Turkey
1,500,000 Anadolu Efes Biracilik Ve Malt Sanayii AS 3.38% 01/11/2022 1,338,323 2.60
1,250,000 Turkcell Iletisim Hizmetleri AS 5.75% 15/10/2025 1,218,688 2.37
2,557,011 4.97
Total Transferable Securities 49,729,943 96.72
Derivative Financial Instruments at positive fair value
OTC Derivative Financial Instruments
Forward Foreign Currency Contracts
Appreciation in Foreign Currency Contracts 329,832 0.64
329,832 0.64
Total Derivative Financial Instruments at positive fair
value 329,832 0.64
Total Financial Assets at fair value through profit or loss 50,059,775 97.36

E.I. Sturdza Funds Plc
Schedule of Investments (unaudited) (continued)
as at 31 December 2016
195
Strategic Quality Emerging Bond Fund (continued)
Fair Value % of
Holding Financial Assets at Fair Value through Profit or Loss USD Net Assets
Cash and cash equivalents* 4,790,924 9.32
Other Assets and Liabilities (3,434,881) (6.68)
Total Net Assets attributable to the Holders of
Redeemable Participating Shares 51,415,818 100.00
Analysis of Total Assets
Transferable securities 49,729,943 89.74
OTC Derivative Financial Instruments 329,832 0.60
Cash and cash equivalents 4,790,924 8.65
Other assets (inclusive of derivative collateral of Nil) 564,642 1.01
Total Assets 55,415,341 100.00
* Cash and cash equivalents are held with The Bank of New York
Mellon (AA-).
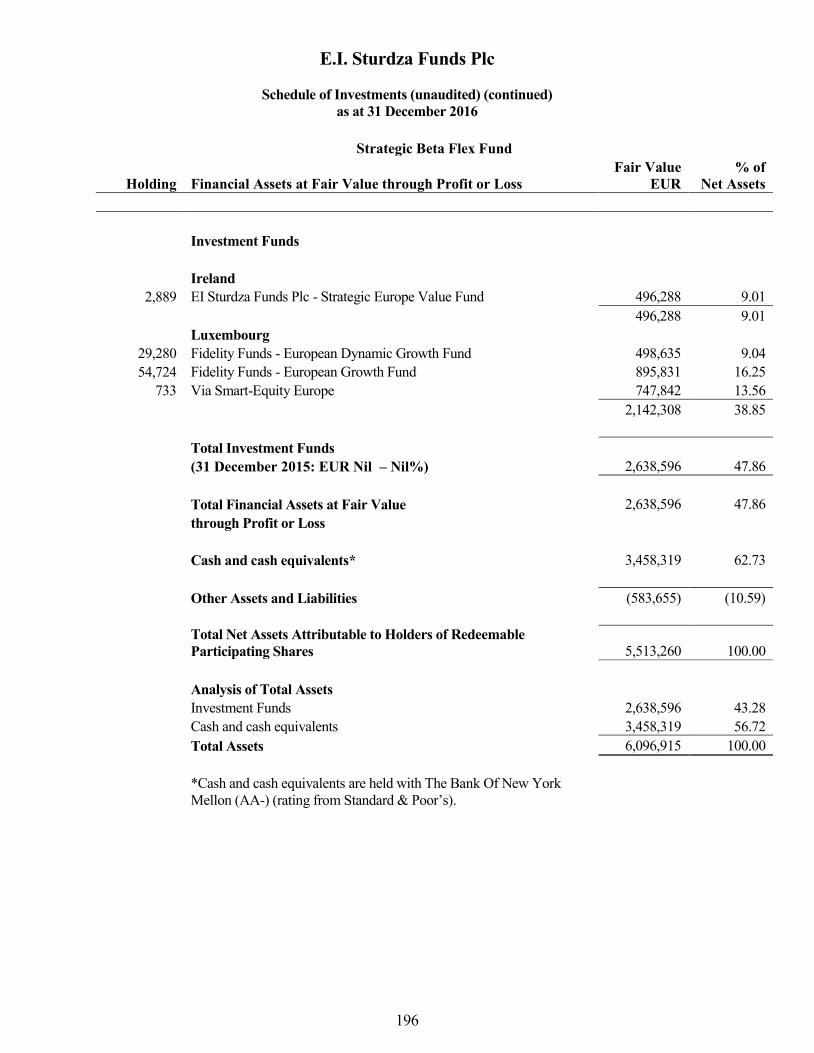
E.I. Sturdza Funds Plc
Schedule of Investments (unaudited) (continued)
as at 31 December 2016
196
Strategic Beta Flex Fund
Fair Value % of
Holding Financial Assets at Fair Value through Profit or Loss EUR Net Assets
Investment Funds
Ireland
2,889 EI Sturdza Funds Plc - Strategic Europe Value Fund 496,288 9.01
496,288 9.01
Luxembourg
29,280 Fidelity Funds - European Dynamic Growth Fund 498,635 9.04
54,724 Fidelity Funds - European Growth Fund 895,831 16.25
733 Via Smart-Equity Europe 747,842 13.56
2,142,308 38.85
Total Investment Funds
(31 December 2015: EUR Nil – Nil%) 2,638,596 47.86
Total Financial Assets at Fair Value 2,638,596 47.86
through Profit or Loss
Cash and cash equivalents* 3,458,319 62.73
Other Assets and Liabilities (583,655) (10.59)
Total Net Assets Attributable to Holders of Redeemable
Participating Shares 5,513,260 100.00
Analysis of Total Assets
Investment Funds 2,638,596 43.28
Cash and cash equivalents 3,458,319 56.72
Total Assets 6,096,915 100.00
*Cash and cash equivalents are held with The Bank Of New York
Mellon (AA-) (rating from Standard & Poor’s).
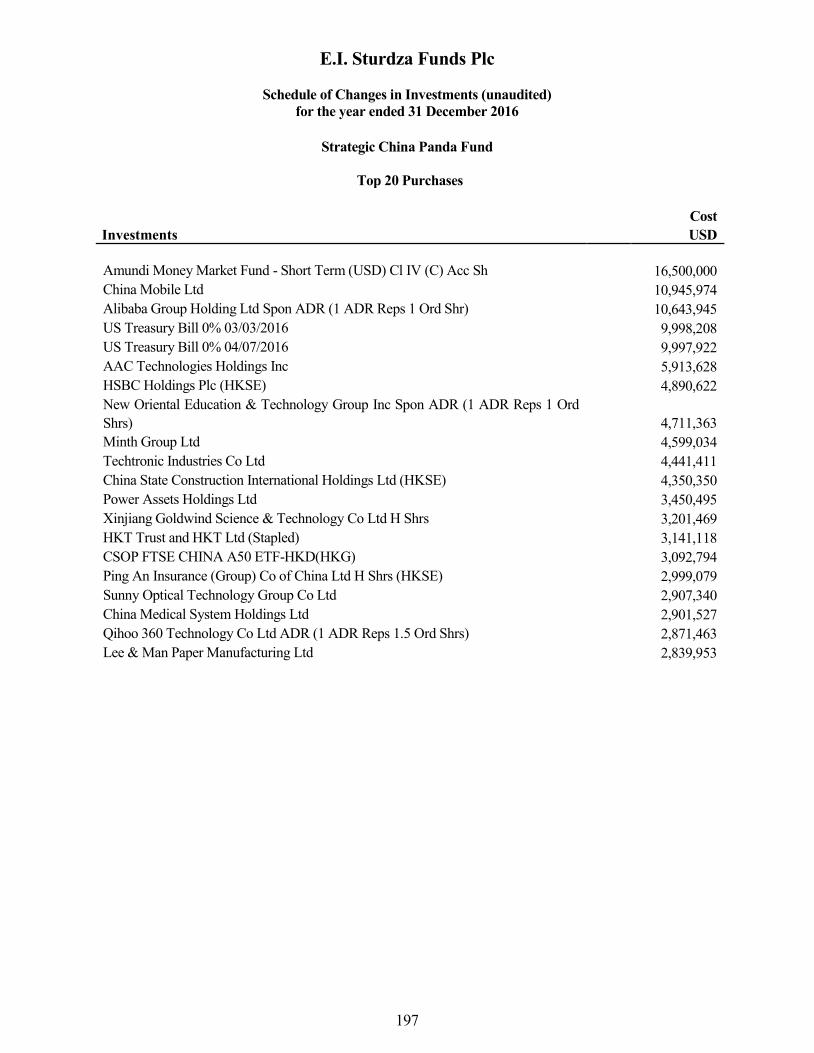
E.I. Sturdza Funds Plc
Schedule of Changes in Investments (unaudited)
for the year ended 31 December 2016
197
Strategic China Panda Fund
Top 20 Purchases
Investments
Cost
USD
Amundi Money Market Fund - Short Term (USD) Cl IV (C) Acc Sh 16,500,000
China Mobile Ltd 10,945,974
Alibaba Group Holding Ltd Spon ADR (1 ADR Reps 1 Ord Shr) 10,643,945
US Treasury Bill 0% 03/03/2016 9,998,208
US Treasury Bill 0% 04/07/2016 9,997,922
AAC Technologies Holdings Inc 5,913,628
HSBC Holdings Plc (HKSE) 4,890,622
New Oriental Education & Technology Group Inc Spon ADR (1 ADR Reps 1 Ord
Shrs)
4,711,363
Minth Group Ltd 4,599,034
Techtronic Industries Co Ltd 4,441,411
China State Construction International Holdings Ltd (HKSE) 4,350,350
Power Assets Holdings Ltd 3,450,495
Xinjiang Goldwind Science & Technology Co Ltd H Shrs 3,201,469
HKT Trust and HKT Ltd (Stapled) 3,141,118
CSOP FTSE CHINA A50 ETF-HKD(HKG) 3,092,794
Ping An Insurance (Group) Co of China Ltd H Shrs (HKSE) 2,999,079
Sunny Optical Technology Group Co Ltd 2,907,340
China Medical System Holdings Ltd 2,901,527
Qihoo 360 Technology Co Ltd ADR (1 ADR Reps 1.5 Ord Shrs) 2,871,463
Lee & Man Paper Manufacturing Ltd 2,839,953
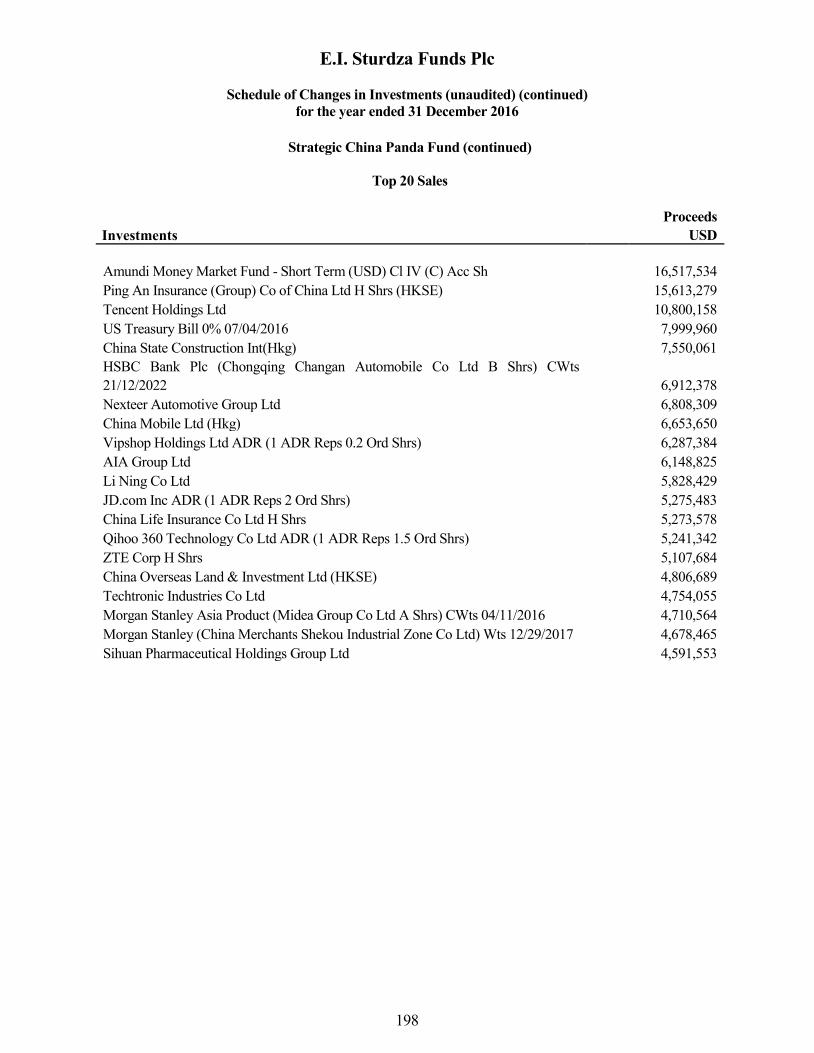
E.I. Sturdza Funds Plc
Schedule of Changes in Investments (unaudited) (continued)
for the year ended 31 December 2016
198
Strategic China Panda Fund (continued)
Top 20 Sales
Investments
Proceeds
USD
Amundi Money Market Fund - Short Term (USD) Cl IV (C) Acc Sh 16,517,534
Ping An Insurance (Group) Co of China Ltd H Shrs (HKSE) 15,613,279
Tencent Holdings Ltd 10,800,158
US Treasury Bill 0% 07/04/2016 7,999,960
China State Construction Int(Hkg) 7,550,061
HSBC Bank Plc (Chongqing Changan Automobile Co Ltd B Shrs) CWts
21/12/2022 6,912,378
Nexteer Automotive Group Ltd 6,808,309
China Mobile Ltd (Hkg) 6,653,650
Vipshop Holdings Ltd ADR (1 ADR Reps 0.2 Ord Shrs) 6,287,384
AIA Group Ltd 6,148,825
Li Ning Co Ltd 5,828,429
JD.com Inc ADR (1 ADR Reps 2 Ord Shrs) 5,275,483
China Life Insurance Co Ltd H Shrs 5,273,578
Qihoo 360 Technology Co Ltd ADR (1 ADR Reps 1.5 Ord Shrs) 5,241,342
ZTE Corp H Shrs 5,107,684
China Overseas Land & Investment Ltd (HKSE) 4,806,689
Techtronic Industries Co Ltd 4,754,055
Morgan Stanley Asia Product (Midea Group Co Ltd A Shrs) CWts 04/11/2016 4,710,564
Morgan Stanley (China Merchants Shekou Industrial Zone Co Ltd) Wts 12/29/2017 4,678,465
Sihuan Pharmaceutical Holdings Group Ltd 4,591,553

E.I. Sturdza Funds Plc
Schedule of Changes in Investments (unaudited) (continued)
for the year ended 31 December 2016
199
Strategic Euro Bond Fund
Top 20 Purchases
Investments
Cost
EUR
Sagess (BR) 0.625% 25/05/2023 4,990,400
Valeo 3.25% 22/01/2024 3,627,467
FCE Bank Plc (BR) 1.875% 18/04/2019 2,612,894
Total Capital Intl (BR) FRN 19/03/2020 2,507,740
Schlumberger Finance Fra (BR) 0.625% 12/02/2019 2,506,788
Proximus 2.375% 04/04/2024 2,282,072
RCI Banque (BR) 2.25% 29/03/2021 2,117,590
3M Co (REG) FRN 15/05/2020 2,007,000
Coca-Cola Co/The (REG) FRN 09/09/2019 2,005,400
General Electric Co (REG) FRN 28/05/2020 2,005,328
Anheuser-Busch Inbev FRN 29/03/2018 2,005,310
Temasek Financial I Ltd (REG) 0.5% 01/03/2022 1,986,720
Telstra Corp Ltd 3.5% 21/09/2022 1,197,394
ENI 4.25% 03/02/2020 1,151,925
Iberdrola Intl (BR) 2.875% 11/11/2020 1,124,703
Total Capital Intl (BR) 2.125 19/11/2021 1,108,925
American Honda Finance (REG) FRN 11/03/2019 1,004,036
DBR 0.0% 15/08/ 2026 964,780
Euro-Bobl Fut Mar 16 08/03/2016 587,038
Fortum (BR) 6% 20/03/2019 584,429

E.I. Sturdza Funds Plc
Schedule of Changes in Investments (unaudited) (continued)
for the year ended 31 December 2016
200
Strategic Euro Bond Fund (continued)
Top 20 Sales
Investments
Proceeds
EUR
KFW (BR) 0.125% 01/06/2020 7,119,719
RTE EDF Transport (BR) 2.875% 12/09/2023 5,864,566
Sagess (BR) 0.625% 25/05/2023 5,168,887
Nederlandse Gasunie 2.625% 13/07/2022 4,606,082
Valeo 3.25% 22/01/2024 3,656,837
Enel Finance International 1.375% 01/06/2026 3,513,253
Aeroports De Paris (BR) 1.5% 24/07/2023 3,253,849
Pepsico Inc 1.75% 28/04/2021 3,201,566
Neder Waterschapsbank (BR) 1.625% 23/08/2019 3,174,921
Rolls-Royce Plc 2.125% 18/06/2021 3,162,468
BOGAEI 3.625% 04/12/2017 EMTN 3,126,390
Toyota Motor Credit Corp (REG) 1% 10/09/2021 3,056,037
Syngenta Finance 1.875% 02/11/2021 3,049,291
Belgium Kingdom (Ser 58) 3.75% 28/09/2020 2,401,630
Deutsche Bahn Finance (BR) 3% 08/03/2024 2,388,878
Ireland (Govt of) Treasury (REG) 4.5% 18/04/2020 2,363,616
Proximus 2.375% 04/04/2024 2,317,526
Lvmh Moet Hennessy Vuitt (BR) 4% 06/04/2018 2,237,017
Oracle Corp 2.25% 10/01/2021 2,189,098
Teliasonera (BR) 4.75% 07/03/2017 2,094,479

E.I. Sturdza Funds Plc
Schedule of Changes in Investments (unaudited) (continued)
for the year ended 31 December 2016
201
Nippon Growth (UCITS) Fund
Top 20 Purchases
Investments
Cost
JPY
SCSK Corp 90,954,544
Shimadzu Corp 90,553,062
Seibu Holdings Inc 50,982,601
Mitsubishi Motors Corp (Tyo) 41,592,390
Kobe Steel Ltd(Tyo) 40,069,716
Fujitsu Ltd 38,529,894
Mitsubishi Corp 22,854,211
Sumitomo Metal Mining Co Ltd(Tyo) 18,465,296
Otsuka Corp 8,513,273
H.I.S Co Ltd 7,820,460

E.I. Sturdza Funds Plc
Schedule of Changes in Investments (unaudited) (continued)
for the year ended 31 December 2016
202
Nippon Growth (UCITS) Fund (continued)
Top 20 Sales
Investments
Proceeds
JPY
Fujifilm Holdings Corp 912,091,225
Itochu Corp 88,8525,996
Sumitomo Mitsui Trust Holdings Inc 762,690,670
Mitsubishi UFJ Financial Group Inc 753,488,450
Mizuho Financial Group Inc 725,371,097
Sumitomo Mitsui Financial Group Inc 725,048,494
Tokyu Fudosan Holdings Corp 590,016,198
Otsuka Corp 567,611,663
NEC Corp 550,201,910
Tokyu Corp 544,247,201
Taisei Corp 505,223,370
Tokyo Tatemono Co Ltd 481,610,372
Marubeni Corp 443,785,419
H.I.S Co Ltd 424,867,057
Nomura Holdings Inc 413,712,566
Nabtesco Corp 402,579,014
Toyo Engineering Corp 396,790,231
Sumitomo Realty & Development Co Ltd 365,174,355
Makino Milling Machine Co Ltd 324,373,163
Toyota Motor Corp 319,763,244

E.I. Sturdza Funds Plc
Schedule of Changes in Investments (unaudited) (continued)
for the year ended 31 December 2016
203
Strategic Europe Value Fund
Top 20 Purchases
Investments
Cost
EUR
SAP 49,542,314
Fresenius Medical Care 48,156,412
Wirecard 46,580,106
Philip Morris International Inc 45,025,483
Visa Inc - Cl A Shrs 41,697,482
UBS Group 40,106,518
Snam 39,925,828
SES FDR (1 FDR Reps 1 Ord Shr) (ENXP) 38,923,458
NN GROUP NV(EOE) 38,625,315
Worldpay Group Plc 36,297,507
Legal & General Group Plc(Lse) 36,214,192
Barclays Plc [Lse] 35,829,075
CTS Eventim 35,197,732
Danone 34,990,241
Novo Nordisk Cl B 34,082,474
Pandora 33,924,424
Red Electrica Corporacion 33,323,230
Shire Plc 32,681,634
Koninklijke Ahold Delhaize N 30,339,526
British American Tobacco Plc 29,987,789

E.I. Sturdza Funds Plc
Schedule of Changes in Investments (unaudited) (continued)
for the year ended 31 December 2016
204
Strategic Europe Value Fund (continued)
Top 20 Sales
Investments
Proceeds
EUR
Visa Inc - Cl A Shrs 55,956,993
Unilever Plc 49,653,177
Bayer - REG 48,874,648
Reckitt Benckiser Group Plc 40,574,920
UBS Group 37,568,049
Novartis (REG) 35,112,641
Reynolds American Inc 34,743,890
Swedish Match 34,577,641
SAP 34,525,315
Paysafe Group Plc 33,586,912
Anheuser-Busch InBev 32,718,539
Sage Group Plc (The) 32,336,275
Pandora 31,469,100
InterContinental Hotels Group Plc 31,137,757
Shire Plc 30,613,914
Amadeus IT Group 28,514,076
Novo Nordisk Cl B 27,817,799
SNAM SPA 27,750,531
Henkel AG & Co KGaA 26,511,995
Cerved Information Solutions 25,315,667
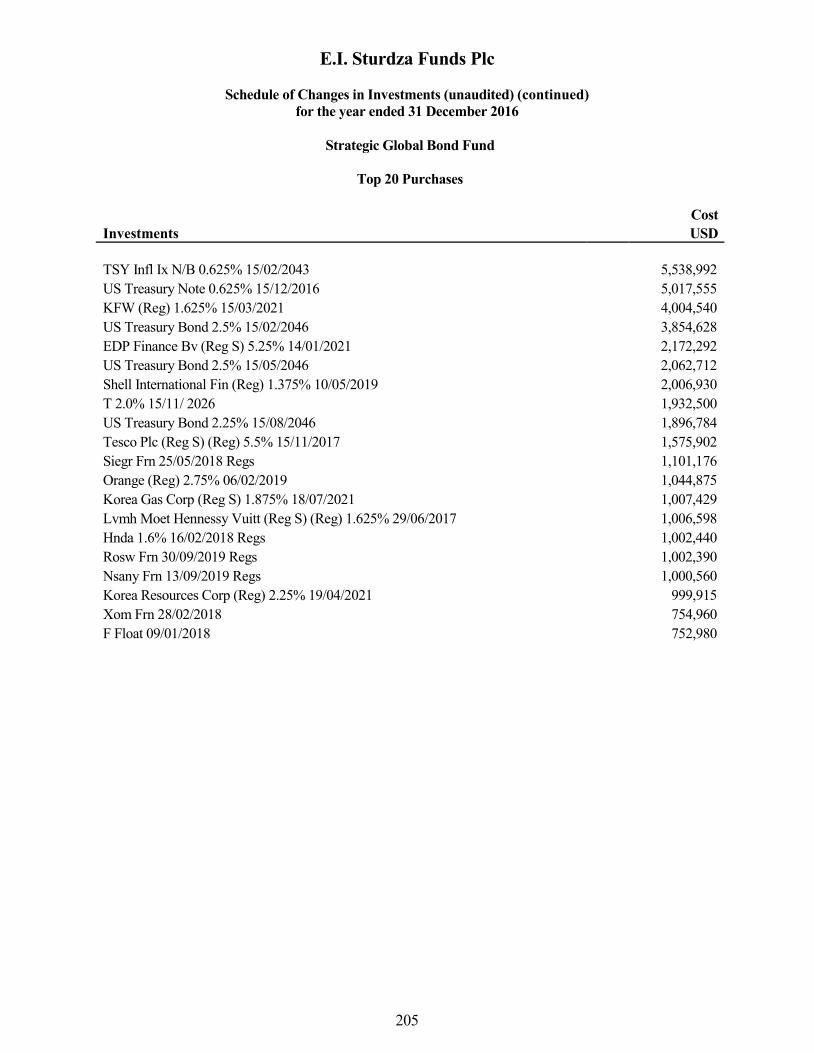
E.I. Sturdza Funds Plc
Schedule of Changes in Investments (unaudited) (continued)
for the year ended 31 December 2016
205
Strategic Global Bond Fund
Top 20 Purchases
Investments
Cost
USD
TSY Infl Ix N/B 0.625% 15/02/2043 5,538,992
US Treasury Note 0.625% 15/12/2016 5,017,555
KFW (Reg) 1.625% 15/03/2021 4,004,540
US Treasury Bond 2.5% 15/02/2046 3,854,628
EDP Finance Bv (Reg S) 5.25% 14/01/2021 2,172,292
US Treasury Bond 2.5% 15/05/2046 2,062,712
Shell International Fin (Reg) 1.375% 10/05/2019 2,006,930
T 2.0% 15/11/ 2026 1,932,500
US Treasury Bond 2.25% 15/08/2046 1,896,784
Tesco Plc (Reg S) (Reg) 5.5% 15/11/2017 1,575,902
Siegr Frn 25/05/2018 Regs 1,101,176
Orange (Reg) 2.75% 06/02/2019 1,044,875
Korea Gas Corp (Reg S) 1.875% 18/07/2021 1,007,429
Lvmh Moet Hennessy Vuitt (Reg S) (Reg) 1.625% 29/06/2017 1,006,598
Hnda 1.6% 16/02/2018 Regs 1,002,440
Rosw Frn 30/09/2019 Regs 1,002,390
Nsany Frn 13/09/2019 Regs 1,000,560
Korea Resources Corp (Reg) 2.25% 19/04/2021 999,915
Xom Frn 28/02/2018 754,960
F Float 09/01/2018 752,980
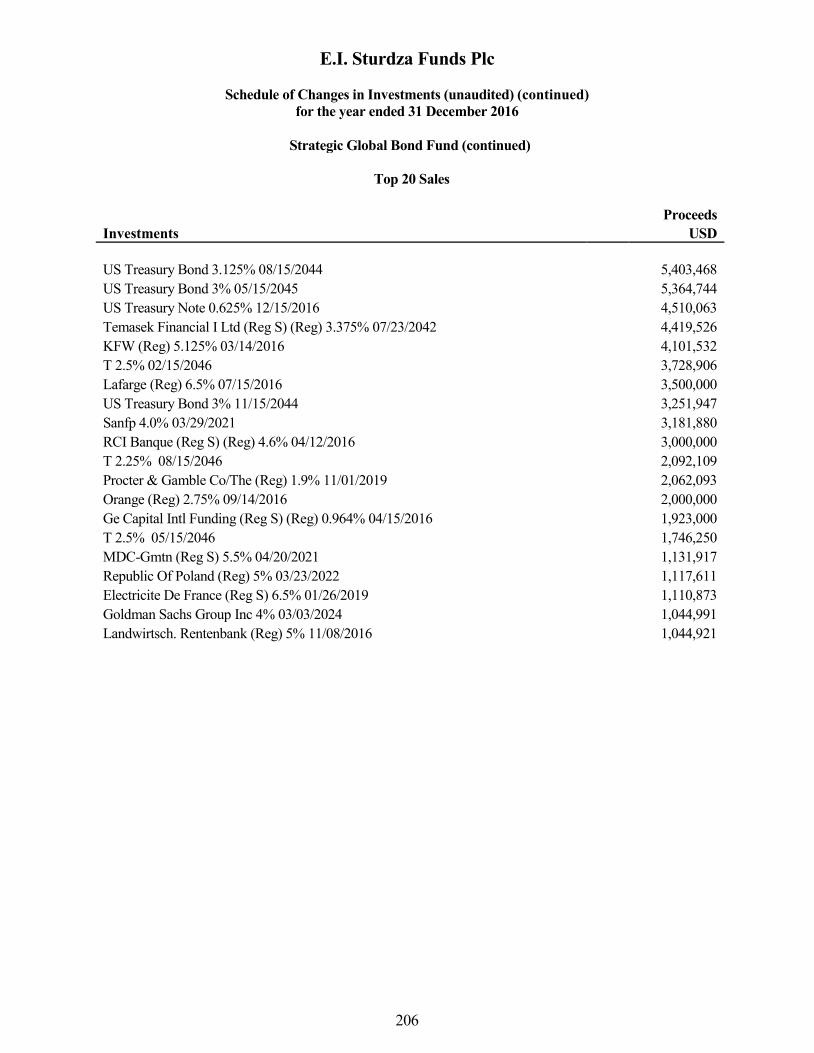
E.I. Sturdza Funds Plc
Schedule of Changes in Investments (unaudited) (continued)
for the year ended 31 December 2016
206
Strategic Global Bond Fund (continued)
Top 20 Sales
Investments
Proceeds
USD
US Treasury Bond 3.125% 08/15/2044 5,403,468
US Treasury Bond 3% 05/15/2045 5,364,744
US Treasury Note 0.625% 12/15/2016 4,510,063
Temasek Financial I Ltd (Reg S) (Reg) 3.375% 07/23/2042 4,419,526
KFW (Reg) 5.125% 03/14/2016 4,101,532
T 2.5% 02/15/2046 3,728,906
Lafarge (Reg) 6.5% 07/15/2016 3,500,000
US Treasury Bond 3% 11/15/2044 3,251,947
Sanfp 4.0% 03/29/2021 3,181,880
RCI Banque (Reg S) (Reg) 4.6% 04/12/2016 3,000,000
T 2.25% 08/15/2046 2,092,109
Procter & Gamble Co/The (Reg) 1.9% 11/01/2019 2,062,093
Orange (Reg) 2.75% 09/14/2016 2,000,000
Ge Capital Intl Funding (Reg S) (Reg) 0.964% 04/15/2016 1,923,000
T 2.5% 05/15/2046 1,746,250
MDC-Gmtn (Reg S) 5.5% 04/20/2021 1,131,917
Republic Of Poland (Reg) 5% 03/23/2022 1,117,611
Electricite De France (Reg S) 6.5% 01/26/2019 1,110,873
Goldman Sachs Group Inc 4% 03/03/2024 1,044,991
Landwirtsch. Rentenbank (Reg) 5% 11/08/2016 1,044,921
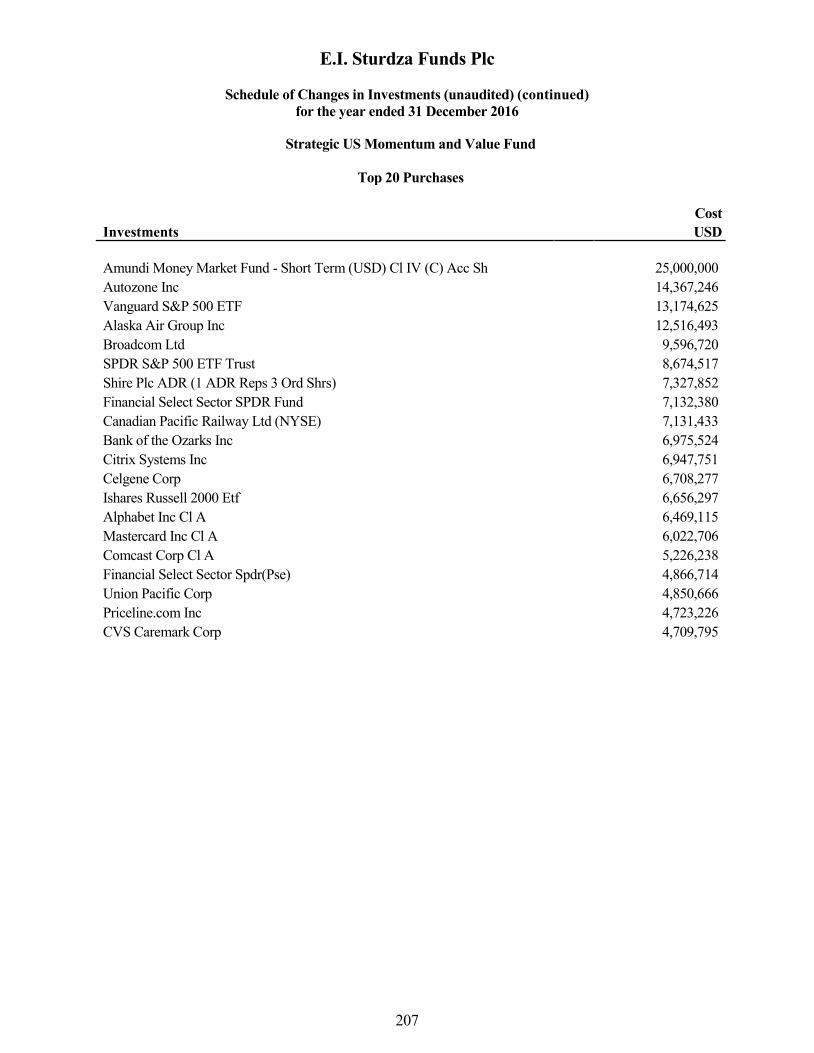
E.I. Sturdza Funds Plc
Schedule of Changes in Investments (unaudited) (continued)
for the year ended 31 December 2016
207
Strategic US Momentum and Value Fund
Top 20 Purchases
Investments
Cost
USD
Amundi Money Market Fund - Short Term (USD) Cl IV (C) Acc Sh 25,000,000
Autozone Inc 14,367,246
Vanguard S&P 500 ETF 13,174,625
Alaska Air Group Inc 12,516,493
Broadcom Ltd 9,596,720
SPDR S&P 500 ETF Trust 8,674,517
Shire Plc ADR (1 ADR Reps 3 Ord Shrs) 7,327,852
Financial Select Sector SPDR Fund 7,132,380
Canadian Pacific Railway Ltd (NYSE) 7,131,433
Bank of the Ozarks Inc 6,975,524
Citrix Systems Inc 6,947,751
Celgene Corp 6,708,277
Ishares Russell 2000 Etf 6,656,297
Alphabet Inc Cl A 6,469,115
Mastercard Inc Cl A 6,022,706
Comcast Corp Cl A 5,226,238
Financial Select Sector Spdr(Pse) 4,866,714
Union Pacific Corp 4,850,666
Priceline.com Inc 4,723,226
CVS Caremark Corp 4,709,795
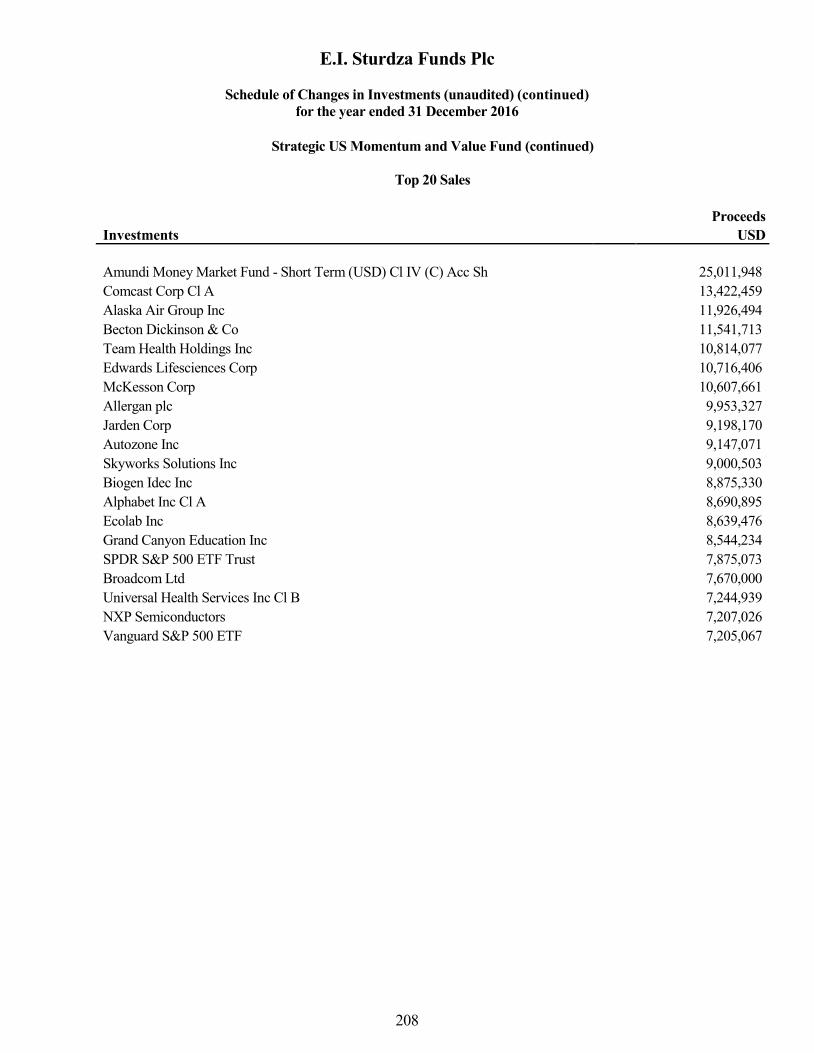
E.I. Sturdza Funds Plc
Schedule of Changes in Investments (unaudited) (continued)
for the year ended 31 December 2016
208
Strategic US Momentum and Value Fund (continued)
Top 20 Sales
Investments
Proceeds
USD
Amundi Money Market Fund - Short Term (USD) Cl IV (C) Acc Sh 25,011,948
Comcast Corp Cl A 13,422,459
Alaska Air Group Inc 11,926,494
Becton Dickinson & Co 11,541,713
Team Health Holdings Inc 10,814,077
Edwards Lifesciences Corp 10,716,406
McKesson Corp 10,607,661
Allergan plc 9,953,327
Jarden Corp 9,198,170
Autozone Inc 9,147,071
Skyworks Solutions Inc 9,000,503
Biogen Idec Inc 8,875,330
Alphabet Inc Cl A 8,690,895
Ecolab Inc 8,639,476
Grand Canyon Education Inc 8,544,234
SPDR S&P 500 ETF Trust 7,875,073
Broadcom Ltd 7,670,000
Universal Health Services Inc Cl B 7,244,939
NXP Semiconductors 7,207,026
Vanguard S&P 500 ETF 7,205,067

E.I. Sturdza Funds Plc
Schedule of Changes in Investments (unaudited) (continued)
for the year ended 31 December 2016
209
Strategic Global Quality Fund
Top 20 Purchases
Investments
Cost
USD
Philip Morris International Inc 4,648,178
Mastercard Inc Cl A 4,315,822
Nestle Reg Shrs 3,211,620
SAP 3,119,194
Microsoft Corp 2,953,763
Kao Corp 2,911,881
Visa Inc - Cl A Shrs 2,782,295
Fresenius Medical Care 2,743,567
Shire Plc 2,708,206
Smith & Nephew Plc 2,669,921
Wirecard 2,614,905
Clorox Co/The 2,599,357
Altria Group Inc 2,475,214
Heineken Holding 2,418,256
Japan Tobacco Inc 2,327,245
Medtronic Plc 2,298,347
Diageo Plc 2,261,992
H&R Block Inc 2,255,415
International Flavors & Fragrances Inc 2,212,362
Svenska Cellulosa B Shrs 2,210,298

E.I. Sturdza Funds Plc
Schedule of Changes in Investments (unaudited) (continued)
for the year ended 31 December 2016
210
Strategic Global Quality Fund (continued)
Top 20 Sales
Investments
Proceeds
USD
Japan Tobacco Inc 2,826,357
Microsoft Corp 2,559,730
Mastercard Inc Cl A 2,485,612
Unilever Plc [Lse] 2,115,264
Anheuser-Busch Inbev Adr (1 Adr Rep 1 Com Shr) 2,077,165
Reynolds American Inc 1,896,752
Reckitt Benckiser Group Plc 1,880,160
Sage Group Plc (The) 1,867,747
H&R Block Inc 1,798,215
Philip Morris International 1,134,190
Visa Inc - Cl A Shrs 975,755
Svenska Cellulosa B Shrs 925,264
Nestle Sa-Reg(Vtx) 913,473
Shire Plc 873,761
Sap Se(Ger) 633,663
Beiersdorf Ag 501,610
Altria Group Inc 488,357
Qiagen 473,889
Alphabet Inc Cl C 471,161
Mead Johnson Nutrition Co 404,125
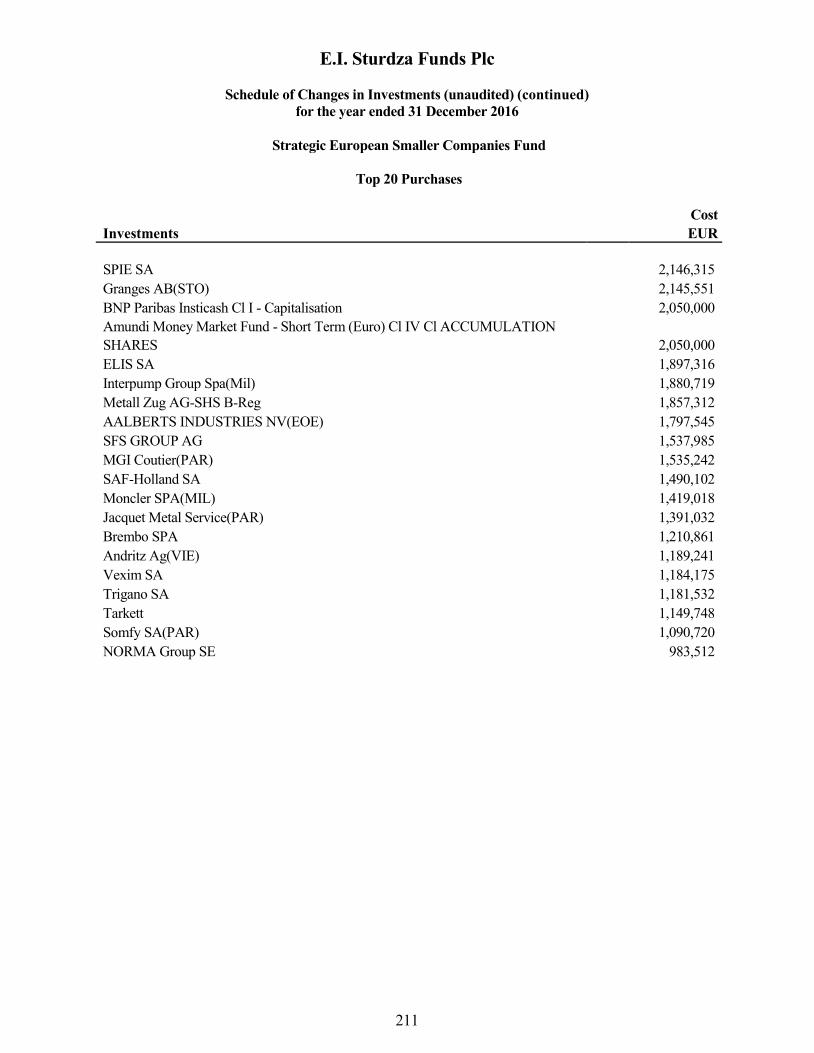
E.I. Sturdza Funds Plc
Schedule of Changes in Investments (unaudited) (continued)
for the year ended 31 December 2016
211
Strategic European Smaller Companies Fund
Top 20 Purchases
Investments
Cost
EUR
SPIE SA 2,146,315
Granges AB(STO) 2,145,551
BNP Paribas Insticash Cl I - Capitalisation 2,050,000
Amundi Money Market Fund - Short Term (Euro) Cl IV Cl ACCUMULATION
SHARES 2,050,000
ELIS SA 1,897,316
Interpump Group Spa(Mil) 1,880,719
Metall Zug AG-SHS B-Reg 1,857,312
AALBERTS INDUSTRIES NV(EOE) 1,797,545
SFS GROUP AG 1,537,985
MGI Coutier(PAR) 1,535,242
SAF-Holland SA 1,490,102
Moncler SPA(MIL) 1,419,018
Jacquet Metal Service(PAR) 1,391,032
Brembo SPA 1,210,861
Andritz Ag(VIE) 1,189,241
Vexim SA 1,184,175
Trigano SA 1,181,532
Tarkett 1,149,748
Somfy SA(PAR) 1,090,720
NORMA Group SE 983,512
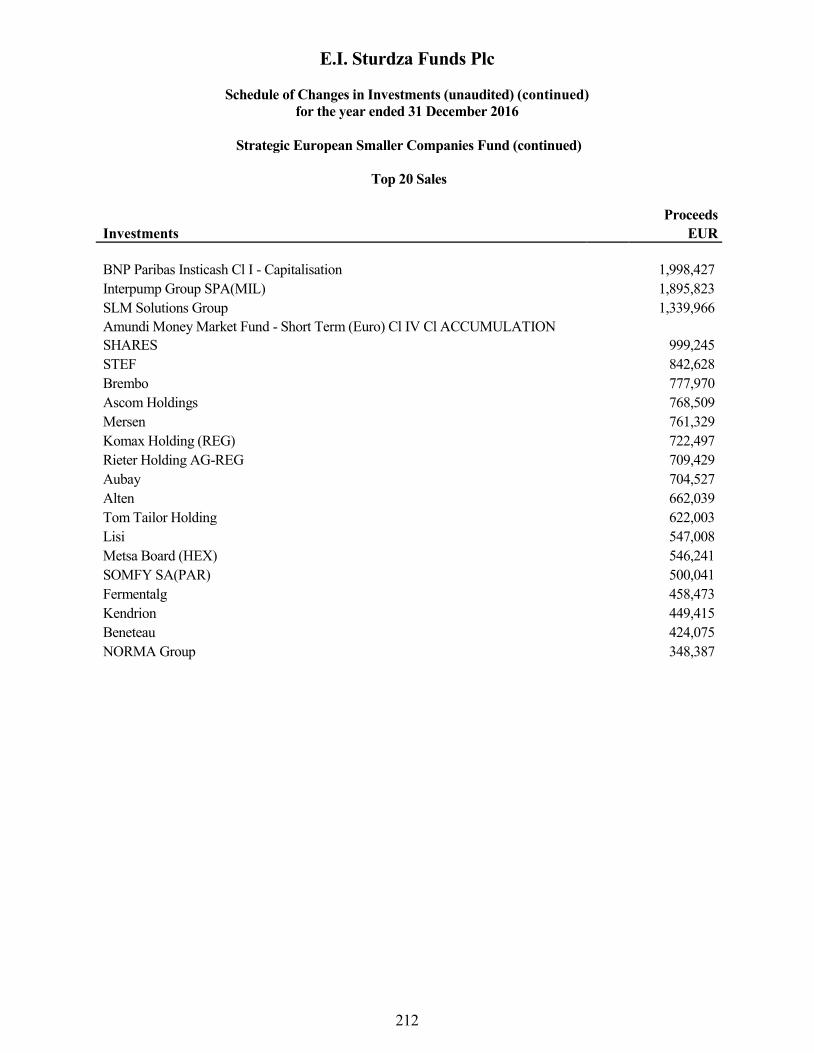
E.I. Sturdza Funds Plc
Schedule of Changes in Investments (unaudited) (continued)
for the year ended 31 December 2016
212
Strategic European Smaller Companies Fund (continued)
Top 20 Sales
Investments
Proceeds
EUR
BNP Paribas Insticash Cl I - Capitalisation 1,998,427
Interpump Group SPA(MIL) 1,895,823
SLM Solutions Group 1,339,966
Amundi Money Market Fund - Short Term (Euro) Cl IV Cl ACCUMULATION
SHARES 999,245
STEF 842,628
Brembo 777,970
Ascom Holdings 768,509
Mersen 761,329
Komax Holding (REG) 722,497
Rieter Holding AG-REG 709,429
Aubay 704,527
Alten 662,039
Tom Tailor Holding 622,003
Lisi 547,008
Metsa Board (HEX) 546,241
SOMFY SA(PAR) 500,041
Fermentalg 458,473
Kendrion 449,415
Beneteau 424,075
NORMA Group 348,387
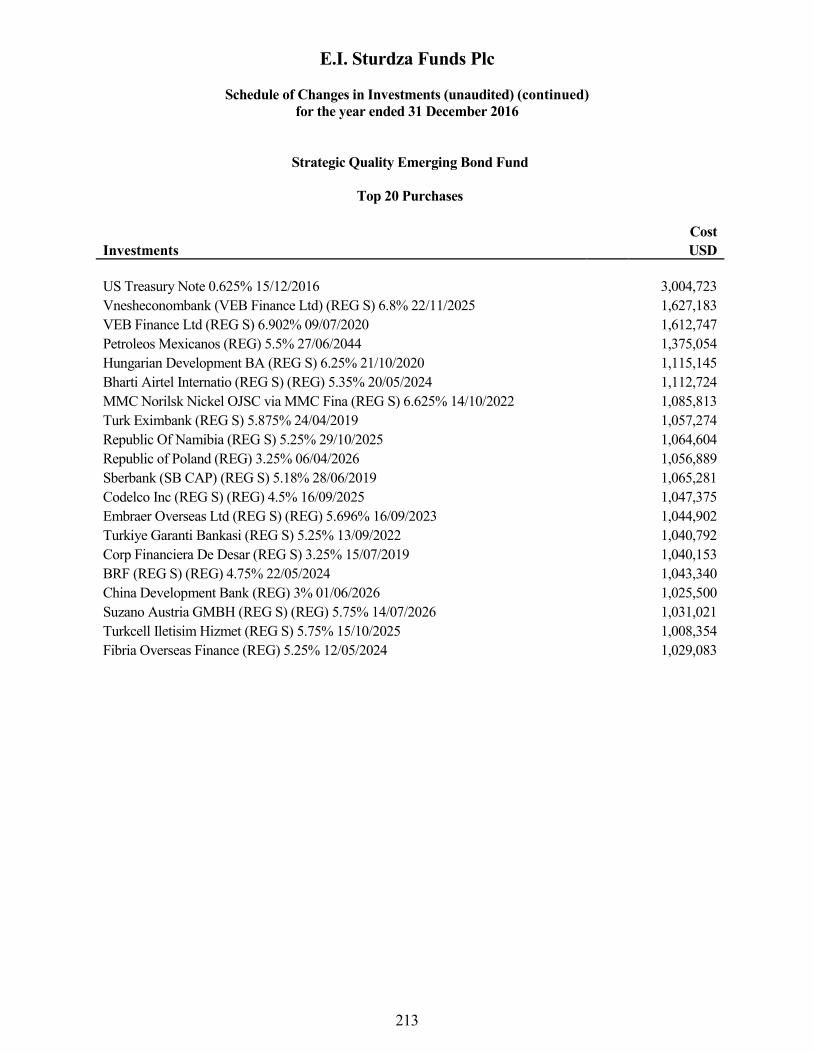
E.I. Sturdza Funds Plc
Schedule of Changes in Investments (unaudited) (continued)
for the year ended 31 December 2016
213
Strategic Quality Emerging Bond Fund
Top 20 Purchases
Investments
Cost
USD
US Treasury Note 0.625% 15/12/2016 3,004,723
Vnesheconombank (VEB Finance Ltd) (REG S) 6.8% 22/11/2025 1,627,183
VEB Finance Ltd (REG S) 6.902% 09/07/2020 1,612,747
Petroleos Mexicanos (REG) 5.5% 27/06/2044 1,375,054
Hungarian Development BA (REG S) 6.25% 21/10/2020 1,115,145
Bharti Airtel Internatio (REG S) (REG) 5.35% 20/05/2024 1,112,724
MMC Norilsk Nickel OJSC via MMC Fina (REG S) 6.625% 14/10/2022 1,085,813
Turk Eximbank (REG S) 5.875% 24/04/2019 1,057,274
Republic Of Namibia (REG S) 5.25% 29/10/2025 1,064,604
Republic of Poland (REG) 3.25% 06/04/2026 1,056,889
Sberbank (SB CAP) (REG S) 5.18% 28/06/2019 1,065,281
Codelco Inc (REG S) (REG) 4.5% 16/09/2025 1,047,375
Embraer Overseas Ltd (REG S) (REG) 5.696% 16/09/2023 1,044,902
Turkiye Garanti Bankasi (REG S) 5.25% 13/09/2022 1,040,792
Corp Financiera De Desar (REG S) 3.25% 15/07/2019 1,040,153
BRF (REG S) (REG) 4.75% 22/05/2024 1,043,340
China Development Bank (REG) 3% 01/06/2026 1,025,500
Suzano Austria GMBH (REG S) (REG) 5.75% 14/07/2026 1,031,021
Turkcell Iletisim Hizmet (REG S) 5.75% 15/10/2025 1,008,354
Fibria Overseas Finance (REG) 5.25% 12/05/2024 1,029,083

E.I. Sturdza Funds Plc
Schedule of Changes in Investments (unaudited) (continued)
for the year ended 31 December 2016
214
Strategic Quality Emerging Bond Fund (continued)
Top 20 Sales
Investments
Proceeds
USD
US Treasury Note 0.625% 15/12/2016 2,002,973
Turkiye Garanti Bankasi (REG S) 5.25% 13/09/2022 1,722,547
VEB Finance Ltd (REG S) 6.902% 09/07/2020 1,613,610
Turk Eximbank (REG S) 5.875% 24/04/2019 1,569,248
ESKOM 5.75% 26/01/2021 REGS 1,487,100
Croatia (REGS) (REG) 6.375% 24/03/2021 1,120,365
T 2.5% 15/05/2046 933,008
GAZPRU 8.625% 28/04/2034 REGS 633,336
Namibia International Bo (REG S) (REG) 5.5% 03/11/2021 546,035
Banco Nac De Desen Econo (REG S) (REG) 5.5% 12/07/2020 525,611
Russian Railways 5.739% 03/04/2017 517,035
Phosagro OAO via Phosagro Bond Fund (REG S) (REG) 4.204% 13/02/2018 514,589
Turkcell Iletisim Hizmet (REG S) 5.75% 15/10/2025 503,576
TII I/L 0.625% 15/02/2043 479,701
Anadolu Efes (REG S) (REG) 3.375% 01/11/2022 434,761
VEBBNK 6.8% 22/11/2025 REGS 266,875
African Export - Import BA (REG) 4% 24/05/2021 198,389

E.I. Sturdza Funds Plc
Schedule of Changes in Investments (unaudited) (continued)
for the year ended 31 December 2016
215
Strategic Beta Flex Fund
Top 20 Purchase
Investments
Cost
EUR
Fidelity Fds-Euro Grow-Yacc 892,000
Via Smart-Equit Eur-Inst Eur 743,000
Fidelity Fd-Eur Dyn G-Y Acc 496,000
E.I.Sturdza-Strat Eur Vl-Ei 495,999
Strategic Beta Flex Fund
Top 20 Sales
Investments
Proceeds
EUR
No sales during the period
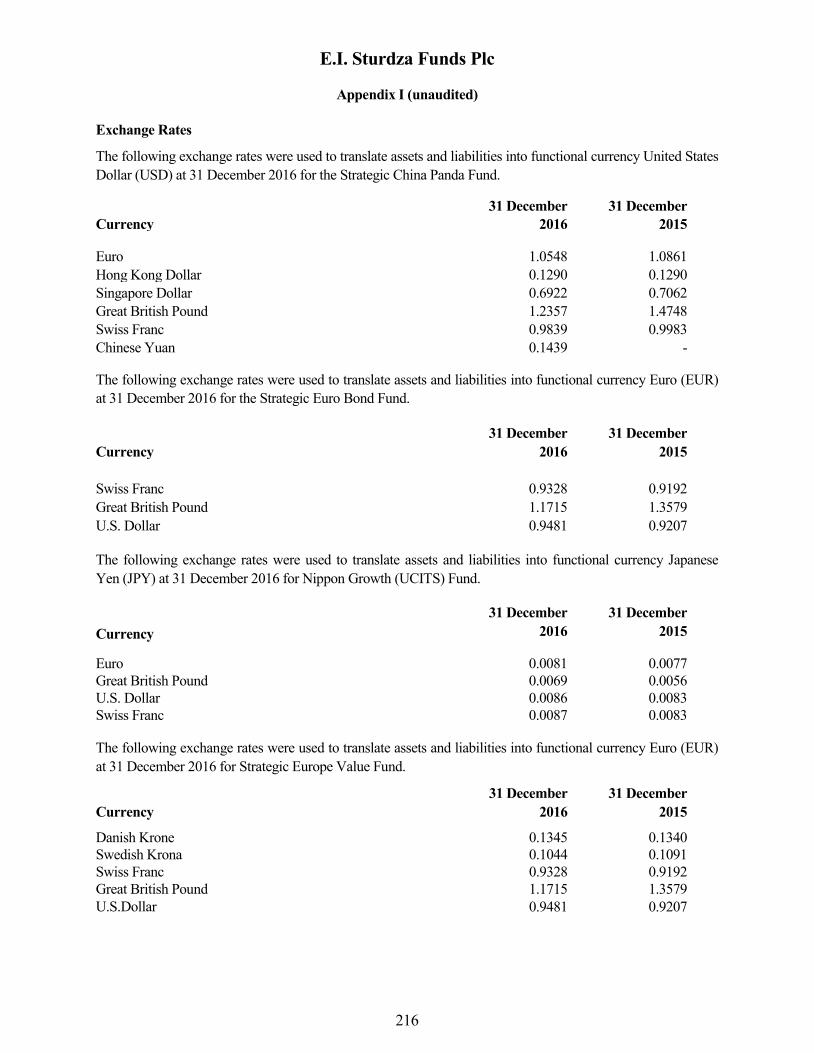
E.I. Sturdza Funds Plc
Appendix I (unaudited)
216
Exchange Rates
The following exchange rates were used to translate assets and liabilities into functional currency United States
Dollar (USD) at 31 December 2016 for the Strategic China Panda Fund.
31 December 31 December
Currency 2016 2015
Euro 1.0548 1.0861
Hong Kong Dollar 0.1290 0.1290
Singapore Dollar 0.6922 0.7062
Great British Pound 1.2357 1.4748
Swiss Franc 0.9839 0.9983
Chinese Yuan 0.1439 -
The following exchange rates were used to translate assets and liabilities into functional currency Euro (EUR)
at 31 December 2016 for the Strategic Euro Bond Fund.
31 December 31 December
Currency 2016 2015
Swiss Franc 0.9328 0.9192
Great British Pound 1.1715 1.3579
U.S. Dollar 0.9481 0.9207
The following exchange rates were used to translate assets and liabilities into functional currency Japanese
Yen (JPY) at 31 December 2016 for Nippon Growth (UCITS) Fund.
31 December 31 December
Currency 2016 2015
Euro 0.0081 0.0077
Great British Pound 0.0069 0.0056
U.S. Dollar 0.0086 0.0083
Swiss Franc 0.0087 0.0083
The following exchange rates were used to translate assets and liabilities into functional currency Euro (EUR)
at 31 December 2016 for Strategic Europe Value Fund.
31 December 31 December
Currency 2016 2015
Danish Krone 0.1345 0.1340
Swedish Krona 0.1044 0.1091
Swiss Franc 0.9328 0.9192
Great British Pound 1.1715 1.3579
U.S.Dollar 0.9481 0.9207

E.I. Sturdza Funds Plc
Appendix I (unaudited) (continued)
217
Exchange Rates (continued)
The following exchange rates were used to translate assets and liabilities into functional currency United
States Dollar (USD) at 31 December 2016 for Strategic Global Bond Fund.
31 December 31 December
Currency 2016 2015
Euro 1.0548 1.0861
Swiss Franc 0.9839 0.9983
Great British Pound 1.2357 1.4748
China Renminbi Offshore 0.1435 -
The following exchange rates were used to translate assets and liabilities into functional currency United
States Dollar (USD) at 31 December 2016 for Strategic US Momentum and Value Fund.
31 December 31 December
Currency 2016 2015
Euro 1.0548 1.0861
Swiss Franc 0.9839 0.9983
Great British Pound 1.2357 1.4748
Canadian Dollar 0.7457 -
The following exchange rates were used to translate assets and liabilities into functional currency United
States Dollar (USD) at 31 December 2016 for Strategic Global Quality Fund.
31 December 31 December
Currency 2016 2015
Swiss Franc 0.9839 0.9983
Great British Pound 1.2357 1.4748
Danish Krone 0.1419 0.1455
Japanese Yen 0.0086 0.0083
Euro 1.0548 1.0861
Swedish Krona 0.1101 -
The following exchange rates were used to translate assets and liabilities into functional currency Euro
(EUR) at 31 December 2016 for Strategic European Smaller Companies Fund.
31 December 31 December
Currency 2016 2015
Swiss Franc 0.9328 0.9192
Great British Pound 1.1715 1.3579
U.S. Dollar 0.9481 0.9207
Swedish Krona 0.1044 -
Danish Krone 0.1345 -
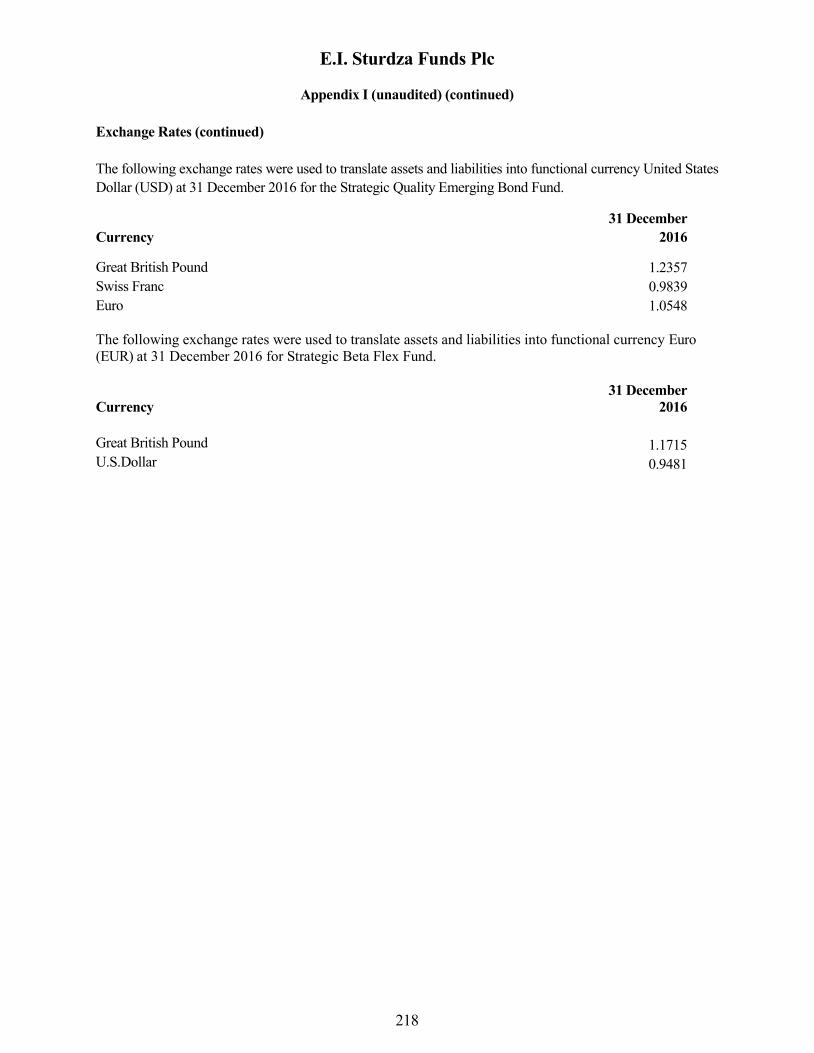
E.I. Sturdza Funds Plc
Appendix I (unaudited) (continued)
218
Exchange Rates (continued)
The following exchange rates were used to translate assets and liabilities into functional currency United States
Dollar (USD) at 31 December 2016 for the Strategic Quality Emerging Bond Fund.
31 December
Currency 2016
Great British Pound 1.2357
Swiss Franc 0.9839
Euro 1.0548
The following exchange rates were used to translate assets and liabilities into functional currency Euro
(EUR) at 31 December 2016 for Strategic Beta Flex Fund.
31 December
Currency 2016
Great British Pound 1.1715
U.S.Dollar 0.9481
E.I. Sturdza Funds Plc
Appendix I (unaudited) (continued)
219
Soft Commission Arrangements
The Investment Manager has entered into soft commission arrangements with brokers in respect of which
certain goods and services used to support the investment decision process were received. The Investment
Manager does not make direct payment for these services but does transact an agreed amount of business
with the brokers on behalf of the Company and commission is paid on these transactions. The Investment
Manager considers these arrangements are to the benefit of the Company and has satisfied itself that it
obtains best execution on behalf of the Company and the brokerage rates are not in excess of customary
institutional full service brokerage rates.
The Strategic China Panda Fund has entered into an Agreement with CIMB. The Strategic Europe Value
Fund has entered into an Agreement with Bloomberg CSA. The Strategic US Momentum and Value Fund
has entered into Agreements with Knight Capital Europe Limited and Bloomberg Tradebook Europe
Limited. The Strategic Global Quality Fund has entered into Agreements with Bloomberg CSA.
As at 31 December 2016, Strategic China Panda Fund held the below balance in accordance with the
Agreement:
CIMB HKD 153,683 (31 December 2015: HKD 41,571)
As at 31 December 2016, Strategic US Momentum and Value Fund held the below balances in
accordance with the Agreements:
Knight Capital Europe Limited USD 491 (31 December 2015: USD 16,581)
Bloomberg Tradebook Europe USD 14,920 (31 December 2015: USD 26,576)
The balances of Strategic Europe Value Fund and Strategic Global Quality Fund are co-mingled. As at
31 December 2016, the below combined balances were held in accordance with the Agreements:
Bloomberg Tradebook EUR 81,602.49 (31 December 2015: EUR 46,296)
JP Morgan EUR 52,042 (31 December 2015: EUR 24,671)

E.I. Sturdza Funds Plc
Appendix I (unaudited) (continued)
220
Strategic
China
Panda
Fund
Strategic
Euro
Bond
Fund
Nippon
Growth
(UCITS)
Fund
Strategic
Europe
Value
Fund
Strategic
Global
Bond
Fund
2016 2016 2016 2016 2016
USD EUR JPY EUR USD
Net Asset Value
USD Class 40,377,562 - - 1,228,751 48,833
Euro Class - - - 296,170,540 -
Hedged Euro Class 17,104,180 - 526,742,253 - -
Hedged Sterling Class 359,828 - - - -
Euro Distributing Class - 2,877,227 - - -
Euro Accumulating Class - 33,336,303 - - -
EUR Institutional Distributing
Class
-
- - 21,646,400 -
JPY Class A - - 87,187,956 - -
JPY Class B - - 2,544,673,217 - -
JPY Class C - - - - -
JPY Class D Institutional - - 663,388,197 - -
EUR Institutional Class - 23,273,371 - 389,523,920 -
EUR Super Institutional Class - - - 150,532,155 -
CHF Accumulating Class - 12,867,848 - - -
CHF Class - - - 43,039,890 -
GBP Hedged Institutional Class - - - - -
GBP Institutional Class - - - 15,687,500 -
Euro Hedged Institutional Class 2,138,787 - 373,661,452 - -
USD Institutional Class 32,148,781 - - 2,014,039 -
Euro Retail Class - - - 8,087,869 -
RMB Class - - - - 123,591
USD Super Institutional Class - - - 2,180,352 -
Strategic
US
Momentum
and Value
Fund
Strategic
European
Smaller
Companies
Fund
Strategic
Global
Qualtiy
Bond Fund
Strategic
Quality
Emerging
Bond
Fund
Strategic
Beta
Flex
Fund
2016 2016 2016 2016 2016
USD EUR USD USD EUR
Net Asset Value
USD Class 170,985,523 - 16,852,874 19,563,348 -
Euro Class - 54,493,724 - 12,374,594 5,513,253
Euro Class X - 10,745,325 - - -
CHF Class - - 6,780,197 9,986,467 -
Hedged Euro Class 2,180,003 - - - -
Hedged CHF Class 6,981,169 - - - -
USD Institutional Class 34,115,042 - 36,031,626 6,327,945 -
EUR Institutional Class - - - 3,163,464 -

E.I. Sturdza Funds Plc
Appendix I (unaudited) (continued)
221
Strategic
China
Panda
Fund
Strategic
Euro
Bond
Fund
Nippon
Growth
(UCITS)
Fund
Strategic
Europe
Value
Fund
Strategic
Global
Bond
Fund
2016 2016 2016 2016 2016
USD EUR JPY EUR USD
Net asset value per share
USD Class US$2,180.71 - - US$99.95 US$1,043.66
Euro Class - - - €195.56 -
Hedged Euro Class €2,086.78 - €1,042.82 - -
Hedged Sterling Class £2,122.58 - - - -
Euro Distributing Class - €1,015.15 - - -
Euro Accumulating Class - €1,138.40 - - -
EUR Institutional Distributing
Class - - - €93.36 -
JPY Class A - - JPY98,673 - -
JPY Class B - - JPY82,755 - -
JPY Class C - - - - -
JPY Class D Institutional - - JPY53,913 - -
EUR Institutional Class - €1,018.29 - €171.77 -
EUR Super Institutional Class - - - €94.62 -
CHF Accumulating Class - CHF980.13 - - -
CHF Class - - - CHF153.71 -
GBP Hedged Institutional Class - - - - -
GBP Institutional Class - - - £125.88 -
Euro Hedged Institutional Class €905.22 - €1,231.20 - -
USD Institutional Class US$840.79 - - US$91.74 -
Euro Retail Class - - - €92.11 -
RMB Class - - - - US$1,004.89
USD Super Institutional Class - - - US$94.87 -
Strategic
US
Momentum
and Value
Fund
Strategic
European
Smaller
Companies
Fund
Strategic
Global
Qualtiy
Bond Fund
Strategic
Quality
Emerging
Bond
Fund
Strategic
Beta
Flex
Fund
2016 2016 2016 2016 2016
USD EUR USD USD EUR
Net asset value per share
USD Class US$748.45 - US$100.80 US$1,007.11 -
Euro Class - €1,127.36 - €994.07 €1,001.29
Euro Class X - €1,066.73 - - -
CHF Class - - CHF89.95 CHF991.38 -
Hedged Euro Class €515.87 - - - -
EUR Institutional Class - - - €997.67 -
Hedged CHF Class CHF509.51 - - - -
USD Institutional Class US$499.99 - US$108.49 US$972.30 -

E.I. Sturdza Funds Plc
Appendix I (unaudited) (continued)
222
Strategic
China
Panda
Fund
Strategic
Euro
Bond
Fund
Nippon
Growth
(UCITS)
Fund
Strategic
Europe
Value
Fund
2015 2015 2015 2015
USD EUR JPY EUR
Net Asset Value
USD Class 73,952,122 - - -
Euro Class - - - 327,928,096
Hedged Euro Class 40,981,966 - 3,339,942,954 -
Hedged Sterling Class 867,288 - - -
Euro Distributing Class - 9,223,913 - -
Euro Accumulating Class - 44,928,224 - -
JPY Class A - - 347,855,139 -
JPY Class B - - 7,586,161,071 -
EUR Institutional Class - 51,260,187 - 430,430,904
CHF Accumulating Class - 20,729,790 - -
CHF Class - - - 58,118,660
Euro Hedged Institutional Class 7,230,052 - 541,072,758 -
JPY Class D Institutional - - 7,122,512,625 -
USD Institutional Class 50,508,355 - - 9,748,035
CHF Institutional Class - 363,921 - -
GBP Hedged Institutional Class - - 2,714,022,513 -
GBP Institutional Class - - - 19,646,940
Euro Institutional Distributing
Class - - - 50,963,516
Euro Retail Class - - - 9,957
Strategic
Global
Bond
Fund
Strategic
US Momentum
and Value
Fund
Strategic
Global
Quality
Fund
Strategic
European
Smaller
Companies
Fund
2015 2015 2015 2015
USD USD USD EUR
Net Asset Value
USD Class 72,417,092 248,706,173 - -
Hedged Euro Class - 16,441,646 - -
RMB Class 22,224,200 - - -
Hedged CHF Class - 14,114,279 - -
USD Institutional Class - 47,056,745 13,094,398 -
Euro Class - - - 34,367,452

E.I. Sturdza Funds Plc
Appendix I (unaudited) (continued)
223
Strategic
China
Panda
Fund
Strategic
Euro
Bond
Fund
Nippon
Growth
(UCITS)
Fund
Strategic
Europe
Value
Fund
2015 2015 2015 2015
USD EUR JPY EUR
Net asset value per share
USD Class US$2,234.97
777
- - -
Euro Class - - - €212.23
Hedged Euro Class €2,179.30 - €1,090.94 -
Hedged Sterling Class £2,209.17 - - -
Euro Distributing Class - €1,021.45 - -
Euro Accumulating Class - €1,131.86 - -
JPY Class A - - JPY100,920 -
JPY Class B - - JPY84,624 -
EUR Institutional Class - €1,009.65 - €184.58
CHF Accumulating Class - CHF982.03 - CHF167.92
Euro Hedged Institutional Class €944.12 - €1,285.25 -
JPY Class D Institutional - - JPY54,803.00 -
USD Institutional Class US$857.40 - - US$97.46
CHF Institutional Class - CHF989.86 - -
GBP Hedged Institutional Class - - £1,195.89 -
GBP Institutional Class - - - £135.77
Euro Institutional Distributing
Class - - - €100.85
Euro Retail Class - - - €101.08
Strategic
Global
Bond
Fund
Strategic
US Momentum
and Value
Fund
Strategic
Global
Quality
Fund
Strategic
European
Smaller
Companies
Fund
2015 2015 2015 2015
USD USD USD EUR
Net asset value per share
USD Class US$1,040.84 US$763.06 - -
Hedged Euro Class - €532.10 - -
RMB Class US$1,043.87 - - -
CHF Hedged Class - CHF529.02 - -
USD Institutional Class - US$506.88 US$114.56 -
Euro Class - - - €992.85
E.I. Sturdza Funds Plc
Appendix I (unaudited) (continued)
224
Strategic
China
Panda
Fund
Strategic
Euro
Bond
Fund
Nippon
Growth
(UCITS)
Fund
Strategic
Emerging
Europe
Fund
Strategic
Europe
Value
Fund
2014 2014 2014 2014 2014
USD EUR JPY USD EUR
Net Asset Value
USD Class 198,097,204 - 6,336,788 -
Euro Class - - - - 141,705,993
Hedged Euro Class 85,088,997 - 4,150,513,787 13,105,791 -
Hedged Sterling Class 1,110,016 - - - -
Euro Distributing Class - 16,429,946 - - -
Euro Accumulating Class - 54,578,872 - - -
JPY Class A - - 471,627,515 - -
JPY Class B - - 7,031,061,176 - -
JPY Class C - - 31,874,810 - -
EUR Institutional Class - 18,375,836 - - 64,155,126
CHF Accumulating Class - 20,105,167 - - -
CHF Class - - - - 36,347,075
Euro Hedged Institutional Class - - 833,037,281 - -
JPY Class D Institutional - - 6,066,408,494 - -
USD Institutional Class 82,276,092 - - 1,515,174 -
CHF Institutional Class - 2,074,702 - - -
GBP Hedged Institutional Class - - 2,733,964,388 - -
USD Select Institutional Class - - - 57,443,638 -
GBP Institutional Class - - - - 6,487,980
Strategic
Global
Bond
Fund
Strategic
US Momentum
and Value
Fund
Strategic
Global
Quality
Fund 2014 2014 2014 USD USD USD
Net Asset Value
USD Class 81,564,710 234,979,851 -
Hedged Euro Class - 25,199,578 -
RMB Class 33,896,136 - -
Hedged CHF Class - 12,418,547 -
USD Institutional Class - 13,844,020 5,056,567

E.I. Sturdza Funds Plc
Appendix I (unaudited) (continued)
225
Strategic
China
Panda
Fund
Strategic
Euro
Bond
Fund
Nippon
Growth
(UCITS)
Fund
Strategic
Emerging
Europe
Fund
Strategic
Europe
Value
Fund
2014 2014 2014 2014 2014
Net asset value per share
USD Class US$2,268.74 - - US$770.76 -
Euro Class - - - - €171.51
Hedged Euro Class €2,206.08 - €1,068.64 €755.57 -
Hedged Sterling Class £2,235.51 - - - -
Euro Distributing Class - €1,061.60 - - -
Euro Accumulating Class - €1,160.99 - - -
JPY Class A - - JPY97,799 - -
JPY Class B - - JPY 82,034 - -
JPY Class C - - JPY 79,687 - -
EUR Institutional Class - €1,032.54 - - €146.20
CHF Accumulating Class - CHF1,021.45 - - -
CHF Class - - - - CHF137.95
Euro Hedged Institutional
Class - - €1,251.45 - -
JPY Class D Institutional - - JPY52,869 - -
USD Institutional Class US$863.20 - - US$727.96 -
CHF Institutional Class - CHF1,026.60 - - -
GBP Hedged Institutional
Class - - £1,160.96 - -
USD Select Institutional
Class - - - US$767.40 -
GBP Institutional Class - - - - £108.46
Strategic
Global
Bond
Fund
Strategic
US Momentum
and Value
Fund
Strategic
Global
Quality
Fund 2014 2014 2014
Net asset value per share
USD Class US$1,056.05 US$806.53 -
Hedged Euro Class - €563.27 -
RMB Class US$1,080.56 - -
CHF Hedged Class - CHF561.00 -
USD Institutional Class - US$534.83 US$99.15
E.I. Sturdza Funds Plc
Supplementary Information (unaudited)
226
1. Total expense ratio
The total expense ratio for each share class of each Sub-Fund for the year ended 31 December 2016 and 31
December 2015 is as follows:
31 December 2016 31 December 2015
Strategic China Panda Fund
USD Class 2.02% 2.57%
Hedged Euro Class 2.01% 2.12%
Hedged Sterling Class 2.01% 2.18%
USD Institutional Class 1.52% 1.77%
Euro Hedged Institutional Class 1.53% 2.70%
Strategic Euro Bond Fund
Euro Distributing Class 1.17% 1.08%
Euro Accumulating Class 1.17% 1.08%
EUR Institutional Class 0.87% 0.78%
CHF Accumulating Class 1.17% 1.08%
CHF Institutional Class - 0.78% Nippon Growth (UCITS) Fund
Hedged Euro Class 2.09% 2.05%
JPY Class A 2.04% 2.04%
JPY Class B 2.07% 2.08%
JPY Class C - 2.04%
JPY Class D Institutional 1.54% -
Euro Hedged Institutional Class 1.54% 1.54%
JPY Class D Institutional - 1.55%
GBP Hedged Institutional Class 1.54% 1.55%
Strategic Europe Value Fund
Euro Class 2.60% 5.12%
EUR Institutional Class 1.63% 3.14%
CHF Class 2.49% 4.74%
GBP Institutional Class 1.43% 2.98%
Euro Institutional Distributing Class 2.04% 1.55%
Euro Retail Class 3.11% 2.63%
USD Super Institutional Class 1.18% -
USD Class 2.14% -
Euro Super Institutional Class 1.18% -
USD Institutional Class 1.29% 1.41%
Strategic Global Bond Fund
USD Class 1.22% 1.22%
RMB Class 1.22% 1.22%
E.I. Sturdza Funds Plc
Supplementary Information (unaudited) (continued)
227
1. Total expense ratio (continued)
The total expense ratio for each share class of each Sub-Fund for the year ended 31 December 2016 and 31
December 2015 is as follows (continued):
31 December 2016 31 December 2015
Strategic US Momentum and Value Fund
USD Class 1.78% 2.29%
Hedged Euro Class 1.78% 2.40%
Hedged CHF Class 1.78% 2.18%
USD Institutional Class 1.28% 1.76%
Strategic Global Quality Fund
USD Institutional Class 1.20% 1.25%
USD Class 1.70% -
CHF Class 1.70% -
Strategic European Smaller Companies
Fund
Euro Class 3.86% 2.99%
Euro X Class 1.94% -
Strategic Quality Emerging Bond Fund
CHF Class 1.53% -
EUR Class 1.53% -
EUR Institutional Class 1.03% -
USD Class 1.53% -
USD Institutional 1.03% -
Strategic Beta Flex Fund
EUR Class 1.29% -
The total expense ratio (excluding performance-related fee paid to the Manager) for each share class of each
Sub-Fund for the year ended 31 December 2016 and 31 December 2015 is as follows:
31 December 2016 31 December 2015
Strategic China Panda Fund
USD Class 2.01% 1.93%
Hedged Euro Class 2.01% 1.93%
Hedged Sterling Class 2.01% 1.93%
USD Institutional Class 1.51% 1.43%
Euro Hedged Institutional Class 1.51% 1.43%
Strategic Euro Bond Fund
Euro Distributing Class 1.17% 1.08%
Euro Accumulating Class 1.17% 1.08%
EUR Institutional Class 0.87% 0.78%
CHF Accumulating Class 1.17% 1.08%
CHF Institutional Class - 0.78%
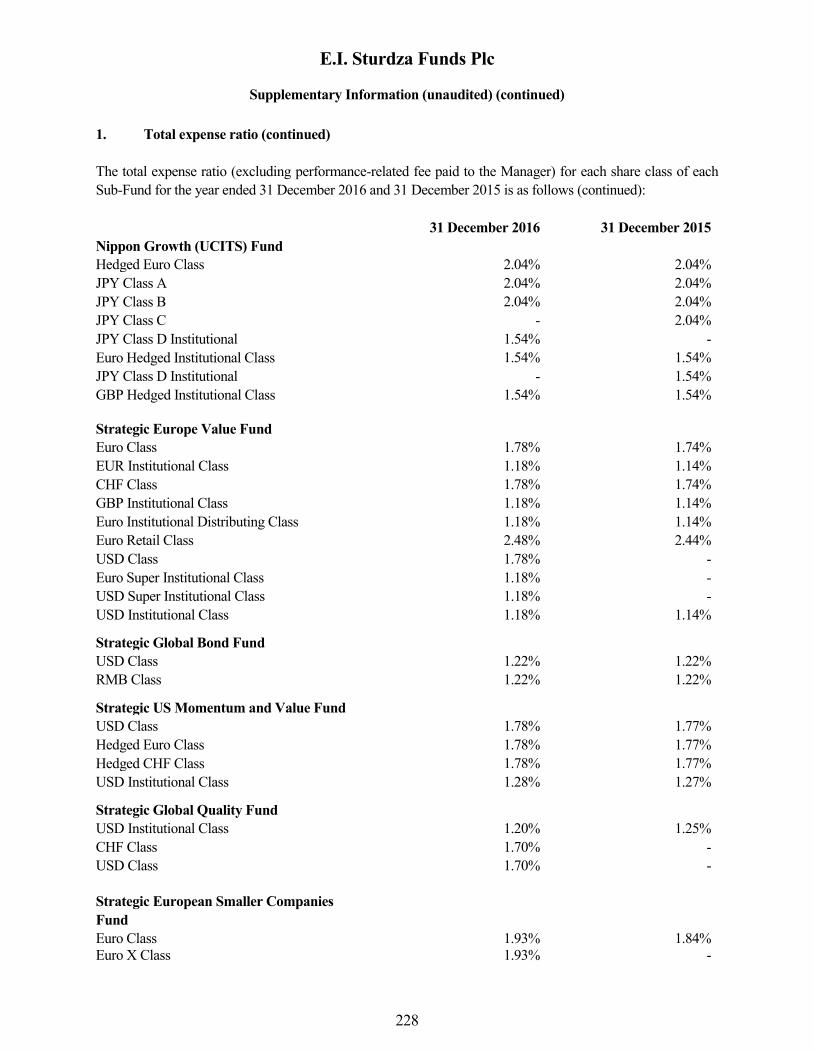
E.I. Sturdza Funds Plc
Supplementary Information (unaudited) (continued)
228
1. Total expense ratio (continued)
The total expense ratio (excluding performance-related fee paid to the Manager) for each share class of each
Sub-Fund for the year ended 31 December 2016 and 31 December 2015 is as follows (continued):
31 December 2016 31 December 2015
Nippon Growth (UCITS) Fund
Hedged Euro Class 2.04% 2.04%
JPY Class A 2.04% 2.04%
JPY Class B 2.04% 2.04%
JPY Class C - 2.04%
JPY Class D Institutional 1.54% -
Euro Hedged Institutional Class 1.54% 1.54%
JPY Class D Institutional - 1.54%
GBP Hedged Institutional Class 1.54% 1.54%
Strategic Europe Value Fund
Euro Class 1.78% 1.74%
EUR Institutional Class 1.18% 1.14%
CHF Class 1.78% 1.74%
GBP Institutional Class 1.18% 1.14%
Euro Institutional Distributing Class 1.18% 1.14%
Euro Retail Class 2.48% 2.44%
USD Class 1.78% -
Euro Super Institutional Class 1.18% -
USD Super Institutional Class 1.18% -
USD Institutional Class 1.18% 1.14%
Strategic Global Bond Fund
USD Class 1.22% 1.22%
RMB Class 1.22% 1.22%
Strategic US Momentum and Value Fund
USD Class 1.78% 1.77%
Hedged Euro Class 1.78% 1.77%
Hedged CHF Class 1.78% 1.77%
USD Institutional Class 1.28% 1.27%
Strategic Global Quality Fund
USD Institutional Class 1.20% 1.25%
CHF Class 1.70% -
USD Class 1.70% -
Strategic European Smaller Companies
Fund
Euro Class 1.93% 1.84%
Euro X Class 1.93% -
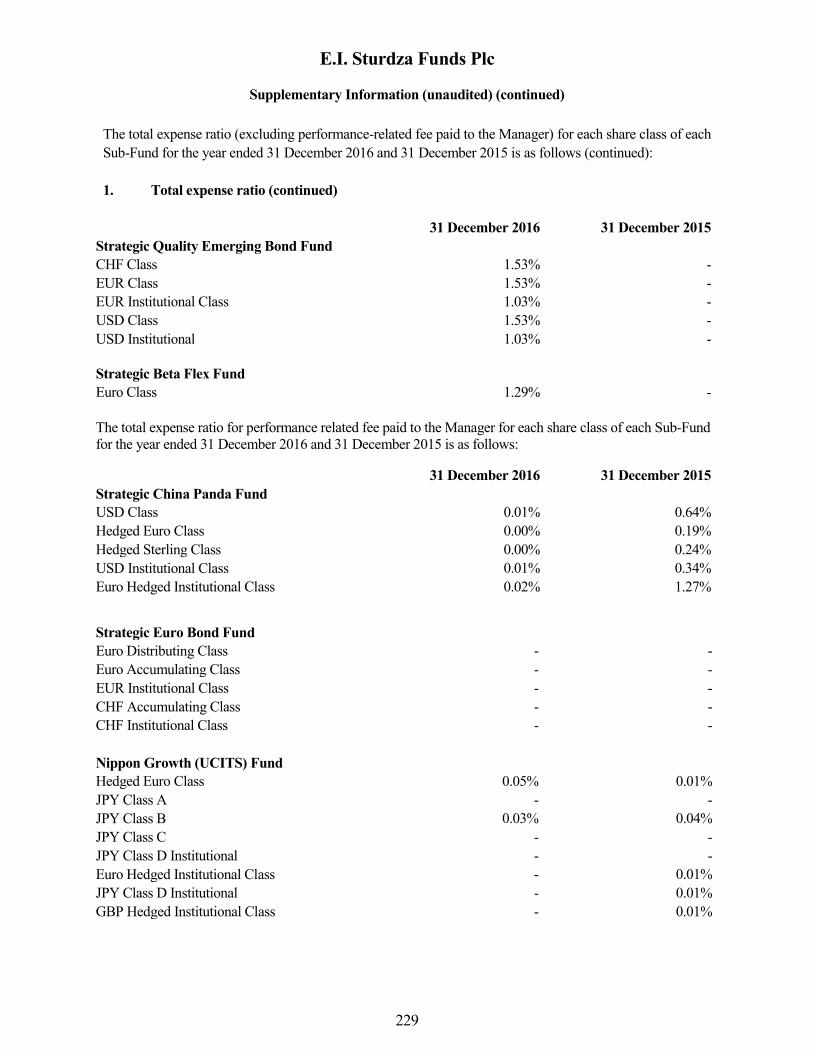
E.I. Sturdza Funds Plc
Supplementary Information (unaudited) (continued)
229
The total expense ratio (excluding performance-related fee paid to the Manager) for each share class of each
Sub-Fund for the year ended 31 December 2016 and 31 December 2015 is as follows (continued):
1. Total expense ratio (continued)
31 December 2016 31 December 2015
Strategic Quality Emerging Bond Fund
CHF Class 1.53% -
EUR Class 1.53% -
EUR Institutional Class 1.03% -
USD Class 1.53% -
USD Institutional 1.03% -
Strategic Beta Flex Fund
Euro Class 1.29% -
The total expense ratio for performance related fee paid to the Manager for each share class of each Sub-Fund
for the year ended 31 December 2016 and 31 December 2015 is as follows:
31 December 2016 31 December 2015
Strategic China Panda Fund
USD Class 0.01% 0.64%
Hedged Euro Class 0.00% 0.19%
Hedged Sterling Class 0.00% 0.24%
USD Institutional Class 0.01% 0.34%
Euro Hedged Institutional Class 0.02% 1.27%
Strategic Euro Bond Fund
Euro Distributing Class - -
Euro Accumulating Class - -
EUR Institutional Class - -
CHF Accumulating Class - -
CHF Institutional Class - -
Nippon Growth (UCITS) Fund
Hedged Euro Class 0.05% 0.01%
JPY Class A - -
JPY Class B 0.03% 0.04%
JPY Class C - -
JPY Class D Institutional - -
Euro Hedged Institutional Class - 0.01%
JPY Class D Institutional - 0.01%
GBP Hedged Institutional Class - 0.01%
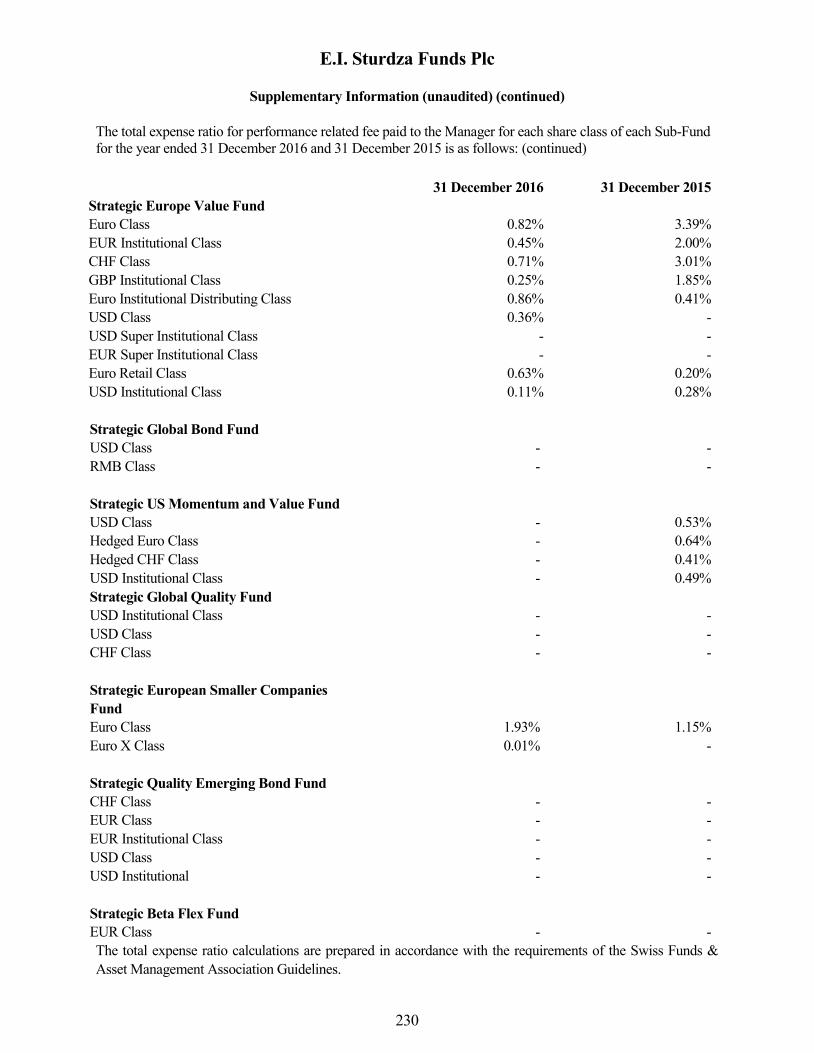
E.I. Sturdza Funds Plc
Supplementary Information (unaudited) (continued)
230
The total expense ratio for performance related fee paid to the Manager for each share class of each Sub-Fund
for the year ended 31 December 2016 and 31 December 2015 is as follows: (continued)
Strategic Global Bond Fund
USD Class - -
RMB Class - -
Strategic US Momentum and Value Fund
USD Class - 0.53%
Hedged Euro Class - 0.64%
Hedged CHF Class - 0.41%
USD Institutional Class - 0.49%
Strategic Global Quality Fund
USD Institutional Class - -
USD Class - -
CHF Class - -
Strategic European Smaller Companies
Fund
Euro Class 1.93% 1.15%
Euro X Class 0.01% -
Strategic Quality Emerging Bond Fund
CHF Class - -
EUR Class - -
EUR Institutional Class - -
USD Class - -
USD Institutional - -
Strategic Beta Flex Fund
EUR Class - -
The total expense ratio calculations are prepared in accordance with the requirements of the Swiss Funds &
Asset Management Association Guidelines.
31 December 2016 31 December 2015
Strategic Europe Value Fund
Euro Class 0.82% 3.39%
EUR Institutional Class 0.45% 2.00%
CHF Class 0.71% 3.01%
GBP Institutional Class 0.25% 1.85%
Euro Institutional Distributing Class 0.86% 0.41%
USD Class 0.36% -
USD Super Institutional Class - -
EUR Super Institutional Class - -
Euro Retail Class 0.63% 0.20%
USD Institutional Class 0.11% 0.28%

E.I. Sturdza Funds Plc
Supplementary Information (unaudited) (continued)
231
2. Fund performance data
The percentage total return of one share, of each share class from inception as calculated in accordance
with the Swiss Fund and Asset Management Association is detailed below:
Inception to
31 December 2016
Inception to
31 December 2015
Fund Index Fund Index
Strategic China Panda Fund
USD Class 118.07% 53.53% 123.50% 52.16%
Hedged Euro Class 108.68% 53.53% 117.93% 52.16%
Hedged Sterling Class 112.26% 53.53% 120.92% 52.16%
USD Institutional Class (15.92)% 10.67% (14.26)% 9.69%
Euro Hedged Institutional Class (9.48)% (9.09)% (5.59)% (9.90)%
Strategic Euro Bond Fund
Euro Distributing Class 1.52% 3.84% 2.15% 4.04%
Euro Accumulating Class 13.84% 3.84% 13.19% 4.04%
EUR Institutional Class 1.83% 0.19% 0.96% 0.39%
CHF Accumulating Class (1.99)% 0.18% (1.80)% 0.38%
CHF Institutional Class - - (1.01)% 0.12%
Nippon Growth (UCITS) Fund
Hedged Euro Class 4.28% 30.11% 9.09%
29.70%
JPY Class A 62.46% 96.42% 66.16% 95.80%
JPY Class B 65.51% 83.74% 69.25% 83.16%
Euro Hedged Institutional Class 23.12% 64.49% 28.53%
63.97%
JPY Class D Institutional 7.83% 41.29% 9.61%
40.84%
GBP Hedged Institutional Class - - 19.59%
35.32%
Strategic Europe Value Fund
Euro Class 95.56% 68.46% 112.23% 55.00%
EUR Institutional Class 71.77% 38.69% 84.58% 35.21%
CHF Class 53.71% 37.23% 67.92% 33.79%
GBP Institutional Class 25.88% 11.68% 35.77% 8.88%
Euro Institutional Distributing Class (6.64)% (0.39)% 0.85%
(2.90)%
Euro Retail Class (7.89)% 2.87% 1.08%
0.28%
USD Institutional Class (8.26)% (2.48)% (2.54)%
(4.93)%
USD Class (0.05)% 8.90% - -
Euro Super Institutional Class (5.38)% 6.05% - -
USD Super Institutional Class (5.13)% 6.60% - -
Strategic Global Bond Fund
USD Class 4.37% 16.05% 4.08% 11.43%
RMB Class 0.49% 13.48% 4.39% 8.97%
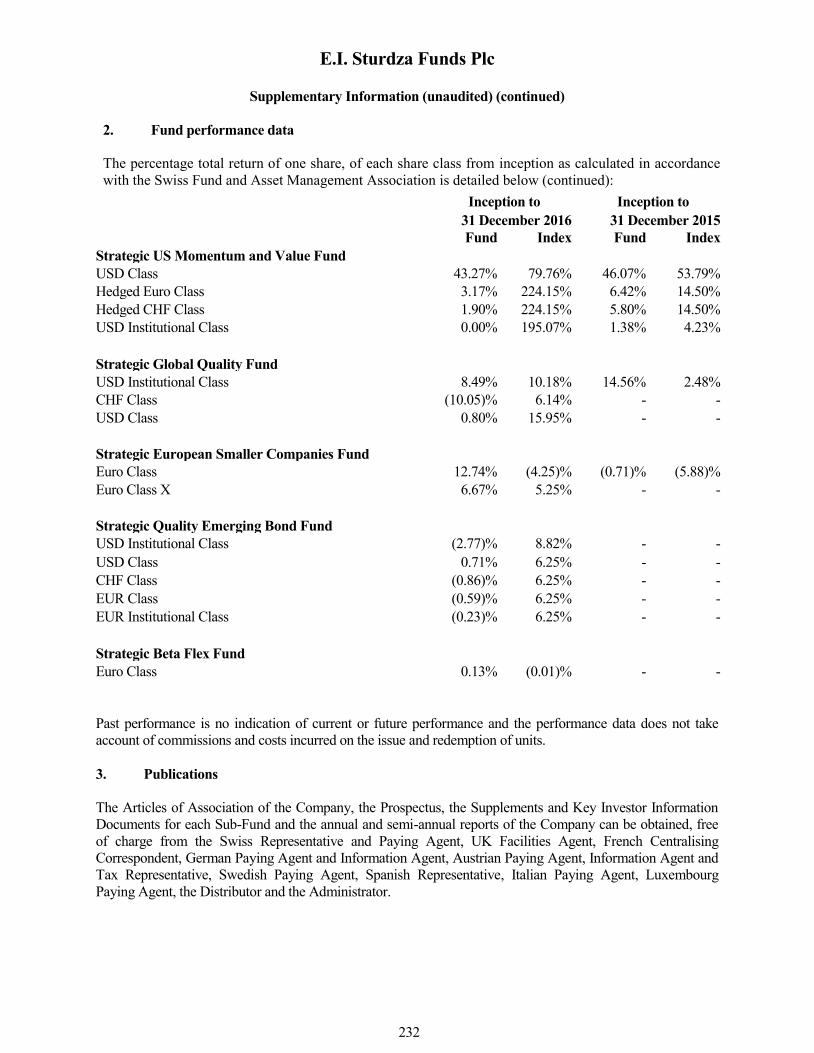
E.I. Sturdza Funds Plc
Supplementary Information (unaudited) (continued)
232
2. Fund performance data
The percentage total return of one share, of each share class from inception as calculated in accordance
with the Swiss Fund and Asset Management Association is detailed below (continued):
Inception to
31 December 2016
Inception to
31 December 2015
Fund Index Fund Index
Strategic US Momentum and Value Fund
USD Class 43.27% 79.76% 46.07% 53.79%
Hedged Euro Class 3.17% 224.15% 6.42% 14.50%
Hedged CHF Class 1.90% 224.15% 5.80% 14.50%
USD Institutional Class 0.00% 195.07% 1.38% 4.23%
Strategic Global Quality Fund
USD Institutional Class 8.49% 10.18% 14.56%
2.48%
CHF Class (10.05)% 6.14% - -
USD Class 0.80% 15.95% - -
Strategic European Smaller Companies Fund
Euro Class 12.74% (4.25)% (0.71)%
(5.88)%
Euro Class X 6.67% 5.25% - -
Strategic Quality Emerging Bond Fund
USD Institutional Class (2.77)% 8.82% - -
USD Class 0.71% 6.25% - -
CHF Class (0.86)% 6.25% - -
EUR Class (0.59)% 6.25% - -
EUR Institutional Class (0.23)% 6.25% - -
Strategic Beta Flex Fund
Euro Class 0.13% (0.01)% - -
Past performance is no indication of current or future performance and the performance data does not take
account of commissions and costs incurred on the issue and redemption of units.
3. Publications
The Articles of Association of the Company, the Prospectus, the Supplements and Key Investor Information
Documents for each Sub-Fund and the annual and semi-annual reports of the Company can be obtained, free
of charge from the Swiss Representative and Paying Agent, UK Facilities Agent, French Centralising
Correspondent, German Paying Agent and Information Agent, Austrian Paying Agent, Information Agent and
Tax Representative, Swedish Paying Agent, Spanish Representative, Italian Paying Agent, Luxembourg
Paying Agent, the Distributor and the Administrator.
E.I. Sturdza Funds Plc
Remuneration Disclosure for the period from 18 March 2016 (effective date) to 31 December
2016 (unaudited)
233
Introduction
The below disclosures are made in respect of the remuneration policies of E.I Sturdza Strategic Management
Limited (the “Investment Manager” to E.I. Sturdza Funds Plc (the “Funds”)). The disclosures are made in
accordance with the European Union (Undertakings for Collective Investment in Transferable Securities)
(Amendment) regulations 2016 – SI 143 of 2016 (“UCITS V Directive”), effective from 18 March 2016.
The remuneration policy of the Investment Manger has been designed to promote sound and effective risk
management and to not encourage risk taking which may be inconsistent with the risk profile and constitution
of the Funds managed.
The policy adopted by the Investment Manager is subject to review on an annual basis and is assessed to
determine whether the system of remuneration operates as intended and is compliant with the remuneration
requirements as set out by the UCITS V Directive.
Decision making process
The decision making in relation to investment strategy and portfolio management is made by external
Investment Advisers, under a contractual relationship with the Investment Manager. No employees of the
Investment Manager are considered Identified Persons, as defined by the UCITS V Directive. The risk profile
of the Funds is monitored on a continuous basis by the employees of the Investment Manager to ensure it
remains within the parameters outlined in the Funds governing documents. The remuneration policies of the
Investment Advisers have been reviewed by the Investment Manager to ensure the remuneration policies are
designed to align the interests of the Investment Adviser’s with those of the shareholders and to discourage
excessive risk taking.
Due to the implementation of the UCITS V Directive during the financial year, no quantitative information is
yet available.