e gaette - Federal Reserve Bank of Minneapolis/media/files/pubs/fedgaz/15-07/job... · e gaette...
6
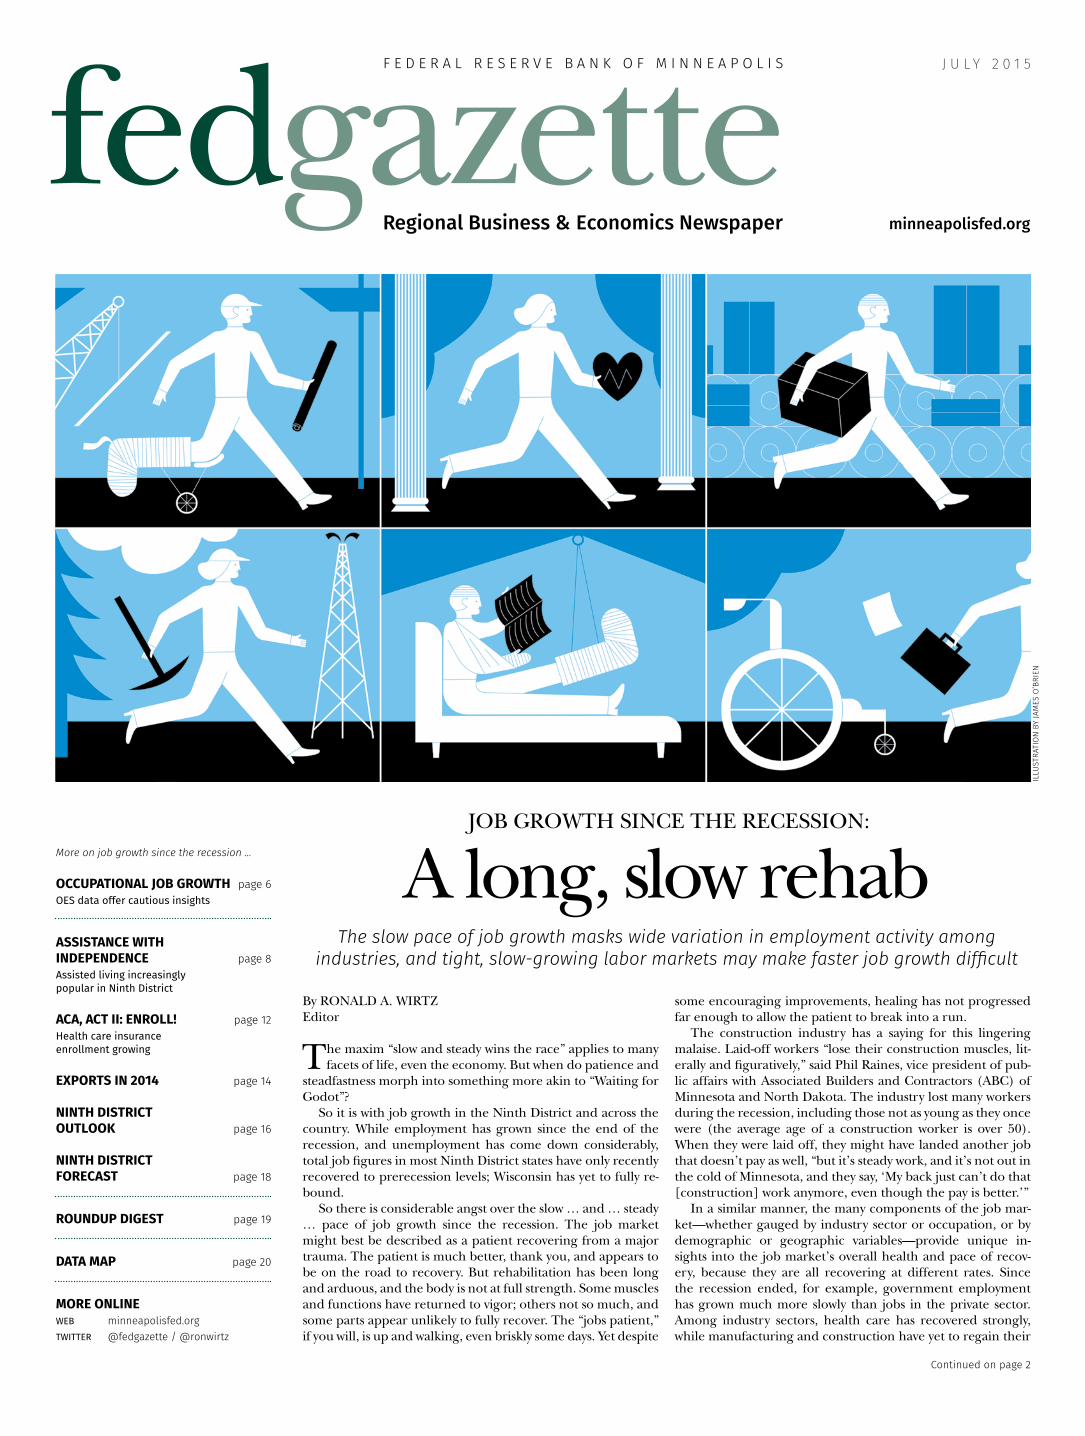
fed gazette Regional Business & Economics Newspaper FEDERAL RESERVE BANK OF MINNEAPOLIS JULY 2015 minneapolisfed.org JOB GROWTH SINCE THE RECESSION: A long, slow rehab The slow pace of job growth masks wide variation in employment activity among industries, and tight, slow-growing labor markets may make faster job growth difficult By RONALD A. WIRTZ Editor T he maxim “slow and steady wins the race” applies to many facets of life, even the economy. But when do patience and steadfastness morph into something more akin to “Waiting for Godot”? So it is with job growth in the Ninth District and across the country. While employment has grown since the end of the recession, and unemployment has come down considerably, total job figures in most Ninth District states have only recently recovered to prerecession levels; Wisconsin has yet to fully re- bound. So there is considerable angst over the slow … and … steady … pace of job growth since the recession. The job market might best be described as a patient recovering from a major trauma. The patient is much better, thank you, and appears to be on the road to recovery. But rehabilitation has been long and arduous, and the body is not at full strength. Some muscles and functions have returned to vigor; others not so much, and some parts appear unlikely to fully recover. The “jobs patient,” if you will, is up and walking, even briskly some days. Yet despite some encouraging improvements, healing has not progressed far enough to allow the patient to break into a run. The construction industry has a saying for this lingering malaise. Laid-off workers “lose their construction muscles, lit- erally and figuratively,” said Phil Raines, vice president of pub- lic affairs with Associated Builders and Contractors (ABC) of Minnesota and North Dakota. The industry lost many workers during the recession, including those not as young as they once were (the average age of a construction worker is over 50). When they were laid off, they might have landed another job that doesn’t pay as well, “but it’s steady work, and it’s not out in the cold of Minnesota, and they say, ‘My back just can’t do that [construction] work anymore, even though the pay is better.’” In a similar manner, the many components of the job mar- ket—whether gauged by industry sector or occupation, or by demographic or geographic variables—provide unique in- sights into the job market’s overall health and pace of recov- ery, because they are all recovering at different rates. Since the recession ended, for example, government employment has grown much more slowly than jobs in the private sector. Among industry sectors, health care has recovered strongly, while manufacturing and construction have yet to regain their More on job growth since the recession … OCCUPATIONAL JOB GROWTH page 6 OES data offer cautious insights ASSISTANCE WITH INDEPENDENCE page 8 Assisted living increasingly popular in Ninth District ACA, ACT II: ENROLL! page 12 Health care insurance enrollment growing EXPORTS IN 2014 page 14 NINTH DISTRICT OUTLOOK page 16 NINTH DISTRICT FORECAST page 18 ROUNDUP DIGEST page 19 DATA MAP page 20 MORE ONLINE WEB minneapolisfed.org TWITTER @fedgazette / @ronwirtz Continued on page 2 ILLUSTRATION BY JAMES O’BRIEN
Transcript of e gaette - Federal Reserve Bank of Minneapolis/media/files/pubs/fedgaz/15-07/job... · e gaette...
fedgazetteRegional Business & Economics Newspaper
F E D E R A L R E S E R V E B A N K O F M I N N E A P O L I S J U L Y 2 0 1 5
minneapolisfed.org
JOB GROWTH SINCE THE RECESSION:
A long, slow rehabThe slow pace of job growth masks wide variation in employment activity among
industries, and tight, slow-growing labor markets may make faster job growth difficult
By RONALD A. WIRTZEditor
The maxim “slow and steady wins the race” applies to many facets of life, even the economy. But when do patience and
steadfastness morph into something more akin to “Waiting for Godot”?
So it is with job growth in the Ninth District and across the country. While employment has grown since the end of the recession, and unemployment has come down considerably, total job figures in most Ninth District states have only recently recovered to prerecession levels; Wisconsin has yet to fully re-bound.
So there is considerable angst over the slow … and … steady … pace of job growth since the recession. The job market might best be described as a patient recovering from a major trauma. The patient is much better, thank you, and appears to be on the road to recovery. But rehabilitation has been long and arduous, and the body is not at full strength. Some muscles and functions have returned to vigor; others not so much, and some parts appear unlikely to fully recover. The “jobs patient,” if you will, is up and walking, even briskly some days. Yet despite
some encouraging improvements, healing has not progressed far enough to allow the patient to break into a run.
The construction industry has a saying for this lingering malaise. Laid-off workers “lose their construction muscles, lit-erally and figuratively,” said Phil Raines, vice president of pub-lic affairs with Associated Builders and Contractors (ABC) of Minnesota and North Dakota. The industry lost many workers during the recession, including those not as young as they once were (the average age of a construction worker is over 50). When they were laid off, they might have landed another job that doesn’t pay as well, “but it’s steady work, and it’s not out in the cold of Minnesota, and they say, ‘My back just can’t do that [construction] work anymore, even though the pay is better.’”
In a similar manner, the many components of the job mar-ket—whether gauged by industry sector or occupation, or by demographic or geographic variables—provide unique in-sights into the job market’s overall health and pace of recov-ery, because they are all recovering at different rates. Since the recession ended, for example, government employment has grown much more slowly than jobs in the private sector. Among industry sectors, health care has recovered strongly, while manufacturing and construction have yet to regain their
More on job growth since the recession …
OCCUPATIONAL JOB GROWTH page 6OES data offer cautious insights
ASSISTANCE WITH INDEPENDENCE page 8Assisted living increasingly popular in Ninth District
ACA, ACT II: ENROLL! page 12Health care insurance enrollment growing
EXPORTS IN 2014 page 14
NINTH DISTRICTOUTLOOK page 16
NINTH DISTRICT FORECAST page 18
ROUNDUP DIGEST page 19
DATA MAP page 20
MORE ONLINEWEB minneapolisfed.orgTWITTER @fedgazette / @ronwirtz
Continued on page 2
ILLU
STRA
TIO
N BY
JAM
ES O
’BRI
EN

former employment levels. They may never, yet these sectors have reasons for optimism.
And a funny thing is also happening in job markets: Despite the impression of a sluggish job market, numerous sources like Raines said firms would hire more people if they could find them. Indeed, unemployment has steadily declined in most places in spite of low net job growth.
In the end, demographics may have the greatest effect on job growth going forward. Currently, the number of work-ers coming into the labor pool is simply too small to sustain large net increases in employment, especially with baby boom-ers starting to retire and creating new openings that need to be filled. So there might be little sense in expecting a big uptick in hiring when there simply isn’t a big pool of workers waiting to be hired.
In slow motionBy now, the story of the Great Reces-sion is familiar: Huge job losses followed by comparatively meager job growth in most states.
As of the third quarter of 2014, private employment in Ninth District states had barely poked its head over the high-water jobs mark set in 2007 (four-quarter aver-age; see Chart 1). Indeed, Wisconsin had yet to cross that jobs threshold; the Up-per Peninsula of Michigan is also still 4 percent below its average 2007 employ-ment levels, short some 3,200 jobs.
[Editor’s note: Job growth has contin-ued into 2015. However, the most com-prehensive data available—and the basis of this analysis—come from the Quar-terly Census of Employment and Wages
(QCEW), which lags other survey-based employment data. Also familiar to many is North Dakota’s anomalous jobs status among most states, including those in the Ninth District. Thanks to the boom in the western Bakken oil shale region of the state, employment never dropped below 2007 levels and North Dakota jobs have since grown by 40 percent, an astro-nomical rate against the backdrop of the Great Recession. Because of North Da-kota’s outlier status, the focus of this jobs discussion will be mostly on other Ninth District states.]
But the slow and steady pace of the job market in most Ninth District states obscures much churning below the sur-face. In a given month, the number of hired workers is typically near the num-ber losing or leaving their jobs; net job growth is a consequence of that narrow margin swinging in a positive direction.
In turn, that underlying job pulse is made up of many industry sectors. The QCEW tracks employment among nine broad-based private industries (not in-cluding an “other” category) as well as government. And just as body parts heal at different rates after injury, so too are jobs growing at different rates among these various industries.
For example, private industry employ-ment has grown by about 6 percent in Minnesota, Montana, South Dakota and Wisconsin (combined) since the end of the recession. But government employ-ment has declined by 1 percent over the same period, or almost 11,000 jobs (see Chart 2). Some of this is a quirk of tim-ing; thousands of federal jobs were va-cated at the start of this decade with the completion of the 2010 Census.
Among local governments, employ-
ment rose slightly during the recession, thanks in part to the American Recovery and Reinvestment Act that funneled bil-lions of dollars to state and local govern-ments to fill budget gaps, retain public employees and boost local spending in hopes of buttressing the economy.
But since 2009, when the federal stim-ulus was near its peak, Minnesota, Mon-tana, South Dakota and Wisconsin have seen a net decline of almost 8,000 local government jobs.
In Minnesota’s Blue Earth County, the federal stimulus “helped a little with keeping levies down and maybe avoided some staff reductions during the down-turn,” according to County Administra-tor Bob Meyer. But over the past five years, county employment has dropped about 5 percent due to tight budgets as
The Quick TakeSince the end of the recession, overall job growth has been fairly steady, but comparatively slow. This broad picture obscures the fact that various industry sectors have recovered at different paces in Ninth District states, reflecting both the steepness of their decline during the recession and their subsequent rate of job growth in recovery. Health care has witnessed surging employment, with robust job growth both during and after the recession, while the construction industry fell hard and is still working to return to prerecession levels. Sources in many fields suggest that jobs would grow faster were it not for persistent labor shortages, and a slow-growing labor force will likely supplant the recession and weak demand as the major obstacle to more rapid job growth.
fedgazetteRegional Business & Economics Newspaper
ISSN 1045-3334
E X E C U T I V E E D I TO R Kei-Mu Yi S E N I O R E D I TO R David WarginE D I TO R Ronald A. WirtzM A N AG I N G E D I TO R Jenni C. SchoppersE C O N O M I S T S Rob Grunewald Joe MahonS E N I O R W R I T E R Phil DaviesD E S I G N E R S John Biasi Lori Korte Mark Shafer
C O R R E S P O N D E N C E
Public AffairsFederal Reserve Bank of Minneapolis90 Hennepin AvenueP.O. Box 291Minneapolis, MN, 55480-0291
(612) [email protected]
WEB minneapolisfed.org/publications/fedgazette
BLOG minneapolisfed.typepad.com/roundup/
TWITTER @fedgazette @ronwirtz
S U B S C R I P T I O N S
Available without charge.
Contact [email protected]
B AC K I S S U E S
Available online at
minneapolisfed.org/publications/fedgazette
R E P R I N T/ P H O TO C O PY
Articles may be reprinted if the source is
credited and Public Affairs is provided with
copies. Permission to photocopy is unrestricted.
D I S C L A I M E R
The opinions expressed in the fedgazette are
expressly those of the authors or of attributed
sources and are not intended to represent a
formal position of this Bank or the Federal
Reserve System.
One of the Minneapolis Fed’s congressionally
mandated responsibilities is to gather
information on the Ninth District economy. The
fedgazette is published quarterly to share that
information with the district, which includes
Montana, North and South Dakota, Minnesota,
northwestern Wisconsin and the Upper
Peninsula of Michigan.
Job Growth from page 1
fedgazette J O B G R O W T H J U LY 2 0 1 5
Page 2
2Employment change, private vs. government2009 to Q3 2014*MN, MT, SD, WI (cumulative)8 percent
4
0
-4
-8 -5,939
+3,151
-7,863
+312,228
-6.4%
1.7%-1.2%
6.1%
Source: Bureau of Labor Statistics, QCEW
* Both 2009 and 2014 measures are four-quarter averages.
Federalgovt.
Localgovt.
Privateemployers
Stategovt.
-4
-8
2007 2008 2009 2010 2011 2012 2013
Nonfarm employment index4-quarter average, 2007 Q1 = 100
Source: Bureau of Labor Statistics, Quarterly Census of Employment and Wages (QCEW)
North Dakota South Dakota
WisconsinMinnesotaMontana
1
90
100
110
70
80
120
2014

a result of reductions in revenue from the state. Coping mechanisms included voluntary furloughs, hiring freezes and early retirement, Meyer said, with gen-eral government, the sheriff’s office and public works “hit the hardest.”
Wisconsin local governments have borne the biggest hit to employment, having lost some 6,600 jobs since 2009. The state Legislature tightly controls property taxes, and local levies can only grow at the previous year’s rate of net new construction, according to Jerry De-schane, executive director of the League of Wisconsin Municipalities. That spend-ing limit can be exceeded only by pass-ing a referendum, Deschane said, and “to date, few referenda have been pro-posed.”
He added that local governments in Wisconsin also rely on state shared rev-enues, and those dropped by 10 percent three years ago “and have not been in-creased since.”
Much of the job loss among local gov-ernments appears to have come through attrition from a controversial state law passed in 2011. Widely referred to as Act 10, it requires greater contributions to health care and pension plans from state and local government employees. It also limits collective bargaining for public employee unions, which gives local gov-ernments more flexibility with budgets and human resource management.
In 2011, the Wisconsin Retirement System (which covers virtually all state and local employees, save for those in Milwaukee) saw retirements leap to 15,000, roughly double the annual rate of the preceding decade, and they re-mained elevated by 20 percent to 30 per-cent the following two years. Given the restrictions of shared revenue and prop-erty tax levies, many local governments have simply not refilled positions.
Less information, more healthAmong private industry sectors, job growth has varied widely. Most of the major industries still had not returned to their prerecession levels by the third quarter of 2014, and two industries—fi-nancial activities and information—have lost jobs even since the end of the reces-sion (see table at right and Chart 3 on pages 4 and 5).
The information industry is en-meshed in a long, downward trend, the result mostly of the rise of the Internet and the subsequent fall in demand for printed materials. In central Minnesota, “the closings of a few major publish-ing and printing companies are really putting a dent in the sector,” said Luke Greiner, regional analyst for central and southwestern Minnesota for the Depart-ment of Employment and Economic De-velopment (DEED). In 2008, for exam-
ple, there were 75 publishing companies in the central Minnesota region, but only 62 by 2014, with jobs falling by 300 to 400, according to Greiner. One of those closures was in St. Cloud, where Quad/Graphics closed a St. Cloud printing op-eration that affected 280 workers.
That was just one of several closures in the state in 2014. In January, the Pio-neer Press closed its St. Paul printing facil-ity and laid off nearly 170 employees; in November, Cenveo Corp. closed its com-mercial printing facility in Minneapolis and cut 112 jobs.
Conversely, some job sectors have witnessed robust hiring in the district. Jobs in natural resources and mining, for example, have risen 20 percent since 2009—and that doesn’t include North Dakota, where such jobs have tripled over this period (see page 4). Gains have been driven by frac sand mining, as well as increased metals mining activity throughout the district, though both of
those industries have seen layoffs more recently amid soft prices.
In terms of overall performance, the leader is the education and health care industry, which grew during and after the recession and created more jobs than any other sector (see page 5). Health care makes up about 90 percent of jobs in the industry; in Minnesota, health care add-ed almost 60,000 jobs since 2007; educa-tion contributed about 7,000.
“The health care sector growth will show up across the board and in every region,” said Laura Beeth, who is system director for talent acquisition for Fair-view Health System, one of Minnesota’s largest employers. Beeth is also chair of the Governor’s Workforce Development Council and HealthForce Minnesota, a collaboration among education, indus-try and government interests hoping to increase the number and diversity of health care workers, among other things.
Across Fairview, Beeth estimated that
the organization has grown by 3,000 jobs over the past five years and now stands at about 25,000 employees statewide (not including Ebenezer, a long-term care provider owned by Fairview). Growth, said Beeth, “is based just on plain de-mand and sheer demographics,” espe-cially an aging baby boom population. “The geriatric world is exploding.”
Sanford Health, headquartered in Sioux Falls, S.D., has facilities in nine states, and job growth “is all across our system and in all areas of our workforce,” including professional and technical po-sitions, support staff and clinical staff” like physicians and nurses, according to Evan Burkett, Sanford’s chief human capital officer.
Other than 2012, when patient vol-umes were steady, “our volumes have continued to increase year over year, which creates demand and need for all staff,” Burkett said. Sanford is also seeing growth regardless of geography, accord-ing to Burkett. “Our more metropolitan locations are feeling a larger impact,” but Sanford is also seeing growth at rural facilities.
I’m not dead yetOther industries have taken a longer route to a jobs recovery. Both manufac-turing and construction have seen em-ployment rebound somewhat since the end of the recession—about 5 percent to 6 percent—which is middle-of-the-pack among major industries, but both are still well below their prerecession job peaks (see page 4).
Nonetheless, there are reasons for optimism. The modest employment re-bound in manufacturing since the end of the recession, for example, contrasts with a previous 40-year trend of employ-ment decline in the industry.
“Many people would equate lower em-ployment [since 2007] with a struggling industry,” said Scott Manley, vice presi-dent of government relations for Wis-consin Manufacturers & Commerce, the state’s chamber of commerce. But since 2010, Wisconsin has produced the fifth-most manufacturing jobs of any state in the country, and output has increased by 18 percent to more than $54 billion, well above prerecession levels. Such growth in jobs and output, said Manley, “is not the hallmark of a struggling industry.”
Laid-off workers “lose their construction
muscles, literally and figuratively.”
—PHIL RAINES, ASSOCIATED BUILDERS AND CONTRACTORS
OF MINNESOTA AND NORTH DAKOTA
Continued on page 4
fedgazette J O B G R O W T H J U LY 2 0 1 5
Page 3
ILLU
STRA
TIO
N BY
JAM
ES O
’BRI
EN
Private, nonfarm employment change in Ninth District states(not including North Dakota)
Natural resources & miningEducation & health servicesProfessional & business servicesLeisure & hospitalityTrade, transportation & utilitiesFinancial activitiesManufacturingInformationConstruction
74,5071,011,436
723,939620,172
1,199,945371,323
830,022112,664253,298
20.4%13.6%
7.1%1.5%
-3.0%-4.5%-8.2%-8.4%
-15.8%
20.9%8.0%
15.0%5.2%2.8%
-1.4%5.1%
-3.6%5.7%
2007 to 3rdQuarter 2014
Total 2014employment
2009 to 3rdQuarter 2014
Since the start of the recession
Since the end of the recession
Source: Bureau of Labor Statistics, QCEW
All dates use four-quarter averages

Nondurable manufacturing has al-ready returned to full employment, according to Manley, with the food and beverage sector growing 31 per-cent from 2007 to 2012. He pointed to Link Snacks—maker of Jack Links beef jerky—as a “great example of a nondu-rable goods manufacturer that has seen continued growth.” Located near Supe-rior, Wis., Link Snacks produces a variety of meat snacks that are sold in over 40 countries. (The company declined com-ment for this story.)
Les Engel, owner of Engel Metallur-gical Ltd. and president of the Central Minnesota Manufacturers Association, also sees a leaner, more productive in-dustry. “I do not see the manufacturing segment as struggling. Companies that have survived the recession are probably in the most healthy condition that they have ever been in,” said Engel. “It’s all about output and productivity. These are critical to compete in a global economy.”
At the same time, the emphasis on in-novation and higher productivity is un-likely to return manufacturing employ-ment to prerecession levels, according to Buckley Brinkman, executive director of the Wisconsin Manufacturing Extension Partnership.
“We can all be nostalgic for our ’65 Chevy, but that’s not coming back” and neither are a lot of manufacturing jobs, Brinkman said. “We’re in a better posi-tion as a country [in manufacturing]. We’re part of a world infrastructure, and our labor is competitive with anyone right now.”
Brinkman characterized the indus-try as a bell-shaped curve. The top 15 percent are world class and “always questioning what they are doing,” while the bottom 15 percent are the “walk-ing dead.” It’s the middle tiers that are the most critical for the industry’s long-term health in the state, walking the fine line between simply worrying about the
day’s orders and imagining what’s neces-sary—new processes, new products, new clients—to attract orders five years down the road. For companies that do the lat-ter, “the future is bright,” said Brinkman. “Those that say they’ve gotten by for 30 years [doing the same thing]—sell those stocks short.”
Under constructionMaybe no industry embodies the jobs trauma of the recession along with the promise and anxiety of recovery more than the construction industry. Across four district states, 16 percent of con-struction jobs—one in six positions—were lost in two short years. Construction employment has since rebounded, but by only about 6 percent from the end of the recession through the third quarter of 2014. Aside from North Dakota, every other district state was still below prere-cession levels; Minnesota, Montana and Wisconsin were far below it.
The residential construction sector has been spotty. Housing construction in Montana and South Dakota looked to be near full recovery in 2013, but a softer 2014 followed, especially in Montana, where permits dropped by 30 percent. Housing starts in Minnesota and Wis-consin have rebounded somewhat from bare-bones levels during the recession, but are well behind the pace seen before the recession.
David Siegel, executive director of the Builders Association of the Twin Cities (BATC), said it has been a “slow hous-ing recovery here.” Twin Cities housing starts “are at half the levels that would be expected given the region’s popula-tion growth” projected by the Metro-politan Council, a regional government and planning agency for the Twin Cities metro. The agency suggests that the re-gion needs about 18,000 units per year to meet population growth, “and we are presently at about 9,000 or 10,000 units,” said Siegel.
Sluggish residential construction growth is ultimately connected to slow
household formations, according to Minnesota state economist Laura Kalam-bokodis. Since 1990, household forma-tions in the state have been consistently above the rate of population growth (see Chart 4). That relationship flipped dra-matically during the recession and only recently returned to its previous trend.
Kalambokodis noted that multifamily apartment construction has been stron-ger than single-family, especially in the Twin Cities, but construction of these dwellings typically requires fewer work-ers per unit than single-family homes. Her office was expecting household formation to accelerate slightly this year and construction employment to follow, but she added, “We also think construc-tion is being hindered on the supply side by materials costs and inadequate labor supply.”
In commercial and industrial con-struction, most sources reported good to very good activity currently. David Oxley, executive director, American Council of Engineering Companies of Minnesota, said the recession was hard on his mem-bers (mostly engineering consulting
The job market might best be described as a patient recovering from a major trauma …
… Some muscles and functions have returned to vigor; others not so much, and some parts appear unlikely to fully recover.
Job Growth from page 3
fedgazette J O B G R O W T H J U LY 2 0 1 5
Page 4
Natural Resources and Mining
’07 ’08 ’09 ’10 ’11 ’12 ’13 ’14
70
80
90
100
110
120
70
80
90
100
110
120
Construction
’07 ’08 ’09 ’10 ’11 ’12 ’13 ’14
70
80
90
100
110
120
Manufacturing
’07 ’08 ’09 ’10 ’11 ’12 ’13 ’14
70
80
90
100
110
120
Trade, transportation and utilities
’07 ’08 ’09 ’10 ’11 ’12 ’13 ’14
70
80
90
100
110
120
Information
’07 ’08 ’09 ’10 ’11 ’12 ’13 ’14
MinnesotaMontanaNorth DakotaSouth DakotaWisconsin
By industry sector,4-quarter average,2007 Q1 = 100
Job growth index
Source: Bureau of Labor Statistics, QCEW
3
’16’13’10’07’04’01’98’95’92 ’19
4More household formation, except during Great RecessionAnnual percent change in Minnesota
Source: Minnesota Management & Budget, February 2015 Forecast
percent1.8
1.5
1.2
.9
.6
.3
0
-.3
Projection
Population
Household
firms), who didn’t start seeing an uptick in business until 2010 or 2011, and it took until 2013 “for things to really start to fly.” But now, “practically every mem-ber is growing and has job openings. … When we’re busy, that bodes well for con-struction firms,” said Oxley.
But Oxley and others are quick to offer caveats. Oxley’s members “are nervous as hell” about work continuing apace. Before the recession, it was not uncom-mon for a firm to have a year’s worth of backlog in work. “Today, if you have six months, you’re feeling pretty good,” said Oxley. “This market responds quickly to changes in the economy … and business goes up and down more than it used to.”
Raines, from ABC of Minnesota and North Dakota, described construction activity as good of late, but it “goes in fits and starts. You’ll get really busy and sometimes you slow down.” And that staggered momentum has the industry looking over its shoulder.
“There is always a certain amount of demand that is ongoing. But in the re-cession, you saw delays in that demand” as companies pushed off projects as long as they could, said Raines. During the recovery, that pent-up demand has been released in a trickle, not a flood. “We’ve never seen that wild move” that unleashed demand and demonstrated broad confidence in the future economy, and there isn’t any expectation of that changing, said Raines.
But perhaps this trepidation on the part of the construction industry is un-called for. Until recently, Minnesota’s construction sector had not seen much job growth over the previous year, ac-cording to Steve Hine, director of the La-bor Market Information Office at DEED. But April construction figures hit the cover off the job ball, growing by more than 6,000 jobs in just one month.
“A little paranoia is understandable because that sector really got it” dur-ing the recession, Hine said. But with recent job growth, “there’s nothing to suggest much sign of weakness [in con-struction]. … Actions speak louder than words.”
Wanted: WorkersThe irony of slow job growth during the recovery is that many industries are complaining about a lack of labor—a complex matter that involves wages and demographics. Employers in many in-dustries have long complained about an inability to attract skilled labor. But wag-es have not seen much movement, and as a result economists tend not to view such conditions as indicative of a broad labor shortage, especially when other in-dicators point to continued slack in the labor market. An additional wrinkle is that demographics are beginning to shift the framing of this debate.
This spring, the unemployment rate in the Twin Cities was 4 percent, one of the lowest metro rates in the coun-try. “People are working,” according to David Griggs, vice president of business investment for Greater MPS, a regional economic development partnership in the Twin Cities. The challenge, he said, “is getting the skills companies need for open positions, and that is a challenge we’ve had for the longest time.” But aside from that matching problem, “what’s looming is the retirement of the largest portion of that skilled workforce,” and the numbers to backfill that gap aren’t there. “And it runs across every sector. You name it, and those skill sets are in need.”
In health care, Fairview has between 1,300 and 1,400 job vacancies, a figure that has grown by 400 or 500 since 2010. Along with job growth from higher de-mand, Fairview is seeing more retire-ments every week, according to Beeth. “There’s growth and then there is catch-up. … We have more needs than we can possibly address,” said Beeth. “It’s been creeping up and this year has really es-calated. And it’s the same everywhere.”
Numerous construction sources not-ed that industry activity is being held back by a lack of construction workers. In South Dakota, the outlook for construc-tion “is very positive for the next two to three years,” said Bryce Healy, executive director of AGC of South Dakota Build-
ing Chapters, which represents general contractors, suppliers and service firms. Nonetheless, he added, “if they could hire more workers, they would be doing more work. … They are down to hiring the unhirable.” One member doing busi-ness in Rapid City told Healy, “I could use 30 more concrete workers today.”
Many Minnesota firms “wish they could expand. … Labor is really the con-stricting thing,” said Raines. “[Firms] are not bidding work because they don’t have the workers.” Many workers left the industry during the recession and are no longer available to work construction, Raines said. And the industry is strug-gling to attract new workers to the con-struction trades. “The new generation is not seeing these as good long-term jobs. They want to play on their phones all day.”
Contractors are adapting to tight la-bor, planning and staging projects more efficiently and with “more of a focus on lean construction methods to reduce labor and material cost,” said Dave Se-merad, CEO of Associated General Con-tractors of Minnesota. “Contractors are doing more work with less labor. With the current labor shortage and experi-enced workers hard to come by, contrac-tors are doing whatever they can to be efficient with the labor they do have.”
Wages might be one reason construc-tion firms are having trouble attracting labor. From 2009 to 2013 (the most re-cent QCEW data available by sector), av-erage construction wages have increased only 2 percent in Minnesota, adjusted for inflation; in South Dakota, they were al-most perfectly flat.
Flight of the worker beeGoing forward, however, demographics will likely play a much larger role in job growth than previously. On the housing side, according to Siegel from BATC, there is demand for framers, roofers, landscapers, siders and finish carpen-ters. “All of these positions have an aging
workforce and not enough young people entering the market.” In talking with oth-er construction associations, “I hear the same refrain—labor is a huge issue, and demographics are not in our favor. This will be an ongoing challenge for many years to come,” assuming the recovery continues, Siegel said.
In the coming years, a huge cohort of baby boomers will be retiring, replaced by a comparatively smaller group of young people coming in—Generation Z, the kids of Generation Xers. The result: The labor force is simply not growing like it used to.
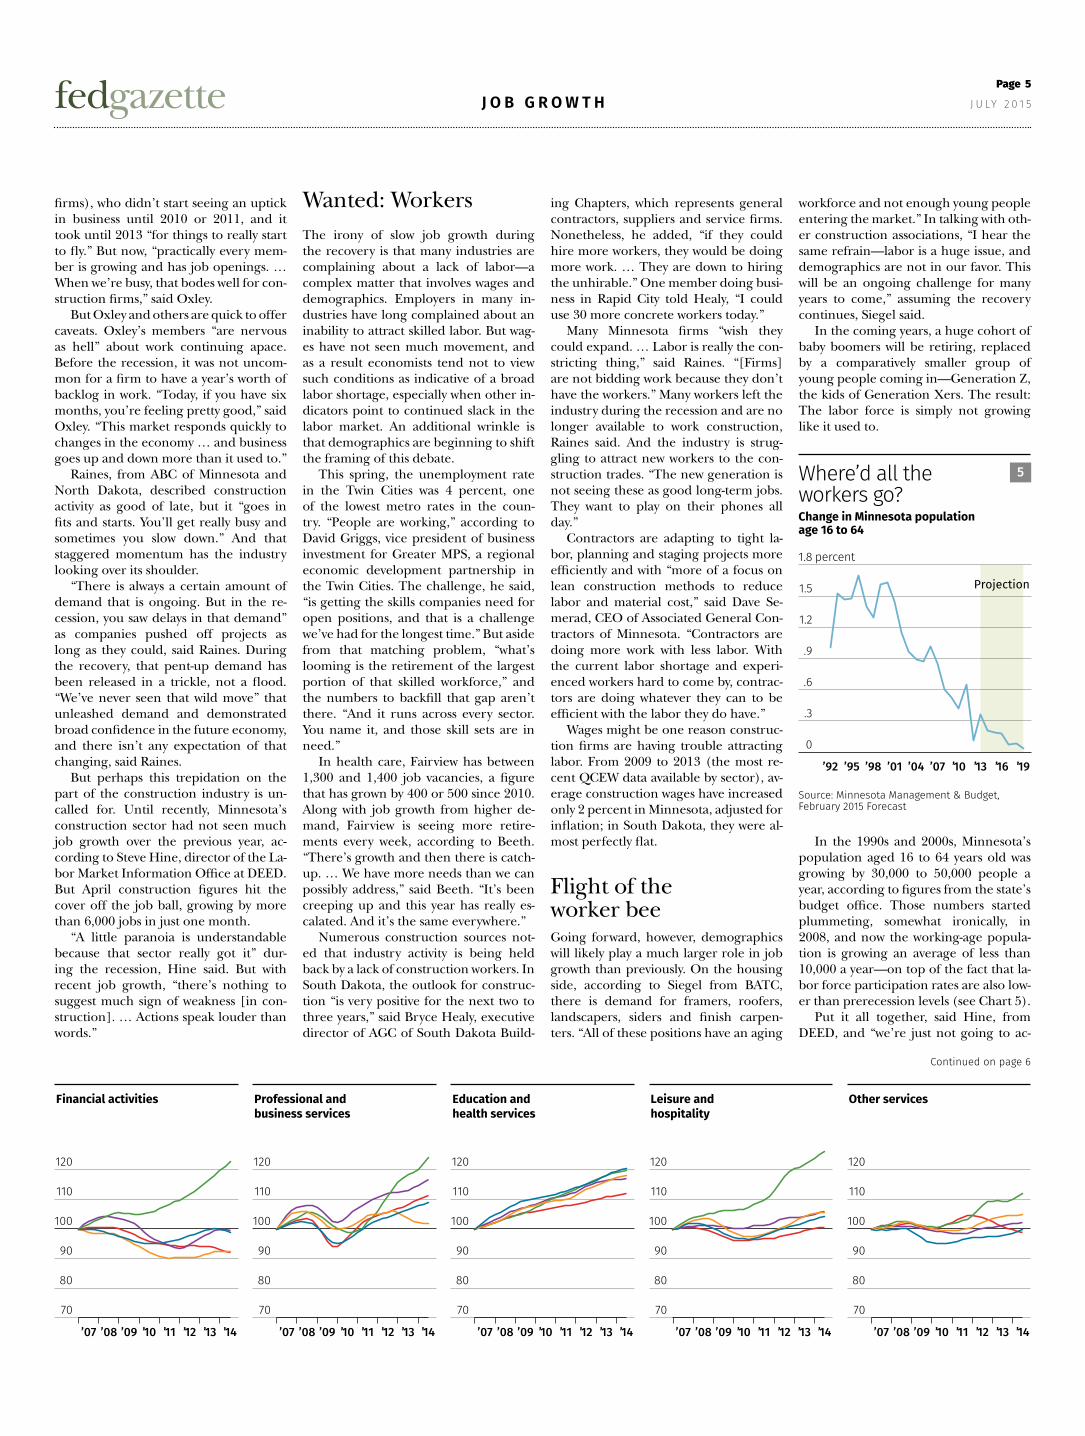
In the 1990s and 2000s, Minnesota’s population aged 16 to 64 years old was growing by 30,000 to 50,000 people a year, according to figures from the state’s budget office. Those numbers started plummeting, somewhat ironically, in 2008, and now the working-age popula-tion is growing an average of less than 10,000 a year—on top of the fact that la-bor force participation rates are also low-er than prerecession levels (see Chart 5).
Put it all together, said Hine, from DEED, and “we’re just not going to ac-
Continued on page 6
fedgazette J O B G R O W T H J U LY 2 0 1 5
Page 5
70
80
90
100
110
120
Financial activities
’07 ’08 ’09 ’10 ’11 ’12 ’13 ’14
70
80
90
100
110
120
Professional and business services
’07 ’08 ’09 ’10 ’11 ’12 ’13 ’14
70
80
90
100
110
120
Education and health services
’07 ’08 ’09 ’10 ’11 ’12 ’13 ’14
70
80
90
100
110
120
Leisure and hospitality
’07 ’08 ’09 ’10 ’11 ’12 ’13 ’14
70
80
90
100
110
120
Other services
’07 ’08 ’09 ’10 ’11 ’12 ’13 ’14
Projection
5Where’d all the workers go?Change in Minnesota population age 16 to 64
Source: Minnesota Management & Budget, February 2015 Forecast
’16’13’10’07’04’01’98’95’92 ’19
1.8
1.5
1.2
.9
.6
.3
0
percent

Down the rabbit hole of occupational job growthOccupational Employment Statistics offer cautious insights
By RONALD A. WIRTZEditor
All data have limitations. They can tell a story, maybe even a good one,
but they often offer only a partial per-spective.
For example, job growth among ma-jor industries is useful for seeing trends and activity among different and impor-tant parts of the economy (see cover ar-ticle). Yet despite this seeming breadth, industry-based data have limited insights because the data do not allow for any differentiation among workers in an in-dustry.
For example, all employees at health care organizations have the same work-er-bee label, despite the fact that certain health care organizations, like large hos-pitals, are often their own self-contained economies, with workers of virtually every stripe under one industry roof—doctors and nurses, of course, but also cooks, janitors, real estate professionals, helicopter pilots, executives, administra-tive assistants, technology professionals, graphic designers, communications spe-cialists, heating and cooling engineers, plumbers, accountants—you get the idea.
Each of these jobs is a separate occu-pation, with its own pay scale and educa-tion requirements. And although health care employment might be growing, it might not be growing across the board in terms of these many occupations with-in a health care organization.
So looking at occupations offers an-other useful perspective on job growth. According to data from the Occupa-tional Employment Statistics (OES)
from the U.S. Bureau of Labor Statistics (BLS), Minnesota saw strong job growth from 2007 to 2014 in lower-paying fields like personal care and service. But jobs also grew in computer/math and man-agement, which are high-paying fields. Most occupations that saw a decline in jobs over this period were in the middle of the occupational wage distribution. Since the end of the recession, wages in most occupational groups have risen very little. This is generally true for all segments of earners within each occupa-tional group—wages have been slow to rise for low, median and higher earners.
Just one (huge) caveat: OES data have considerable limitations in any occupational analysis that focuses on change over time. Think of the OES as the flashing yellow light of job databases. You may proceed, but there are risks, so use caution.
Some background: The OES is a da-tabase of more than 800 occupations, grouped conveniently into 22 major cat-egories (the latter of which is the basis of this analysis). These data on jobs at non-farm establishments are compiled every six months via survey by the BLS. Annual occupation figures are a rolling tabula-tion of three years’ worth of surveys (six in all). Among many uses, this informa-tion feeds estimates of current and fu-ture employment needs and job oppor-tunities used to develop many education and workforce development plans.
On its website, the BLS calls the OES program “the only comprehen-sive source of regularly produced oc-cupational employment and wage rate information” for national and state economies. Remember that little tid-
bit, because from here the analysis goes down the methodological rabbit hole to identify the source of caution.
The BLS notes that although the OES is designed to create detailed annual em-ployment and wage estimates, “it is less useful for comparisons of two or more points in time” because of a variety of changes over the years—in methodol-ogy, survey execution, data definitions—that can affect survey results in a given year. For example, there have been pe-riodic alterations to occupational and industrial classification systems that are the backbone of the OES. Considerable effort is made to harmonize classifica-tions systems in any update, but perfect matches are elusive.
But a bigger issue is the survey meth-odology itself. Because OES data are the product of three years’ worth of roll-ing surveys—six surveys with various amounts of sample overlap—the BLS strongly advises against the use of OES data for time-series comparisons that at-tempt to track annual changes over time.
However, OES data do allow for com-paring two points in time, provided they are three or more years apart (the BLS itself has published research doing so). But because of these methodological matters, this is only a comparison of two
complish [a higher growth rate]. … There’s not a lot of slack where we can grow jobs as fast as we could in the past.”
For some industries, returning to prerecession job levels is not neces-sarily a desirable goal. Hine cautioned that “we don’t really want to get back to where we were” before the reces-sion in terms of now-obvious job im-balances in the housing market and financial and real estate services.
At the same time, Hine believes that tight labor markets might eventu-ally benefit workers by putting upward pressure on wages, another “Waiting for Godot” matter that has garnered considerable attention from workers and policymakers worried about per-sistently slow wage growth.
“It’s been so many years since em-ployers have had to really compete for workers,” Hine said. “There’s been this business mantra on limiting costs and wage growth” to stay competitive, and doing something different is difficult for firms, especially early adopters.
“But there have been anecdotes of wage pressure starting to build,” Hine added, pointing to Wal-Mart’s decision to push up its minimum com-pany wage across the board. “Maybe it’s a sign that [employers] are going to have to raise wages to attract labor … much as was recognized by em-ployers in North Dakota,” a state that went from one of the lowest median incomes to the second highest in the country in the span of a decade in re-sponse to the huge demand for work-ers in the oil patch.
“It will become an economic ne-cessity over the course of the next 15 years. There is such limited labor force growth; employers are compet-ing almost for a fixed pool of job can-didates. And that is sort of new terri-tory,” said Hine.
Though wage pressure is not yet showing up much in the data, there is talk of it. In manufacturing, for ex-ample, there are 5,000 job openings in Minnesota, according to Bob Kill, president and CEO of Enterprise Min-nesota, a nonprofit consulting orga-nization to manufacturers. Many of these openings go unfilled because of skill shortages among available work-ers.
As a group, Kill said, manufacturers “are optimistic because they feel they can compete with anyone … and the challenge they have [in attracting la-bor] is under their control.” In focus groups and polls over the past two years, manufacturing employers “say wages are going up, and they expect them to continue,” said Kill. “More employers are getting more proactive” on wages to attract employees. “They have to think of careers for their em-ployees.”
Job Growth from page 5
fedgazette J O B G R O W T H J U LY 2 0 1 5
Page 6
ILLU
STRA
TIO
N BY
JAM
ES O
’BRI
EN
1Employment change by occupational median wageMinnesota
thousand1000
800
600
400
200
0
Source: Bureau of Labor Statistics, Occupational Employment Statistics
< $10 $10 to$15
$15 to$20
$20 to$30
> $30
20072014