
E Ford Merkle Jun 8
21
Supply Chain Monitoring Ford Parts Supply & Logistics Case Study Roger Merkle Former Manager, North American Inventory Planning Department
Transcript of E Ford Merkle Jun 8

8/8/2019 E Ford Merkle Jun 8
http://slidepdf.com/reader/full/e-ford-merkle-jun-8 1/21
Supply Chain MonitoringFord Parts Supply & LogisticsCase Study
Roger Merkle
Former Manager, North American Inventory Planning Department
8/8/2019 E Ford Merkle Jun 8
http://slidepdf.com/reader/full/e-ford-merkle-jun-8 2/21
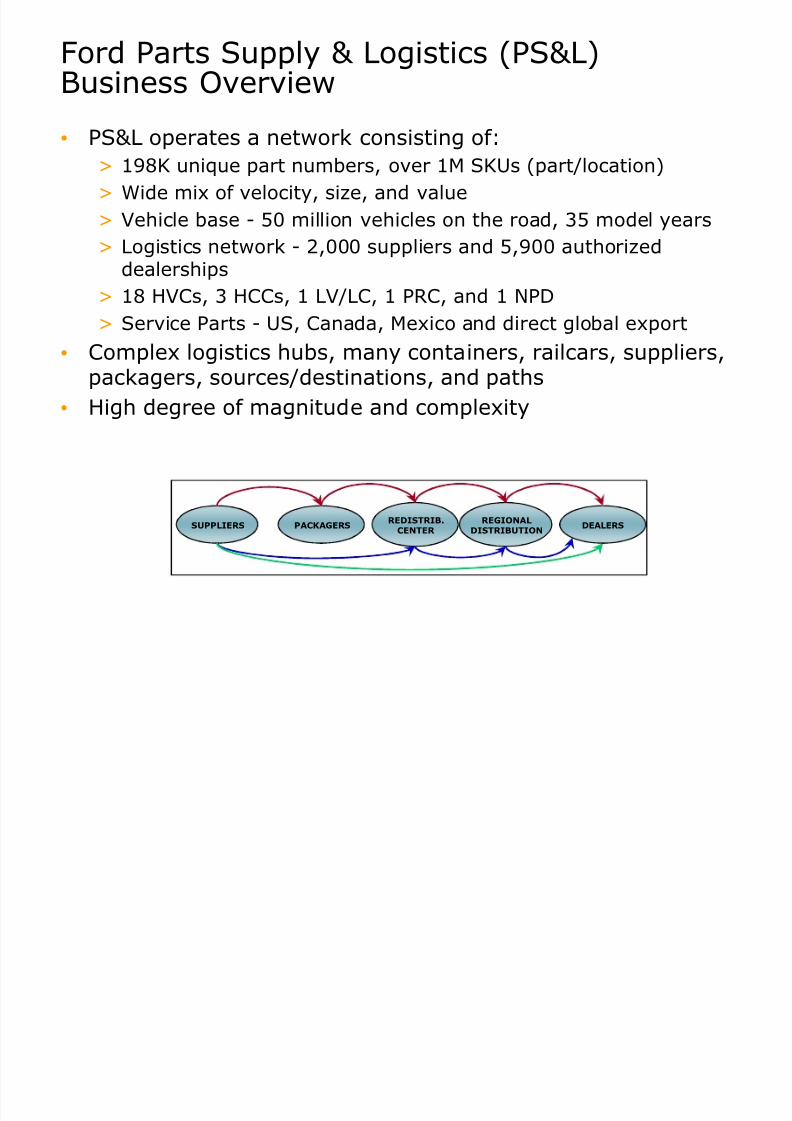
Ford Parts Supply & Logistics (PS&L)Business Overview
PS&L operates a network consisting of:> 198K unique part numbers, over 1M SKUs (part/location)
> Wide mix of velocity, size, and value
> Vehicle base - 50 million vehicles on the road, 35 model years
> Logistics network - 2,000 suppliers and 5,900 authorized
dealerships> 18 HVCs, 3 HCCs, 1 LV/LC, 1 PRC, and 1 NPD
> Service Parts - US, Canada, Mexico and direct global export
Complex logistics hubs, many containers, railcars, suppliers,packagers, sources/destinations, and paths
High degree of magnitude and complexity
SUPPLIERS PACKAGERSREDISTRIB.
CENTER REGIONAL
DISTRIBUTIONDEALERS
8/8/2019 E Ford Merkle Jun 8
http://slidepdf.com/reader/full/e-ford-merkle-jun-8 3/21
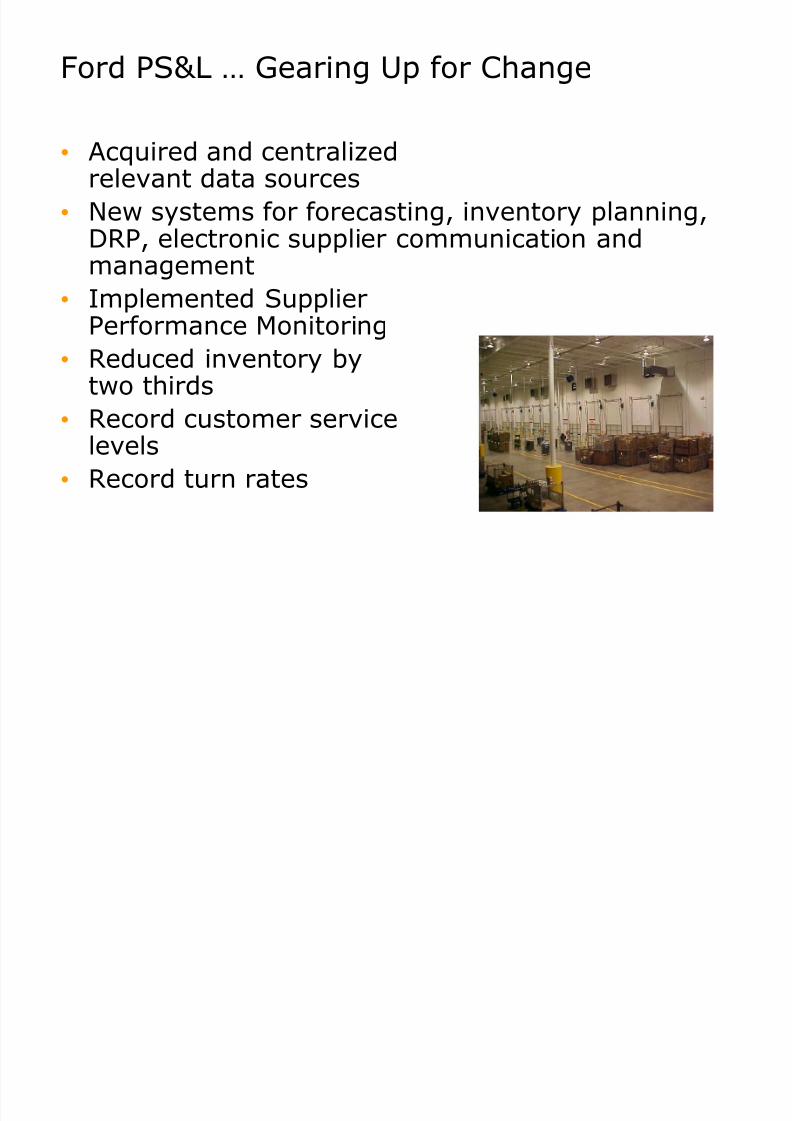
Ford PS&L « Gearing Up for Change
Acquired and centralizedrelevant data sources
New systems for forecasting, inventory planning,DRP, electronic supplier communication and
management Implemented Supplier
Performance Monitoring
Reduced inventory bytwo thirds
Record customer servicelevels
Record turn rates
8/8/2019 E Ford Merkle Jun 8
http://slidepdf.com/reader/full/e-ford-merkle-jun-8 4/21
PURCHASING
Low purchase price
(High Inventory)
(Stable schedules)
(Long lead times)
SOURCE (MAKE)
DISTRIBUTION
(Process-focused)
Stable Fixed Costs
Low inventory
Stable Part Mix
Stable Schedules
Low Transportation
Cost
DELIVER
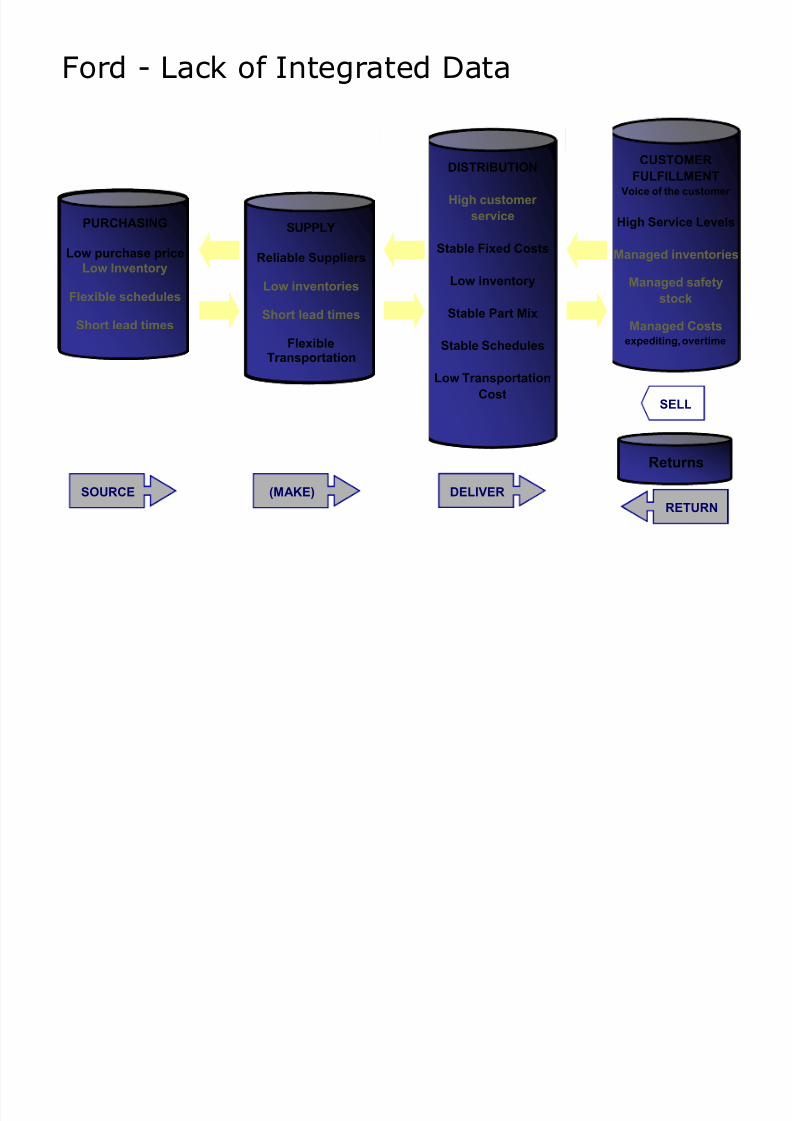
Returns
CUSTOMER
FULFILLMENTVoice of the customer
(High inventories)
(High safety stock)
(High Costs)expediting, overtime
RETURN
SELL
SUPPLY
Reliable Suppliers
(High inventories)
(Long lead times)
FlexibleTransportation
PURCHASING
Low purchase price
Low Inventory
Flexible schedules
Short lead times
DISTRIBUTION
High customer
service
Stable Fixed Costs
Low inventory
Stable Part Mix
Stable Schedules
Low Transportation
Cost
CUSTOMER
FULFILLMENTVoice of the customer
High Service Levels
Managed inventories
Managed safety
stock
Managed Costsexpediting, overtime
SUPPLY
Reliable Suppliers
Low inventories
Short lead times
FlexibleTransportation
Ford - Lack of Integrated Data
8/8/2019 E Ford Merkle Jun 8
http://slidepdf.com/reader/full/e-ford-merkle-jun-8 5/21
8/8/2019 E Ford Merkle Jun 8
http://slidepdf.com/reader/full/e-ford-merkle-jun-8 6/21
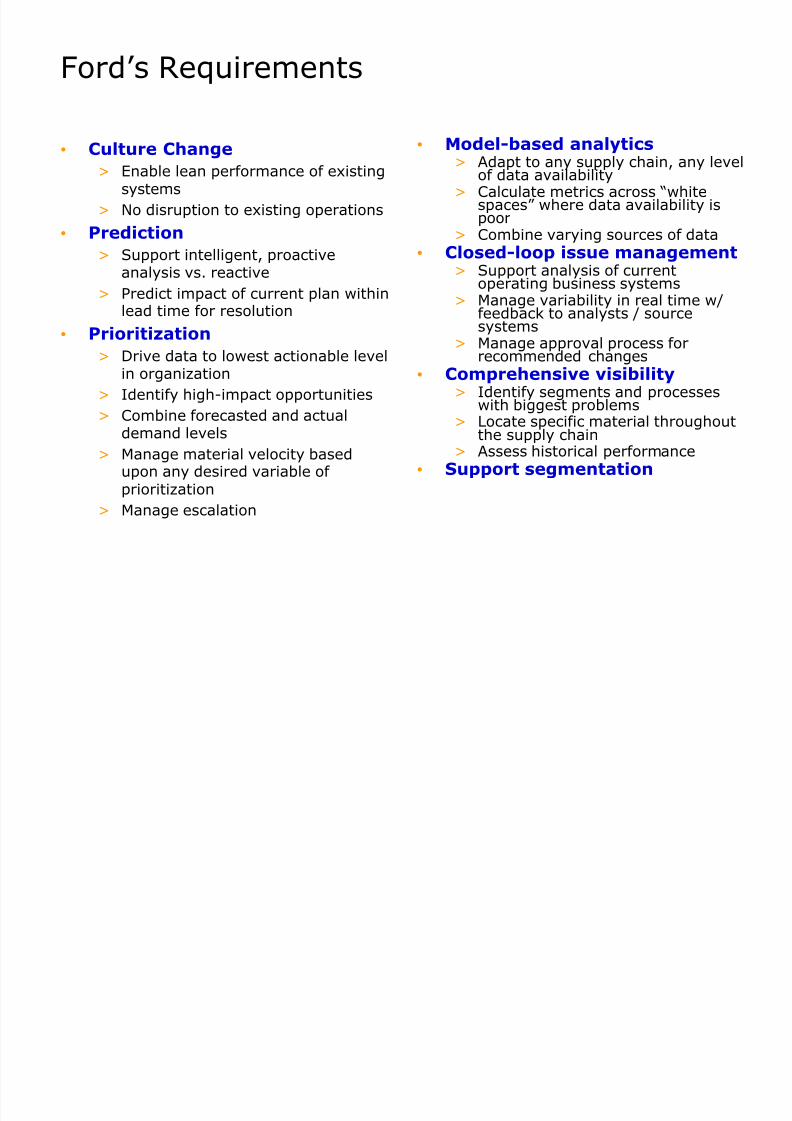
Ford¶s Requirements
Culture Change
> Enable lean performance of existingsystems
> No disruption to existing operations
Prediction
> Support intelligent, proactive
analysis vs. reactive> Predict impact of current plan within
lead time for resolution
Prioritization
> Drive data to lowest actionable levelin organization
> Identify high-impact opportunities
> Combine forecasted and actualdemand levels
> Manage material velocity basedupon any desired variable of prioritization
> Manage escalation
Model-based analytics> Adapt to any supply chain, any level
of data availability> Calculate metrics across ³white
spaces´ where data availability ispoor
> Combine varying sources of data
Closed-loop issue management
> Support analysis of currentoperating business systems> Manage variability in real time w/
feedback to analysts / sourcesystems
> Manage approval process forrecommended changes
Comprehensive visibility> Identify segments and processes
with biggest problems> Locate specific material throughout
the supply chain> Assess historical performance
Support segmentation
8/8/2019 E Ford Merkle Jun 8
http://slidepdf.com/reader/full/e-ford-merkle-jun-8 7/21
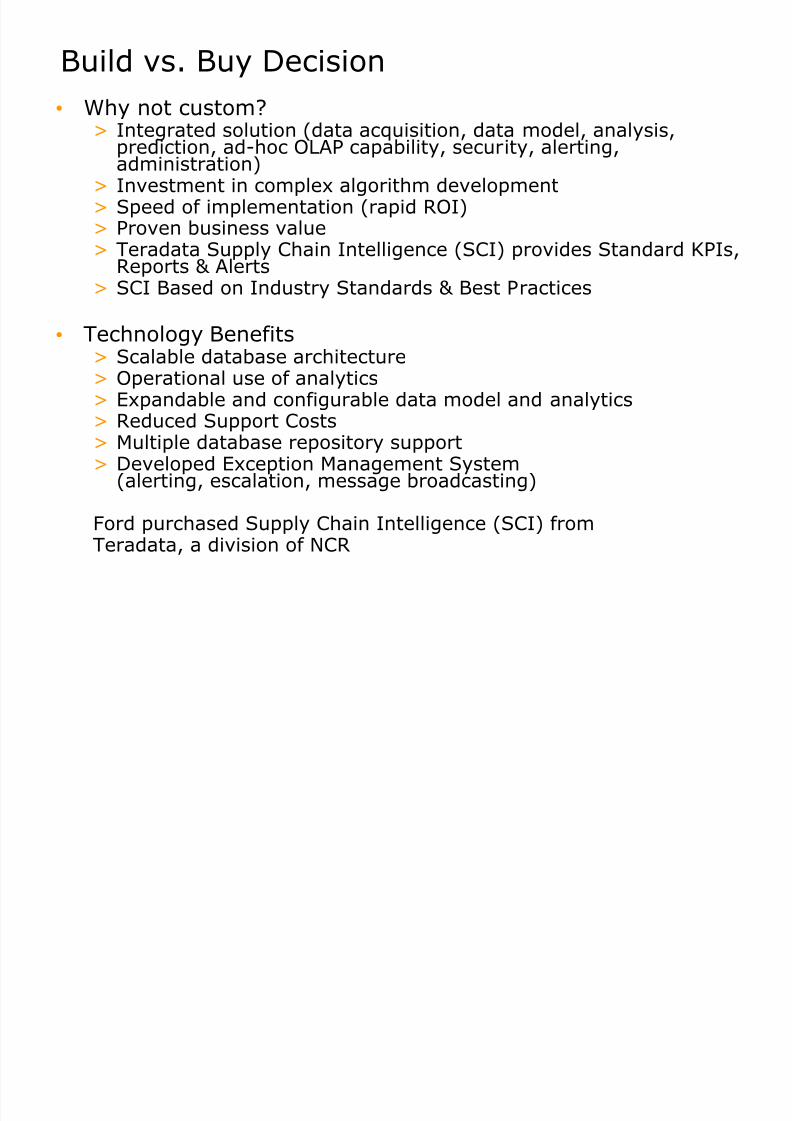
Build vs. Buy Decision
Why not custom?
> Integrated solution (data acquisition, data model, analysis,prediction, ad-hoc OLAP capability, security, alerting,administration)
> Investment in complex algorithm development> Speed of implementation (rapid ROI)> Proven business value> Teradata Supply Chain Intelligence (SCI) provides Standard KPIs,
Reports & Alerts> SCI Based on Industry Standards & Best Practices
Technology Benefits> Scalable database architecture> Operational use of analytics> Expandable and configurable data model and analytics
> Reduced Support Costs> Multiple database repository support> Developed Exception Management System
(alerting, escalation, message broadcasting)
Ford purchased Supply Chain Intelligence (SCI) from
Teradata, a division of NCR
8/8/2019 E Ford Merkle Jun 8
http://slidepdf.com/reader/full/e-ford-merkle-jun-8 8/21
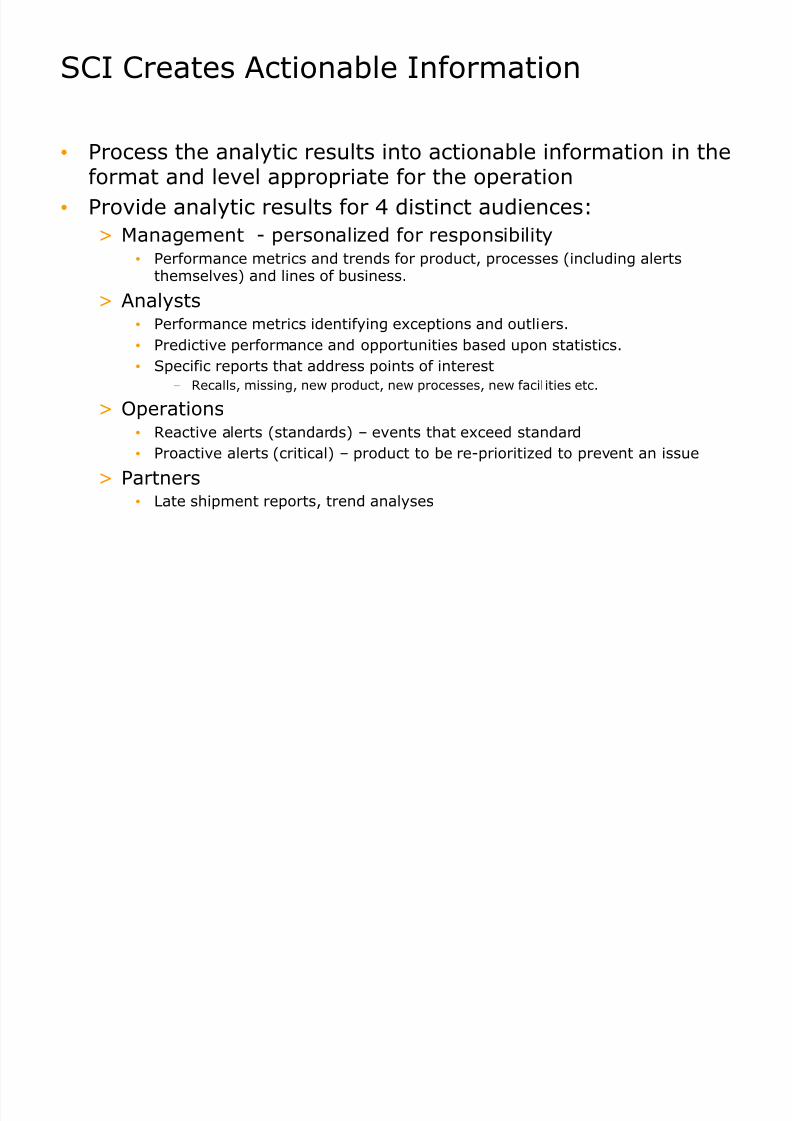
Process the analytic results into actionable information in theformat and level appropriate for the operation
Provide analytic results for 4 distinct audiences:
> Management - personalized for responsibility Performance metrics and trends for product, processes (including alerts
themselves) and lines of business.
> Analysts Performance metrics identifying exceptions and outliers.
Predictive performance and opportunities based upon statistics.
Specific reports that address points of interest
± Recalls, missing, new product, new processes, new facilities etc.
> Operations Reactive alerts (standards) ± events that exceed standard
Proactive alerts (critical) ± product to be re-prioritized to prevent an issue
> Partners Late shipment reports, trend analyses
SCI Creates Actionable Information

8/8/2019 E Ford Merkle Jun 8
http://slidepdf.com/reader/full/e-ford-merkle-jun-8 9/21
Solution Example
Ford¶s Three-Pronged Solution
8/8/2019 E Ford Merkle Jun 8
http://slidepdf.com/reader/full/e-ford-merkle-jun-8 10/21
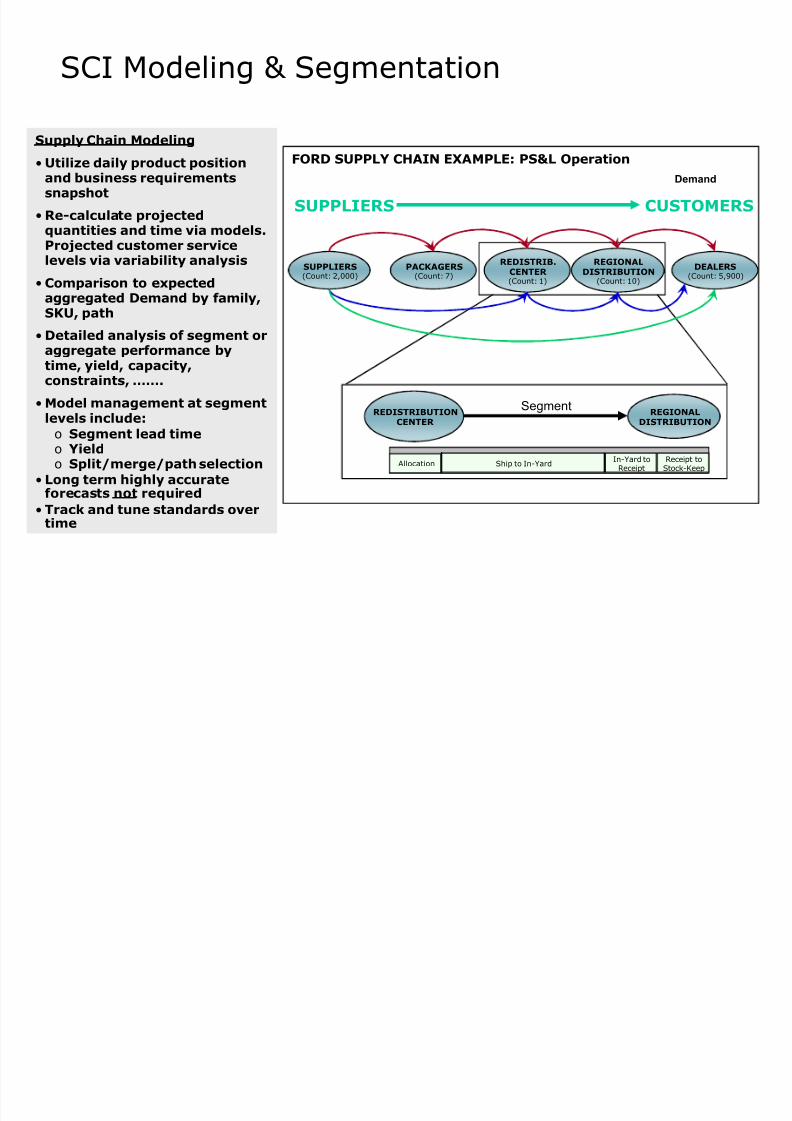
FORD SUPPLY CHAIN EXAMPLE: PS&L OperationSupply Chain Modeling
Utilize daily product positionand business requirementssnapshot
Re-calculate projectedquantities and time via models.Projected customer servicelevels via variability analysis
Comparison to expectedaggregated Demand by family,SKU, path
Detailed analysis of segment oraggregate performance bytime, yield, capacity,constraints, ««.
Model management at segment
levels include:o Segment lead timeo Yieldo Split/merge/path selection
Long term highly accurateforecasts not required
Track and tune standards overtime
SUPPLIERS
(Count: 2,000)
Demand
INTE2
V ALS
Segment
Allocation
SUPPLIERS CUSTOMERS
PACKAGERS
(Count: 7)
REDISTRIB.CENTER (Count: 1)
REGIONALDISTRIBUTION
(Count: 10)
DEALERS
(Count: 5,900)
REDISTRIBUTIONCENTER REGIONALDISTRIBUTION
Ship to In-YardIn-Yard toReceipt
Receipt toStock-Keep
SCI Modeling & Segmentation
8/8/2019 E Ford Merkle Jun 8
http://slidepdf.com/reader/full/e-ford-merkle-jun-8 11/21
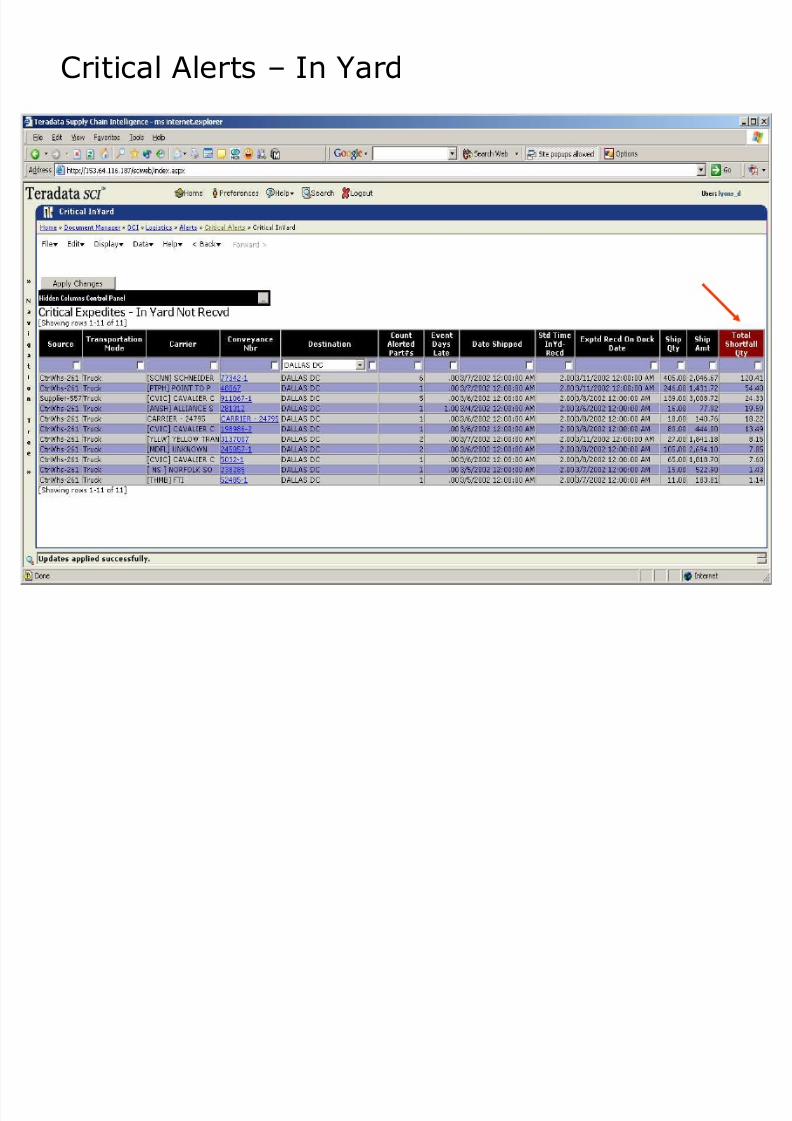
Critical Alerts ± In Yard

8/8/2019 E Ford Merkle Jun 8
http://slidepdf.com/reader/full/e-ford-merkle-jun-8 12/21
Critical Alerts ± In Yard
8/8/2019 E Ford Merkle Jun 8
http://slidepdf.com/reader/full/e-ford-merkle-jun-8 13/21
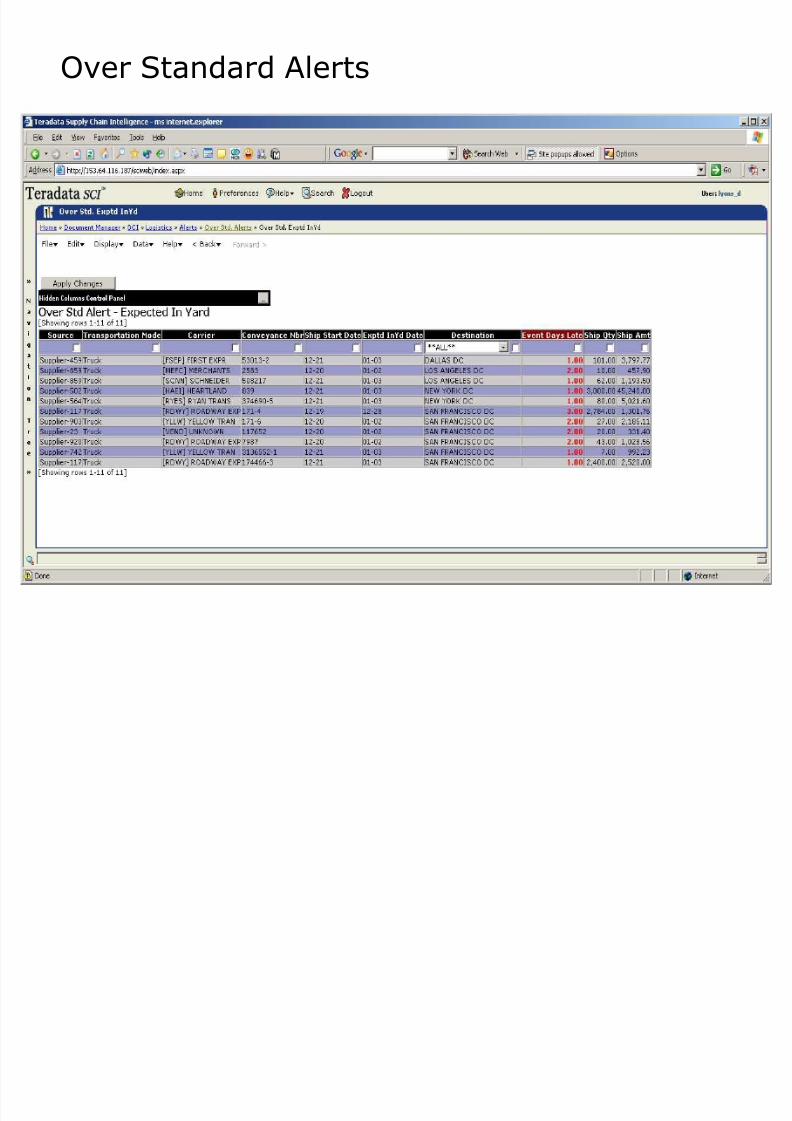
Over Standard Alerts
8/8/2019 E Ford Merkle Jun 8
http://slidepdf.com/reader/full/e-ford-merkle-jun-8 14/21
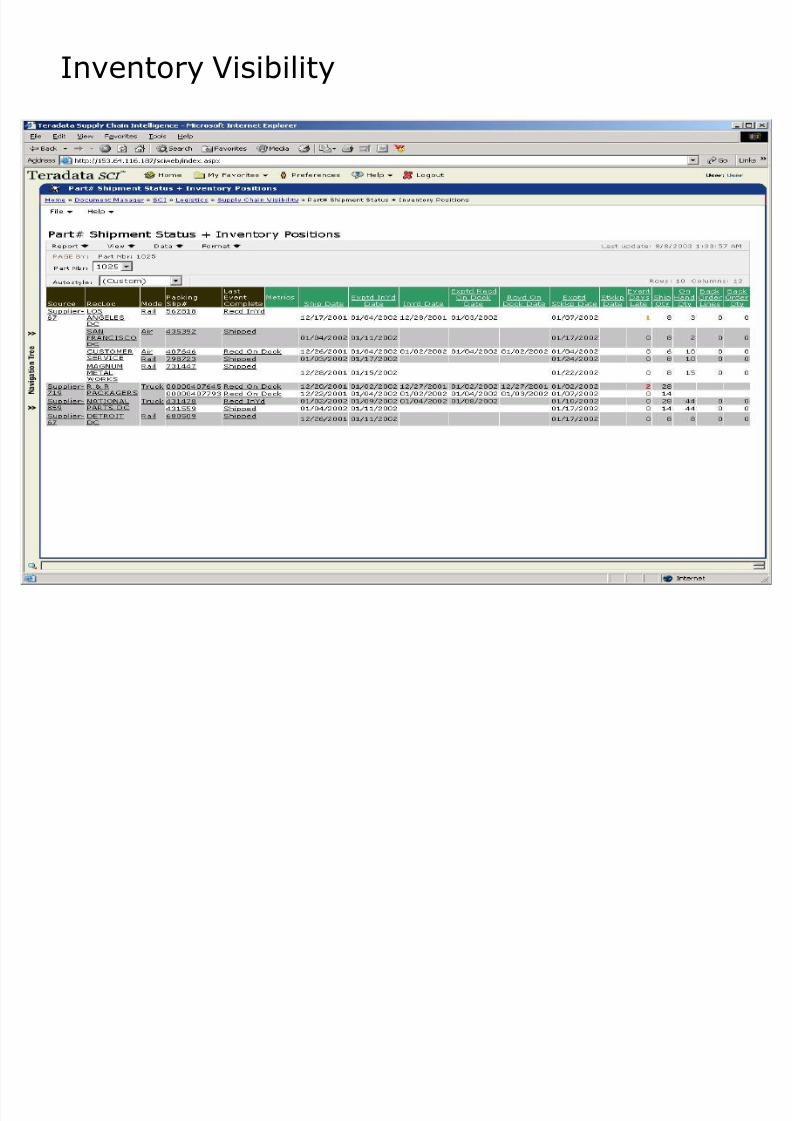
Inventory Visibility
8/8/2019 E Ford Merkle Jun 8
http://slidepdf.com/reader/full/e-ford-merkle-jun-8 15/21
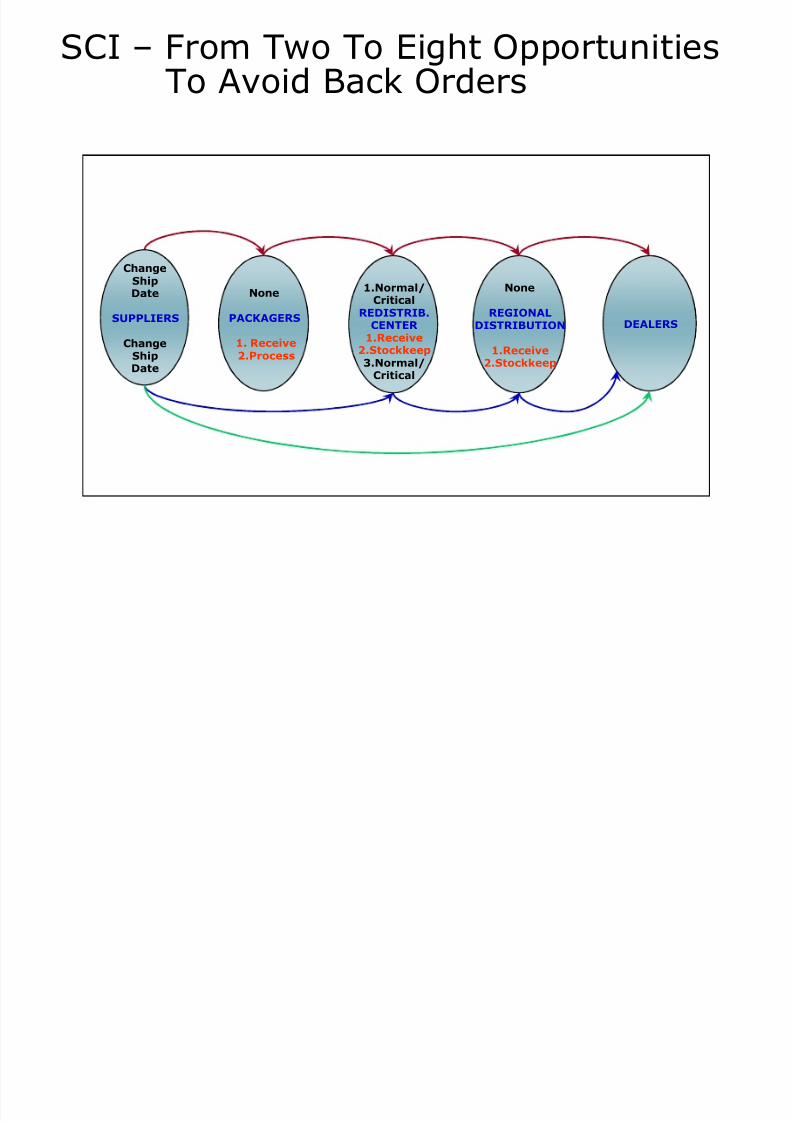
SCI ± From Two To Eight OpportunitiesTo Avoid Back Orders
Change
ShipDate
SUPPLIERS
ChangeShipDate
None
PACKAGERS
1. Receive2.Process
1.Normal/Critical
REDISTRIB.CENTER
1.Receive2.Stockkeep3.Normal/
Critical
None
REGIONALDISTRIBUTION
1.Receive2.Stockkeep
DEALERS
8/8/2019 E Ford Merkle Jun 8
http://slidepdf.com/reader/full/e-ford-merkle-jun-8 16/21
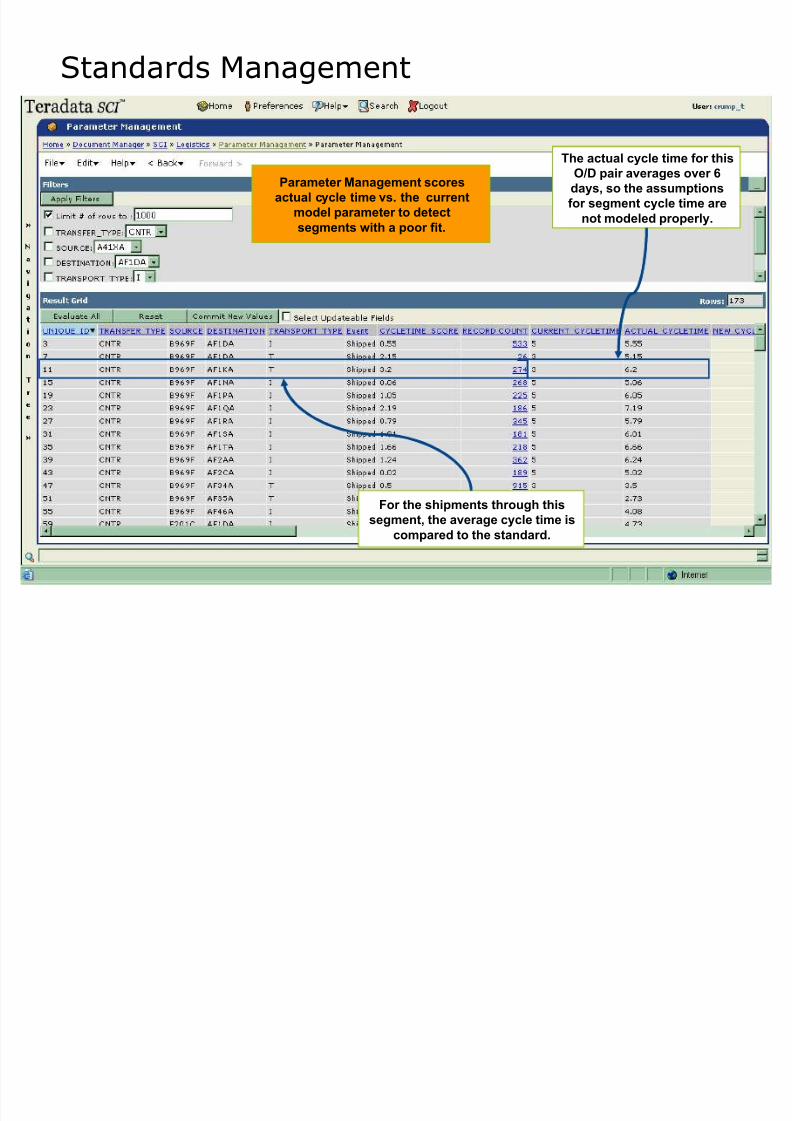
The actual cycle time for this
O/D pair averages over 6
days, so the assumptions
for segment cycle time are
not modeled properly.
For the shipments through this
segment, the average cycle time is
compared to the standard.
Parameter Management scores
actual cycle time vs. the current
model parameter to detect
segments with a poor fit.
Standards Management
8/8/2019 E Ford Merkle Jun 8
http://slidepdf.com/reader/full/e-ford-merkle-jun-8 17/21
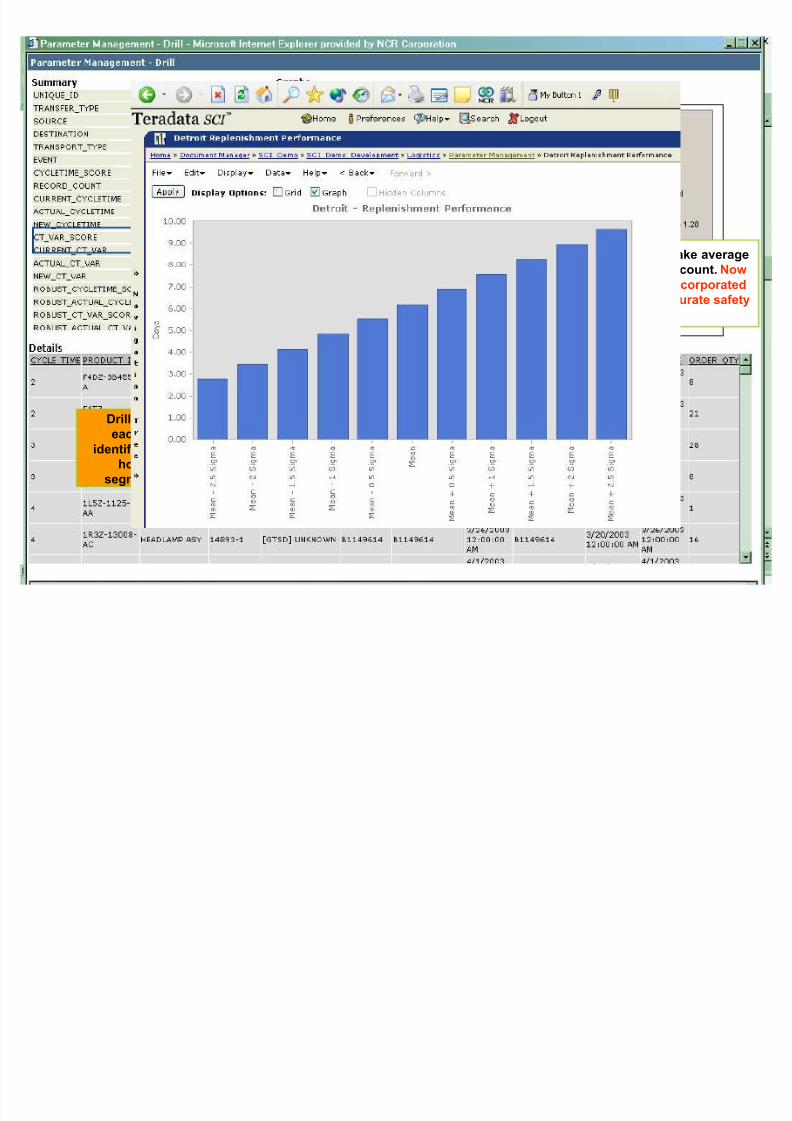
The current model does take average
segment variability into account. Now
actual variability can be incorporated
into the model to drive accurate safety
stock
New model parameter evaluated
for fit with actual shipment
transaction cycle times
Drilling into the detailed data for each segment supports outlier
identification and users can evaluate
how well the model fits each
segment within the supply chain.
8/8/2019 E Ford Merkle Jun 8
http://slidepdf.com/reader/full/e-ford-merkle-jun-8 18/21
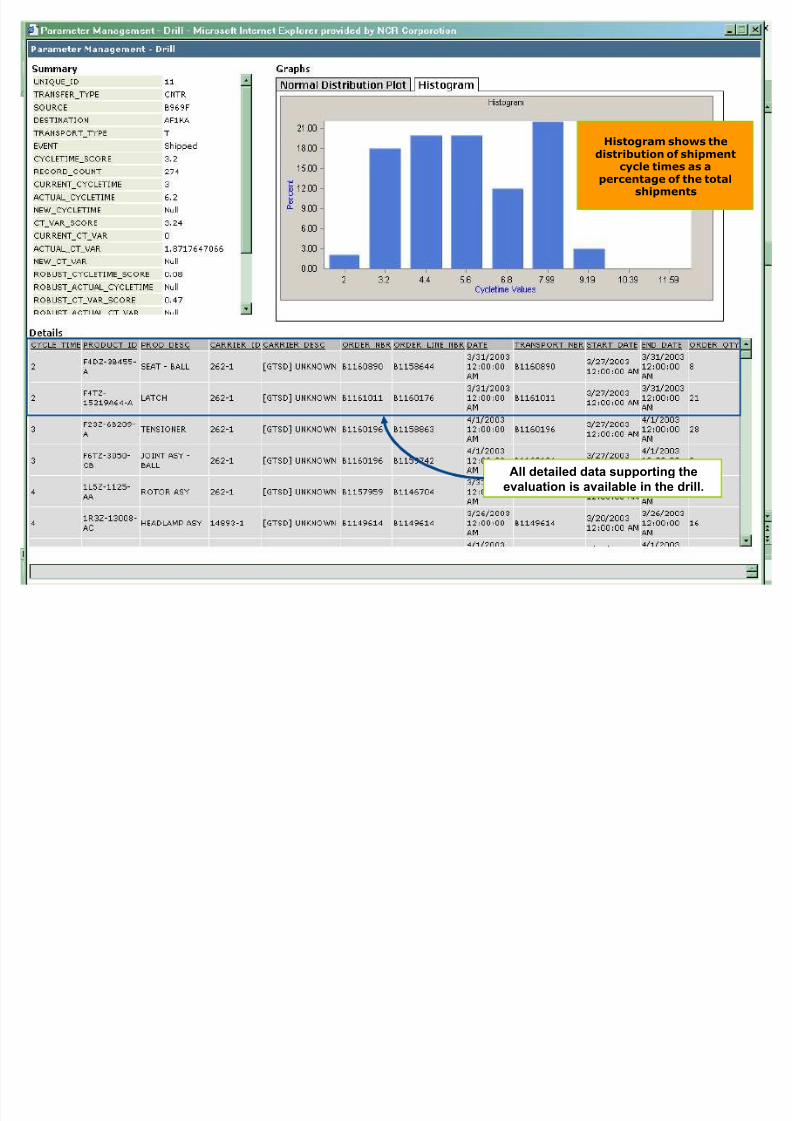
All detailed data supporting the
evaluation is available in the drill.
Histogram shows thedistribution of shipment
cycle times as apercentage of the total
shipments
8/8/2019 E Ford Merkle Jun 8
http://slidepdf.com/reader/full/e-ford-merkle-jun-8 19/21
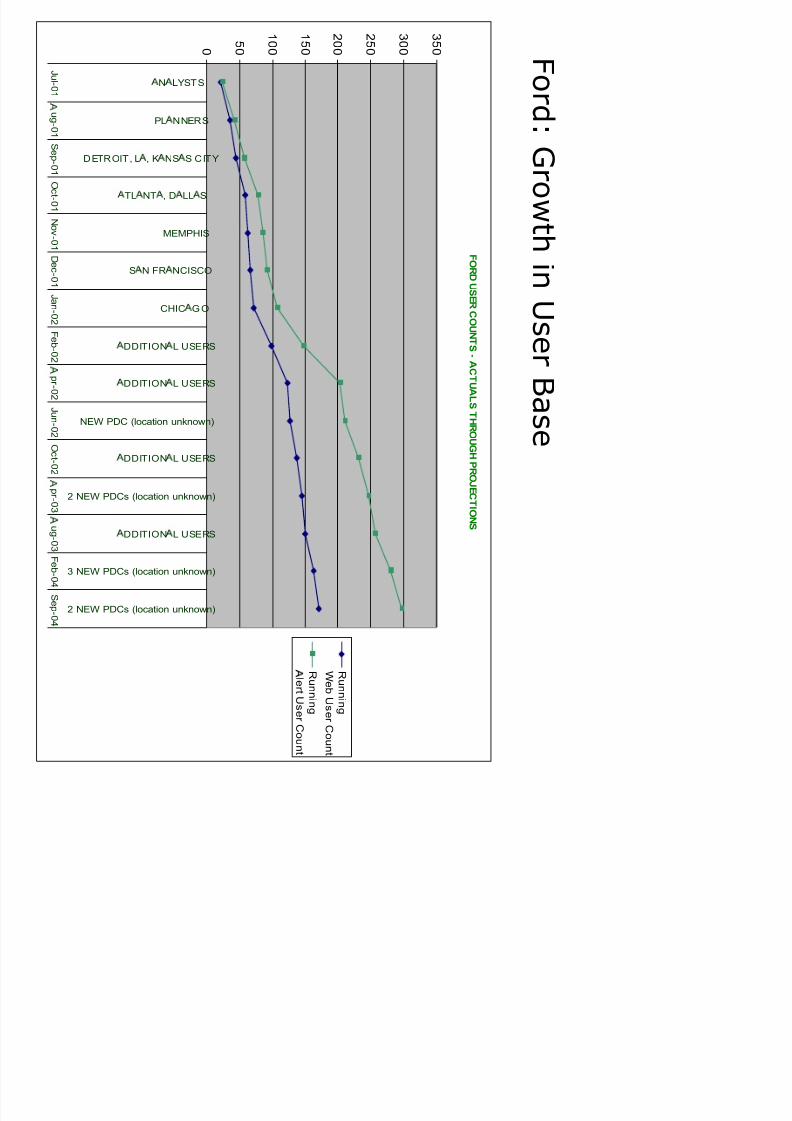
F or d
: Gr ow t h
i n U s er B
a s e
F OR
D U SER C O UNT S-A CT UAL S
T HR O U GHPR O J E CT I ON S
0 5 0
1 0 0
1 5 0
2 0 0
2 5 0
3 0 0
3 5 0
N LYSTS
PL NNERS
DETROIT, L , K NS S CITY
TL NT , D LL S
MEMPHIS
S N FR NCISCO
CHIC GO
DDITION L USERS
DDITION L USERS
NEW PDC (location unknown)
DDITION L USERS
2 NEW PDCs (location unknown)
DDITION L USERS
3 NEW PDCs (location unknown)
2 NEW PDCs (location unknown)
J ul - 0 1
3
u g- 0
1 S e p- 0 1 O c t - 0 1
N ov- 0 1 D e c- 0 1
J an- 0 2
F e b - 0 2 3
pr - 0 2
J un- 0 2
O c t - 0 2 3
pr - 0 3
3
u g- 0
3 F e b - 0 4
S e p
8/8/2019 E Ford Merkle Jun 8
http://slidepdf.com/reader/full/e-ford-merkle-jun-8 20/21
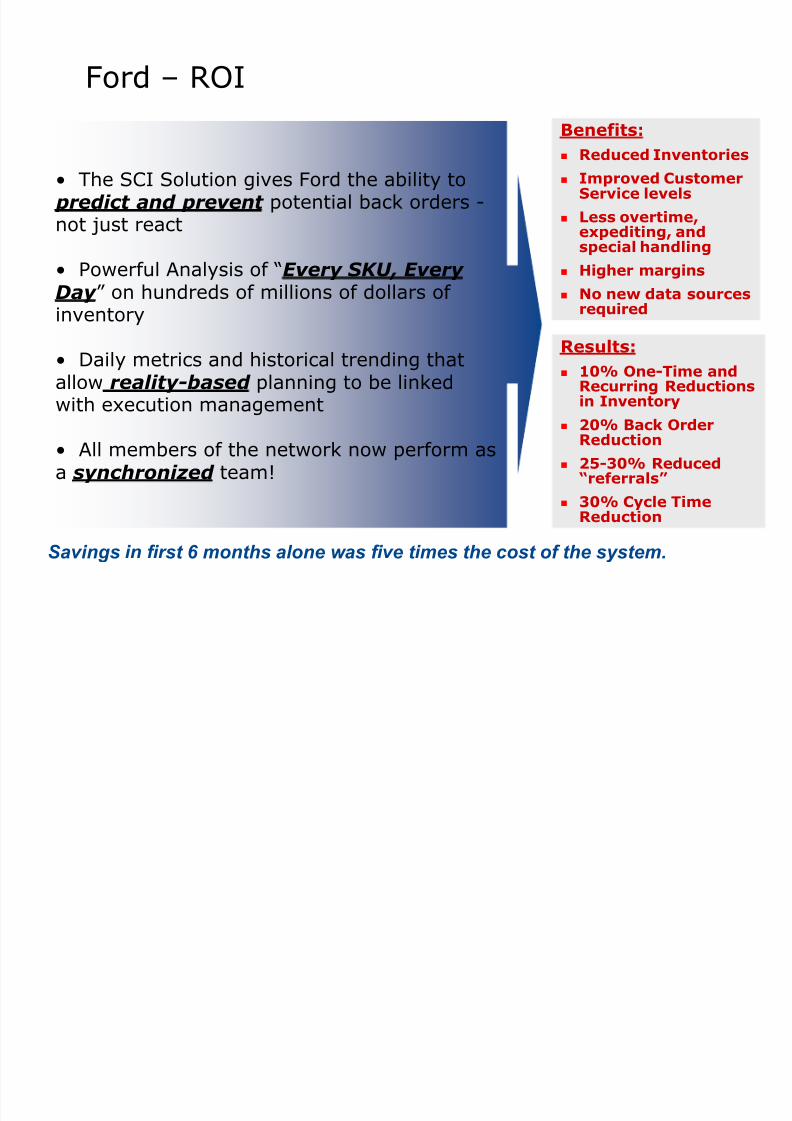
The SCI Solution gives Ford the ability to predict and prevent potential back orders -not just react
Powerful Analysis of ³Every SKU, Every Day ́ on hundreds of millions of dollars of inventory
Daily metrics and historical trending thatallow reality-based planning to be linkedwith execution management
All members of the network now perform asa synchronized team!
Benefits:
Reduced Inventories
Improved CustomerService levels
Less overtime,expediting, andspecial handling
Higher margins
No new data sourcesrequired
Results:
10% One-Time andRecurring Reductionsin Inventory
20% Back OrderReduction
25-30% Reduced³referrals´
30% Cycle TimeReduction
Ford ± ROI
Savi ngs i n f ir st 6 months al one w as f iv e t i mes the cost of the system.

8/8/2019 E Ford Merkle Jun 8
http://slidepdf.com/reader/full/e-ford-merkle-jun-8 21/21
Thank You for your Attention
Email:[email protected]